Abstract
The quantification of solid debris in used lubricating oil is essential for assessing transmission system wear and optimizing maintenance strategies. This study introduces a low-cost capacitive proximity sensor for monitoring total solid particle contamination in lubricants, with a focus on ferrous (Fe), non-ferrous (Al), and non-metallic (SiO2) debris. Controlled tests were performed using five mixing ratios of large-to-small particles (100:0, 75:25, 50:50, 25:75, and 0:100) at a fixed debris mass of 0.5 g per 25 mL of SAE 85W-140 automotive gear oil. Cubic regression analysis yielded high predictive accuracy, with average R2 values of 0.994 for Fe, 0.943 for Al, and 0.992 for SiO2. Further dimensionality reduction using Principal Component Analysis (PCA), along with Linear Discriminant Analysis (LDA) of multivariate statistical analysis, effectively classifies debris types and enhances interpretability. These results demonstrate the potential of capacitive sensing as an offline, non-invasive alternative to traditional techniques for wear debris monitoring in transmission systems. These results confirm the potential of capacitive sensing, supported by statistical modeling, as a non-invasive, cost-effective technique for offline classification and monitoring of wear debris in transmission systems.
1. Introduction
Monitoring solid debris in used lubricating oil of transmission system is a cornerstone of predictive maintenance strategies and condition-based monitoring. Wear particles provide direct evidence of component degradation, enabling timely corrective actions before severe damage or machine failure occurs. In recent years, numerous oil analysis methods have been developed, each targeting specific aspects of debris detection. However, no single technique currently offers a universal solution for identifying all particle types, sizes, shape, thickness ratio, surface texture, edge detail, and compositions—resulting in analytical blind spots that may hinder accurate diagnostics.
Traditional spectrographic techniques such as Rotating Disk Electrode (RDE) and Rotrode Filter Spectroscopy (RFS) are effective at detecting small metallic elements and trace wear constituents. Yet, they suffer from a major limitation, that is, an inability to identify larger particles, generally those exceeding 25 microns, due to physical limitations in atomization and excitation processes [1]. Meanwhile, automatic particle counters provide real-time data on particle size and quantity, crucial for assessing oil cleanliness. Despite this, they lack the ability to differentiate between metallic, non-metallic, or contaminant particles because they are insensitive to compositional characteristics [2].
Techniques such as Analytical Ferrography, Magnetic Chip Detectors (MCD), and the Particle Quantifier Index (PQI) are particularly effective in detecting ferromagnetic wear debris. However, these methods inherently favor magnetic materials, thus underreporting or missing entirely non-ferrous and non-metallic contaminants like alumina oxide or silicon dioxide [3,4]. Similarly, metallic wear sensors—commonly integrated in-line—offer continuous monitoring but are selective toward conductive particles, leaving non-metallic debris undetected [5]. Acoustic emission monitoring, though promising in capturing real-time wear events, poses challenges in calibration and interpretation. It is often difficult to distinguish genuine wear signals from background mechanical noise [6].
Amidst this landscape of fragmented capabilities, the need for a versatile, cost-effective, and compositionally inclusive detection technology becomes increasingly apparent. This aligns with the Large Particle Testing (LPT) concept put forward by Poley [7], who emphasized that larger particles serve as more definitive indicators of ongoing mechanical wear. Consequently, innovative solutions that overcome the limitations of existing techniques are necessary for a more comprehensive oil analysis. One such advanced tool is the LaserNetFines (LNF) system, which combines direct imaging with laser-based detection to evaluate both the size distribution and morphology of particles present in lubricating oil. The LNF system excels in categorizing particles by shape—such as cutting wear, severe sliding wear, and fatigue debris—and offers partial compositional insights by analyzing optical density and reflectivity. Unlike conventional particle counters, LaserNetFines retains particle images for visual inspection and classification, providing valuable insights into the root cause of wear mechanisms. While it does not match the elemental specificity of spectrometric techniques, its ability to classify debris morphology makes it particularly useful in industrial diagnostics where wear pattern identification is critical [8].
Recent advancements in sensor technologies have significantly enhanced the capabilities of real-time oil condition monitoring, which is essential for predictive maintenance and machinery reliability. A miniaturized thermal conductivity sensor based on the hot-film principle [9] has been developed to detect water contamination and degradation in mineral oil, demonstrating that such conditions lead to increased thermal conductivity and thus can be effectively monitored in real time. Complementing this, a compact optical sensor utilizing non-dispersive infrared (NDIR) spectroscopy [10] enables quasi-continuous in situ monitoring of key oil parameters such as oxidation, water content, and acid number, with high correlation to laboratory results. These sensing approaches highlight the trend toward integrating intelligent monitoring systems within mechanical components. In alignment with this trend, sensor-integrating machine elements [11]—such as bearings, shafts, and gears with embedded sensing functionality—have emerged as a foundational technology in the digitalization of mechanical systems. Current research emphasizes their systematic development, modularization, and use of smart materials, though challenges remain in energy supply, data transmission, and cybersecurity. Together, these innovations underscore the movement toward more autonomous and interconnected condition monitoring systems, supporting the broader objectives of Industry 4.0.
In response to these diverse limitations and building upon the LPT framework, the present study introduces a capacitive proximity sensor as a new approach for quantifying total solid debris in used lubricants. The sensor’s performance is examined under varying ratios of large and small particles across three representative debris types: ferrous (Fe), non-ferrous (Al), and non-metallic (SiO2). Using cubic regression analysis, the sensor’s electrical response is modeled against controlled debris mixtures, and further statistical processing is carried out through Principal Component Analysis (PCA), Linear Discriminant Analysis (LDA), as the clustering algorithms. This multifaceted approach enables robust classification while maintaining a low-cost, non-invasive, and material-independent profile—highlighting its potential for an offline invasive technique in transmission system health monitoring.
2. Experimental Methodology
The capacitive sensor utilized in this study is an IFM KI6000 model, IFM automation, Essen, Germany, engineered for proximity sensing in viscous fluid environments. The sensor’s structural configuration, as illustrated in Figure 1 and Figure 2, features a pair of concentrically aligned metallic electrodes embedded within a non-conductive housing. These electrodes function as the plates of an “unwound” or planar capacitor, designed to maximize interaction with the surrounding medium. The inter-electrode region constitutes the primary sensing zone, where alterations in the dielectric properties of the intervening material directly influence the system’s electrical characteristics. When solid debris—such as metallic or non-metallic wear particles—suspended in the lubricating fluid enters the sensor’s active region, it perturbs the established electrostatic field between the electrodes. This disturbance leads to a measurable shift in the capacitance of the oscillator circuit integrated within the sensor. The capacitance change modifies the oscillator’s output signal, primarily in terms of amplitude and frequency. A dedicated trigger circuit continuously monitors the oscillatory signal and compares it to a predefined threshold. Upon detecting a change exceeding this threshold, the sensor alters its output state, thereby enabling real-time indication of the presence and potentially the concentration of particulate contaminants. To enable data logging and real-time analysis, the sensor is interfaced with a data acquisition system (DAQ). The sensor’s analog output signal is first routed through a signal conditioning stage, which includes analog filtering and amplification to enhance signal fidelity. This processed signal is subsequently digitized using an Analog-to-Digital Converter (ADC) and transmitted to a PC-based graphical user interface (GUI) for continuous visualization and storage [12]. This setup supports the collection of high-resolution time-series data for advanced multivariate statistical analysis and classification tasks (Figure 3).
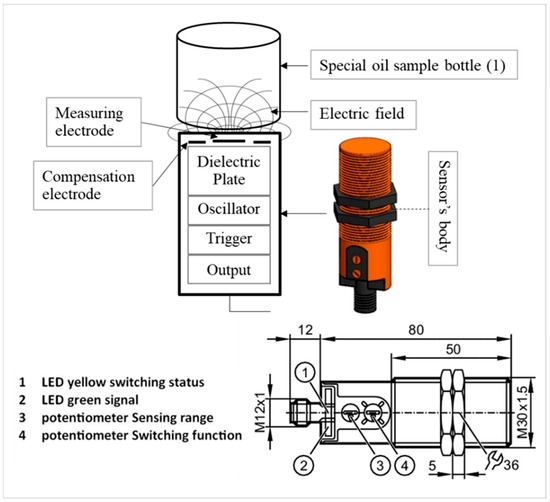
Figure 1.
Schematic illustration of the capacitive proximity sensor used to detect solid debris in oil. The sensor includes a dielectric plate, oscillator, trigger circuit, and output interface aligned with a sample bottle to create an electric field.
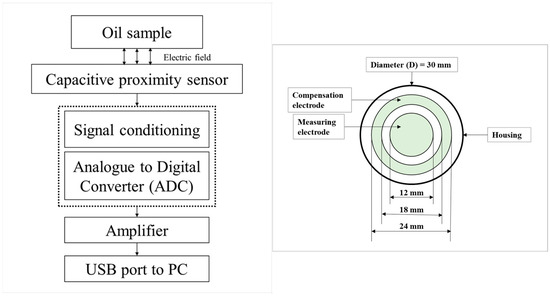
Figure 2.
Signal processing flow of the capacitive proximity sensor system including signal conditioning, ADC conversion, amplification, and data transmission to a PC and schematic diagram of sensor configuration.
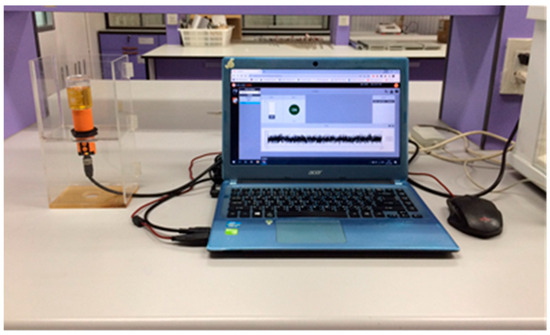
Figure 3.
Experimental laboratory setup showing the sensor unit connected to a data acquisition system and a laptop for signal monitoring and analysis.
The sensor’s sensitivity to debris is governed by the dielectric properties of the particles; materials with higher dielectric constants induce greater changes in capacitance and are therefore more readily detected. Fundamentally, the sensor operates based on the principle of electric field interference caused by solid particulates. The electric field, defined as the force per unit charge, directs outward from a positive charge and inward toward a negative charge, influencing any charge entering the field. The direction of the electric field corresponds to the direction of the force exerted on a positive test charge. This principle underpins the detection mechanism used by the capacitive sensor to monitor changes in the dielectric environment caused by different types of solid debris.
The electric field is mathematically defined as
where
E = F/q
- E is the electric field (in newtons per coulomb, N/C),
- F is the electric force (in newtons, N),
- q is the electric charge (in coulombs, C).
The capacitance of the sensor, which varies in response to the presence of different solid particles, is governed by the dielectric properties of the surrounding medium. It can be expressed by the following equation:
where
C = ε0 × εr × A/d
- C is the capacitance (in farads, F),
- ε0 is the permittivity of free space (approximately 8.854 × 10⁻¹² F/m),
- εr is the relative dielectric constant of the oil or medium between the electrodes,
- A is the effective overlapping area of the two electrodes (in square meters),
- d is the distance between the electrodes (in meters).
Since ε0, A, and d are constant for a given sensor configuration, the capacitance primarily varies with the dielectric constant εr of the medium. Thus, the presence of solid particles alters εr, producing detectable changes in capacitance that enable the sensor to effectively identify and monitor debris in lubricating oil.
To evaluate the repeatability of the capacitive sensor, 20 repeated measurements of 0.60 g/25 mL of PTT limited slip gear oil SAE 85W-140, Bangkok, Thailand were conducted for each debris type under identical test conditions. The results, summarized in Table 1, include the mean sensor output, standard deviation (SD), and coefficient of variation (CV) for ferrous (Fe), aluminum (Al), and silicon dioxide (SiO2) particles, separated into large and small sizes.

Table 1.
Repeatability test.
The mean sensor responses ranged from 75.70 mV to 95.50 mV across all debris types, with standard deviations consistently below 2.0 mV. The calculated CV values—which express the relative variation as a percentage of the mean—ranged from 1.33% to 2.23%.
These results demonstrate high repeatability across all measurements. Particularly, SiO2 small particles exhibited the lowest CV at 1.33%, indicating excellent measurement stability. Fe small and Al large debris also showed very good repeatability, with CV values of 1.70% and 1.72%, respectively. Even the highest CV observed (2.23% for Al small particles) remains well within acceptable limits for sensor precision in tribological diagnostics. Overall, the low variability and narrow spread of repeated measurements confirm that the sensor provides consistent and reliable outputs under controlled conditions, reinforcing its suitability for quantitative condition monitoring and multivariate statistical modeling.
The experimental investigation involved evaluating the response signal of used lubricating oil mixed with three types of solid debris—namely ferrous (Fe), aluminum (Al), and silica (SiO2) particles—using the capacitive sensor. These particles were introduced in predefined large-to-small ratios (100:0, 75:25, 50:50, 25:75, and 0:100) while maintaining a constant overall debris concentration at 0.5 g over 25 mL of lubricating oil sample. The debris was prepared using controlled sieving procedures to produce sharply separated particle size distributions.
Prepared samples were mixed into SAE 85W-140 general mineral lubricating base oil API Gl-4 specification and tested using a capacitive sensor connected to a data acquisition system. The sensor interface included an analog signal conditioner, amplification circuitry, and an ADC, feeding into a PC-based graphical user interface for continuous signal monitoring.
Each test was conducted by locating an oil sample container containing the prepared oil sample over the sensor’s measuring head. The response signal was continuously recorded; three repeated tests were carried out to visualize capacitance variation over time. To ensure consistent results, the testing rig was custom designed to minimize mechanical variation and secure repeatable sensor positioning. Throughout the testing period, all experiments were conducted under ambient laboratory conditions maintained at 25 °C, with minimal exposure to environmental noise such as vibration or thermal drift.
Additionally, microscopic imaging was shown to document and confirm the morphology of both large (average size range 450 to 600 µm) and small debris particles (average size range 54 to 70 µm). Representative images including metallic debris and non-metallic granules are provided in Figure 4, Figure 5 and Figure 6, each accompanied by a 500-micron scale bar.
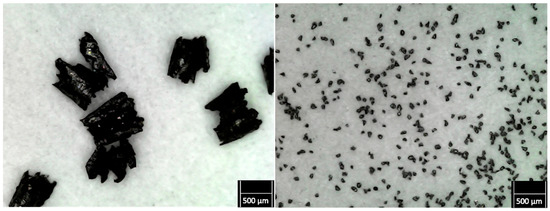
Figure 4.
Microscopic images showing typical morphology of large (left) and small (right) non-metallic debris particles used in the mixing experiments. Each frame is shown with a 500 µm scale bar.
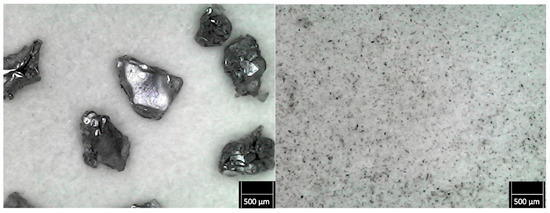
Figure 5.
Microscopic images showing typical morphology of large (left) and small (right) metallic debris particles used in the experimental tests. Each frame is shown with a 500 µm scale bar.
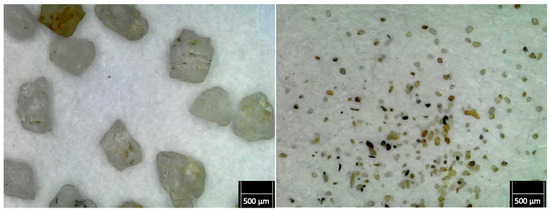
Figure 6.
Microscopic images showing typical morphology of large (left) and small (right) SiO2 non-metallic debris particles used in the experimental tests. Each frame is shown with a 500 µm scale bar.
This experimental framework successfully simulates real-world oil contamination scenarios: ferrous, non-ferrous metallic and non-metallic debris, and highlights the effectiveness of capacitive sensing for detecting and characterizing solid contaminants of varying material types and sizes in used lubricants.
3. Sensor Response and Statistical Analysis
The capacitive sensor’s output trend over a 10 min test duration was examined for Ferrous debris mixed in SAE 85W-140 mineral oil at different large-to-small particle ratios (Figure 7). A clear dependency of sensor response on particle morphology and mixing ratio was observed. At 100% large particles, the sensor output shows a pronounced and steady increase, peaking at around 100 mV. The steep rise is likely due to stronger dielectric interference caused by large ferrous debris entering and accumulating within the sensing field. These particles, due to their mass and jagged morphology, disturb the electric field more effectively.
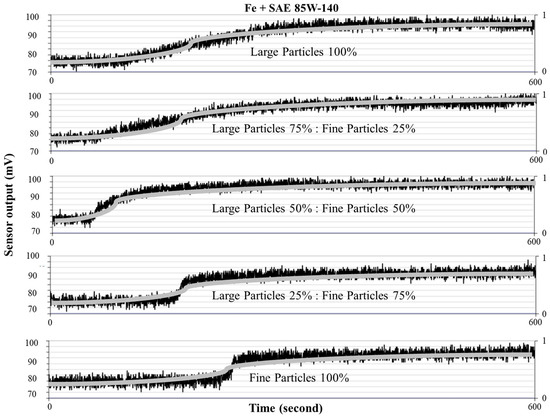
Figure 7.
Sensor output trend for Fe debris at different large-to-small particle ratios in SAE 85W-140.
As the mixing ratio shifts to 75:25 and 50:50, the sensor response still trends upward but with slightly reduced slopes and lower peak values, indicating a moderated dielectric effect due to the presence of smaller debris, which individually contribute less capacitance shift. With 25% large to 75% small, the trend becomes flatter, with a smaller amplitude and more delayed saturation, reflecting a predominance of small debris that generate lower individual sensor signals. At 100% small particles, the initial spike is minimal and the overall trend is relatively subdued, with peak output not exceeding ~90 mV. This result underscores the weaker capacitive interaction of small Fe particles, consistent with their lower surface area and interaction strength. The overall analysis demonstrates that Fe debris size distribution significantly influences capacitive sensor output. Larger ferrous particles contribute more distinctly to the response signal, reinforcing the suitability of capacitive sensors for monitoring severe wear conditions involving coarse debris.
Aluminum debris (Al)
The sensor response trends for Al particles (Figure 8) show a generally weaker signal compared to Fe debris, consistent with aluminum’s lower dielectric constant. At 100% large particles, the response increases gradually over time but with lower peak amplitude than Fe, indicating a less disruptive interaction with the capacitive field. As the ratio of small particles increases (75:25 and 50:50), the response trends become more noisy and less distinguishable, although there is still a noticeable upward trajectory. The 50:50 mix appears to yield a moderate but distinguishable capacitance shift, suggesting some cumulative interaction between large and small Al particles. At 25% large and 75% small, the signal becomes increasingly scattered, and saturation is not clearly observed, implying weak dielectric engagement from predominantly small Al particles. Finally, in the 100% small particle case, the sensor output is nearly flat, fluctuating around a low baseline, reflecting the minimal capacitive impact of small aluminum debris. These results suggest that although Al debris can be detected by the capacitive sensor, the signal strength is significantly reduced compared to ferrous particles. The findings emphasize that while size still plays a role, material properties like conductivity and debris shape may also influence sensor response dynamics.
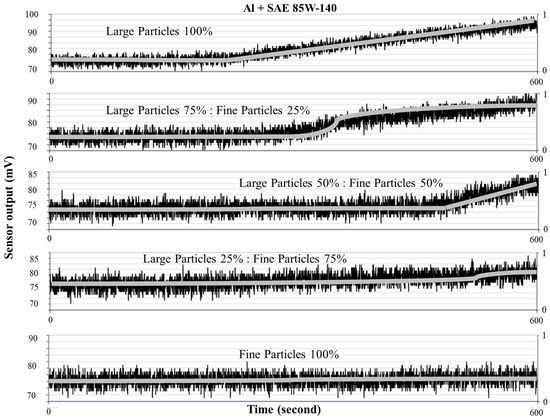
Figure 8.
Sensor output trend for Al debris at different large-to-small particle ratios in SAE 85W-140.
Silica debris (SiO2)
The trending response for SiO2 particles (Figure 9) shows the lowest overall signal amplitude among the three tested debris types. Even at 100% large particles, the sensor response is only slightly elevated, reflecting the inherently lower dielectric interaction of non-metallic, non-conductive particles. This muted behavior is expected given that SiO2 has quite low density and a relatively weak influence on capacitance change compared to metals. As the mixture includes more small particles, the trend lines flatten further. At 50:50 and 25:75 ratios, the response becomes nearly indistinguishable from noise, with no clear saturation trend. In the 100% small SiO2 case, the sensor output remains largely unchanged over time, suggesting an extremely low capacitive sensitivity to these particles. These results confirm that while SiO2 particles do enter the sensing field, their impact on the electric field strength and capacitance modulation is limited, especially in small form. Nonetheless, the slight rising trend in the large-particle case indicates that piling up of SiO2 particles may still contribute detectable shifts under certain conditions.
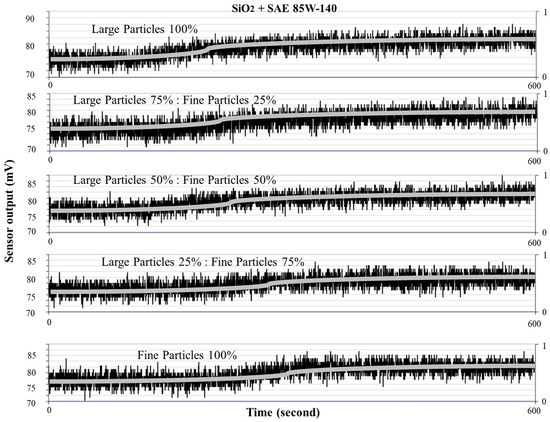
Figure 9.
Sensor output trend for SiO2 debris at different large-to-small particle ratios in SAE 85W-140.
In consequence of the above, sensor response histograms which are shown in Figure 10, Figure 11 and Figure 12, were developed for ferrous (Fe), aluminum (Al), and silica (SiO2) debris suspended in SAE 85W-140 lubricant, using data collected from three repeated trials of continuous sensor monitoring output. These histograms represent a time-resolved summary of the capacitive sensor’s voltage output (in millivolts), plotted across a test duration of 1 to 600 s. To ensure consistency and statistical robustness, sensor readings were captured at regular 100 s intervals during each trial, allowing for the construction of averaged histograms that accurately reflect the signal trends under each test condition.
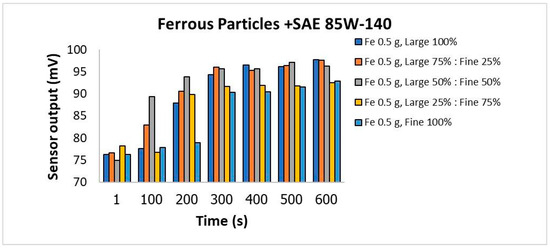
Figure 10.
Sensor output histogram for Fe particles in SAE 85W-140.
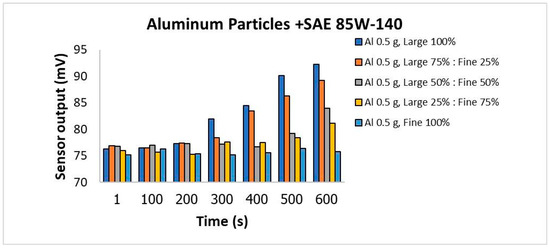
Figure 11.
Sensor output histogram for Al particles in SAE 85W-140.
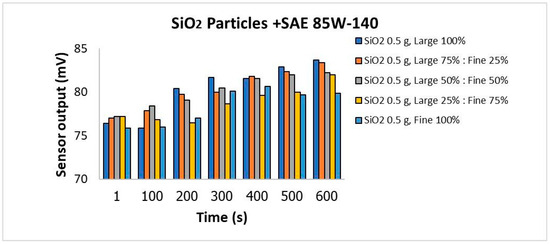
Figure 12.
Sensor output histogram for SiO2 particles in SAE 85W-140.
For all three debris types, the analysis was performed under controlled conditions, maintaining a fixed total debris mass of 0.5 g per 25 mL of SAE 85W140 oil while varying the proportion of large to small particles. The evaluated mixing ratios include: 100% large particles, 75% large to 25% small, 50% large to 50% small, 25% large to 75% small, and 100% small particles. These specific distributions were chosen to study how particle size heterogeneity influences the capacitive response profile over time. The resulting histograms not only capture the transient and steady-state behavior of the sensor output but also serve as a foundation for subsequent cubic regression analysis and statistical interpretation.
3.1. Cubic Regression
In addition to the histograms, cubic regression was applied to model the time-dependent behavior of capacitive sensor output in response to ferrous (Fe), aluminum (Al), and silica (SiO2) debris dispersed in SAE 85W-140 lubricant. The sensor response data were extracted from histogram trend plots, representing changes in output voltage over a 10 min test interval for various debris compositions and particle size distributions. These regression models are based on data obtained from three repeated sensor measurements for each debris condition. For each test, the sensor output was sampled at 100 s intervals, allowing for the construction of consistent histograms that capture time-dependent signal evolution. The use of repeated measurements enhances the statistical reliability of the extracted regression coefficients and minimizes the influence of random noise or transient anomalies. To capture the nonlinear characteristics of the sensor output—particularly the gradual rise, inflection points, and saturation behaviors observed in real-time sensing—a third-degree polynomial model was employed. The cubic equation is defined as
where t is the elapsed time in seconds, and β0 through β3 are the regression coefficients corresponding to the constant, linear, quadratic, and cubic terms, respectively. These coefficients reflect the influence of time on the sensor’s response and vary according to debris type and composition.
Sensor Output = β0 + β1·t + β2·t2 + β3·t3
The coefficient of determination (R2) was used to evaluate the model’s accuracy in fitting the empirical data. An R2 value close to 1.0 indicates that the cubic model effectively captures the variability in the sensor output and provides a robust description of the underlying trends.
By comparing the fitted models across different debris types, it becomes possible to interpret how material properties such as conductivity, particle shape, and dielectric behavior influence the sensor’s performance. This regression approach supports the development of predictive frameworks for online condition monitoring, especially in applications where debris characterization is essential for diagnosing machinery wear and lubricant degradation. To model the nonlinear relationship between debris composition and sensor response, originally various polynomial regression models were evaluated. Initially, a first-order (linear) regression was applied; however, it produced low coefficients of determination (R2), indicating an inadequate fit to the experimental data. A second-order (quadratic) model improved the fit moderately but failed to fully capture the observed curvature and saturation effects in several cases. The third-order (cubic) polynomial regression achieved the highest R2 values demonstrating superior predictive accuracy within the studied range. Thus, the cubic model was selected to extract the regression coefficients (β0 to β3), which were subsequently used for statistical classification. While it was recognized that the use of higher-order polynomials may limit extrapolation beyond the experimental domain, our analysis focuses on classification within the tested debris ratios, where the cubic model proved most appropriate.
Figure 13, Figure 14 and Figure 15 below illustrate the cubic regression trends for each material and its respective debris mixing configurations.
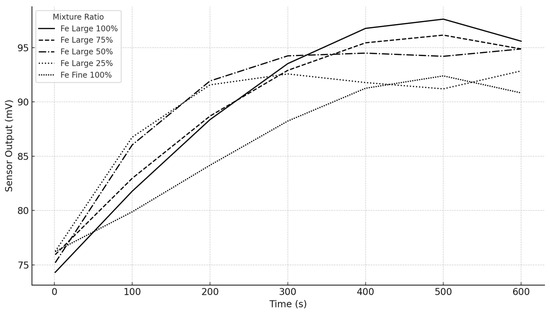
Figure 13.
Ferrous (Fe) debris cubic regression plot.
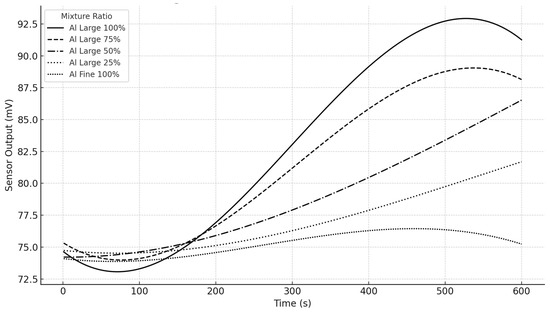
Figure 14.
Aluminum (Al) debris cubic regression plot.
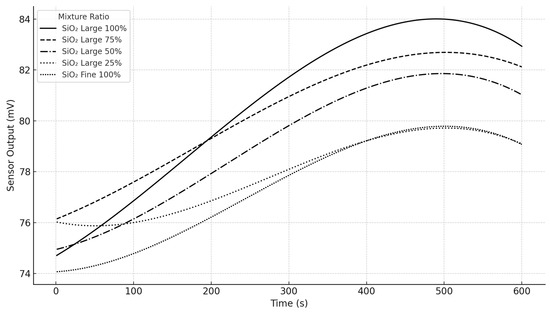
Figure 15.
Silica (SiO2) debris cubic regression plot.
From Table 2, Table 3 and Table 4, the regression analysis highlights key differences in how the sensor responds to Fe, Al, and SiO2 debris over time:

Table 2.
Cubic regression results for ferrous debris.

Table 3.
Cubic regression results for aluminum debris.

Table 4.
Cubic regression results for silica debris.
- Ferrous (Fe) Particles: Show the highest sensor output and strongest regression fit (R2 > 0.98 in most cases), indicating high sensor sensitivity to magnetic particles. The β coefficients also reveal a pronounced nonlinear growth in response.
- Aluminum (Al) Particles: Exhibit a more moderate sensor response with noticeable variance across mixtures. R2 values remain high, though slightly lower than Fe, showing reliable but less intense sensor interaction.
- Silica (SiO2) Particles: Demonstrate gradual and steady sensor output increase. The sensor appears less sensitive to SiO2 compared to Fe and Al, yet the cubic models still provide good fits (R2 ~ 0.96). The trend shows smoother curves with smaller β values.
Overall, the sensor shows different levels of sensitivity and response dynamics depending on the particle material and size distribution. This reflects both material-specific interaction mechanisms and the influence of particle composition on sensor behavior. From a physical standpoint, ferrous particles (Fe), being magnetic, likely induce stronger and more variable interactions with the sensor, resulting in more dynamic coefficients. Aluminum and SiO2, being non-magnetic, produce weaker effects, with SiO2 (an insulator) contributing the least. From a statistical viewpoint, higher-order terms (β2 and β3) improve model fit for complex materials like Fe, while simpler models suffice for SiO2. These differences underline both the material properties and the sensor’s differential sensitivity.
Some fluctuations in the sensor’s voltage output over time were observed, particularly in prolonged measurements. This temporal variation is likely due to physical interactions within the fluid, such as sedimentation of heavier particles, agglomeration of small and large metal debris, or redistribution of particles caused by minor fluid disturbances. These effects can transiently alter the dielectric properties around the sensor electrodes, leading to signal variability. Such behavior reflects the dynamic nature of debris–lubricant interaction and highlights the importance of statistical averaging in sensor signal interpretation.
3.2. Multivariate Statistical Assessment
The Principal Component Analysis (PCA) and Linear Discriminant Analysis (LDA) were performed using the regression coefficients β1, β2, and β3, and the R2 values derived from the cubic regression models of Fe, Al, and SiO2 debris mixing in SAE 85W-140 oil are plotted as shown in Figure 16 and Figure 17, respectively.
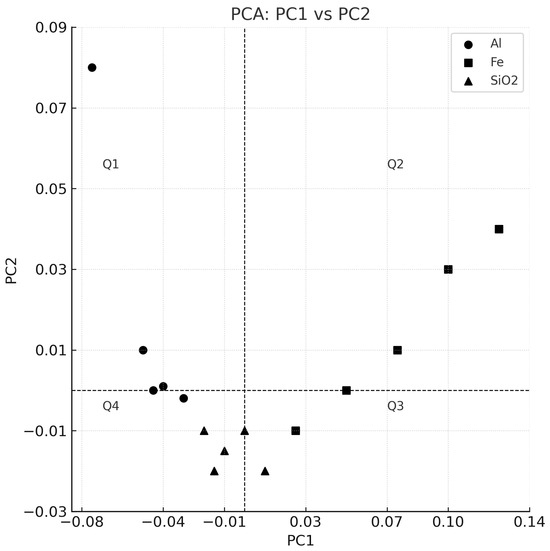
Figure 16.
PCA plot showing PC1 vs. PC2 with quadrant markers for Fe, Al, and SiO2.
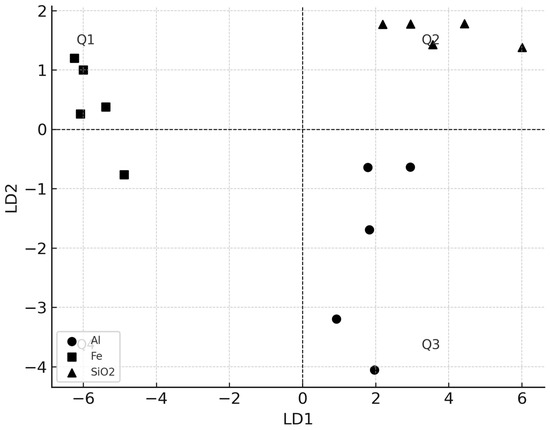
Figure 17.
LDA plot showing LD1 vs. LD2 with quadrant markers for Fe, Al, and SiO2.
The data points in the PCA plot (PC1 vs. PC2) as shown in Figure 16, corresponding to different debris types exhibit distinct clustering behavior, highlighting the variance in regression characteristics across Fe, Al, and SiO2. PCA identifies directions of maximum variance, which in this case, separates the ferrous from the non-ferrous and non-metallic particles. The quadrant division in the PCA plot further reveals the concentration of Al and SiO2 samples in different quadrants, suggesting systematic differences in their regression response trends. Figure 17, the LDA plot, on the other hand, is a supervised technique aiming to find a feature space that maximizes the separation between the known categories. In the LD1 vs. LD2 plot, a clearer separation between Fe, Al, and SiO2 samples is observed. This demonstrates that the regression-based features are not only statistically meaningful but also physically significant enough to discriminate between the three debris types. The LD1 axis likely represents the most significant contrast in response dynamics (e.g., metallic vs. non-metallic), while LD2 may reflect secondary differences such as the degree of agglomeration or dielectric contrast. Overall, both PCA and LDA confirm the feasibility of using regression-based descriptors derived from time-dependent sensor response data for debris classification. This supports the potential for automated debris identification in used oil analysis using a capacitive sensor platform.
3.3. Physical Interpretation
It can be postulated that the sedimentation and agglomeration behaviors of debris in lubricating oils are governed by distinct physical–electrical mechanisms that differ fundamentally between metallic and non-metallic particles (Figure 18 and Figure 19). Metallic debris, due to its higher density and often irregular morphology, tends to sediment rapidly under gravitational forces, promoting individual settling but also facilitating electrostatic or magnetic-induced clustering when in close proximity. In contrast, non-metallic debris such as silica exhibits slower sedimentation rates owing to its lower density and may instead favor sedimentation through gravitational force as governed by Stoke’s law, particularly in high-viscosity media. The interplay between particle size, surface charge, and dielectric properties critically modulates the extent to which each type of debris undergoes sedimentation versus agglomeration, ultimately influencing their detectability by capacitive sensors and other condition monitoring techniques.
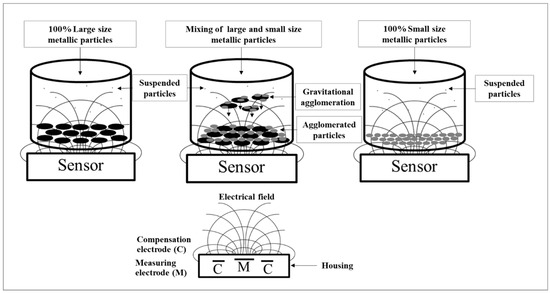
Figure 18.
Proposed physical model for metallic debris particles.
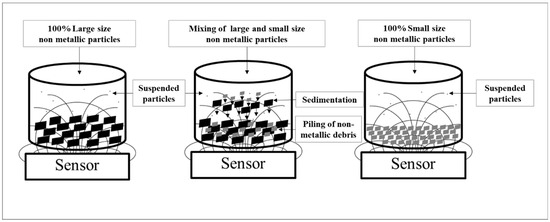
Figure 19.
Proposed physical model for non-metallic debris particles.
The image illustrates three cases:
- 100% large-size metallic particles: These settle rapidly due to higher density and size.
- Mixture of large and small metal particles: Agglomeration occurs, forming clusters that sediment faster.
- 100% small-size non-metallic particles: Particles remain suspended due to low sedimentation velocity.
In order to enhance the interpretability and scientific grounding of the sensor response data, a physics-based model is proposed to describe the sedimentation and agglomeration behavior of solid debris in lubricating oils. This model considers the physical forces acting on debris particles in a viscous fluid and how these forces affect their spatial distribution relative to the sensing plane of a capacitive sensor.
The sedimentation of solid debris particles in oil is governed by Stokes’ Law, which describes the terminal velocity of a spherical particle falling under gravity in a viscous fluid:
where
v = (2/9)(r2 (ρp − ρf) g)/μ
- v = terminal velocity of the particle
- r = radius of the particle
- ρp = density of the particle
- ρf = density of the fluid (oil)
- g = gravitational acceleration
- μ = dynamic viscosity of the fluid
From Table 5 above, it is evident that larger and denser particles (e.g., metallic debris) settle faster and are more likely to interact with the sensor surface. This behavior directly impacts the initial linear and quadratic terms (β1 and β2) in the cubic regression model. In addition to sedimentation, agglomeration plays a critical role, especially for metallic particles with high surface energy. These particles may cluster due to van der Waals forces or other inter-particle attractions. Agglomeration changes the effective size and dielectric signature of the particles, altering the capacitance profile. Agglomeration is also influenced by concentration and particle mixing ratios. In cases where small and large particles are mixed, bridging and clustering may occur, leading to nonlinearities in the sensor output. These effects are captured by higher-order terms (β2 and β3) in the regression model.

Table 5.
Calculation of terminal velocity of the particles.
However, it should be noted that terminal velocity represents a simplified, single-particle theoretical model. In practice, the sensing environment contains a complex mixture of large and small debris at various concentrations. Under these conditions, particle–particle interactions such as agglomeration (especially in metallic debris like Fe and Al) and non-uniform sedimentation dynamics cause deviations from linear behavior. These collective phenomena lead to a nonlinear sensor response, which cannot be fully captured by first-order models. As a result, higher-order polynomial regression, particularly quadratic and cubic models, provided a significantly better fit to the sensor output data. This is evident in the high R2 values observed indicating that second- and third-order regression effectively captures the complex interplay of physical behaviors influencing the capacitive signal.
The table below summarizes the typical physical and electrical properties of the primary debris types analyzed in this study. These characteristics influence both the sedimentation/agglomeration behavior and the capacitive sensor’s dielectric response. As such, they provide an important physical basis to interpret the regression coefficients obtained from statistical modeling.
From Table 6 above, it is evident that ferrous debris has the highest density and a moderate dielectric constant, leading to strong sedimentation–agglomeration and predictable linear sensor responses (higher β1). Al has a lower density but still produces measurable dielectric perturbations. SiO2 on the other hand, with low density and dielectric constant, tends to remain suspended longer and sediments steadily due to gravitational settling, contributing to more complex, nonlinear sensor responses (notably influencing β2 and β3 terms). Thus, these physical properties align well with the trends observed in the regression analysis and support the interpretation provided by the postulated physics model.

Table 6.
Typical characteristics of ferrous, aluminum, and silica debris [13].
In terms of debris characteristics, the following physical traits significantly affect these coefficients:
- Particle Size: Larger particles sediment faster (per Stokes’ Law), leading to more immediate sensor interaction.
- Density: Heavier particles like Fe contribute more to the β1 term due to stronger gravitational settling.
- Dielectric Constant: Materials with higher permittivity (such as metals) create stronger perturbations in the capacitive field, influencing the overall signal amplitude.
- Agglomeration Tendency: Non-metallic particles with low surface energy or granular shapes may agglomerate more readily. This introduces nonlinearities (β2, β3) due to changes in effective particle size and interaction geometry.
Thus, by examining the regression coefficients, one can infer qualitative and quantitative information about the particle type, size distribution, sedimentation dynamics, and fluid–particle interactions. This linkage enhances the interpretability of sensor data and strengthens the case for using multivariate regression in oil debris diagnostics. This integration strengthens the analytical framework and provides a mechanistic explanation for the sensor response trends, enhancing both scientific robustness and practical applicability of the condition monitoring technique.
4. Conclusions
The following conclusions can be drawn from this research:
- Capacitive proximity sensing is established as a feasible, cost-effective, and non-invasive method for real-time monitoring of solid debris in lubricating oils. Its offline adaptability and simplicity in design make it well-suited for integration into existing industrial machinery without disrupting operations.
- The use of cubic regression models to analyze sensor responses across varying particle size distributions (Fe, Al, and SiO2) enables the accurate characterization of nonlinear behaviors such as agglomeration and sedimentation. These regression-based features reflect meaningful physical interactions, including dielectric effects, particle density, and dynamic clustering phenomena.
- The extracted statistical parameters from sensor data serve as reliable descriptors that align with underlying physics-based mechanisms, supporting the integration of data-driven models with physically interpretable insights. This enhances the diagnostic depth of the sensing framework.
- The application of multivariate techniques—including Principal Component Analysis (PCA), Linear Discriminant Analysis (LDA), and clustering algorithms—significantly improves the classification accuracy among different debris types. This capability is particularly valuable in complex lubrication systems with mixed metallic and non-metallic contamination.
Although the present study confirms the potential of capacitive sensing combined with cubic regression analysis for classifying Fe, Al, and SiO2 debris in lubricants, further validation through benchmarking against established debris analysis techniques is strongly recommended. Future investigations should incorporate comparative studies involving randomly selected lubricant samples, assessed concurrently using standard methods such as spectrometric oil analysis, particle counting, or analytical ferrography. Such an approach would provide a more comprehensive evaluation of sensor accuracy, reliability, and practical applicability. This step is considered essential for advancing the method from laboratory feasibility toward implementation in real-world condition monitoring systems.
Author Contributions
Conceptualization, S.R.; methodology, S.R.; validation, S.I.; formal analysis, S.I.; investigation, S.R.; resources; writing—original draft preparation, S.R.; writing—review and editing, S.R.; visualization, S.I.; supervision, S.R.; project administration, S.R.; funding acquisition. All authors have read and agreed to the published version of the manuscript.
Funding
Department of Production and Robotics Engineering, Faculty of Engineering, King’s Mongkut University of Technology of funding this research project.
Data Availability Statement
The original contributions presented in this study are included in the article. Further inquiries can be directed to the corresponding author.
Conflicts of Interest
The authors declare no conflict of interest.
References
- Totten, G.E.; Westbrook, S.R. Handbook of Lubrication and Tribology, Volume II: Theory and Design; CRC Press: Boca Raton, FL, USA, 2003. [Google Scholar]
- Hunt, T.M. Handbook of Wear Debris Analysis and Particle Detection in Liquids; Elsevier Science Publishers Ltd.: Amsterdam, The Netherlands, 1993. [Google Scholar]
- Fitch, J.C. Proactive Maintenance for Mechanical Systems; FES Inc.: Stillwater, OK, USA, 1992; p. 74075. [Google Scholar]
- Roylance, B.J. Ferrography–then and now. Tribol. Int. J. 2005, 38, 857–862. [Google Scholar] [CrossRef]
- Zhu, X.; Zhong, C.; Zhe, J. Lubricating oil conditioning sensors for online machine health monitoring—A review. Tribol. Int. J. 2017, 109, 473–484. [Google Scholar] [CrossRef]
- Zhu, J.; He, D.; Bechoefer, E. Survey of lubrication oil condition monitoring diagnostics and prognostics techniques and systems. J. Chem. Sci. Technol. 2013, 2, 100–115. [Google Scholar]
- Poley, J. Practical Fluid Analysis in the 21st Century; Reliabilityweb: Blair, NE, USA, 2019. [Google Scholar]
- Spectro Scientific. LaserNetFines Particle Analysis Technology Guide. 2020. Available online: www.spectrosci.com (accessed on 15 April 2025).
- Kuntner, J.; Chabicovsky, R.; Jakoby, B. Sensing the thermal conductivity of deteriorated mineral oils using a hot-film microsensor. Sens. Actuators A Phys. 2005, 123, 397–402. [Google Scholar] [CrossRef]
- Rauscher, M.S.; Tremmel, A.J.; Schardt, M.; Koch, A.W. Non-dispersive infrared sensor for online condition monitoring of gearbox oil. Sensors 2017, 17, 399. [Google Scholar] [CrossRef] [PubMed]
- Kirchner, E.; Wallmersperger, T.; Gwosch, T.; Menning, J.D.; Peters, J.; Breimann, R.; Stahl, K. A review on sensor-integrating machine elements. Adv. Sens. Res. 2024, 3, 2300113. [Google Scholar] [CrossRef]
- IFM Capacitive Sensor Training Manual. Available online: www.ifm-electronic.com (accessed on 18 May 2025).
- Bhushan, B. Modern Tribology Handbook; CRC Press: Boca Raton, FL, USA, 2001. [Google Scholar]
Disclaimer/Publisher’s Note: The statements, opinions and data contained in all publications are solely those of the individual author(s) and contributor(s) and not of MDPI and/or the editor(s). MDPI and/or the editor(s) disclaim responsibility for any injury to people or property resulting from any ideas, methods, instructions or products referred to in the content. |
© 2025 by the authors. Licensee MDPI, Basel, Switzerland. This article is an open access article distributed under the terms and conditions of the Creative Commons Attribution (CC BY) license (https://creativecommons.org/licenses/by/4.0/).