Abstract
To investigate the adhesion characteristics and sanding effect of rail vehicles on a contaminated rail surface, an innovative wheel/ring configuration test rig, named the PLS-Circulator, was employed. Based on the equivalence principle, the sanding condition relationship between the test rig and the field was first established. Then, extensive and quantitative experiments on the enhancement of rail vehicle adhesion in sanding conditions were conducted. The results show that the maximum adhesion coefficient of various media increases with an increase in the amount of sand, and the adhesion-enhancing effects gradually reach the threshold when the amount of sand is high. On the other hand, after a single application of sand, the increase in the adhesion coefficient gradually decreases over time, and the pattern of adhesion enhancement degradation varies in different media. It was found that oil is the most unfavorable condition, where the adhesion-enhancing effect deteriorates the fastest. The appropriate amount of sand on the PLS-Circulator is 0.3 g/m, corresponding to 4.8 g/m of sand in the field.
1. Introduction
Wheel–rail adhesion is an important boundary for rail vehicles and one of the characteristics that make rail travel significantly different from other forms of transportation. Ordinarily, rail vehicles rely on adhesion for guiding, traction, and braking. However, degraded adhesion is one of the most significant challenges faced by rail vehicles in harsh operating environments and complex open-line conditions [1,2]. When rail vehicles operate on a rail surface that is contaminated by oil [3,4], water [5,6], leaves [7,8], etc., the adhesive force between the wheel and rail is limited, which restricts the maximum braking or traction force that the vehicle can apply and even poses serious safety risks. In this case, rail vehicles generally use the method of sanding between the wheel–rail contact interface to improve wheel–rail adhesion over time (multiple years) [9]. Most of the time, this achieves good results in practical operations, but it sometimes contributes to malfunction. This is because the effect of adhesion enhancement during sanding does not last long and diminishes over time [10], so the dynamic evolution of adhesion in the sanding process necessitates further research.
In order to investigate the effects of adhesion characteristics and sanding on contaminated rail surfaces, researchers have conducted sanding simulation tests on different low-adhesion conditions using full-size (Lewis [11]) or scaled (Arias-Cuevas [12]; Omasta [13]; Wang [14,15]) wheel–rail contact simulation test rigs. The experimental results indicate that appropriate sanding can effectively enhance wheel–rail adhesion under various low-adhesion conditions. This adhesion enhancement can be briefly elucidated through the micro-contact mechanism at the wheel–rail interface. The particles entering the interface can effectively pierce through contamination films and establish contact with the wheel and rail metal surfaces, thereby bearing the normal load at the wheel–rail contact interface [16]. The plowing action of these hard particles on the metal interface is considered the primary mechanism for improving the wheel–rail adhesion coefficient [17]. However, existing research is mostly based on wheel/wheel-type test rigs (also called twin-disk rigs, as shown in Figure 1a), which simulate rails using rail rollers. Due to the cyclic rolling of the wheel and the roller, it is hard to match the amount of sand dispersed in test rigs with the actual amount of sand in the field [12,18]. Moreover, the rotation of the rail roller seriously interferes with the normal distribution of contaminants such as oil and water, as well as adhesion-enhancing particles, like sand, between the wheel and the rail, making it difficult to simulate the actual working state of sanding. It is also impossible to simulate the operating characteristics of multiple wheels on a train passing through the same point on the rail, thus causing inaccurate measurements of dynamic evolution in test rigs.
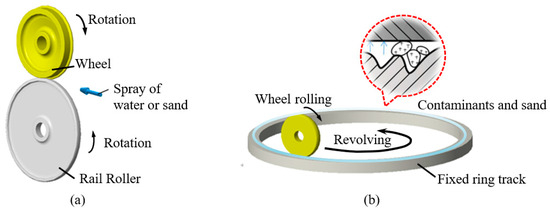
Figure 1.
Test rig configurations for wheel–rail adhesion simulation. (a) Twin-disk rig; (b) wheel/ring test rig.
Recently, a new type of wheel/ring configuration test rig (PLS-Circulator) has been established for adhesion simulations under complex rail surface conditions [19,20]. The test rig is equipped with a fixed ring track, and the wheels run circumferentially on the track (Figure 1b). This configuration overcomes the shortcomings of the twin-disk rig, on which it is difficult to carry out quantitative sanding testing, and can restore the actual distribution state of the low-adhesion medium on the rail surface [21], making test results more accurate and reliable.
This study aimed to carry out experimental research on the sanding effect of rail vehicles under low-adhesion conditions, especially the dynamic evolution of adhesion in the process of sanding. Wheel–rail sanding tests and adhesion-enhancing tests were carried out on the wheel/ring test rig under water, oil, and other conditions to obtain more quantitative data that is consistent with field tests. This study provides data support for the application of active adhesion enhancement and adhesion management of rail vehicles in complex and extreme environments and could be of great significance for efforts towards ensuring the safety and efficiency of rail transit transportation systems.
2. Materials and Methods
2.1. Mechanism of the PLS-Circulator
The PLS-Circulator’s innovative configuration is crucial for quantitative adhesion simulations. The PLS-Circulator consists of two motors (a Vehicle Motor and Wheel Motor, PHYSIS, Ningbo, China), a gearbox, a revolving arm, two wheels, a track, a frame, cylinders, pressure sensors, torque meters, a water spray device, and a sanding device, as shown in Figure 2. The diameter of the fixed ring track is 2 m. The wheels and the ring track are made of the wheel and rail steels that are used in the field. The Vehicle Motor drives the gearbox, which, in turn, revolves the revolving arm and drives the wheel to roll circumferentially on the track. The Wheel Motor generates slip between the wheel and rail.
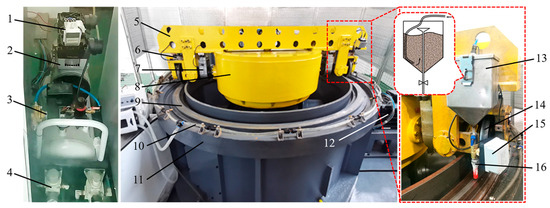
Figure 2.
Structure of the PLS-Circulator. 1—timer-controller; 2—air compressor; 3—solenoid valve; 4—pressure-regulating valve; 5—revolving arm; 6—pressure sensor; 7—torque meter; 8—gearbox; 9—fixed ring track; 10—water spray device; 11—frame; 12—motor; 13—sandbox; 14—wheel; 15—throttle valve; 16—sanding pipe.
The PLS-Circulator applies vertical force between the wheel and rail through cylinders. A pressure sensor is installed between the wheel and the cylinder to measure the vertical force, while a torque meter is deployed between the wheel and the gearbox to measure the tangential force between the wheel and rail.
In the sanding device, compressed air generated by the air compressor is transported to the sandbox through a timer-controlled solenoid valve and pressure-regulating valve. The sandbox is set at one end of the revolving arm. Under the action of compressed air, the sand inside the sandbox is fully lifted and sprayed onto the track in front of the wheel through the built-in funnel, throttle valve, and sanding pipe. In addition, there is a tread cleaner installed above the wheels. By controlling the compressed air pressure and throttle valve opening to regulate the particle distribution density of sand falling on the rail surface, sanding- and adhesion-enhancing effects were achieved between the wheel and rail under mixed-medium conditions.
According to the PLS-Circulator’s mechanism, the fixed track ensures the actual distribution of contaminants and sand on the rail surface. In addition, the wheels running circumferentially simulate multiple wheels of a train to study the dynamic evolution of adhesion. The models, limitations, accuracies, and application scopes of the sensors mentioned above are provided in Table 1.

Table 1.
Sensors in the PLS-Circulator.
2.2. Wheel–Rail Adhesion Simulation
The PLS-Circulator is a down-scaled test rig with a wheel diameter of 210 mm and is one quarter of the actual vehicle size. In order to accurately simulate the actual wheel–rail contact relationship, according to the Hertz equivalent principle [22], the curvature radius of the wheel section can be calculated as 75 mm, and the curvature radius of the railhead is infinite [19]. In this case, the maximum contact pressure and the ratio of the longitudinal and transversal semi-axis length of the elliptical contact patch are the same in both the test rig and the field. Hence, the corresponding relationship between the simulated axle load of a real vehicle and the vertical force exerted on the test rig is presented in Table 2.

Table 2.
Relationship between the axle load and the vertical force on the PLS-Circulator.
Since the wheel on the test rig is coaxial with the torque meter, the tangential force (T) between the wheel and rail can be calculated based on the torque meter, while the vertical force (N) between the wheel and rail can be collected by the pressure sensor. The adhesion coefficient (μ) between the wheel and rail is equal to the tangential force divided by the vertical force. Considering transient dynamics, the expression for the adhesion coefficient is shown below:
where M is the torque measured by the torque meter; R, J, and ω1 are the radius, moment of inertia, and angular velocity of the wheel.
2.3. Equivalence Principle
In the experimental investigation on the sanding effect of rail vehicles under low-adhesion conditions, the PLS-Circulator adopts an angular velocity equivalence test method, meaning that the angular velocity of the wheel on the test rig is equivalent to that of the real vehicle.
During the test, the coupling between one of the wheels and the gearbox is disconnected, allowing the wheel to roll purely under the action of the Vehicle Motor to simulate vehicle speed. Therefore, the vehicle speed (v) on the test rig is as follows:
The other wheel is connected to the gearbox, generating slip under the drive of the Wheel Motor. Under braking conditions, the slip rate (s) is expressed as
where ω1 is the angular velocity of the braking wheel, while ω2 is the angular velocity of the pure rolling wheel. ω1 and ω2 can be acquired from the speed channel of the torque meters connected to two wheels.
To investigate the fundamental effects of sand amount on the adhesion coefficient and eliminate the influence of vehicle speed on the test results, we referred to the test methods employed by Knorr-Bremse [23] and adopted the method based on mass/distance to measure the sand amount. Since the density of sand used in the test rig is the same as that in the field, the particle distribution density of sand will be equivalent on a scaled test rig. The scaling coefficient for sand amount is 1:42. The mass/distance equivalent amount of sand on the test rig is shown in Table 3.

Table 3.
Equivalent amount of sand for the PLS-Circulator.
The type of sand we used in the experiments is quartz sand with a SiO2 content greater than 98%, according to GMRT2461 [24] requirements. Figure 3a shows the distributing effect of the sanding device on the PLS-Circulator when operating. With the revolution of the test rig, the sand can be evenly distributed on the rail surface. During the test, the amount of sand ranges from 0 to 0.3 g/m, and the sand particle size ranges from 0.1 mm to 2 mm. Figure 3b shows the different particle sizes of the sand.
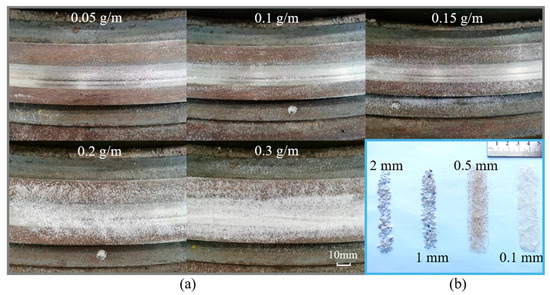
Figure 3.
Structure of PLS-Circulator. (a) Sand amount from 0.05 to 0.3 g/m; (b) sand particle size from 0.1 to 2 mm.
2.4. Experimental Procedure
The experimental procedure to measure the adhesion characteristics and sanding effect under low-adhesion conditions using the PLS-Circulator featured the following steps:
- (1)
- Apply an axle load of 11 tons to the wheels, set the target vehicle speed to 40 km/h, and set the target slip rate at a constant value of 5%.
- (2)
- Distribute the low-adhesion medium onto the rail surface before initiating the test rig. See below for more details on the application of the contaminants.
- Wet conditions:Activate the water spray device to spray water onto the rail surface at a flow rate of 2 L/min and maintain said rate.
- Oil conditions:Apply 40 mL of synthetic gear oil (Mobil 75W-90) evenly on the rail surface.
- Ultra-low-adhesion medium:Apply 40 mL of synthetic gear oil (Mobil 75W-90) evenly on the rail surface and initiate the test rig. Maintain the target slip rate at a constant value of 50% for 300 s. A black mixture of oil and iron filings should form between the wheel and rail, accompanied by an obvious decrease in the adhesion coefficient to an extremely low level of 0.03.
- (3)
- Operate the sanding device to sprinkle the sand onto the rail surface. See below for more details on controlling variables such as sand amount and sand particle size.
- Sand amount:Sprinkle the sand at dosages of 0 g/m, 0.05 g/m, 0.1 g/min, 0.15 g/min, 0.2 g/min, and 0.3 g/m. In these experiments, the sand particle size is specified as 0.5 mm.
- Sand particle size:Sprinkle the sand with diameters of 0.1 mm, 0.5 mm, 1 mm, and 2 mm, respectively, onto the rail surface, with a consistent sand amount of 0.3 g/m.
- (4)
- Measure the adhesion coefficient between the wheel and rail, and then stop the rig after running continuously for 80 s.
- (5)
- Carry out these procedures three times.
- (6)
- Conclude the experiment.
By systematically controlling variables, this study investigates the impact of factors such as a low-adhesion medium, the sand amount, and the sand particle size in the sanding process on the wheel–rail adhesion characteristics to investigate adhesion enhancement and degradation.
3. Analysis of Experimental Results
3.1. Wet Conditions
Adhesion characteristic tests were conducted under wet conditions using different sand amounts according to the procedures mentioned in Section 2.4. The state of the rail surface before and after the test under wet conditions is shown in Figure 4a, while the variation in the adhesion coefficient with different sand amounts is depicted in Figure 4b. From these figures, it can be observed that the initial adhesion coefficient under wet conditions is approximately 0.15. As the sand amount increases, the maximum adhesion coefficient gradually rises. However, when the sand amount reaches 0.3 g/m, the increase in adhesion coefficient has already reached the threshold. Additionally, the adhesion-enhancing effect gradually diminishes over time.
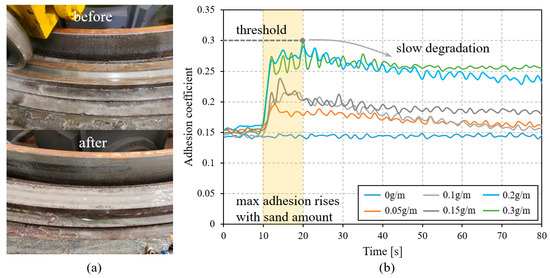
Figure 4.
Adhesion characteristic tests under wet conditions with sand particle size 0.5 mm. (a) Photographs of the rail surface; (b) measured adhesion coefficient of different sand amounts.
3.2. Oil Conditions
Experimental investigations on the adhesion characteristics of different sand amounts under oil conditions were carried out. The state of the rail surface before and after the test under oil conditions is shown in Figure 5a, while the variation in the adhesion coefficient with different sand amounts is depicted in Figure 5b. From the graphs, it can be observed that the initial adhesion coefficient under oil conditions is approximately 0.05. As the sand amount increases, the maximum adhesion coefficient gradually rises. Similarly, when the sand amount ups to 0.3 g/m, the increase in adhesion coefficient has already reached the threshold. Additionally, the adhesion-enhancing effect gradually diminishes over time. In particular, when the sand amount is high, the adhesion coefficient at a higher level will rapidly decline.
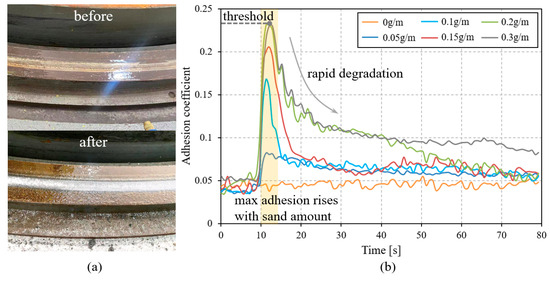
Figure 5.
Adhesion characteristic tests of different sand amounts under oil conditions with a sand particle size of 0.5 mm. (a) Photographs of the rail surface; (b) measured adhesion coefficient of different sand amounts.
Subsequently, experimental investigations on the adhesion characteristics of different sand particle sizes under oil conditions were conducted. The state of the rail surface before and after the test is shown in Figure 6a, while the variation in the adhesion coefficient with different sand particle sizes is depicted in Figure 6b. From the graph in Figure 6b, it is evident that the sand particle size has a relatively minor impact on the evolution of the adhesion coefficient. However, as the sand particle size increases, the maximum adhesion coefficient tends to decrease. The adhesion-enhancing effect diminishes rapidly over time, similar to what is depicted in Figure 5b for when the sand amount is high.
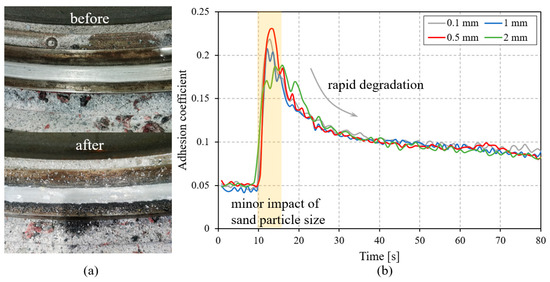
Figure 6.
Adhesion characteristic tests of different sand particle sizes under oil conditions with sand amount at 0.3 g/m. (a) Photographs of the rail surface; (b) measured adhesion coefficient of different sand particle sizes.
3.3. Ultra-Low-Adhesion Medium
To investigate the adhesion characteristics of different sand amounts under ultra-low-adhesion conditions, we applied the procedures mentioned in Section 2.4. The state of the rail surface before and after the test is shown in Figure 7a, while the adhesion coefficient under ultra-low-adhesion conditions with different sand amounts is depicted in Figure 7b. From the graphs, it can be observed that the initial adhesion coefficient is about 0.03. As the sand amount increases, the maximum adhesion coefficient gradually rises. Similarly, the adhesion-enhancing effect gradually diminishes over time.
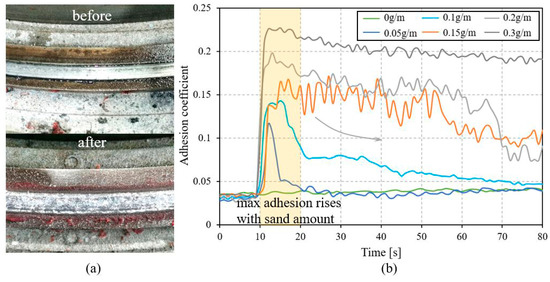
Figure 7.
Adhesion characteristic tests under ultra-low adhesion with sand particle size at 0.5 mm. (a) Photographs of the rail surface; (b) measured adhesion coefficient of different sand amounts.
4. Discussion
4.1. Adhesion Enhancement
The PLS-Circulator, featuring a fixed track, accurately replicates the distribution of rail surface contaminants, such as oil and water, in the field. The particle distribution density of sand falling on the rail surface during the sanding process can be measured and controlled, thus overcoming the challenge of conducting quantitative tests on the twin-disk rigs. In these studies, excessive sanding occurred due to experimental equipment limitations, severely weakening the adhesion-enhancing effect and significantly underestimating the threshold for particle amount [9,13]. From the experiments described in Section 3, it is evident that the PLS-Circulator is able to simulate the actual working state of sanding and adhesion enhancement between the wheel–rail interface.
Utilizing the PLS-Circulator, we conducted experiments on wheel–rail adhesion characteristics for various rail surface media, with these experiments featuring different sand amounts and sand particle sizes. During the tests, wheel vibration was observed when the sand was applied to the track surface. Fluctuations in the adhesion coefficient can be seen in Figure 4, Figure 5, Figure 6 and Figure 7. The vertical vibration of the wheel is caused by sand entering the wheel–rail interface. The vertical force fluctuates, and the adhesion coefficient is determined according to Formula (1).
Additionally, we measured the trend in adhesion enhancement and its relationship with the amount of sand. Based on the test results, as illustrated in Figure 8, the maximum adhesion coefficient increases with the increase in sand for various rail surface media. The sands entering the wheel–rail interface effectively pierce through contamination films and establish contact with the wheel and rail metal surfaces [25]; therefore, a larger particle density enables the transmission of more tangential force. The plowing action of these hard particles on the metal interface is considered the mechanism for improving the wheel–rail adhesion coefficient. However, when the amount of sand is large, the adhesion-enhancing effect gradually reaches the threshold due to the limited number of particles that can actually enter the wheel–rail contact area.
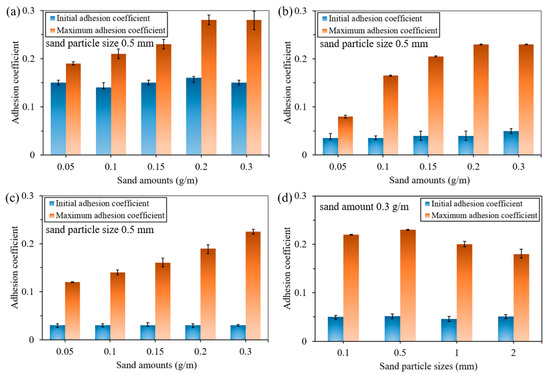
Figure 8.
Initial and maximum adhesion coefficients of different media with varying sand amounts and sand particle sizes. (a) Wet conditions; (b) oil conditions; (c) ultra-low-adhesion mediums; (d) oil conditions.
Moreover, the sand particle size has a minor impact on the evolution of the adhesion coefficient. With the same amount of sand, the particle density at the wheel–rail interface obtained by crushing sand of different sizes through wheels approaches the same level. However, when the sand particle size is larger, the maximum adhesion coefficient tends to decrease, as also observed in references [10,26]. This is because when the wheel crushes the larger sand particles, the disintegrated sand will emanate from the wheel–rail contact area, resulting in a decrease in particle density.
4.2. Dynamic Evolution of Adhesion
Previously, it was proven that the adhesion enhancement is related to variations in sand amount and sand particle size. However, after a single application of sand, the increase in adhesion coefficient gradually decreases over time. This is due to sand being squeezed continuously out of the wheel–rail contact range during the wheel–rail rolling process, resulting in a steady decline in the effective particle amount at the wheel–rail contact interface. To model the reducing particle density using an exponential function, the adhesion coefficient (μ) over time is expressed as:
where a is the attenuation coefficient, related to the medium and sand amount; μ0 is the initial adhesion coefficient, obtained from Figure 8; and Δμ is the adhesion enhancement, related to the medium and sand amount and also obtainable from Figure 8.
Due to the sand amount threshold, a natural exponential function is constructed as a transition function between 0 and 1 to describe the effect of sanding. The expression for the adhesion enhancement (Δμ) is shown below:
where μmax is the maximum adhesion coefficient under different sand amounts, obtained from Figure 8; k is the threshold coefficient of sand amount; and x is the sand amount, measured in g/m.
We used experimental data for least squares fitting [27] to obtain empirical formulas of the dynamic adhesion with different media and different sand amounts, and the results are depicted in Figure 9. From Figure 9a, it can be seen that when the sand amount is 0.3 g/m, the attenuation coefficients for each medium are 0.899 (oil conditions), 0.995 (ultra-low conditions), and 0.992 (wet conditions). The predicted adhesion coefficient based on empirical formulas is in good agreement with the measured values. In Figure 9b, when the sand amount threshold coefficient is 95, the predicted dynamic adhesion with different sand amounts is appropriately plotted under oil conditions.
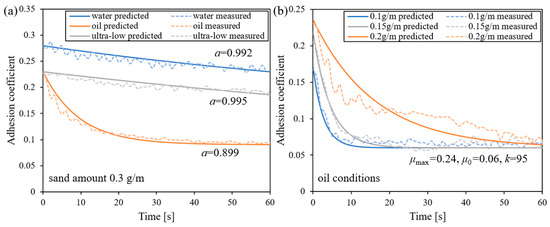
Figure 9.
Predicted and measured adhesion coefficient over time. (a) Various media; (b) different sand amounts.
We summarized our experimental data and formed a graph of the dynamic evolution of adhesion under the differing conditions used in our tests (different in terms of the medium and sand amounts used); the results are illustrated in Figure 10. It can be observed that the patterns of adhesion reduction vary under the conditions of different media. The degradation of the adhesion-enhancing effect is slow under water conditions, as the embedded particles remaining on the wheel and rail surfaces continue to maintain effectiveness for an extended period. This becomes particularly evident under wet conditions, which correspond to the boundary lubrication condition [28]. The water film thickness is much smaller than the particle size and surface roughness, and the normal load between the wheel and rail is mainly borne by the sand–metal micro-protrusions. Under the oily environment, the adhesion-enhancing effect of sanding diminishes rapidly. This is because the remaining embedded particles and rough surfaces are difficult to maintain under the presence of thicker oil films. With the continuous removal of sand, the wheel–rail interface quickly returns to a mixed-film-lubricated state, with the solid micro-protrusions on the surface bearing less load, and the normal load between the wheel and rail is mainly borne by the oil film. As the shear strength of the oil film is much lower than that between solid micro-protrusions, the adhesion coefficient in oil conditions rapidly decreases after sanding, becoming far lower than that in wet conditions. Meanwhile, Figure 10c suggests that the adhesion-enhancing effect of sanding in an ultra-low-adhesion medium mixed with oil and iron filings appears to fall between that derived from using an oily environment and a wet rail. The thickness of the lubricating film used under ultra-low-adhesion conditions lies between that of a water film and an oil film. Mixed-film lubrication occurs when there is minimal sand, while boundary lubrication dominates in conditions with higher sand amounts.

Figure 10.
Reduction in the adhesion-enhancing effect under conditions with different media. (a) Wet conditions; (b) oil conditions; (c) ultra-low-adhesion medium.
Similar studies have also been reported in references [9,10,12,14], but due to their use of twin-disk rigs, these studies present adhesion coefficient values considering the number of cycles of rail rollers. Compared to this paper, the figures regarding sand amounts in such studies are not quite accurate, and mention of a corresponding relationship with the actual vehicle is lacking, thus limiting the significance of the results. In this study, the dynamic evolution of adhesion over time was investigated, enabling us to estimate the adhesion of each axis at different positions during the sanding process. Due to the innovative configuration of the PLS-Circulator, it is now possible to simulate the operating characteristics of multiple wheels on a train passing through the same point on the track in the laboratory. Therefore, the duration of the adhesion-enhancing effect observed on the test rig indicates whether a single application of sand under low-adhesion conditions can meet the adhesion requirements for wheels. This indicator can be used to allocate the appropriate number of sanding devices installed on rail vehicles in the appropriate positions. Finally, as revealed in previous research [29,30], it should be noted that sanding can cause damage to the wheel–rail interface. After the sanding test, spalling and pitting on the wheel contact surface were observed on the PLS-Circulator, as shown in Figure 11, with the image on the right of this figure being captured by an optical microscope (VHX-6000, Keyence, Osaka, Japan). This indicates that the amount of sanding needs to be carefully selected to both ensure the adhesion-enhancing effect and limit wheel–rail damage.
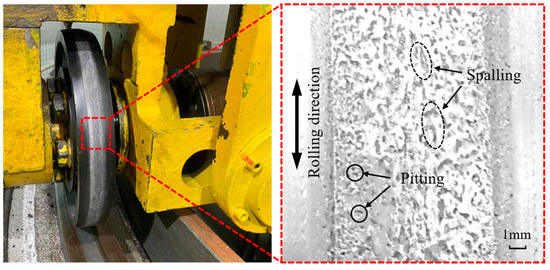
Figure 11.
Damage to the wheel while sanding.
5. Conclusions
In this study, based on the PLS-Circulator, indoor bench tests were conducted on the sanding process of rail vehicles. An equivalent relationship between the sanding conditions of the test rig and the field was established, leading to the development of a test method for simulating actual vehicle conditions on the test rig. Through experimental research, the sanding and adhesion enhancement characteristics under low-adhesion conditions, such as water and oil conditions, were identified. Based on our results, the following conclusions can be drawn:
- (1)
- The initial adhesion coefficient of 0.15 under wet conditions is greater than that under oil conditions (0.05) and mixed-medium conditions (0.03). With the application of the appropriate sand amount, the adhesion coefficient of each medium can be increased to 0.2 or above, thereby satisfying the traction and braking requirements.
- (2)
- The maximum adhesion coefficient under mixed-medium conditions increases with an increase in sand, and the adhesion-enhancing effect gradually trends toward the threshold when the amount of sand is high. The size of sand particles has a relatively small impact on the maximum adhesion coefficient.
- (3)
- After a single application of sand, the increase in adhesion coefficient continuously decreases over time because of the reduced particle density at the wheel–rail contact interface. The trend in adhesion enhancement degradation varies under different media, with water media leading to a slower degradation rate compared to oil media.
- (4)
- Comparing the three low-adhesion media at the wheel–rail interface—water, oil, and a mixture—the most unfavorable conditions occur under oil, as the adhesion-enhancing effect deteriorates the fastest. In other words, the number of axles that can maintain a high adhesion level with a single sanding application on the actual vehicle is relatively small.
- (5)
- Due to the threshold effect of the adhesion enhancement and the potential damage to the wheel–rail interface caused by sanding, the amount of sand needs to be carefully selected. The appropriate sand amount on the PLS-Circulator is 0.3 g/m, corresponding to 4.8 g/m of sand in the field. This conclusion could help guide decisions regarding how much sand to use for rail vehicles under low-adhesion conditions.
Author Contributions
Conceptualization, C.C. and C.T.; methodology, C.C.; software, J.Z.; validation, F.Q., M.Z. and C.Y.; formal analysis, C.C.; investigation, C.C.; resources, F.Q.; data curation, J.Z.; writing—original draft preparation, C.C.; writing—review and editing, C.C.; visualization, C.C.; supervision, C.T.; project administration, F.Q.; funding acquisition, M.Z. and C.Y. All authors have read and agreed to the published version of the manuscript.
Funding
This research was funded by the National Natural Science Foundation of China (No. 52072266) and the Changzhou Sci & Tech Program (No. CJ20241089).
Data Availability Statement
The data presented in this study are available on request from the corresponding author. The data are not publicly available due to privacy restrictions.
Acknowledgments
We would like to express special thanks to Chao Chen for his original design of the experimental equipment used in this study. Though all authors contributed equally to this work, he is also this article’s first author. Thanks to Tian and Zhou for their valuable support in the creation of this article.
Conflicts of Interest
Authors Feng Qiao, Ming Zhao and Chuan Yang were employed by CRRC Changchun Railway Vehicles Co., Ltd. The remaining authors declare that the research was conducted in the absence of any commercial or financial relationships that could be construed as a potential conflict of interest.
References
- Chen, H. Review of various influencing factors and improvement measures on wheel-rail adhesion. Wear 2024, 550–551, 205283. [Google Scholar] [CrossRef]
- Vollebregt, E.; Six, K.; Polach, O. Challenges and progress in the understanding and modelling of the wheel-rail creep forces. Veh. Syst. Dyn. 2021, 59, 1026–1068. [Google Scholar] [CrossRef]
- Lewis, R.; Gallardo-Hernández, E.A.; Hilton, T.J.; Armitage, T. Effect of oil and water mixtures on adhesion in the wheel/rail contact. Proc. Inst. Mech. Eng. Part F J. Rail Rapid Transit 2009, 223, 275–283. [Google Scholar] [CrossRef]
- Green, D.A.; Lewis, R. The effects of soot-contaminated engine oil on wear and friction: A review. Proc. Inst. Mech. Eng. Part D J. Automob. Eng. 2008, 222, 1669–1689. [Google Scholar] [CrossRef]
- Chen, H.; Ban, T.; Ishida, M.; Nakahara, T. Experimental Investigation of Influential Factors on Adhesion Between Wheel and Rail Under Wet Conditions. Wear 2008, 265, 1504–1511. [Google Scholar] [CrossRef]
- Wang, W.; Wang, H.; Wang, H.Y.; Guo, J.; Liu, Q.; Zhu, M.; Jin, X. Sub-scale simulation and measurement of railroad wheel/rail adhesion under dry and wet conditions. Wear 2013, 302, 1461–1467. [Google Scholar] [CrossRef]
- Li, Z.; Arias-Cuevas, O.; Lewis, R.; Gallardo-Hernández, E.A. Rolling-Sliding Laboratory Tests of Friction Modifiers in Leaf Contaminated Wheel-Rail Contacts. Tribol. Lett. 2009, 33, 97–109. [Google Scholar] [CrossRef]
- Cann, P.M. The “leaves on the line” problem—A study of leaf residue film formation and lubricity under laboratory test conditions. Tribol. Lett. 2006, 24, 151–158. [Google Scholar] [CrossRef]
- Kumar, S.; Krishnamoorthy, P.K.; Prasanna-Rao, D.L. Wheel-Rail Wear and Adhesion with and Without Sand for a North American Locomotive. J. Eng. Ind. 1986, 108, 141–147. [Google Scholar] [CrossRef]
- Shi, L.; Li, Q.; Kvarda, D.; Galas, R.; Omasta, M.; Wang, W.; Guo, J.; Liu, Q. Study on the wheel/rail adhesion restoration and damage evolution in the single application of alumina particles. Wear 2019, 426–427 Pt B, 1807–1819. [Google Scholar] [CrossRef]
- Lewis, S.; Riley, S.; Fletcher, D.I.; Lewis, R. Optimisation of a Railway Sanding System: Adhesion Tests. Int. J. Railw. 2017, 6, 87–98. [Google Scholar] [CrossRef]
- Arias-Cuevas, O.; Li, Z. A laboratory investigation on the influence of the particle size and slip during sanding on the adhesion and wear in the wheel-rail contact. Wear 2011, 271, 14–24. [Google Scholar] [CrossRef]
- Omasta, M.; Machatka, M.; Smejkal, D.; Hartl, M.; Křupka, I. Influence of sanding parameters on adhesion recovery in contaminated wheel–rail contact. Wear 2015, 322–323, 218–225. [Google Scholar] [CrossRef]
- Wang, W.; Zhang, H.; Wang, H.; Liu, Q.; Zhu, M. Study on the adhesion behavior of wheel/rail under oil, water and sanding conditions. Wear 2011, 271, 693–2698. [Google Scholar] [CrossRef]
- Wang, W.; Liu, T.; Wang, H.; Liu, Q.; Zhu, M.; Xiao, J. Influence of friction modifiers on improving adhesion and surface damage of wheel/rail under low adhesion conditions. Tribol. Int. 2014, 75, 16–23. [Google Scholar] [CrossRef]
- Horng, J.; Wei, C.; Hung-Jung, T.; Shiu, B. A study of surface friction and particle friction between rough surfaces. Wear 2009, 267, 1257–1263. [Google Scholar] [CrossRef]
- Lewis, R.; Dwyer-Joyce, R.S. Wear at the wheel/rail interface when sanding is used to increase adhesion. Proc. Inst. Mech. Eng. Part F J. Rail Rapid Transit 2006, 220, 29–41. [Google Scholar] [CrossRef]
- Arias-Cuevas, O.; Li, Z.; Lewis, R. Investigating the lubricity and electrical insulation caused by sanding in dry wheel-rail contacts. Tribol. Lett. 2010, 37, 623–635. [Google Scholar] [CrossRef]
- Chen, C.; Tian, C.; Zhou, J.; Zhai, G.; Yu, H. Development of a New Test-Rig for Wheel-Rail Contact Experiments Under Large Slip Conditions. Appl. Sci. 2023, 13, 5320. [Google Scholar] [CrossRef]
- Tian, C.; Zhai, G.; Gao, Y.; Chen, C.; Zhou, J. Study on Creepage Control for PLS-160 Wheel-Rail Adhesion Test Rig Based on LADRC. Sensors 2023, 23, 1792. [Google Scholar] [CrossRef] [PubMed]
- Zhou, J.; Chen, C.; Tian, C.; Zhai, G.; Yu, H. Experimental study on adhesion recovery based on a circumferential test rig. Ind. Lubr. Tribol. 2024, 76, 317–326. [Google Scholar] [CrossRef]
- Bosso, N.; Allen, P.D.; Zampieri, N. Scale Testing Theory and Approaches. In Handbook of Railway Vehicle Dynamics, 2nd ed.; Iwnicki, S., Spiryagin, M., Cole, C., McSweeney, T., Eds.; CRC Taylor and Francis: Boca Raton, FL, USA, 2019; Chapter 20; pp. 838–853. [Google Scholar]
- KNORR-BREMSE. Feasible improvement of exc. low adhesion by sand deposition. In Theoretical Estimation of Feasible Stopping Performance; KNORR-BREMSE: Munich, Germany, 2019; p. TA44810/48EN05. [Google Scholar]
- GMRT2461; UK Rail Safety and Standards Board. Sanding Equipment (Issue 3). Hercules Ebooks Institute: London, UK, 2018.
- Chen, H.; Namura, A.; Ishida, M.; Nakahara, T. Influence of axle load on wheel/rail adhesion under wet conditions in consideration of running speed and surface roughness. Wear 2016, 366–367, 303–309. [Google Scholar] [CrossRef]
- Shi, L.; Wang, C.; Ding, H.; Kvarda, D.; Galas, R.; Omasta, M.; Wang, W.; Liu, Q.; Hartl, M. Laboratory investigation on the particle-size effects in railway sanding: Comparisons between standard sand and its micro fragments. Tribol. Int. 2020, 146, 106259. [Google Scholar] [CrossRef]
- Meli, E.; Ridolfi, A.; Rindi, A. An Innovative Degraded Adhesion Model For Railway Vehicles: Development and Experimental Validation. Meccanica 2014, 49, 919–937. [Google Scholar] [CrossRef]
- Masjedi, M.; Khonsari, M.M. Film thickness and asperity load formulas for line-contact elastohydrodynamic lubrication with provision for surface roughness. J. Tribol. 2012, 134, 011503. [Google Scholar] [CrossRef]
- Huang, W.; Cao, X.; Wen, Z.; Wang, W.; Liu, Q.; Zhu, M.; Jin, X. A Subscale Experimental Investigation on the Influence of Sanding on Adhesion and Rolling Contact Fatigue of Wheel/Rail Under Water Condition. J. Tribol. 2017, 139, 011401. [Google Scholar] [CrossRef]
- Wang, C.; Shi, L.; Ding, H.; Wang, W.; Galas, R.; Guo, J.; Liu, Q.; Zhou, Z.; Omasta, M. Adhesion and damage characteristics of wheel/rail using different mineral particles as adhesion enhancers. Wear 2021, 477, 203796. [Google Scholar] [CrossRef]
Disclaimer/Publisher’s Note: The statements, opinions and data contained in all publications are solely those of the individual author(s) and contributor(s) and not of MDPI and/or the editor(s). MDPI and/or the editor(s) disclaim responsibility for any injury to people or property resulting from any ideas, methods, instructions or products referred to in the content. |
© 2025 by the authors. Licensee MDPI, Basel, Switzerland. This article is an open access article distributed under the terms and conditions of the Creative Commons Attribution (CC BY) license (https://creativecommons.org/licenses/by/4.0/).