Article

Research on Ground Contact Characteristics and Influencing Factors of Tires with Complex Tread Patterns Based on Inverse Modeling

1
College of Transportation, Shandong University of Science and Technology, Qingdao 266590, China
2
College of Pipeline and Civil Engineering, China University of Petroleum (East China), Qingdao 266580, China
*
Author to whom correspondence should be addressed.
Lubricants 2025, 13(6), 261; https://doi.org/10.3390/lubricants13060261
Submission received: 2 April 2025 / Revised: 4 June 2025 / Accepted: 9 June 2025 / Published: 12 June 2025

Abstract

The contact characteristics of radial tires are crucial for optimizing stress distribution, deformation, and wear. The non-uniform contact stress behavior induced by complex tread patterns remains under-explored in existing tire mechanics research. Taking the 205/50R17 radial tire as a representative case, a reverse modeling approach was employed to develop an accurate finite element model for tires incorporating intricate tread pattern features. The fidelity of the proposed tire simulation model was confirmed utilizing high-precision contour profiling techniques. The impact of diverse usage conditions and design parameters on the tire outer profile and ground contact characteristics under static and free-rolling states was analyzed. Experimental observations demonstrate that the increased inflation pressure leads to a proportional decrease in contact area. Under incremental vertical loading, the contact patch develops progressively into a saddle-shaped geometry featuring elevated shoulder regions and a recessed central zone. Increasing the belt angle compromises its hoop-stiffening function, thereby inducing elliptical contact patch geometry. Larger design diameters compromise contact length symmetry in shoulder regions. Variation in shoulder thickness at 85% of the tread width results in a significant difference in contact length between the left and right tread blocks in the rolling state. This work enables refinement strategies for both tread configurations and tire dimensional designs in industrial applications.

1. Introduction

As a complex structure composed of rubber components and cord reinforcement layers, tires play a crucial role in bearing the load of the entire vehicle, buffering vibrations, and transmitting power to the ground [1,2,3,4]. Research on tire–road contact characteristics is not only conducive to optimizing tire structural design, but also of great significance to improving the vehicle’s handling stability and fuel economy [5,6,7].
Contemporary vehicle dynamics analysis typically considers only the major and minor axis lengths of the contact footprint and assumes that the contact pressure distribution follows a predetermined functional form [8,9]. However, the contact footprint alone is insufficient to accurately represent the full operational behavior of the tire under various conditions. To address this limitation, Pacejka et al. [10] developed the Magic Formula model to describe in detail the coupling relationships among longitudinal force, lateral force, and self-aligning torque in diverse load and slip conditions. Mavros et al. [11] proposed a viscoelastic brush model incorporating rubber’s viscoelasticity and inertial effects to simulate the creation of temporary contact forces, and the results demonstrated that the transient behavior of the contact region is strongly associated with the development of transient frictional forces. Liu et al. [12] proposed a tire model incorporating a pliable ring and a two-dimensional elasticity base, analyzing its contact footprint and stiffness properties. Zang et al. [13] used a method combining theoretical calculation and simulation to conduct a comparative study on the distribution law of the contact patch of diamond-structured non-pneumatic safety tires. Wang et al. [14] developed a three-dimensional model of tire–road interaction and verified the unevenness of normal grounding stress, proving that its unevenness is negatively correlated with the load and positively correlated with the inflation pressure. Chen et al. [15] utilized pressure-sensitive film to investigate the grounding characteristics of tires and road surfaces, and the results confirmed that the ground contact area exhibits an approximately linear connection to tire inflation pressure and load. Kang et al. [16] conducted mobility tests on vehicles operating under various soil conditions using a vehicle fitted with a central tire inflation system. Their findings indicated that reducing tire pressure lowers the tire–ground contact pressure, thereby mitigating vehicle sinkage in soft soil conditions. Shakiba et al. [17] developed an integrated tire–road finite element model incorporating three-dimensional non-uniform contact stress. Their findings revealed that tire pressure and vehicle speed influence the contact area, while the slip rate affects the stress distribution. Gou et al. [18], using 2D and 3D finite element models of mining tires, found that the stress in the shoulder area is negatively correlated with inflation pressure. Kong et al. [19] employed computer vision techniques to establish a general framework for detecting tire deformation and inflation pressure from images, which can be calibrated to accurately predict grounding length and calculate grounding area. The aforementioned researchers employed theoretical models and finite element simulations to study the influence of inflation pressure and load on tire contact patterns, indicating that ground stress is more sensitive to changes in tire pressure.
The mechanical behavior of tires is influenced not only by inflation pressure but also the flexibility of the carcass rubber, the stiffness of the sidewalls, and the structure of the tire cord layer [20,21]. In Gipser’s study [22], the tread wear model was constructed as a function of tread block height over time, and it was shown that the block height indirectly influences the distribution of ground contact pressure. Through a coupled flexible carcass–banded ply model with a decoupled tread layer, Mavros et al. [23] demonstrated that contact pressure variations and footprint geometry evolution are governed by the radial nonlinear stiffness of the carcass, internal tire pressure, and road contact dynamics. Chen et al. [24], through an investigation of the force state of the bundle layer at varying rolling speeds, found that the cord force within the bundle layer exhibits fluctuations and asymmetry as speed increases. Namjoo et al. [25], considering variations in carcass ply stiffness, employed a three-dimensional finite element model to verify that increasing carcass ply stiffness reduces the contact area and results in a more uniform stress distribution. Mao et al. [26] replaced the traditional belt layer with a mesh belt layer structure and found that this structure effectively absorbs the tire’s radial load while reducing the sensitivity of the tire center to high-load stress. Under longitudinal slip conditions, Meng et al. [27] conducted a comparison of the contact stress on the tire tread at different belt angles and demonstrated that slight variations in the belt angle can optimize tread wear. Prior investigations methodologically establish belt layer mechanics correlations with tire–ground contact characteristics, focusing on footprint patterns and stress distribution while neglecting the belt angle’s effects on dynamic tread contour evolution.
Tire camber and road conditions critically modulate the contact mechanics characteristics of tires [28,29]. Liang et al. [30] developed custom imaging processing algorithms to extract 69 contact footprint descriptors and established a PCA-based feature screening protocol for wet-grip performance metrics. Oubahdou et al. [31] employed semi-analytical calculation (SAM) simulation to estimate the grounding pressure distribution during cornering and discovered that the grounding pressure increases with the increase in tire inclination angle and gradually stabilizes. Du et al. [32] constructed finite element models for both mechanical elastic wheels and pneumatic tires. Their comparative analysis indicated that progressive localized wear is initiated on tread profiles with increasing camber, and pneumatic tires exhibit a higher tendency for pressure concentration. Deng et al. [33] analyzed the ground pressure of the honeycomb unit structure under different damage conditions and found that as the degree of damage increased, the ground pressure of the honeycomb tire initially experienced a slight decrease, followed by a substantial increase. Yu et al. [34] developed a three-dimensional finite element tire–road interaction model, revealing that the grounding pressure under braking conditions exceeds values observed in stationary states. Liang et al. [35] presented an approach to studying tread wear on the basis of the geometric characteristics of tread impressions. Combined with the analysis of test results, it was shown that a larger tread contact length-to-width ratio is beneficial to improving the wear resistance of all-steel load-bearing radial tires. However, researchers have paid less attention to the effects of tire design outer diameter, shoulder thickness, and other parameters on tire–ground contact characteristics under the same tire size. Therefore, studying the correspondence between the tire’s grounding characteristics and design parameters can provide a reference for optimizing tire design and matching the tire with the vehicle.
In this study, the tread pattern was accurately reconstructed using an inverse modeling approach, and a high-fidelity numerical simulation model of the tire featuring intricate tread patterns was developed. The static and dynamic validities of the established finite element model were validated via outer contour scanning and rolling radius measurements, respectively. The contact footprint geometry was parametrically defined with enhanced precision by implementing a 70% width criterion for the left and right shoulder traction zones during characterization. The coupling mechanism of the ground contact behavior of tires with complex tread patterns was investigated under two typical working conditions: static loading and free rolling. By employing a variable-parameter numerical simulation strategy, the impact of inflation pressure and loading conditions on the contact footprint was analyzed. Additionally, corresponding relationships among belt angle, design outer diameter, and shoulder thickness were identified in terms of their impact on the geometric characteristics of the footprint and the outer contact contour.

2. Tire Finite Element Modeling

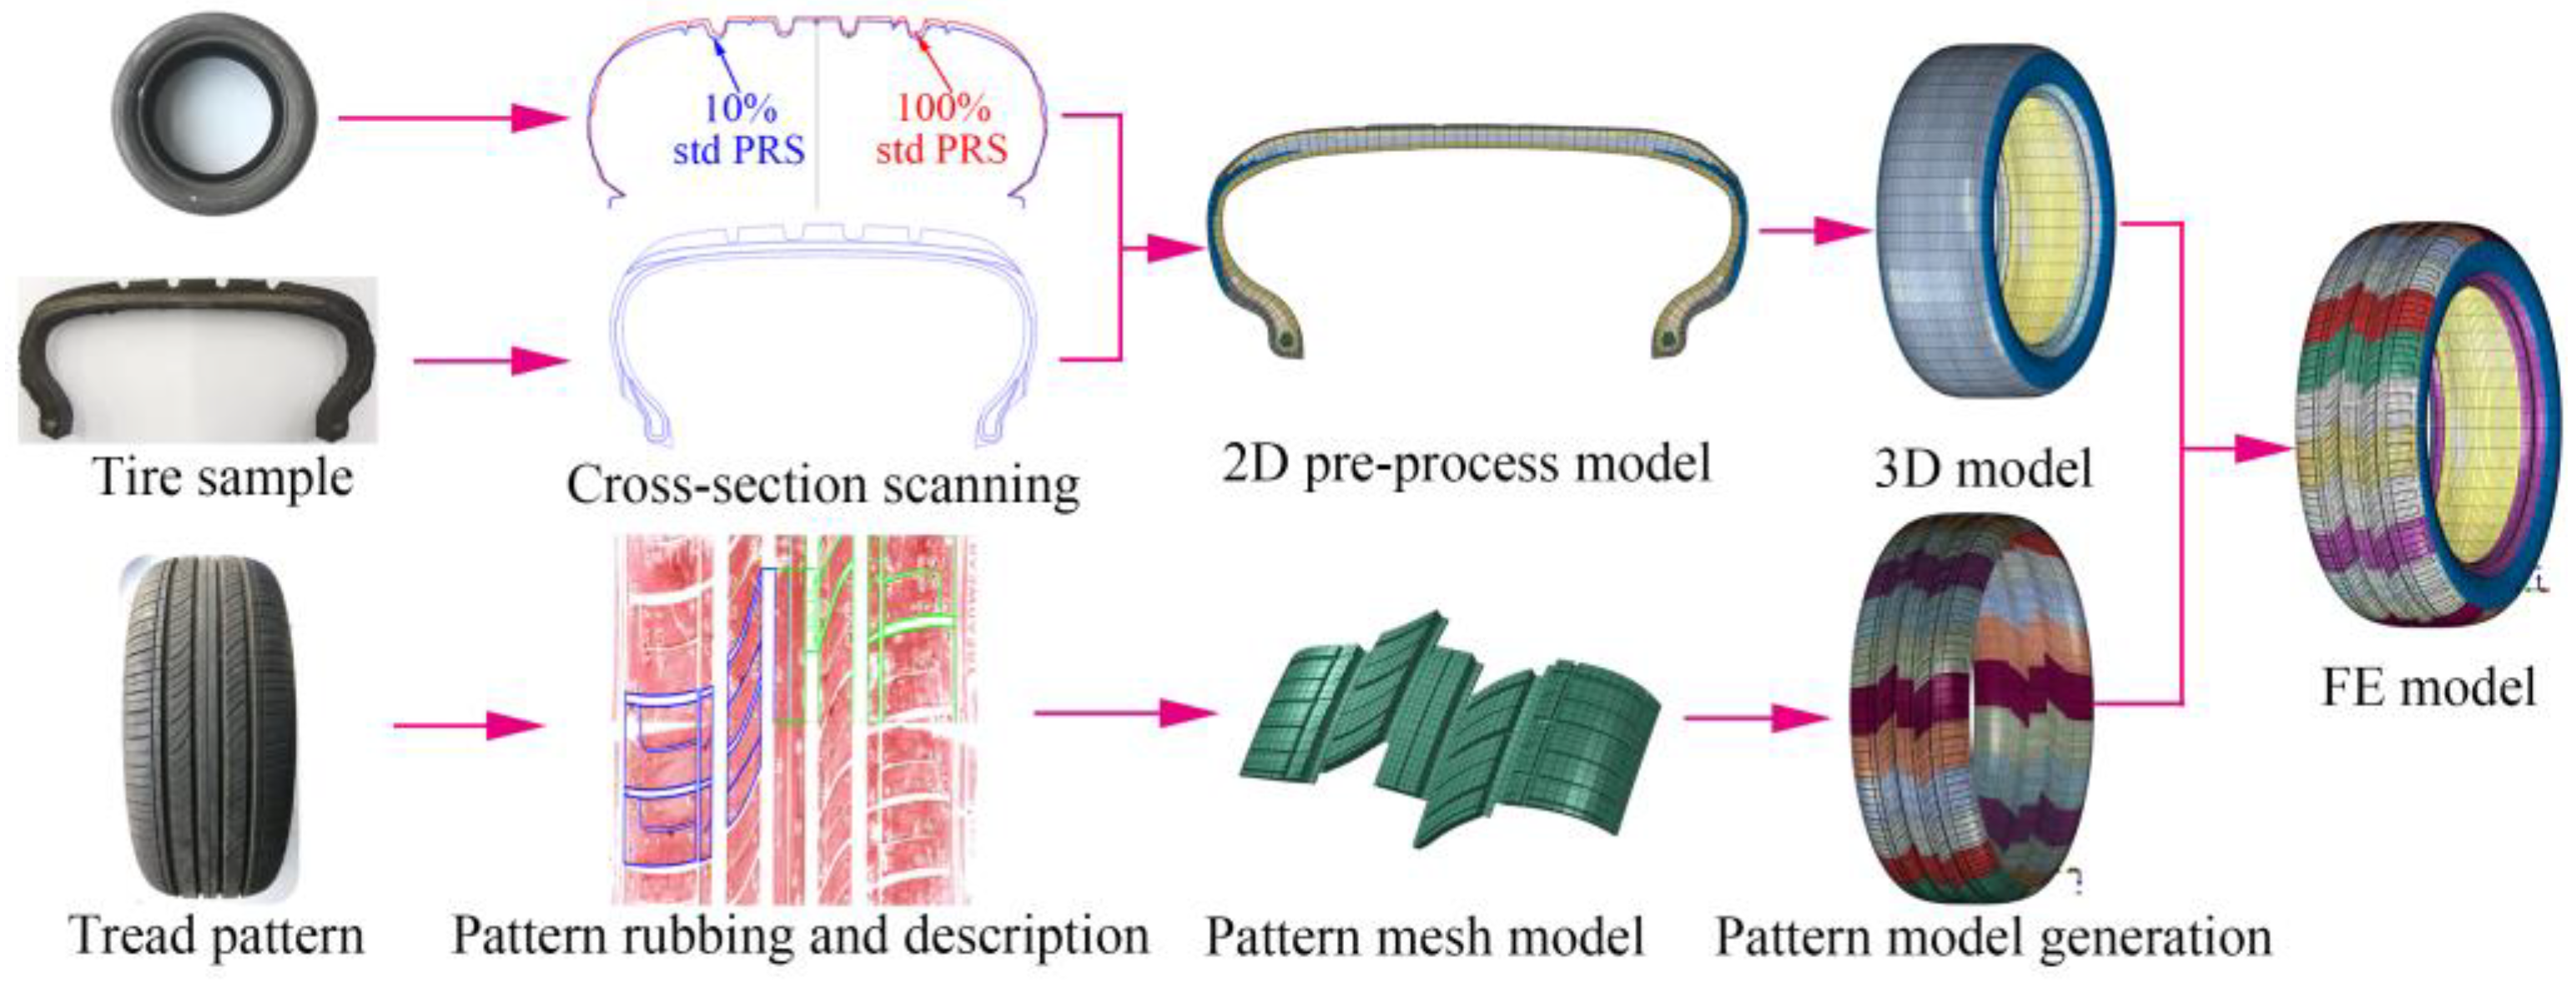
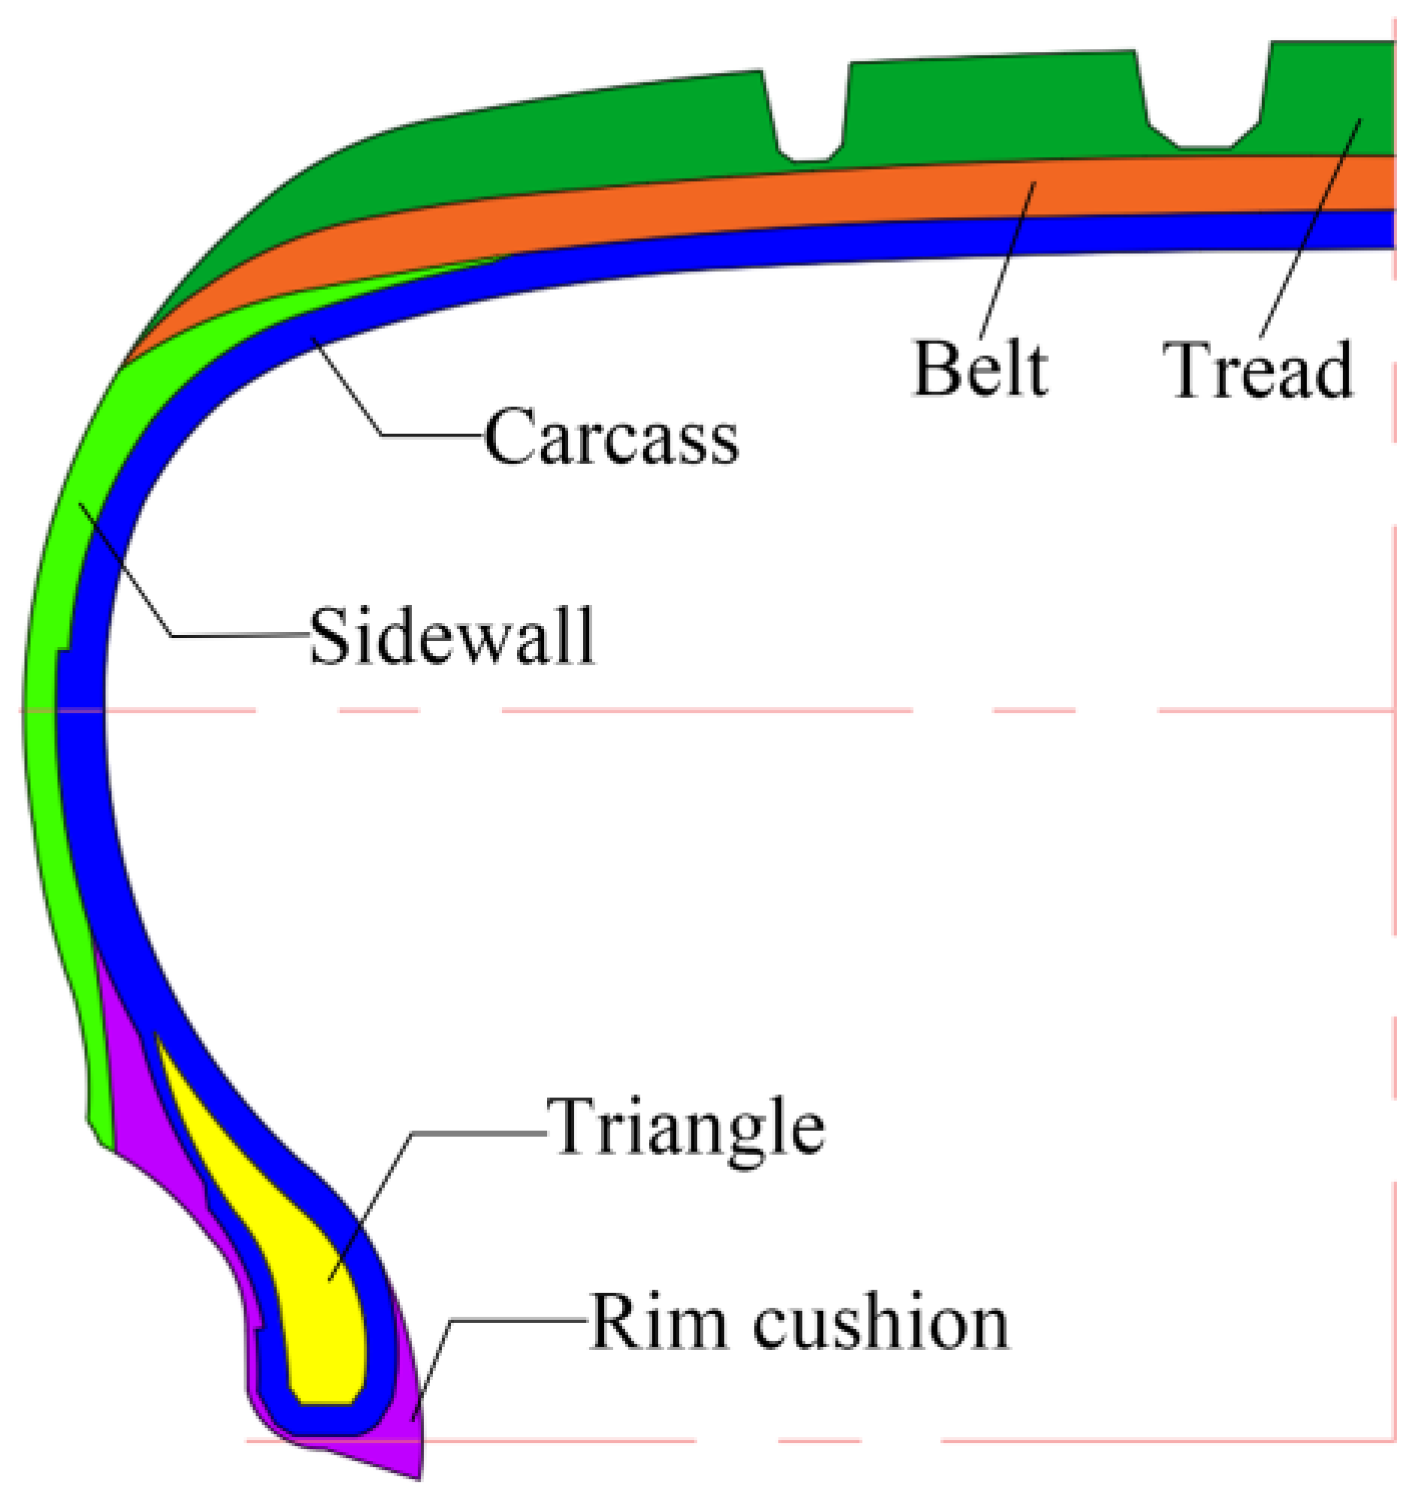
2.1. Finite Element Model of a Tire with Complex Tread Patterns

The inverse finite element modeling process for tires, illustrated in Figure 1, was applied to a Double Star brand 205/50R17 tire with complex tread patterns. The outer contour and tire section were first scanned for tires at 10% standard air pressure (10% tdPRS) to obtain the contour and tire section scans. Subsequently, each rubber component and reinforcing cord layer was mapped and positioned to complete the material distribution map and the outer contour 2D tire body model. The finite element mesh was then generated using ABAQUS/CAE 6.14 software. The rubber domain was meshed using 3-node (CGAX3) and 4-node (CGAX4) continuum axisymmetric elements for triangular and quadrilateral regions, respectively. To represent the reinforcement structure, the tire skeleton was modeled using generalized axisymmetric surface film elements (SFMGAX1), which were embedded in the corresponding rubber elements as rebar layers. Furthermore, the internal air cavity was modeled using acoustic axisymmetric elements, specifically ACAX3 and ACAX4. The 2D carcass model was rotated to generate a 3D axisymmetric carcass model of the tire.
Under 10% standard pressure, tire rubbings were obtained for pattern replication. Tread block pitch dimensions were measured with median values determined. Based on the scanned outer contour under 10% standard inflation pressure, a 3D solid-mapping model for the tread block was created. The mesh comprised primarily 8-node brick elements (C3D8H), supplemented by hybrid 6-node wedge elements (C3D6H) in geometrically complex zones. The meshed block was subsequently integrated into the overall tire model.
The combined modeling technology was used to bind the three-dimensional carcass and the pattern to obtain the numerical simulation model of the 205/50R17 tire. To ensure the accuracy of the simulation analysis, the model established during the simulation was divided into 180 equal parts in the circumferential direction. The established tire numerical simulation model with complex tread patterns contained 309,780 nodes, 227,230 rubber solid units, and 80,280 three-dimensional carcass reinforcement rib units.

2.2. Material Characteristics

Tire mechanical behavior is strongly associated with the characteristics of rubber materials, where the strain energy density function exclusively characterizes the hyperelastic response of rubber compounds. The frequently employed strain energy density functions in FEA calculations are the neo-Hookean model, Yeoh model, Mooney–Rivlin model, Ogden model, etc.
This research utilizes the neo-Hookean model because it is unconditionally stable and robust [36], and is suitable for various tire analysis conditions. The expression of the model is as follows [37,38]:
W = C 10 I 1 3 + 1 d 1 J 1 2
where W is the strain energy density, C 10 is the material constant, I 1 is the first strain invariant, d 1 is the compressibility parameter, and J is the elastic volume ratio.
The tire material distribution is shown in Figure 2, and the parameters of rubber materials used for each component are shown in Table 1. The backbone structure of the 205/50R17 tire consists of two layers of steel belt plies embedded in the belt rubber, one layer of carcass ply embedded in the carcass rubber, sidewall rubber, and rim cushion rubber, as well as bead wires embedded in the triangle rubber. The parameters of the reinforcement materials are presented in Table 2.

3. Experimental Verification

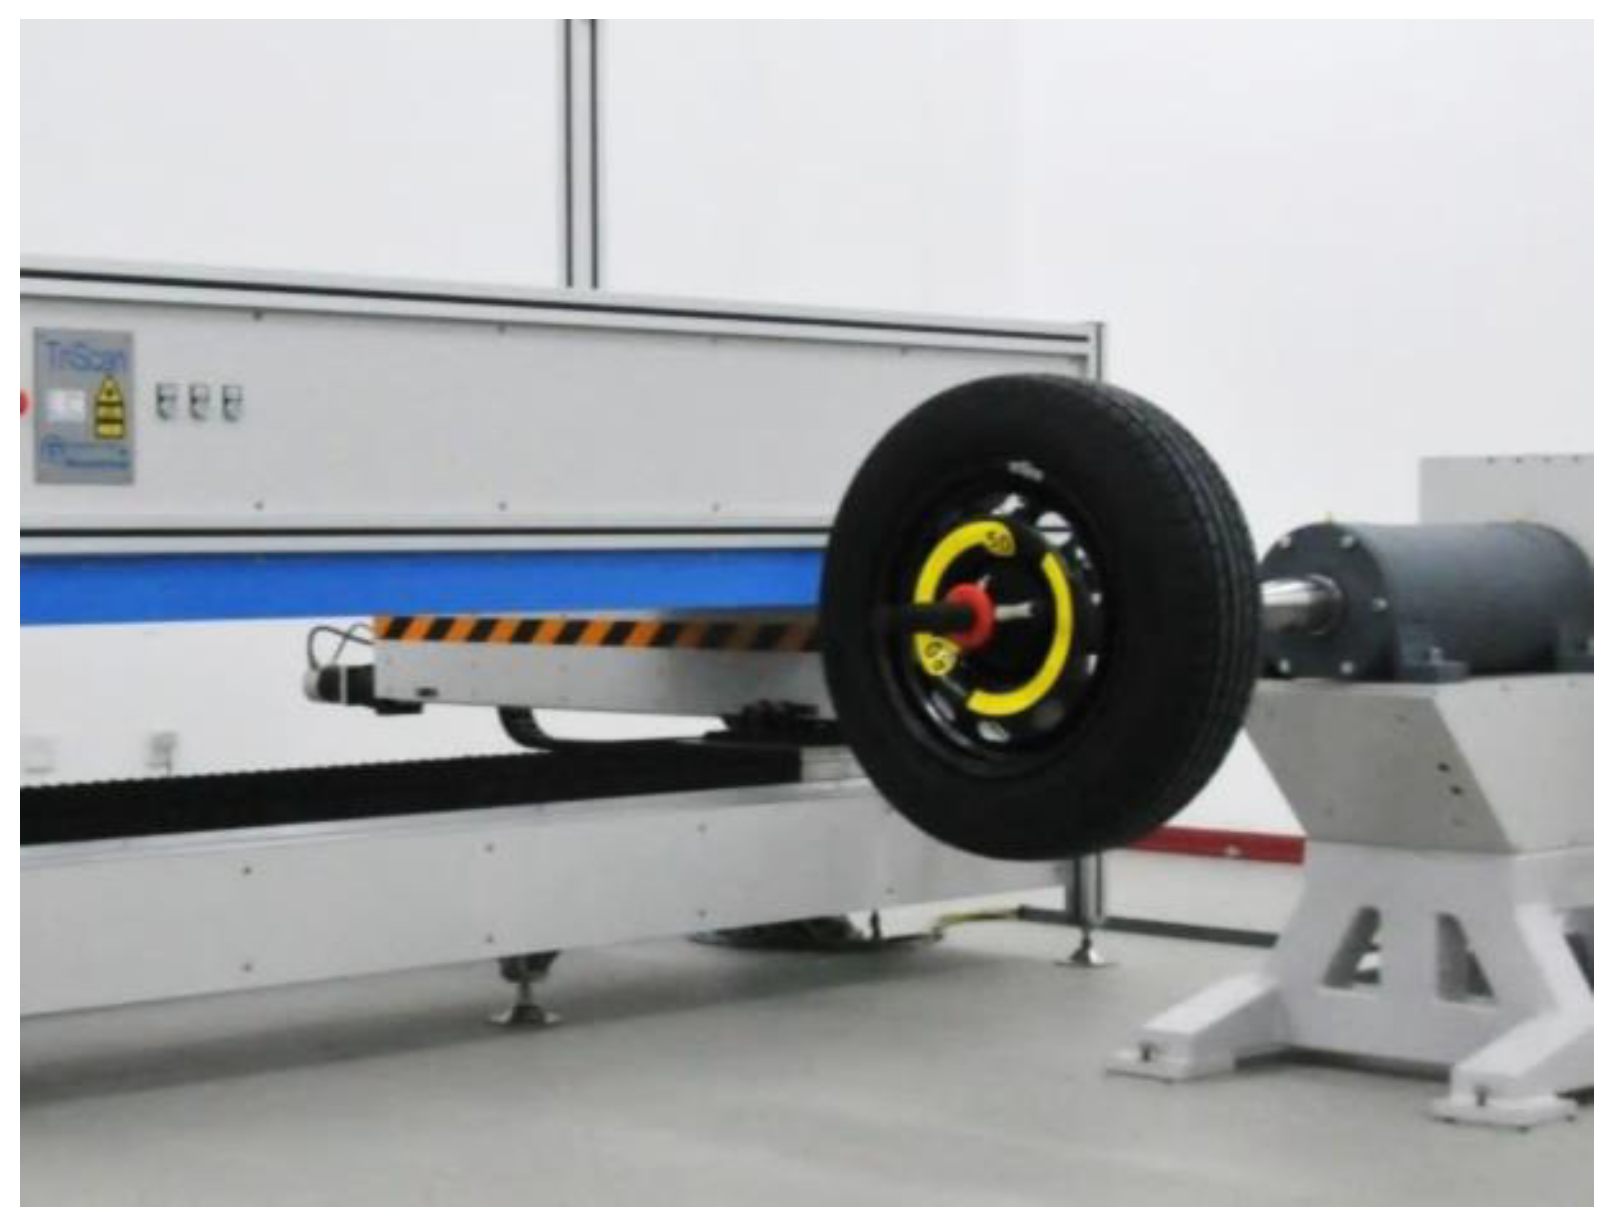
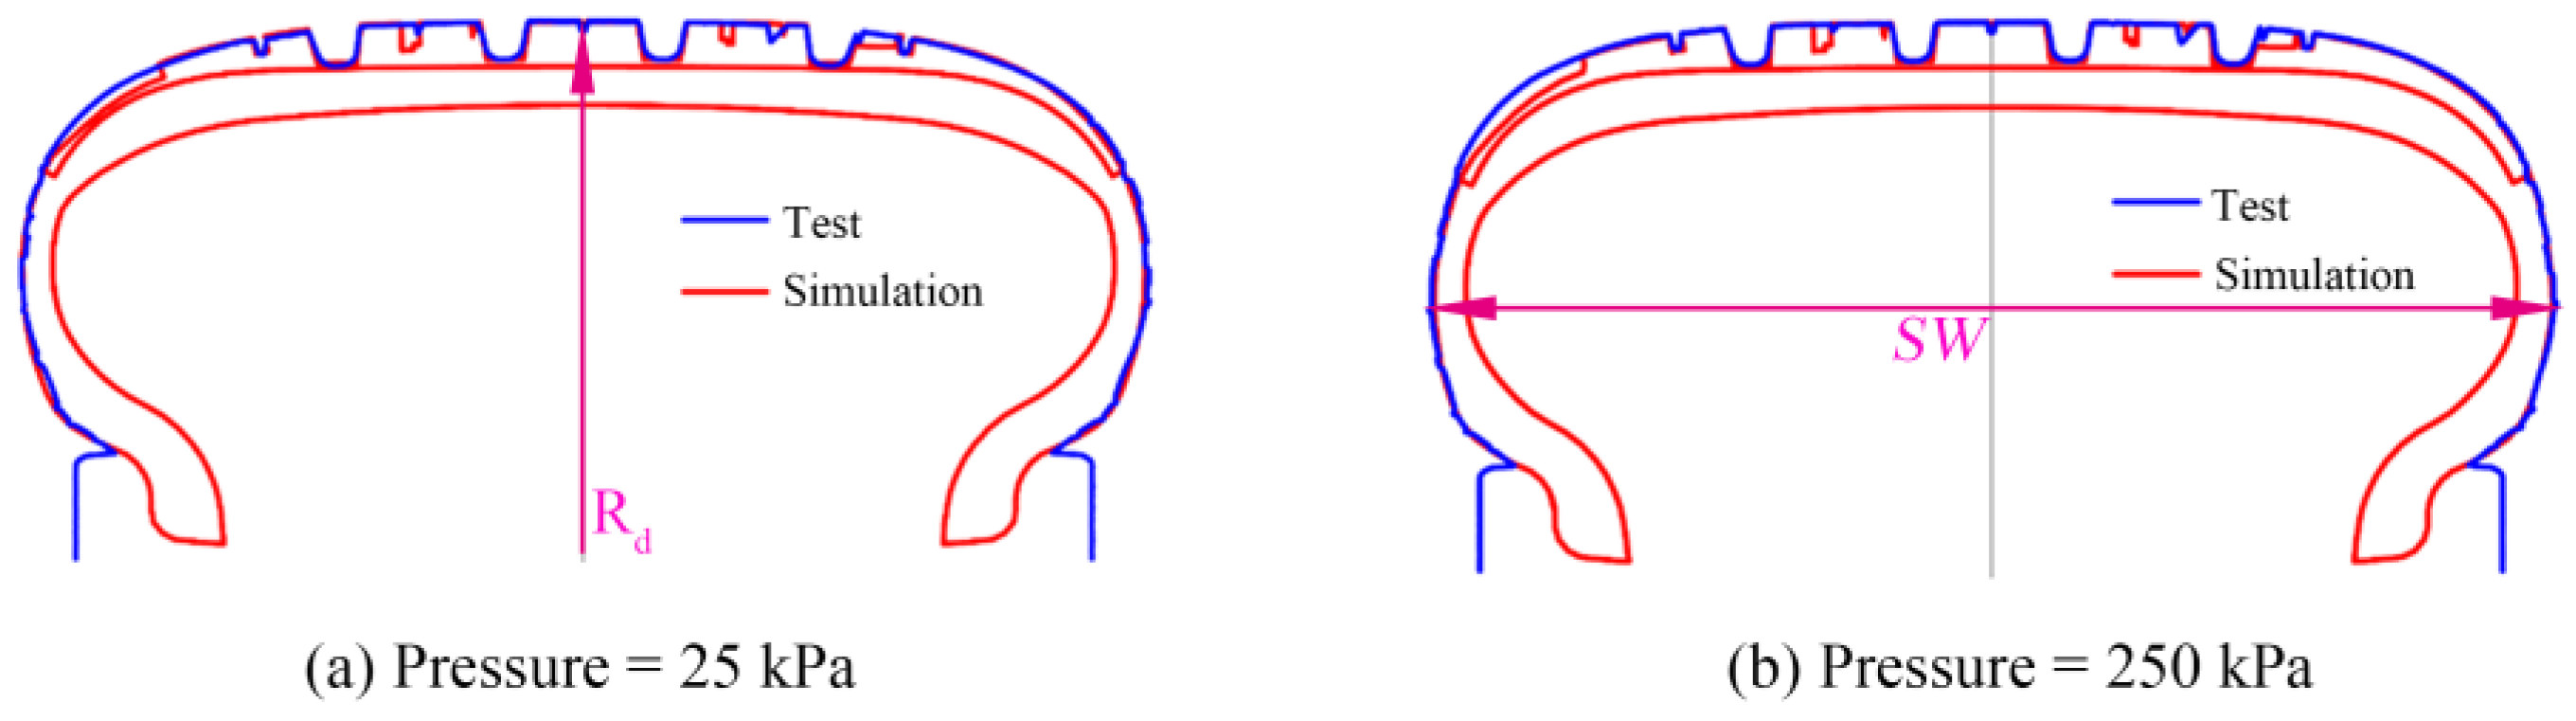
3.1. Tire Inflation Contour Scanning Test

To confirm the computational validity of the model, the tire outer radius (Rd) and the inflated section width (SW) of the tire at 10% standard inflation pressure (25 kPa) and 100% standard inflation pressure (250 kPa) were measured with a tire outer contour scanner, as depicted in Figure 3. The test results were contrasted and analyzed with the simulation results.
Figure 4 shows the comparison between the simulation and test of the outer edge of the tire profile at 10% standard inflation pressure (25 kPa) and 100% standard inflation pressure (250 kPa). Table 3 shows the comparison between the outer edge simulation and experimental data.
In accordance with the information presented in Table 3, the three-dimensional tire structural model constructed at 10% standard inflation pressure demonstrates minimal deviation between the simulation and test results under varying inflation pressures. Therefore, the constructed finite element model can accurately reflect the change in tire outer edge size and can be utilized for tire simulation research.

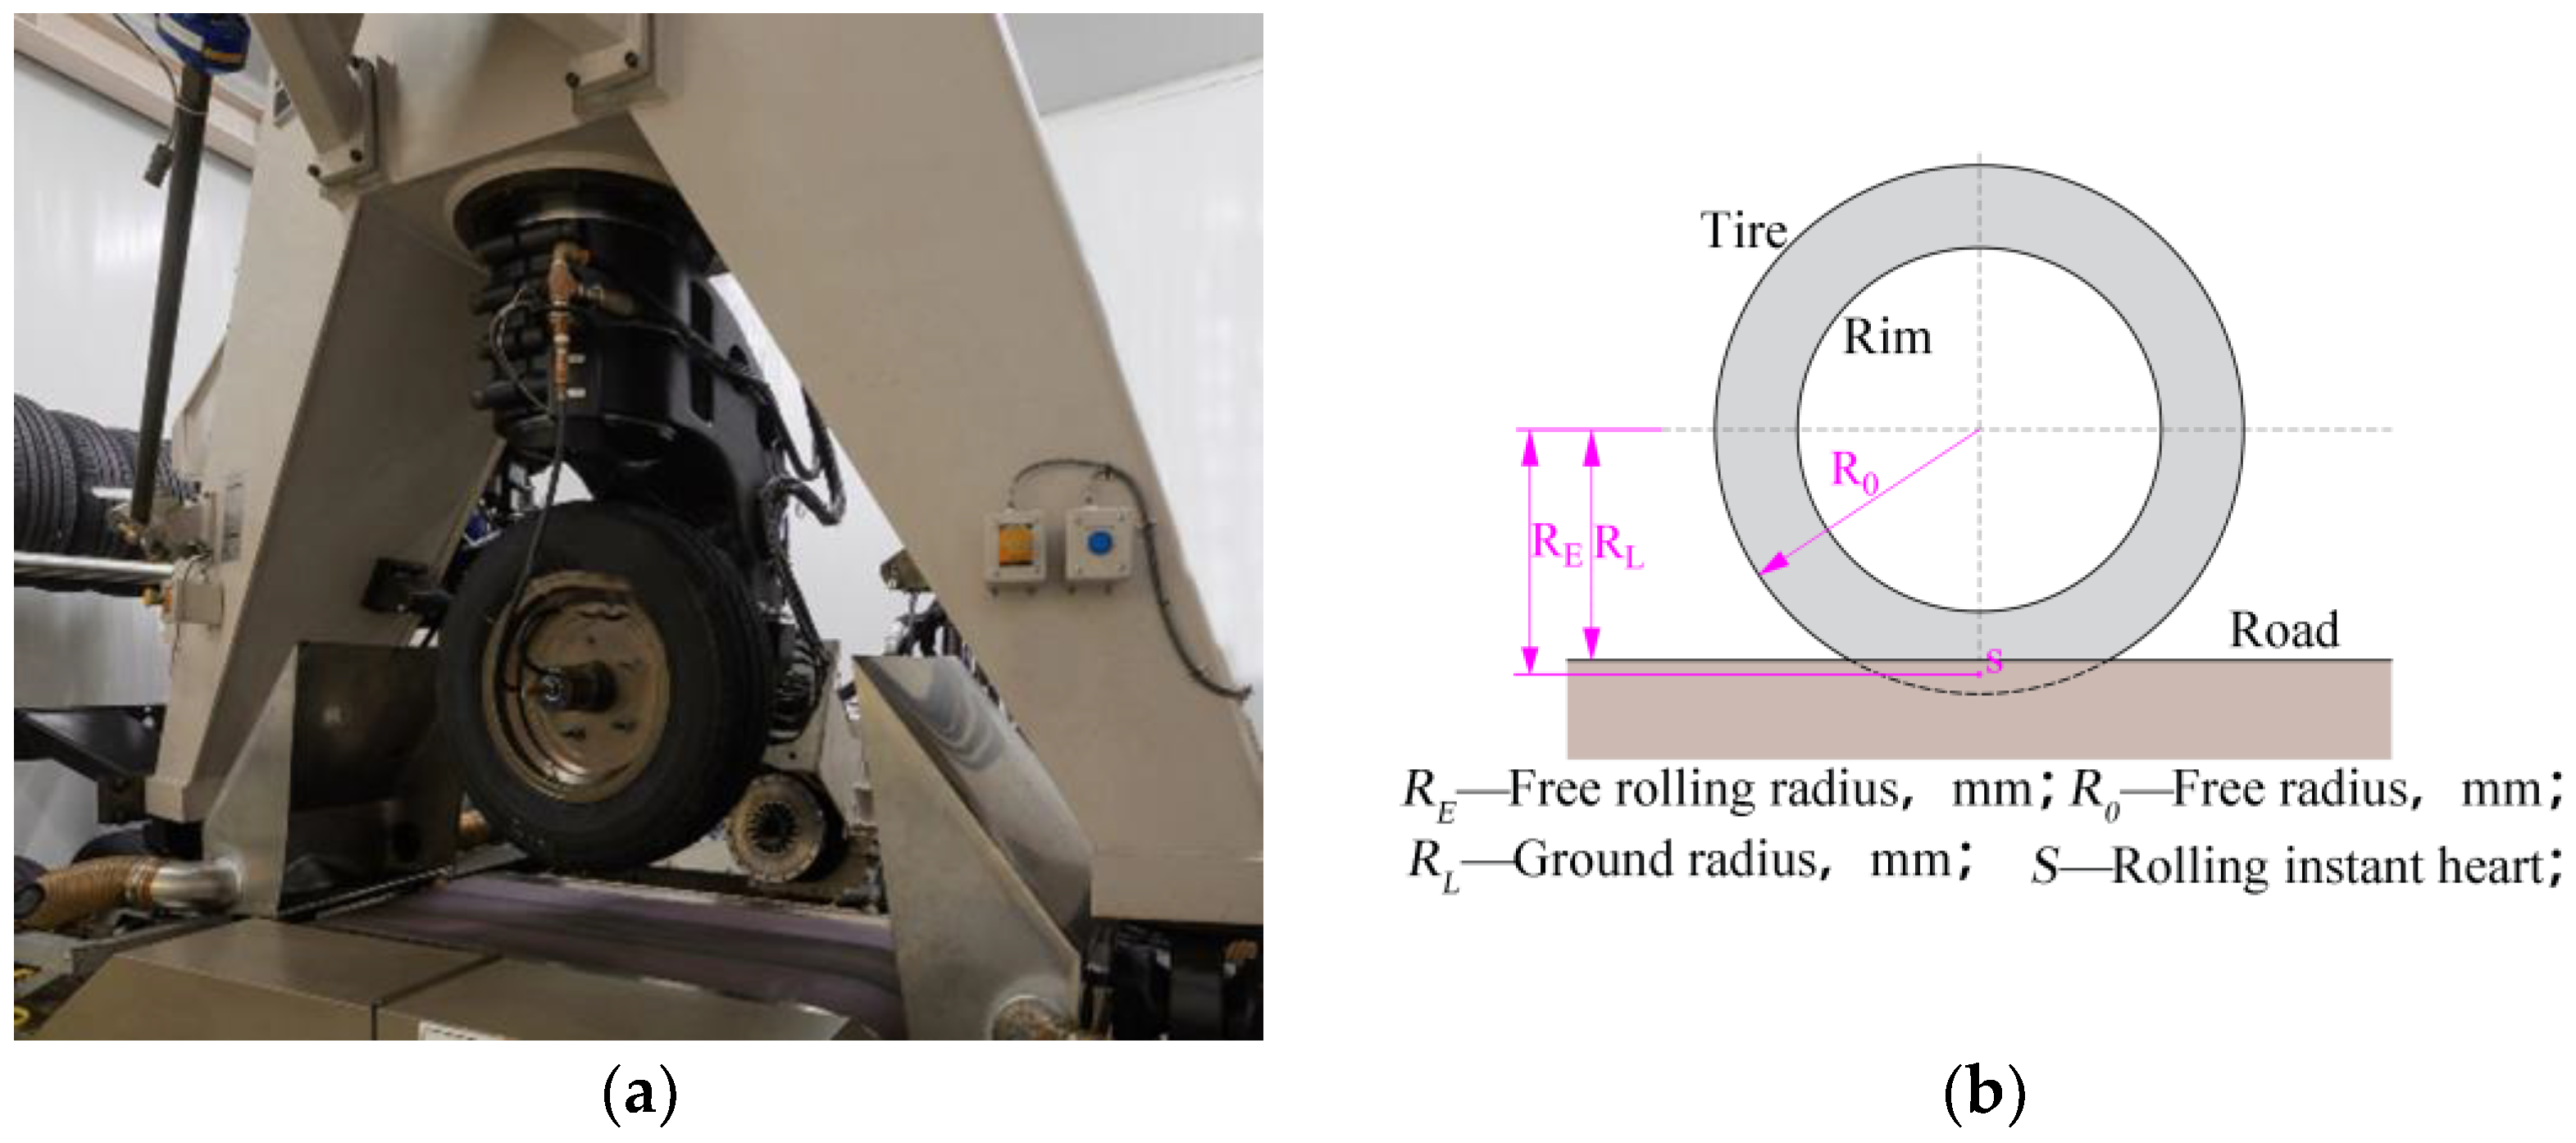
3.2. Tire Free-Rolling Test

To validate the dynamic precision of the simulation model, free-rolling tests were conducted using the US-manufactured MTS Flat-Trac CT six-axis force test rig, as shown in Figure 5a. During the test, the inflation pressure was kept constant at 220 kPa, the camber angle was set to 0°, and the rolling speed was fixed at 60 km/h. The rolling radius was measured under radial loads of 1600 N, 3200 N, and 4800 N. The experimental results were then compared with the corresponding simulation results for validation and analysis. Figure 5b presents a schematic diagram illustrating the rolling radius of the tire. Point S represents the instantaneous center of tire motion, R 0 denotes the distance from the wheel center to the outer tread surface after inflation, R L refers to the loaded radius or ground radius of the tire, and R E represents the free-rolling radius of the tire.
Figure 6 presents a contrast between the simulated and experimental data of the tire’s loaded radius ( R L ) and free-rolling radius ( R E ) under various loading conditions at an inflation pressure of 220 kPa. As depicted in the figure, the largest discrepancy between the simulated and measured values of both the loaded radius and free-rolling radius is within 1%, indicating that the developed finite element model, which incorporates a complex tread pattern, is suitable for subsequent tire simulation studies.

4. Results and Discussion

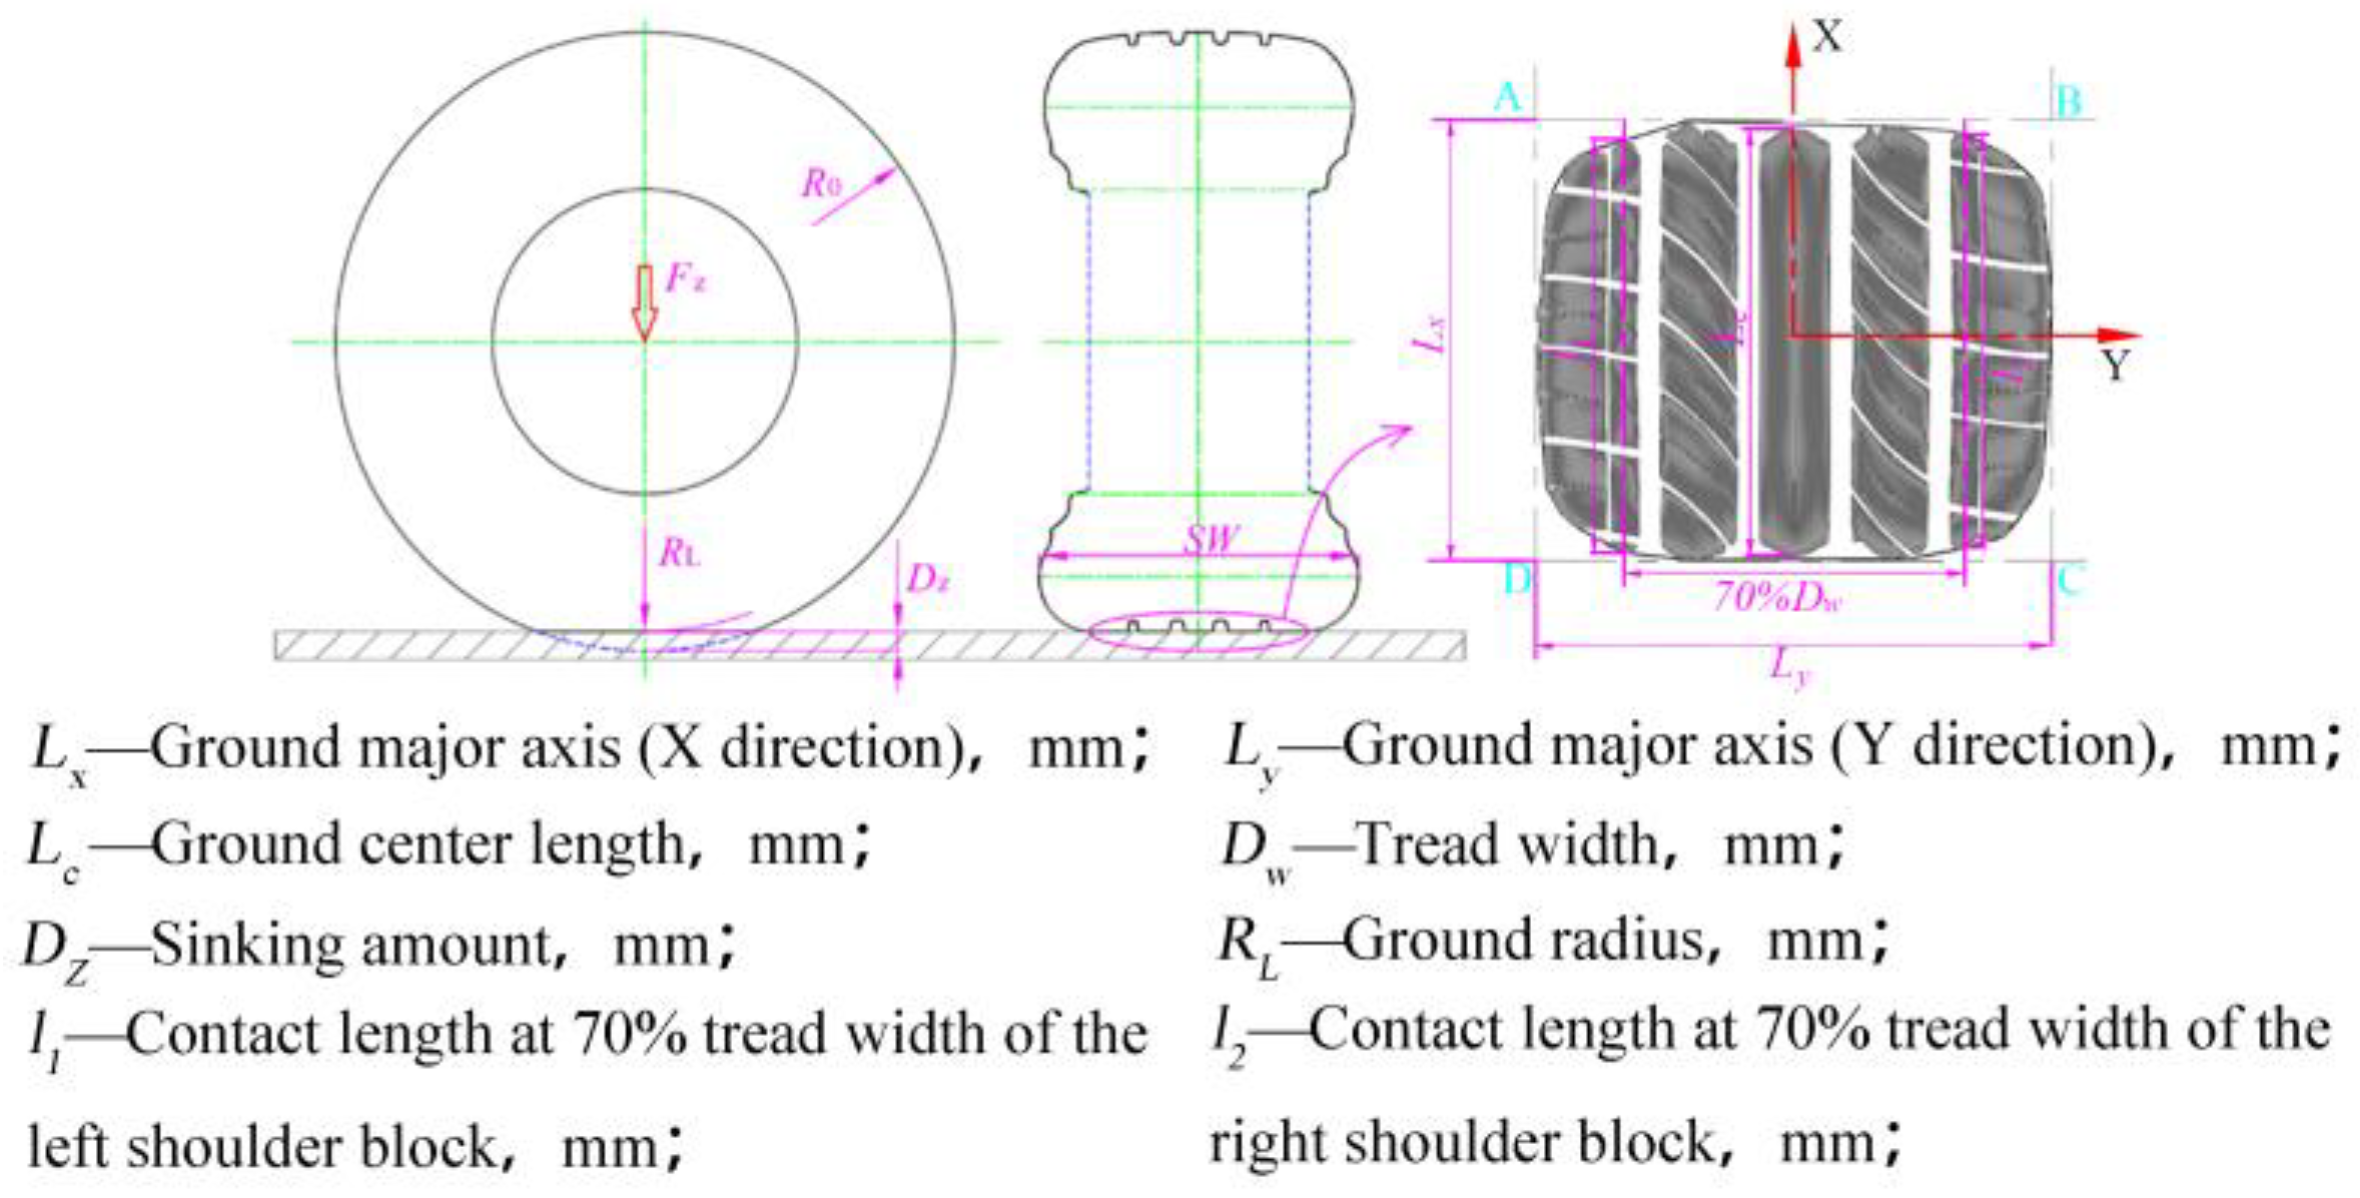
4.1. Definition and Influencing Factors of Tire–Road Contact Geometric Characteristics

Tire contact characteristics constitute the foundation of tire dynamics research. The analysis of the tire’s contact pressure distribution and changes in contact footprint is an important part of the quantitative comparison of mechanical and geometric characteristics. In order to systematically establish correlations between the contact geometry and tire performance, and realize a comprehensive characterization of the contact footprint, in addition to conventional parameters such as the length, width, and area of principal axes, this paper considers the contact length parameter of the tread block and redefines the tire contact geometry characteristics, as displayed in Figure 7.
Using a single-variable method, the impact of inflation pressure, radial load, belt angle, design outer diameter, and tire shoulder thickness on the static and dynamic contact performance of the tire was analyzed. The corresponding relationships among tire usage, design parameters, and ground contact geometric characteristics were established, and thereby the prediction and control method of tire performance was theoretically obtained. The typical analysis conditions are shown in Table 4, where ABT = 26°, Rd = 316.1, and SW = 14.57 are the original fixed parameters of the tire. When analyzing the impact of varying inflation pressures on tire–ground contact characteristics, Fz was set to 3200 N, and when analyzing the influence of different loads on tire–ground contact performance, the inflation pressure was set to 220 kPa.

4.2. Inflation Pressure

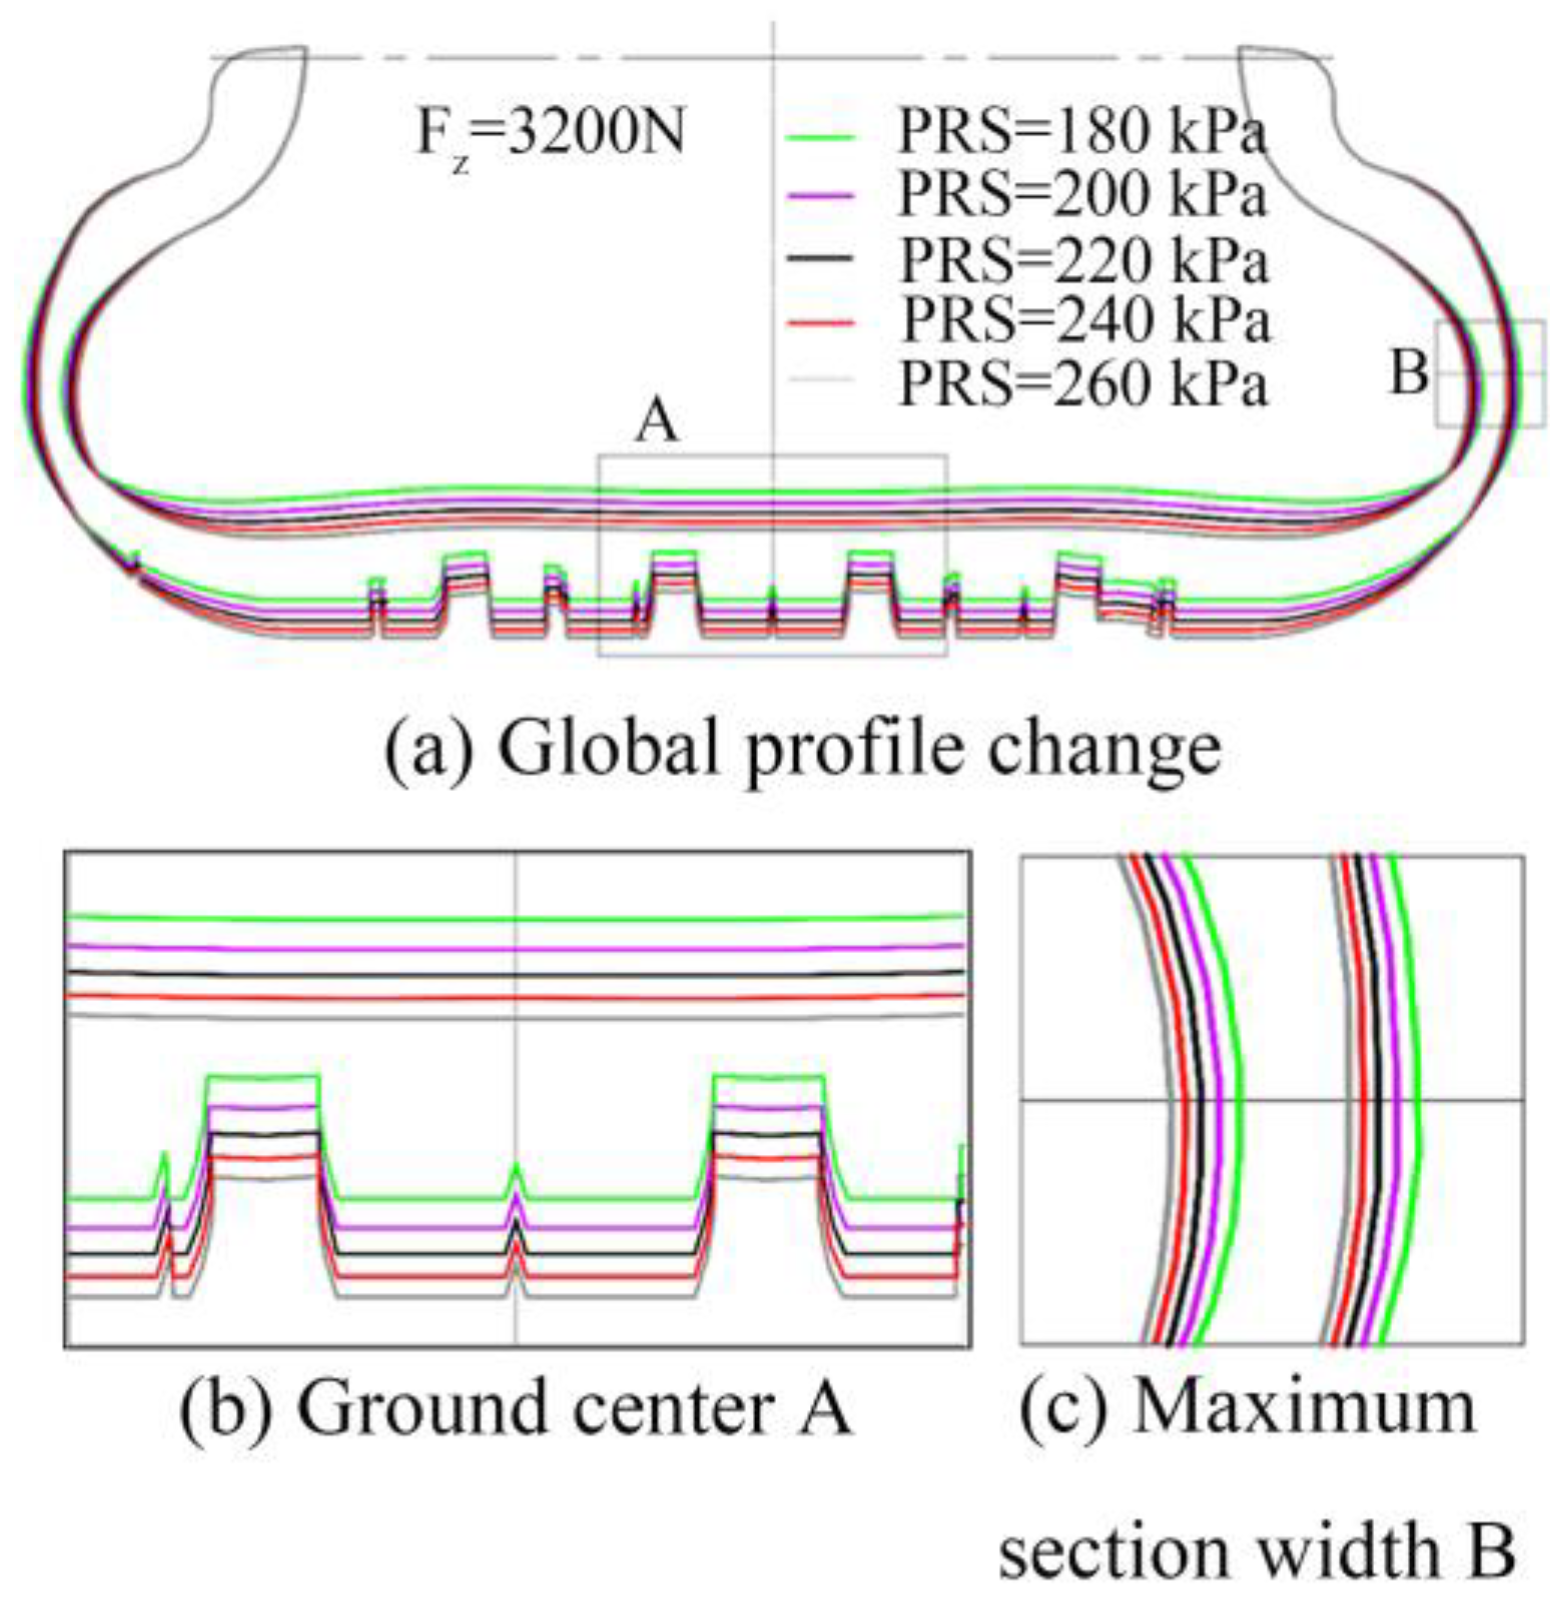
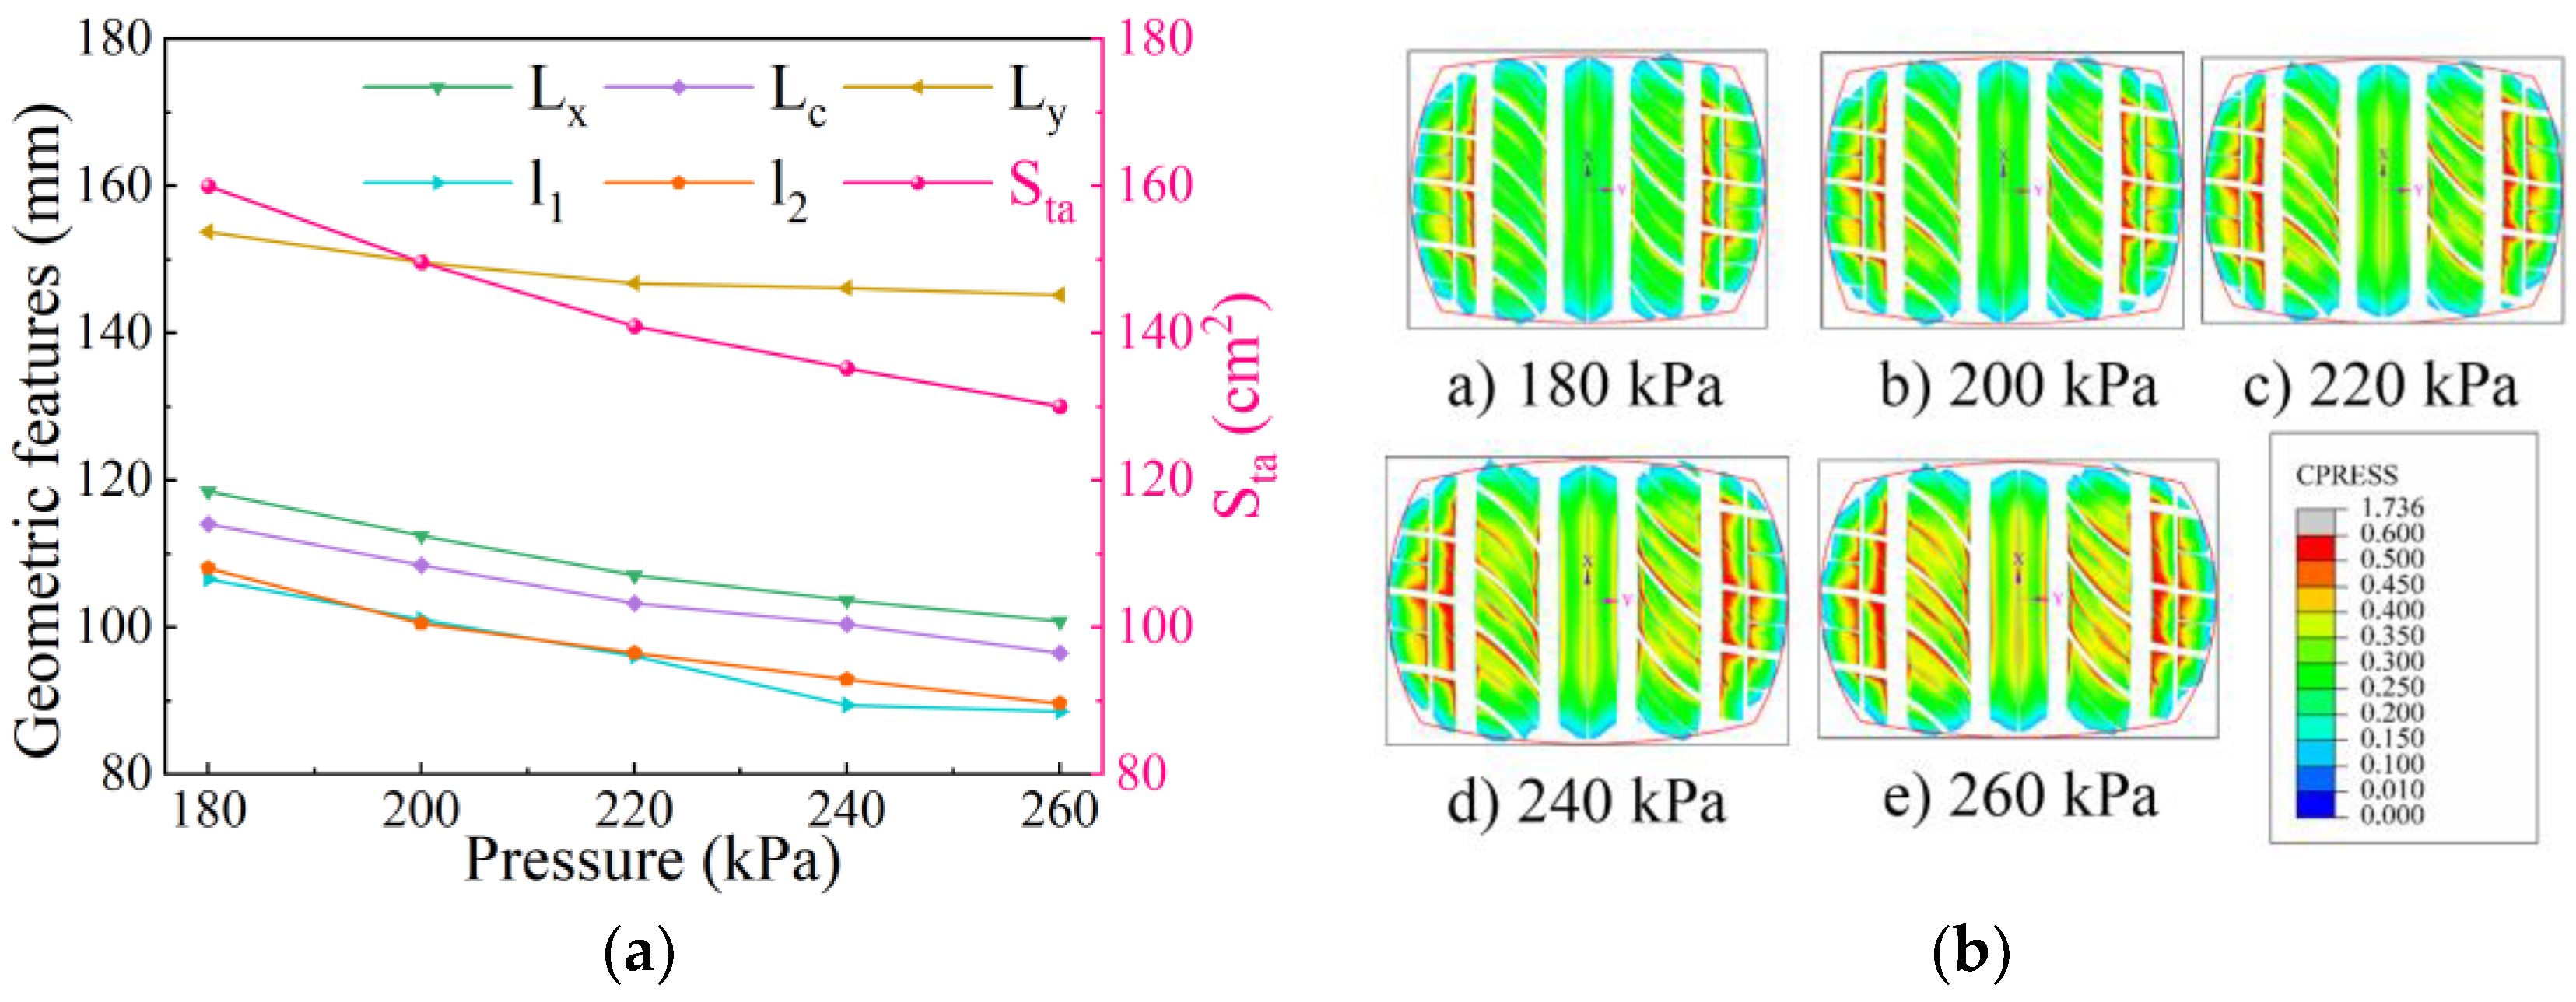
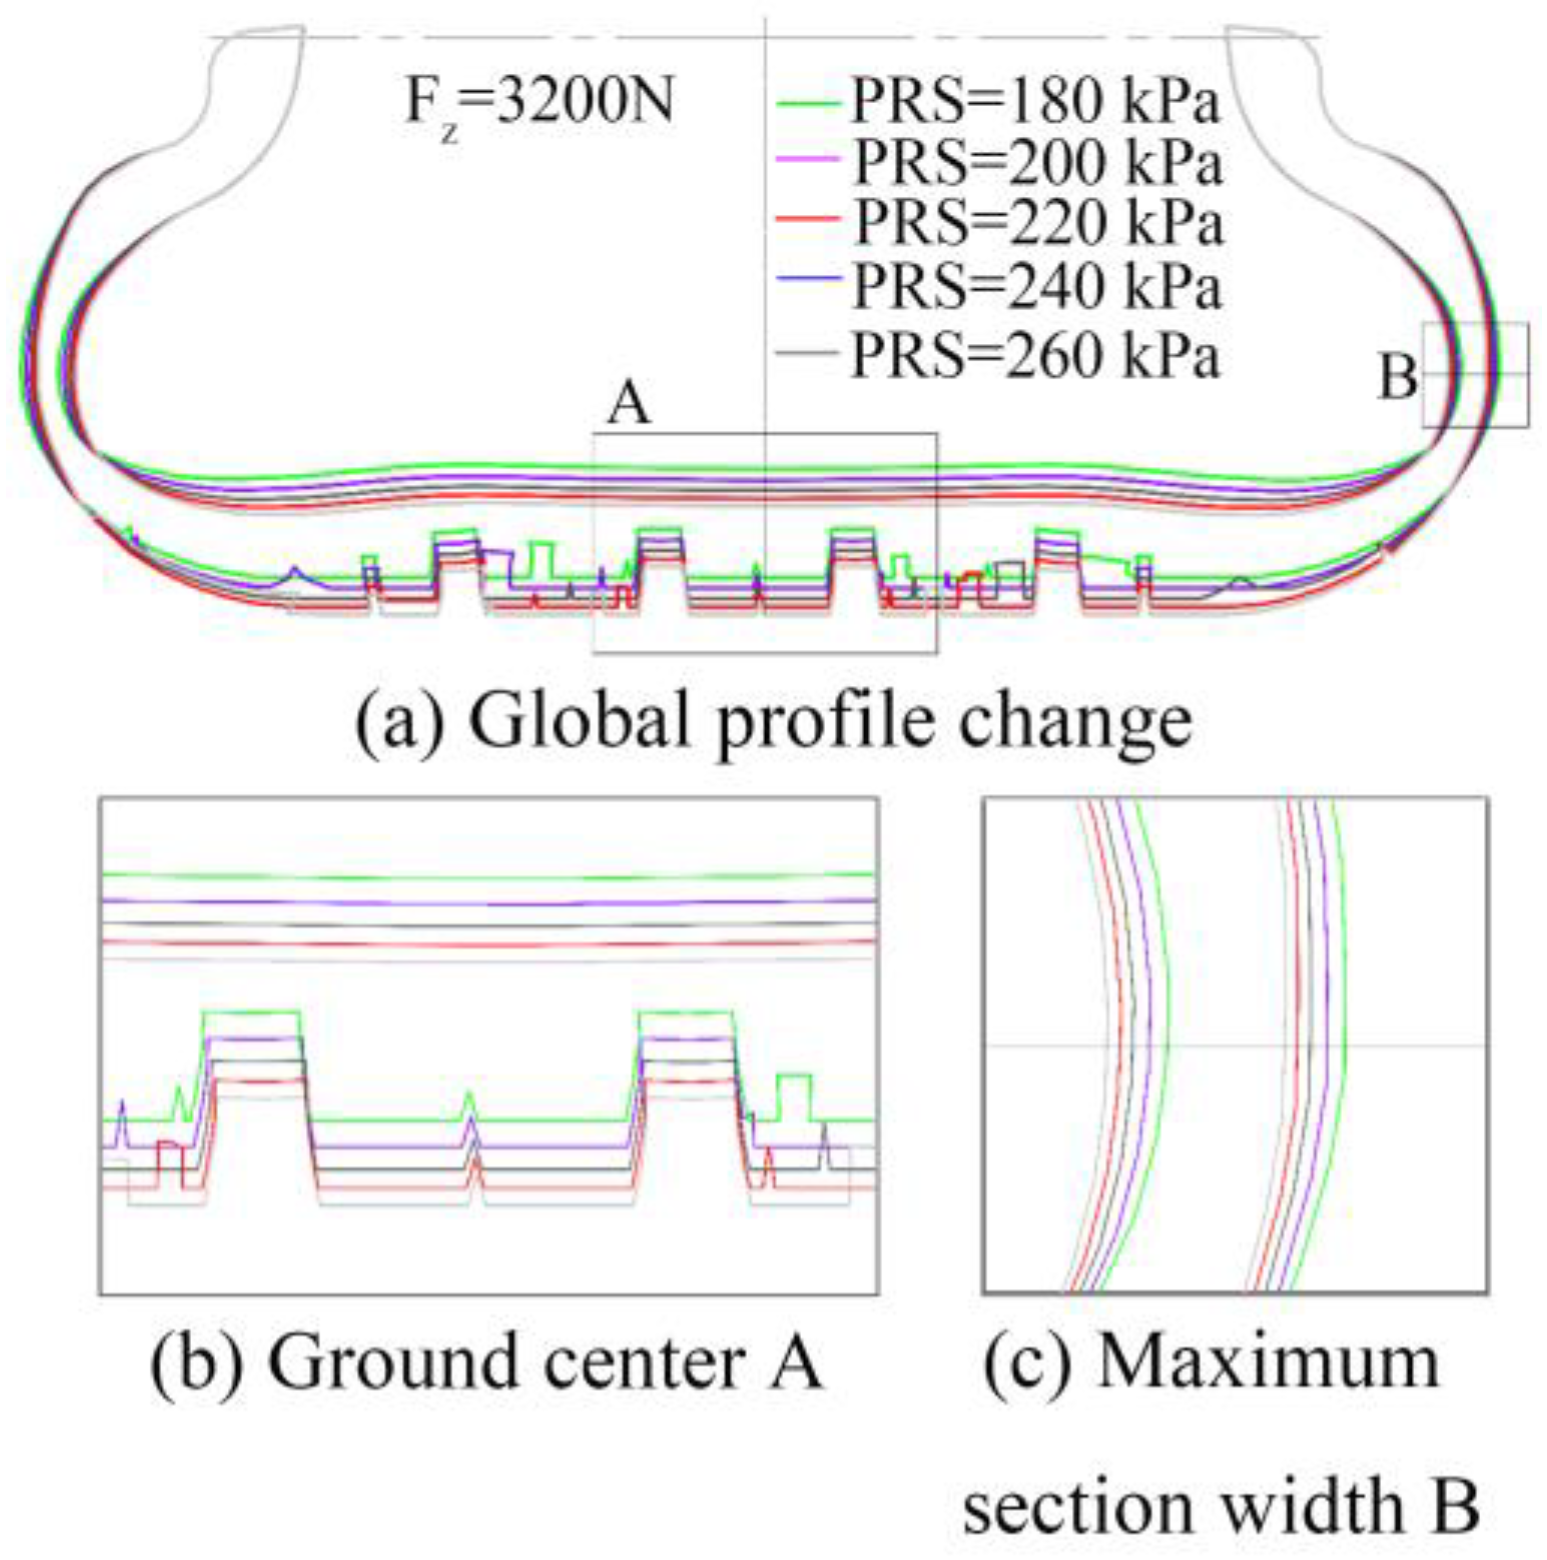
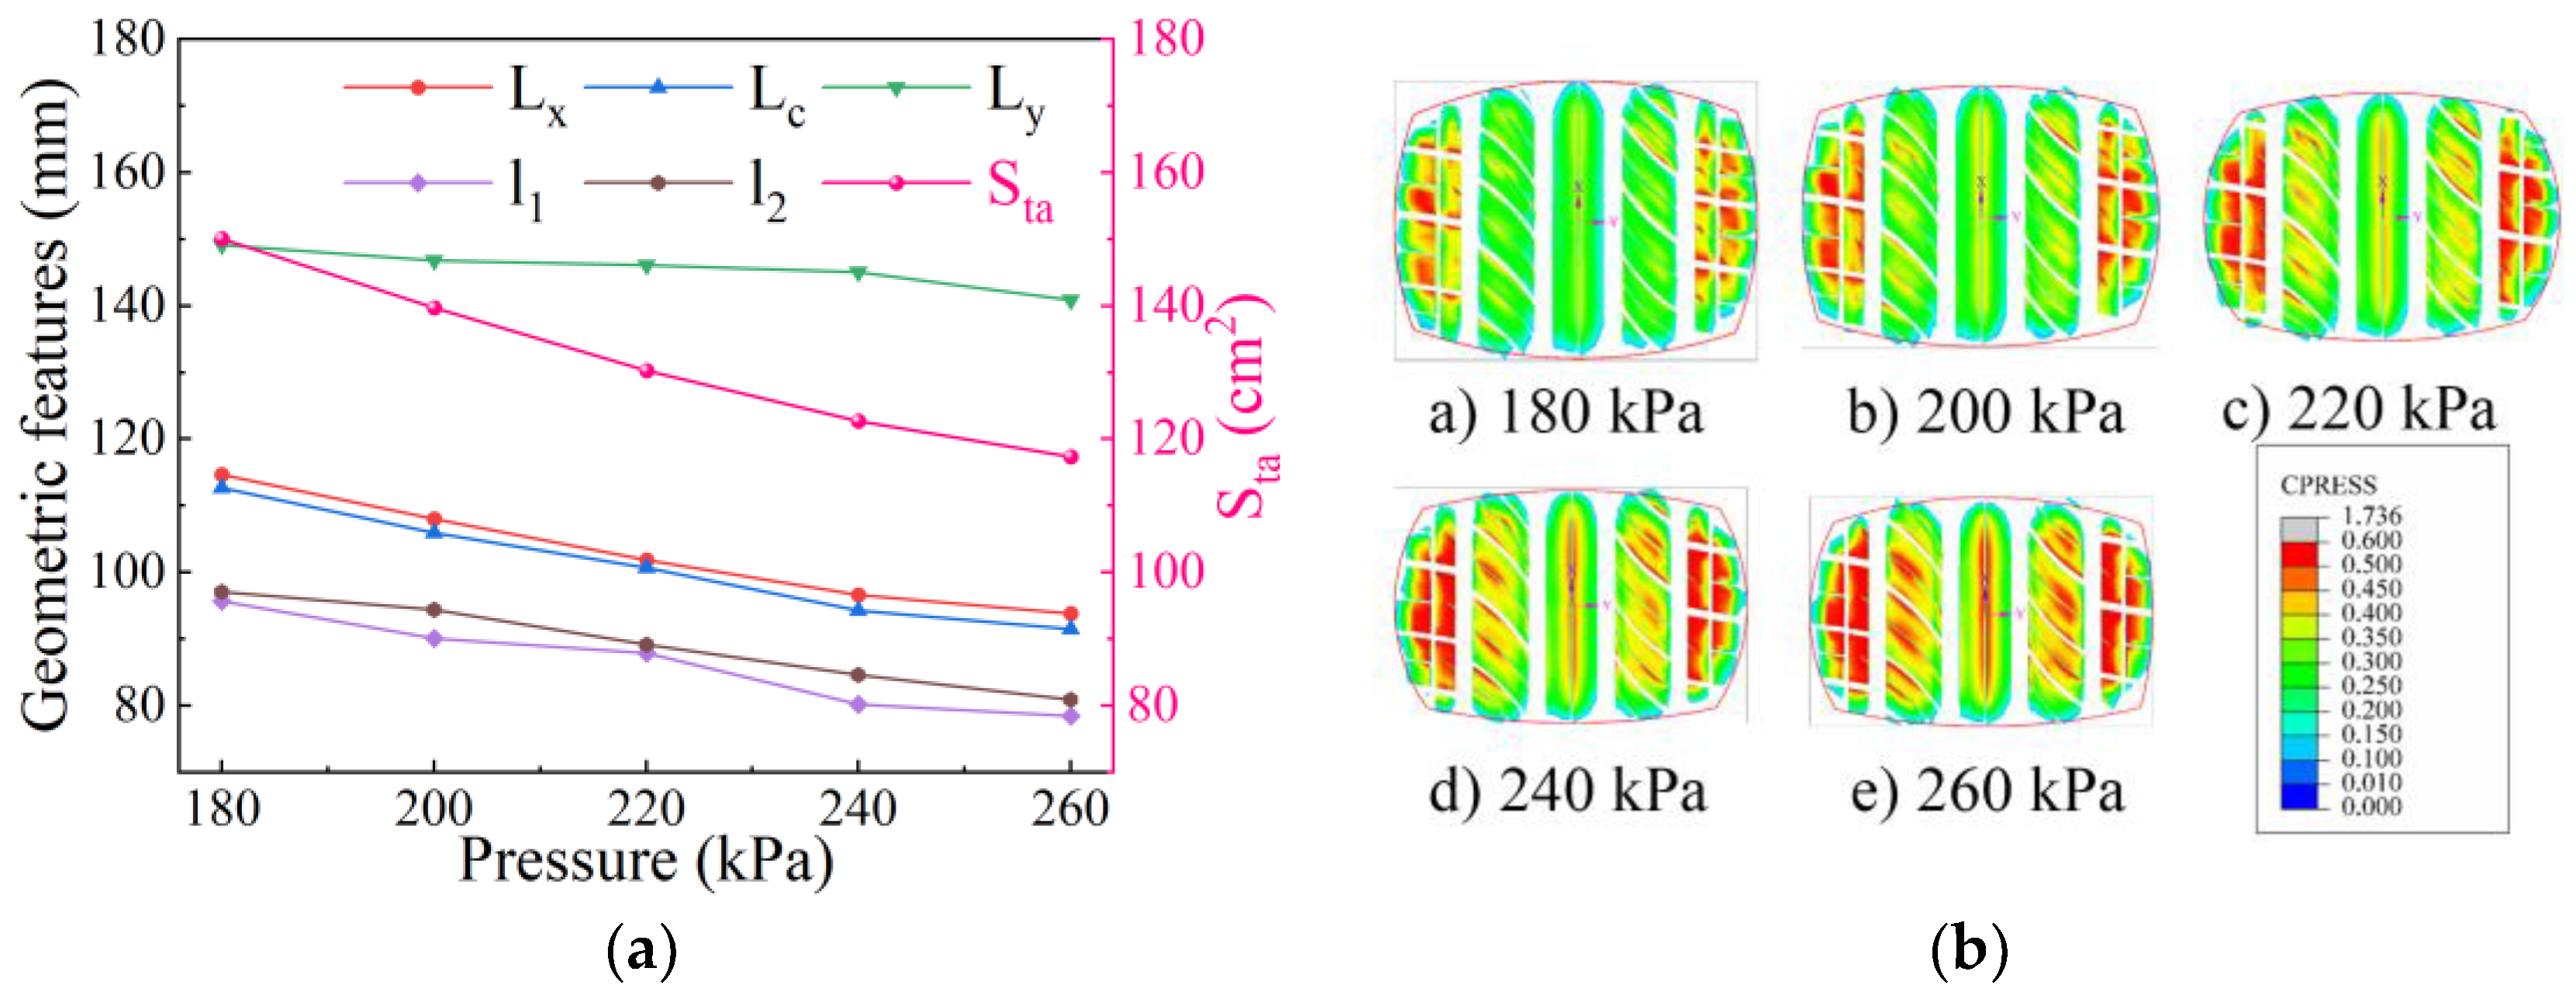
4.2.1. Influence of Inflation Pressure on Static Contact Characteristics

Under a radial load of 3200 N and a reference inflation pressure of 220 kPa, finite element simulations were performed to investigate the static contact outer contour of the tire over a range of inflation pressures. Figure 8 presents the simulation results of the overall grounded outer contour. It is evident that when the pressure is low, the two sidewalls of the tire resist external forces through bending and deformation. With the tire shoulder as the “fulcrum”, an obvious “warping” phenomenon occurs in the center of the crown.
Figure 9a shows the static contact geometry parameters of the tire at various inflation pressures, and Figure 9b shows the contact footprint and pressure distribution. It is observed from Figure 9 that under identical load conditions, an increase in internal tire pressure leads to a larger crown curvature radius, a reduction in contact area (Sta), and a shortening of both the major and minor axes of the contact footprint, exhibiting an overall linear decreasing trend. Consequently, the contact pressure distribution becomes more concentrated at the crown center, shifting the contact force from the shoulders to the central area of the crown. The edges of the tread grooves exhibit noticeable ground stress concentration, leading to an increased wear contribution in the central crown tread blocks.

4.2.2. Influence of Inflation Pressure on Contact Characteristics of Free-Rolling Tires

Under the condition of a radial load of 3200 N and a free-rolling velocity of 60 km/h, finite element simulations of the dynamic contact outer contour of the tire under different inflation pressure conditions were carried out. Figure 10 shows the outer contour of the free-rolling tire under varying inflation pressures. As observed in Figure 10, an increase in internal tire pressure results in a similar changing trend for the rolling radius and static ground contact characteristics. Specifically, the dynamic radius of the load is positively correlated with the inflatable pressure, while the maximum width of the section is reversed.
It is observed from Figure 11a that when the tire is rolling, the contact lengths of the shoulder tread blocks are not completely consistent, reflecting that the ground contact geometry presents a left–right asymmetric feature, which is caused by the angular effect of the belt cord layer.
Figure 11b illustrates the distribution of tire contact pressure under varying inflation pressures in the free-rolling condition. Based on the observations from Figure 11, it is evident that the contact area diminishes progressively as inflation pressure rises, with stress primarily concentrated at the center of the tire crown and the edges of the pattern grooves. Compared with static ground contact characteristics, the high-speed centrifugal effect in the rolling state causes a rise in the tire–ground contact radius, a reduction in the major axis of the contact footprint, and a decrease of approximately 10% in the effective ground contact area, leading to more pronounced stress concentration at the tread groove edges.

4.3. Radial Load

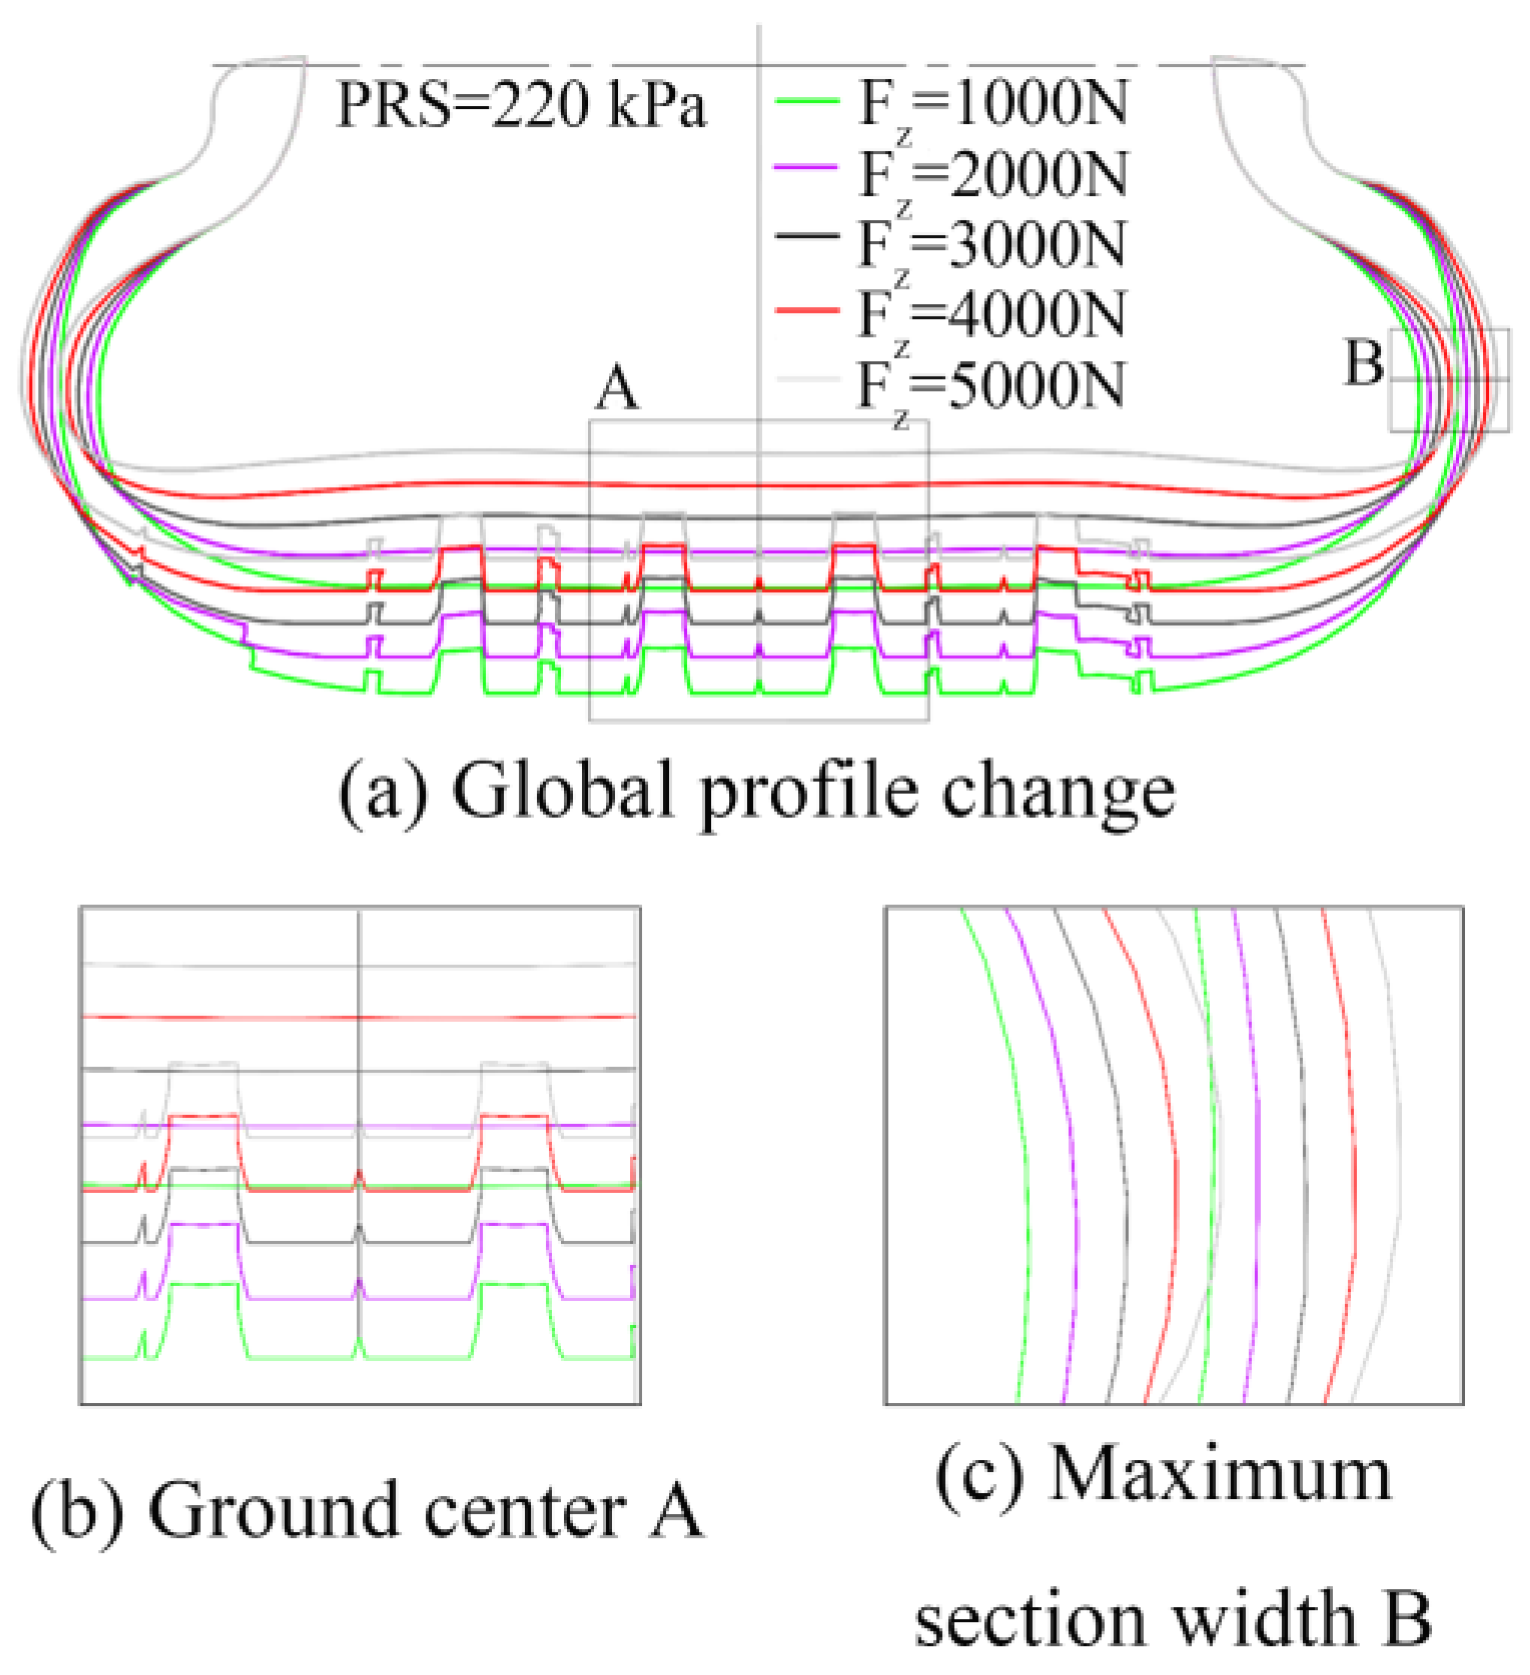
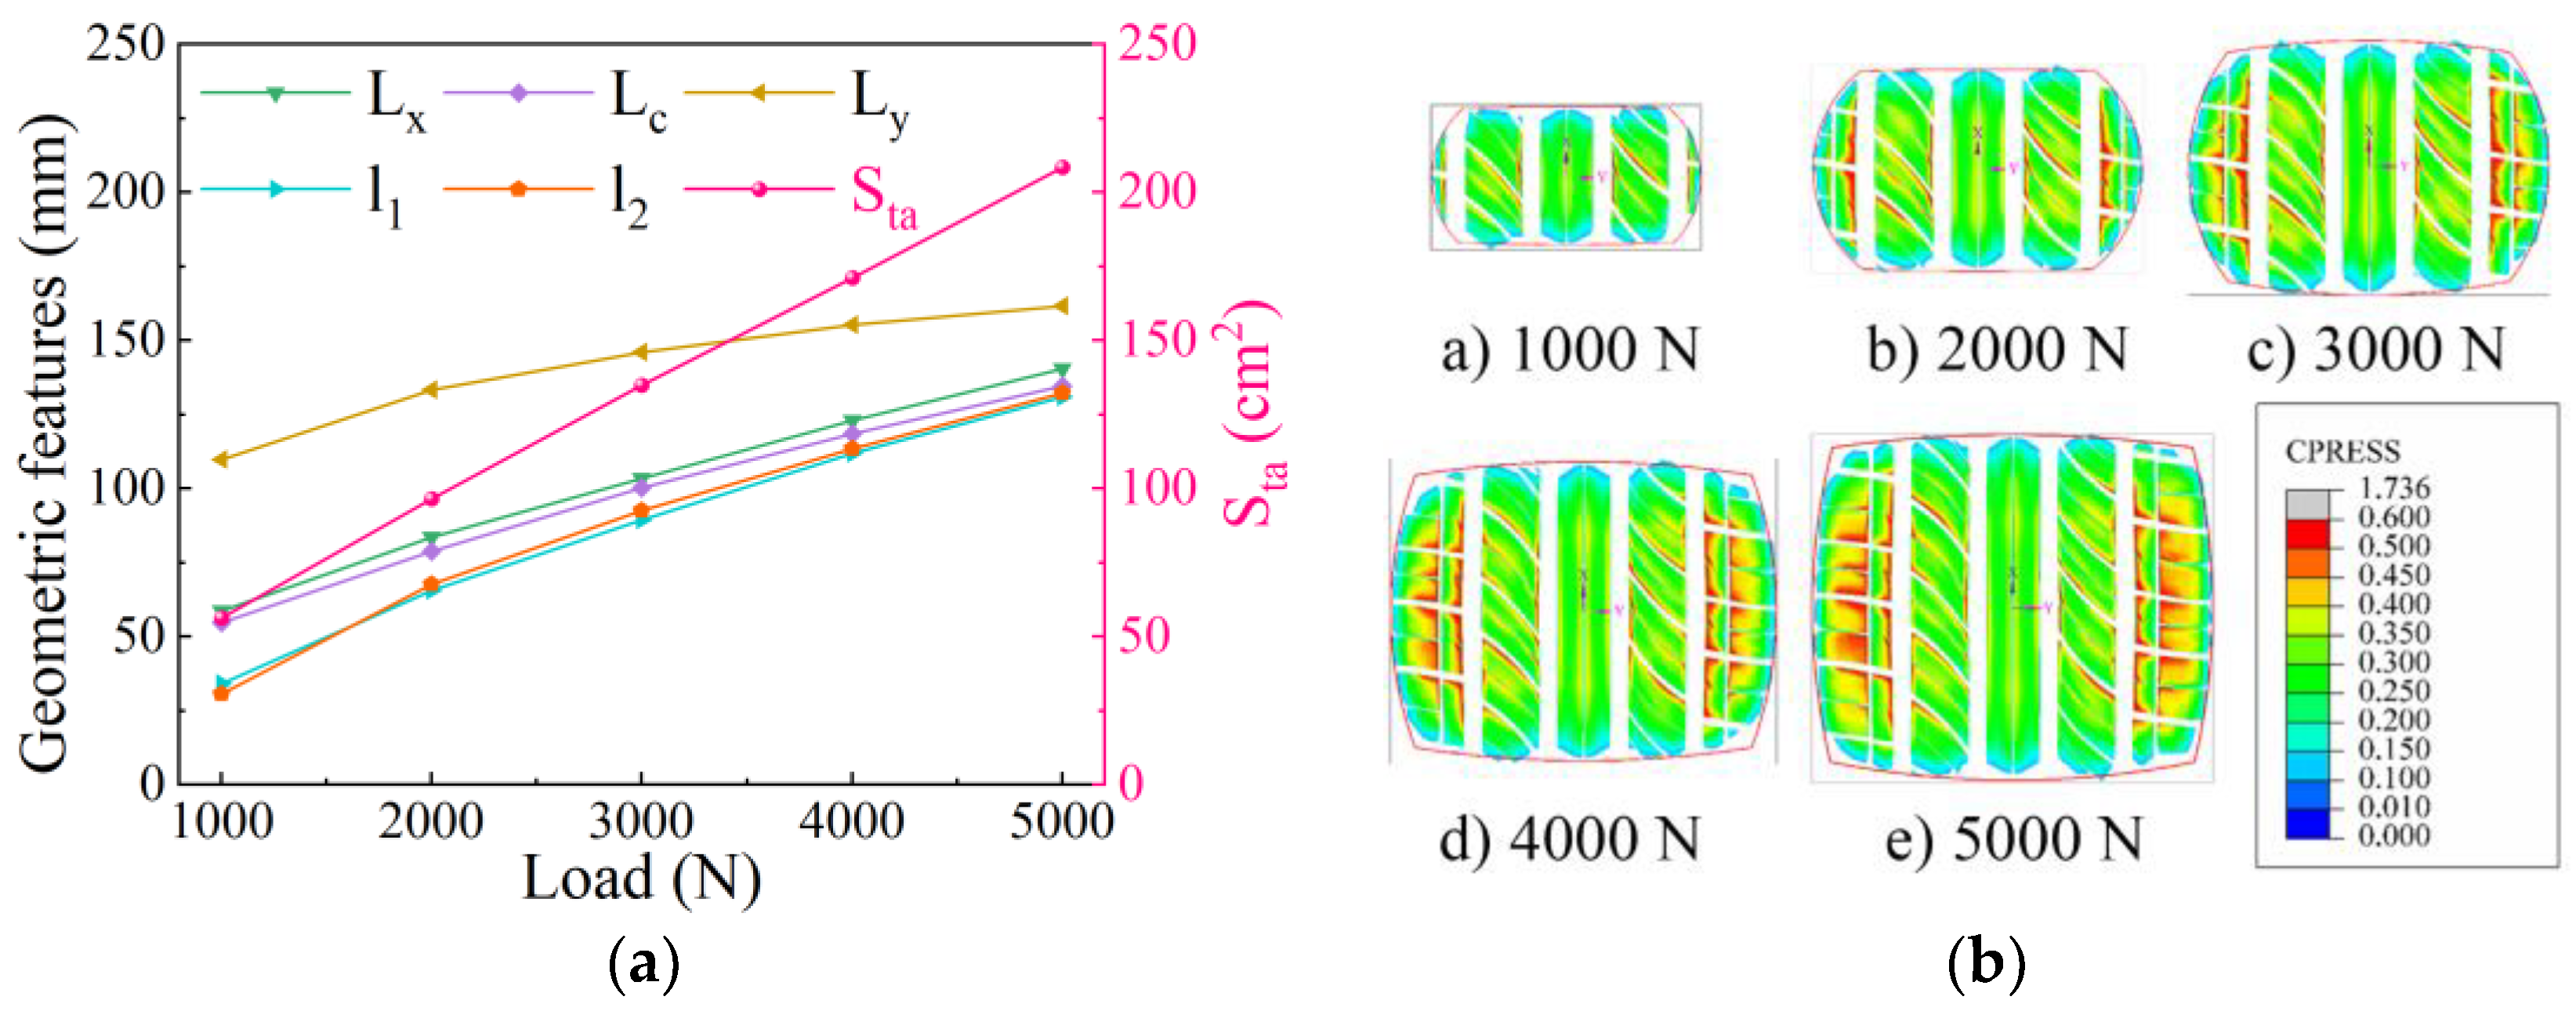
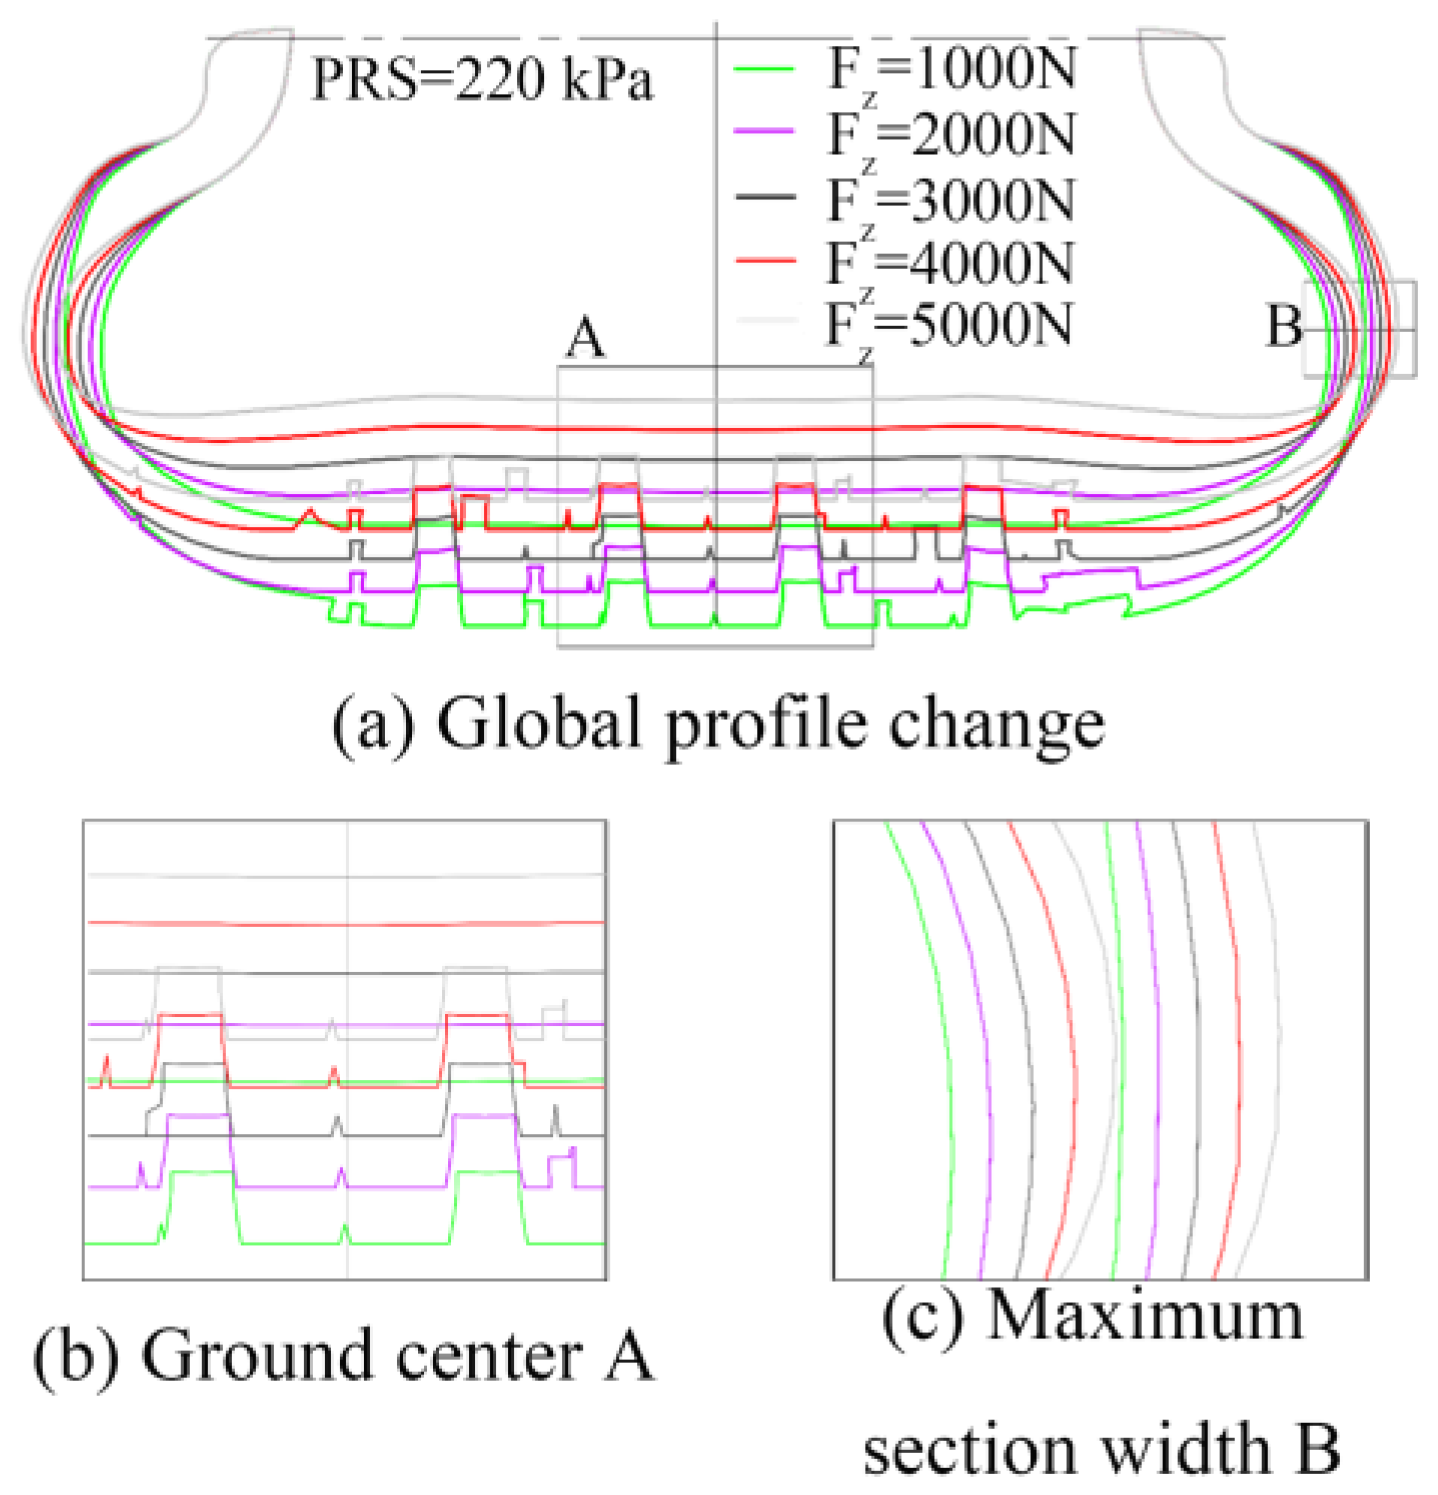
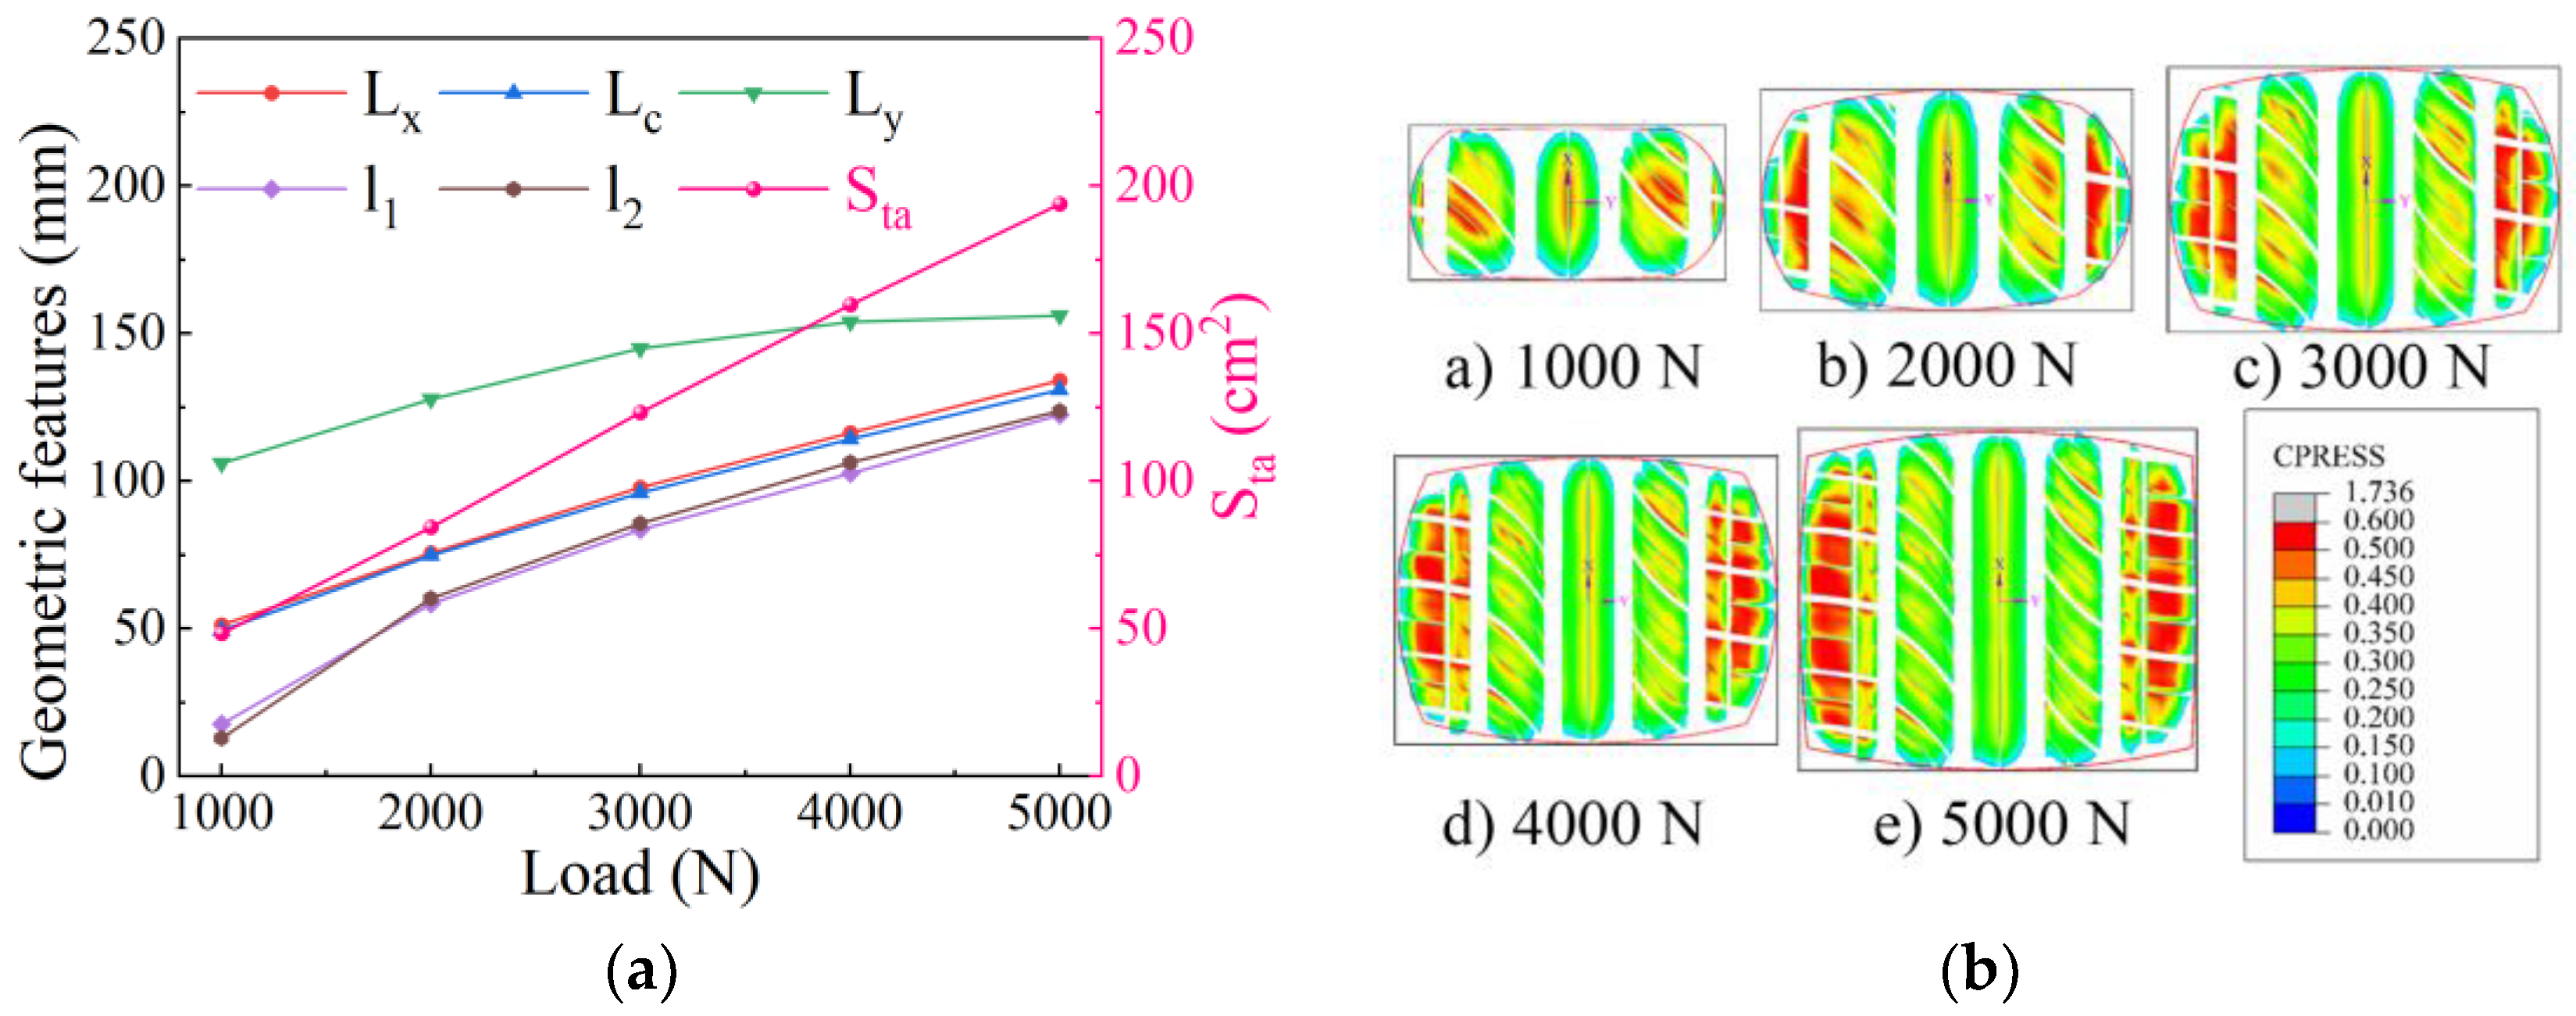
4.3.1. Influence of Radial Load on Static Contact Characteristics

Under the condition of 220 kPa inflation pressure, the tire’s outer profile was simulated by changing different loads. The change results of the tire outer profile are shown in Figure 12. At an identical inflation pressure, as the radial load increases, the outer radius of the ground contact gradually decreases, the maximum width of the section gradually increases, and significant deformation occurs in the lower sidewall.
The impact of radial load on the geometric characteristics of the tire’s contact area is illustrated in Figure 13a. At a constant inflation pressure, the lengths of both the major and minor axes of the contact footprint expand as the radial load rises; however, the rate of increase in the minor axis length progressively diminishes.
Figure 13b presents the static ground contact pressure distribution for the tire under varying radial load conditions. The pressure on the shoulder pattern block exhibits a more pronounced increase compared to that on the middle pattern block, resulting in a saddle-shaped profile characterized by raised shoulders and a depressed center. The two-dimensional grounding pattern reveals that the contact shape gradually transitions from an ellipse to a rectangle, while the contact footprint exhibits an overall nonlinear amplification trend. Additionally, the contact area progressively expands, and noticeable stress concentration occurs at the edges of the tread grooves in the shoulder region.

4.3.2. Influence of Radial Load on Contact Characteristics of Free-Rolling Tires

Finite element simulations were conducted at a constant free-rolling velocity of 60 km/h to evaluate the dynamic contact outer profile of the tire under varying radial loads. Figure 14 illustrates the outer contour for the free-rolling tire under different radial loads, revealing that as the load increases, the load radius decreases, the maximum section width increases, and the static contact characteristics follow the same trend.
Figure 15a shows the ground contact geometric parameters of a free-rolling tire under different radial load conditions, and Figure 15b shows the contact pressure cloud diagram. From Figure 15, it is evident that at low radial loads, ground pressure is primarily concentrated in the geometric center. With increasing radial load, contact pressure rises on both sides of the major and minor axes. Compared to static ground characteristics, in the rolling state, the major axis length of the ground contact is significantly reduced, and the effective contact area decreases by approximately 10%, leading to more pronounced stress concentration at the tread groove edges.

4.4. Belt Angle

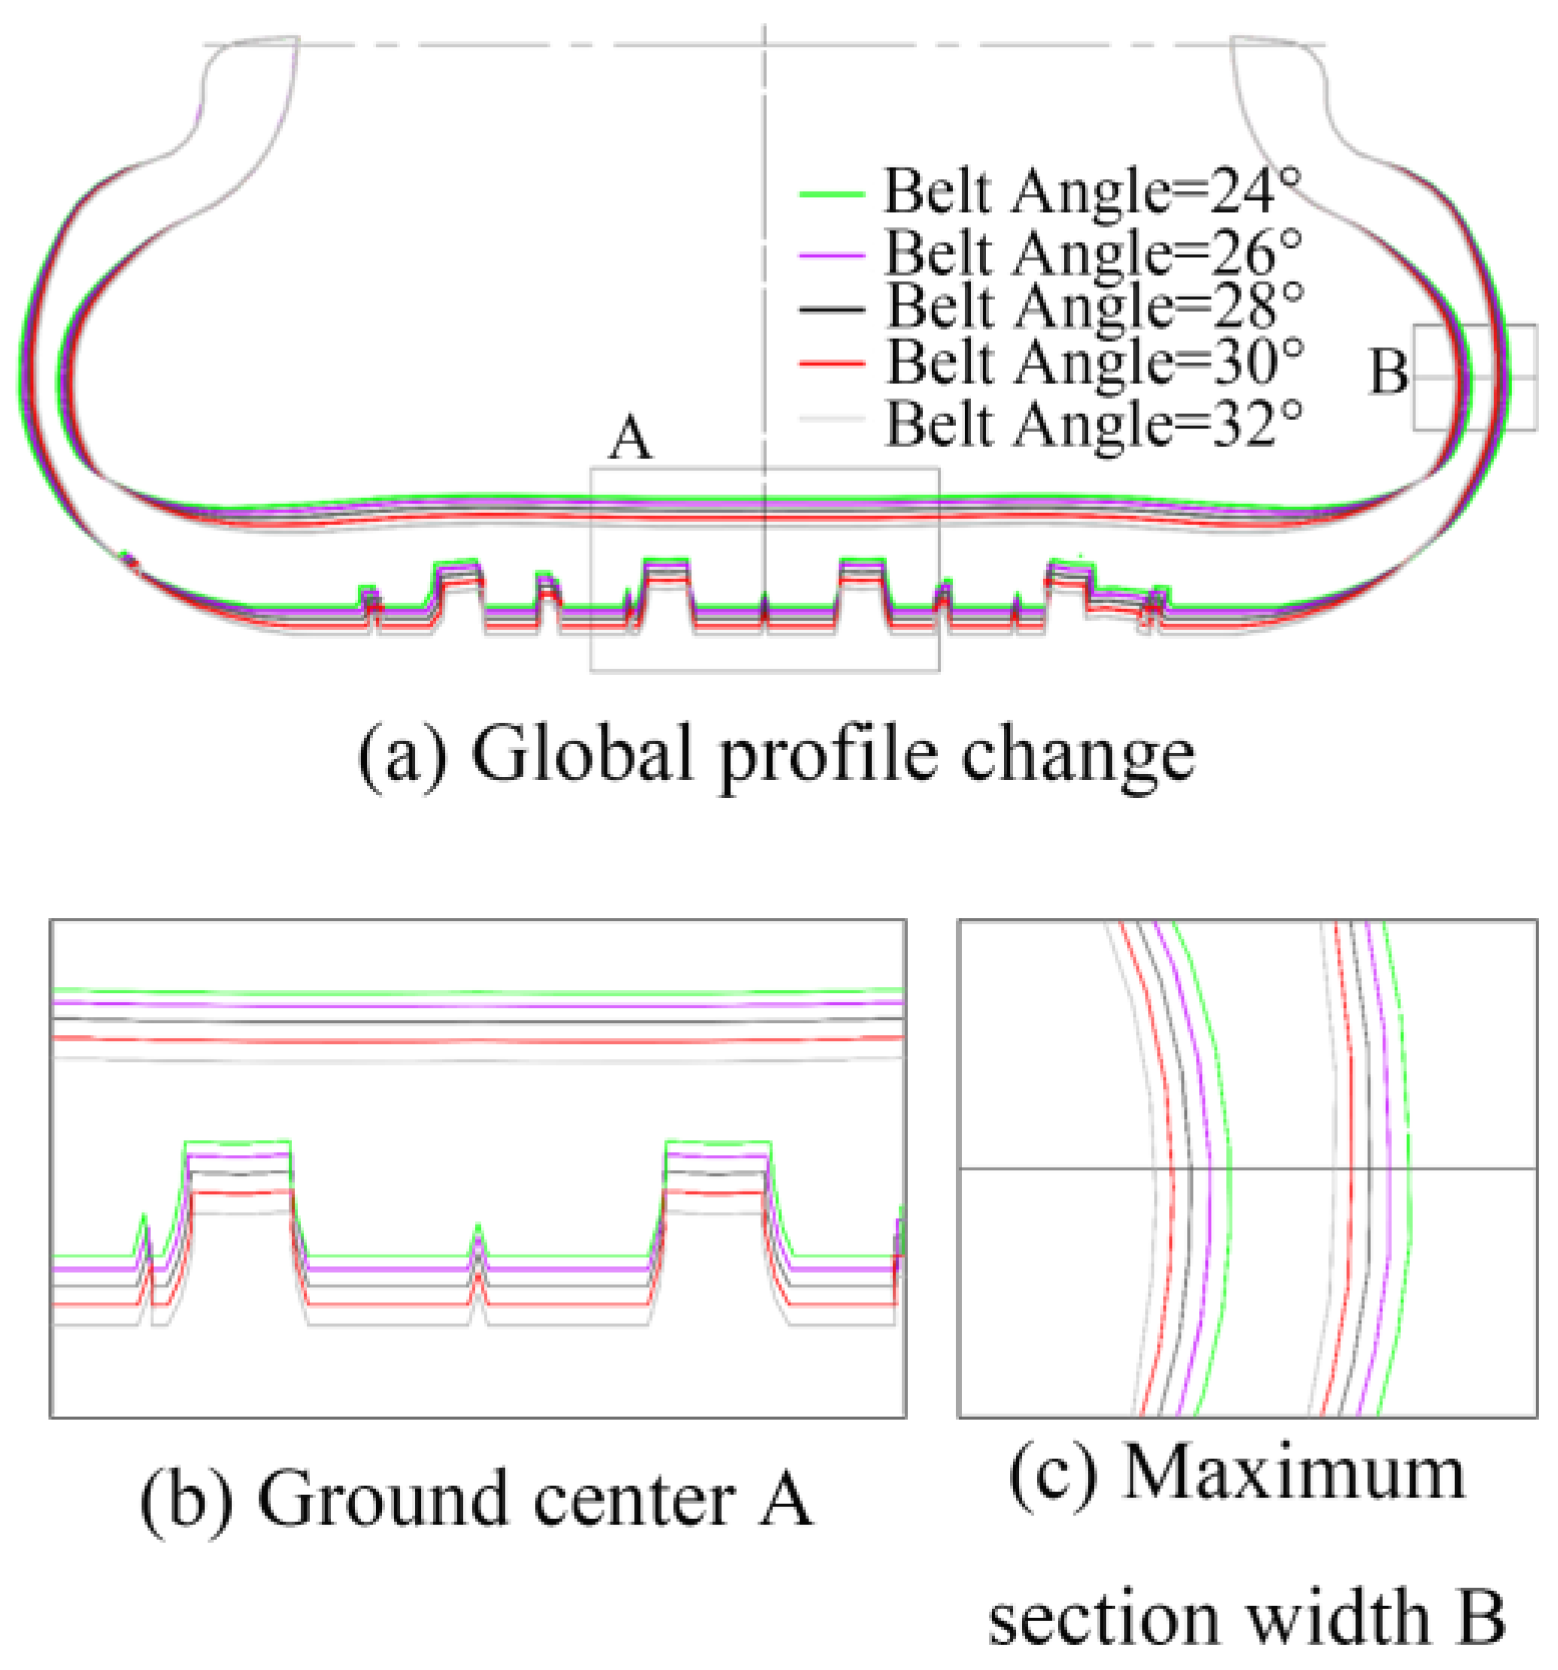
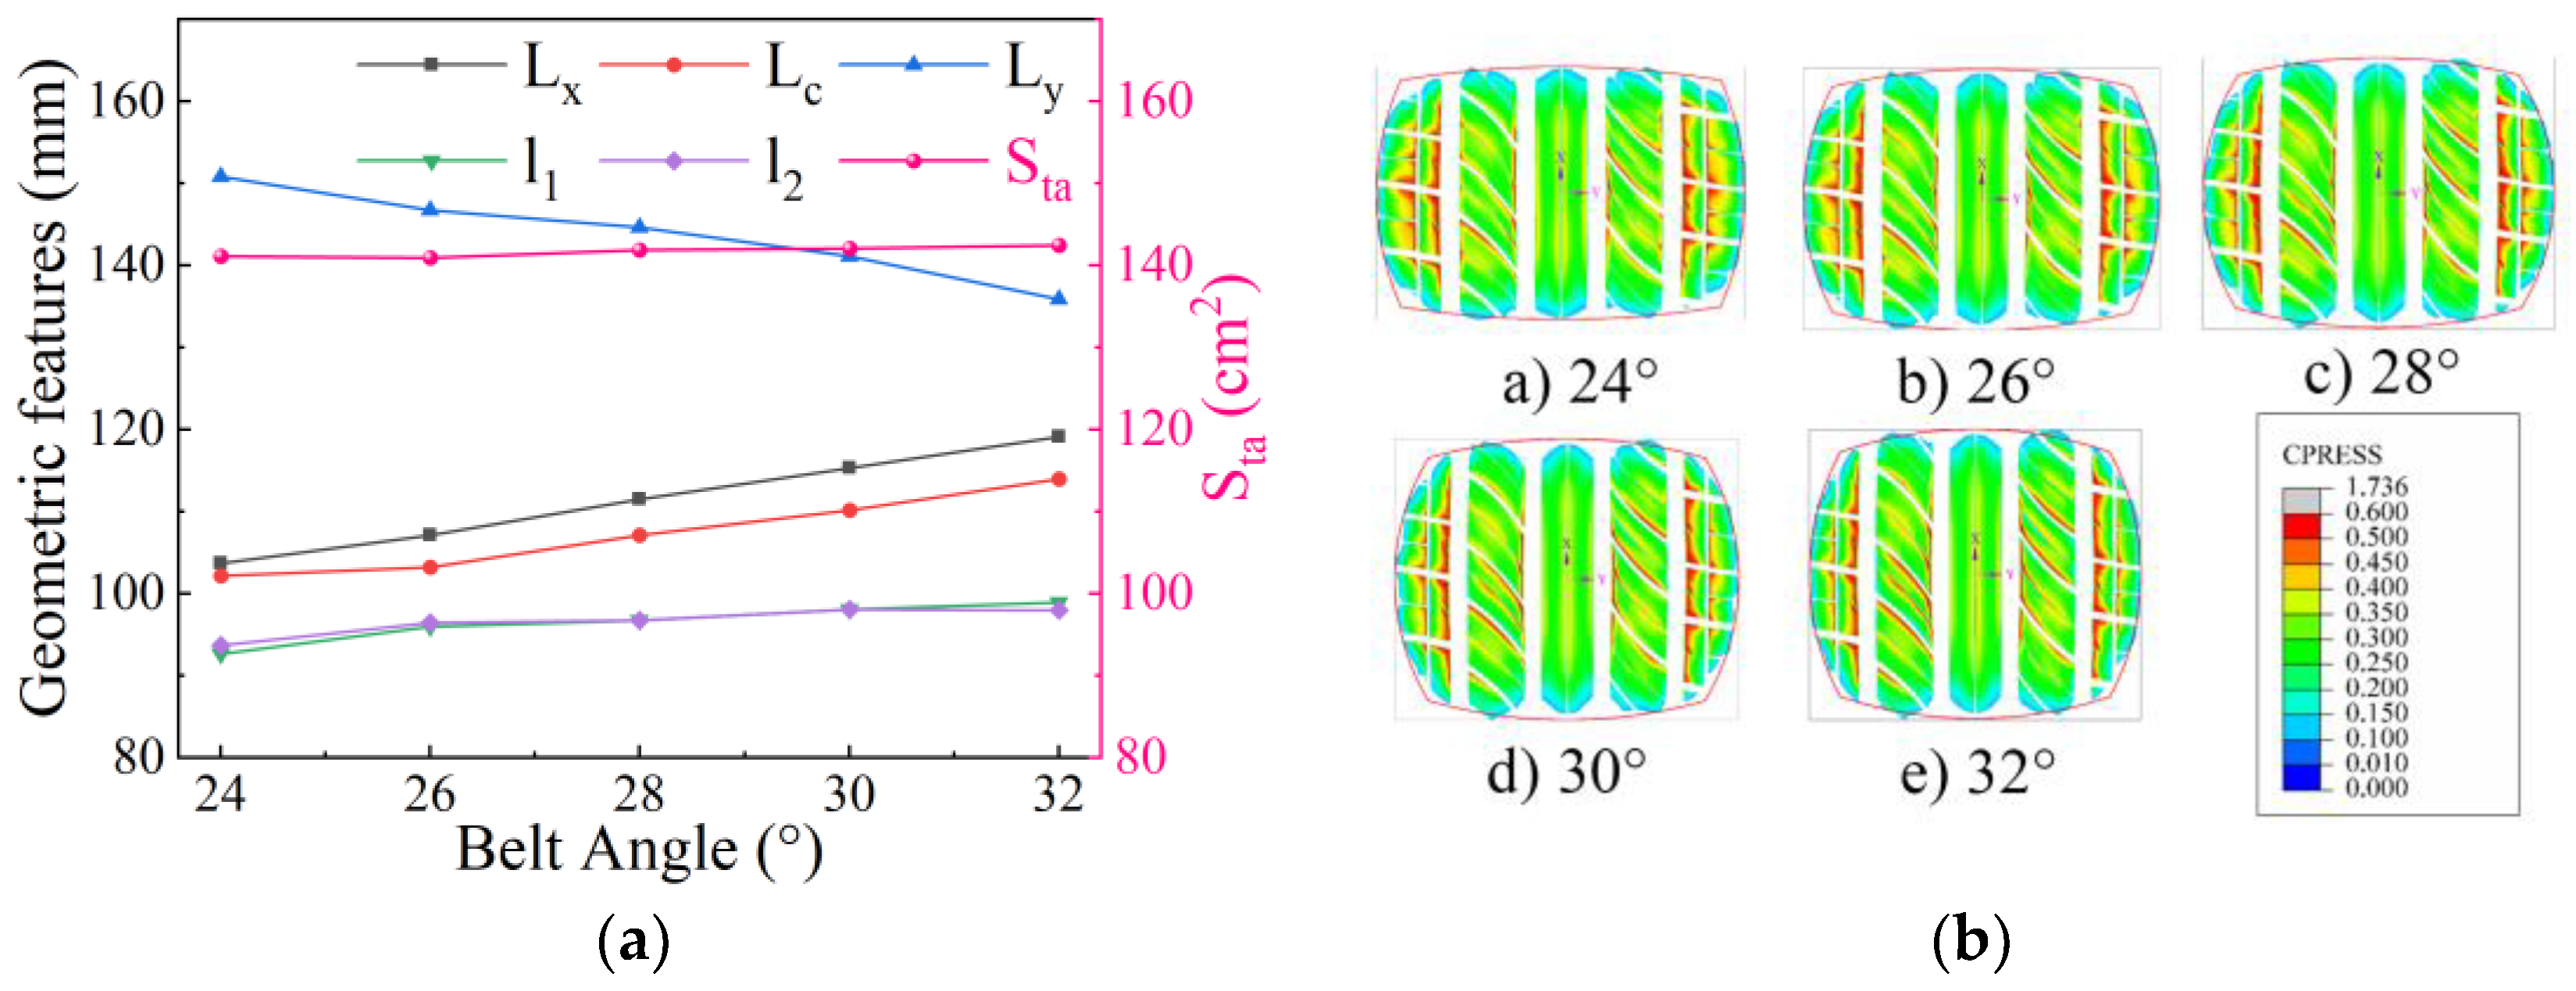
4.4.1. Influence of Belt Angle on Static Contact Characteristics

Under rated inflation pressure and radial load conditions, the tire outer profile was simulated by changing different belt layer angles. Figure 16 illustrates the changes in the tire contact profile, showing that under identical inflation pressure and radial load conditions, an increase in the belt angle reduces the circumferential tightening effect on the tire, improves the upper sidewall’s resistance to bending, establishes a force fulcrum at the shoulder, and induces crown bending. Specifically, the center radius of the crown decreases as the belt angle decreases, while the maximum section width increases slightly.
Figure 17a illustrates the variations in tire contact geometry parameters under different belt angles. As the belt angle increases, the contact long axis and contact area show significant growth. Combined with the static contact footprint depicted in Figure 17b, the tire contact geometry becomes more elliptical than rectangular, and the contact footprint geometry becomes more reasonable, contributing to improved ride comfort and enhanced tire–ground adhesion.

4.4.2. Influence of Belt Angle on Contact Characteristics of Free-Rolling Tires

The rolling speed was adjusted to 60 km/h. The tire’s outer profile under varying belt angles was simulated, with the resulting profile changes illustrated in Figure 18. This figure demonstrates that, under constant inflation pressure and radial loading, the loaded dynamic radius increases proportionally with the belt angle, while the maximum section width decreases inversely, which aligns with the belt configuration’s effects on static contact characteristics.
Figure 19a shows the ground contact geometry parameters of a free-rolling tire at different belt angles. Combined with the ground contact pressure cloud diagram in Figure 19b, it is clear that as the belt angle increases, the ground contact shape tends to be circular. This differential area shift (shoulder contact patch recession exceeding central block expansion) induces an effective footprint reduction, causing rolling-induced stress intensification at the tread groove margins that surpasses static conditions, which amplifies the belt reinforcement’s circumferential constriction effects on interfacial geometry and pressure fields.

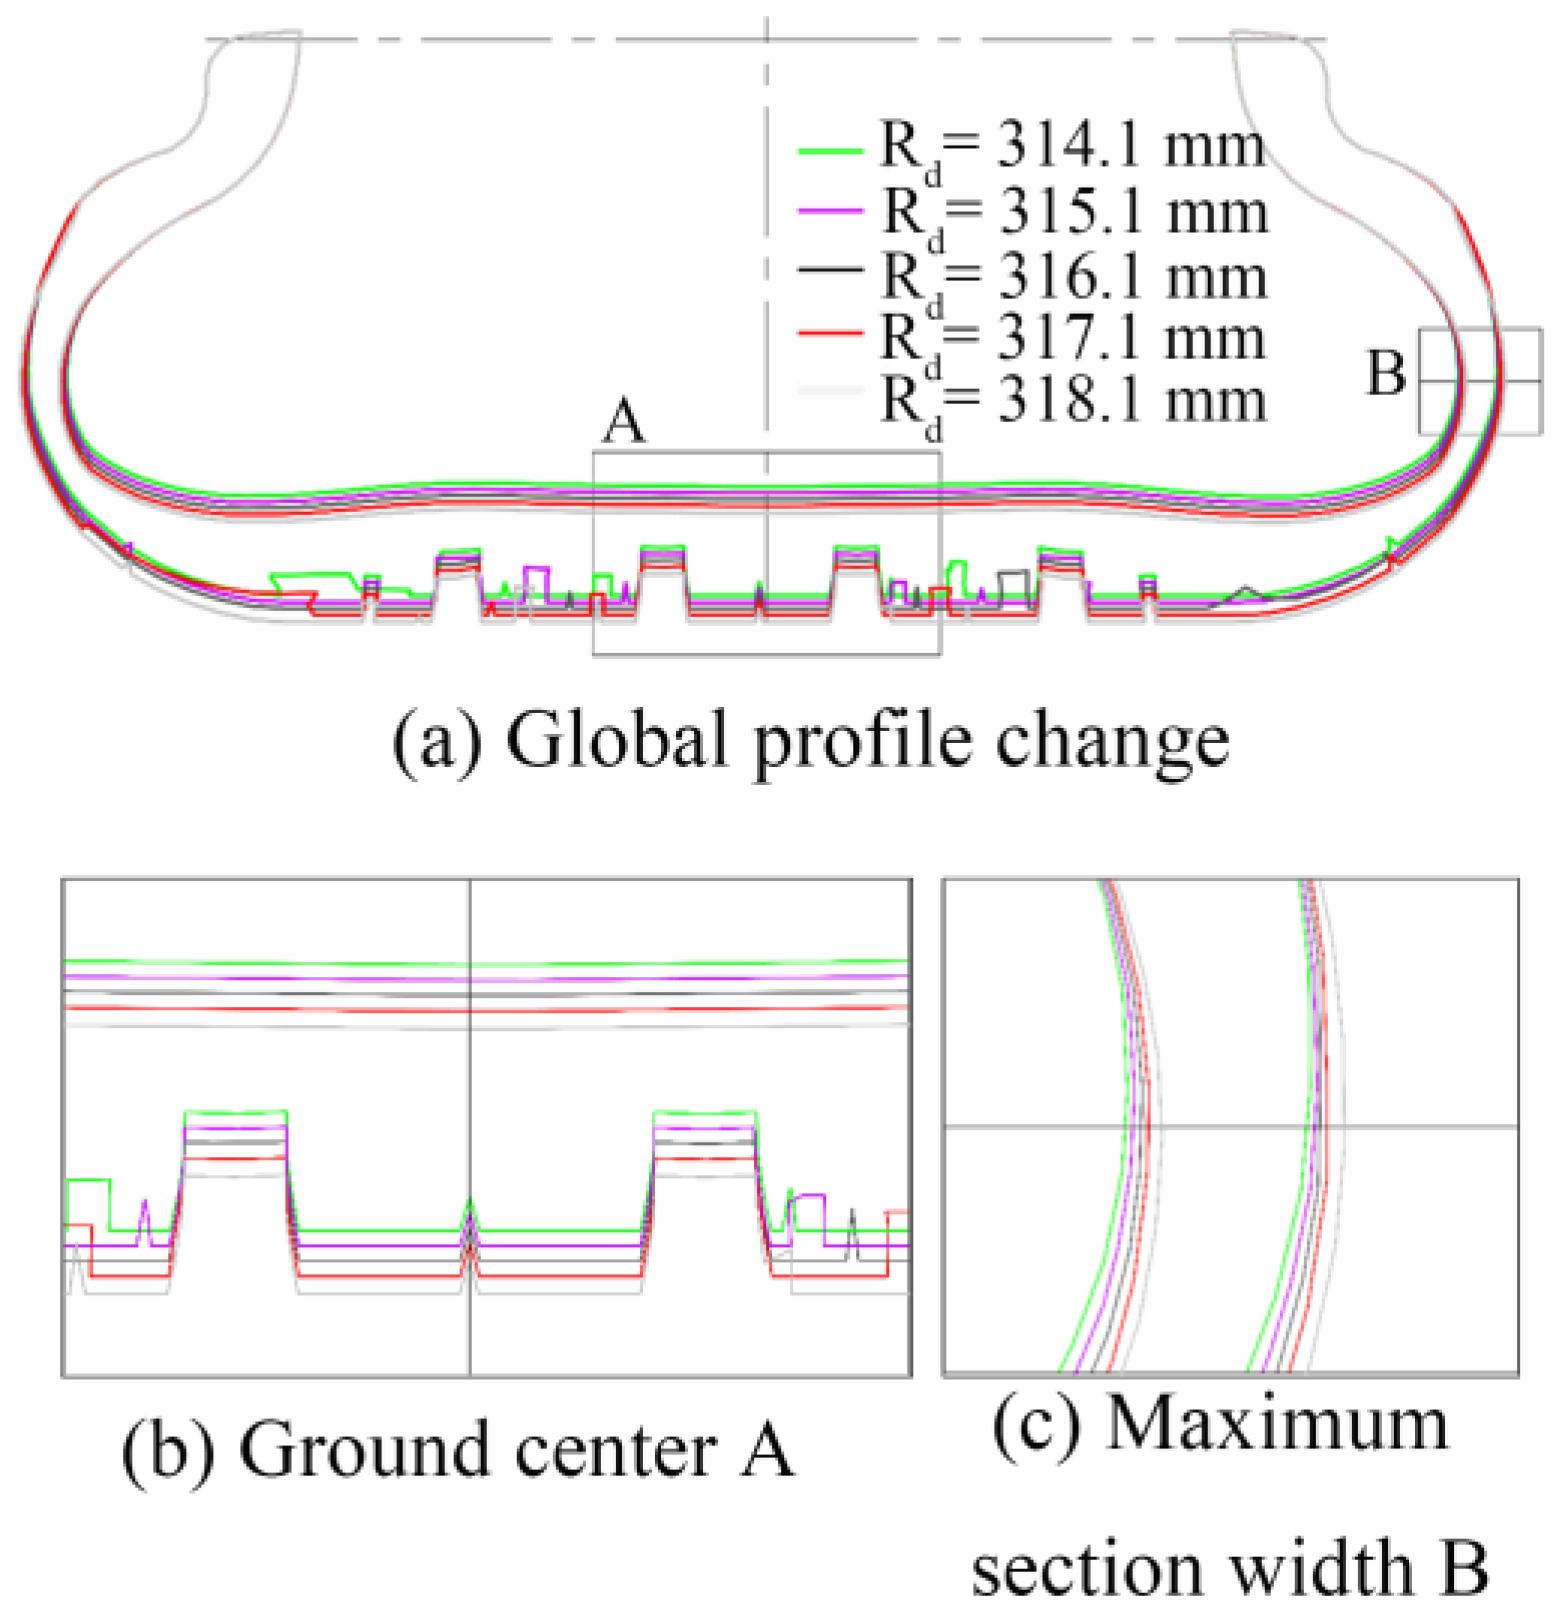
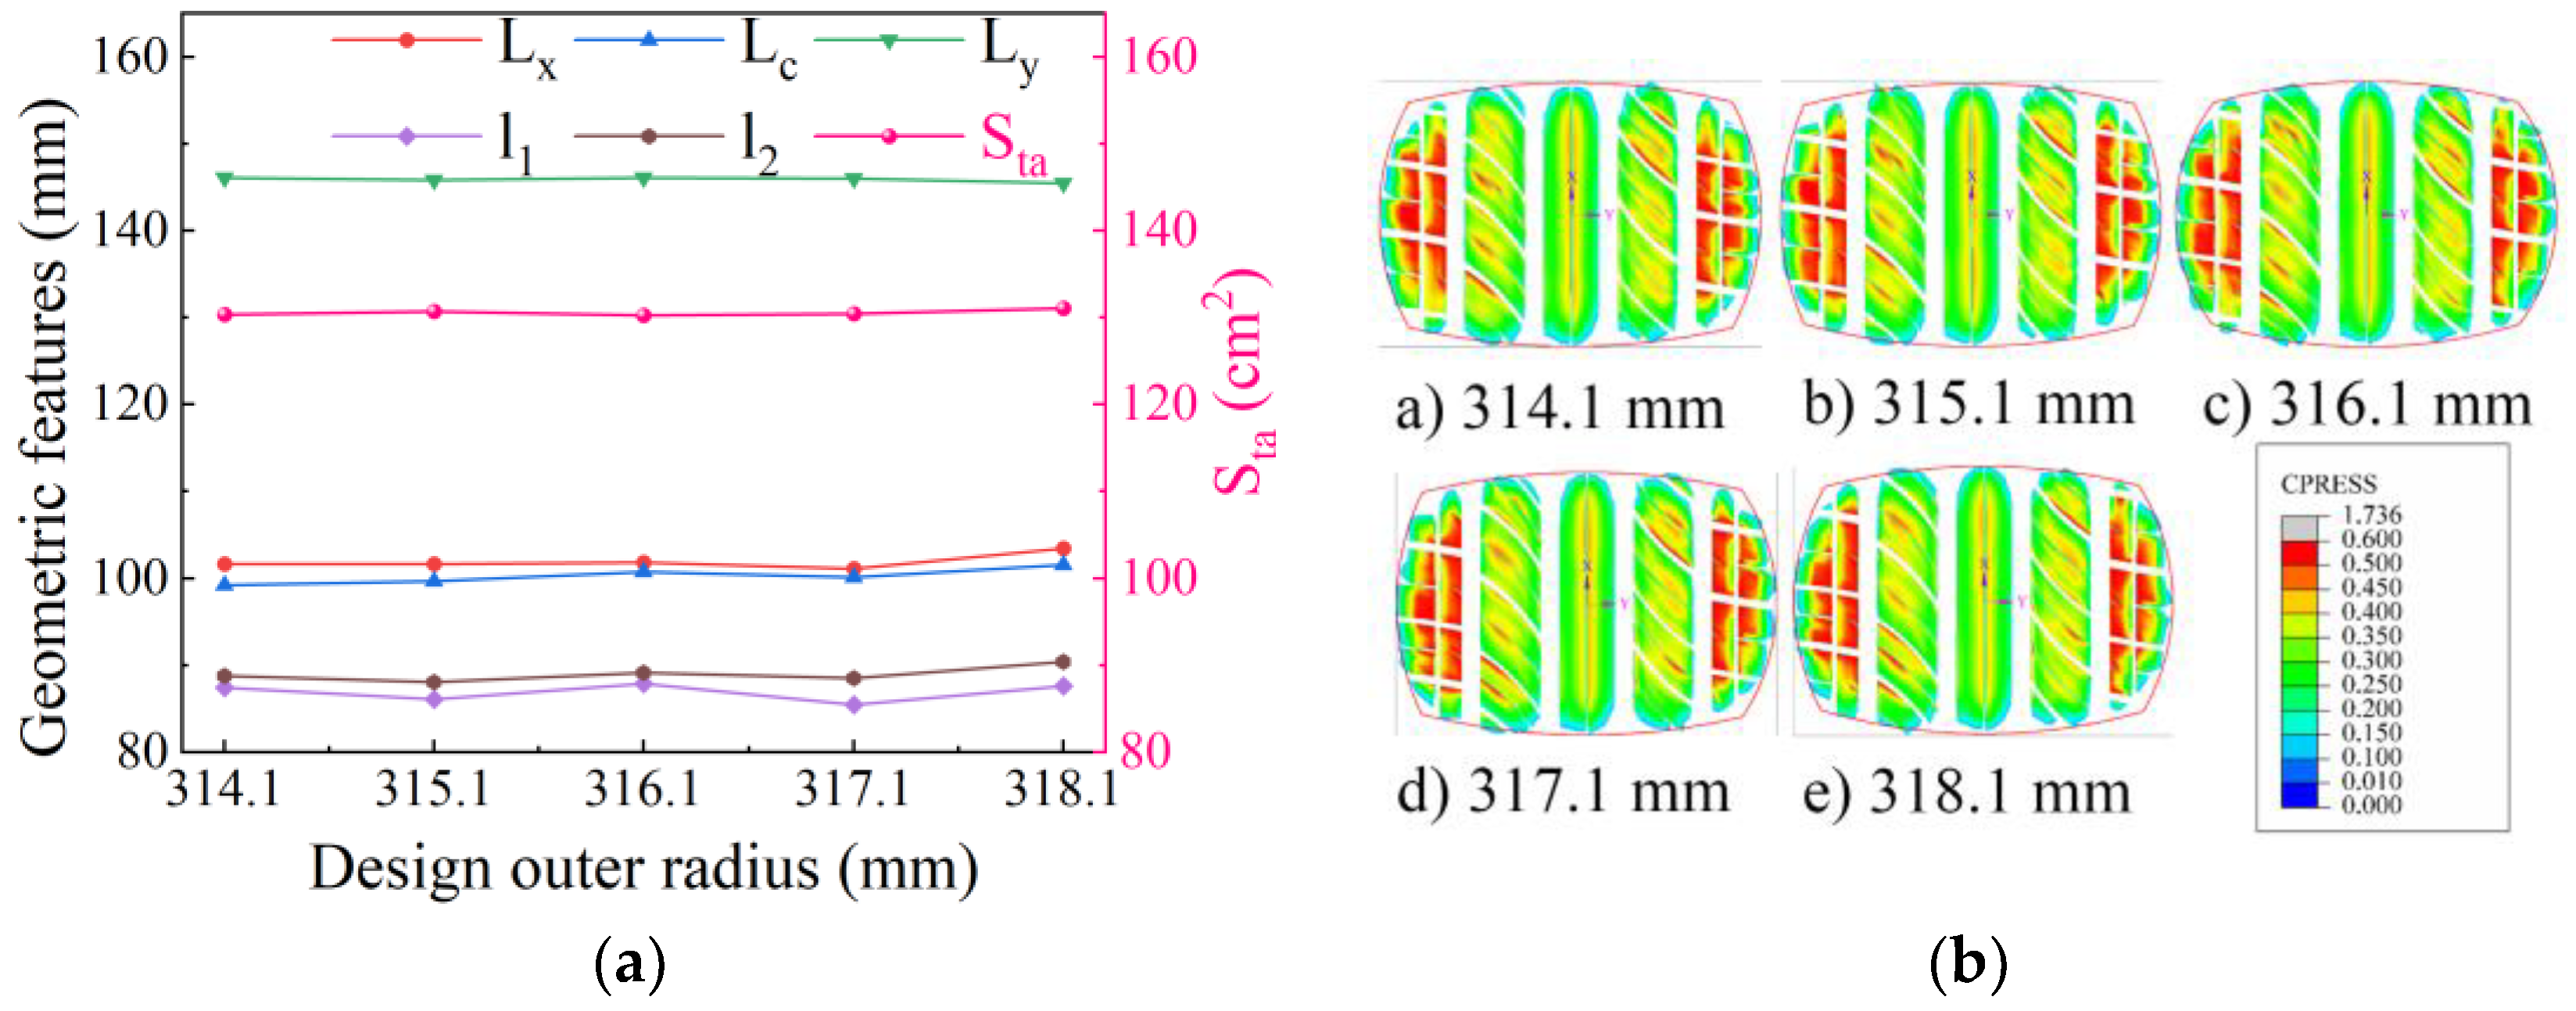
4.5. Design Outer Radius

4.5.1. Influence of Design Outer Radius on Static Contact Characteristics

The simulation parameters were configured with 220 kPa inflation pressure and 3200 N radial load. Subsequent analyses evaluated the outer contour and contact footprint variations across the modified design outer radii of the tire. As depicted in Figure 20, the influence of the tire design outer radius (Rd) on the static ground contact profile reveals that an increase in Rd leads to progressive growth in the maximum section width and a simultaneous reduction in the curvature radius of the upper-sidewall inner contour. Concurrently, it is evident that increasing Rd minimally affects lower sidewall deformation, but significantly influences the crown region above the maximum section width. This provides the theoretical foundation for optimizing vehicle handling stability and driving economy through outer radius adjustments during tire design.
Figure 21 displays the corresponding contact geometry parameters and pressure distribution for when the design outer radius of the tire was altered. It can be seen that minor adjustments to the outer radius exert minimal influence on the contact patch shape and pressure distribution. Stress concentrations remain primarily localized at the shoulder tread pattern groove.

4.5.2. Influence of Design Outer Radius on Contact Characteristics of Free-Rolling Tires

A free-rolling velocity of 60 km/h was applied under nominal inflation pressure and radial load conditions, the design outer radius of the tire was changed, and the outer contour and contact footprint of the tire in the free-rolling state were simulated. Figure 22 shows the effect of changing the design outer radius on the tire contact profile in the free-rolling condition. It can be seen that an increase in the load dynamic radius and maximum section width is positively correlated with the design outer radius, exhibiting a trend consistent with the variation in static contact characteristics.
Figure 23a illustrates the influence of varying design outer radii on the geometric parameters of a free-rolling tire’s ground contact. Analysis of the tire–ground contact pressure distribution in Figure 23b reveals that, relative to static ground contact characteristics, the left–right asymmetry in shoulder contact length becomes more pronounced during rolling conditions, with a significant increase in ground contact pressure on the right side of the imprint. This phenomenon, coupled with a reduction in the effective ground contact area, results in increased stress concentration at the edge of the pattern groove.

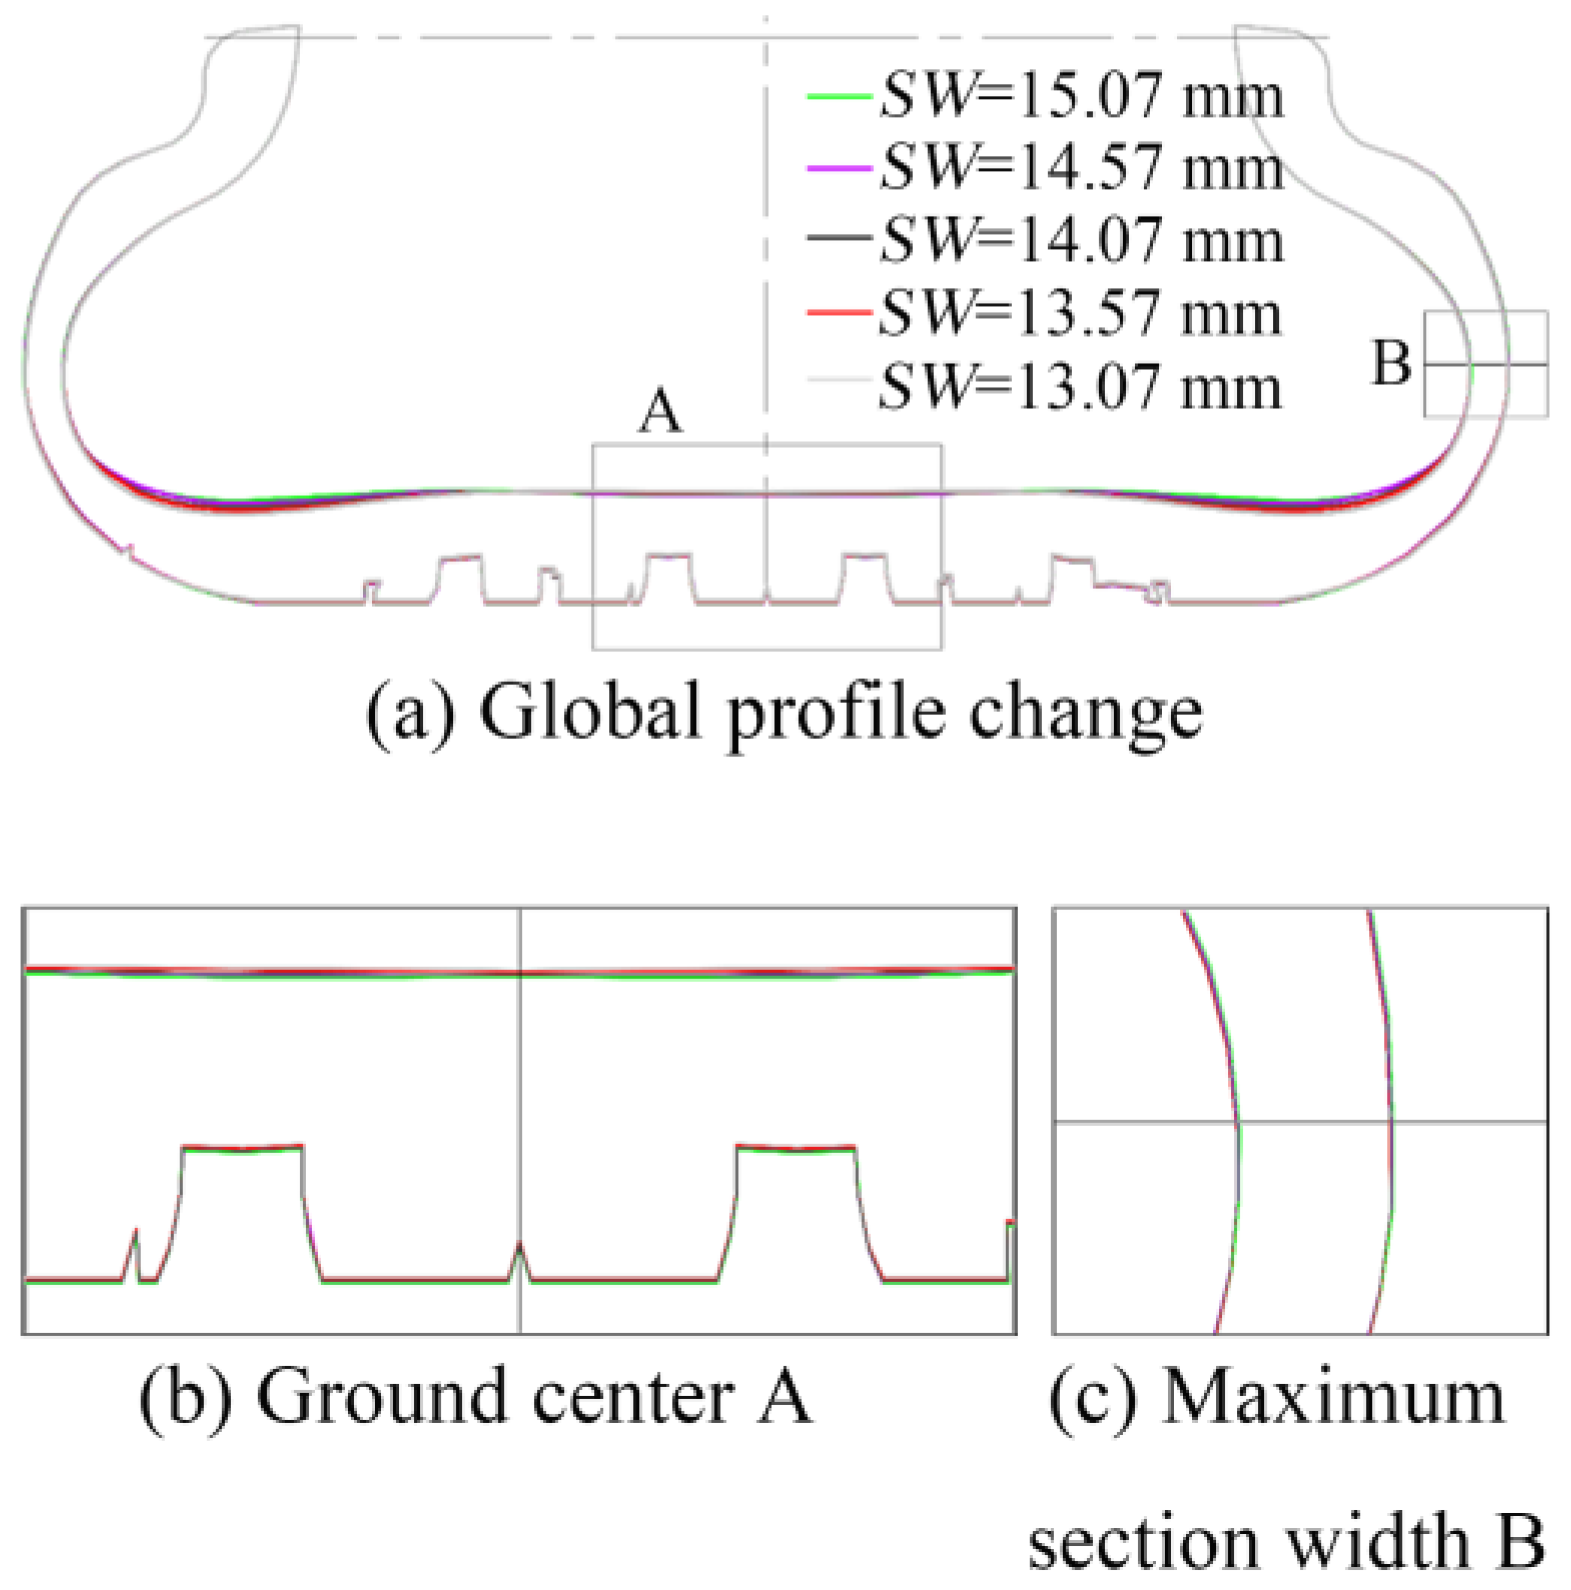
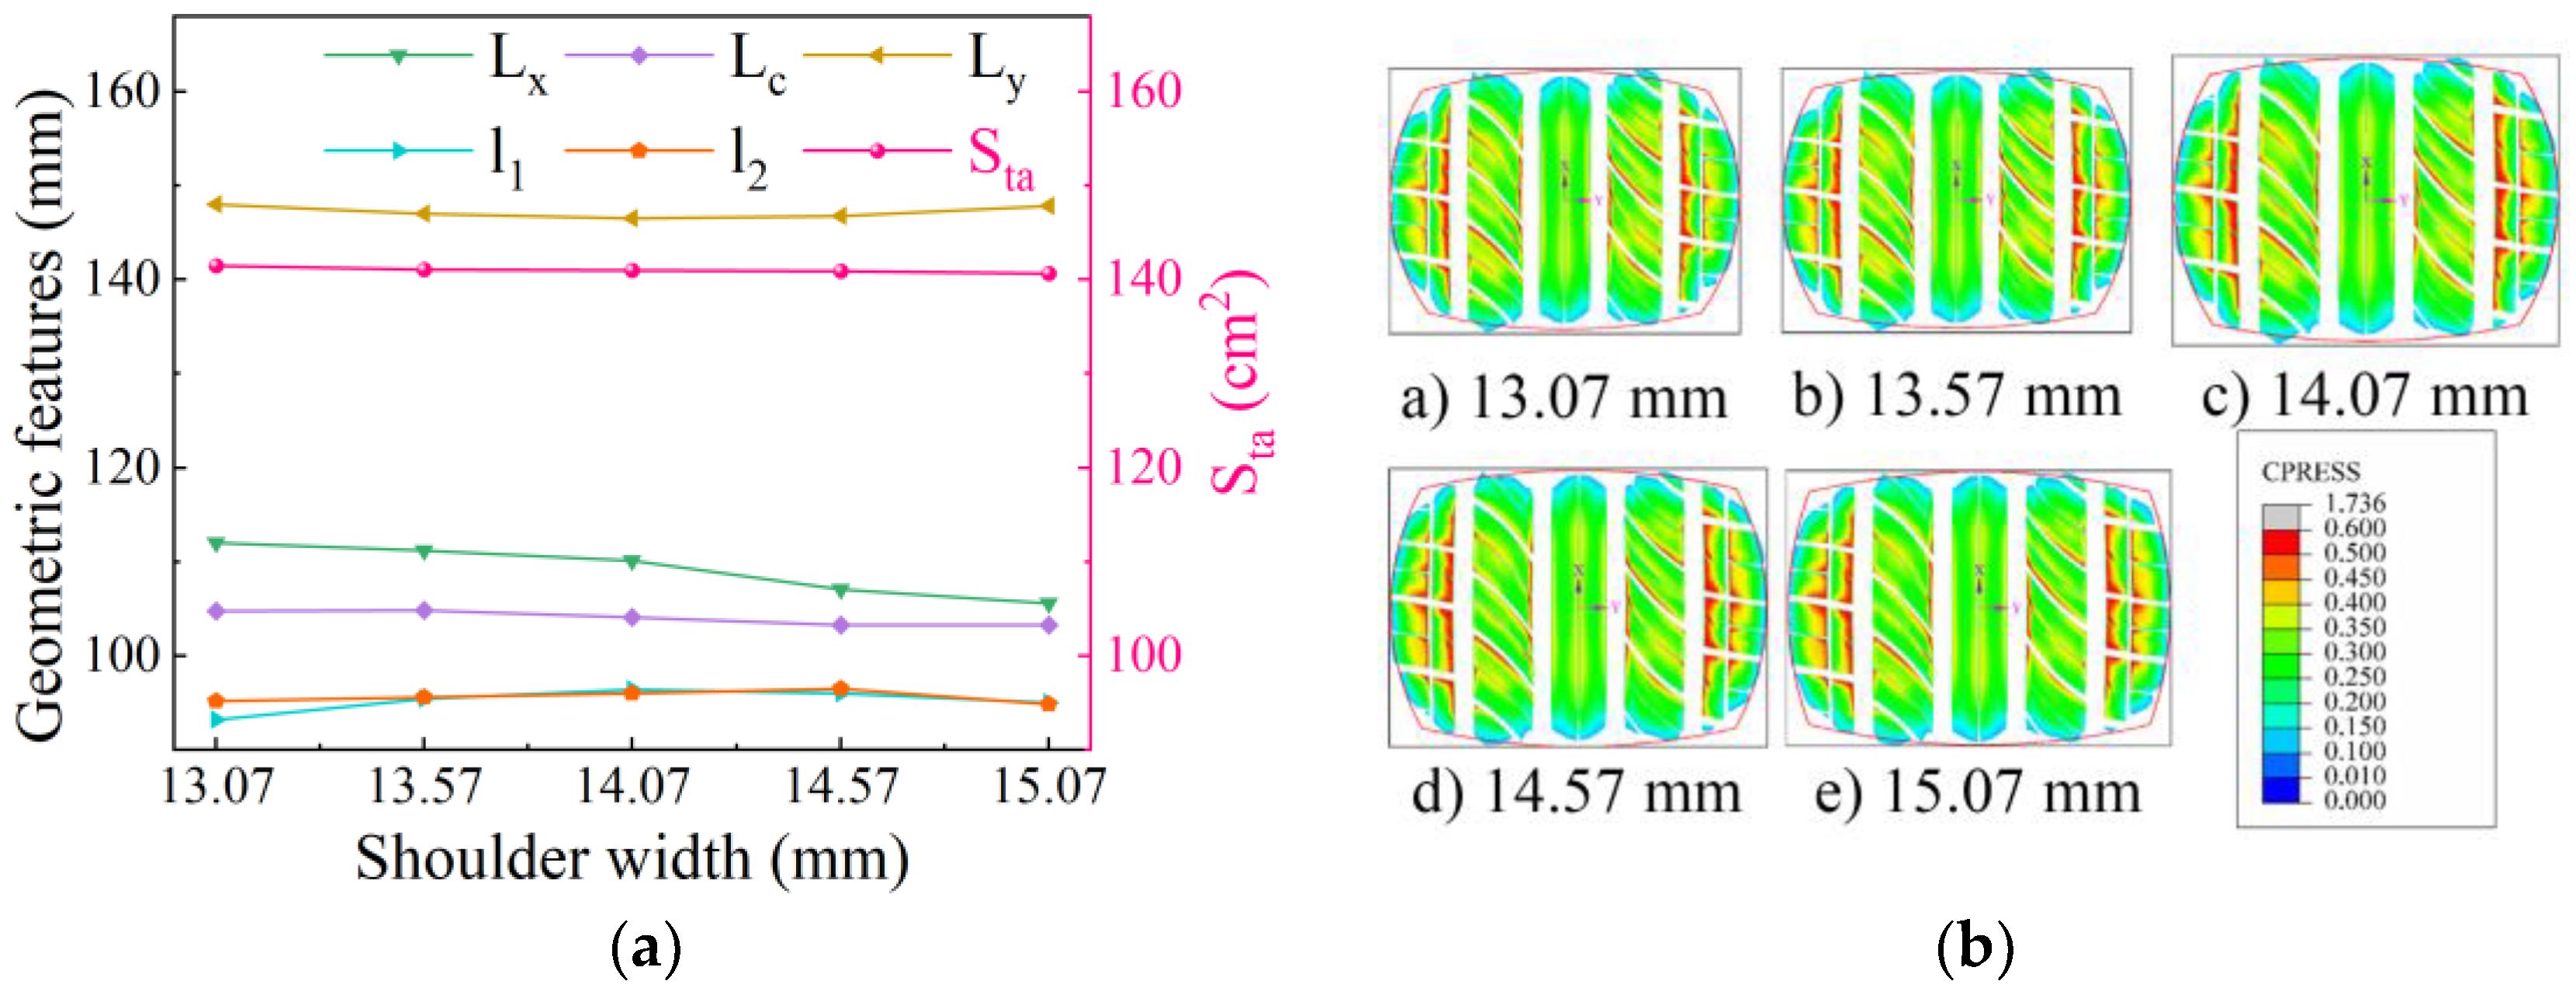
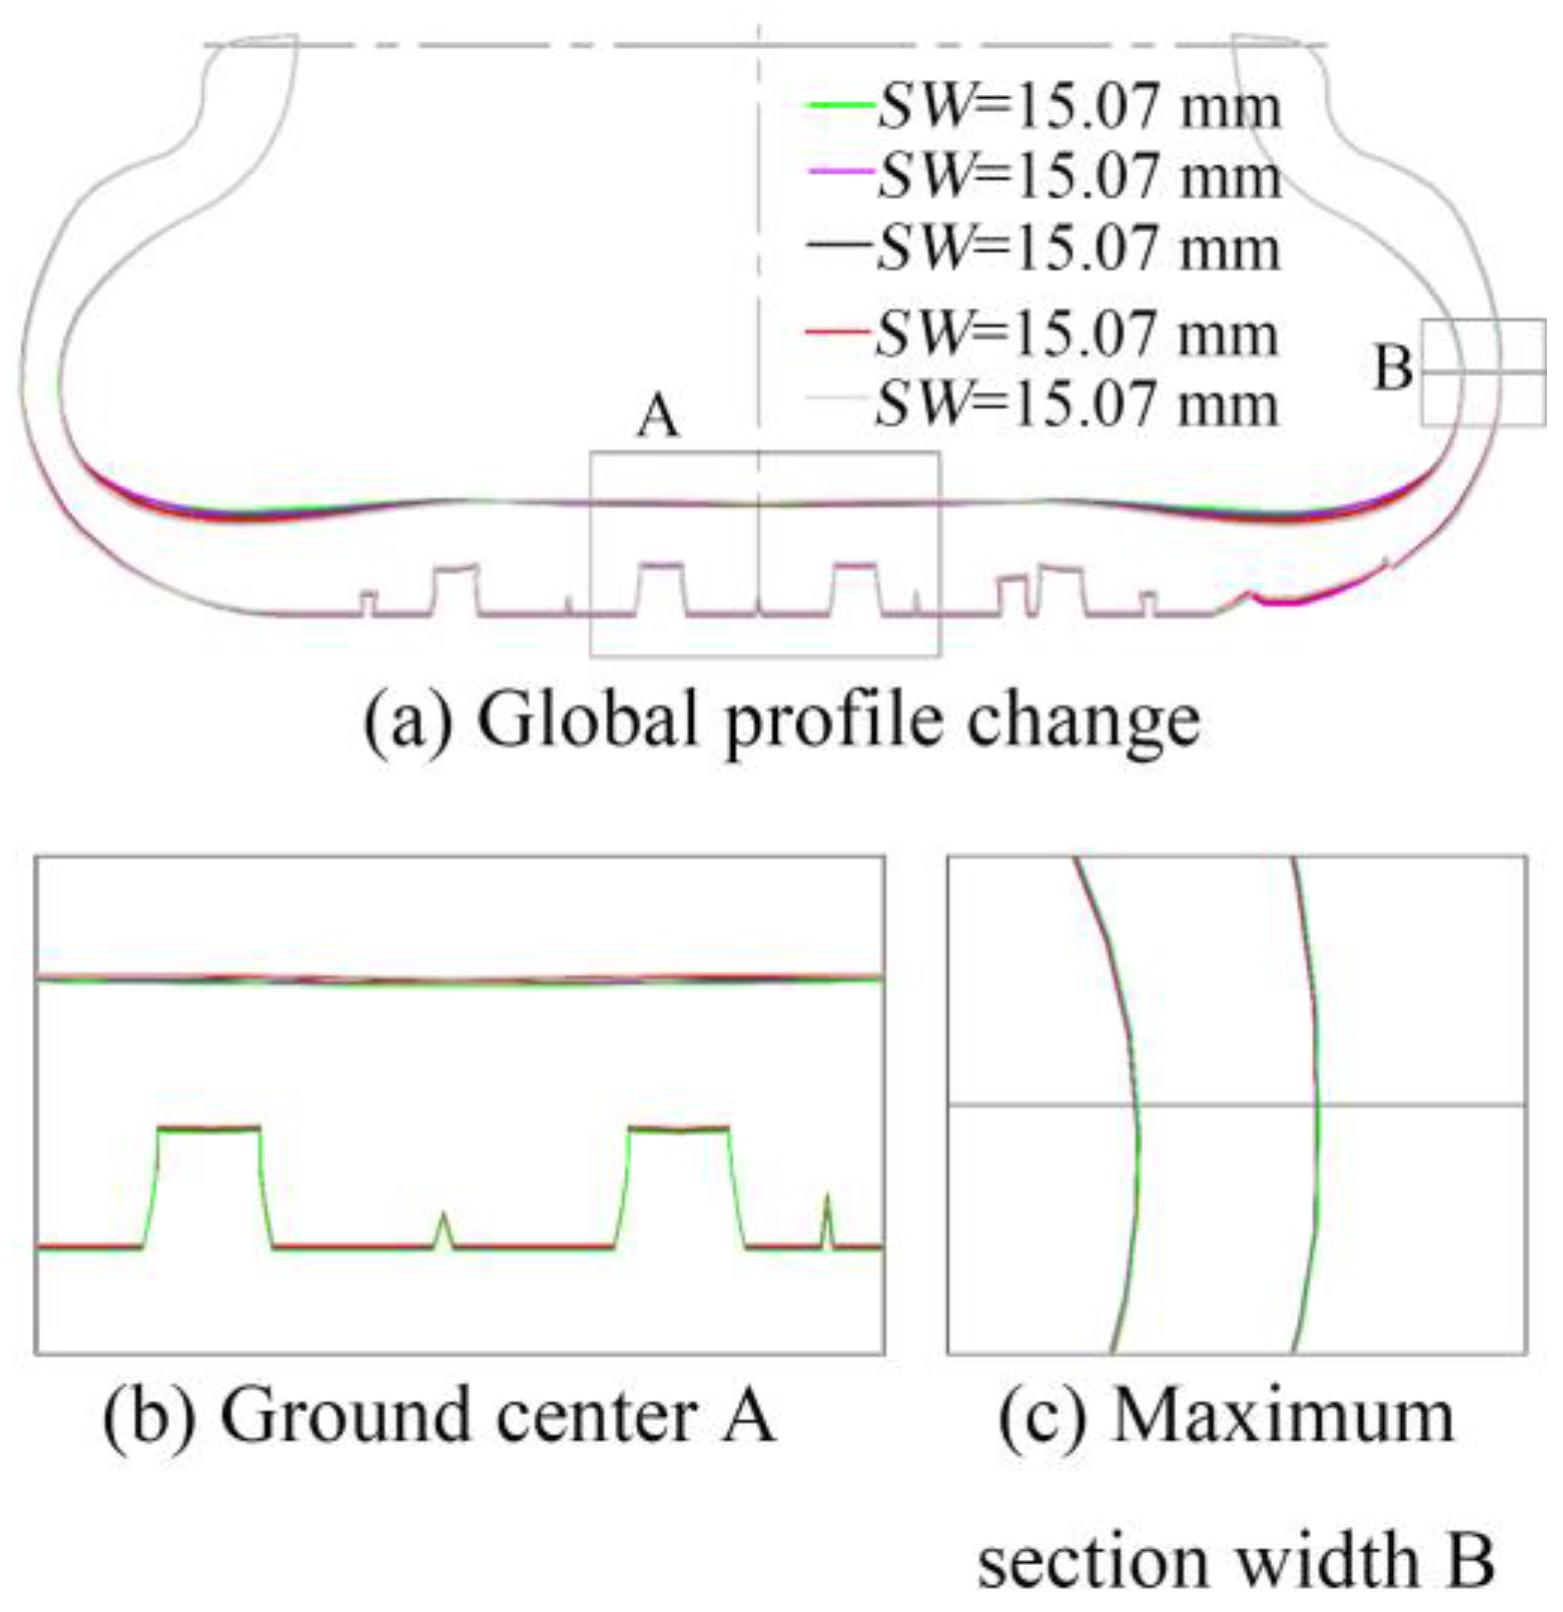
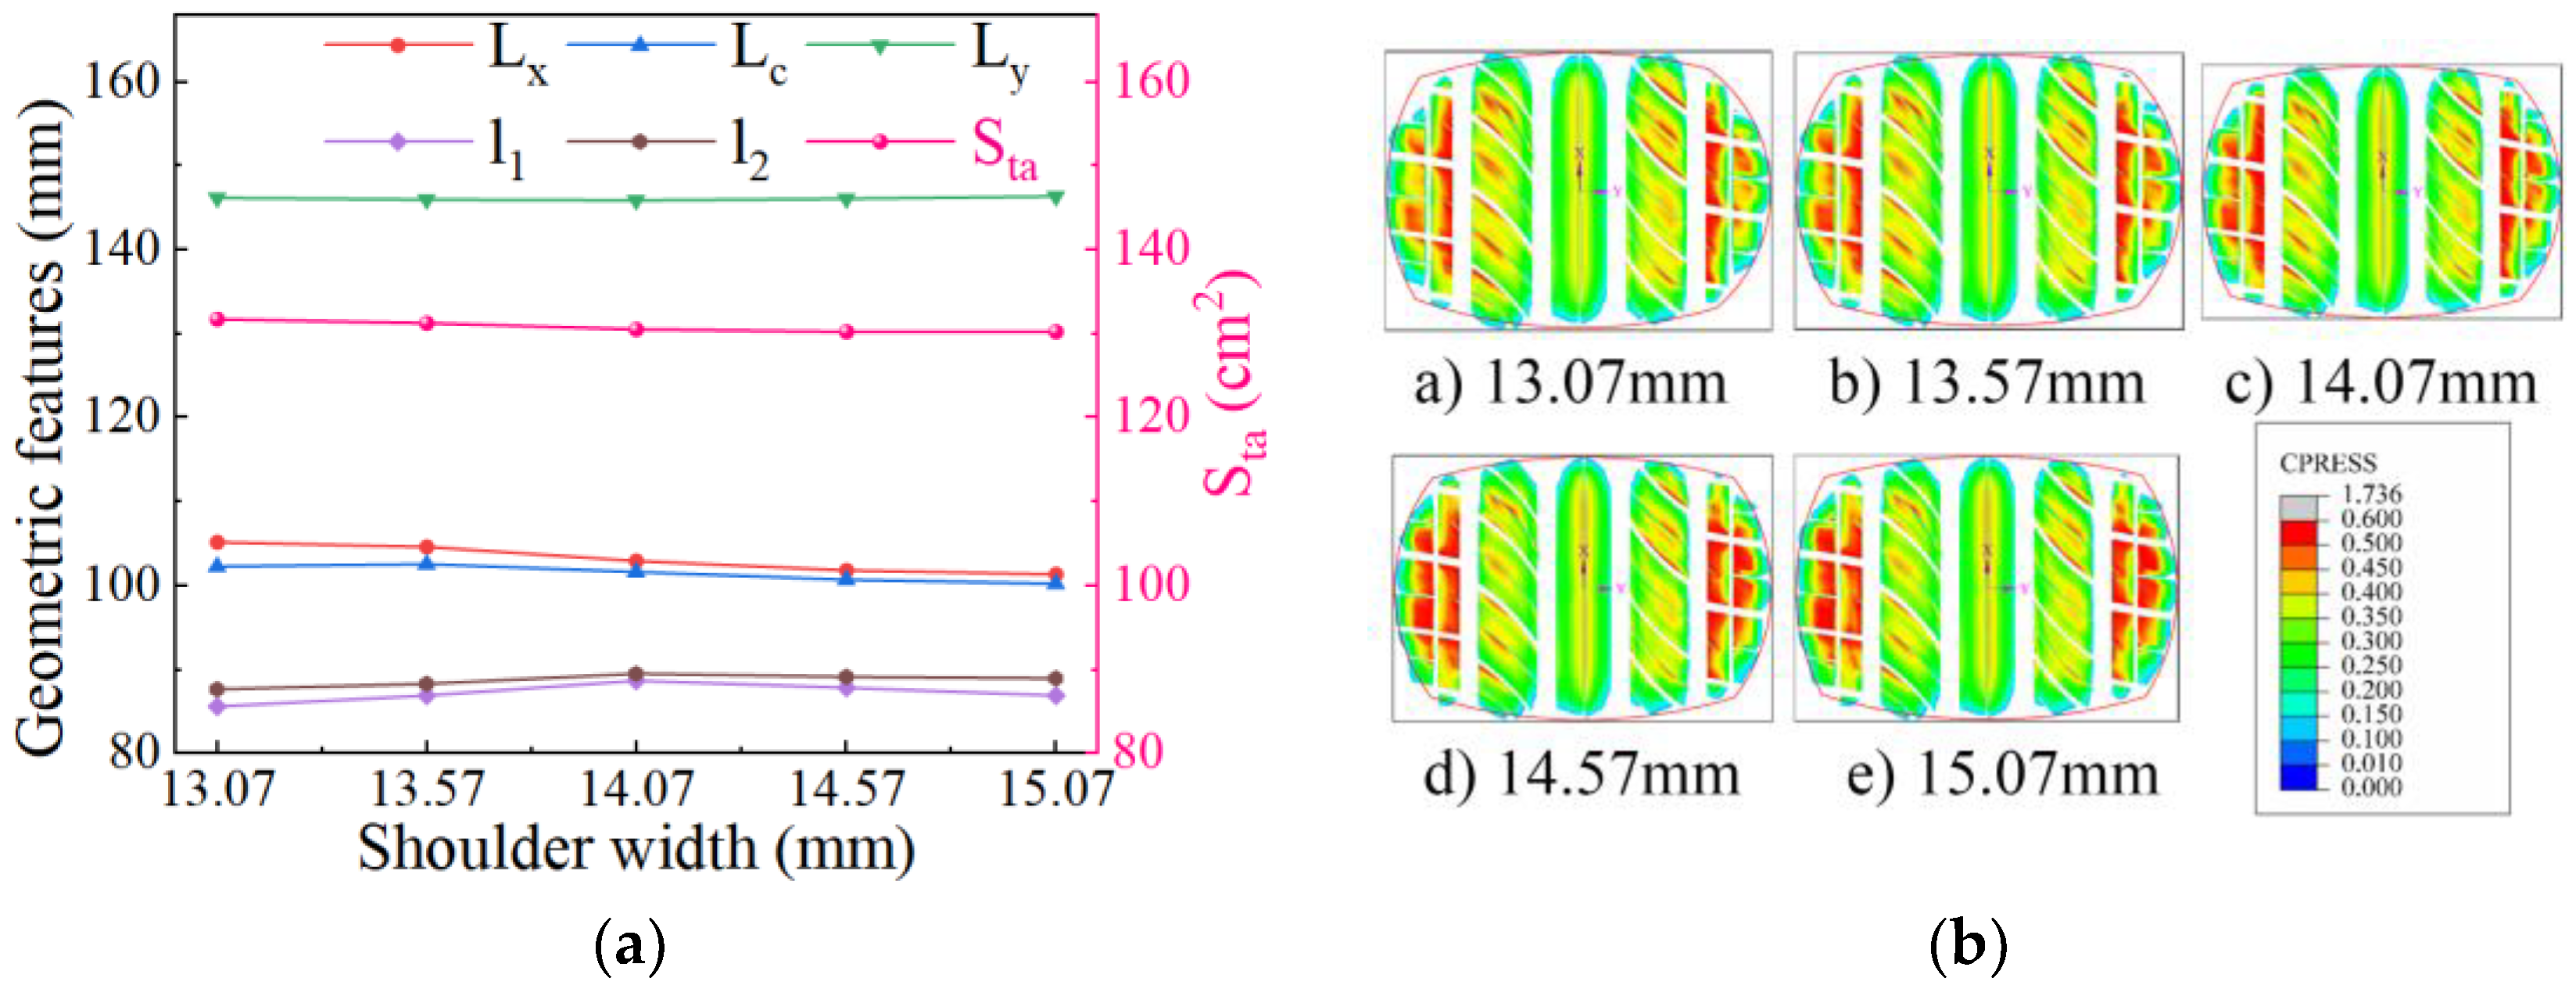
4.6. Shoulder Thickness

4.6.1. Influence of Shoulder Thickness on Static Contact Characteristics

The impact of varying tire shoulder thicknesses on the static ground profile under rated inflation pressure and radial load conditions is depicted in Figure 24. It is evident that the adjustment of the shoulder design thickness at 85% of the tire tread width has little effect on the ground contact outer radius and the maximum section width. However, shoulder thickness augmentation elevates shoulder profile curvature radii while expanding upper-sidewall clearances, generating elevated compressive stress concentrations in shoulder lug components.
Under different shoulder thicknesses, the static ground contact outer contour parameter change diagram, contact footprint, and pressure distribution of the tire are displayed in Figure 25. It can be seen that the axle load borne by the crown part increases, and warping occurs with the middle tread block on the left and right shoulders as the fulcrum, which intensifies the compression of the tire shoulder rubber material. Subsequent to marginal interfacial area variation, central crown contact pressure exhibits phased attenuation after initial escalation, effectively mitigating central tread block abrasion.

4.6.2. Influence of Shoulder Thickness on Contact Characteristics of Free-Rolling Tires

Under a free-rolling condition of 60 km/h, Figure 26 presents the variations in the overall tire profile resulting from adjustments to the shoulder design thickness at 85% of the tread width. The figure demonstrates that adjusting the tire shoulder design thickness at 85% of the tire’s tread width induces consistent alterations in the static contact contour, mirroring the trend observed in static contact characteristics.
The tire contact outer contour parameter variation, contact footprint, and pressure distribution diagram in the free-rolling state are displayed in Figure 27. Figure 27a shows that the asymmetry of the shoulder tread block contact length increases under free-rolling conditions relative to static contact characteristics. Similarly, Figure 27b indicates that, compared to the static contact condition, lateral contact pressures within the tread contact patch exhibit an upward trend with increasing shoulder thickness.

5. Conclusions

A novel methodology integrating 3D carcass refined modeling and complex tread pattern reverse reconstruction was developed. Using a 205/50R17 ultra-high-performance tire with multi-directional tread patterns as the research object, this approach established a high-fidelity finite element model for complex-patterned tires. The reliability of the numerical simulation model was validated through contour scanning tests and free-rolling tests. The following conclusions were obtained by analyzing the changes in tire contact outer contour, contact footprint, and pressure distribution under different operating conditions and design parameters.
(1)
Elevated inflation pressure systematically induces three static effects: crown curvature expansion, contact area linear contraction, and groove-wall stress concentration peaks. Concurrently in free rolling, pressure amplification exacerbates contact stress heterogeneity, ultimately inducing accelerated localized fatigue wear cyclic deterioration.
(2)
The radial load is positively correlated with the maximum section width and deformation of the lower tire sidewall, but negatively correlated with the ground contact radius. As the radial load increases, the ground contact shape progressively transforms from an elliptical shape to a rectangular form, and the asymmetry of the ground contact pressure distribution increases; the ground contact pressure of the shoulder pattern block increases more than that of the middle pattern block, and finally forms a saddle shape with high shoulders and a low middle.
(3)
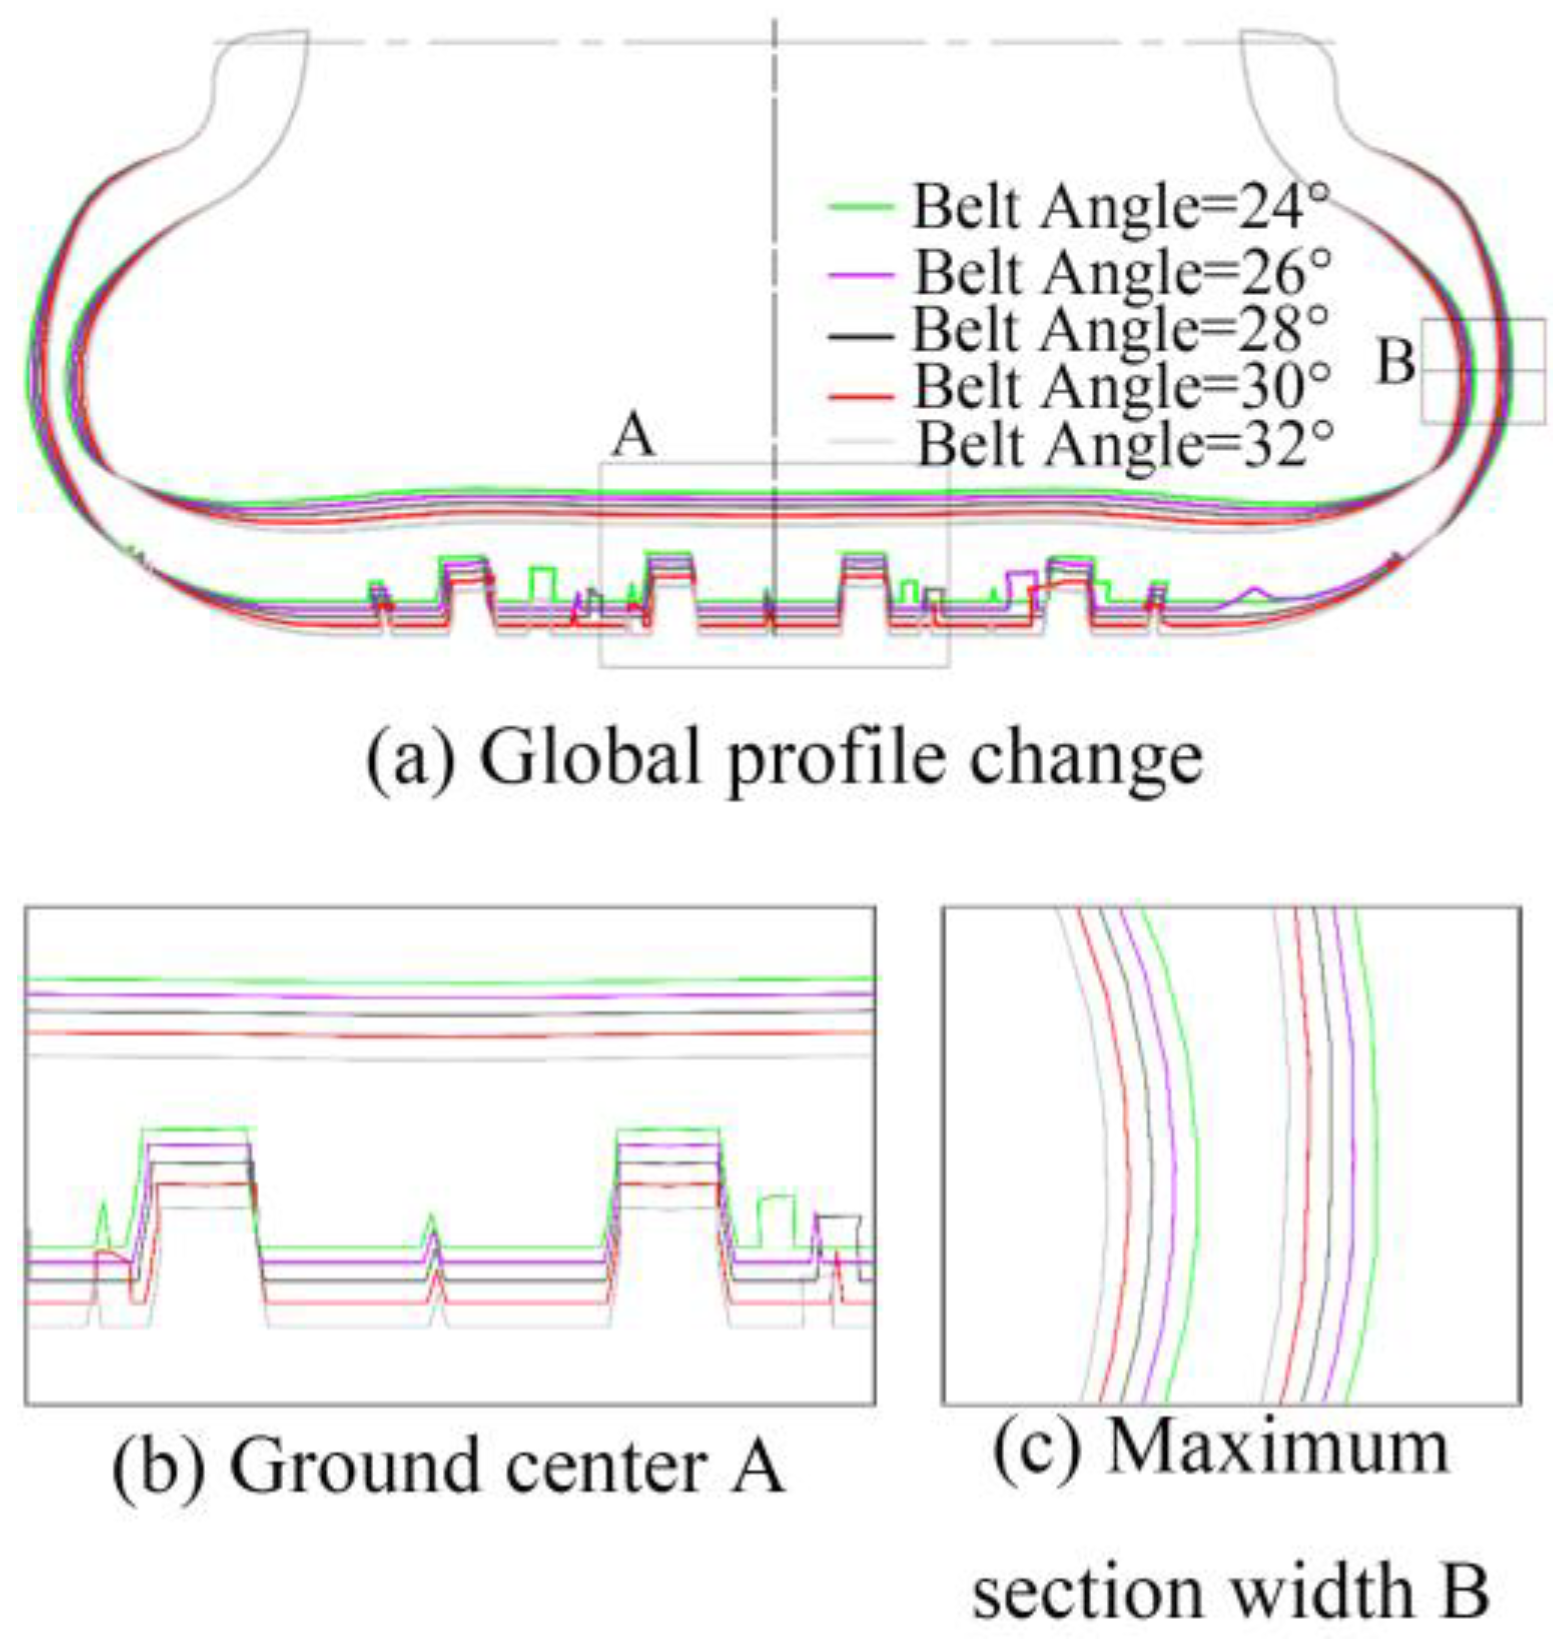
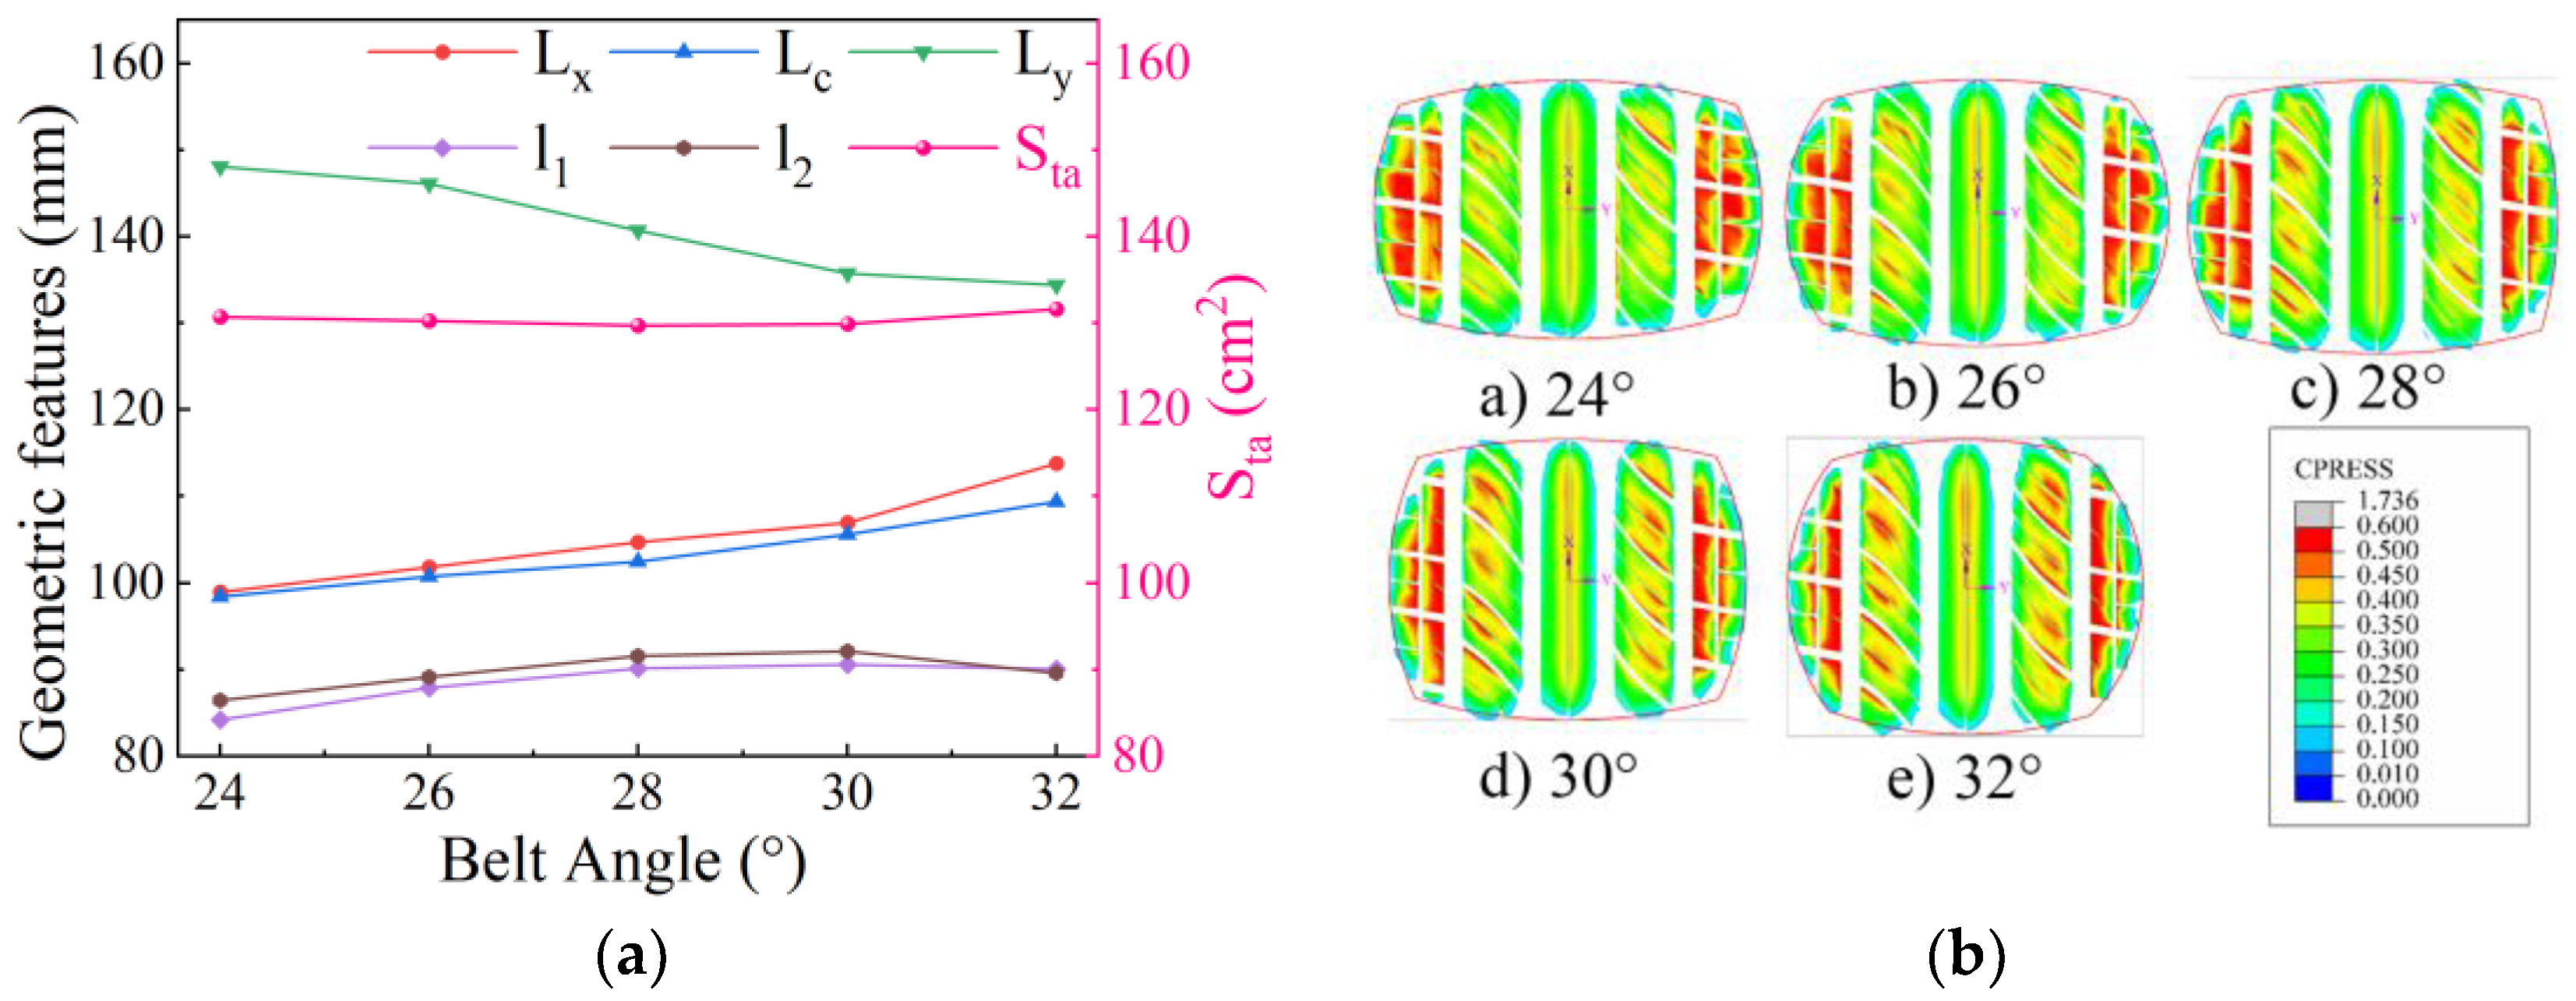
Under fixed operating conditions, an increase in the belt angle weakens the belt’s reinforcing effect on the tire, while the bending effect of the upper sidewall intensifies, leading to crown buckling under bending stress. Compared to static contact characteristics, the tire’s effective ground contact area decreases in the rolling state, causing stress concentration at the tread groove edges.
(4)
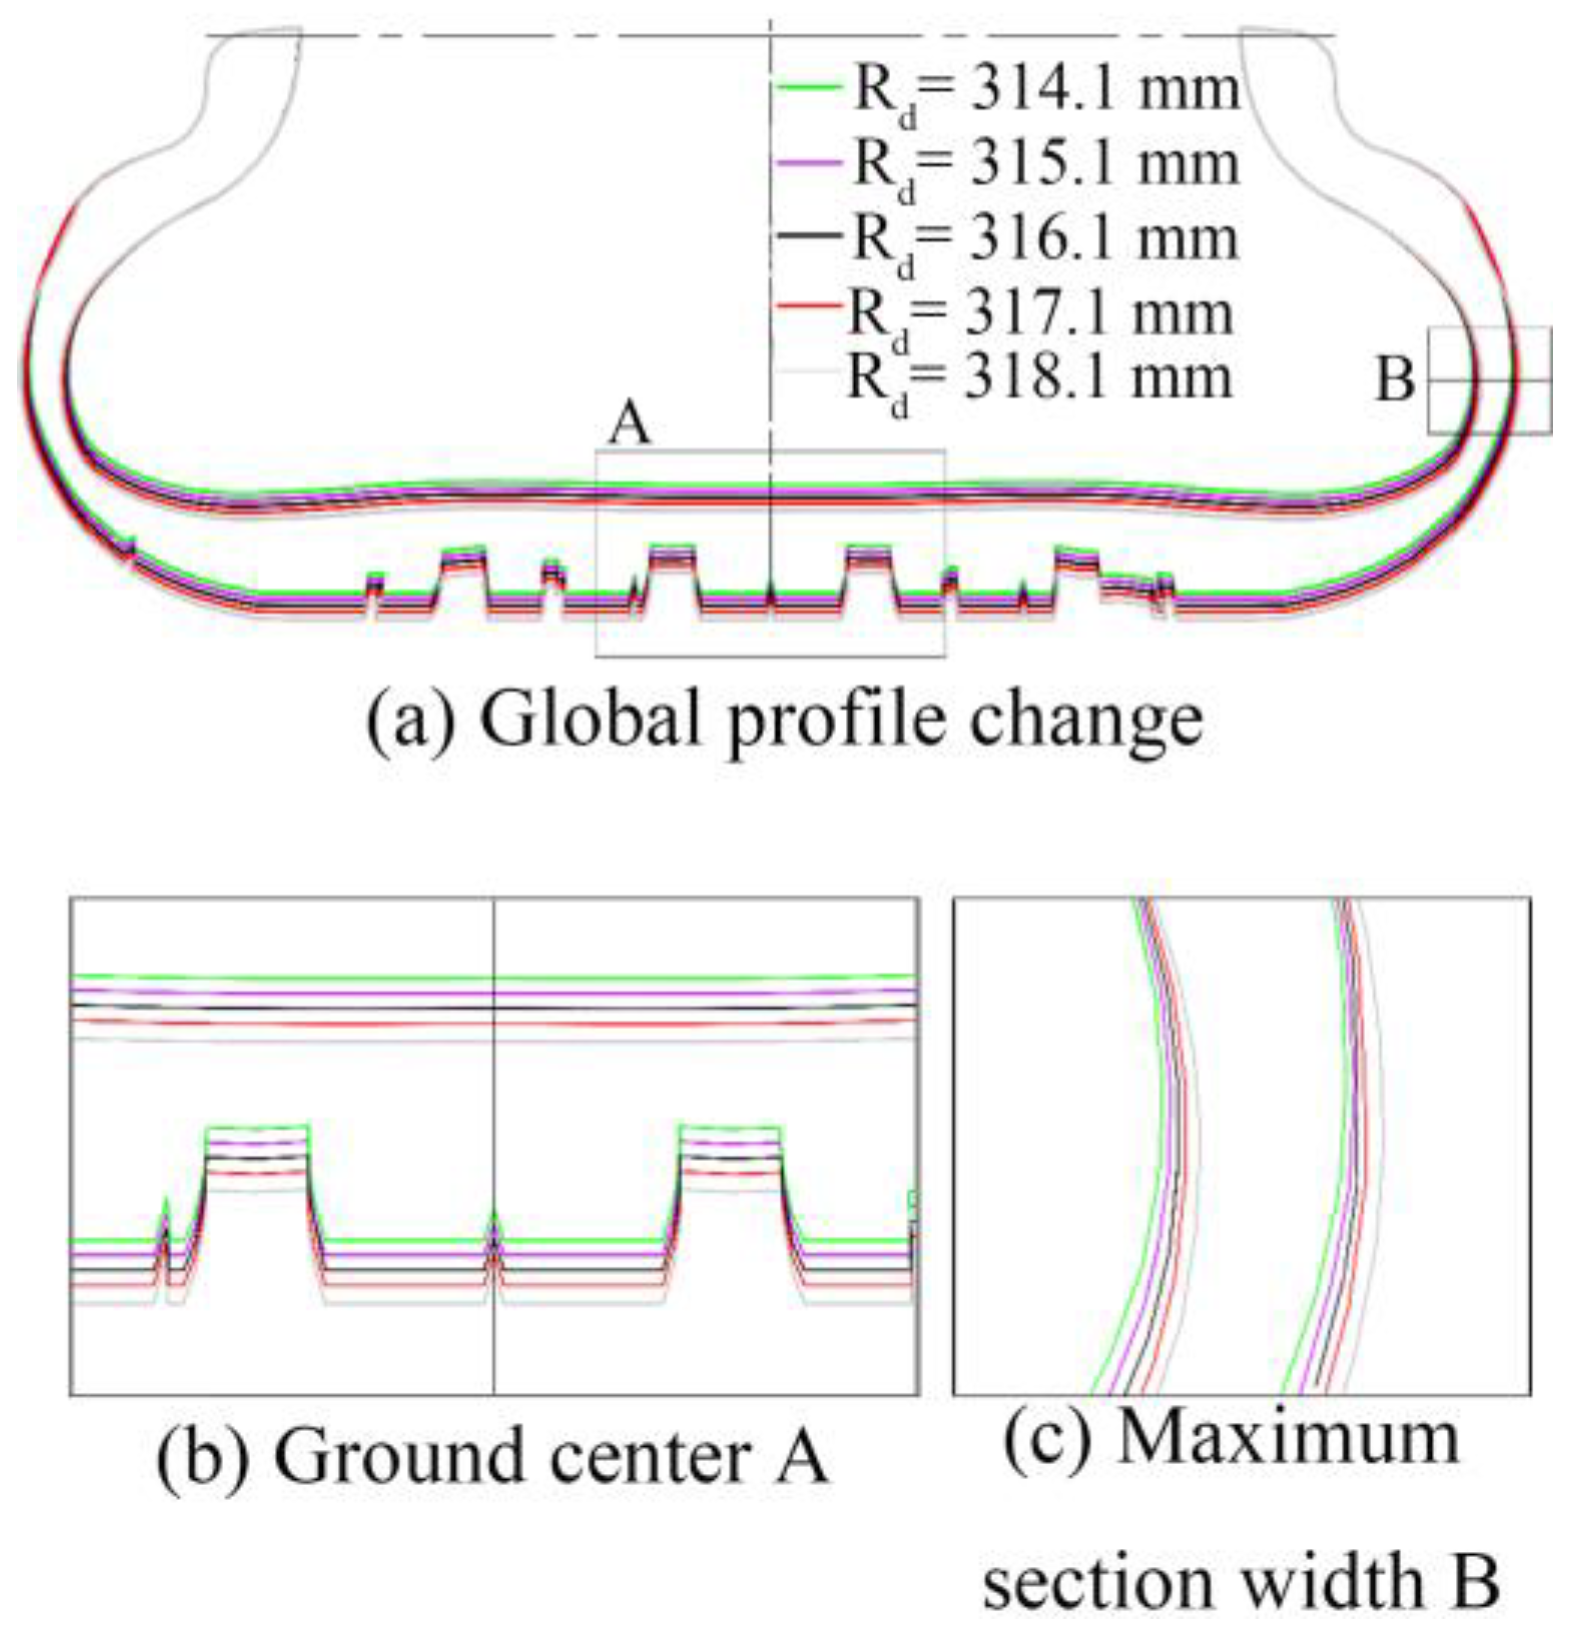
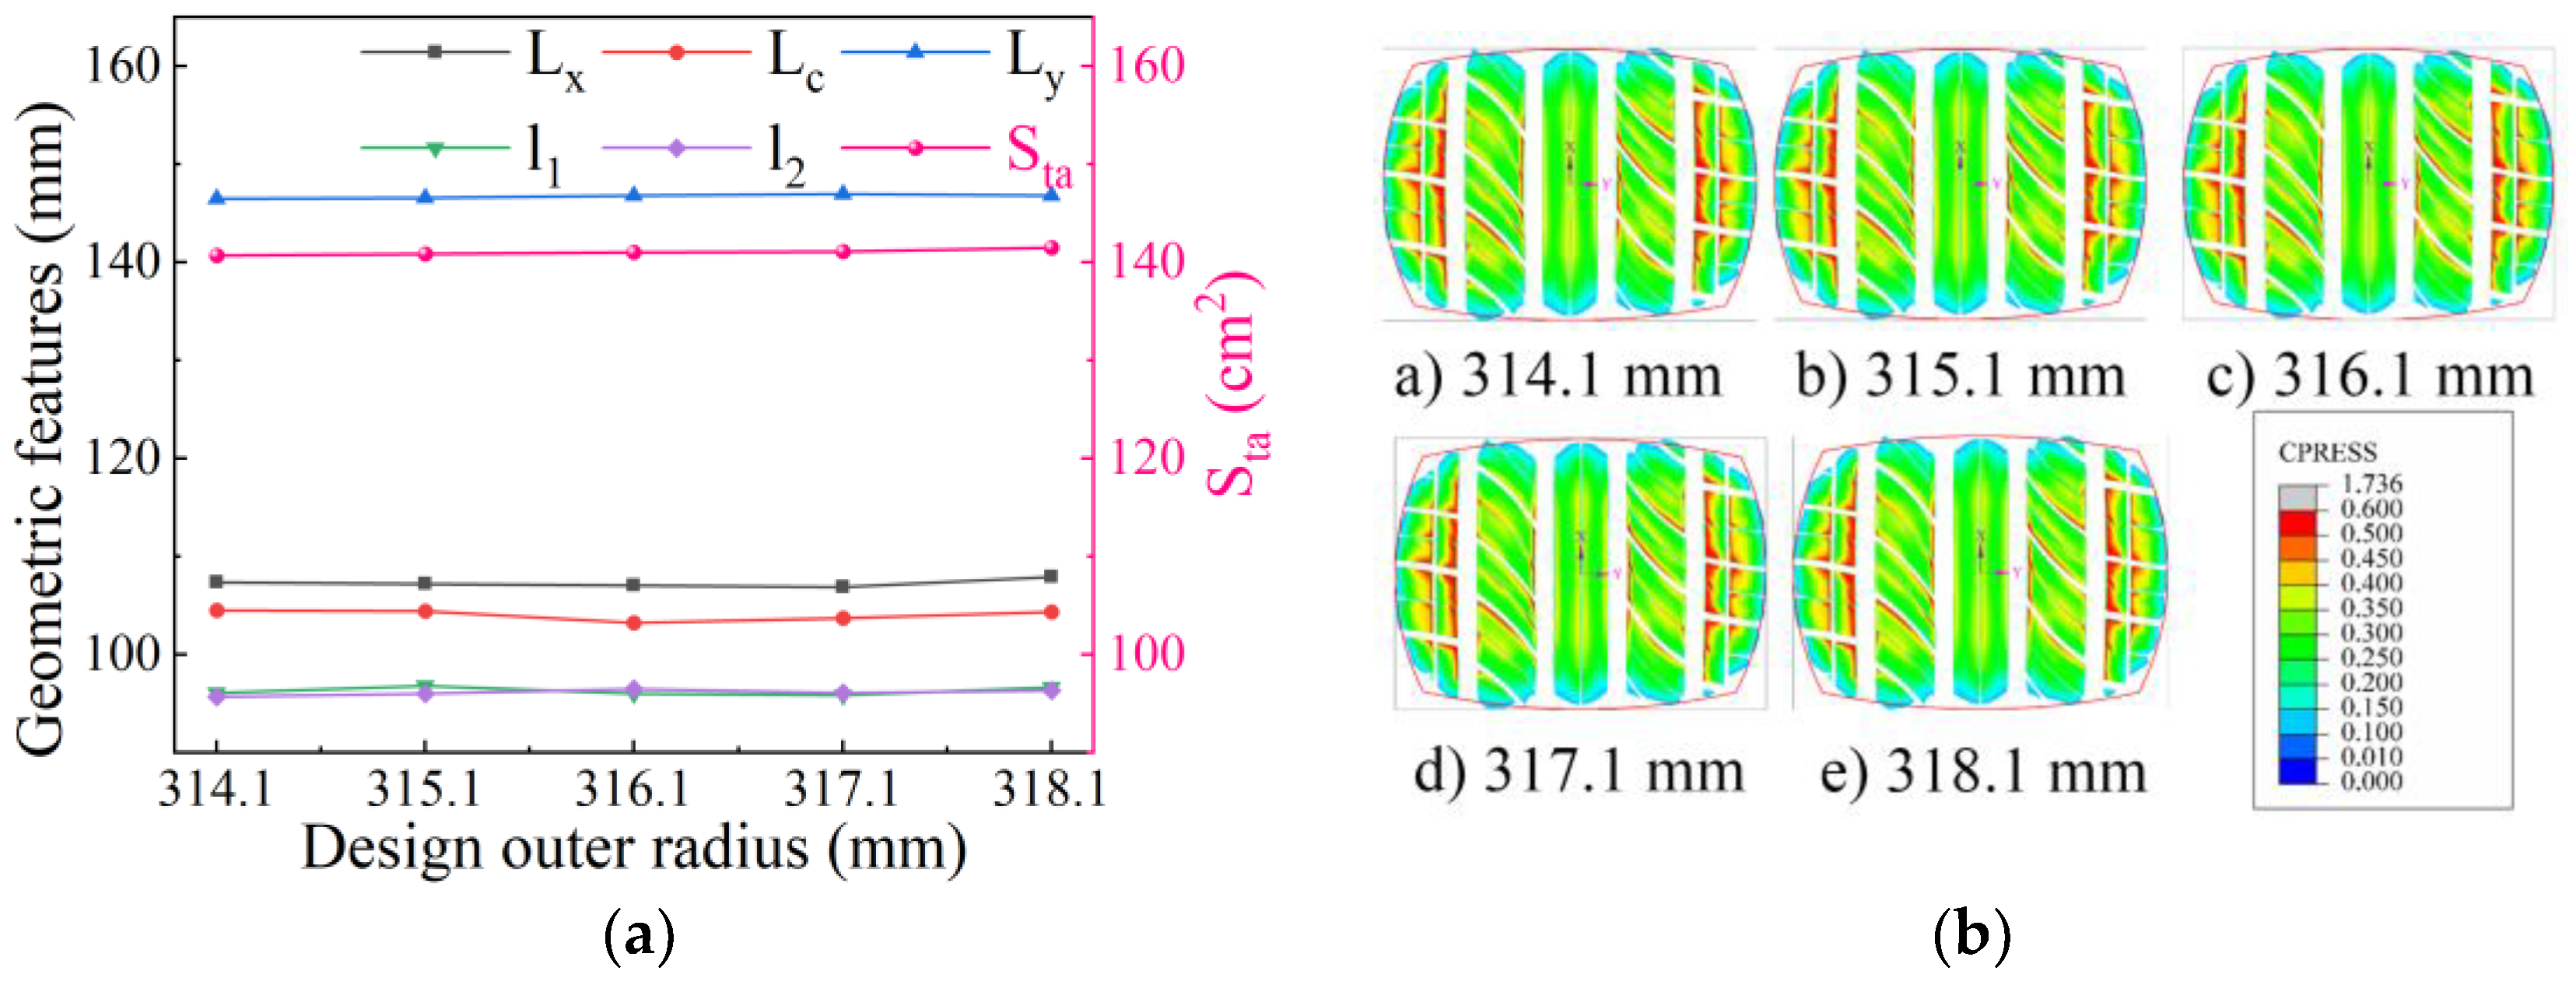
An increase in the tire’s designed outer radius has a greater impact on the crown portion above the maximum section width, contributing to improved vehicle handling stability and driving economy through controlled outer radius design. In the free-rolling state, an increase in the designed outer radius alters the symmetry of the contact length in the shoulder area, reduces the effective contact area, and intensifies stress concentration.
(5)
Adjustments in shoulder design thickness at 85% of the tire’s tread width show the same trend for dynamic and static contact characteristics. However, the asymmetry of the ground contact footprint length is more pronounced in rolling conditions, and the ground contact pressure is significantly higher than in static conditions. Within the adjustment range, the ground contact length of the right tread block exhibits significant variation between static and free-rolling conditions due to asymmetric ground contact.

Author Contributions

Conceptualization, X.D.; Methodology, X.D. and Y.G.; Software, Y.G.; Formal analysis, H.L.; Resources, X.D. and Y.G.; Data curation, H.L. and M.X.; Writing—original draft, H.L. and Y.G.; Writing—review & editing, M.X.; Visualization, M.X. All authors have read and agreed to the published version of the manuscript.

Funding

This research was supported by the Shandong Provincial Natural Science Foundation (No. ZR2022QE048) and Chinese Postdoctoral Science Foundation General Program (No. 2021M700544).

Data Availability Statement

The original contributions presented in this study are included in the article. Further inquiries can be directed to the corresponding author.

Conflicts of Interest

The authors declare no conflict of interest.

References

  1. Baranowski, P.; Malachowski, J.; Mazurkiewicz, L. Local blast wave interaction with tire structure. Def. Technol. 2020, 16, 520–529. [Google Scholar] [CrossRef]
  2. Zang, L.; Peng, X.; Sun, J.; Cui, S.; Bai, Y. Investigation on structural design and grounding characteristics of two dimensional double-u honeycomb non-pneumatic tires. Eur. J. Mech. A Solids 2025, 111, 105599. [Google Scholar] [CrossRef]
  3. Sim, J.; Hong, J.; Cho, I.; Lee, J. Analysis of vertical stiffness characteristics based on spoke shape of non-pneumatic tire. Appl. Sci. 2021, 11, 2369. [Google Scholar] [CrossRef]
  4. Zhou, H.; Li, H.; Liang, C.; Zhang, L.; Wang, G. Relationship between tire ground characteristics and vibration noise. Strojniski Vestn. J. Mech. Eng. 2021, 67, 11–26. [Google Scholar] [CrossRef]
  5. Aguilar, J.J.C.; Carrillo, J.A.C.; Fernández, A.J.G.; Pozo, P.S. Optimization of an optical test bench for tire properties measurement and tread defects characterization. Sensors 2017, 17, 707. [Google Scholar] [CrossRef]
  6. Xia, K.; Yang, Y. Three-dimensional finite element modeling of tire/ground interaction. Int. J. Numer. Anal. Methods Geomech. 2012, 36, 498–516. [Google Scholar] [CrossRef]
  7. Fathi, H.; El-Sayegh, Z.; Ren, J.; El-Gindy, M. Analysis of Tire-Road interaction: A literature review. Machines 2024, 12, 812. [Google Scholar] [CrossRef]
  8. Farhadi, P.; Golmohammadi, A.; Sharifi, A.; Shahgholi, G. Potential of three-dimensional footprint mold in investigating the effect of tractor tire contact volume changes on rolling resistance. J. Terramech. 2018, 78, 63–72. [Google Scholar] [CrossRef]
  9. Schjønning, P.; Stettler, M.; Keller, T.; Lassen, P.; Lamandé, M. Predicted tyre–soil interface area and vertical stress distribution based on loading characteristics. Soil Tillage Res. 2015, 152, 52–66. [Google Scholar] [CrossRef]
  10. Pacejka, H.B.; Bakker, E. The magic formula tyre model. Vehicle Syst. Dyn. 1992, 21, 1–18. [Google Scholar] [CrossRef]
  11. Mavros, G.; Rahnejat, H.; King, P.D. Transient analysis of tyre friction generation using a brush model with interconnected viscoelastic bristles. Proc. Inst. Mech. Eng. Pt. K J. Multi-Body Dyn. 2005, 219, 275–283. [Google Scholar] [CrossRef]
  12. Liu, Z.; Liu, Y.; Gao, Q. In-Plane flexible ring modeling and a nonlinear stiffness solution for heavy-load radial tires. Mech. Syst. Signal Proc. 2022, 171, 108956. [Google Scholar] [CrossRef]
  13. Zang, L.; Wang, X.; Chen, Y.; Li, Y.; Jin, H.; Yang, G. Investigation on mechanical characteristics of non-pneumatic tire with rhombus structure under complex pavement conditions. Simul. Model. Pract. Theory 2022, 116, 102494. [Google Scholar] [CrossRef]
  14. Wang, H.; Al-Qadi, I.L.; Stanciulescu, I. Simulation of tyre–pavement interaction for predicting contact stresses at static and various rolling conditions. Int. J. Pavement Eng. 2012, 13, 310–321. [Google Scholar] [CrossRef]
  15. Chen, B.; Ding, P.; Wei, G.; Xiong, C.; Wang, F.; Yu, J.; Yu, H.; Zou, Y. A Study on the contact characteristics of tires–roads based on pressure-sensitive film technology. Materials 2023, 16, 6323. [Google Scholar] [CrossRef]
  16. Kang, D.; Lee, M.C.; Cho, S.; Shin, Y. Experimental study on mobility of a vehicle with ctis in soft soil. Int. J. Automot. Technol. 2014, 15, 71–77. [Google Scholar] [CrossRef]
  17. Shakiba, M.; Gamez, A.; Al-Qadi, I.L.; Little, D.N. Introducing realistic tire–pavement contact stresses into Pavement Analysis Using Nonlinear Damage Approach (PANDA). Int. J. Pavement Eng. 2017, 18, 1027–1038. [Google Scholar] [CrossRef]
  18. Guo, J.; Ding, P.; Gao, J.; Huang, Z.; Guo, Q.; Yang, X. Numerical simulation of grounding characteristics and temperature field of mine tires under multiple working conditions. Adv. Polym. Technol. 2022, 2022, 3830961. [Google Scholar] [CrossRef]
  19. Kong, X.; Zhang, J.; Wang, T.; Deng, L.; Cai, C.S. Non-contact vehicle weighing method based on tire-road contact model and computer vision techniques. Mech. Syst. Signal Proc. 2022, 174, 109093. [Google Scholar] [CrossRef]
  20. Tian, L.; Wang, D.; Su, P.; Wei, Q. A study on the viscoelastic behaviors of tire cords using dynamic mechanical analysis. J. Eng. Fibers Fabr. 2020, 15, 1558925020915195. [Google Scholar] [CrossRef]
  21. Xie, M.; Tang, H.; Yao, H. Failure Analysis of tire separation in two-sized tires on airbus planes. Eng. Fail. Anal. 2016, 61, 21–27. [Google Scholar] [CrossRef]
  22. Gipser, M. FTire—The tire simulation model for all applications related to vehicle dynamics. Vehicle Syst. Dyn. 2007, 45, 139–151. [Google Scholar] [CrossRef]
  23. Mavros, G.; Rahnejat, H.; King, P. Analysis of the transient handling properties of a tyre, based on the coupling of a flexible Carcass—Belt Model with a separate tread incorporating transient viscoelastic frictional properties. Vehicle Syst. Dyn. 2005, 43, 199–208. [Google Scholar] [CrossRef]
  24. Chen, L.; Sun, P.; Zhou, S.; Meng, J.; Qian, C.; Sun, X. Analysis of cord stress during tire dynamic longitudinal slip. J. Ind. Text. 2023, 53, 15280837231214465. [Google Scholar] [CrossRef]
  25. Namjoo, M.; Golbakhshi, H. An efficient design tool based on fem for evaluating effects of components properties and operating conditions on interaction of tire with rigid road. J. Cent. S. Univ. 2015, 22, 189–195. [Google Scholar] [CrossRef]
  26. Mao, R.; Sun, P.; Zhou, S.; Chen, L.; Meng, J.; Yang, W.; Yang, C.; Luo, K. Optimization of tire-ground performance through meshed belt layer structure. J. Ind. Text. 2024, 54, 15280837241275137. [Google Scholar] [CrossRef]
  27. Meng, J.L.; Sun, P.F.; Zhou, S.T.; Li, Y.; Chen, L.-W.; Mao, R. Study on the influence of belt angle on tire grounding characteristics under longitudinal slip conditions. J. Eng. Fibers Fabr. 2024, 19, 15589250241252633. [Google Scholar] [CrossRef]
  28. Yunta, J.; Garcia-Pozuelo, D.; Diaz, V.; Olatunbosun, O. Influence of camber angle on tire tread behavior by an on-board strain-based system for intelligent tires. Measurement 2019, 145, 631–639. [Google Scholar] [CrossRef]
  29. Liu, Q.; Pei, J.; Wang, Z.; Hu, D.; Huang, G.; Meng, Y.; Lyu, L.; Zheng, F. Analysis of tire-pavement interaction modeling and rolling energy consumption based on finite element simulation. Constr. Build. Mater. 2024, 425, 136101. [Google Scholar] [CrossRef]
  30. Liang, C.; Shan, M.; Wang, G.; Zhu, D.; Chen, X. A method for tire wet grip performance evaluation based on grounding characteristics. Proc. Inst. Mech. Eng. D J. Automob. Eng. 2022, 236, 109–117. [Google Scholar] [CrossRef]
  31. Oubahdou, Y.; Wallace, E.-R.; Reynaud, P.; Picoux, B.; Dopeux, J.; Petit, C.; Nélias, D. Effect of the tire—Pavement contact at the surface layer when the tire is tilted in bend. Constr. Build. Mater. 2021, 305, 124765. [Google Scholar] [CrossRef]
  32. Du, X.; Zhao, Y.; Wang, Q.; Fu, H.; Lin, F. Grounding characteristics of a non-pneumatic mechanical elastic tire in a rolling state with a camber angle. Strojniski Vestn. J. Mech. Eng. 2019, 65, 287–296. [Google Scholar] [CrossRef]
  33. Deng, Y.; Wang, Z.; Liu, T.; Liang, W.; Shen, H.; Xiao, Z. Static and dynamic mechanical characteristics of honeycomb non-pneumatic tire under structural damage condition. Eur. J. Mech. A Solids 2023, 102, 105120. [Google Scholar] [CrossRef]
  34. Yu, L.; Hu, J.; Li, R.; Yang, Q.; Guo, F.; Pei, J. Tire-pavement contact pressure distribution analysis based on ABAQUS simulation. Arab. J. Sci. Eng. 2022, 47, 4119–4132. [Google Scholar] [CrossRef]
  35. Liang, C.; Wang, G.; An, D.; Ma, Y. Tread wear and footprint geometrical characters of truck bus radial tires. Chin. J. Mech. Eng. 2013, 26, 506–511. [Google Scholar] [CrossRef]
  36. Bonet, J.; Wood, R.D. Nonlinear Continuum Mechanics for Finite Element Analysis, 2nd Ed; Cambridge University Press: Cambridge, UK, 2008; pp. 140–180. [Google Scholar]
  37. Wang, Y.; Lu, Y.J.; Si, C.D. Tire-pavement coupling dynamic simulation under tire high-speed-rolling condition. Int. J. Simul. Model. 2016, 15, 236–248. [Google Scholar] [CrossRef]
  38. Conradie, J.M.; Els, P.S.; Heyns, P.S. Finite element modelling of off-road tyres for radial tyre model parameterization. Proc. Inst. Mech. Eng. Part D J. Automob. Eng. 2016, 230, 564–578. [Google Scholar] [CrossRef]
Figure 1. Reverse modeling process for tire finite element analysis.
Lubricants 13 00261 g001
Figure 2. Material distribution map of 205/50R17 tire.
Lubricants 13 00261 g002
Figure 3. Full-featured contour scanner.
Lubricants 13 00261 g003
Figure 4. Verification of profile under different inflation pressures.
Lubricants 13 00261 g004
Figure 5. Tire free-rolling test. (a) Tire free-rolling test rig. (b) Schematic diagram of tire rolling radius.
Lubricants 13 00261 g005
Figure 6. Comparison of simulated and experimental tire radii.
Lubricants 13 00261 g006
Figure 7. Definition of geometric features of contact footprint.
Lubricants 13 00261 g007
Figure 8. Influence of inflation pressure on static contact profile.
Lubricants 13 00261 g008
Figure 9. Influence of inflation pressure on (a) contact parameters and (b) static contact footprint.
Lubricants 13 00261 g009
Figure 10. Influence of inflation pressure on free-rolling tire contact profile.
Lubricants 13 00261 g010
Figure 11. Effect of inflation pressure on (a) dynamic contact parameters and (b) dynamic contact footprint.
Lubricants 13 00261 g011
Figure 12. Influence of load on static tire contact profile.
Lubricants 13 00261 g012
Figure 13. Influence of radial loading on (a) static contact parameters and (b) static contact footprint.
Lubricants 13 00261 g013
Figure 14. Influence of load on free-rolling tire contact profile.
Lubricants 13 00261 g014
Figure 15. Influence of radial loading on (a) dynamic contact parameters and (b) dynamic contact footprint.
Lubricants 13 00261 g015
Figure 16. Influence of belt angle on static tire contact profile.
Lubricants 13 00261 g016
Figure 17. Influence of belt angle on (a) static contact parameters and (b) static contact footprint.
Lubricants 13 00261 g017
Figure 18. Influence of belt angle on free-rolling tire contact profile.
Lubricants 13 00261 g018
Figure 19. Influence of belt angle on (a) dynamic contact parameters and (b) dynamic contact footprint.
Lubricants 13 00261 g019
Figure 20. Influence of overall radius on static tire contact profile.
Lubricants 13 00261 g020
Figure 21. Influence of design outer radius on (a) static contact parameters and (b) static contact footprint.
Lubricants 13 00261 g021
Figure 22. Influence of overall radius on free-rolling tire contact profile.
Lubricants 13 00261 g022
Figure 23. Influence of design outer radius on (a) dynamic contact parameters and (b) dynamic contact footprint.
Lubricants 13 00261 g023
Figure 24. Influence of shoulder thickness on static tire contact profile.
Lubricants 13 00261 g024
Figure 25. Influence of tire shoulder thickness on (a) static contact parameters and (b) static contact footprint.
Lubricants 13 00261 g025
Figure 26. Influence of shoulder thickness on free-rolling tire contact profile.
Lubricants 13 00261 g026
Figure 27. The influence of tire shoulder thickness on (a) dynamic contact parameters and (b) dynamic contact footprint.
Lubricants 13 00261 g027
Table 1. Neo-Hookean parameters of rubber materials for different parts of tires.
ComponentTreadBeltCarcassSidewallTriangleRim Cushion
C100.59331.09650.55910.41262.40291.1238
Table 2. Reinforcement skeleton material parameters.
ComponentSteel BeltCarcass PlyBead Wire
Elastic modulus (GPa)110.99.36210
Poisson’s ratio0.290.40.3
Table 3. Comparison of outer contour simulation and experimental data.
Inflation Pressure/kPaTire Outer Radius Rd/mmInflated Section Width SW/mm
Test1Test2SimulationErrorTest1Test2SimulationError
25316.35316.1316.476−0.08%213.858214.186213.4810.25%
250319.95319.85319.5350.11%212.016211.198210.9650.30%
Table 4. Typical influence factors of tire performance.
TypeProjectAnalysis Conditions
Operating conditionsInflation pressure IP/kPa180200220240260
Radial load Fz/N10002000300040005000
Design parametersBelt angle ABT2426283032
Design outer radius Rd/mm314.1315.1316.1317.1318.1
85% shoulder thickness S85/mm15.0714.5714.0713.5713.07
Disclaimer/Publisher’s Note: The statements, opinions and data contained in all publications are solely those of the individual author(s) and contributor(s) and not of MDPI and/or the editor(s). MDPI and/or the editor(s) disclaim responsibility for any injury to people or property resulting from any ideas, methods, instructions or products referred to in the content.

