Article

Assessing the Compatibility of PAO and POE with Fluoroelastomer (FKM) for Potential EVs Application

by
Bernardo Tormos
1,*,
José M. Liñeira Del Río
1,
Adbeel Balaguer
1,* and
Enrique Giménez
2
1
CMT—Clean Mobility and Thermofluids, Universitat Politècnica de València, 46022 Valencia, Spain
2
Institute of Materials Technology, Universitat Politècnica de València (UPV), 46022 Valencia, Spain
*
Authors to whom correspondence should be addressed.
Lubricants 2025, 13(4), 176; https://doi.org/10.3390/lubricants13040176
Submission received: 17 January 2025 / Revised: 26 March 2025 / Accepted: 9 April 2025 / Published: 11 April 2025
(This article belongs to the Special Issue Tribology of Electric Vehicles)

Abstract

:
The accelerated growth of electric vehicle (EV) powertrains has prompted the development of specialized fluids that meet stringent thermal and electrical requirements for immersion cooling systems, including interactions with non-metallic components like fluoroelastomer (FKM). This research investigates the interactions between fluoroelastomer (FKM) and two potential base fluids—polyalphaolefin (PAO4) and a polyol ester (POE)—to assess their suitability for immersion cooling applications. Immersion tests, following an adapted ASTM D7216 standard, evidenced changes in FKM’s mass, Shore A hardness, and tensile strength. Furthermore, the physical, electrical, and thermal properties of the tested fluids were analyzed before and after immersion to determine whether contact with the FKM elastomer compromised their performance. The findings of this study reveal that the fluid exerts a greater influence on the elastomer than vice versa. This study bridges a knowledge gap in regards to EV fluid development and material science, contributing to the development of durable and efficient thermal management solutions.

1. Introduction

The transition from internal combustion engine (ICE) vehicles to electric vehicles (EVs) marks a transformative shift in the automotive industry, driven by the need for sustainable transportation. As EV adoption accelerates globally, the demand for advanced materials and fluids tailored to their unique operational requirements has intensified [1]. Effective thermal management remains a critical challenge in the development of electric vehicles. It is essential for optimizing lithium-ion battery performance, safety, and longevity. Unlike ICE vehicles, EVs face heightened thermal demands due to rapid charge–discharge cycles and high-voltage systems, necessitating precise temperature control to prevent overheating and thermal runaway [2,3]. Traditional cooling methods, such as air cooling or indirect liquid cooling via cold plates, often prove inefficient or add unnecessary weight, prompting the adoption of single-phase liquid immersion cooling (SLIC) as a highly effective alternative [4,5].
In SLIC systems, battery and powertrain components are submerged in a dielectric fluid, enabling direct heat transfer from heat-generating elements to the cooling medium [2]. This approach offers superior heat dissipation, reduced thermal gradients, and compact design, making it ideal for next-generation EVs [6,7]. However, the success of SLICs depends on fluids with exceptional thermal conductivity, low electrical conductivity, oxidative stability, and compatibility with system materials, including non-metallic components like fluoroelastomers (FKM) used for sealing and insulation [8].
Among thermal fluid candidates, polyalphaolefins (PAO) and polyol esters (POE) are leading choices due to their synthetic nature, dielectric properties, and thermal performance. PAO, a non-polar hydrocarbon with a [–CH2–CH(R)–]n structure, offers excellent thermal stability and low viscosity [9,10]. POE, a polar ester with an R–COO–R’ structure, provides superior oxidative resistance and solvency [11]. These fluids outperform alternatives like mineral oils (less thermally robust) or silicones (higher conductivity), making them ideal for EV immersion cooling [12]. Recent studies, such as those by Wahab et al. (2025) and Tormos et al. (2023), underscore their potential, highlighting PAO’s endurance under thermal loads and POE’s heat transfer efficiency [5,8].
FKM, a high-performance fluoroelastomer with a fluorinated backbone [–CH2–CF2–CF(CF3)–]n, is integral to EV systems and is used in seals, gaskets, O-rings, and high-voltage cable insulation [13]. Its exceptional resistance to heat, chemicals, and mechanical stress makes it vital for maintaining reliability in EV powertrains, where it prevents leaks and insulates electrical components [14]. However, prolonged exposure to immersion fluids can alter FKM’s properties, producing swelling, softening, or degradation due to fluid penetration into its polymer matrix, potentially compromising sealing efficacy or insulation integrity [15]. This poses a critical concern for SLIC, where direct fluid–elastomer contact under high-temperature, high-voltage conditions amplifies these risks. While prior research, such as that by García-Tuero et al. (2022) [15], has examined elastomer compatibility with transmission fluids, few studies address FKM’s interaction with synthetic thermal fluids like PAO and POE under EV-relevant immersion cooling conditions. Recent reviews, including that of Wahab et al. (2025), identify material compatibility as a key hurdle, yet empirical data remain limited [5].
These interactions could significantly influence the fluids’ electrical and thermal properties, a key consideration for EV thermal management systems. In high-voltage environments, base fluids like PAO and POE must maintain low electrical conductivity to prevent arcing or insulation failure, while efficiently dissipating heat from critical components. Contact with FKM may leach degradation byproducts or polar species (e.g., from thermal breakdown), potentially increasing the fluid’s ionic content and electrical conductivity.
This study addresses this critical gap by evaluating the compatibility of PAO4 and POE with FKM for EV immersion cooling applications. Specifically, it investigates a pressing problem, i.e., how these fluids affect FKM’s mechanical properties (mass, hardness, tensile strength) and conversely, whether FKM impacts the fluids’ physical, thermal, and electrical properties post-immersion. Using a modified ASTM D7216 immersion test at 120 °C for 168 h, we evaluate these interactions. The novelty lies in pioneering a comprehensive analysis of fluid stability—particularly dielectric and thermal performance—following FKM contact, an underexplored aspect essential for SLIC reliability. Unlike previous studies focusing on elastomer responses to fuels or lubricants [16,17], this research targets the unique demands of immersion cooling, where fluid integrity is as critical as elastomer durability. As this study extends beyond traditional elastomer-centric analyses, its significance is profound: it informs the design of robust fluid–elastomer systems, enhancing EV powertrain safety, efficiency, and longevity as the industry scales to meet sustainability goals. By filling this knowledge gap, we lay the groundwork for advancing thermal management technologies in next-generation EVs, where material compatibility directly impacts performance.

2. Materials and Methods

2.1. Materials

To investigate elastomer–fluid compatibility for potential electric vehicle (EV) applications, a fluoroelastomer (FKM) and two base fluids, polyalphaolefin (PAO4) and polyol ester (POE), were selected. These materials were chosen based on their relevance to automotive applications, their contrasting polarity, and previous studies conducted by our research team [8,18].

2.1.1. Elastomer

FKM, a synthetic fluoroelastomer with the general formula of [-CH2-CF2-CF(CF3)-], is known for its exceptional resistance to heat, chemicals, and oils due to its high fluorine content. These properties make it ideal for harsh operating environments commonly encountered in automotive systems [13,14]. FKM sheets with a thickness of 2 mm were sourced from Industria de la Goma (Tarragona, Spain) and were precisely cut from these sheets for experimental evaluation.

2.1.2. Base Fluids

The following selected base fluids were employed in their pure form, without additives:
Polyalphaolefin (PAO4) is a non-polar synthetic hydrocarbon characterized by the general structure of [–CH2–CH(R)–]n, where R typically represents an alkyl group. PAOs are widely utilized in automotive and industrial applications due to their exceptional thermal and oxidative stability. The specific PAO employed in this study, SpectraSyn 4, was sourced from ExxonMobil (Barcelona, Spain).
Polyol ester (POE) is a polar ester characterized by a general structure such as R–COO–R’, formed through the reaction of polyols and carboxylic acids (e.g., pentaerythritol tetraesters). It is distinguished by its low viscosity, exceptional oxidative stability, minimal deposit formation, and biodegradability [11]. Its polarity enhances solvency and facilitates interactions with polar materials, offering a notable contrast to the non-polar PAO. The POE utilized in this study, Waglinol 3/13480, was sourced from IQLubricants (Barcelona, Spain).
These materials provide a basis for assessing elastomer–fluid interactions critical to the development of advanced EV fluid systems. A summary of the fluid properties is presented in Table 1.

2.2. Methods

The compatibility of the elastomer with the lubricant bases was assessed through immersion testing. This method evaluates compatibility by analyzing the impact of a liquid on test specimens that are submerged under controlled conditions, including a specified temperature and duration. The impact of the fluid on the tested material is quantified by analyzing changes in its physical properties before and after immersion.
The immersion experiments were performed in accordance with a modified version of ASTM D7216 [19]. A test temperature of 120 °C was selected—lower than the standard’s recommended value—to better reflect the operational conditions of electric vehicle (EV) applications. Additionally, the experimental configuration was adapted by utilizing a 1-liter beaker instead of the smaller glass tubes typically specified in the standard, a modification that optimized the compatibility of the available laboratory equipment.
Fluoroelastomer specimens were fully submerged in the beaker and maintained at the designated temperature of 120 °C for a duration of 168 h, equivalent to one week, ensuring consistent exposure to the test conditions. Heating was carried out in a thermal bath to maintain the required temperature with precision, while the beakers were sealed with lids to minimize evaporative losses and protect the specimens from potential external contaminants.
To assess the impact on the elastomer, the initial mass, Shore A hardness, and tensile properties were measured using specimens extracted from FKM sheets. Specifically, six Type IV specimens, as defined by ASTM D638 [20], were used for tensile testing, whereas six specimens with dimensions of 2 cm × 5 cm were utilized for evaluating mass and hardness, as defined by ASTM D7216 (refer to Figure 1).
To assess the impact on the fluids, measurements were conducted on both fresh samples and those exposed to FKM during the immersion test. Comprehensive descriptions of these measurement methodologies are provided in the subsequent subsections.

2.2.1. Measurement of Mass Changes

For each fluid (PAO4 and POE), six FKM samples were used to quantify the mass change. The mass of each sample was recorded before and after the immersion test using an analytical balance (KERN 770, Kern & Sohn, Balingen, Germany) with a readability of 0.0001 g. The mean mass change and its standard deviation were then calculated for each fluid.
For each test, the change in properties was calculated as follows:
m a s s = 100 [ ( m f m i ) / m i ]
where m a s s : mass change, %; m f : final mass, g; and m i : initial mass, g.

2.2.2. Measurement of Hardness Changes

For each fluid (PAO4 and POE), six FKM specimens were analyzed to assess hardness changes. The hardness of each specimen was measured before and after immersion using a Shore A durometer, with six readings per sample averaged to determine the mean. To meet ASTM D2240 requirements [21], the specimens were stacked to a thickness of 6 mm. The hardness change was then calculated using the expression provided below.
H = H f H i
where H : hardness change; H f : final hardness; and H i : initial mass, all in Shore A units.

2.2.3. Measurement of Tensile Strength and Elongation Changes

This study evaluated tensile strength, defined as the maximum stress a specimen sustains prior to rupture, and ultimate elongation, representing the strain at failure under continuous tensile loading, with these values derived from stress–strain curves. These properties were measured in accordance with ASTM D638 [20], utilizing Type IV dumbbell-shaped specimens (refer to Figure 1). Testing was conducted using an Instron 4204 tensile testing machine at a crosshead speed of 50 mm/min and a maximum load capacity of 5 kN. For each base fluid (PAO4 and POE), six FKM specimens were tested, and stress–strain curves were generated, from which the tensile strength and ultimate elongation were calculated, with the average values and the standard deviation reported. Baseline measurements were obtained from unexposed FKM samples to establish reference values, and all tests were performed under consistent environmental conditions.
The variation in properties for each test was calculated in accordance with ASTM D7216 [19] using the following equation:
E = 100 [ ( E f E i ) / E i ]
where E : ultimate elongation change (%); E f : final ultimate elongation (%); and E i : initial ultimate elongation (%). An analogous approach was applied to determine the percentage change in tensile strength.

2.2.4. Stereomicroscopy

The surface morphology of the fluoroelastomer (FKM) samples was examined before and after immersion in PAO4 and POE using an Apochromatic Stereomicroscope Leica MZ APO (Leica Microsystems, Wetzlar, Germany). Images were captured at a magnification of 80×. Samples were prepared by air-drying after immersion and mounted directly under the microscope, without additional coating, to preserve their native state. Images were acquired under reflected light conditions, with brightness and contrast adjusted to enhance the visibility of surface details. Each sample was imaged in triplicate at different locations, and representative images were selected for analysis. To assess the impact of the elastomer on the oil’s properties, several key physical, thermal, and electrical characteristics were evaluated. This analysis provided insight into the fluid’s stability and compatibility with the elastomer material.
Measurements were performed on both fresh fluid and the fluid subjected to the immersion test. The fresh fluid served as the baseline for direct comparison with the aged fluid’s properties post-test. The analysis included viscosity, density, thermal conductivity, heat capacity, breakdown voltage, resistivity, and dissipation factor, all measured under controlled conditions per relevant ASTM and IEC standards to ensure reliability and reproducibility.

2.2.5. Measurement of Viscosity and Density

Viscosity and density are key properties to consider when selecting a base fluid for e-fluid development, as they significantly impact performance and heat dissipation efficiency [22]. Low-viscosity fluids enhance flow dynamics and improve energy efficiency, elements crucial for extending the driving range of electric vehicles. Density, on the other hand, plays a fundamental role in determining the fluid’s thermal and flow characteristics. It affects the fluid’s capacity to transfer heat efficiently and influences the energy required to circulate the fluid through the system.
The viscosity and density of the oil samples were measured using the Anton Paar Automatic Kinematic Viscometer SVM 3001 (Graz, Austria), which complies with the ASTM D7042 standard [23]. This instrument is a Stabinger viscometer. It operates on a rotational coaxial cylinder measuring system and allows for the simultaneous determination of dynamic viscosity (η) and density (ρ) in oils and fuels. The kinematic viscosity (ν) is calculated directly by the instrument via dividing the measured dynamic viscosity by the corresponding density at the same test temperature.
The viscometer provides a repeatability of 0.10% and a reproducibility of 0.35% for viscosity measurements, while for density, the repeatability is 0.00005 g/cm3, and the reproducibility is 0.0001 g/cm3. Measurements of kinematic viscosity, dynamic viscosity, and density were recorded in triplicate at 20 °C intervals over a temperature range of 20 to 120 °C.

2.2.6. Measurement of Thermal Properties

Thermal conductivity is a crucial property in the context of fluids for electric vehicles, as it determines the fluid’s ability to transfer heat. Efficient thermal management is vital in EV systems to prevent the overheating of the battery and other critical components. A fluid with high thermal conductivity can rapidly dissipate heat from the battery, ensuring optimal performance and extending its lifespan by reducing the risk of thermal degradation [22,24].
Specific heat capacity complements thermal conductivity by defining the fluid’s ability to store thermal energy. A fluid with a high specific heat capacity can absorb and retain more heat without a significant temperature increase, which is essential for stabilizing the thermal environment within the EV system.
The thermal conductivity and heat capacity of the oil samples were determined using the Thermtest THW-L1 system (Hanwell, Canada), which operates based on the transient hot wire (THW) method and complies with the ASTM D7896 standard [25]. This technique employs a fine platinum wire immersed in a measurement cell holding approximately 20 mL of the oil sample to directly assess the thermal properties of liquids. The platinum wire functions as both a heating element and a temperature sensor; an electric current passing through the wire generates heat, and the subsequent temperature rise is tracked over time [26]. The instrument offers a measurement accuracy of ±2% and a repeatability of ±1%.
Before testing, the device was calibrated with distilled water at 20 °C to verify accuracy. After calibration, the sample cell was filled with the base oil and inserted into a temperature control unit. Thermal measurements were performed at 20 °C intervals across a temperature range of 20 °C to 120 °C. At each temperature, three measurements were obtained, with a 10 min interval between consecutive readings to ensure isothermal conditions. The mean thermal conductivity and specific heat capacity values, along with their standard deviations, were calculated for each temperature.

2.2.7. Measurement of Resistivity and Dissipation Factor

The resistivity (volume resistivity) and dissipation factor of the oil samples were measured to assess their electrical insulating properties, following the IEC 60247 [27] standard.
Measurements were conducted using the DF9010 system manufactured by APT Power Technology Co. (Beijing, China). A 90 mL oil sample was introduced into the test cell, which was cleaned prior to testing by filling and draining it three times with the same oil sample to displace any residual product. The test was conducted at 90 °C, as per the standard.
The equipment applied a direct current (DC) voltage during the testing procedure and recorded the current flowing through the test circuit to determine resistivity. Concurrently, the dissipation factor was calculated using the same measurements. For each oil sample, four measurements were conducted, and the mean values were reported. Notably, the stated accuracy was ±10% for resistivity and ±1% for the dissipation factor.

2.2.8. Breakdown Voltage Measurement

Breakdown voltage (BDV) of the base oil samples was determined using the Huazheng HZJQ-X1 Transformer Oil BDV Tester (Baoding, China), following the ASTM D1816 standard [28]. The instrument offers a measurement accuracy of ±3%. BDV tests were performed on each base oil in both fresh and post-immersion conditions. For each condition, five replicate measurements were conducted, with a 2 min interval between consecutive tests to allow for dielectric recovery. Throughout the testing process, the samples were maintained at a controlled room temperature of 20–25 °C, as specified by the referenced standard.

2.2.9. Measurement of Water Content

The water content of the fluid samples (PAO4 and POE) was determined in parts per million (ppm) using the Karl Fischer Coulometric (KFC) titration method, following the ASTM E1064 standard [29]. Measurements were conducted with a Metrohm 917 Coulometer (Metrohm, Herisau, Switzerland), which offers a precision of ±3 ppm. The KFC technique relies on the stoichiometric reaction of water with iodine and sulfur dioxide in the presence of a base and alcohol, where iodine is electrochemically generated in situ within the titration cell. This ensures accurate dosing for trace-level water detection. The endpoint of the titration is detected voltammetrically using a dual platinum electrode system, e.g., a constant current is applied, and the presence of excess iodine—indicating complete consumption of water in the sample—causes a sharp decrease in voltage across the electrodes, signaling the end of the reaction. For each sample, three replicates were measured, and the average water content was reported, along with the standard deviation to ensure reproducibility.
Table 2 summarizes the equipment and relevant standards used for measuring the properties mentioned in this study.

3. Results and Discussion

3.1. Effects on the Polymer

3.1.1. Mass Change

The mass of the FKM specimens was measured before and after immersion in the base fluids to determine the mass change, calculated using Equation (1). For each fluid, six specimens were assessed, and the mean and the standard deviation (SD) were computed. The immersion test results, presented in Table 3, highlight distinct behavioral differences in FKM samples exposed to PAO4 and POE.
The FKM samples immersed in PAO4 exhibited a mass loss of −1.69% ± 0.01. This phenomenon could be attributed to the leaching of plasticizers or other low-molecular-weight compounds from the FKM into the PAO [16]. Such interactions may impact the long-term stability of FKM components when exposed to PAO-based fluids.
In contrast, immersion in POE resulted in a mass gain of 2.76% ± 0.07. This mass increase is likely due to fluid uptake by the FKM, which suggests some level of swelling or absorption [16,17]. Swelling of elastomers like FKM in fluids can impact mechanical properties such as hardness and elasticity, which are critical for sealing applications in electric vehicles.
The opposing behaviors observed for PAO and POE reflect the distinct chemical compositions and polarities of these fluids. PAO, being a non-polar, synthetic hydrocarbon fluid, is less likely to interact strongly with the polar groups in FKM, leading to limited compatibility. On the other hand, POE, with its ester-based, polar structure, may interact more strongly with the polar sites in FKM, facilitating absorption and mass gain.

3.1.2. Hardness Change

The immersion test results reveal variations in the hardness of FKM specimens exposed to PAO and POE fluids, as summarized in Table 4. Hardness values represent the mean of six samples, rounded to the nearest whole Shore A point per ASTM D7216 guidelines, with their respective standard deviations (SD) provided.
Before immersion, the FKM samples exhibited a hardness of 75 Shore A ± 1. After immersion in PAO, the hardness increased to 81 Shore A (±0.38), reflecting a +6 Shore A (±0.33) change. This hardening effect can be attributed to the extraction of plasticizers or other low-molecular-weight components from the FKM matrix by the non-polar PAO fluid. PAO, a synthetic hydrocarbon with a [–CH2–CH(R)–]n structure, lacking significant polar groups, limiting its chemical affinity with the fluorinated backbone of FKM [–CH2–CF2–CF(CF3)–]n. This non-polar interaction likely facilitates the diffusion of mobile, non-cross-linked components out of the elastomer, reducing its plasticity and increasing rigidity [30]. This hardening may enhance resistance to deformation under static loads, a desirable trait for seals in electric vehicle (EV) systems subjected to constant pressure. However, this increased stiffness could compromise sealing performance in dynamic applications requiring elasticity, such as regarding gaskets exposed to thermal cycling or vibration, potentially leading to micro-cracks or reduced resilience over time.
Conversely, immersion in POE led to a decrease in hardness to 71 Shore A (±0.64), corresponding to a -4 Shore A (±0.73) change, indicating a softening effect. This behavior aligns with the observed mass gain of +2.76% (Section 3.1.1), suggesting absorption of the polar POE fluid into the FKM matrix. POE, with its ester-based structure (R–COO–R’), exhibits greater polarity due to its carbonyl (C=O) and oxygen (C–O) groups, enabling stronger interactions with polar sites within FKM, such as residual hydroxyl groups. Fluid absorption into the elastomer typically reduces its hardness by decreasing resistance to penetration [31]. This uptake likely acts as an internal plasticizer, disrupting the cross-linked structure and enhancing chain mobility, thereby increasing flexibility [30]. The softening effect could enhance sealing adaptability in EV components under variable conditions, such as battery pack seals exposed to fluctuating temperatures. However, excessive softening may reduce wear resistance, particularly under mechanical stress, risking abrasion or creep in high-pressure environments, including powertrain insulation.
These opposing hardness trends highlight the distinct chemical and physical interactions between FKM and the test fluids, driven by their differing polarities and molecular structures. The extraction-induced hardening by PAO reflects a loss of plasticizing agents, potentially concentrating the cross-linked fluorocarbon network, thus increasing stiffness. In contrast, POE’s softening effect arises from fluid penetration, which enhances segmental motion within the polymer chains. Such variations underscore the need for a tailored approach to fluid selection, considering the specific mechanical requirements of elastomer components in electric vehicle systems.
The low standard deviation across all conditions indicates high consistency and reproducibility of the results. However, further studies are recommended to assess the long-term mechanical performance of FKM under prolonged exposure and dynamic operational conditions.

3.1.3. Tensile Properties

The tensile properties of the FKM samples before and after immersion in PAO and POE fluids are summarized in Table 5 and Table 6. The tensile strength indicates the maximum tensile stress a specimen can withstand before failure. This property increased significantly after immersion in both fluids. For the FKM exposed to PAO, the tensile strength increased from 3.2 ± 0.2 MPa (without immersion) to 5.4 ± 0.3 MPa, representing a +66.3% change. Similarly, POE immersion led to an increase to 4.0 ± 0.2MPa, corresponding to a +24.7% change. This increase in tensile strength is likely associated with the hardening effect observed in the hardness tests, particularly for PAO. However, the smaller increase observed with POE may indicate that fluid absorption mitigated the strengthening effect by introducing plasticization.
The ultimate elongation of FKM also changed markedly after immersion in both fluids. PAO immersion resulted in a significant increase from 84.8 ± 2.2% to 123.6 ± 5.6%, representing a +45.7% change. POE immersion exhibited an even greater increase to 128.1 ± 9.4%, a 51.1% change. These results indicate that both fluids enhanced the flexibility of FKM, likely due to changes in the material’s internal structure. While PAO’s effect may stem from fluid extraction leading to structural compactness, POE’s polar nature and fluid absorption likely introduced plasticizing effects, contributing to the observed flexibility increase.
As Figure 2 depicts, it is possible to observe the distinct profiles of the curves that reflect the differing interaction mechanisms of PAO and POE with FKM. PAO immersion enhances both strength and elongation but introduces rigidity, as seen in the steeper stress increase. In contrast, POE immersion provides a balanced improvement in strength and flexibility, likely due to fluid absorption and the resulting plasticization effects. These results align with the hardness, tensile strength, and elongation data, providing a comprehensive view of the material’s behavior.
The enhanced mechanical properties observed for both PAO and POE immersions indicate their potential compatibility with FKM in EV systems. However, the selection of fluid should consider the specific application requirements. For static seals or components subjected to high mechanical loads, PAO-treated FKM may offer better performance due to its higher strength. On the other hand, POE-treated FKM, with its superior flexibility and balanced strength, could be more suitable for dynamic applications requiring adaptability to movement or vibration.

3.1.4. Surface Morphology of FKM

To complement the physical analyses, the surface morphology of the fluoroelastomer (FKM) was examined before and after immersion in PAO and POE using stereomicroscopy, as described in Section 2.2.4. Stereomicroscope images (Figure 3) depict the FKM surface under three conditions: (a) without immersion (pristine), (b) after immersion in PAO4, and (c) after immersion in POE, with a scale bar of 100 μm.
The pristine FKM surface (a) exhibits a uniform black/dark gray appearance with a fine, granular texture, reflecting its intact vulcanized structure prior to testing. After immersion in PAO4 (b), the surface remains predominantly dark gray with a granular texture, although faint linear features are visible. These features suggest minor surface alterations, possibly due to a slight extraction of low-molecular-weight components, consistent with the observed −1.69% mass loss reported in Section 3.2.2. After immersion in POE (c) the FKM surface exhibits a distinct pattern of surface variability compared to the appearance of (a) and (b), characterized by micro-scale undulations or protrusions. This pattern is likely a result of localized fluid absorption.
While these images provide qualitative insights into surface changes, quantitative surface roughness parameters (e.g., Ra, the arithmetic average roughness) were not measured in this study due to equipment limitations. Stereomicroscope images of the FKM surface are included in the Supplementary Materials in higher resolution.

3.2. Effects on the Fluid

3.2.1. Physical Properties: Viscosity and Density

From a physical perspective, the kinematic viscosity and density of the fluids exhibited negligible changes following the immersion test, as demonstrated by the data in Figure 3 and Figure 4. The observed variations remained consistently minor across all conditions.
Figure 3 presents the kinematic viscosity data, highlighting the limited magnitude of these changes. The average increase in kinematic viscosity was 0.98% for PAO4 (Figure 4a) and 1.30% for POE (Figure 4b). The most pronounced shifts occurred at lower temperatures (20–40 °C), where increases approached 2%. Although these changes are modest, they exceed the equipment’s reproducibility threshold of 0.35% and surpass the standard deviation of replicate measurements, indicating that the observed variations reflect genuine, measurable effects rather than experimental noise. The standard deviations for each measurement are represented in the plotted curves.
Figure 4 illustrates the density of the fluids, with average changes across the evaluated temperature range of 0.27% for PAO4 (Figure 5a) and 0.19% for POE (Figure 5b). All absolute density variations exceeded the equipment’s reproducibility limit of 0.1 kg/m3, confirming that these changes are statistically significant and not attributable solely to measurement uncertainty.
These subtle alterations in kinematic viscosity and density are likely attributable to thermal degradation processes, as similar trends have been reported in prior studies [8]. However, no discernible influence from contact with FKM was observed, suggesting that the changes are predominantly driven by temperature-related effects rather than interactions with the elastomer.

3.2.2. Thermal Properties

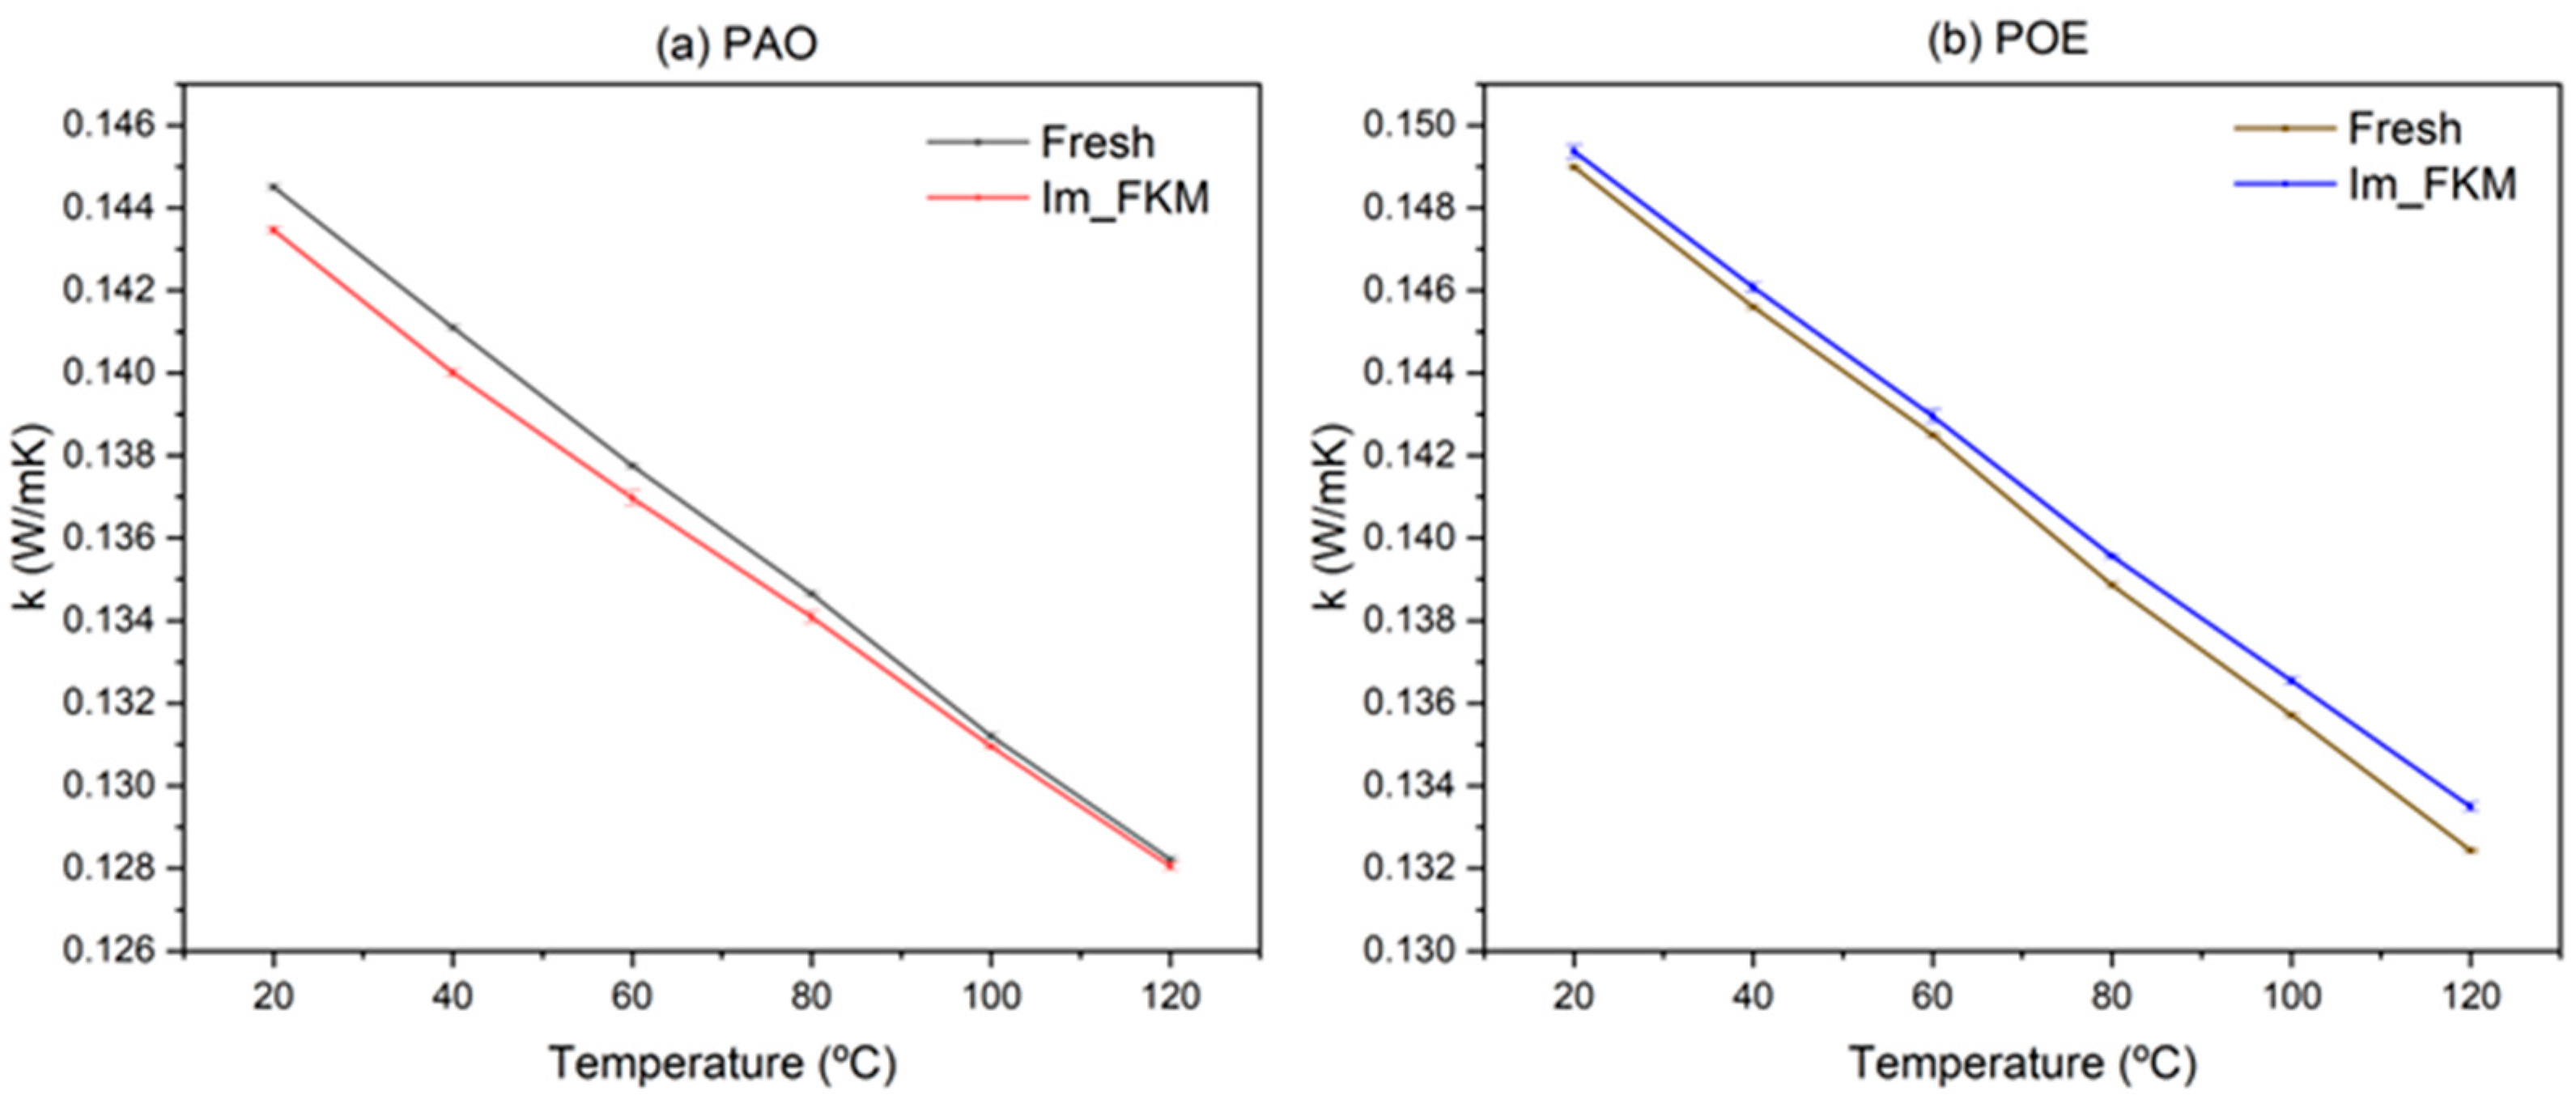
Thermal conductivity, a key parameter for heat transfer efficiency, was measured according to ASTM D7882, with a recommended threshold of 0.14 W/m·K at 40 °C for acceptable performance in EV applications [31]. As shown in Figure 6, both PAO4 and POE exhibit thermal conductivities above this threshold at 40 °C.
Fresh PAO4 (Figure 6a) has a thermal conductivity of 0.1411 W/m·K at 40 °C, decreasing to 0.1400 W/m·K after the test, a 0.78% reduction. Fresh POE’s thermal conductivity at 40 °C increases from 0.1455 W/m·K to 0.1460 W/m·K after the test, a 0.34% rise (Figure 6b). The standard deviation of triplicate measurements for both fluids is approximately 0.001 W/m·K, indicating high measurement repeatability. However, with the equipment’s accuracy specified at ±2% (corresponding to ±0.0028 W/m·K at 0.14 W/m·K), the observed changes (e.g., −0.0011 W/m·K for PAO4; +0.0005 W/m·K for POE at 40 °C) fall within the measurement uncertainty. The minimal changes post-immersion suggest that both fluids maintain adequate thermal conductivity for EV cooling, with POE’s slightly higher values reflecting the influence of its polar ester groups.
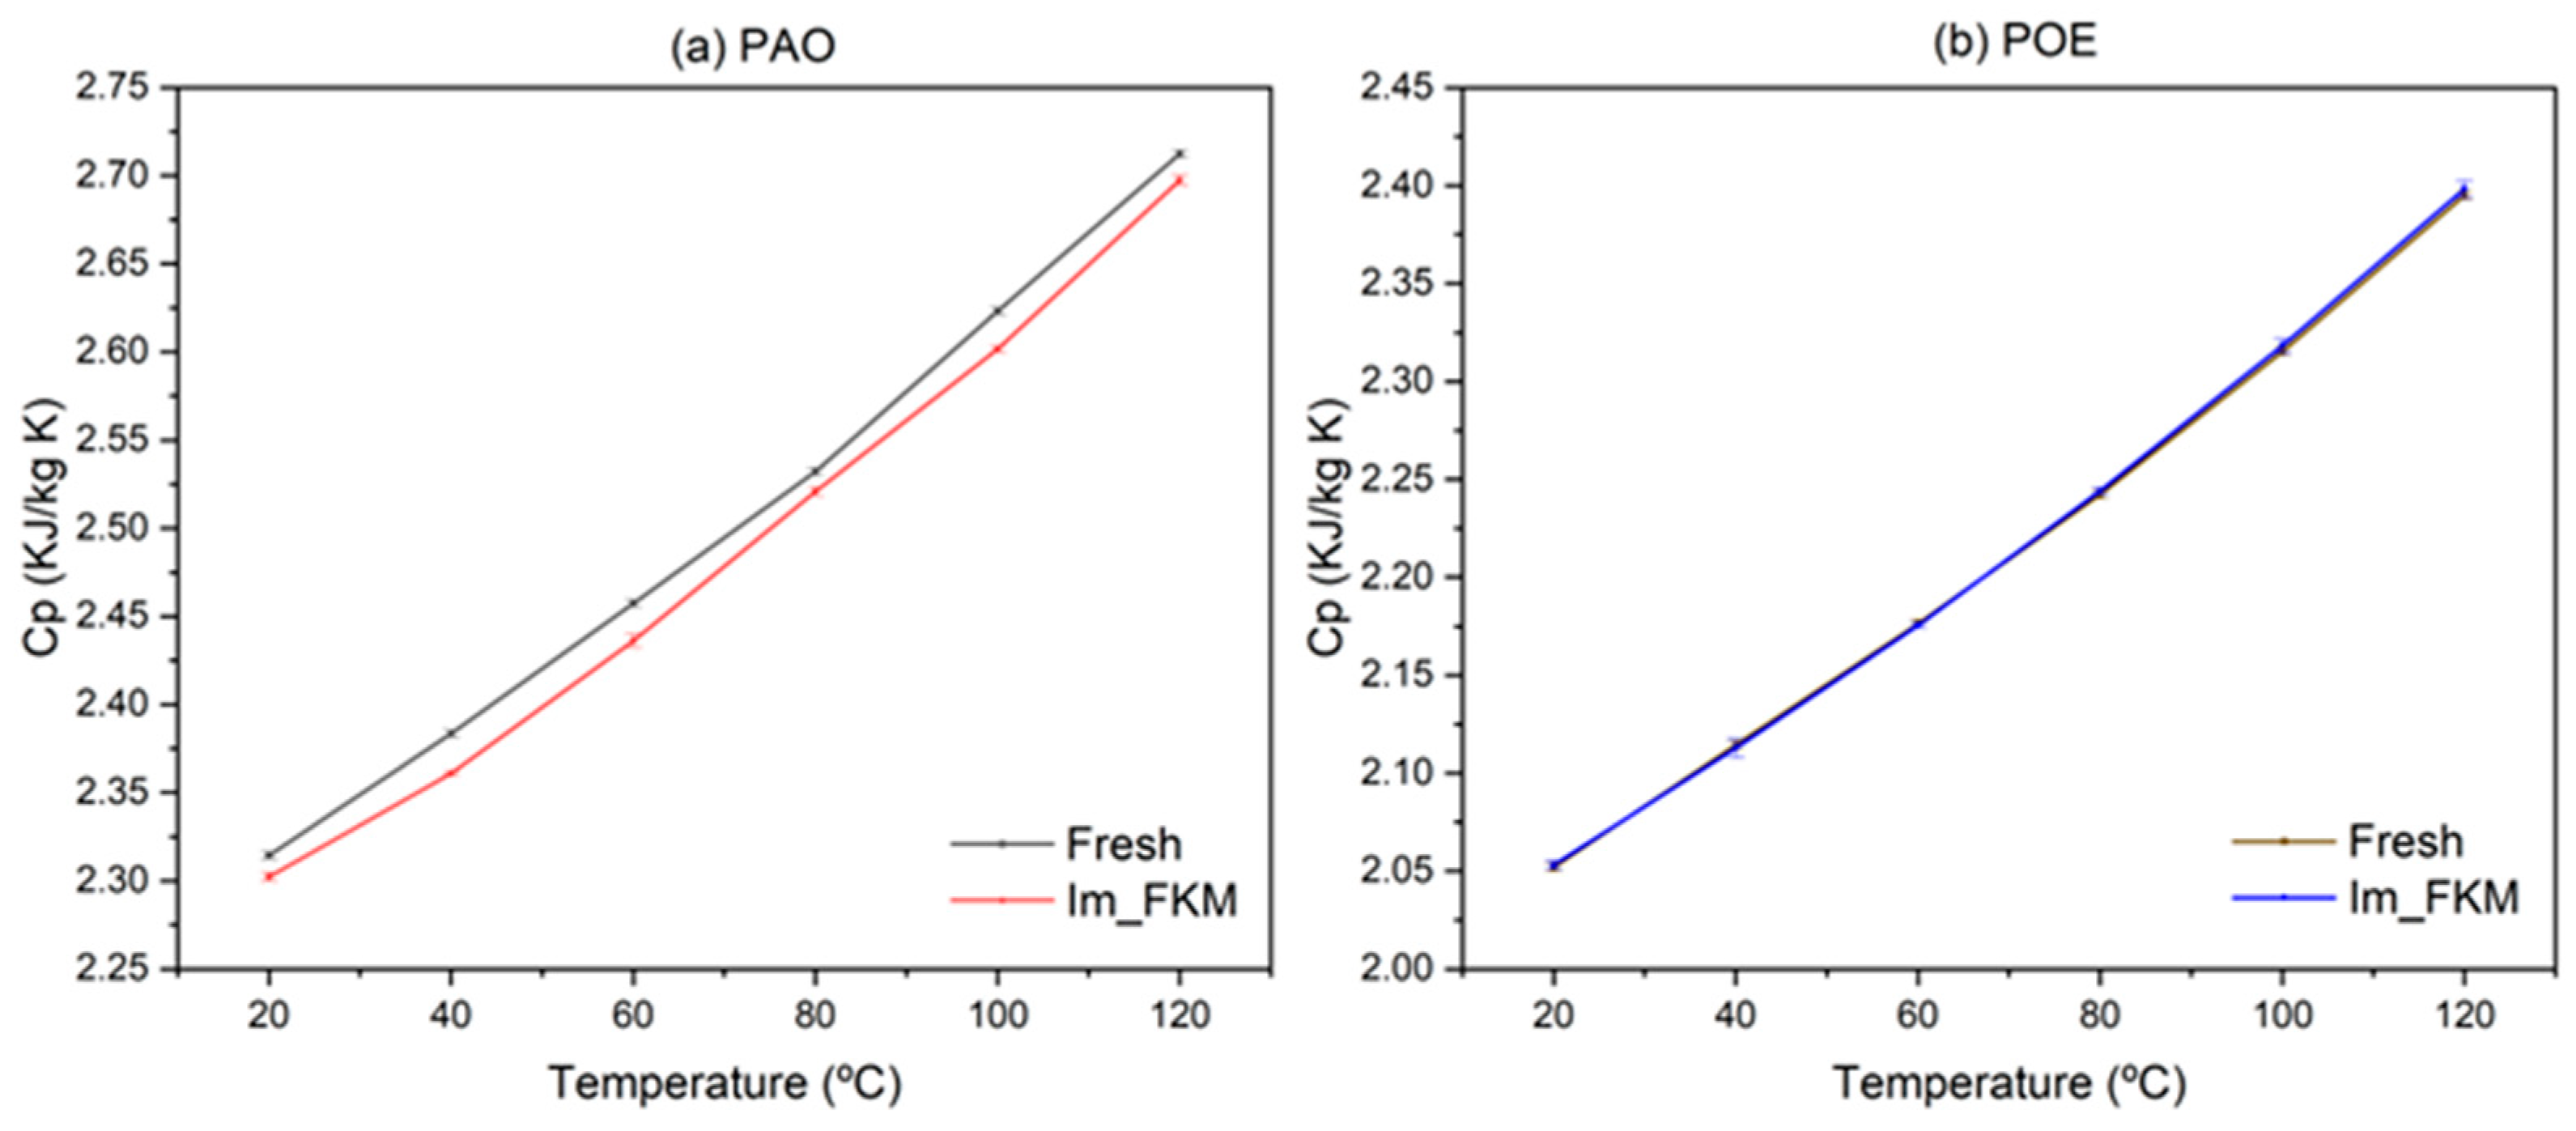
Specific heat capacity, which indicates a fluid’s ability to store thermal energy, was measured across 20–120 °C, as shown in Figure 7. The average change in Cp over this range is −0.69% for PAO4 and +0.09% for POE (Table 6), with a standard deviation of approximately 0.003 kJ/kg·K for triplicate measurements, indicating high measurement repeatability. Given the equipment’s accuracy for thermal conductivity measurements (±2%), a similar accuracy for Cp measurements would suggest an uncertainty of approximately ±0.046 kJ/kg·K for a typical value of 2.3 kJ/kg·K, which exceeds the observed changes (e.g., −0.0159 kJ/kg·K for PAO4). Thus, these variations are likely within the measurement uncertainty. For PAO4, the slight decrease may reflect minor thermal degradation, consistent with its stable chemical structure, while POE’s marginal increase may be influenced by moisture incorporation (water content rising from 154.4 ppm to 859.4 ppm, Section 3.2.3), as water exhibits a high specific heat capacity. These results confirm that both fluids maintain their heat storage capabilities after the test.
To comprehensively evaluate the combined impact of physical and thermal properties on heat transfer performance, the Mouromtseff number (Mo) was calculated as a figure of merit (FOM) [24]. The Mouromtseff number integrates density ( ρ ), thermal conductivity (k), specific heat capacity ( C p ), and dynamic viscosity ( μ ) into a single metric, defined as
M o = ρ a k b C p d μ e
Depending on the type of flow, laminar or turbulent, the values of the exponent change according to the following table (Table 7):
For a fixed geometry and flow velocity, the fluid with the highest Mouromtseff number achieves the greatest heat transfer rate [
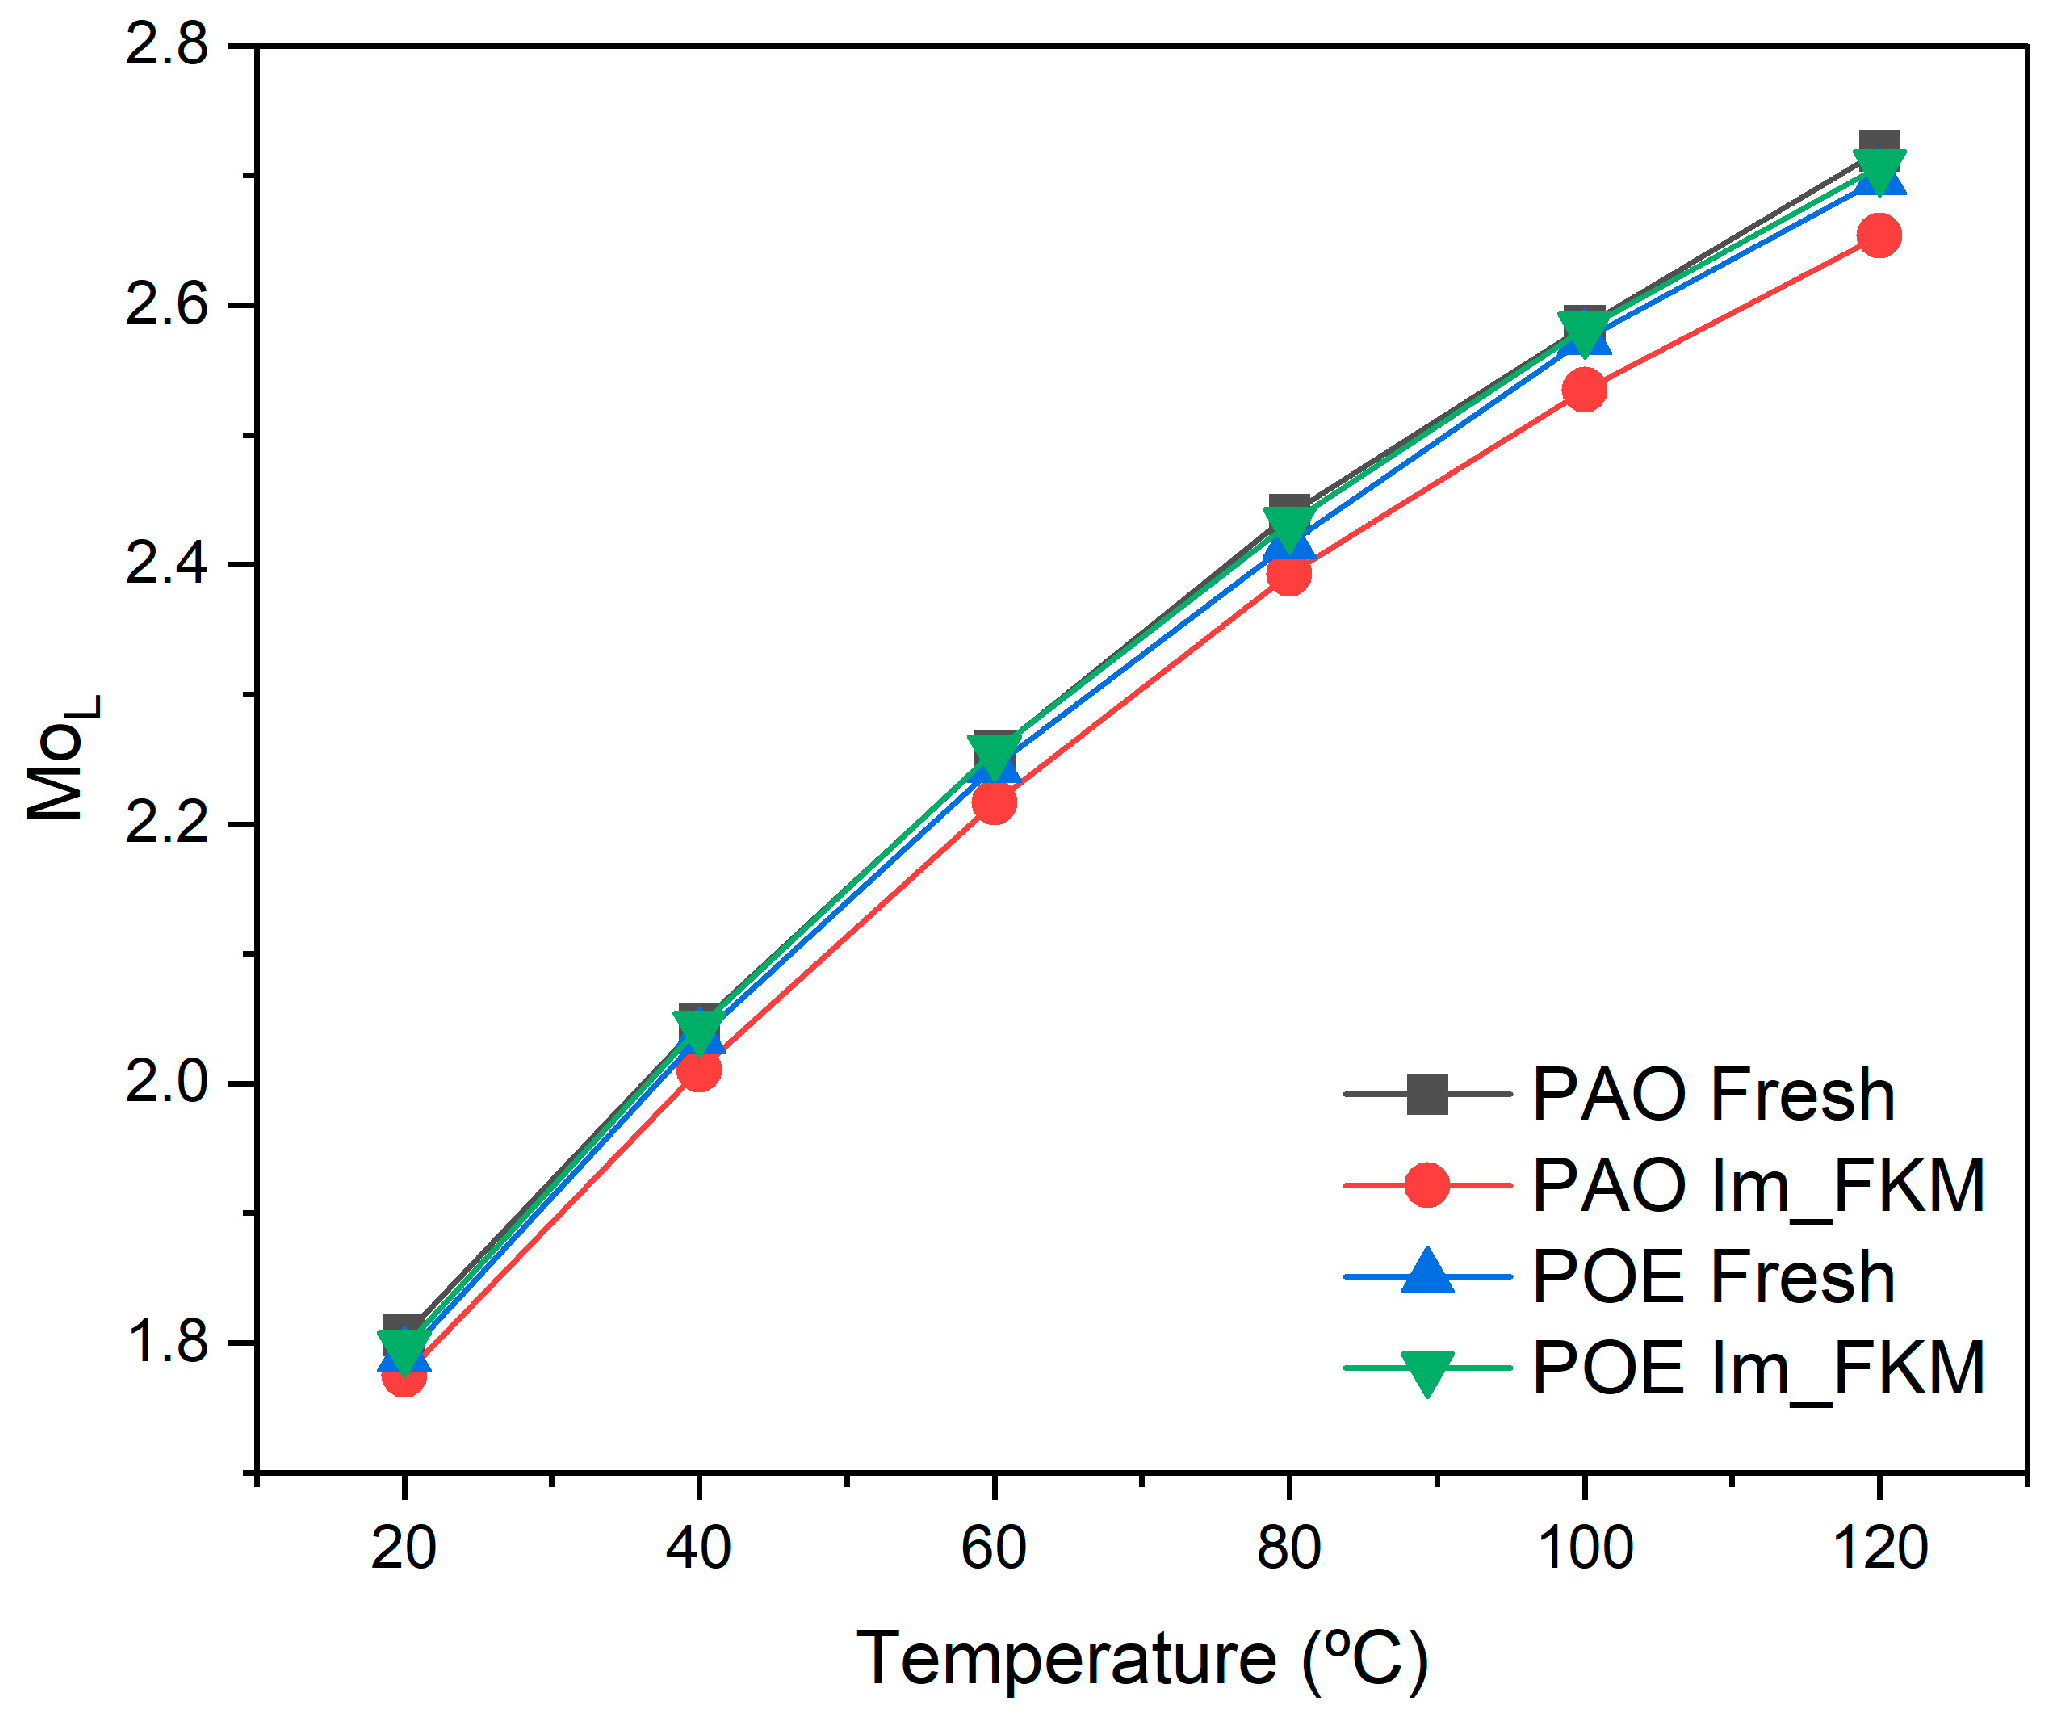
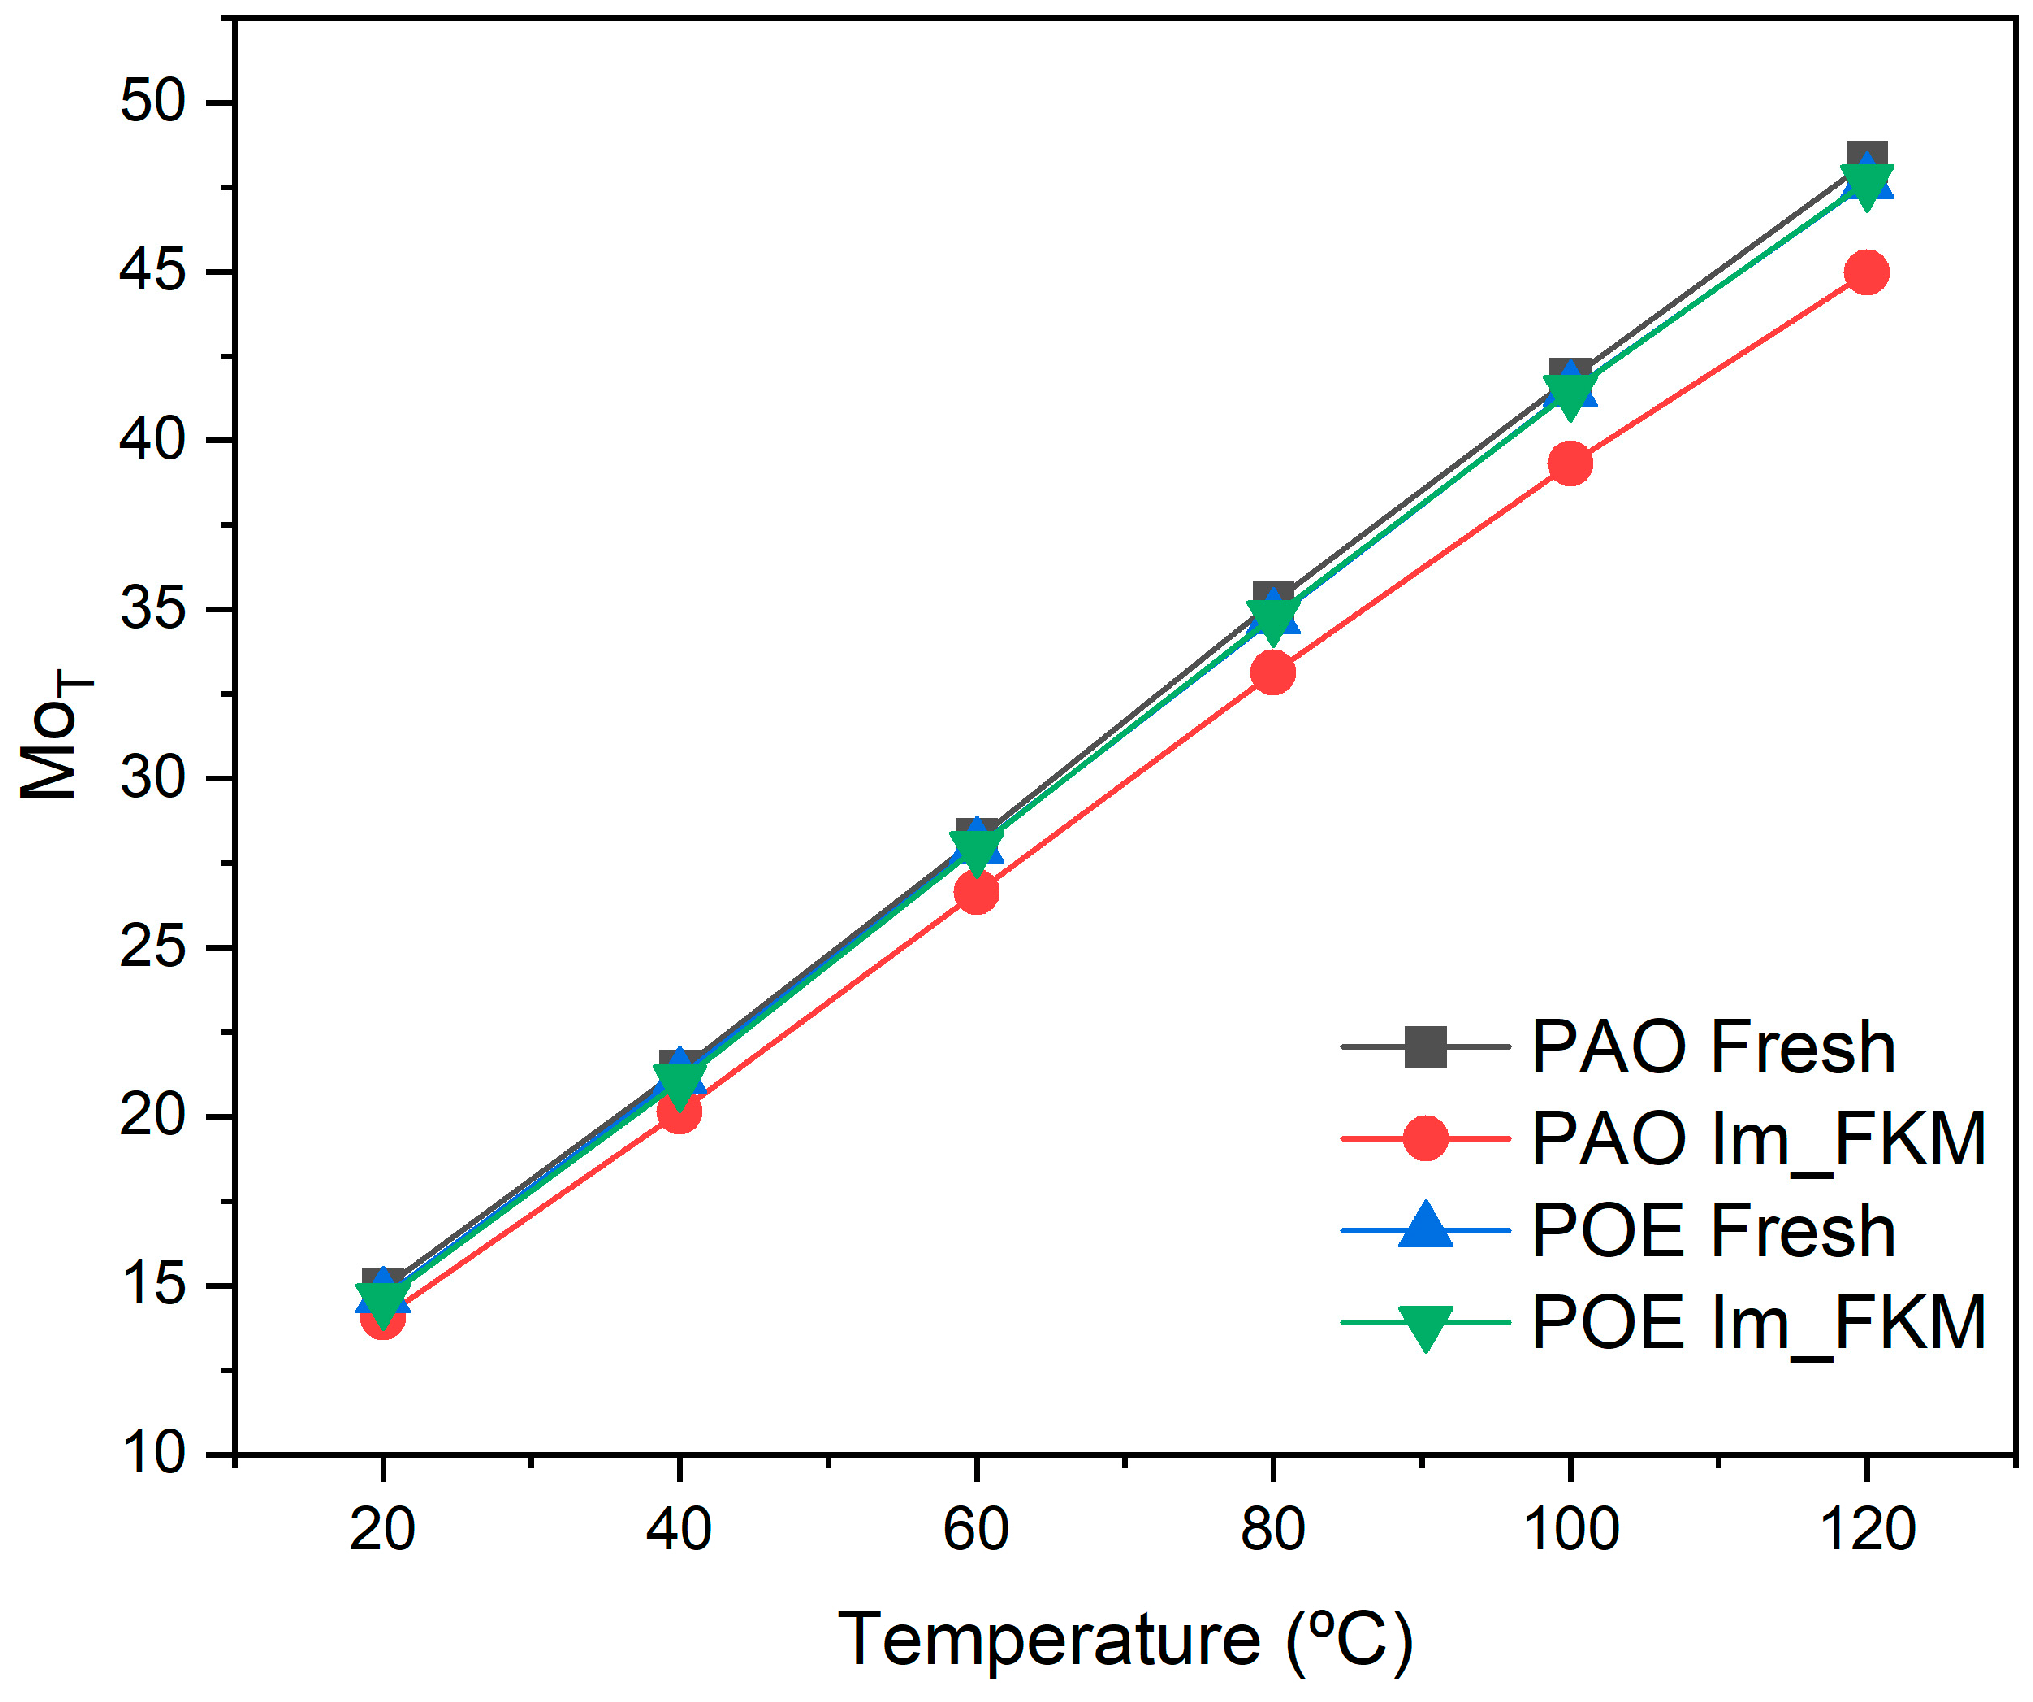
24]. Using Equation (4), the Mouromtseff number was calculated for both fluids under fresh and post-immersion conditions across 20–120 °C, with results for laminar (MoL) and turbulent (MoT) flow presented in Figure 8 and Figure 9, respectively.
The average changes in MoL and MoT over 20–120 °C are summarized in Table 8. For PAO4, MoL decreases by 2.80% and MoT by 6.67% after the test, reflecting the combined effect of a slight reduction in thermal conductivity and specific heat capacity, alongside increases in kinematic viscosity and density. These changes are consistent with thermal degradation, with no direct evidence of elastomer influence. For POE, MoL increases by 0.22% and MoT decreases by 0.20%. The minor improvement in MoL suggests that POE’s heat transfer performance under laminar flow conditions is slightly enhanced, possibly due to moisture uptake, while the small decrease in MoT indicates sensitivity to viscosity changes in turbulent flow.

3.2.3. Electrical Properties

E-thermal fluids in electric vehicles must exhibit robust electrical insulating properties to ensure passenger safety, protect battery and electronic components, and withstand the combined thermal and electrical stresses during operation. This study evaluated the resistivity, dissipation factor, and breakdown voltage (BDV) of polyalphaolefin (PAO4) and polyol ester (POE) before and after immersion testing with fluoroelastomer (FKM) to assess their stability and compatibility under conditions simulating EV thermal management systems.
The dissipation factor, which quantifies dielectric losses in a fluid as the ratio of energy dissipated to energy stored, represents the heat loss under an alternating electric field. An ideal dielectric fluid exhibits a dissipation factor near zero, indicating minimal energy loss. These losses are influenced by material polarity, temperature, and contamination, such as through moisture or degradation products. In EV applications, excessive dielectric losses can generate heat, counteracting cooling efficiency and potentially leading to insulation failure in high-voltage environments. For transformer oils under AC conditions, the dissipation factor is a critical performance indicator, with standards like IEC 60247 [27] typically requiring values below 1% to minimize energy loss and ensure reliability. In DC battery systems, such as those in EVs, dielectric losses are less pronounced due to the absence of alternating fields; however, the dissipation factor serves as a sensitive, cost-effective indicator of fluid quality, enabling rapid degradation assessment using widely available methods [31]. This dual role underscores its importance in immersion cooling, where fluid stability directly impacts thermal management and electrical safety over the battery’s lifespan.
The dissipation factor showed modest increases post-immersion, as depicted in Figure 10. For PAO4, the dissipation factor rose from 0.14% (fresh) to 0.3% (post-immersion), while POE exhibited an increase from 1.0% to 1.2%. These increments suggest a slight elevation in dielectric losses, potentially due to thermal degradation at 120 °C or minor leaching of polar species from FKM into the fluid. PAO4′s low absolute values, remaining well below the 1% threshold, indicate a minimal impact on insulation performance and heat generation in EV systems. In contrast, POE’s higher baseline, attributed to its polar ester groups, and its post-immersion value, while still below critical levels for some applications, suggest greater susceptibility to degradation-induced losses.
Resistivity, a measure of a fluid’s electrical insulation capacity, displayed divergent trends post-immersion, as shown in Figure 11. PAO4′s resistivity decreased from 19 GΩ·m (fresh) to 16.3 GΩ·m (post-immersion), a 14% reduction, while POE’s resistivity dropped from 5 GΩ·m to 0.32 GΩ·m, a 94% decline, rendering it nearly conductive. For PAO4, the modest decrease may result from minor oxidative breakdown or impurity accumulation, yet its post-immersion value retains sufficient insulating capability for EV applications. Conversely, POE’s severe resistivity loss indicates thermal hydrolysis or ionization of its ester groups, likely exacerbated by moisture absorption, compromising its insulating performance and correlating with its elevated dissipation factor. The inherently lower resistivity of ester oils compared to polyalphaolefins arises from their chemical polarity, attributed to C=O and C-O bonds, which facilitate charge transport more efficiently [12]. To elucidate these changes, a water content analysis was employed.
The electrical properties of fluids are highly sensitive to water content, where even a minor increase can significantly reduce resistivity by enhancing ionic conductivity. Table 9 presents the water content variations for PAO4 and POE before and after immersion testing. PAO4′s water content increased moderately from 62.9 ppm to 102.6 ppm, while POE’s exhibited a substantial increase from 154.4 ppm to 859.4 ppm. For PAO4, the modest resistivity decrease aligns with its moderate moisture increase, maintaining its insulating capability. POE’s severe resistivity loss, however, correlates with its significant water uptake, suggesting that moisture—potentially from FKM leaching, hydrolysis, or humidity absorption—enhances ionic conductivity, particularly given POE’s polar structure. According to Daccord [24], a minimum fluid resistivity threshold of 0.2 GΩ·m is typically required for immersion cooling applications, even for polluted or end-of-life fluid. Although this study does not replicate end-of-life conditions, POE’s post-immersion resistivity (0.32 GΩ·m) approaches this limit, raising concerns regarding its long-term reliability in EV systems.
At the molecular level, POE’s ester groups (R-COO-R’) are susceptible to nucleophilic attack by water molecules under thermal stress, leading to hydrolysis.
R-COO-R’ + H2O → R-COOH + R’-OH
The resulting carboxylic acids (R-COOH) and alcohols (R’-OH) are polar and can dissociate into ions in the presence of water, increasing the fluid’s ionic content. Additionally, water itself (with a high dielectric constant) enhances ion mobility, further reducing resistivity. FKM may contribute trace moisture or polar species during immersion, but the primary driver appears to be POE’s inherent susceptibility to moisture absorption due to its polarity, as evidenced by the water content data.
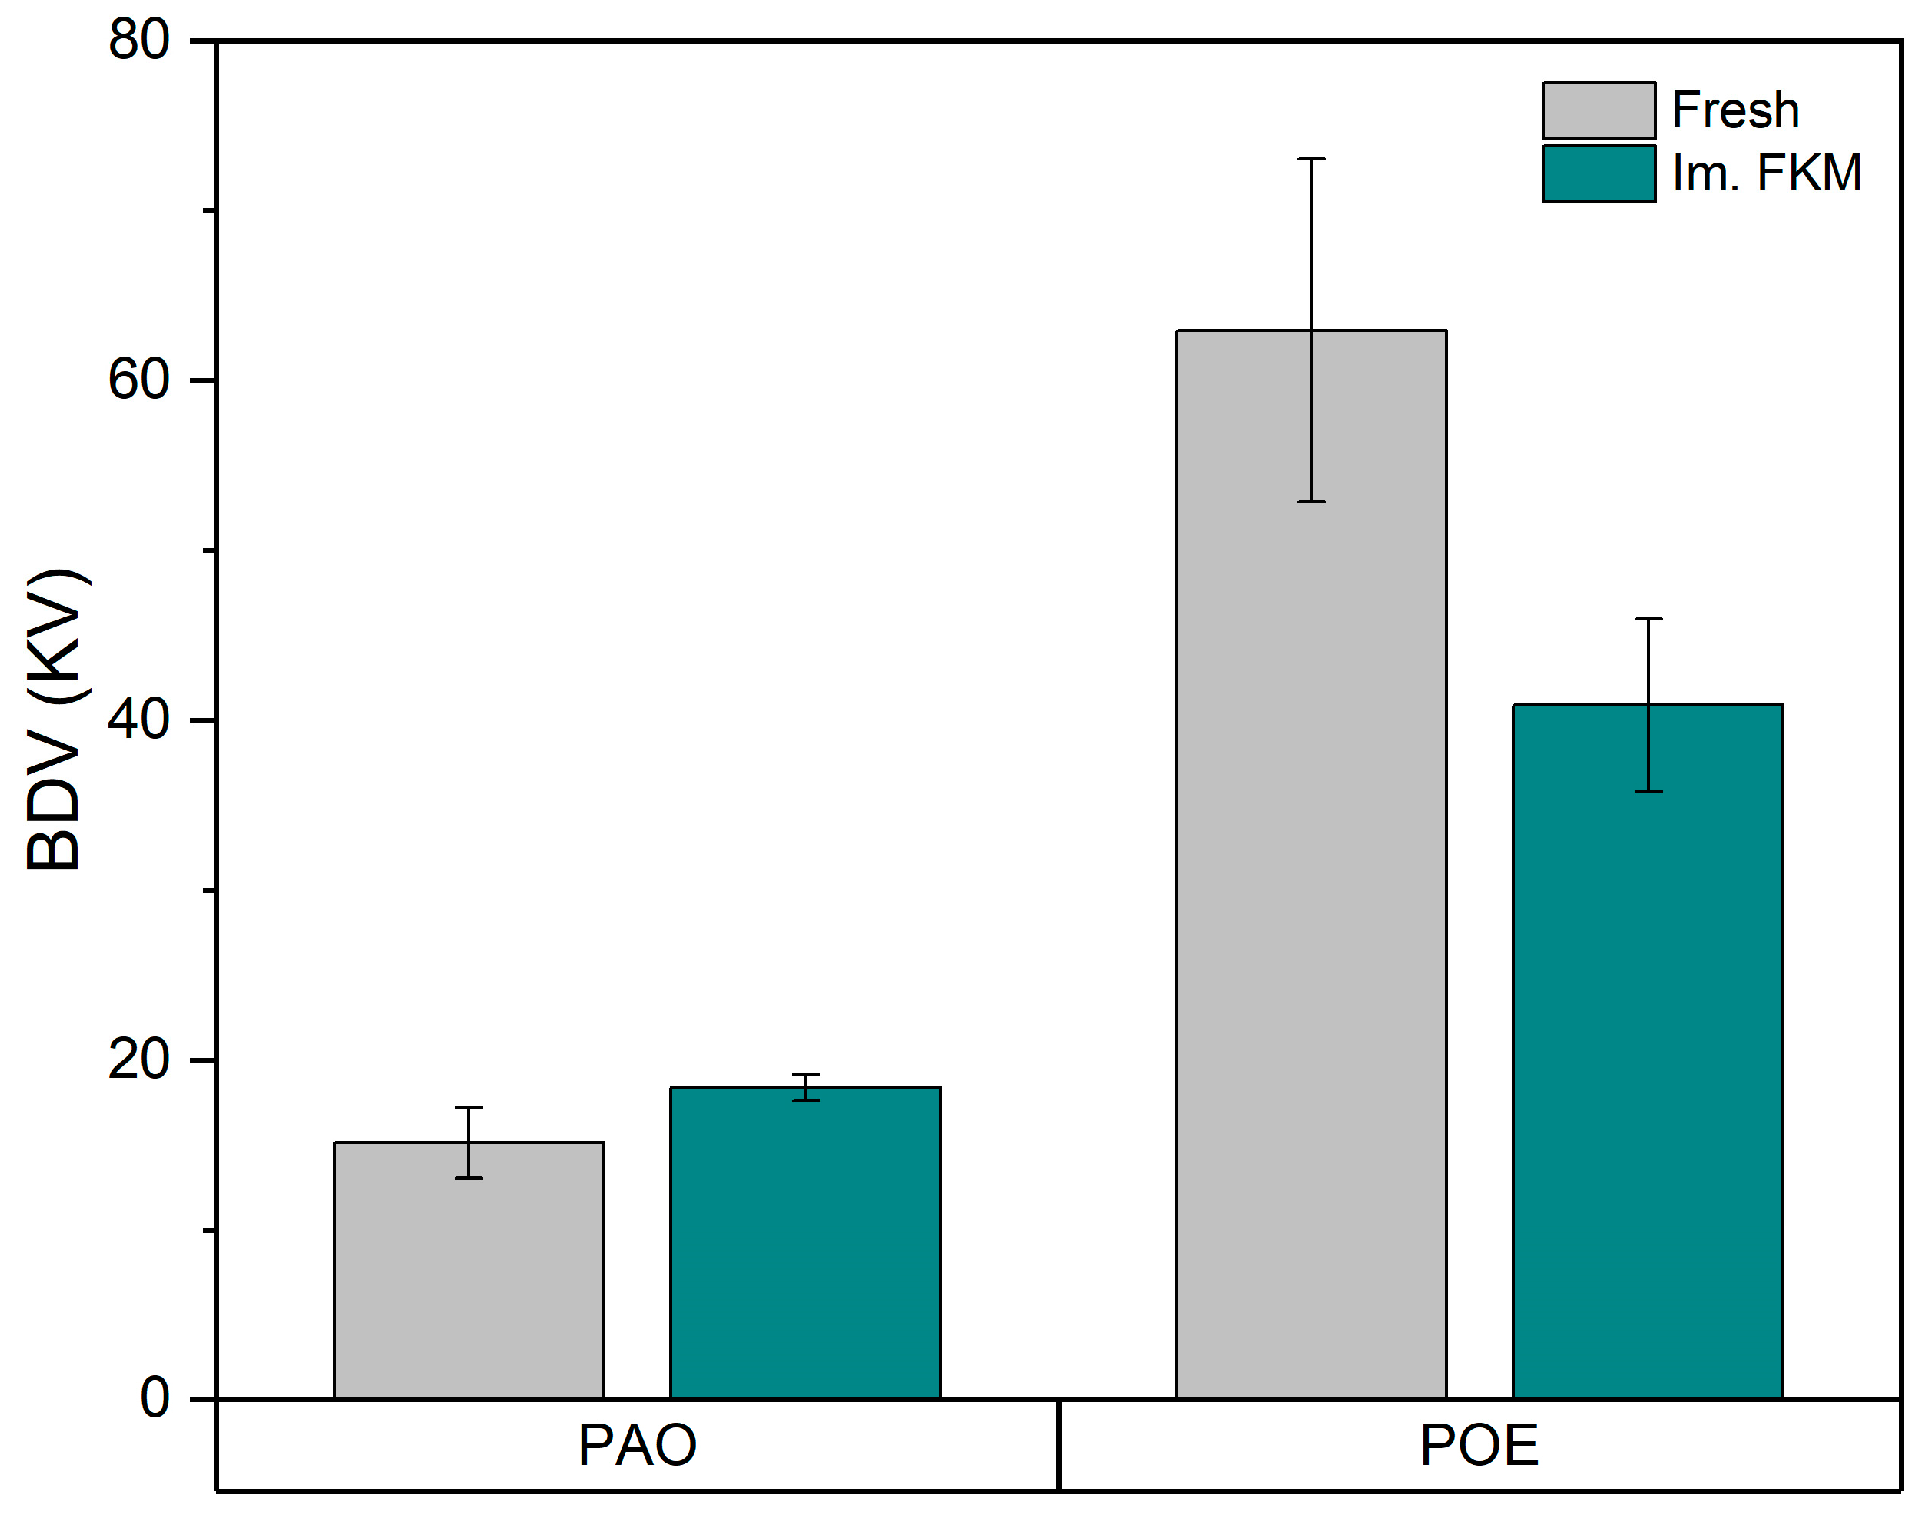
Breakdown voltage (BDV), which indicates the voltage at which a fluid fails as an insulator, further highlighted these differences, as shown in Figure 12. PAO4′s BDV increased from 15.2 kV (fresh) to 18.4 kV (post-immersion), a 21% improvement, possibly due to the volatilization of impurities during thermal exposure, enhancing its dielectric strength, consistent with the results of prior studies [8,24]. Conversely, POE’s BDV decreased from 62.9 kV to 40.9 kV, a 35% reduction, aligning with its diminished resistivity and increased dissipation factor. POE’s high moisture level (859.4 ppm) and oxidation products likely reduced its dielectric strength by increasing the ionic pathways. While POE’s post-immersion BDV is still higher in comparison to that of PAO, which is better for this application, its significant decline suggests vulnerability to moisture-related thermal stress, impacting the safety and efficiency in DC battery systems over time.
These electrical property changes have significant implications for EV immersion cooling applications. PAO4 demonstrates commendable stability, with maintained resistivity above industry standards, a low dissipation factor indicating minimal dielectric losses, an improved BDV, and a minimally altered FKM surface (Section 3.2.2), making it a robust choice for systems requiring consistent electrical insulation, such as battery packs or motor windings. POE, despite its initially higher BDV, exhibits substantial degradation of resistivity and BDV, with a higher dissipation factor, extreme water uptake (859.4 ppm), and a degraded FKM surface (roughness and precipitates), signaling significant reliability concerns for DC battery cooling, where fluid and seal stability are critical over extended operational periods. Future research could explore the addition of moisture scavengers or antioxidants to POE to mitigate water uptake and hydrolysis, reducing dielectric losses and improving FKM compatibility, thereby enhancing its viability for EV applications.

4. Conclusions

The objective of this research is to evaluate the compatibility of fluoroelastomer (FKM) with two base fluids, polyalphaolefin (PAO4) and polyol ester (POE), for potential electric vehicle (EV) applications.
The immersion tests revealed contrasting effects of PAO and POE on the physical properties of FKM. PAO4 exposure resulted in a mass loss of −1.69%, attributed to the extraction of low-molecular-weight compounds, while POE caused a mass gain of +2.76% due to fluid absorption. These interactions led to contrasting changes in FKM hardness, i.e., PAO4 increased hardness by +6 Shore A, reflecting a hardening effect, whereas POE decreased hardness by −4 Shore A, indicative of plasticization and enhanced flexibility. Both fluids improved FKM’s mechanical properties, with tensile strength and ultimate elongation increasing post-testing, although PAO4′s hardening effect was more pronounced compared to POE’s plasticizing influence.
The findings of this study additionally reveal that the interaction between the fluid and the elastomer exerts an asymmetrical impact, with the fluid exerting a greater influence on the elastomer than vice versa. The observed changes in the physical, thermal, and electrical properties of the fluids closely align with the trends associated with thermal degradation, irrespective of contact with the FKM elastomer. This indicates that the elastomer’s contribution to fluid property changes is minimal under the tested conditions. Conversely, the degradation and swelling behavior of FKM suggests a more pronounced susceptibility to the chemical and thermal effects of the fluids, particularly POE. These results underscore the importance of considering both thermal stability and fluid–elastomer compatibility in the selection of materials for EV immersion cooling applications, where operational reliability depends on maintaining both fluid performance and elastomer integrity under demanding conditions.
The fluid properties, however, showed minimal changes beyond the effects of thermal degradation. PAO4′s thermal conductivity at 40 °C decreased from 0.1411 W/m·K to 0.1400 W/m·K (−0.78%), while POE’s increased from 0.1455 W/m·K to 0.1460 W/m·K (+0.34%), both remaining above the 0.14 W/m·K EV threshold. Average changes across 20–120 °C were −0.47% for PAO4 and +0.47% for POE, within the ±2% equipment uncertainty. Specific heat capacity varied by −0.69% (PAO4) and +0.09% (POE), also within uncertainty levels. The Mouromtseff number showed PAO4′s MoL decreasing by 2.80% and MoT by 6.67%, while POE’s MoL rose by 0.22% and MoT fell by 0.20%, driven by minor shifts in viscosity and density. PAO4 maintained a high resistivity, but POE’s dropped due to hydrolysis and the water content rising from 154.4 ppm to 859.4 ppm.
These results demonstrate that the fluid, particularly POE, significantly impacts FKM properties, while FKM exerts minimal influence on the fluid’s properties. The degradation and swelling of FKM with POE highlight its susceptibility to chemical and thermal effects, driven by polarity differences and fluid absorption.
These findings underscore the importance of balancing thermal stability, electrical performance, and fluid–elastomer compatibility in material selection for EV immersion cooling systems. While PAO4′s stability makes it a strong candidate, POE’s performance suggests that optimization—potentially through additives like moisture scavengers or antioxidants to mitigate hydrolysis and moisture uptake—could enhance its suitability. Future research should explore these additives and investigate the long-term effects of cyclic thermal and electrical stress on fluid–elastomer interactions to ensure operational reliability under demanding EV conditions.

Supplementary Materials

The following supporting information can be downloaded at: https://www.mdpi.com/article/10.3390/lubricants13040176/s1, Figure S1: Stereomicroscope images of original FKM surface at 80x magnification, scale bar = 100 μm; Figure S2: Stereomicroscope images of FKM surface at 80x magnification after immersion in PAO4, scale bar = 100 μm; Figure S3: Stereomicroscope images of FKM surface at 80x magnification after immersion in POE, scale bar = 100 μm; Figure S4. Comparison of stereomicroscope images of FKM surface at 80x magnification: (a) without immersion, (b) after immersion in PAO4, and (c) after immersion in POE, scale bar = 100 μm.

Author Contributions

Conceptualization, B.T. and A.B.; formal analysis, J.M.L.D.R. and A.B.; funding acquisition, B.T.; investigation, A.B.; methodology, B.T., A.B. and E.G.; project administration, B.T.; resources, B.T.; supervision, B.T.; writing—original draft, A.B.; writing—review and editing, B.T., J.M.L.D.R., A.B. and E.G. All authors have read and agreed to the published version of the manuscript.

Funding

This research was partially supported by the project CIAICO/2021/013 AICO 2022, funded by GVA, Generalitat Valenciana. Adbeel Balaguer is supported through the program Subvenciones para la Contratación de Personal Investigador Predoctoral of the Generalitat Valenciana and the European Social Fund Plus [grant number CIACIF/2021/241].

Data Availability Statement

The original contributions presented in this study are included in the article/Supplementary Materials. Further inquiries can be directed to the corresponding authors.

Conflicts of Interest

The authors declare no conflicts of interest. The funders had no role in the design of the study; in the collection, analyses, or interpretation of data; in the writing of the manuscript; or in the decision to publish the results.

References

  1. Roe, C.; Feng, X.; White, G.; Li, R.; Wang, H.; Rui, X.; Li, C.; Zhang, F.; Null, V.; Parkes, M.; et al. Immersion cooling for lithium-ion batteries—A review. J. Power Sources 2022, 525, 231094. [Google Scholar] [CrossRef]
  2. Sundin, D.W.; Sponholtz, S. Thermal management of Li-Ion batteries with single-phase liquid immersion cooling. IEEE Open J. Veh. Technol. 2020, 1, 82–92. [Google Scholar] [CrossRef]
  3. Patil, M.S.; Seo, J.-H.; Lee, M.-Y. A novel dielectric fluid immersion cooling technology for Li-ion battery thermal management. Energy Convers. Manag. 2021, 229, 113715. [Google Scholar] [CrossRef]
  4. Williams, N.P.; Trimble, D.; O’Shaughnessy, S.M. Thermal management of Lithium-ion Batteries for Electric Vehicles through Immersion Cooling. In Proceedings of the 2023 22nd IEEE Intersociety Conference on Thermal and Thermomechanical Phenomena in Electronic Systems (ITherm), Orlando, FL, USA, 30 May–2 June 2023; pp. 1–6. [Google Scholar]
  5. Wahab, A.; Najmi, A.-U.; Senobar, H.; Amjady, N.; Kemper, H.; Khayyam, H. Immersion cooling innovations and critical hurdles in Li-ion battery cooling for future electric vehicles. Renew. Sustain. Energy Rev. 2025, 211, 115268. [Google Scholar] [CrossRef]
  6. Narita, K.; Takekawa, D. Lubricants Technology Applied to Transmissions in Hybrid Electric Vehicles and Electric Vehicles. In Proceedings of the 2019 JSAE/SAE Powertrains, Fuels and Lubricants, Kyoto, Japan, 26–29 August 2019. SAE Technical Papers, SAE International. [Google Scholar] [CrossRef]
  7. Satyanarayana, G.; Sudhakar, D.R.; Goud, V.M.; Ramesh, J.; Pathanjali, G. Experimental investigation and comparative analysis of immersion cooling of lithium-ion batteries using mineral and therminol oil. Appl. Therm. Eng. 2023, 225, 120187. [Google Scholar] [CrossRef]
  8. Tormos, B.; Bermúdez, V.; Ruiz, S.; Alvis-Sanchez, J. Degradation Effects of Base Oils after Thermal and Electrical Aging for EV Thermal Fluid Applications. Lubricants 2023, 11, 241. [Google Scholar] [CrossRef]
  9. Benda, R.; Bullen, J.; Plomer, A. Synthetics basics: Polyalphaolefins—base fluids for high-performance lubricants. J. Synth. Lubr. 1996, 13, 41–57. [Google Scholar] [CrossRef]
  10. He, J.; Wang, B.; Ma, A.; Liu, D.; Yang, L.; Zhang, A.; Pan, S.; Yu, H.; Li, H.; Gui, J. Low-viscosity poly-α-olefin production from Fischer-Tropsch mixed α-olefins: Synthesis and kinetics. Fuel 2025, 386, 134322. [Google Scholar] [CrossRef]
  11. Lin, L.; Kedzierski, M.A. Density and viscosity of a polyol ester lubricant: Measurement and molecular dynamics simulation. Int. J. Refrig. 2020, 118, 188–201. [Google Scholar] [CrossRef] [PubMed]
  12. Rodríguez, E.; Rivera, N.; Fernández-González, A.; Pérez, T.; González, R.; Battez, A.H. Electrical compatibility of transmission fluids in electric vehicles. Tribol. Int. 2022, 171, 107544. [Google Scholar] [CrossRef]
  13. Flitney, R. Materials. In Seals and Sealing Handbook, 6th ed.; Elsevier Ltd.: Amsterdam, The Netherlands, 2014; pp. 369–435. [Google Scholar] [CrossRef]
  14. McKeen, L. Chapter10—The effect of heat aging on the properties of elastomers and rubbers. In The Effect of Long Term Thermal Exposure on Plastics and Elastomers, 2nd ed.; William Andrew Publishing: Norwich, NY, USA, 2021; pp. 277–312. [Google Scholar] [CrossRef]
  15. García-Tuero, A.; Ramajo, B.; Valbuena, G.D.; Fernández-González, A.; Mendoza, R.; García, A.; Battez, A.H. Automatic Transmission Fluids in Electrified Transmissions: Compatibility with Elastomers. Appl. Sci. 2022, 12, 6213. [Google Scholar] [CrossRef]
  16. Durbin, T.D.; Karavalakis, G.; Norbeck, J.M.; Park, C.S.; Castillo, J.; Rheem, Y.; Bumiller, K.; Yang, J.; Van, V.; Hunter, K. Material compatibility evaluation for elastomers, plastics, and metals exposed to ethanol and butanol blends. Fuel 2016, 163, 248–259. [Google Scholar] [CrossRef]
  17. Müller, M.; Šleger, V.; Čedík, J.; Pexa, M. Research on the Material Compatibility of Elastomer Sealing O-Rings. Polymers 2022, 14, 3323. [Google Scholar] [CrossRef] [PubMed]
  18. Tormos, B.; Bermúdez, V.; Balaguer, A.; Giménez, E. Compatibility Study of Polyamide (PA6) with Lubricant Bases for Electric Vehicle Applications. Lubricants 2024, 12, 54. [Google Scholar] [CrossRef]
  19. ASTM D7216; Standard Test Method for Determining Automotive Engine Oil Compatibility with Typical Seal Elastomers. ASTM International: West Conshohocken, PA, USA, 2023.
  20. ASTM D638; Standard Test Method for Tensile Properties of Plastics. ASTM International: West Conshohocken, PA, USA, 2022.
  21. ASTM D2240; Standard Test Method for Rubber Property—Durometer Hardness. ASTM International: West Conshohocken, PA, USA, 2021.
  22. Kwak, Y.; Cleveland, C.; Adhvaryu, A.; Fang, X.; Hurley, S.; Adachi, T. Understanding Base Oils and Lubricants for Electric Drivetrain Applications. In Proceedings of the 2019 JSAE/SAE Powertrains, Fuels and Lubricants, Nashville, Tennessee, 20 May 2019. [Google Scholar]
  23. ASTM D7042-21a; Test Method for Dynamic Viscosity and Density of Liquids by Stabinger Viscometer (and the Calculation of Kinematic Viscosity). ASTM International: West Conshohocken, PA, USA, 2021. [CrossRef]
  24. Daccord, R.; Kientz, T.; Bouillot, A. Aging of a dielectric fluid used for direct contact immersion cooling of batteries. Front. Mech. Eng. 2023, 9, 1212730. [Google Scholar] [CrossRef]
  25. ASTM D7896-19; Test Method for Thermal Conductivity, Thermal Diffusivity and Volumetric Heat Capacity of Engine Coolants and Related Fluids by Transient Hot Wire Liquid Thermal Conductivity Method. ASTM International: West Conshohocken, PA, USA, 2019. [CrossRef]
  26. Thermal Conductivity—What It Is and It’s Formula. Available online: https://thermtest.com/what-is-thermal-conductivity (accessed on 9 March 2025).
  27. IEC 60247:2004|IEC. Available online: https://webstore.iec.ch/en/publication/1150 (accessed on 13 January 2025).
  28. ASTM D1816; Test Method for Dielectric Breakdown Voltage of Insulating Liquids Using VDE Electrodes. ASTM International: West Conshohocken, PA, USA, 2019. [CrossRef]
  29. ASTM E1064; Test Method for Water in Organic Liquids by Coulometric Karl Fischer Titration. ASTM International: West Conshohocken, PA, USA, 2016. [CrossRef]
  30. Eyerer, S.; Eyerer, P.; Eicheldinger, M.; Tübke, B.; Wieland, C.; Spliethoff, H. Theoretical analysis and experimental investigation of material compatibility between refrigerants and polymers. Energy 2018, 163, 782–799. [Google Scholar] [CrossRef]
  31. Kass, M.D.; Theiss, T.; Pawel, S.; Baustian, J.; Wolf, L.; Koch, W.; Janke, C. Compatibility Assessment of Elastomer Materials to Test Fuels Representing Gasoline Blends Containing Ethanol and Isobutanol. SAE Int. J. Fuels Lubr. 2014, 7, 445–456. [Google Scholar] [CrossRef]
Figure 1. Fluoroelastomer (FKM) samples prepared for testing: a dumbbell-shaped specimen (bottom) for tensile testing and a rectangular specimen (top) for mass and hardness measurements.
Lubricants 13 00176 g001
Figure 2. Stress–strain curves for FKM. Stress–strain curves of FKM (black), FKM after PAO4 immersion (red), and FKM after POE immersion (blue).
Lubricants 13 00176 g002
Figure 3. Stereomicroscope images of FKM surface at 80× magnification: (a) without immersion, (b) after immersion in PAO4, and (c) after immersion in POE; scale bar = 100 μm.
Lubricants 13 00176 g003
Figure 4. Kinematic viscosity of PAO and POE before and after the immersion test. Kinematic viscosity (mm2/s) of PAO4 and POE before (Fresh) and after the immersion (Im_FKM) at temperatures from 20 to 120 °C. Error bars represent standard deviation from triplicate measurements. (a) PAO4; (b) POE.
Lubricants 13 00176 g004
Figure 5. Density of PAO and POE before and after the immersion test. Density (kg/m3) of PAO4 and POE before (Fresh) and after immersion in FKM across 20 to 120 °C. Error bars indicate standard deviation. (a) PAO4; (b) POE.
Lubricants 13 00176 g005
Figure 6. Thermal conductivity of each fluid before and after the test. Thermal conductivity (W/m·K) of PAO4 and POE before (Fresh) and after immersion test at 120 °C for 168 h with fluoroelastomer contact (Im_FKM). Data points represent the mean of triplicate measurements, with a standard deviation of approximately 0.001 W/m·K. (a) PAO4; (b) POE.
Lubricants 13 00176 g006
Figure 7. Specific heat capacity (Cp) of each fluid before and after the test. Specific heat capacity (kJ/kg·K) of PAO4 and POE before (Fresh) and after immersion in contact with FKM (Im_FKM) at 120 °C for 168 h. Data points represent the mean of triplicate measurements, with a standard deviation of approximately 0.003 kJ/kg·K. (a) PAO4; (b) POE.
Lubricants 13 00176 g007
Figure 8. Mo for laminar flow of each fluid.
Lubricants 13 00176 g008
Figure 9. Mo for turbulent flow of each fluid.
Lubricants 13 00176 g009
Figure 10. Dissipation Factor of PAO4 and POE before and after immersion testing. Dissipation factor (%) of PAO4 and POE before (Fresh) and after immersion with FKM (Im_FKM) at 120 °C for 168 h. Error bars represent the standard deviation.
Lubricants 13 00176 g010
Figure 11. Resistivity of fluids before and after immersion testing. Resistivity (GΩ·m) of PAO4 and POE before (Fresh) and after immersion with FKM (Im_FKM) at 120 °C for 168 h, measured at 90 °C. Error bars represent the standard deviation.
Lubricants 13 00176 g011
Figure 12. Breakdown voltage of PAO4 and POE before and after immersion testing. Breakdown voltage (kV) of PAO4 and POE before (Fresh) and after immersion with FKM (Im_FKM) at 120 °C for 168 h. Error bars represent the standard deviation.
Lubricants 13 00176 g012
Table 1. Density (ρ), kinematic viscosity(ν), and viscosity index (VI) of the fluids used.
Fluidρ 15 °Cν 40 °Cν 100 °CVI
PAO0.8195 g/mL17.90 mm2/s4.03 mm2/s125
POE0.9460 g/mL19.84 mm2/s4.45 mm2/s140
Table 2. Equipment and standards used for measured properties.
PropertiesEquipmentStandard
Viscosity and densitySVM 3001 Viscometer, Anton PaarASTM D7042
Breakdown voltageHZJQ-X1, HuazhengASTM D1816
Resistivity and dissipation factorOil Tan Delta & Resistivity DF9010 system, APT Power Technology Co.IEC 60247
Thermal conductivity and specific heat capacityTHW-L1, Thermtest InstrumentsASTM D7896
Water content917 Coulometer, MetrohmASTM E1064
Table 3. Mass change of FKM samples after the immersion test.
Immersion FluidMass Change (%)±SD
PAO−1.690.01
POE2.76 0.07
Table 4. Hardness of FKM samples before and after the immersion test, along with the corresponding hardness change.
ConditionHardness (Shore A Points)±SDHardness Change (Shore A Points)±SD
Pre-immersion751
After Immersion in PAO810.3860.33
After Immersion in POE710.64−40.73
Table 5. Tensile properties of FKM after the immersion in the base fluids.
FluidTensile Strength (MPa)±SDUltimate Elongation (%)±SD
No immersion3.20.2 84.82.2
PAO5.40.3123.65.6
POE4.0±0.2128.19.4
Table 6. Percentage of change for the tensile properties.
FluidTensile Strength Change (%)±SDUltimate Elongation Change (%)±SD
PAO66.3 45.7
POE24.7 51.1
Table 7. Exponents of the Mouromtseff number equation for laminar and turbulent flow.
Exponent Laminar Flow Turbulent Flow
a0.33 0.80
b0.670.67
c0.330.33
d0.170.47
Table 8. Average variation in physical and thermal properties after the immersion test.
PropertyPAOPOE
Thermal conductivity−0.47%0.47%
Specific heat capacity−0.69%0.09%
Kinematic viscosity0.97%1.30%
Density0.27%0.19%
Mo laminar−2.80%0.22%
Mo turbulent−6.67%−0.20%
Table 9. Water content of PAO and POE before and after the immersion test.
FluidWater Content (ppm) SD
PAO Fresh 62.90.57
PAO After Immersion 102.60.57
POE Fresh 154.46.06
POE After Immersion 859.45.94
Disclaimer/Publisher’s Note: The statements, opinions and data contained in all publications are solely those of the individual author(s) and contributor(s) and not of MDPI and/or the editor(s). MDPI and/or the editor(s) disclaim responsibility for any injury to people or property resulting from any ideas, methods, instructions or products referred to in the content.

