Tribological Behaviors and Statistical Experimental Design of Sintered and Age-Hardened Aluminum–Copper Based Composites

 ,
, 

 and
and
Abstract
1. Introduction
2. Materials and Experimental Methods
2.1. Material Selections
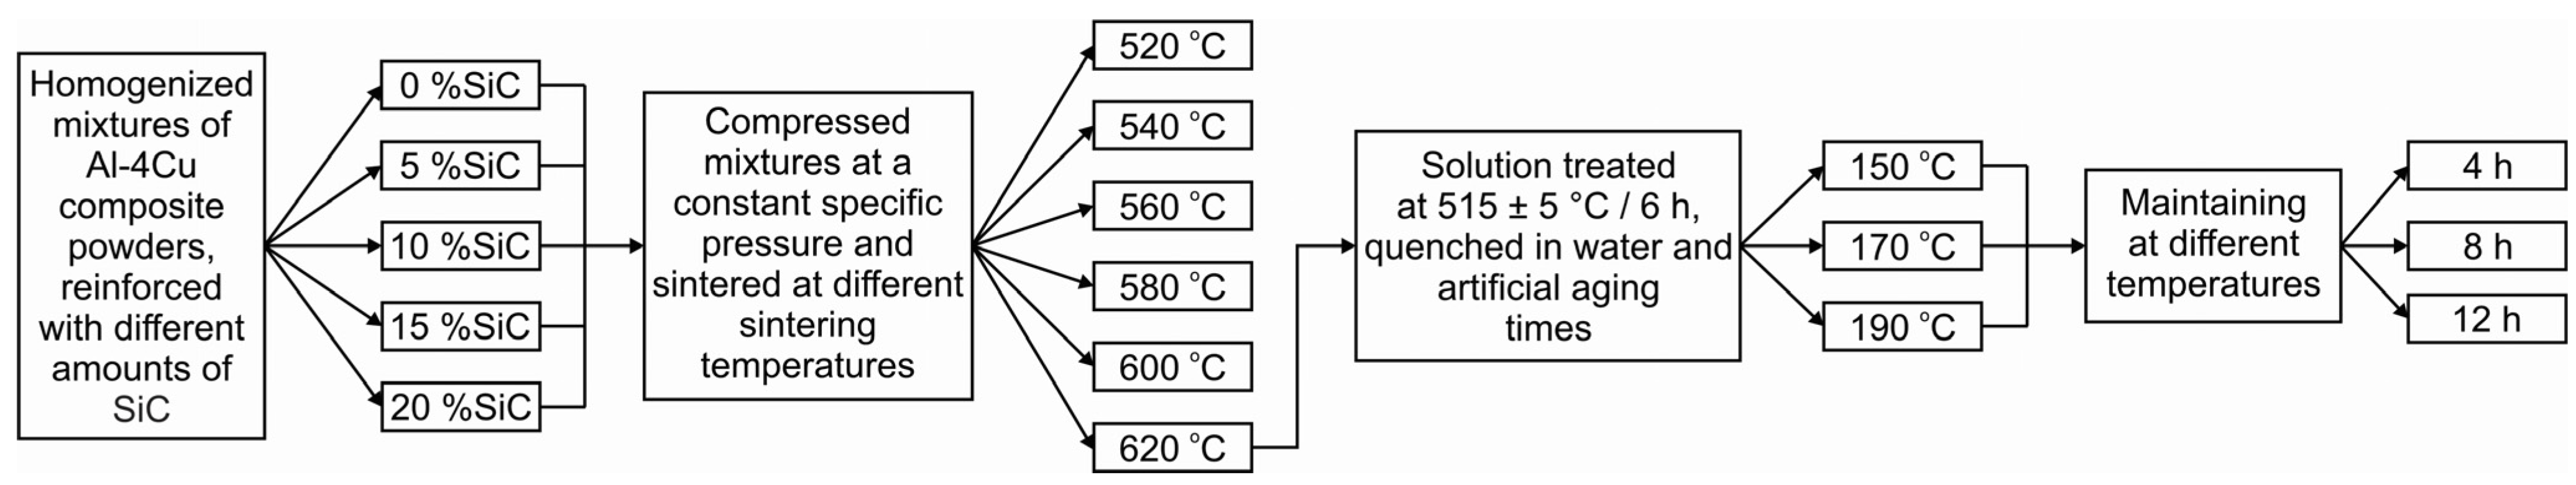
2.2. Experimental Procedure
2.3. Factorial Design of Experiments
3. Experimental Results and Discussion
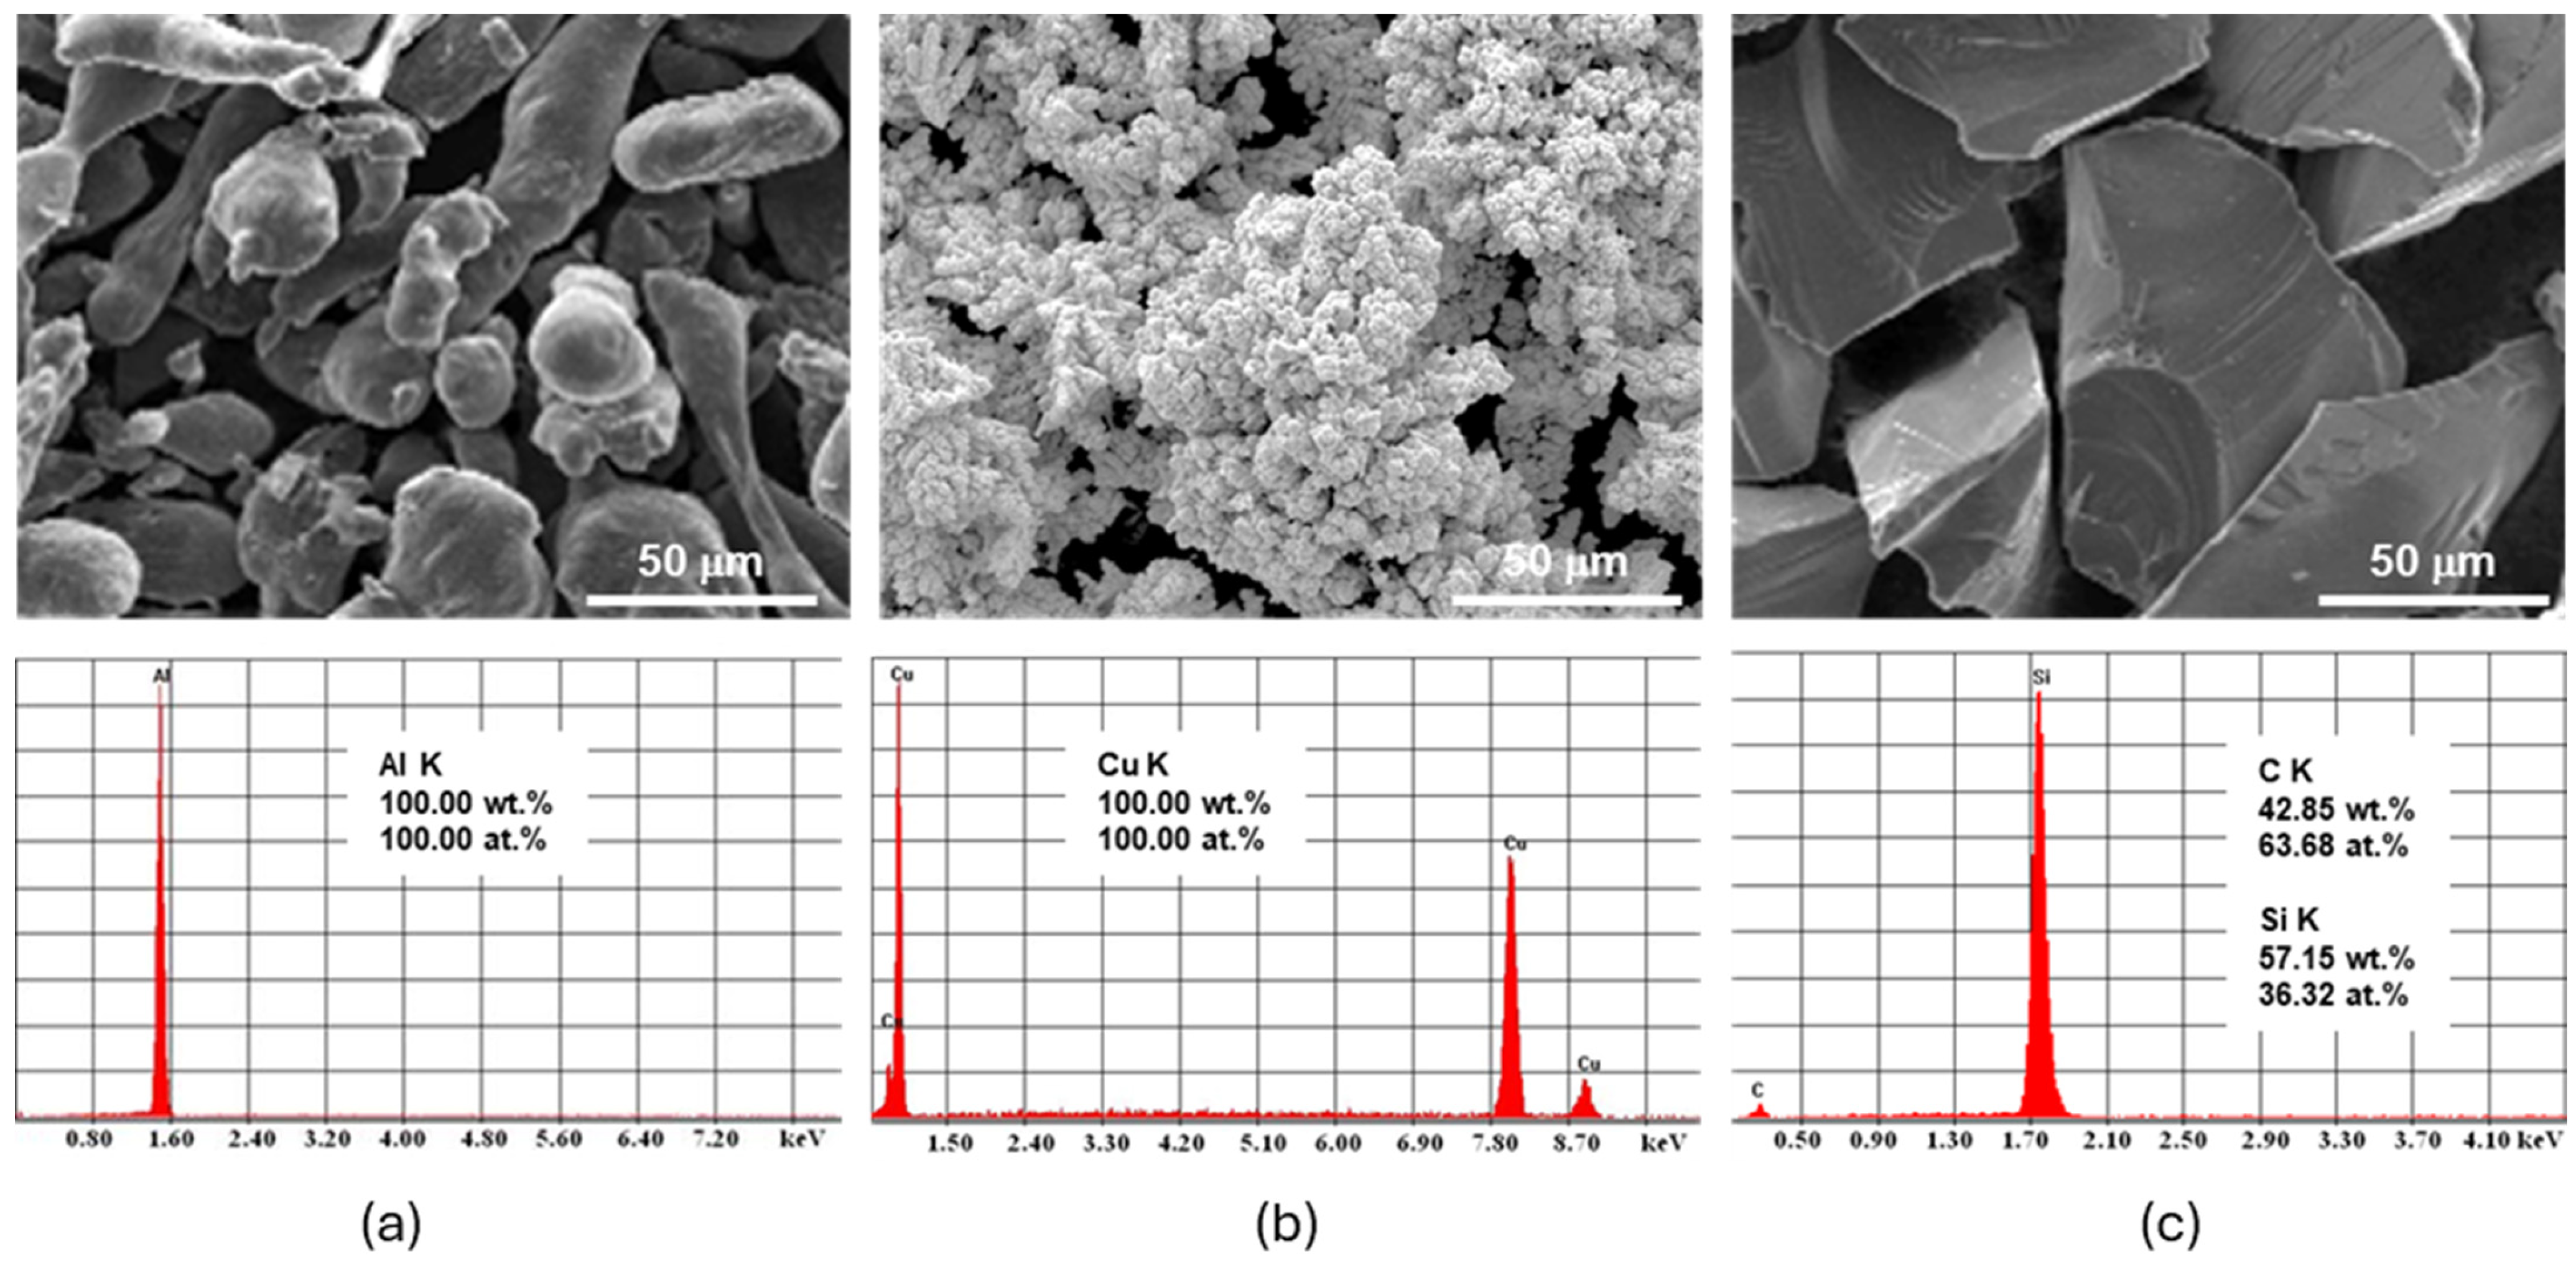
3.1. Raw and Mixture Powders’ Characterizations
3.2. Characterizations of Compacted Parts
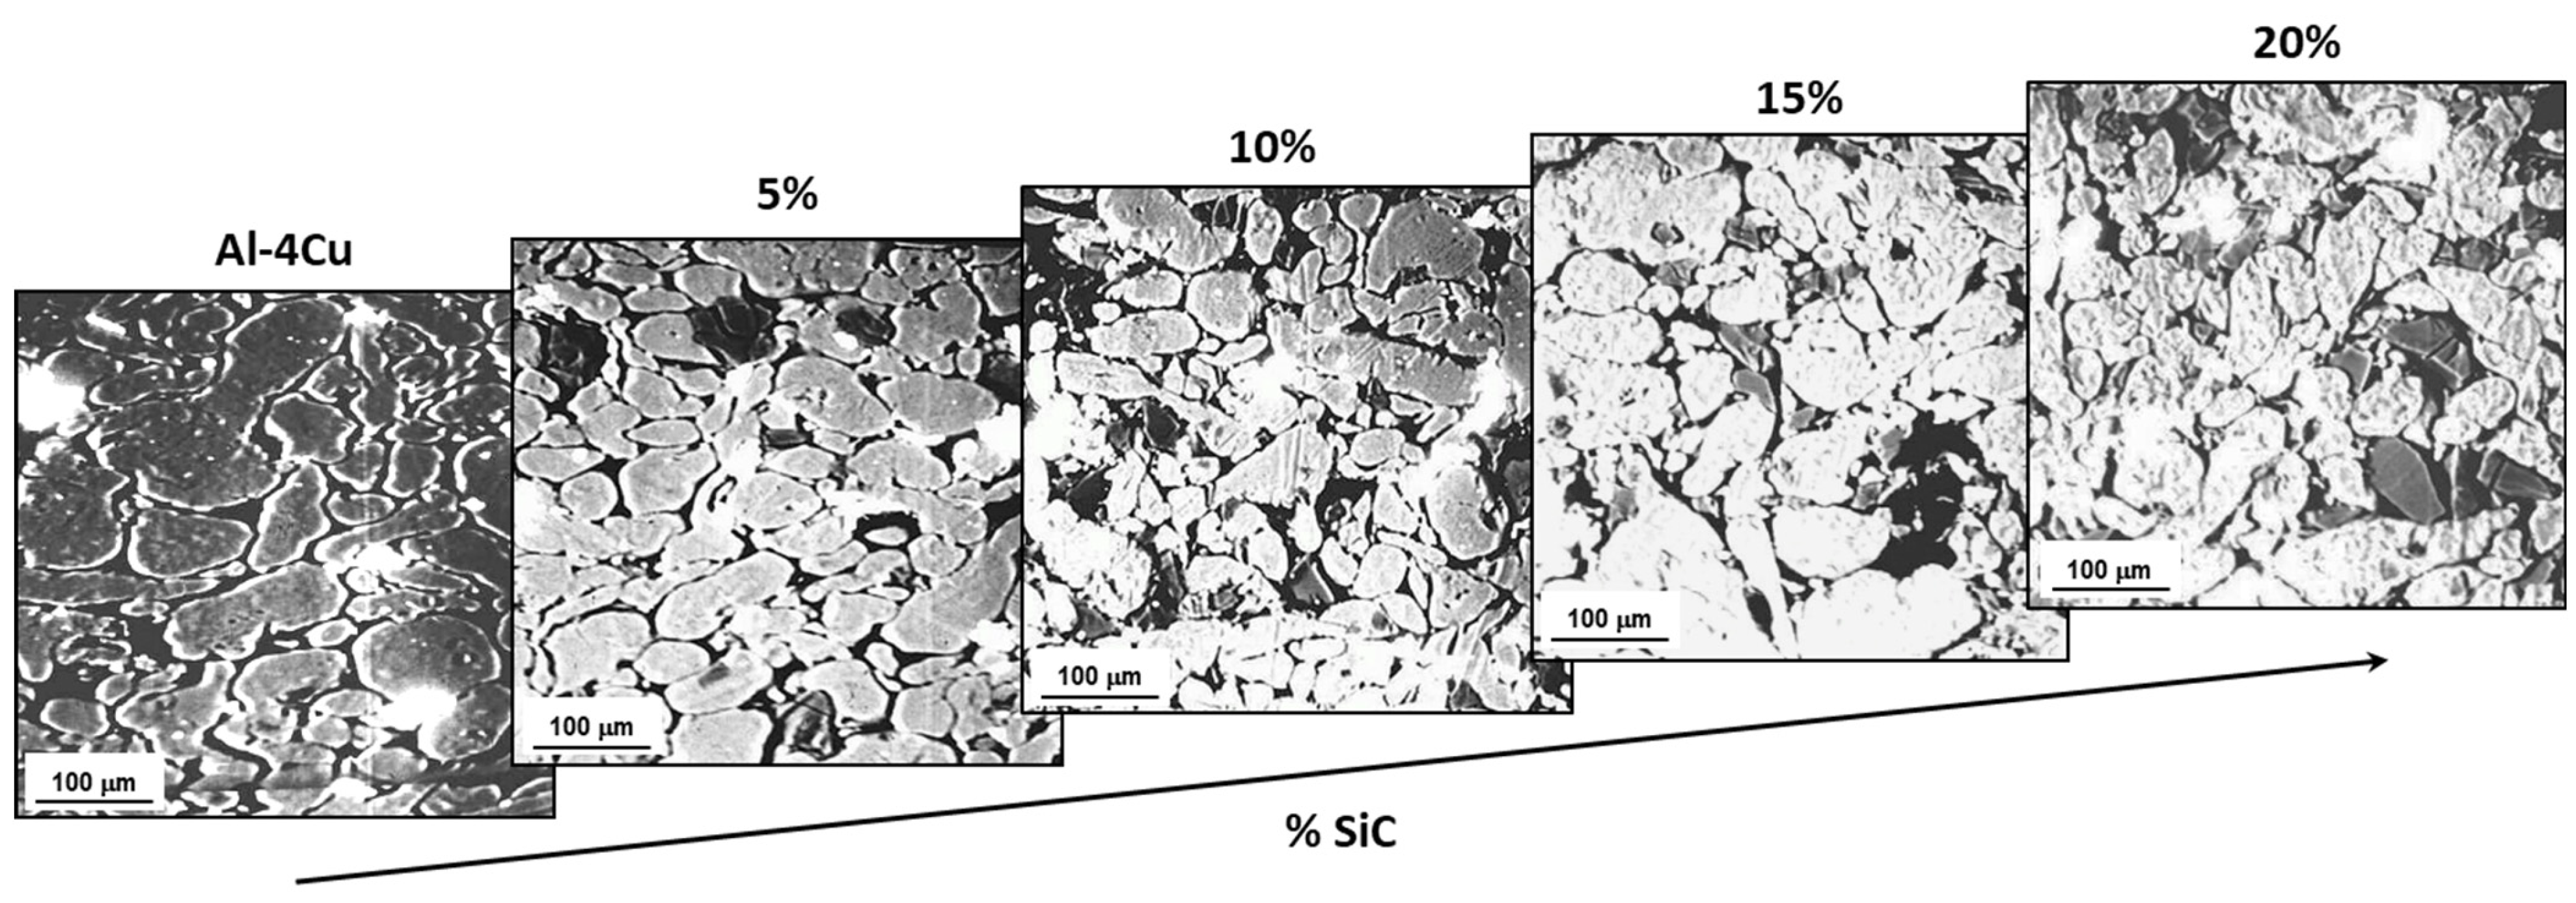
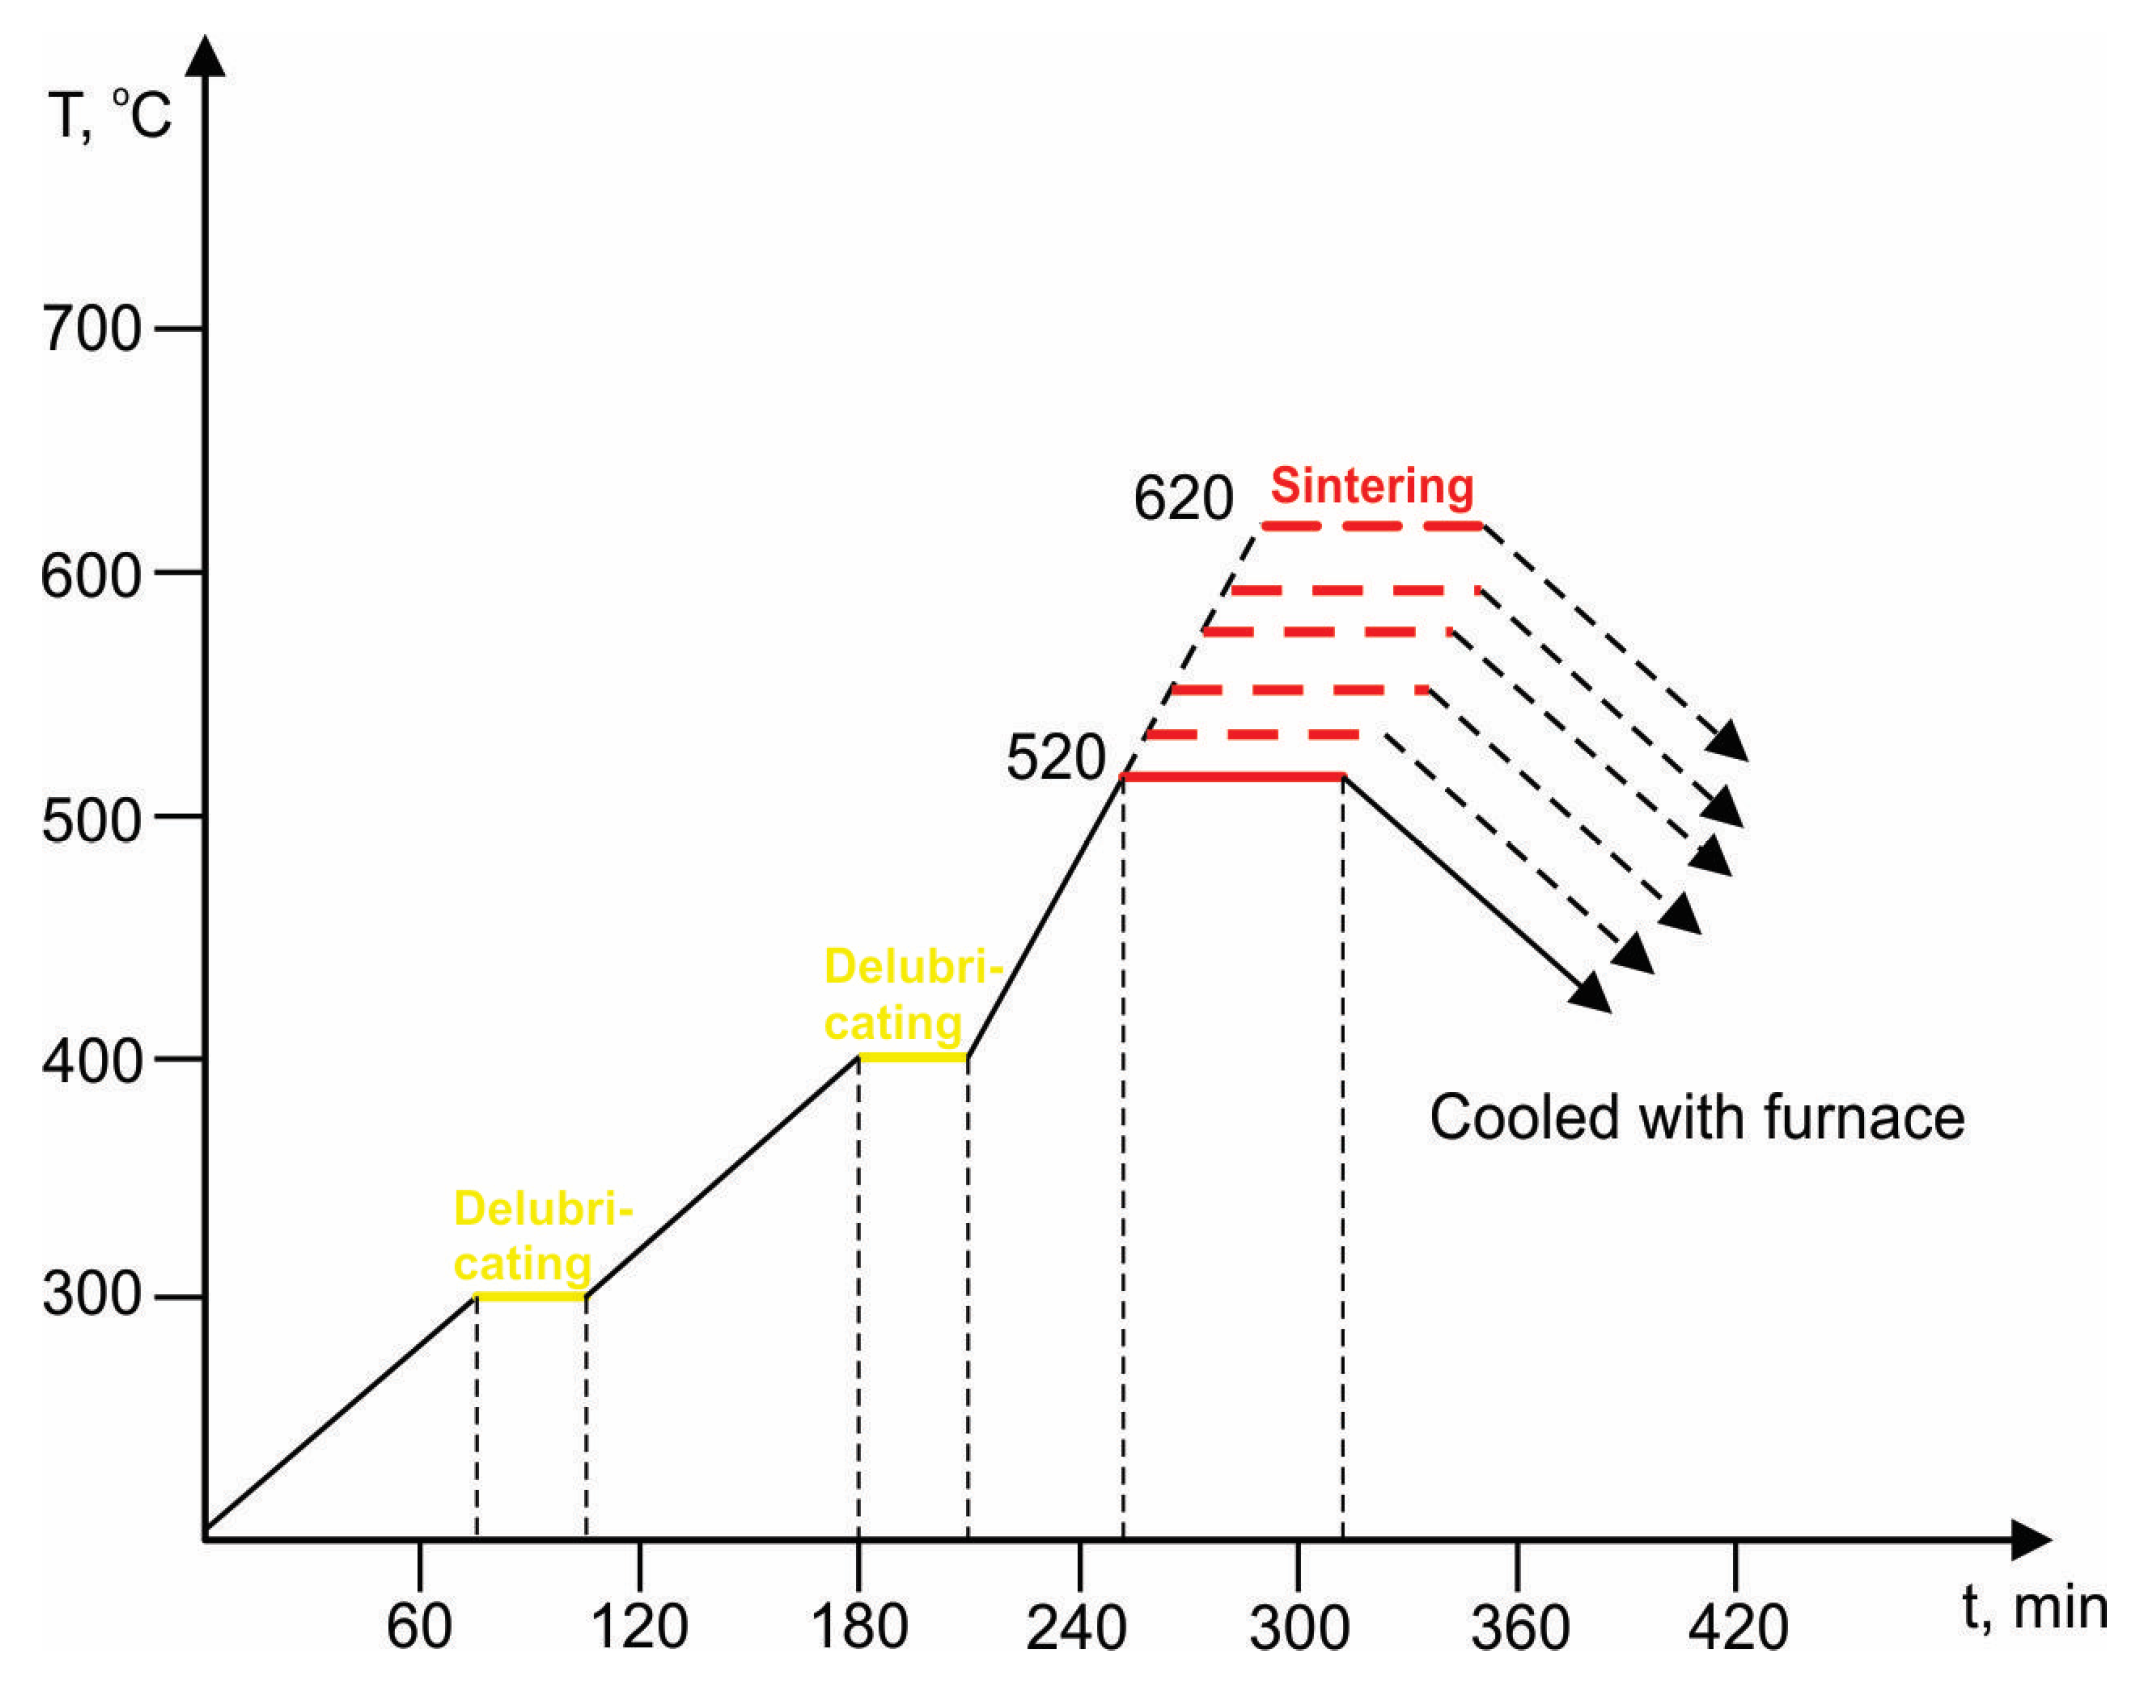
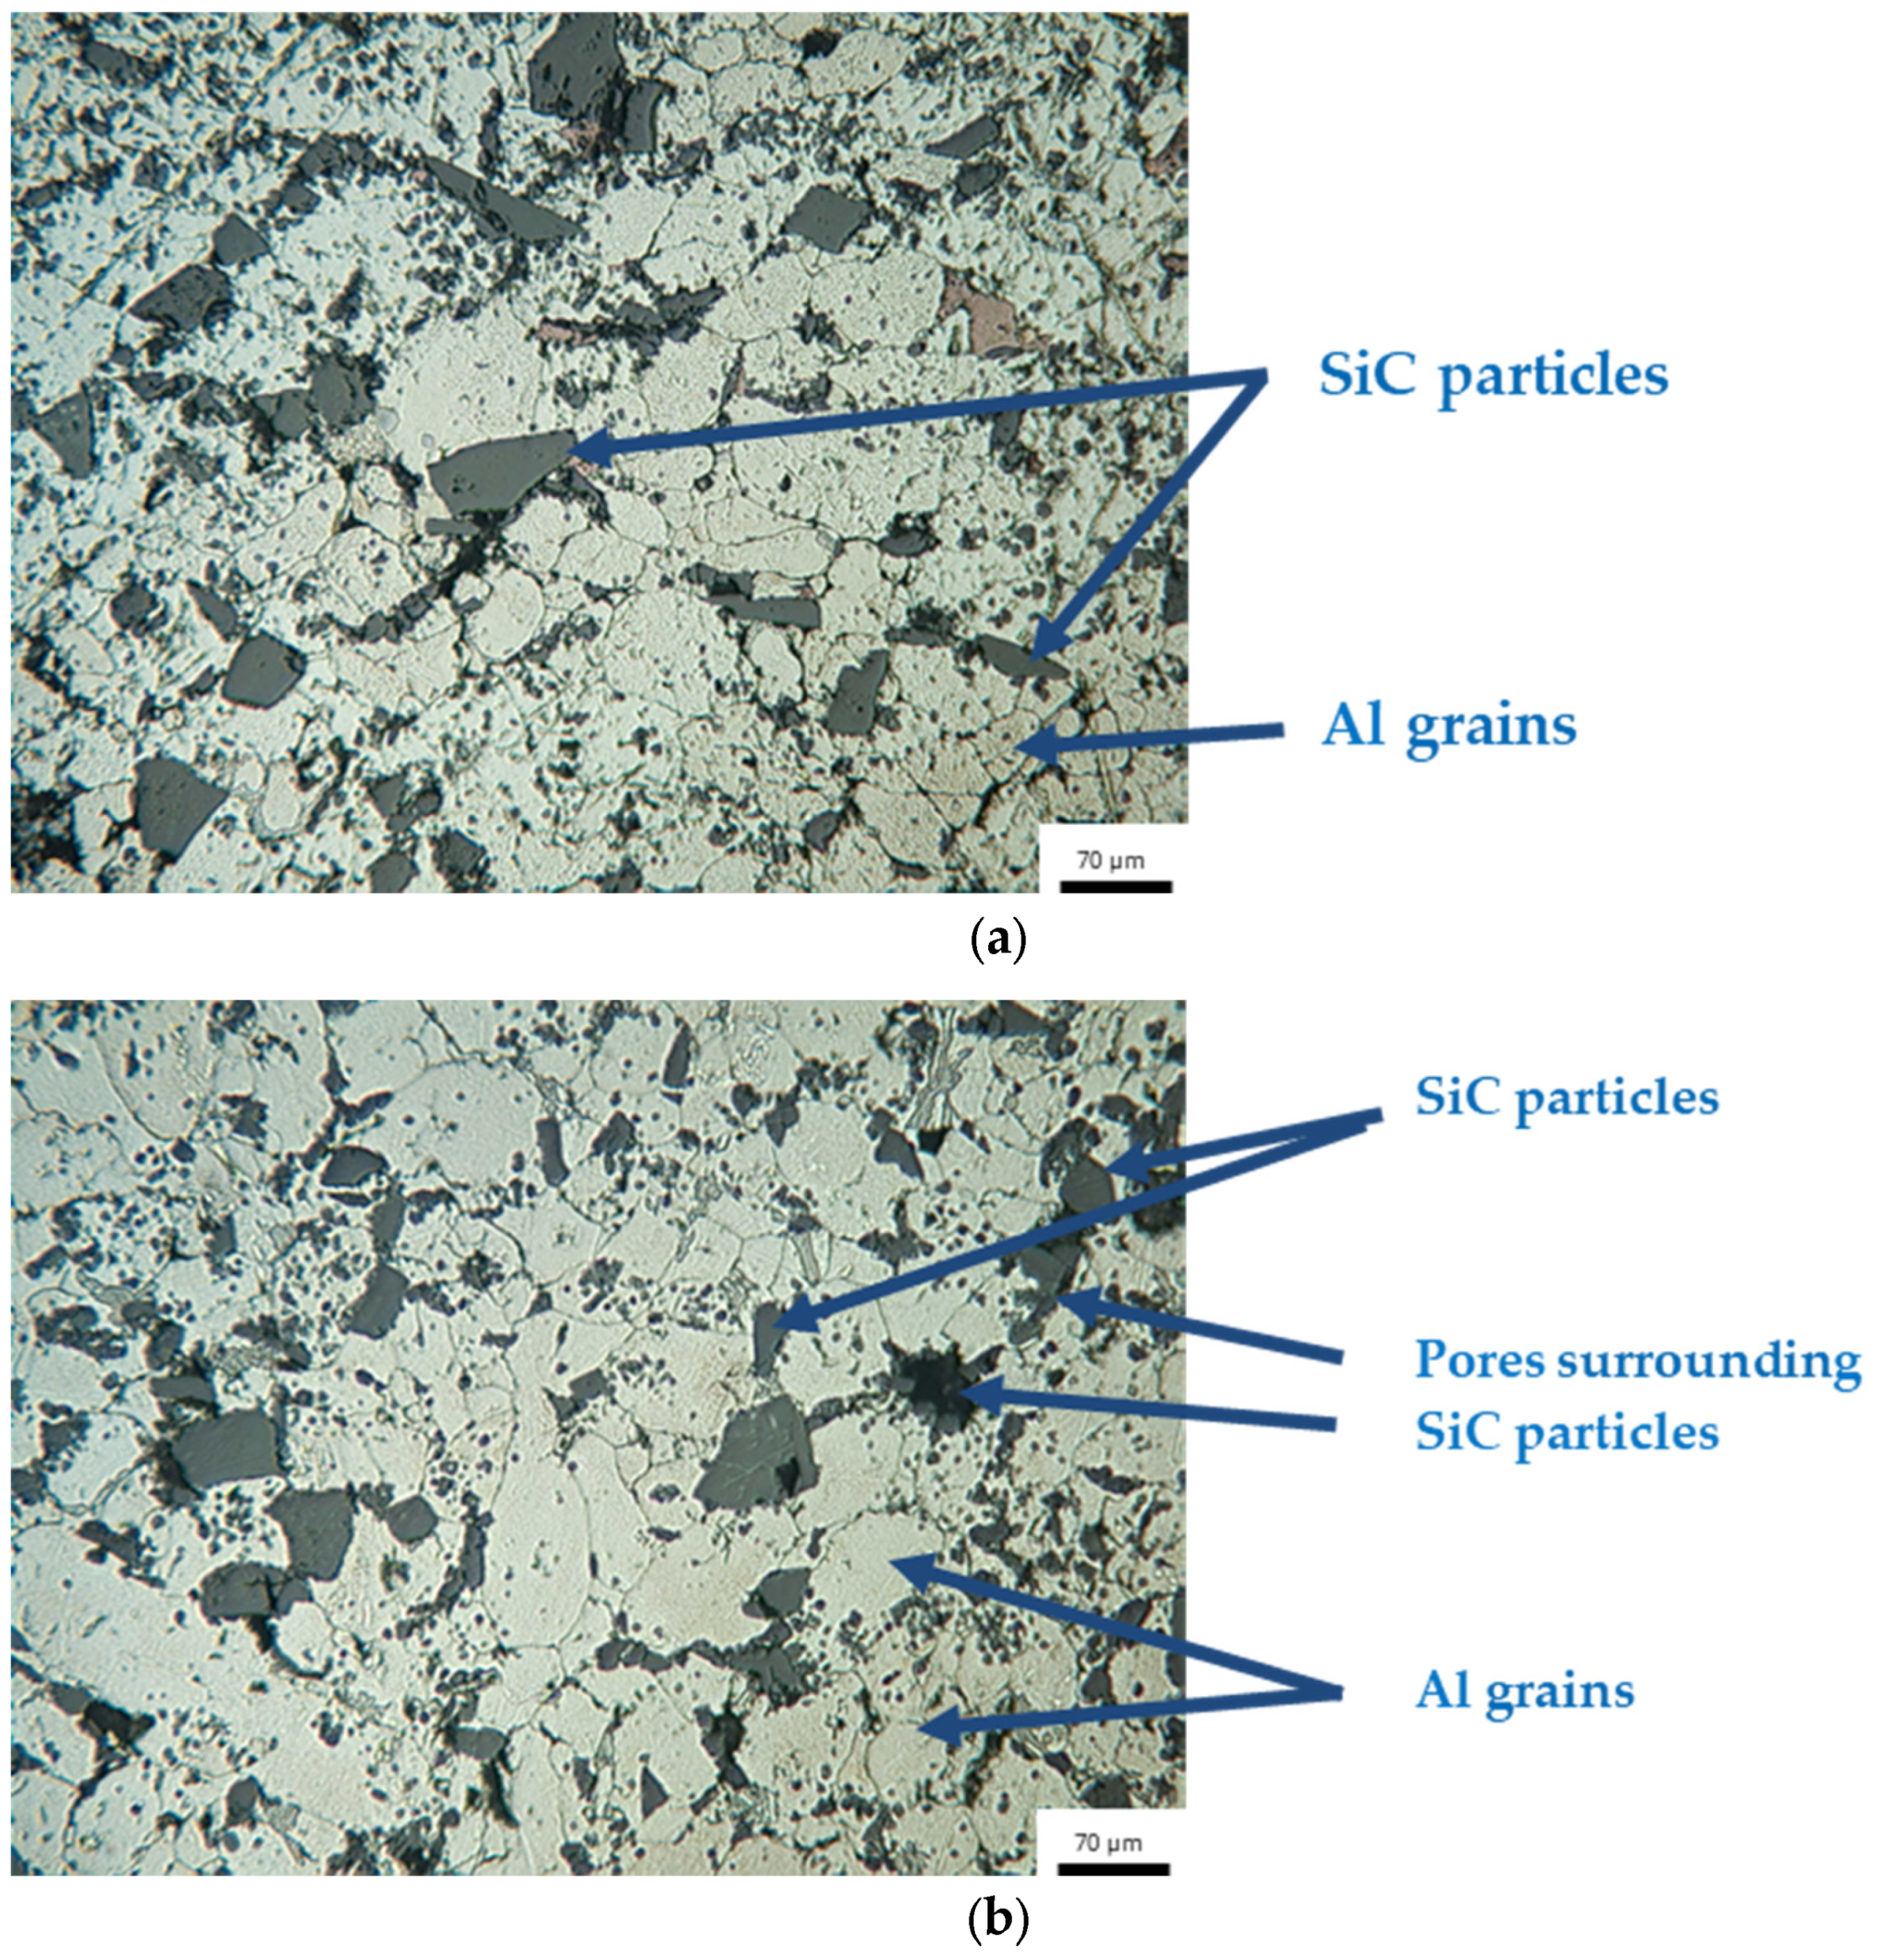
3.3. Characterization of Sintered Parts
3.4. Characterizations of Age-Hardened Sample
3.4.1. The Influence of Aging Parameters on Physical, Mechanical, and Micostructural Properties of Sintered Al-Cu-SiC Composites
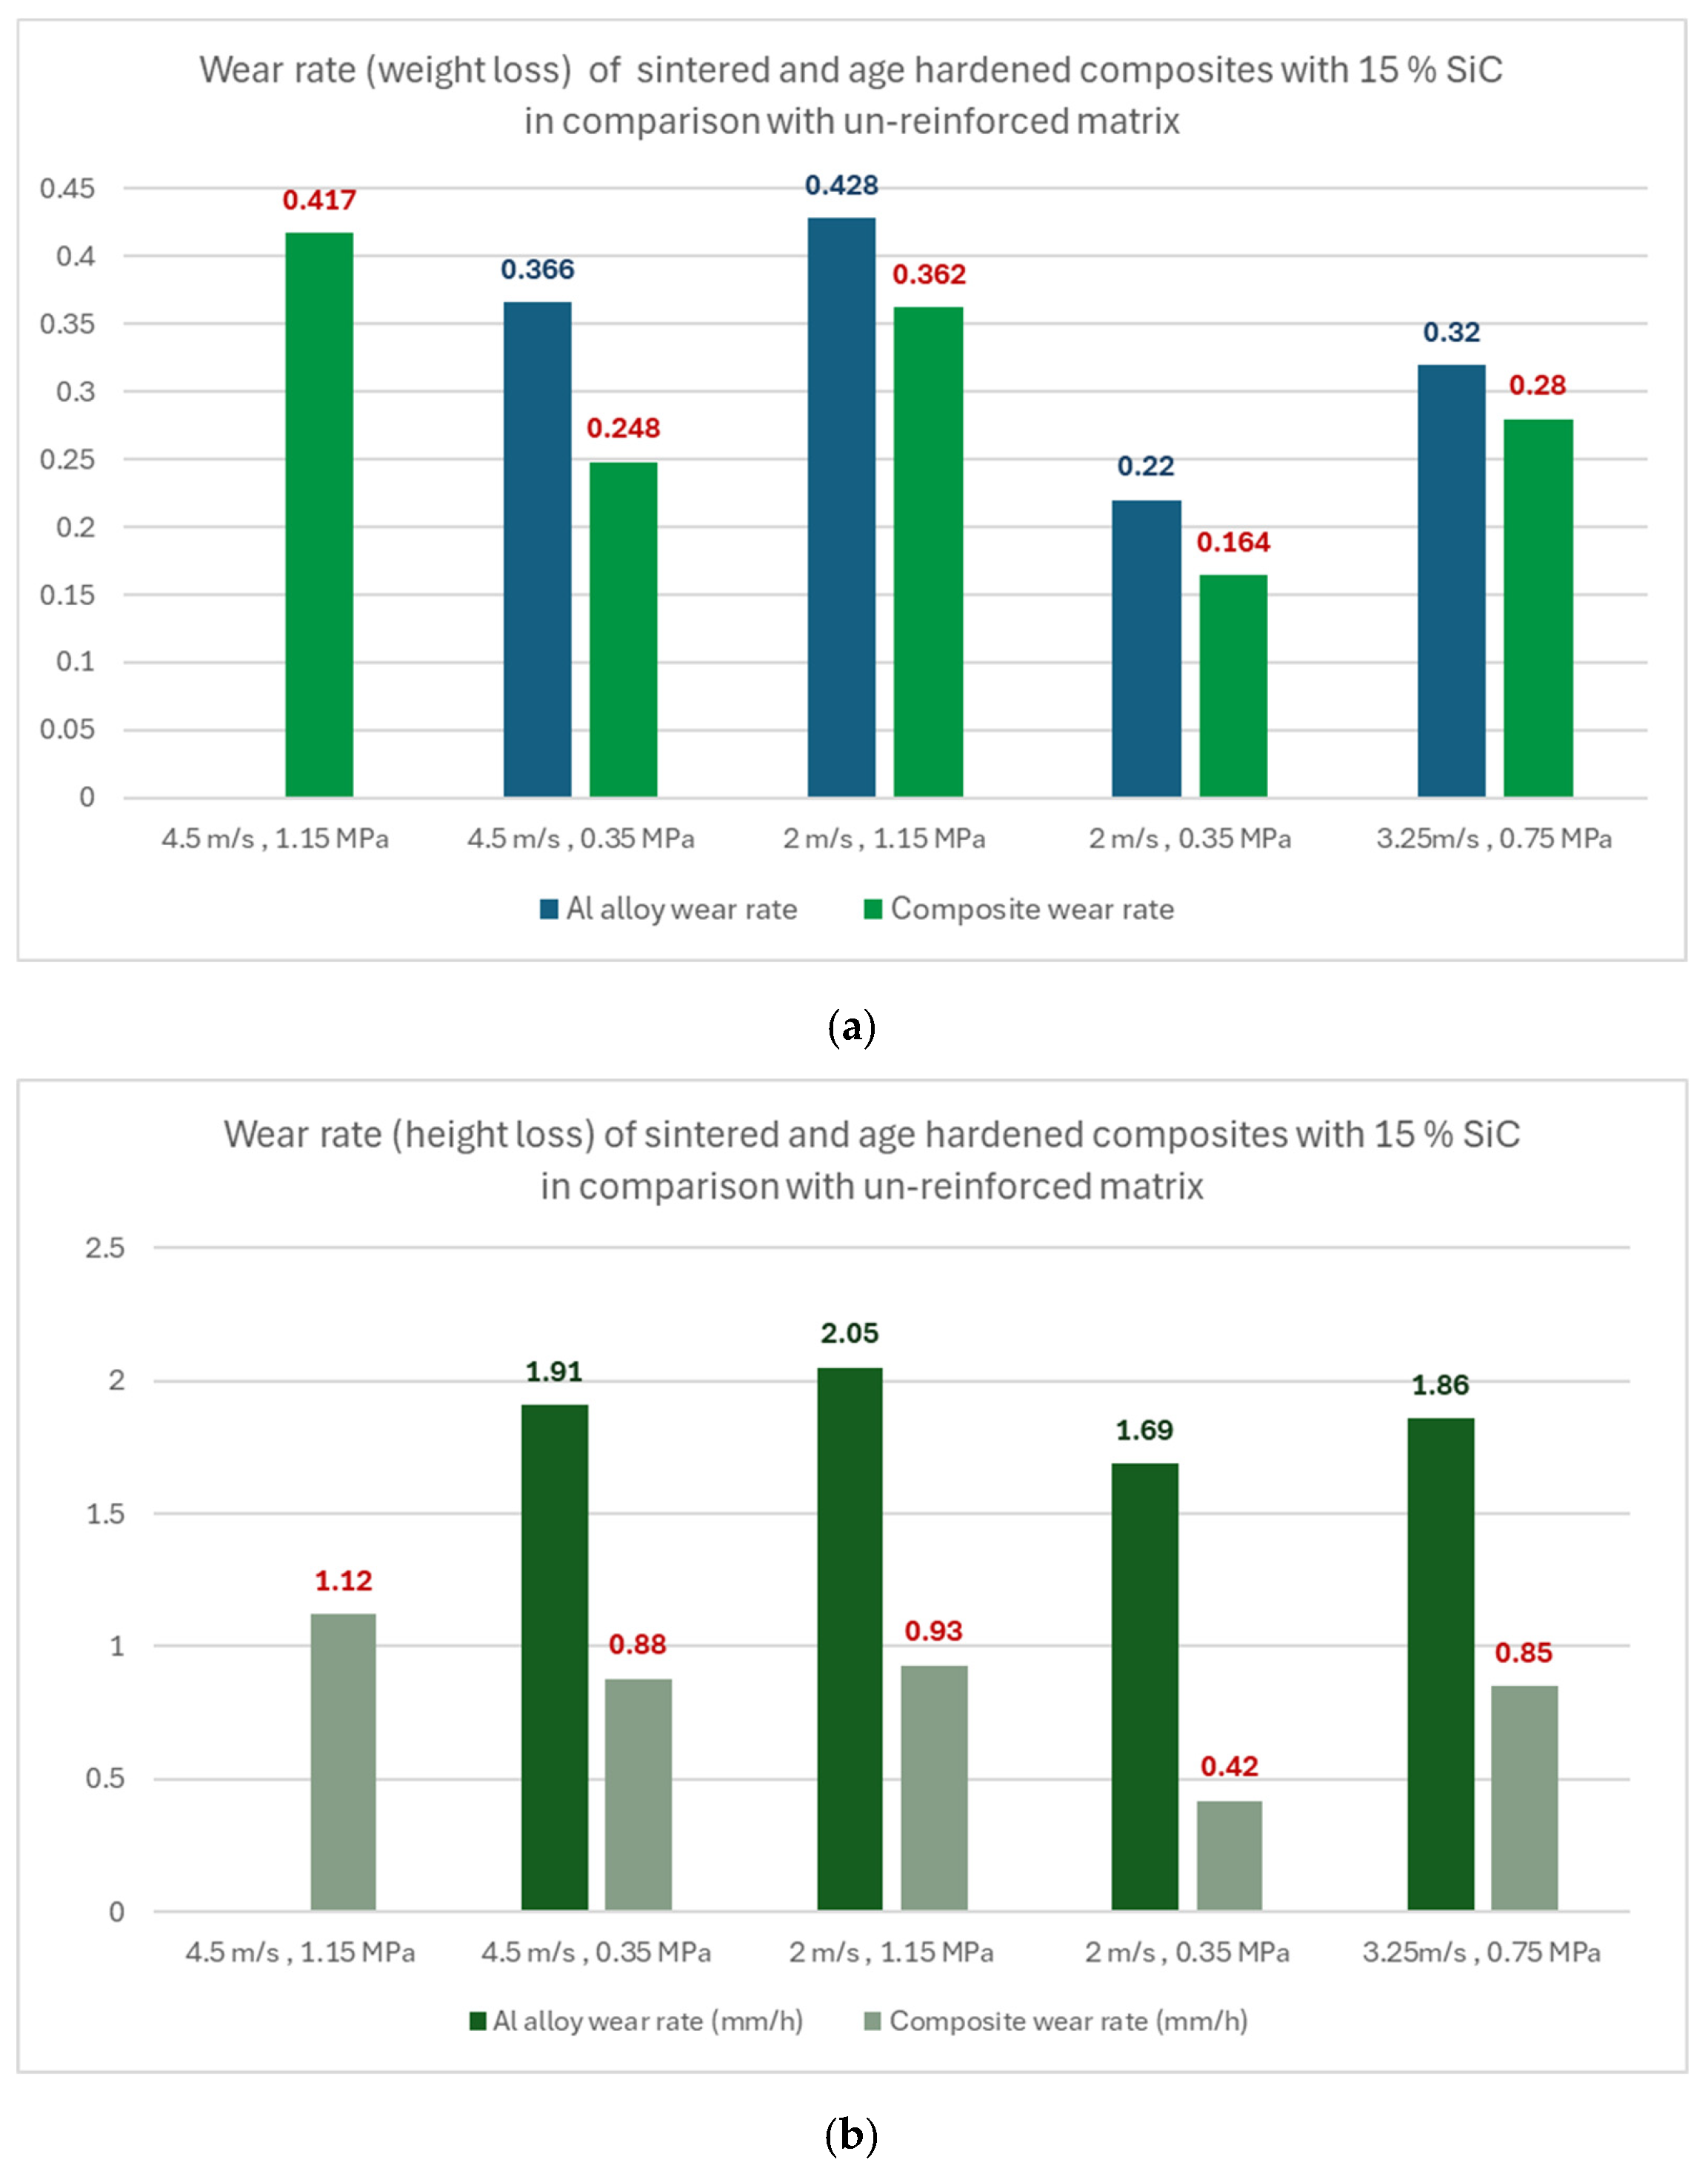
3.4.2. The Comparison of Sintered and Age-Hardened Unreinforced Matrix Al-4Cu Alloy Versus Aluminum-Based Composites from Tribological Point of View
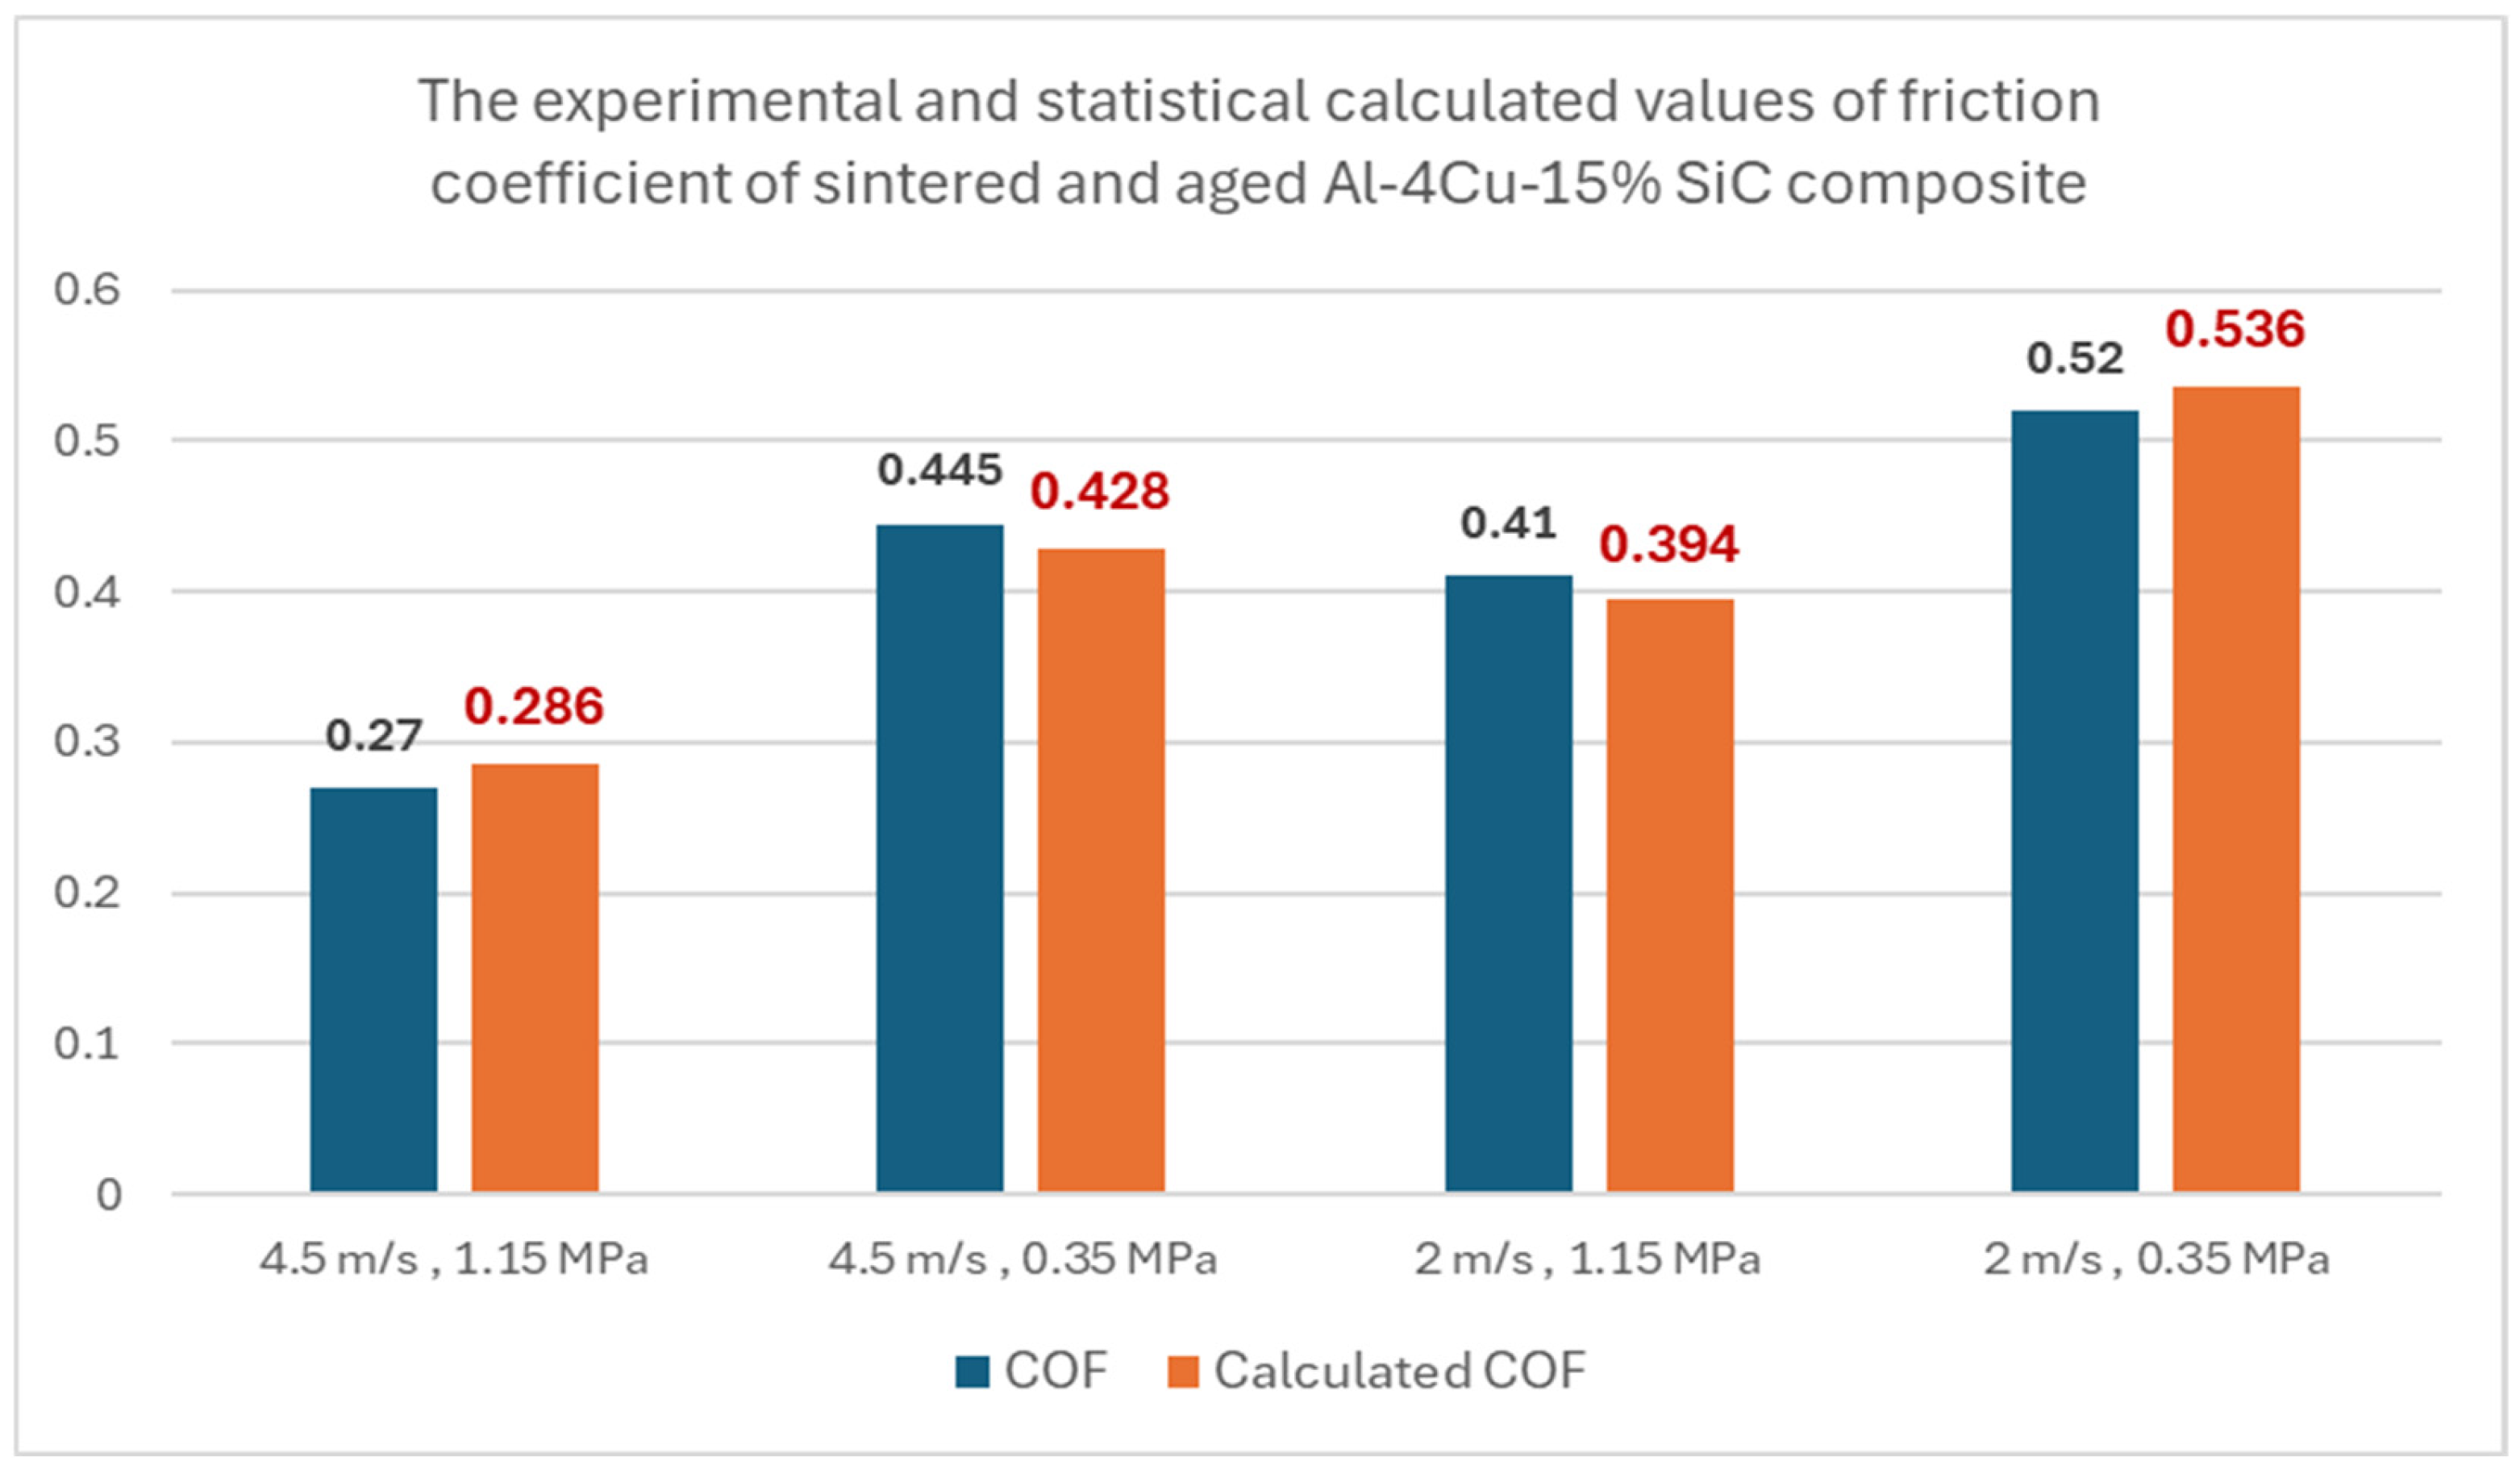
3.4.3. Tribological Behavior and Statistical Experimental Design of Sintered and Age-Hardened Al-4Cu-15% SiC Composites
- where
4. Conclusions
5. The Future Scope of Work
Author Contributions
Funding
Data Availability Statement
Acknowledgments
Conflicts of Interest
References
- Wąsik, A.; Leszczyńska-Madej, B.; Madej, M. Sustainability in the Manufacturing of Eco-Friendly Aluminum Matrix Composite Materials. Sustainability 2024, 16, 903. [Google Scholar] [CrossRef]
- Sadhu, K.K.; Prajapati, P.K.; Mandal, N.; Sahoo, R.R. Tribo-mechanical evaluation of SiC-reinforced wear-resistant aluminium composite fabricated through powder metallurgy. Mater. Today Commun. 2025, 42, 111184. [Google Scholar] [CrossRef]
- Bharathi, P.; Sampath Kumar, T. Effect of Silicon Carbide and Boron Carbide on Mechanical and Tribological Properties of Aluminium 7075 Composites for Automobile Applications. Silicon 2023, 15, 6147–6171. [Google Scholar] [CrossRef]
- Venkatesh, V.S.S.; Deoghare, A.B. Microstructural Characterization and Mechanical Behaviour of SiC and Kaoline Reinforced Aluminium Metal Matrix Composites Fabricated Through Powder Metallurgy Technique. Silicon 2022, 14, 3723–3737. [Google Scholar] [CrossRef]
- Sellami, A.; Elleuch, R. Green composite friction materials: A review of a new generation of eco-friendly brake materials for sustainability. Environ. Eng. Res. 2024, 29, 230226. [Google Scholar] [CrossRef]
- Lattanzi, L.; Awe, S.A. Thermophysical properties of Al-based metal matrix composites suitable for automotive brake discs. J. Alloys Metall. Syst. 2024, 5, 100059. [Google Scholar] [CrossRef]
- Serrenho, A.C.; Norman, J.B.; Allwood, J.M. The impact of reducing car weight on global emissions: The future fleet in Great Britain. Philos. Trans. R. Soc. A Math. Phys. Eng. Sci. 2017, 375, 20160364. [Google Scholar] [CrossRef]
- Romero, C.A.; Correa, P.; Ariza Echeverri, E.A.; Vergara, D. Strategies for Reducing Automobile Fuel Consumption. Appl. Sci. 2024, 14, 910. [Google Scholar] [CrossRef]
- Fayyazbakhsh, A.; Bell, M.L.; Zhu, X.; Mei, X.; Koutný, M.; Hajinajaf, N.; Zhang, Y. Engine emissions with air pollutants and greenhouse gases and their control technologies. J. Clean. Prod. 2022, 376, 134260. [Google Scholar] [CrossRef]
- Popescu, I.N.; Ghiţă, C.; Bratu, V.; Palacios Navarro, G. Tribological behaviour and statistical experimental design of sintered iron–copper based composites. Appl. Surf. Sci. 2013, 285, 72–85. [Google Scholar] [CrossRef]
- Yan, L.; Xu, H. Lightweight composite materials in automotive engineering: State-of-the-art and future trends. Alex. Eng. J. 2025, 118, 1–10. [Google Scholar] [CrossRef]
- Popescu, I.N.; Vidu, R.; Bratu, V.; Olei, B.A.; Ungureanu, D.N.; Anghelina, F.V. Effects of Silicon Carbide Proportion and Artificial Aging Parameters on Microstructure and Hardness of Al-Cu/SiCp Composites. Solid State Phenom. 2014, 216, 122–127. [Google Scholar] [CrossRef]
- Gecu, R.; Karaaslan, A. Sliding Wear of the Ti-Reinforced Al Matrix Bi-metal Composite: A Potential Replacement to Conventional SiC-Reinforced Composites for Automotive Application. Int. J. Met. 2019, 13, 641–652. [Google Scholar] [CrossRef]
- Candela, A.; Sandrini, G.; Gadola, M.; Chindamo, D.; Magri, P. Lightweighting in the automotive industry as a measure for energy efficiency: Review of the main materials and methods. Heliyon 2024, 10, e29728. [Google Scholar] [CrossRef] [PubMed]
- Sima, G.; Mangra, M.; Gîngu, O.; Criveanu, M.C.; Olei, B.A. Influence of the Reinforcing Elements on the Wear Behavior of Al/(Sic+Graphite) Composites Elaborated by Spark Plasma Sintering Technology. Mater. Sci. Forum 2011, 672, 241–244. [Google Scholar] [CrossRef]
- Zheng, K.L.; Wei, X.S.; Yan, B.; Yan, P.F. Ceramic waste SiC particle-reinforced Al matrix composite brake materials with a high friction coefficient. Wear 2020, 458, 203424. [Google Scholar] [CrossRef]
- Qiu, T.; Wu, M.; Du, Z.; Chen, G.; Zhang, L.; Qu, X. Microstructure evolution and densification behaviour of powder metallurgy Al–Cu–Mg–Si alloy. Powder Metall. 2020, 63, 54–63. [Google Scholar] [CrossRef]
- Janowski, G.M.; Pletka, B.J. The effect of particle size and volume fraction on the aging behavior of a liquid-phase sintered SiC/aluminum composite. Metall. Mater. Trans. A 1995, 26, 3027–3035. [Google Scholar] [CrossRef]
- Hassan, A.M.; Alrashdan, A.; Hayajneh, M.T.; Mayyas, A.T. Wear behavior of Al–Mg–Cu–based composites containing SiC particles. Tribol. Int. 2009, 42, 1230–1238. [Google Scholar] [CrossRef]
- Hatti, G.; Naveen, G.J.; Koti, V.; Uppin, V.S.; Lingaraju, S.V.; Janamatti, S.; Hokrani, V.V.; Pujar, S.N. Green metal matrix composites: A multi-faceted study on Al alloy composites with egg shell powder and silicon carbide as reinforcements. Metall. Res. Technol. 2024, 121, 610. [Google Scholar]
- Usca, Ü.A.; Şap, S.; Uzun, M.; Değirmenci, Ü. Determination of mechanical and tribological properties of vacuum sintered hybrid reinforced Al-4Cu composites. J. Compos. Mater. 2024, 58, 2799–2815. [Google Scholar] [CrossRef]
- Ravichandran, M.; Vidhya, V.; Anandakrishanan, V. Study of the Characteristics of AL + 5 wt.% TiO2 + 6 wt.% GR Hybrid P/M Composite Powders Prepared by the Process of Ball Milling. Mater. Sci. 2016, 51, 589–597. [Google Scholar] [CrossRef]
- Bhaskar, S.; Kumar, M.; Patnaik, A. Silicon Carbide Ceramic Particulate Reinforced AA2024 Alloy Composite—Part I: Evaluation of Mechanical and Sliding Tribology Performance. Silicon 2020, 12, 843–865. [Google Scholar] [CrossRef]
- Jang, H.; Ko, K.; Kim, S.J.; Basch, R.H.; Fash, J.W. The effect of metal fibers on the friction performance of automotive brake friction materials. Wear 2004, 256, 406–414. [Google Scholar] [CrossRef]
- Chandel, R.; Sharma, N.; Bansal, S.A. A review on recent developments of aluminum-based hybrid composites for automotive applications. Emergent Mater. 2021, 4, 1243–1257. [Google Scholar] [CrossRef]
- Nicolicescu, C.; Ciobanu, M.; Leonat, L. Influence of the Mechanical Alloying Parameters on the Elaboration of Sic/Al Nanocomposite Powders. Mater. Sci. Forum 2011, 672, 219–222. [Google Scholar] [CrossRef]
- Kim, S.-C.; Kim, M.-T.; Lee, S.; Chung, H.; Ahn, J.-H. Effects of copper addition on the sintering behavior and mechanical properties of powder processed Al/SiCpcomposites. J. Mater. Sci. 2005, 40, 441–447. [Google Scholar] [CrossRef]
- Prasad, N.J.K.; Suresh, K.R.; Niranjan, H.B.; Venkateswarlu, K. Effect of Copper Addition on the Sintering Behavior and Mechanical Properties of Powder Processed Al/Beryl Composites. Procedia Mater. Sci. 2014, 5, 1148–1154. [Google Scholar] [CrossRef]
- Natarajan, N.; Vijayarangan, S.; Rajendran, I. Wear behaviour of A356/25SiCp aluminium matrix composites sliding against automobile friction material. Wear 2006, 261, 812–822. [Google Scholar] [CrossRef]
- Wąsik, A.; Leszczyńska-Madej, B.; Madej, M.; Goły, M. Effect of Heat Treatment on Microstructure of Al4Cu-SiC Composites Consolidated by Powder Metallurgy Technique. J. Mater. Eng. Perform. 2020, 29, 1841–1848. [Google Scholar] [CrossRef]
- Ghiţă, C.; Popescu, I.N. Experimental research and compaction behaviour modelling of aluminium based composites reinforced with silicon carbide particles. Comput. Mater. Sci. 2012, 64, 136–140. [Google Scholar] [CrossRef]
- Lapshin, O.; Savitskii, A.; Ovcharenko, V. Mathematical Model of Compact Changes in Volume during Liquid-Phase Sintering. II. J. Mater. Synth. Process. 2001, 9, 83–92. [Google Scholar] [CrossRef]
- Zhou, J.; Duszczyk, J. Preparation of Al-20Si-4.5Cu alloy and its composite from elemental powders. J. Mater. Sci. 1999, 34, 5067–5073. [Google Scholar] [CrossRef]
- Zhang, Q.; Xiao, B.L.; Liu, Z.Y.; Ma, Z.Y. Microstructure evolution and elemental diffusion of SiCp/Al–Cu–Mg composites prepared from elemental powder during hot pressing. J. Mater. Sci. 2011, 46, 6783–6793. [Google Scholar] [CrossRef]
- Bhoi, N.K.; Singh, H.; Pratap, S. Developments in the aluminum metal matrix composites reinforced by micro/nano particles—A review. J. Compos. Mater. 2020, 54, 813–833. [Google Scholar] [CrossRef]
- Özay, Ç.; Gencer, E.B.; Gökçe, A. Microstructural properties of sintered Al–Cu–Mg–Sn alloys. J. Therm. Anal. Calorim. 2018, 134, 23–33. [Google Scholar] [CrossRef]
- Tang, F.; Anderson, I.E.; Biner, S.B. Solid state sintering and consolidation of Al powders and Al matrix composites. J. Light Met. 2002, 2, 201–214. [Google Scholar] [CrossRef]
- Savitskii, A.P.; Romanov, G.N.; Martsunova, L.S.; Zhdanov, V.V. Nature of the growth of Al-Cu powder compacts during liquid-phase sintering. Sov. Powder Metall. Met. Ceram. 1988, 27, 348–351. [Google Scholar] [CrossRef]
- Leszczyńska-Madej, B.; Madej, M.; Wąsik, A. The effect of Cu addition on wear mechanisms and tribological properties of aluminium matrix composites reinforced with SiC. J. Compos. Mater. 2019, 53, 3073–3083. [Google Scholar] [CrossRef]
- Taloi, D.E.F.; Bratu, C.; Berceanu, E. The Optimisation of Metallurgical Processes; Didactica & Pedagogica Publisher: Bucharest, Romania, 1983. [Google Scholar]
- Milosan, I. 2k Factorial Design Used to Optimize the Linear Mathematical Model through Active Experiment. RECENT—REzultatele CErcetărilor Noastre Teh. 2018, 19, 37–43. [Google Scholar] [CrossRef]


| Preparation Steps | Materials Used | Parameters | Equipment(s) |
|---|---|---|---|
| Oxide reduction | Copper powders | Temperature: 280 °C Time: 1 h Atmosphere: hydrogen | Heat furnace (from Siemens Plania, Berlin-Lichtenberg, Germany) |
| Drying | SiC particles | Temperature: 400 °C Time: 2 h Atmosphere: hydrogen | Heat furnace (from Siemens Plania, Berlin-Lichtenberg, Germany) |
| Gravimetric dosage of mixtures | Raw elemental powders of Al, Cu, SiC and additive lubricant (zinc stearate) | Mixture 1: Al − 4 wt.% Cu + 2% Zn stearate Mixture 2: Al − 4 wt.% Cu − 5 wt.% SiC + 2% Zn stearate Mixture 3: Al − 4 wt.% Cu − 10 wt.% SiC + 2% Zn stearate Mixture 4: Al − 4 wt.% Cu − 15 wt.% SiC + 2% Zn stearate Mixture 5: Al − 4 wt.% Cu − 20 wt. %SiC + 2% Zn stearate | Analytical balance (SAUTER, New York, NY, USA) |
| Dry omogeni -zation of mixtures | Mixture 1 to 5 | Rotation Speed: 20 RPM Time: 3 to 9 h | Double Cone Blender (10 kg capacity, Gemco, Middlesex, NJ, USA) |
| Uniaxial compaction | Mixture 1 to 5 | Pressures: 100 to 450 MPa | Automate hydraulic press of 30 tf (Groupe Meyer France, Saint-Étienne, France) |
| Presintering (dewaxing and degassing) and sintering process | Compact samples | Presintering temperatures: 300, 400 °C Maintaining time: 30–40 min Sintering temperatures: 520–620 °C Maintaining time: 60 min Protective atmosphere: hydrogen | Heat furnace (from Siemens Plania, Berlin-Lichtenberg, Germany) |
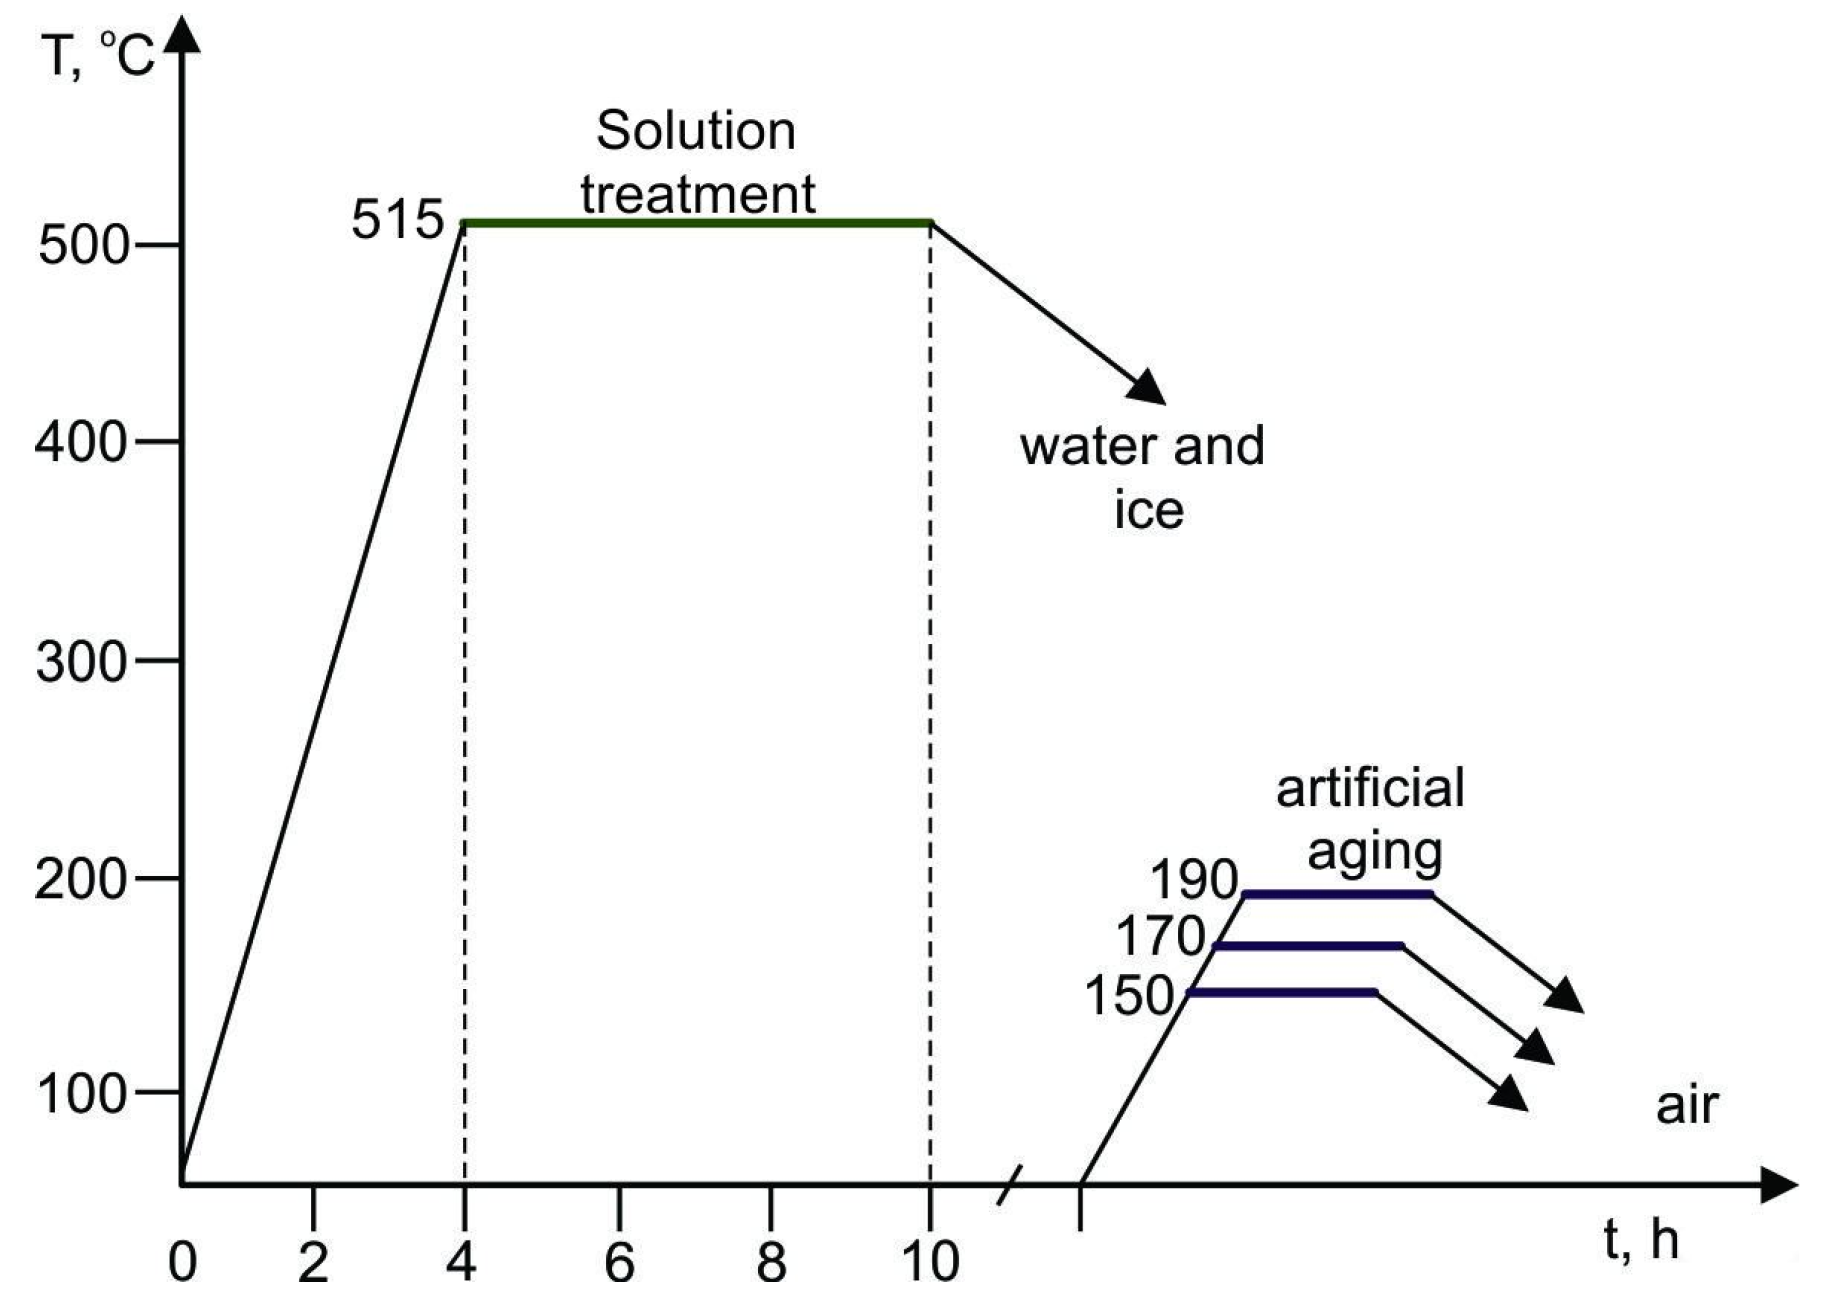
| Secondary heat treatments | Sintered samples | Solution treatment temperature: 515 ± 5 °C Maintaining time: 6 h Quenching: in water Temperatures of artificial aging: 150, 170, 190 °C Maintaining times: 4, 8, 12 h | Heating oven (MMM Group, Planegg, Germany) |
| Preparation Steps | Materials Used | Parameters | Equipment(s) |
|---|---|---|---|
| Mounting | Bakelite powder | Time: (i) 1–3 min heating; (ii) 3–6 min cooling Pressure: 270–290 bar | Automatic Simplimet Mounting Press (from Bűehler, Lake Bluff, IL, USA) |
| Grounding | SiC papers | Papers grit size: 800, 1000, 1200, and 1500 Rotating speed: 200–300 RPM Cooling liquid: water | Alpha, Beta, and Vector Powerhead (from Bűehler, Lake Bluff, IL, USA) |
| Ultrasonic cleaning | Ethylic alcohol | Time: 4–6 min | USC-TH type ultrasonic cleaner (from VWR, LLC, Leicestershire, UK) |
| Polishing | Textile materials; Al2O3 in suspension (1 μm size) | Rotating speed: 150 RPM Cooling liquid: water | Alpha, Beta, and Vector Powerhead (from Bűehler, Lake Bluff, IL, USA) |
| Etching | Keller’s reagent | Composition: 10 cm3 HF, 15 cm3 HCl, 25 cm3 HNO3, 50 cm3 H2O | - |
| Powder(s) Type/Mixture | Apparent Density, g/cm3 | Tap Density, g/cm3 | Flow Rate, s/50 g | Specific Surface Area, m2/cm3 | Particle Shape |
|---|---|---|---|---|---|
| Al | 1.27 | 1.37 | 12.6 | 0.12 | droplet (elongated shape) |
| Cu | 2.36 | 2.85 | 39 | 0.40 | dendritic |
| β-SiC | 1.38 | 1.65 | 17 | 0.36 | poliedric |
| Al-4Cu-0%SiC | 1.36 | 1.647 | 13.67 | 0.18 | - |
| Al-4Cu-5%SiC | 1.322 | 1.628 | 13.85 | 0.3 | - |
| Al-4Cu-10%SiC | 1.325 | 1.621 | 13.73 | 0.24 | - |
| Al-4Cu-15%SiC | 1.340 | 1.605 | 13.88 | 0.36 | - |
| Al-4Cu-20%SiC | 1.345 | 1.597 | 13.92 | 0.41 | - |
| Sample Composition wt.% | Characteristics | Applied Pressure, MPa | ||||||||
|---|---|---|---|---|---|---|---|---|---|---|
| 0 | 100 | 150 | 200 | 250 | 300 | 350 | 400 | 450 | ||
| Al-4Cu- 0% SiC | Green density, g/cm3 | 1.36 | 2.052 | 2.329 | 2.54 | 2.61 | 2.609 | 2.611 | 2.61 | 2.61 |
| Porosity, % | 33.82 | 23.92 | 13.65 | 5.82 | 3.23 | 3.26 | 3.21 | 3.23 | 3.23 | |
| Al-4Cu- 5% SiC | Green density, g/cm3 | 1.346 | 2.035 | 2.263 | 2.407 | 2.481 | 2.533 | 2.578 | 2.58 | 2.579 |
| Porosity, % | 35.59 | 25.10 | 16.71 | 11.41 | 8.69 | 6.77 | 5.04 | 5.04 | 5.04 | |
| Al-4Cu- 10% SiC | Green density, g/cm3 | 1.341 | 2.013 | 2.287 | 2.369 | 2.425 | 2.468 | 2.501 | 2.511 | 2.524 |
| Porosity, % | 36.80 | 26.51 | 16.50 | 13.51 | 11.46 | 9.89 | 8.69 | 8.32 | 7.85 | |
| Al-4Cu- 15% SiC | Green density, g/cm3 | 1.326 | 1.967 | 2.226 | 2.355 | 2.402 | 2.463 | 2.489 | 2.515 | 2.53 |
| Porosity, % | 38.25 | 28.76 | 19.38 | 14.71 | 13.00 | 10.79 | 9.85 | 8.91 | 8.37 | |
| Al-4Cu- 20% SiC | Green density, g/cm3 | 1.323 | 1.959 | 2.18 | 2.303 | 2.366 | 2.426 | 2.454 | 2.467 | 2.493 |
| Porosity, % | 38.90 | 29.63 | 21.70 | 17.28 | 15.01 | 12.86 | 11.85 | 11.39 | 10.45 | |
| Sintering Temperature °C | Copper Content in the Liquid wt.% | Equilibrium Liquid Phase Proportion, % |
|---|---|---|
| 640 | 8 | 73 |
| 635 | 10 | 47 |
| 630 | 11 | 34 |
| 625 | 13 | 24 |
| 620 | 14 | 20 |
| 615 | 16 | 15 |
| 610 | 18 | 11 |
| 605 | 19 | 8 |
| 600 | 20 | 6 |
| 595 | 21 | 5 |
| 590 | 23 | 3 |
| 585 | 24 | 1 |
| 580 | 25 | 0.5 |
| Sintering Temperature °C | Brinell Hardness | ||||
|---|---|---|---|---|---|
| Al-4Cu- 0% SiC | Al-4Cu- 5% SiC | Al-4Cu- 10% SiC | Al-4Cu- 15% SiC | Al-4Cu- 20% SiC | |
| 520 | 30 | 28 | 28.5 | 30 | 27.5 |
| 540 | 36 | 29 | 27.5 | 28 | 29 |
| 560 | 40 | 45 | 38 | 36 | 35 |
| 580 | 33 | 29.5 | 26 | 28 | 28.5 |
| 600 | 50.5 | 52 | 51 | 55 | 52 |
| 620 | 58 | 57 | 59 | 62 | 55 |
| Sample Composition wt.% | Aging Parameters | μHV0.01 |
|---|---|---|
| Al-4Cu-0% SiC | 170 °C/12 h | 101 |
| 190 °C/8 h | 103 | |
| Al-4Cu-5% SiC | 170 °C/8 h | 119 |
| Al-4Cu-10% SiC | 121 | |
| Al-4Cu-15% SiC | 170 °C/4 h | 130 |
| Al-4Cu-20% SiC | 123 |
| Element | wt % | At % | K-Ratio | Z | A | F |
|---|---|---|---|---|---|---|
| AlK | 49.49 | 69.76 | 0.2105 | 1.0509 | 0.4047 | 1.0000 |
| CuK | 50.51 | 30.24 | 0.4715 | 0.9333 | 1.0003 | 1.0000 |
| Total | 100.00 | 100.00 |
| Element | wt % | At % | K-Ratio | Z | A | F |
|---|---|---|---|---|---|---|
| AlK | 48.41 | 68.85 | 0.2036 | 1.0521 | 0.3998 | 1.0000 |
| CuK | 51.59 | 31.15 | 0.4823 | 0.9346 | 1.0003 | 1.0000 |
| Total | 100.00 | 100.00 |
| Element | wt.% | At.% | K-Ratio | Z | A | F |
|---|---|---|---|---|---|---|
| O K | 1.32 | 3.01 | 0.0042 | 1.1217 | 0.2860 | 1.0019 |
| Al K | 49.61 | 67.04 | 0.2275 | 1.0434 | 0.4393 | 1.0003 |
| Si K | 0.87 | 1.13 | 0.0032 | 1.0735 | 0.3402 | 1.0002 |
| Fe K | 14.61 | 9.54 | 0.1479 | 0.9559 | 0.9898 | 1.0696 |
| Cu K | 33.59 | 19.27 | 0.3063 | 0.9255 | 0.9855 | 1.0000 |
| Total | 100.00 | 100.00 |
| Samples | Investigated Zone Area | Element Mass, wt.% | ||||||
|---|---|---|---|---|---|---|---|---|
| Al | Cu | O | Fe | Zn | C | Si | ||
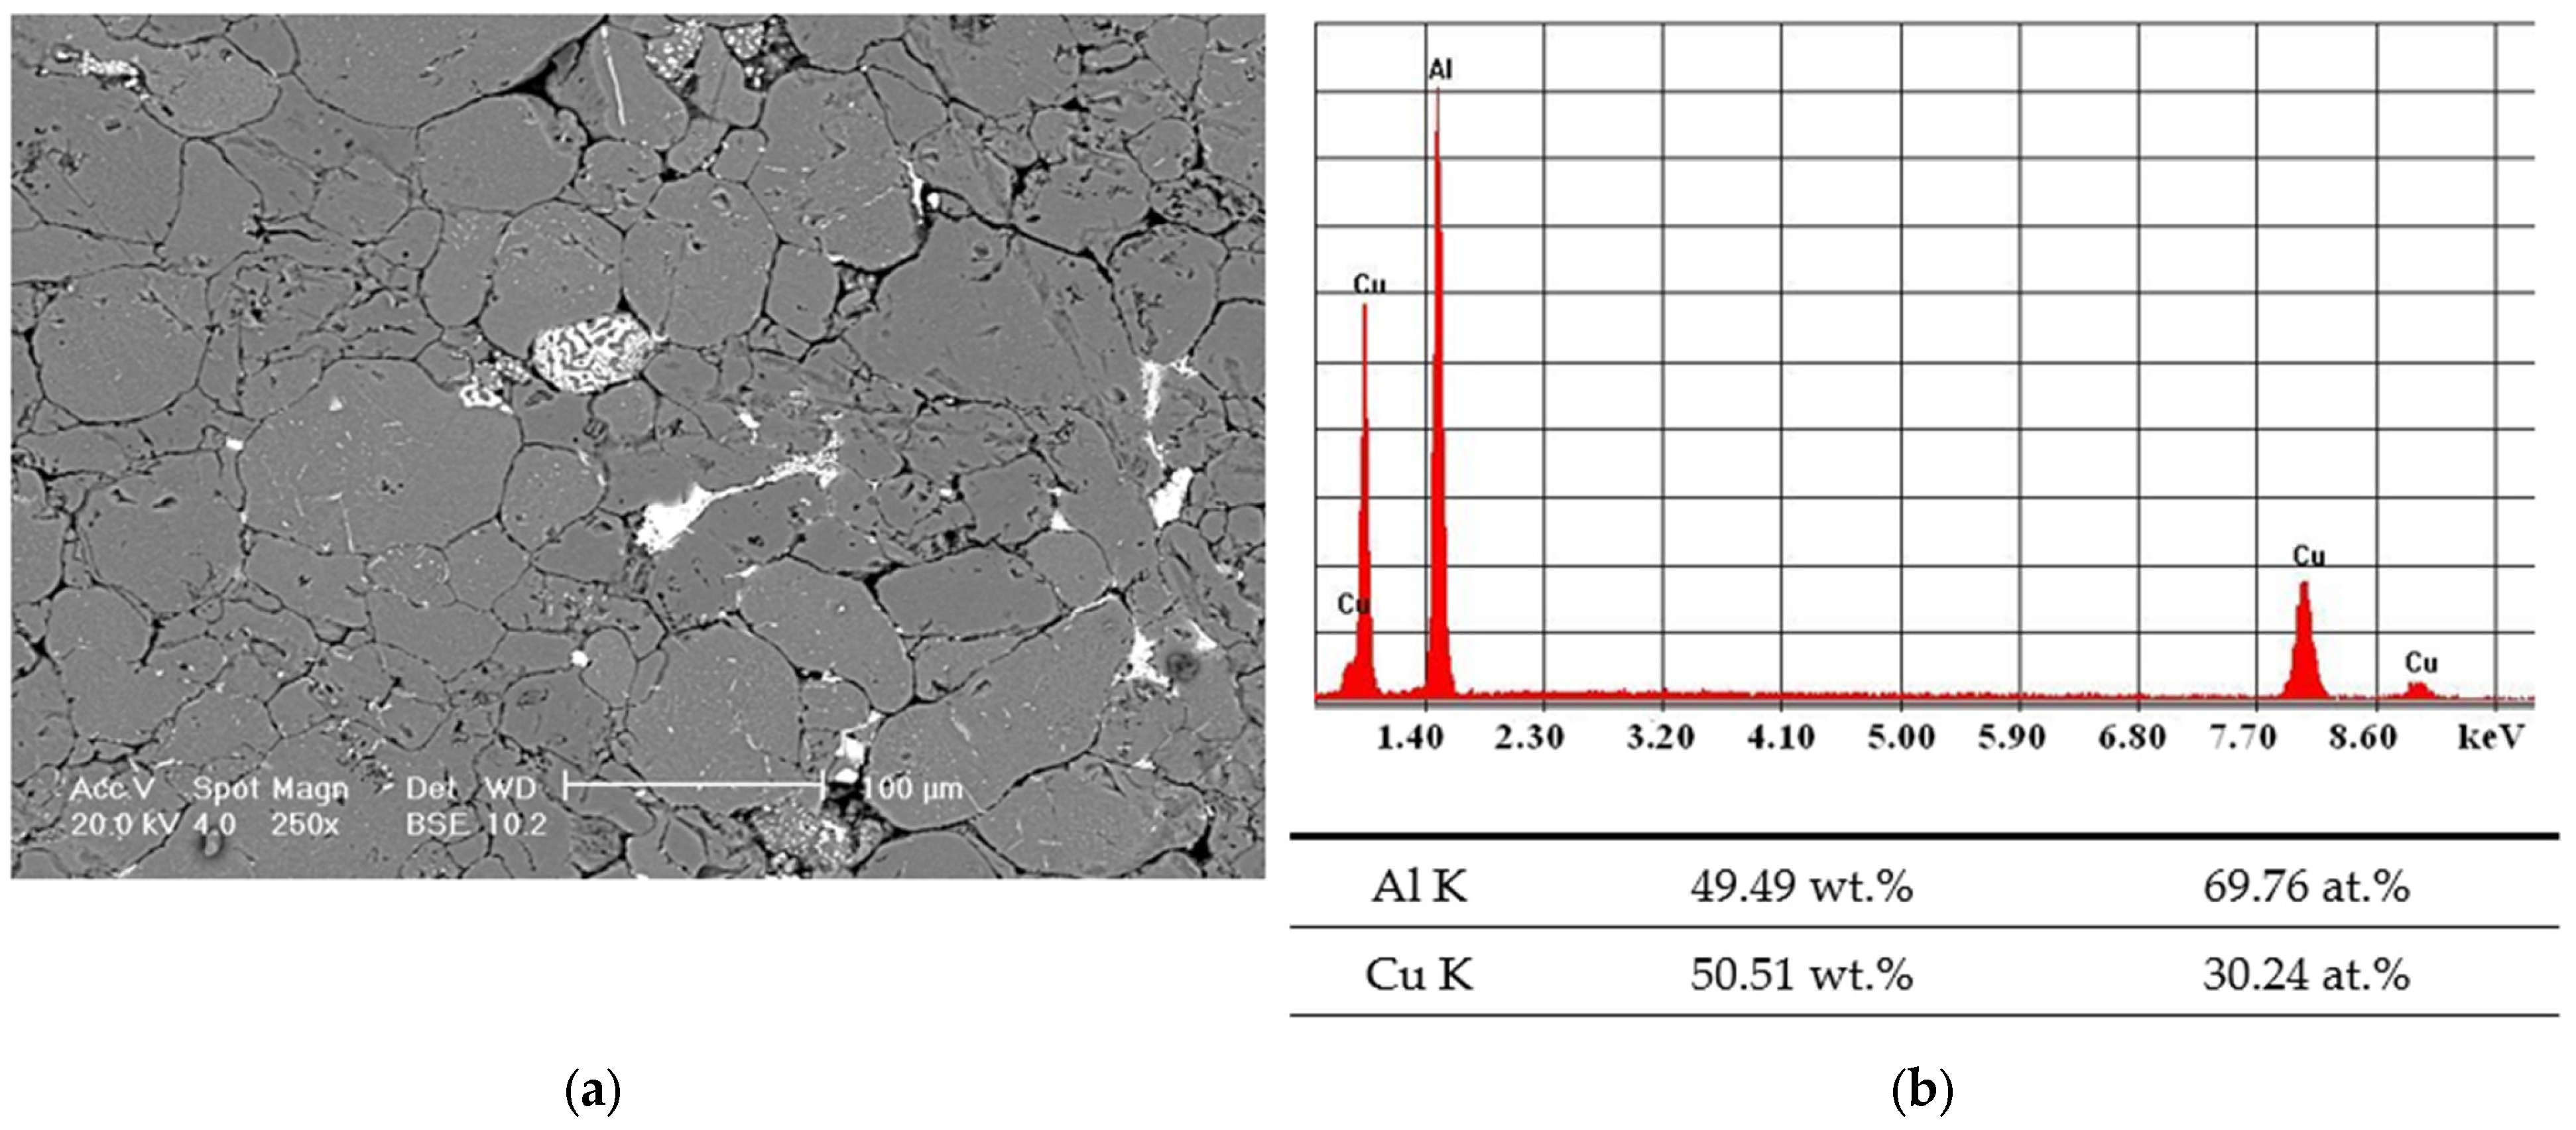
| Al-4Cu-0% SiC (170 °C/12 h) | white and gray area (Al2Cu) | 49.49 | 50.51 | - | - | - | - | - |
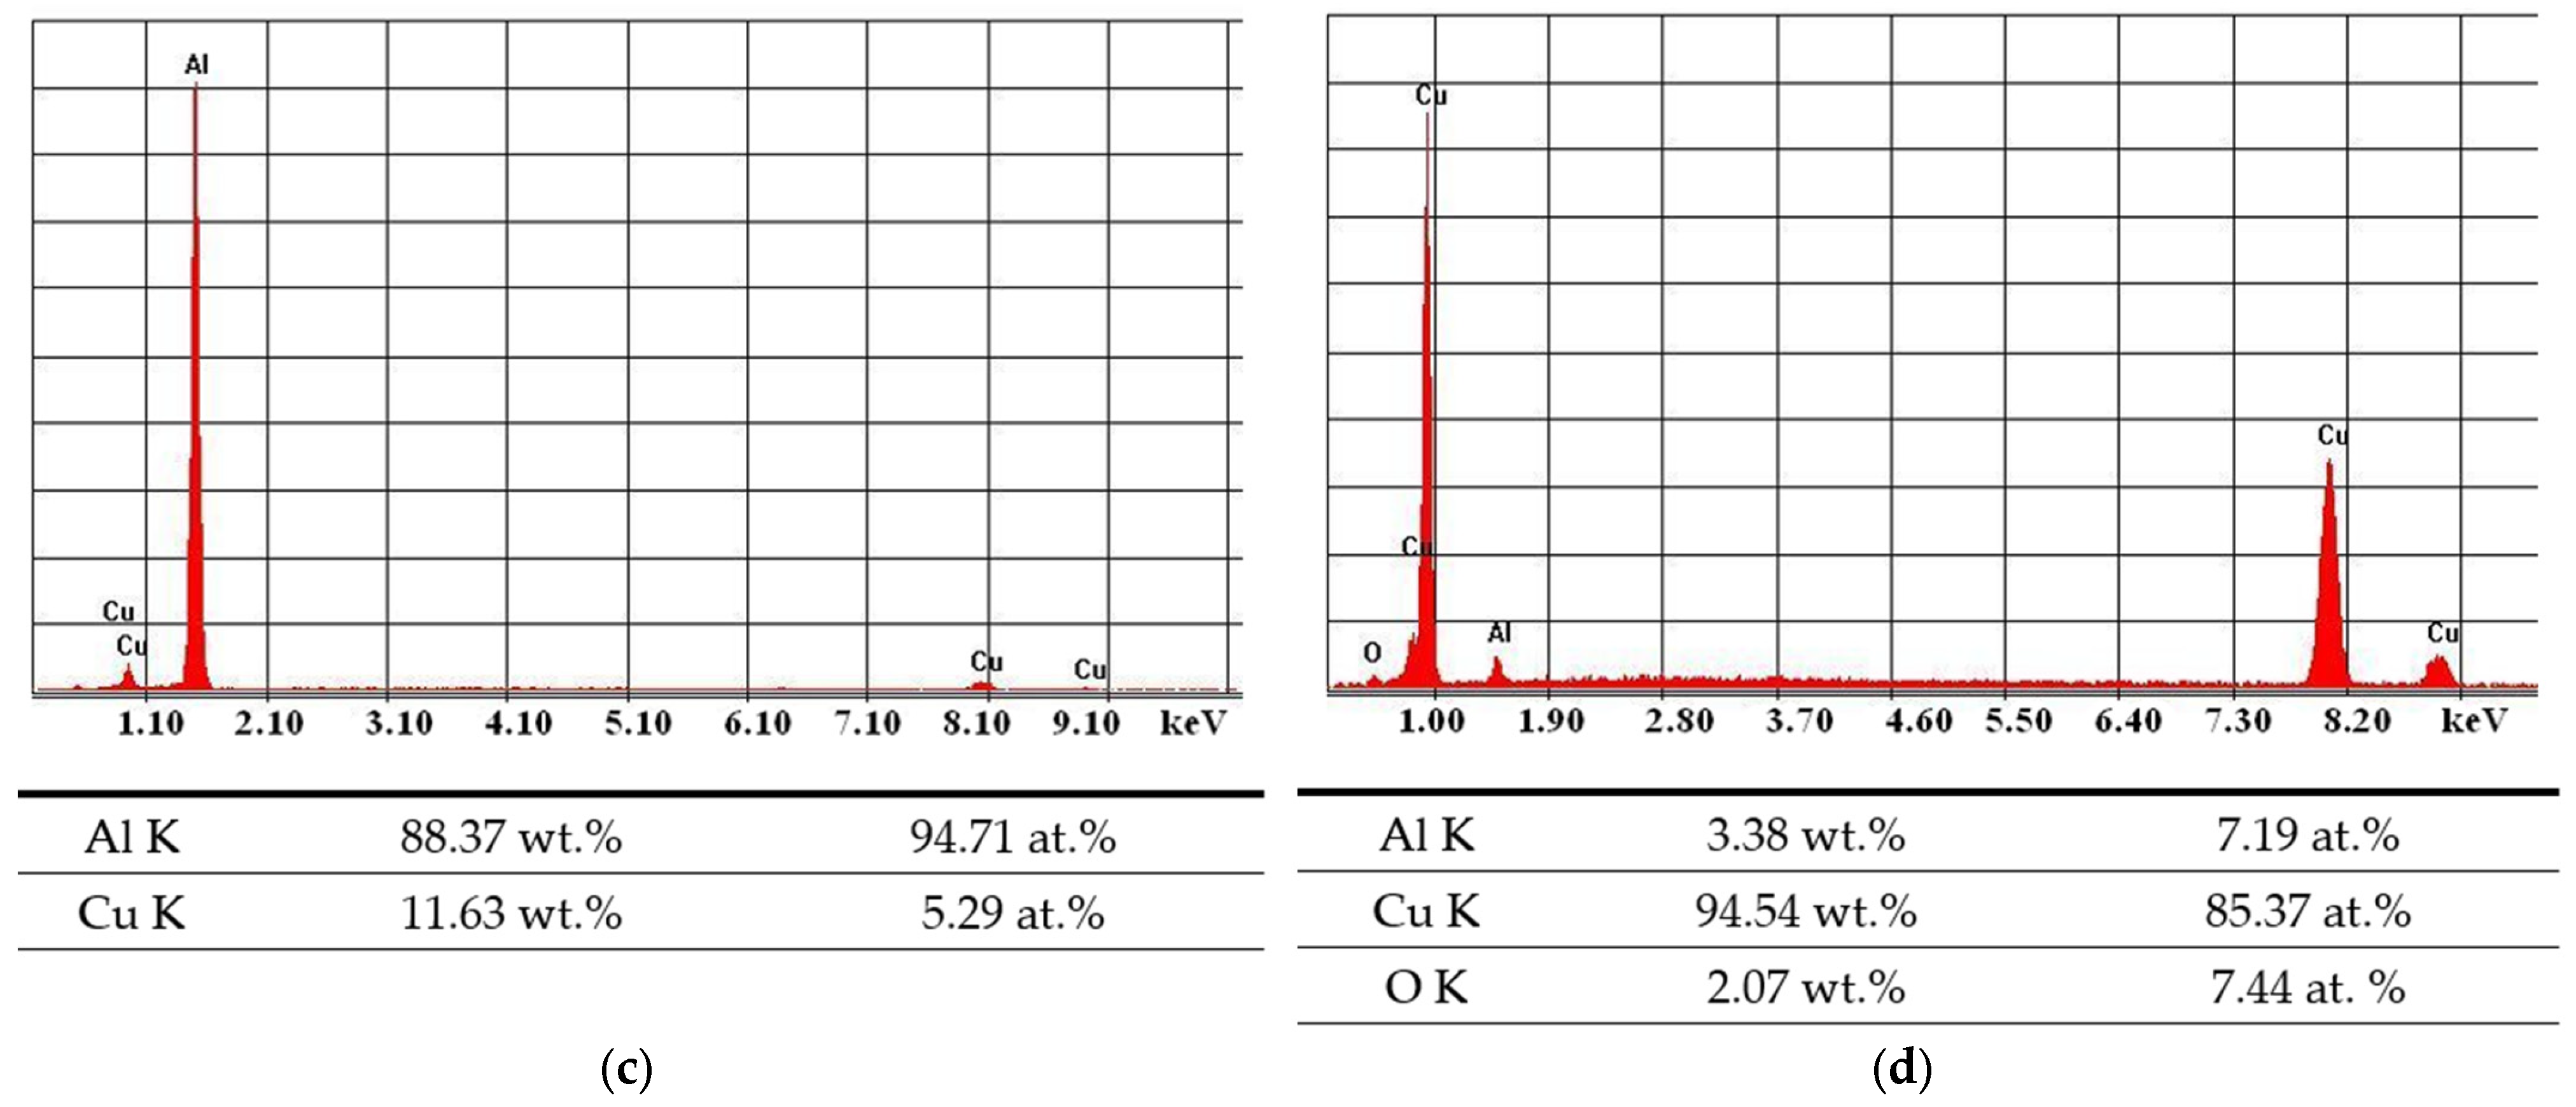
| white area | 3.38 | 94.54 | 2.07 | - | - | - | - | |
| gray area | 88.37 | 11.63 | - | - | - | - | - | |
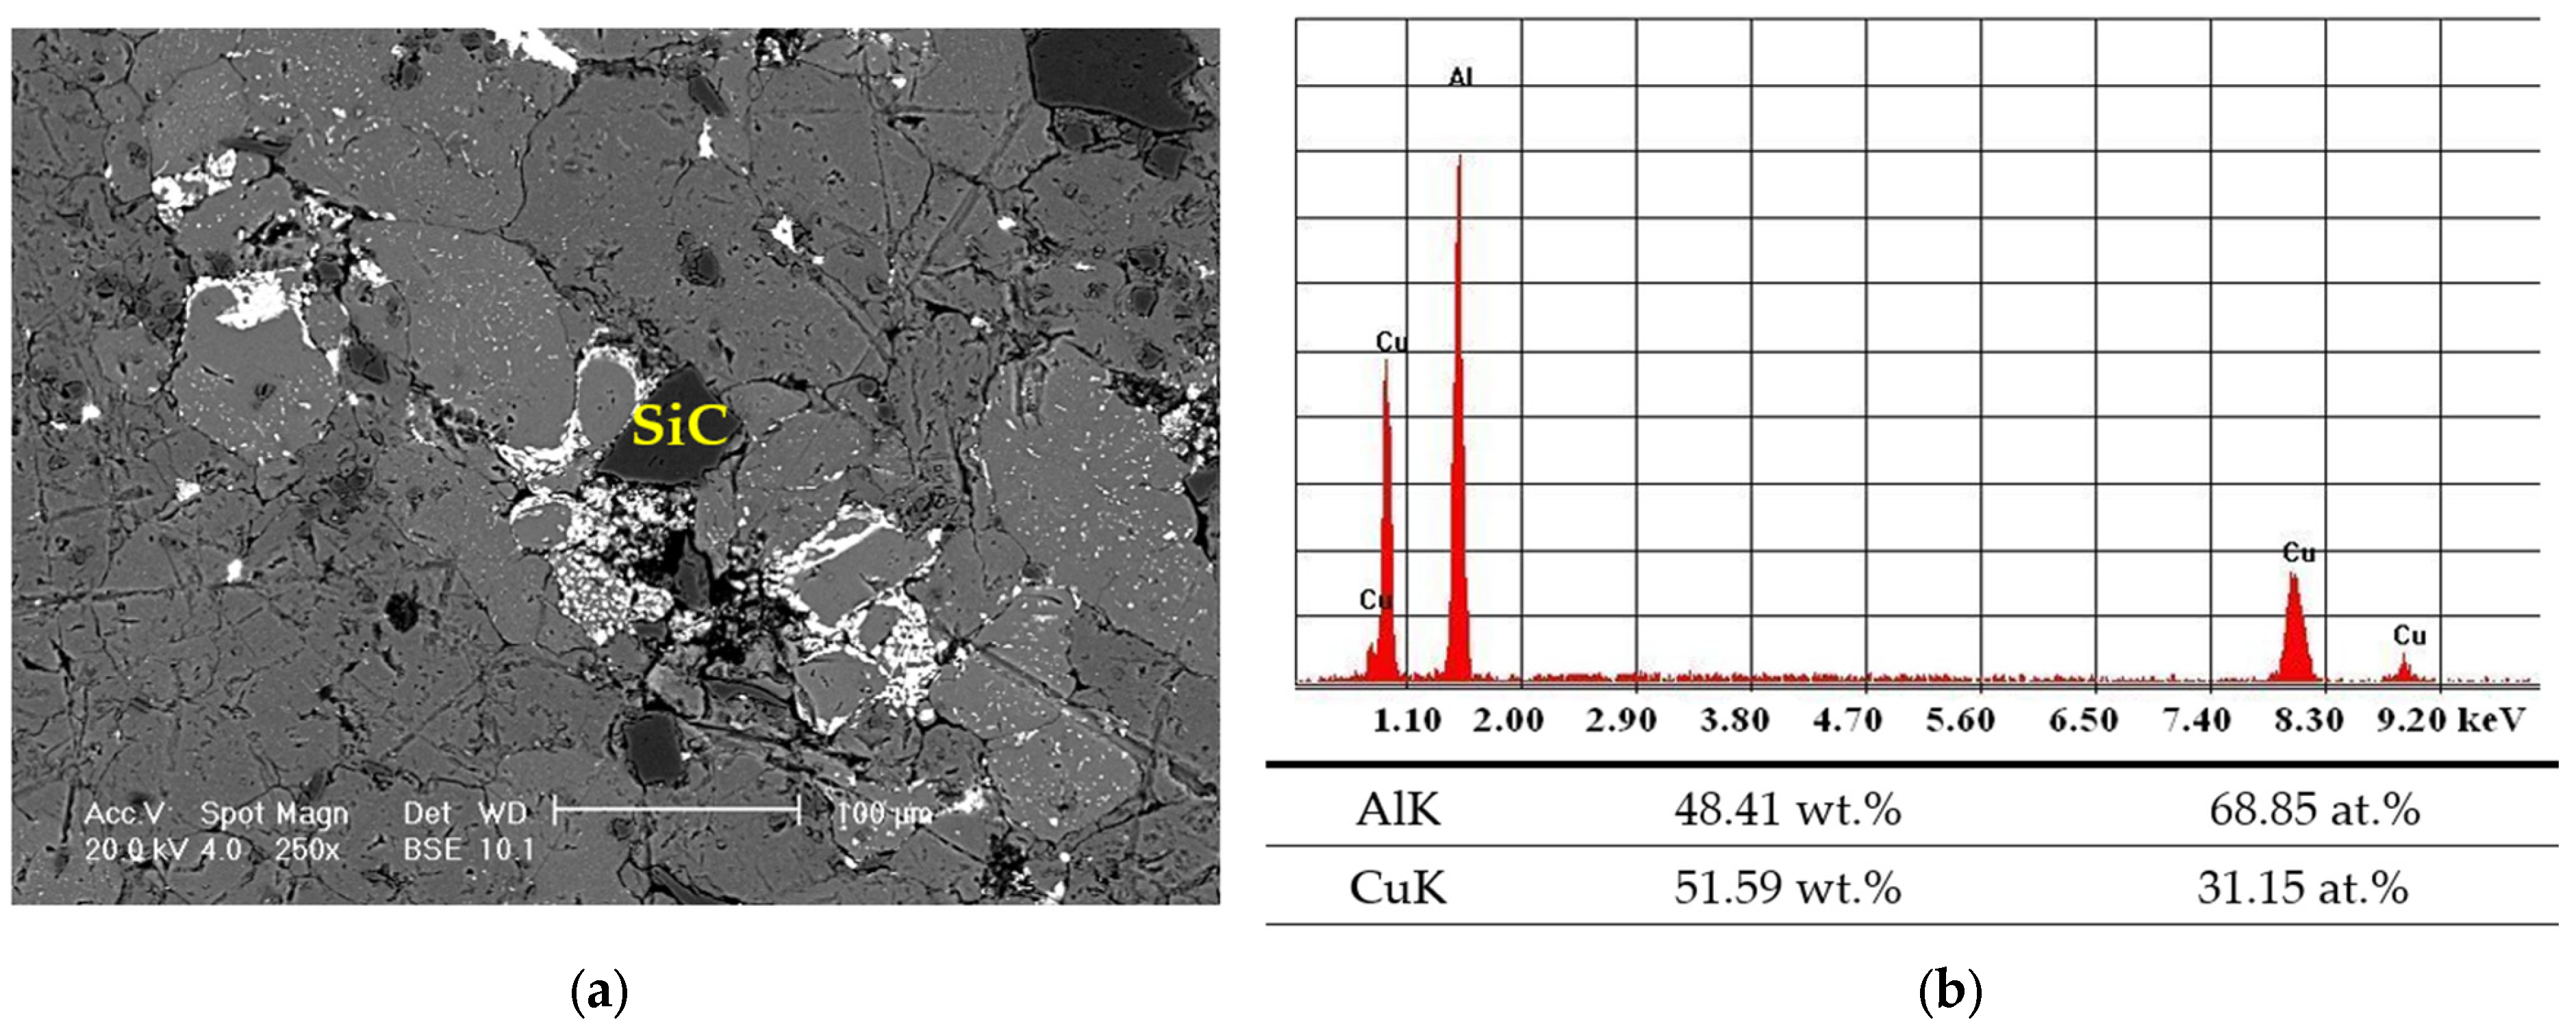
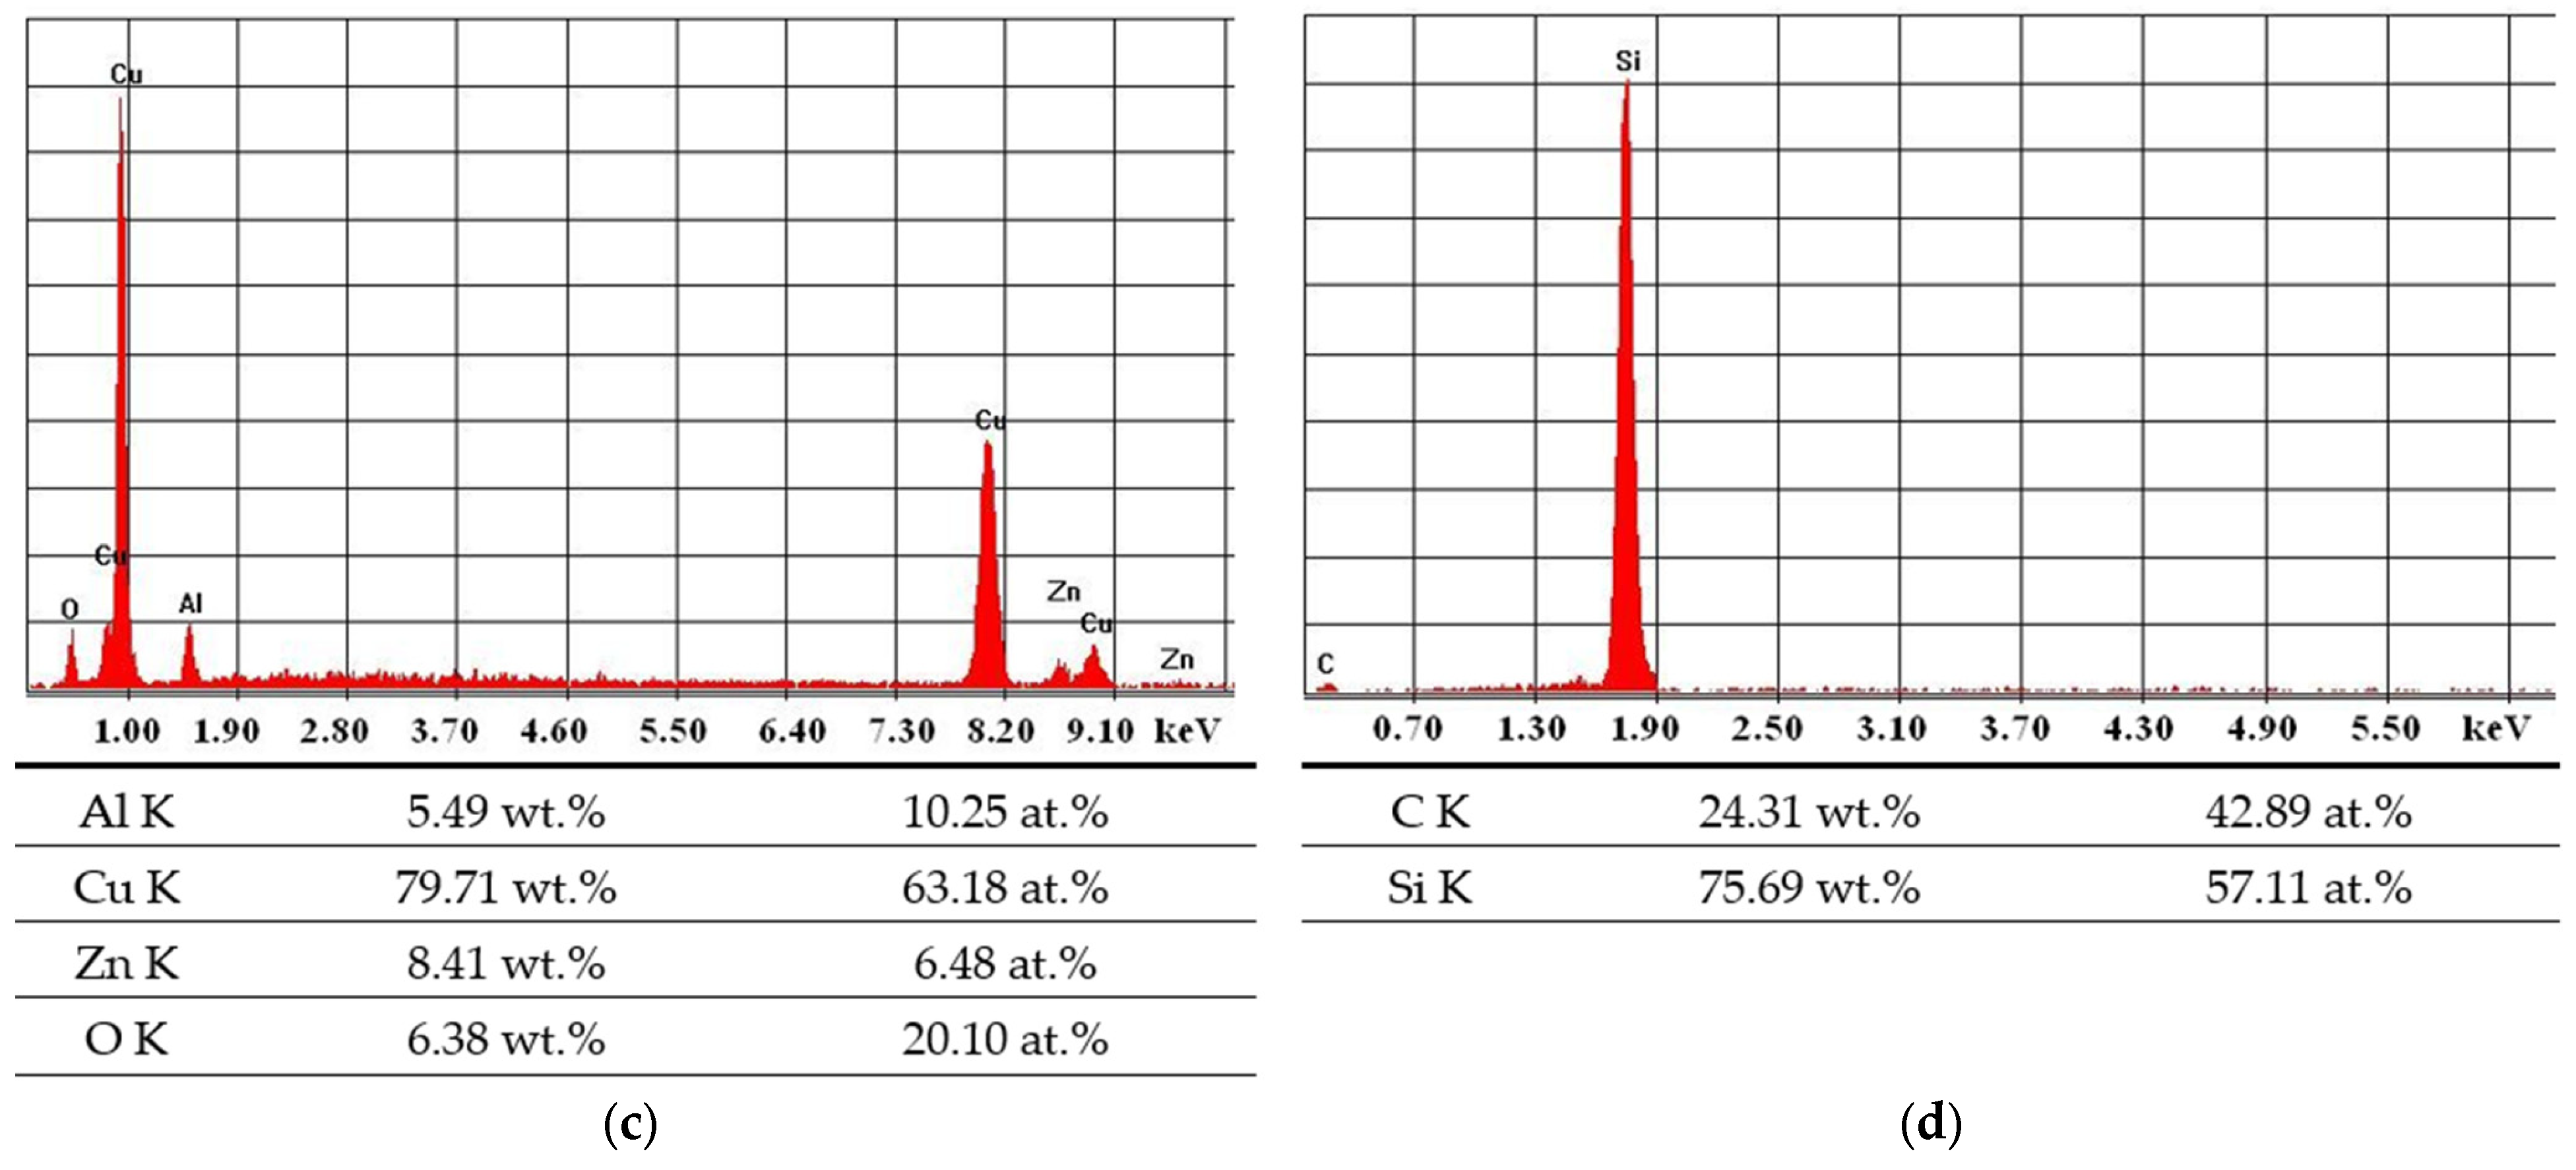
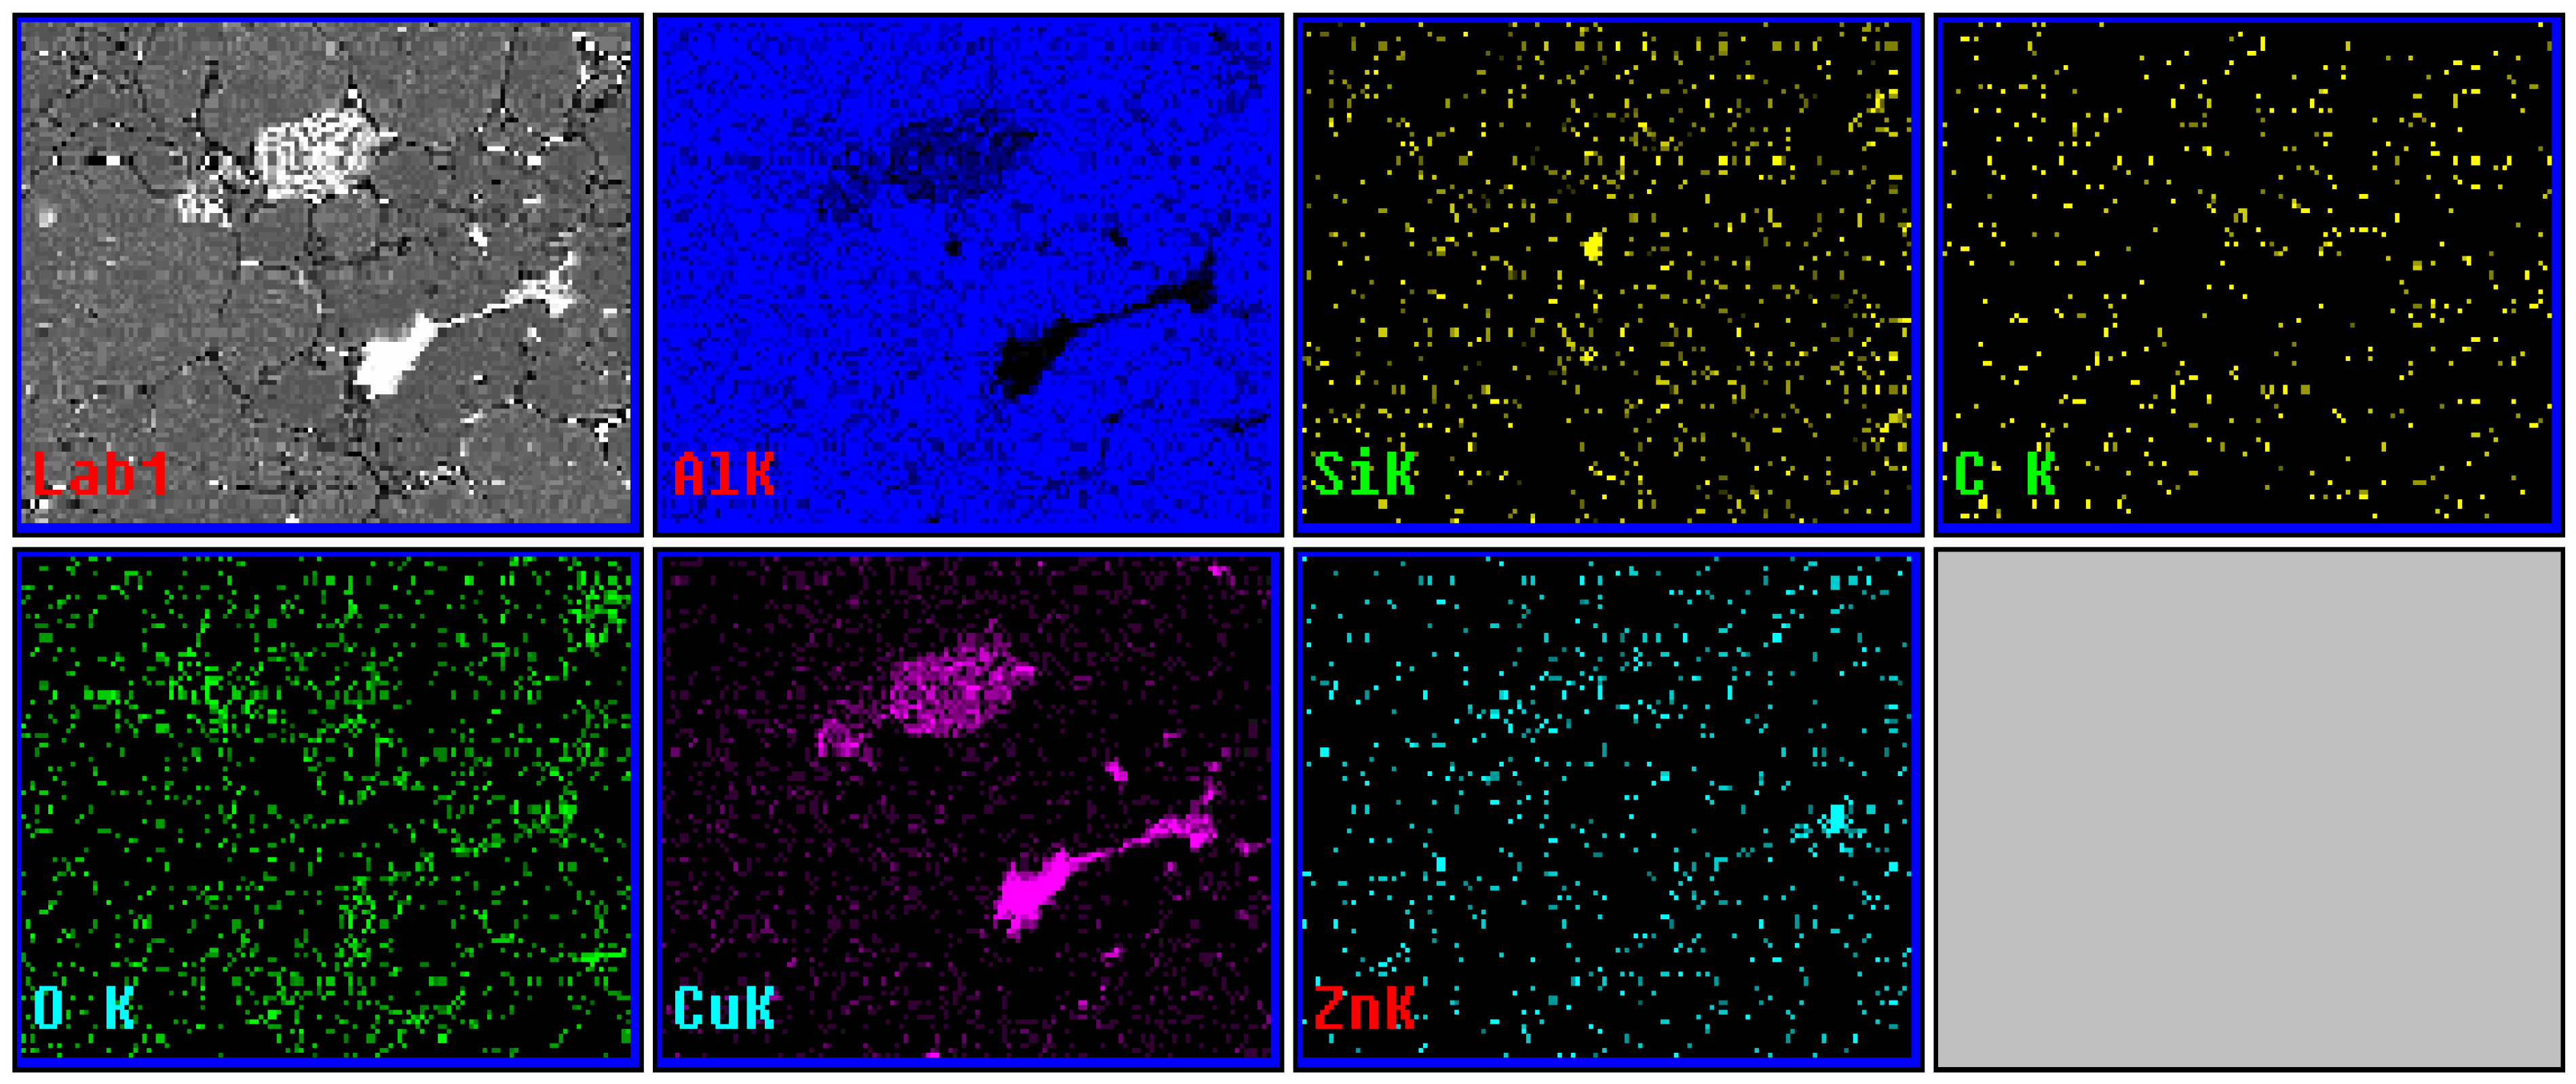
| Al-4Cu-10% SiC (170 °C/8 h) | white and gray area (Al2Cu) | 48.41 | 51.59 | - | - | - | - | - |
| white area | 5.49 | 79.71 | 6.38 | - | 8.41 | - | - | |
| SiC | - | - | - | - | - | 24.31 | 75.69 | |
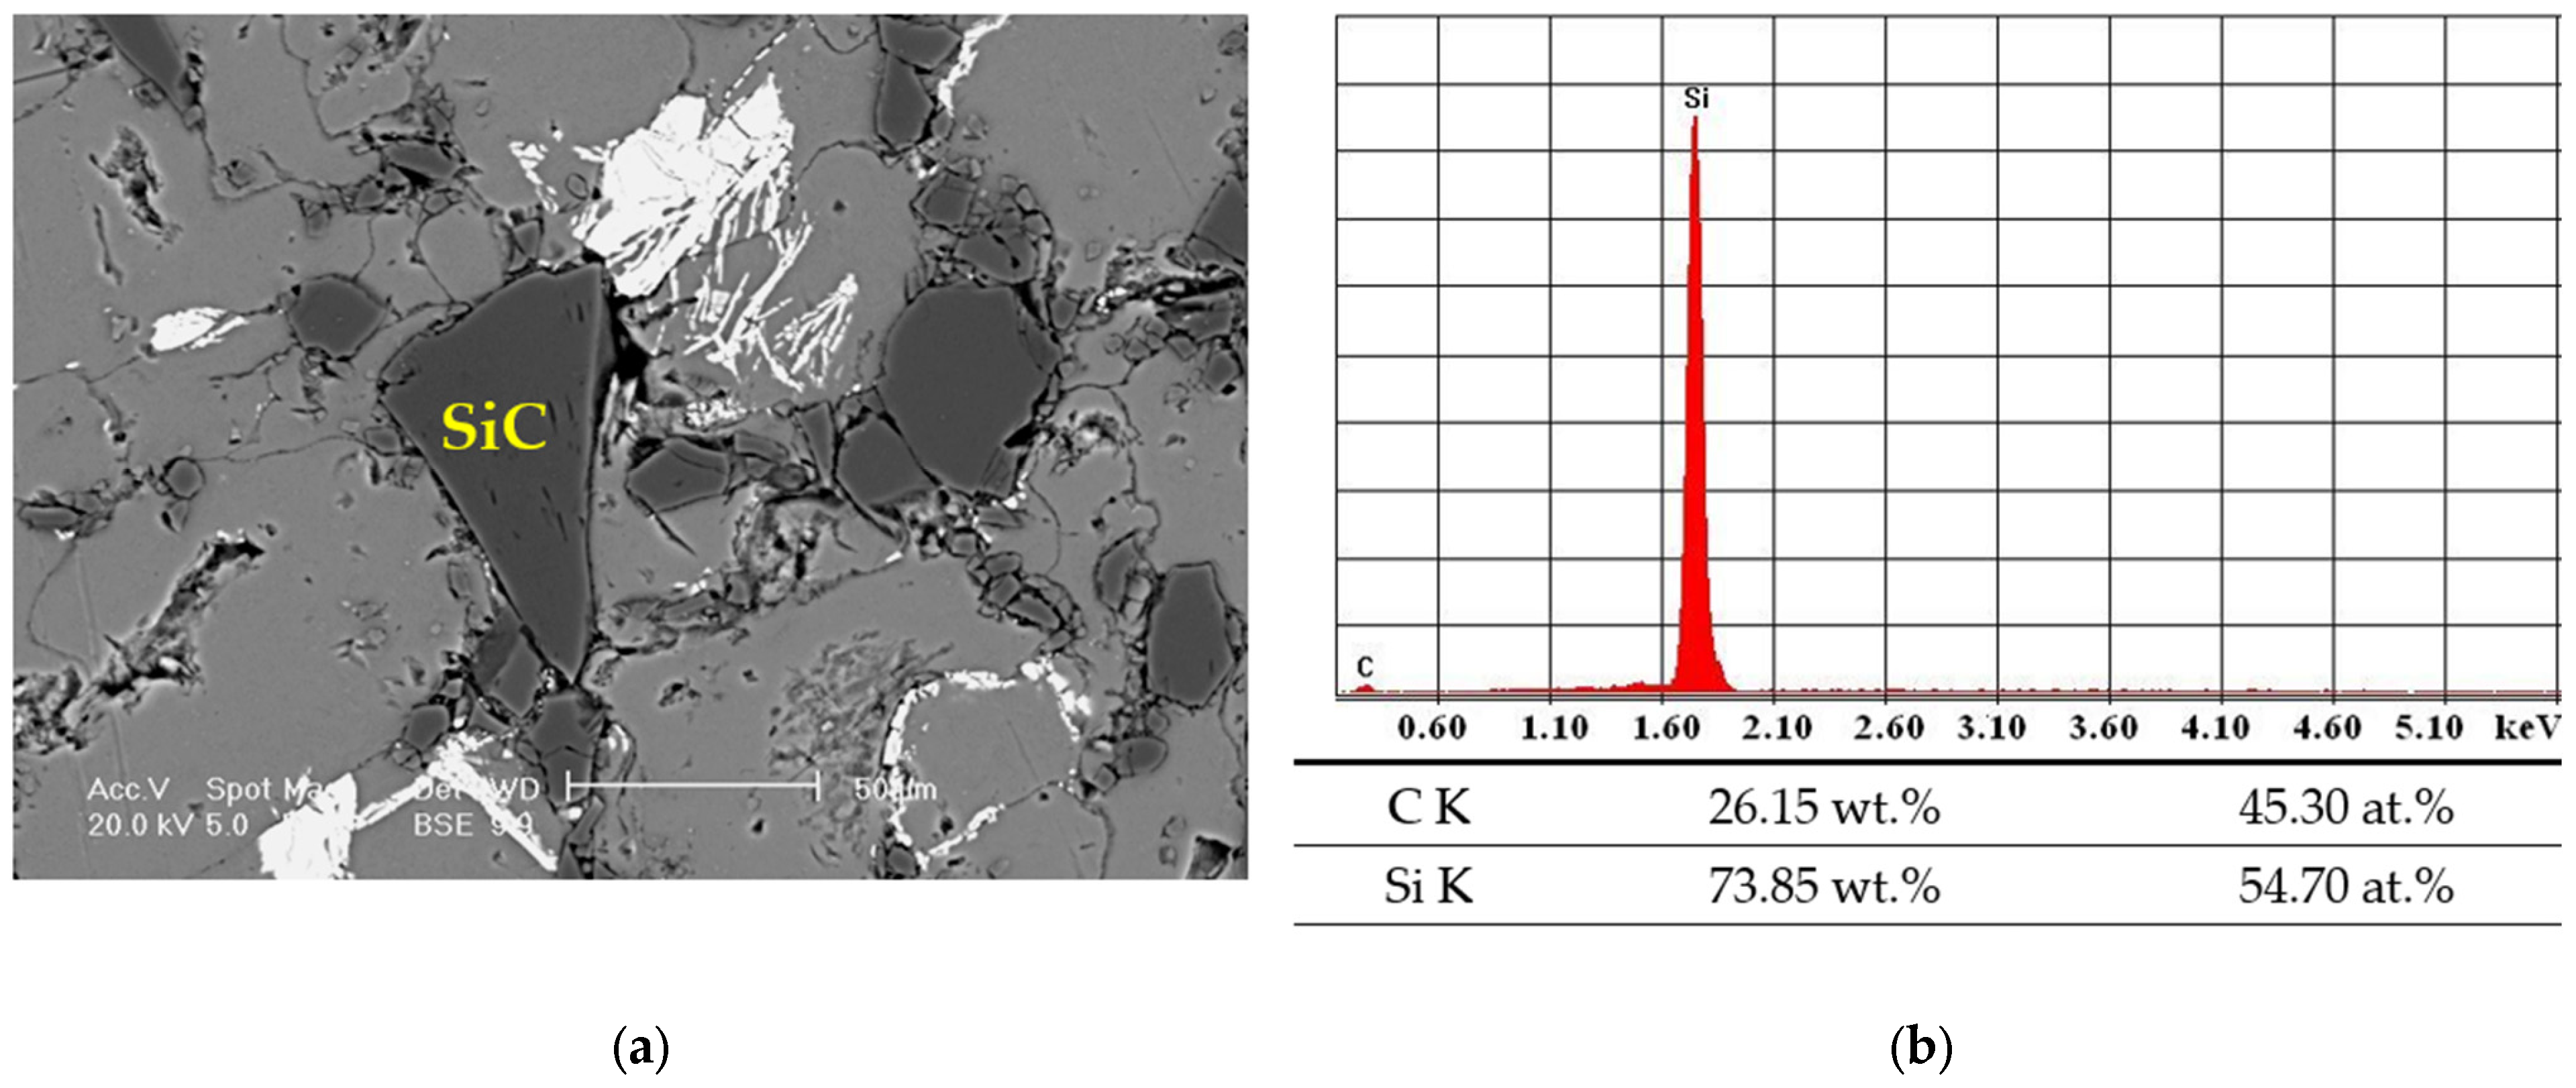
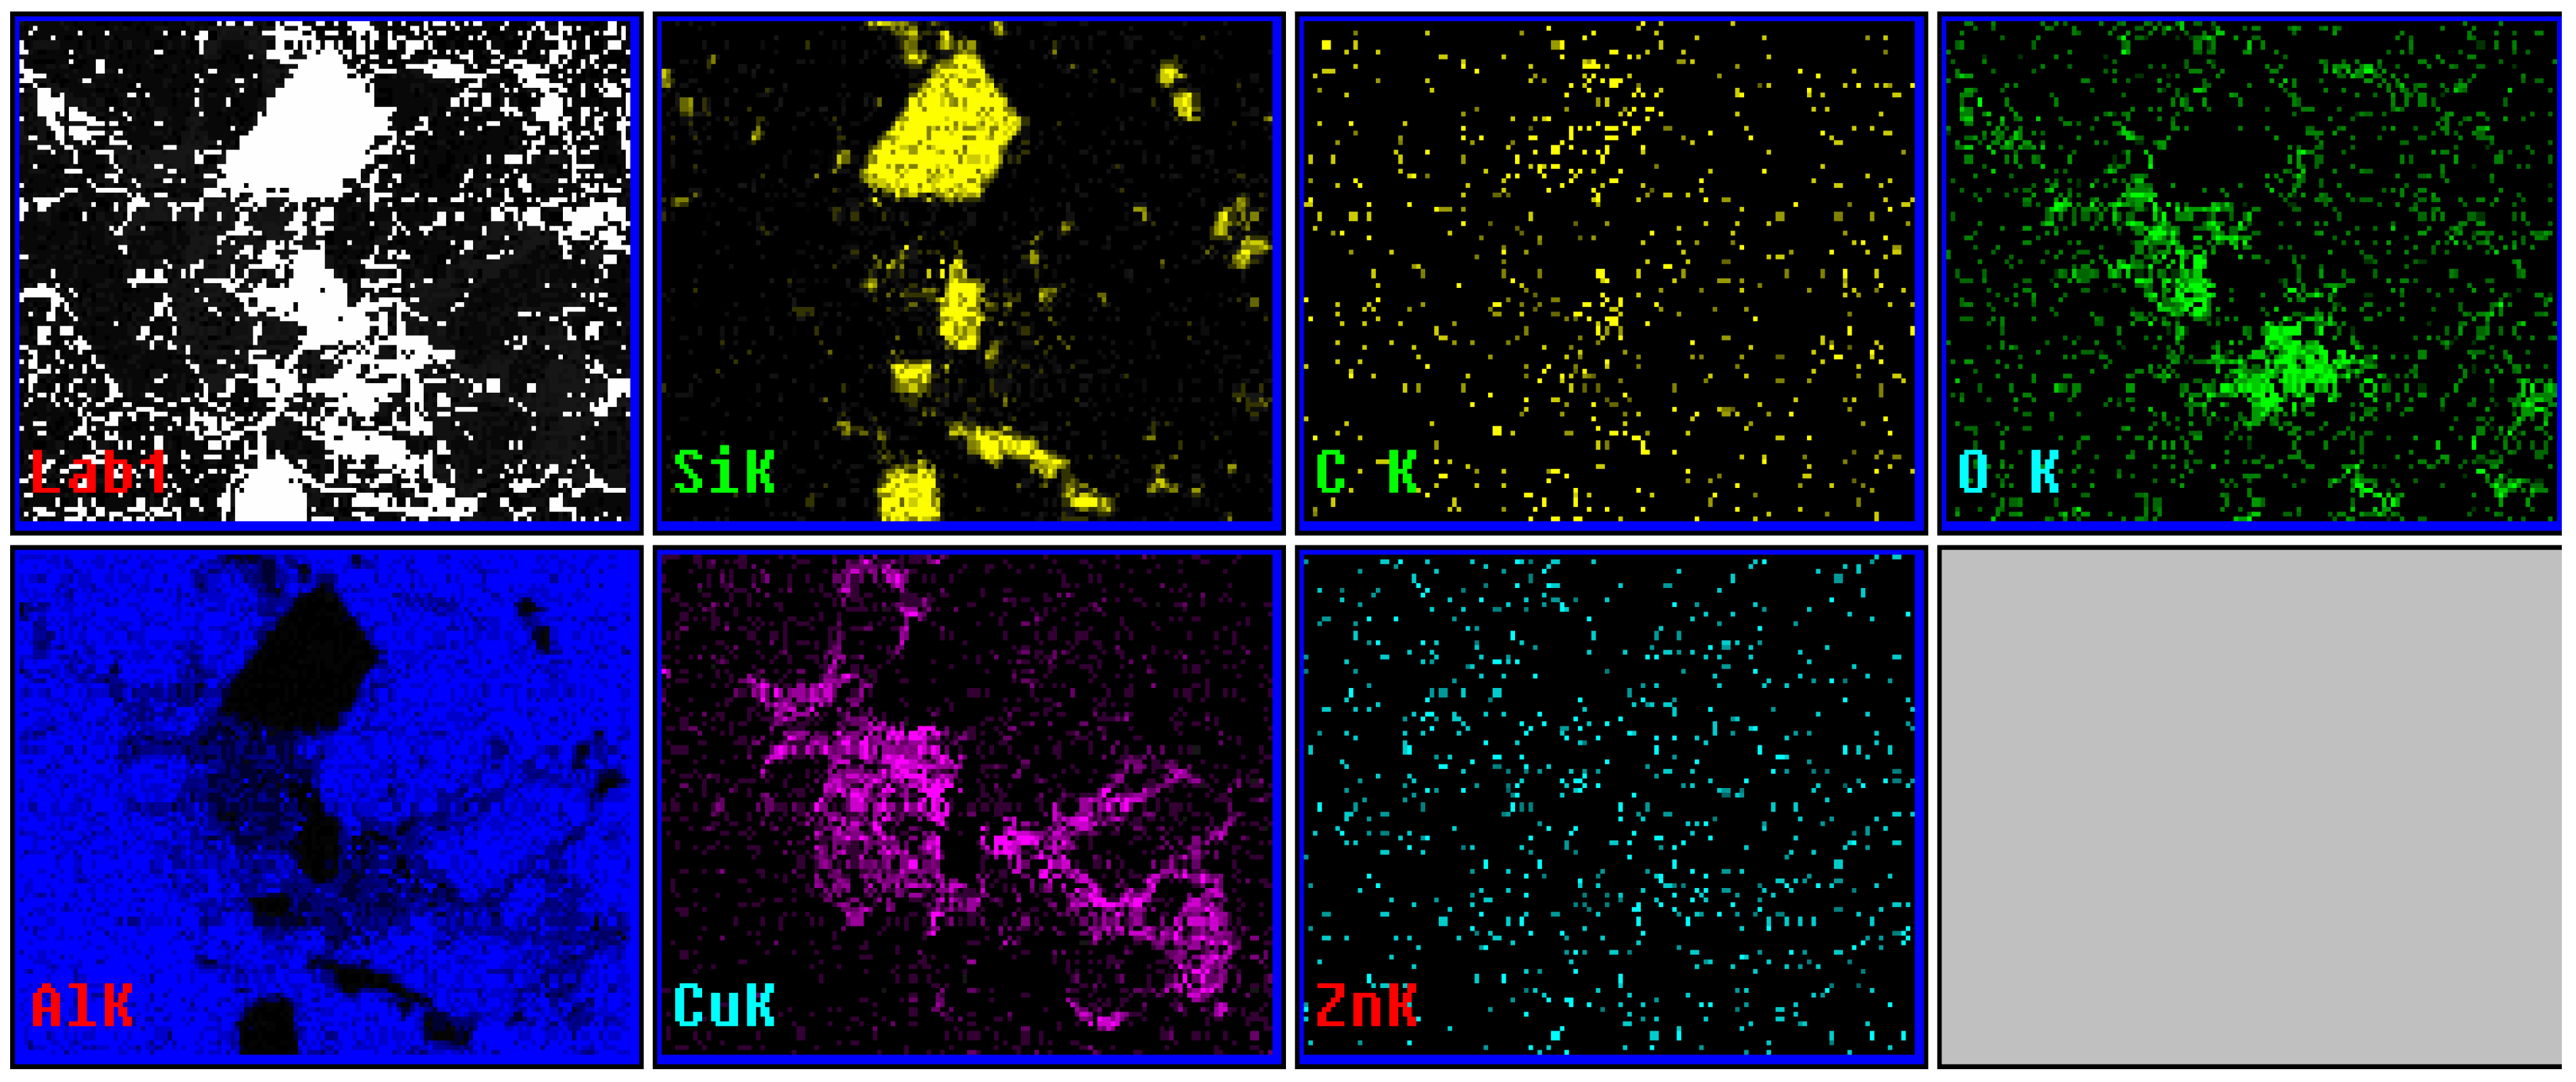
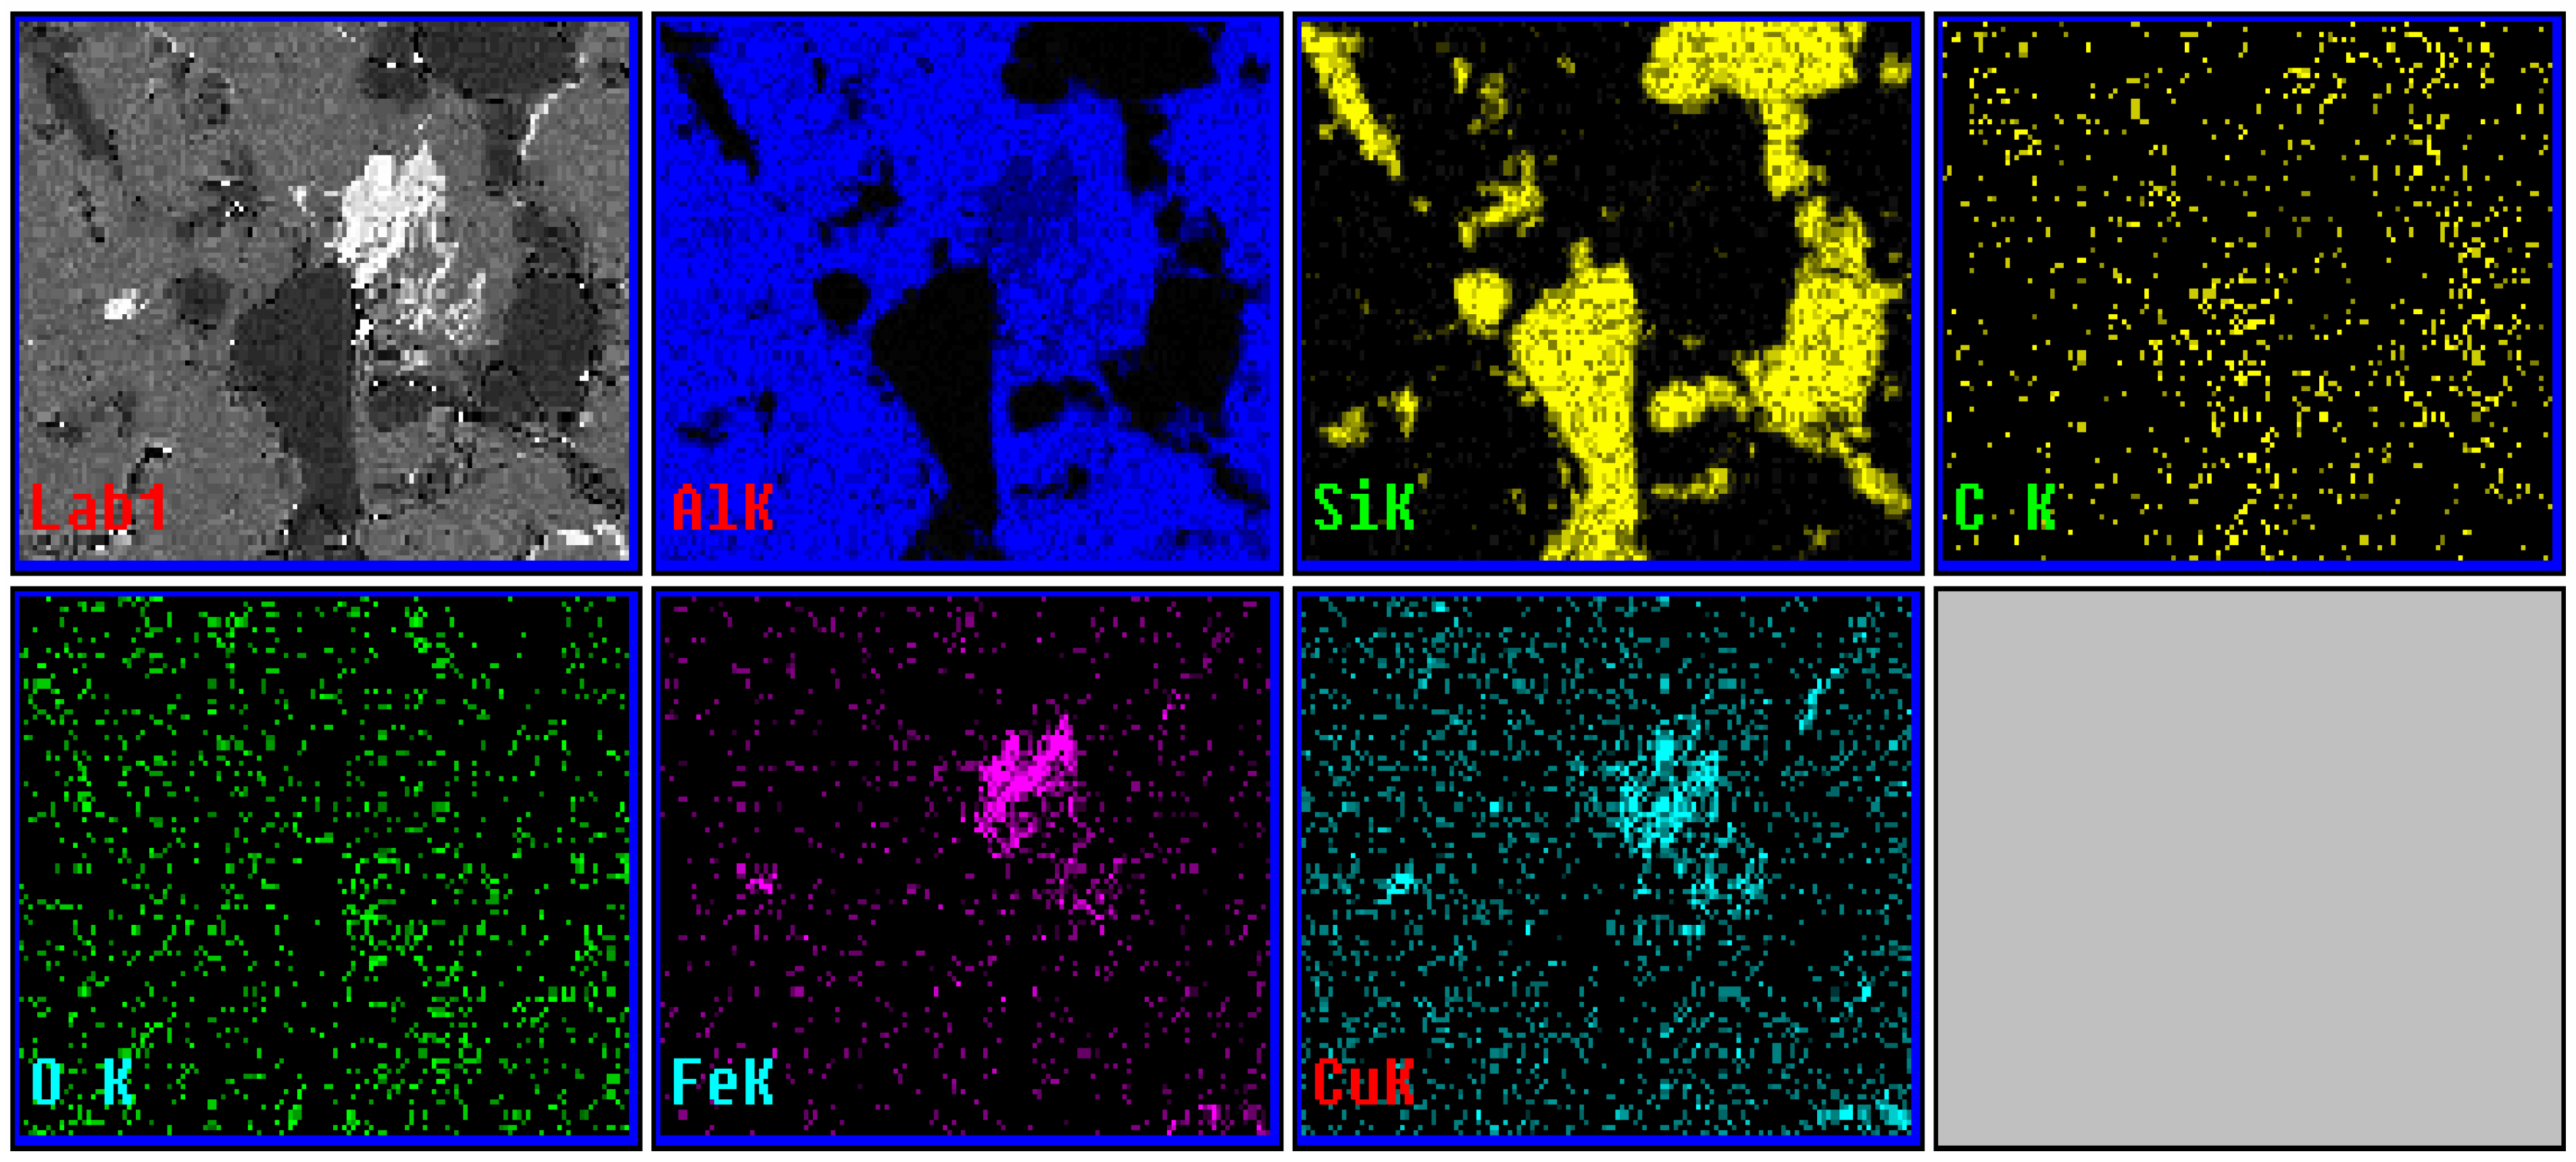
| Al-4Cu-15% SiC (170 °C/4 h) | white area | 49.61 | 33.59 | 1.32 | 14.61 | - | - | 0.87 |
| gray area | 55.74 | 8.96 | 1.59 | 30.38 | - | - | 3.34 | |
| SiC | - | - | - | - | - | 26.15 | 73.85 | |
| SI. No. | Variables | ||
|---|---|---|---|
| Factor Levels | Z1—Applied Load (×10−1 MPa) | Z2—Relative Speed in Braking Point (m/s) | |
| Coded values | x1 | x2 | |
| 1 | Upper level (+1) | 11.5 | 4.5 |
| 2 | Base level, Z0i (0) | 7.5 | 3.25 |
| 3 | Lower level (−1) | 3.5 | 2 |
| Variation interval, ΔZi | 4 | 1.25 | |
| Trial No. | x0 | Applied Load (×10−1 MPa) x1 | Relative Speed (m/s) x2 | x1 x2 | Wear Rate (mm/h) y1 | Wear Rate (g/cm3) y2 | Friction Coefficient y3 |
|---|---|---|---|---|---|---|---|
| 1 | (+1) | 11.5 (+1) | 4.5 (+1) | (+1) | 1.12 | 0.417 | 0.27 |
| 2 | (+1) | 3.5 (−1) | 4.5 (+1) | (−1) | 0.88 | 0.248 | 0.445 |
| 3 | (+1) | 11.5 (+1) | 2 (−1) | (−1) | 0.93 | 0.362 | 0.41 |
| 4 | (+1) | 3.5 (−1) | 2 (−1) | (+1) | 0.42 | 0.164 | 0.52 |
| No. | = | = | = | |||||||
|---|---|---|---|---|---|---|---|---|---|---|
| 1 | 0.83 | −0.0375 | 0.00140625 | 0.287 | −0.0065 | 0.0000423 | 0.41 | 0.015 | 0.000225 | 3 |
| 2 | 0.89 | −0.0175 | 0.00030625 | 0.279 | −0.0145 | 0.00021 | 0.38 | −0.015 | 0.000225 | 3 |
| 3 | 0.85 | 0.0225 | 0.00050625 | 0.31 | 0.0165 | 0.000272 | 0.39 | −0.005 | 0.000025 | 3 |
| 4 | 0.9 | 0.0325 | 0.00105625 | 0.298 | 0.0045 | 0.00002025 | 0.4 | 0.005 | 0.000025 | 3 |
| Trial No. | Applied Load ×10−1 MPa) | Relative Speed/ (m/s) | Wear Rate, (mm/h) | Calculated Wear Rate (mm/h) | Wear Rate g/cm2 h | Calculated Wear Rate, (g/cm2 h) | Friction Coefficient | Calculated Friction Coefficient | ||
|---|---|---|---|---|---|---|---|---|---|---|
| x0 | x1 | x2 | x1x2 | y1 | y1calc | y2 | y2calc | y3 | y3calc | |
| 1 | (+1) | 11.5 (+1) | 4.5 (+1) | (+1) | 1.12 | 1.188 | 0.417 | 0.4248 | 0.27 | 0.2862 |
| 2 | (+1) | 3.5 (−1) | 4.5 (+1) | (−1) | 0.88 | 0.813 | 0.248 | 0.2408 | 0.445 | 0.4282 |
| 3 | (+1) | 11.5 (+1) | 2 (−1) | (−1) | 0.93 | 0.863 | 0.362 | 0.3552 | 0.41 | 0.3938 |
| 4 | (+1) | 3.5 (−1) | 2 (−1) | (+1) | 0.42 | 0.488 | 0.164 | 0.1712 | 0.52 | 0.5358 |
| No. | |||||||||||||
|---|---|---|---|---|---|---|---|---|---|---|---|---|---|
| 1 | 1.12 | 1.188 | −0.088 | 0.007744 | 0.417 | 0.4248 | −0.0078 | 0.0000608 | 0.27 | 0.2862 | −0.0162 | 0.00026244 | 1 |
| 2 | 0.88 | 0.813 | 0.067 | 0.004489 | 0.248 | 0.2408 | 0.0072 | 0.0000518 | 0.445 | 0.4282 | 0.0168 | 0.00028224 | 1 |
| 3 | 0.93 | 0.863 | 0.067 | 0.004489 | 0.362 | 0.3552 | 0.0068 | 0.0000462 | 0.41 | 0.3938 | 0.0162 | 0.00026244 | 1 |
| 4 | 0.42 | 0.488 | −0.068 | 0.004624 | 0.164 | 0.1712 | −0.0072 | 0.0000518 | 0.52 | 0.5358 | −0.0158 | 0.00024964 | 1 |
Disclaimer/Publisher’s Note: The statements, opinions and data contained in all publications are solely those of the individual author(s) and contributor(s) and not of MDPI and/or the editor(s). MDPI and/or the editor(s) disclaim responsibility for any injury to people or property resulting from any ideas, methods, instructions or products referred to in the content. |
© 2025 by the authors. Licensee MDPI, Basel, Switzerland. This article is an open access article distributed under the terms and conditions of the Creative Commons Attribution (CC BY) license (https://creativecommons.org/licenses/by/4.0/).
Share and Cite
Popescu, I.N.; Alhalaili, B.; Anghelina, F.V.; Nicolicescu, C.; Vidu, R. Tribological Behaviors and Statistical Experimental Design of Sintered and Age-Hardened Aluminum–Copper Based Composites. Lubricants 2025, 13, 172. https://doi.org/10.3390/lubricants13040172
Popescu IN, Alhalaili B, Anghelina FV, Nicolicescu C, Vidu R. Tribological Behaviors and Statistical Experimental Design of Sintered and Age-Hardened Aluminum–Copper Based Composites. Lubricants. 2025; 13(4):172. https://doi.org/10.3390/lubricants13040172
Chicago/Turabian StylePopescu, Ileana Nicoleta, Badriyah Alhalaili, Florina Violeta Anghelina, Claudiu Nicolicescu, and Ruxandra Vidu. 2025. "Tribological Behaviors and Statistical Experimental Design of Sintered and Age-Hardened Aluminum–Copper Based Composites" Lubricants 13, no. 4: 172. https://doi.org/10.3390/lubricants13040172
APA StylePopescu, I. N., Alhalaili, B., Anghelina, F. V., Nicolicescu, C., & Vidu, R. (2025). Tribological Behaviors and Statistical Experimental Design of Sintered and Age-Hardened Aluminum–Copper Based Composites. Lubricants, 13(4), 172. https://doi.org/10.3390/lubricants13040172