1. Introduction
This research proposes a non-linear optimization model to design textured surfaces. Surface texturing is the process of creating micro- or nano-scale features on a surface. This technique modifies surface topography to improve tribological properties in micro- and nano-electromechanical systems (MEMS/NEMS) [
1,
2,
3]. The objective of our proposed model is to determine the feature size, shape, and arrangement that minimize the real contact area between interacting surfaces and minimize deformation during sliding in dry conditions. Our motivation is the fact that, in small-scale systems, surface forces are highly sensitive to the contact area. Minimizing the contact area leads to minimizing adhesion and friction forces. Failure to do so amplifies surface forces that can lead to device failure [
1,
4]. There are numerous examples of small-scale mechanical devices in biomedical implants and precision manufacturing tools (such as pacemakers, wheelchairs, drills, etc.) that contain moving or sliding components where friction reduction via surface texturing could substantially improve performance and longevity [
5,
6]. The outcome of the proposed model is a surface texture that is specifically engineered to deliver improved performance in tribological applications by controlling the real contact area. Precise control of the design and fabrication of MEMS/NEMS can unlock the full potential of surface texturing for tribological applications.
Several techniques have been utilized to fabricate designed surfaces, including laser ablation, soft lithography, hot embossing, photolithography-based techniques, electron beam lithography, nanoparticle spin coating, nanoparticle self-assembly, polymer jet printing, and “pulsed-mode” two-photon lithography [
1,
7]. These advanced fabrication technologies have enabled the creation of intricate surface textures with specific geometries. Despite notable advancements in fabrication technologies and theoretical modeling, a significant gap remains in techniques explicitly focused on the design of surface textures to reduce adhesion and friction. The design process—including determining the feature size, shape, and arrangement—is crucial for engineering surface textures that deliver superior performance in tribological applications. Research further highlights that the tribological performance of designed surfaces is significantly influenced by surface texturing, particularly the shape and specific parameters of the texture. However, existing studies have primarily examined surface texturing under lubricated and hydrodynamic conditions, with fewer investigations addressing dry sliding conditions.
Motivated by the potential of surface texturing to enhance tribological performance in miniaturized MEMS/NEMS, this study presents a novel approach to texture design under dry-sliding conditions. We develop a non-linear optimization model that minimizes both the contact area between interacting surfaces and texture deformation, while maintaining precise control over key design parameters such as feature size and shape. By leveraging advanced mathematical modeling and optimization, our work provides a robust framework for predicting and refining surface textures across a broad range of materials, including metals, ceramics, and polymers. In particular, stiff/hard ceramics commonly used in MEMS/NEMS stand to benefit greatly from minimal contact deformation, and metals similarly exhibit high stiffness that can accommodate the proposed design approach. By bridging the gap between manufacturing capabilities and performance requirements, this framework paves the way for major advancements in tribological performance and surface engineering.
The proposed model for surface texturing reduces friction and wear, thereby extending the lifespan of components in MEMS/NEMS. This leads to lower material consumption, reduced maintenance needs, and decreased energy usage associated with frictional losses. Furthermore, the model’s focus on optimizing texture design ensures that fabrication resources are used efficiently, minimizing material waste and reducing the environmental footprint of manufacturing processes. By integrating sustainable design principles, the proposed approach supports the development of durable, high-performance surfaces that align with long-term ecological and economic objectives in advanced engineering applications.
2. Literature Review
In order to highlight the contribution of the proposed optimization model, we review the related literature focused on experimental, simulation, computational, and optimization methods for surface texturing design. We also provide a review of non-linear optimization methods and solution approaches. We summarize this literature in the next few paragraphs.
2.1. Methods for Surface Texturing Design
2.1.1. Experimental Methods
Afshar-Mohajer and Zou [
1] use experimental methods to examine the effects of three distinct textures under dry sliding conditions on friction, contact area, and texture durability. They compared cones (
textures) with cylinders (
-base textures) and rods (
-tip textures), which were fabricated using two-photon lithography and replica molding with PDMS. Their findings show that
textures effectively reduced friction by minimizing the real contact area at the tip of the texture and showed higher load-bearing capacity and resistance to deformation due to their larger base. Evangelista et al. [
6] present a comprehensive analysis of the impact that surface texturing has on the dry tribological performance of polymeric materials in medical devices. Their findings show that geometric shapes, such as grooves and pillars, are particularly effective in influencing the frictional behavior on polymer surfaces. Designed polymer surfaces, especially those with reduced effective contact areas, show a significant reduction in friction. Kang et al. [
8] explored the frictional behavior of aluminum substrates textured with smooth, micro-dome, and nanoscale dimple designs. They found that nanotextured surfaces increase friction under dry conditions due to higher adhesion forces but significantly reduced friction under wet conditions.
2.1.2. Simulations and Computational Models
A study by Cheng et al. [
9] investigates the friction behavior of cemented carbide surfaces textured through femtosecond laser processing. Finite element analysis of the friction process was conducted using Abaqus software. The research focuses on assessing the impact of different texture orientations and the angle between the sliding direction and texture pattern on the friction coefficient and wear resistance. Berardo et al. [
10] investigate the dry sliding behavior of laser-textured SiC and carbon black surfaces. Their findings revealed that larger hole diameters and higher texture densities significantly reduced dynamic friction and heat generation, especially on the stiffer SiC surfaces. Finite element simulations further validated the critical role of hole diameter in optimizing tribological performance. Xing et al. [
11] combined experimental testing and empirical analysis to study the effects of linear and wavy grooves on Al
2O
3/TiC ceramics, finding that wavy grooves with smaller spacing improved wear resistance by reducing contact area, increasing surface roughness, and trapping debris. He et al. [
12] combined experimental and simulation methods to analyze micro-textures on cemented carbide surfaces, showing that circular pit geometries provided superior friction reduction and wear resistance by improving stress distribution and accommodating wear debris. Using response surface methodology, they optimized texture fabrication parameters, achieving a
reduction in friction coefficients. Yang et al. [
13] use simulation to improve the milling performance of different V-groove micro-texture ball-end milling cutters for milling titanium alloys. By simulating thermal and force characteristics, they refined groove parameters to reduce cutting force, improve chip flow, and enhance wear resistance.
2.1.3. Optimization Technique
Ge et al. [
14] evaluate five algorithms—linear regression, decision tree, gradient boosting, support vector machine, and neural network—for their ability to predict load-carrying capacity and friction force based on texture parameters including depth, side length, surface ratio, and shape.
2.2. Non-Linear Optimization
Non-linear optimization is a cornerstone of modern applied mathematics, with numerous applications spanning various engineering disciplines and industrial processes [
15,
16]. In the context of surface texturing, non-linear models excel at capturing and optimizing the complex interactions among geometry, material properties, and load conditions. These models often involve multiple, interdependent parameters—such as surface roughness, dimple geometry, coating characteristics, and elastic deformations—which together govern frictional and wear behavior [
17].
For well-behaved problems where the objective function and constraints are differentiable, gradient-based methods are typically employed. However, when the design space is highly non-convex, lacks closed-form gradients, or includes mixed discrete-continuous variables—common traits in tribological surface optimization—heuristic and meta-heuristic methods (e.g., genetic algorithms, particle swarm optimization, simulated annealing) have gained widespread attention [
18,
19]. These population-based or stochastic techniques rely on iterative refinement and global exploration strategies to evade local minima and discover near-optimal solutions. In parallel, problem-specific heuristics may integrate domain knowledge (e.g., restricting texture parameters to physically feasible ranges) to guide searches more effectively.
For very large-scale or distributed formulations, decomposition methods present a valuable approach to reduce complexity [
20,
21]. These techniques split the original problem into smaller, more tractable subproblems, each focusing on a subset of design variables or constraints. Coordinating these subproblems through a master–subproblem workflow allows for the exploitation of specific structural features in tribological models, such as spatial partitioning of a textured surface or separate treatment of structural domains. When combined with heuristics or meta-heuristics, these decomposition approaches can yield near-global solutions in a fraction of the time required by direct, “all-in-one” optimization.
In tribology research, numerous theoretical studies seek to identify optimal texturing parameters—for instance, the aspect ratio of dimples, texture density, relative dimple depth, or texturing extent—to improve load-carrying capacity and reduce friction. Such designs often rely on non-linear optimization to balance the physical constraints imposed by governing equations (e.g., the Reynolds equation) and to manage the large number of variables characterizing surface geometry. By systematically refining these variables, researchers can effectively reconcile competing objectives—while minimizing surface contact—and thereby achieve more robust and efficient textured surfaces for real-world tribological applications [
22].
2.3. Key Contributions to the Literature and Practical Relevance
Counterface-Aware Texture Optimization: Unlike existing approaches that focus solely on designing texture for one surface, our method systematically optimizes the counterface texture based on the topography of the given surface. This results in a more realistic and application-driven approach that directly impacts friction, wear resistance, and load distribution in real-world mechanical systems.
Multi-Factor Optimization for MEMS/NEMS and Large-Scale Applications: Our model is particularly relevant to MEMS/NEMS, as well as larger mechanical components where precise control over tribological properties is essential. The method takes a systems approach by incorporating multiple design parameters, making it a scalable and adaptable solution for high-precision industries such as aviation, manufacturing, and biomedical devices.
Beyond Empirical Design—A Data-Driven Predictive Tool: Many current texture designs rely on empirical methods, which are labor-intensive, time-consuming, and often suboptimal. Our computational optimization framework enables engineers to efficiently identify ideal texture parameters while significantly reducing the reliance on costly physical prototyping.
Compatibility with Modern Fabrication Techniques: The proposed method is compatible with widely used fabrication techniques such as photolithography, laser texturing, and other precision manufacturing methods. The ability to fine-tune texture designs computationally before fabrication makes this method highly relevant to practical industrial applications.
Statistical and Computational Validation: Our results demonstrate that enforcing symmetry in texture design increases contact area, which can negatively impact tribological performance. Through hypothesis testing and statistical analysis, we show that non-symmetric designs lead to significantly lower contact areas, thereby improving wear resistance and reducing friction.
The proposed model can be further refined by accounting for the mechanics of deformation during sliding, etc. However, we firmly believe that this work represents an important step forward in optimizing surface textures beyond conventional single-surface designs. By considering both the textured surface and the counterface, our approach provides a more comprehensive and practical solution for real-world applications. The integration of multi-factor optimization and computational modeling makes it a valuable predictive tool that enhances surface engineering in both research and industry.
The goal of the proposed research is to provide a robust framework that supports the effective design of textured surfaces for various engineering applications. This research will contribute to the ongoing efforts to improve the efficiency and reliability of MEMS/NEMS, paving the way for their broader adoption in industrial and commercial applications.
3. Modeling Approach
3.1. Problem Definition and Assumptions
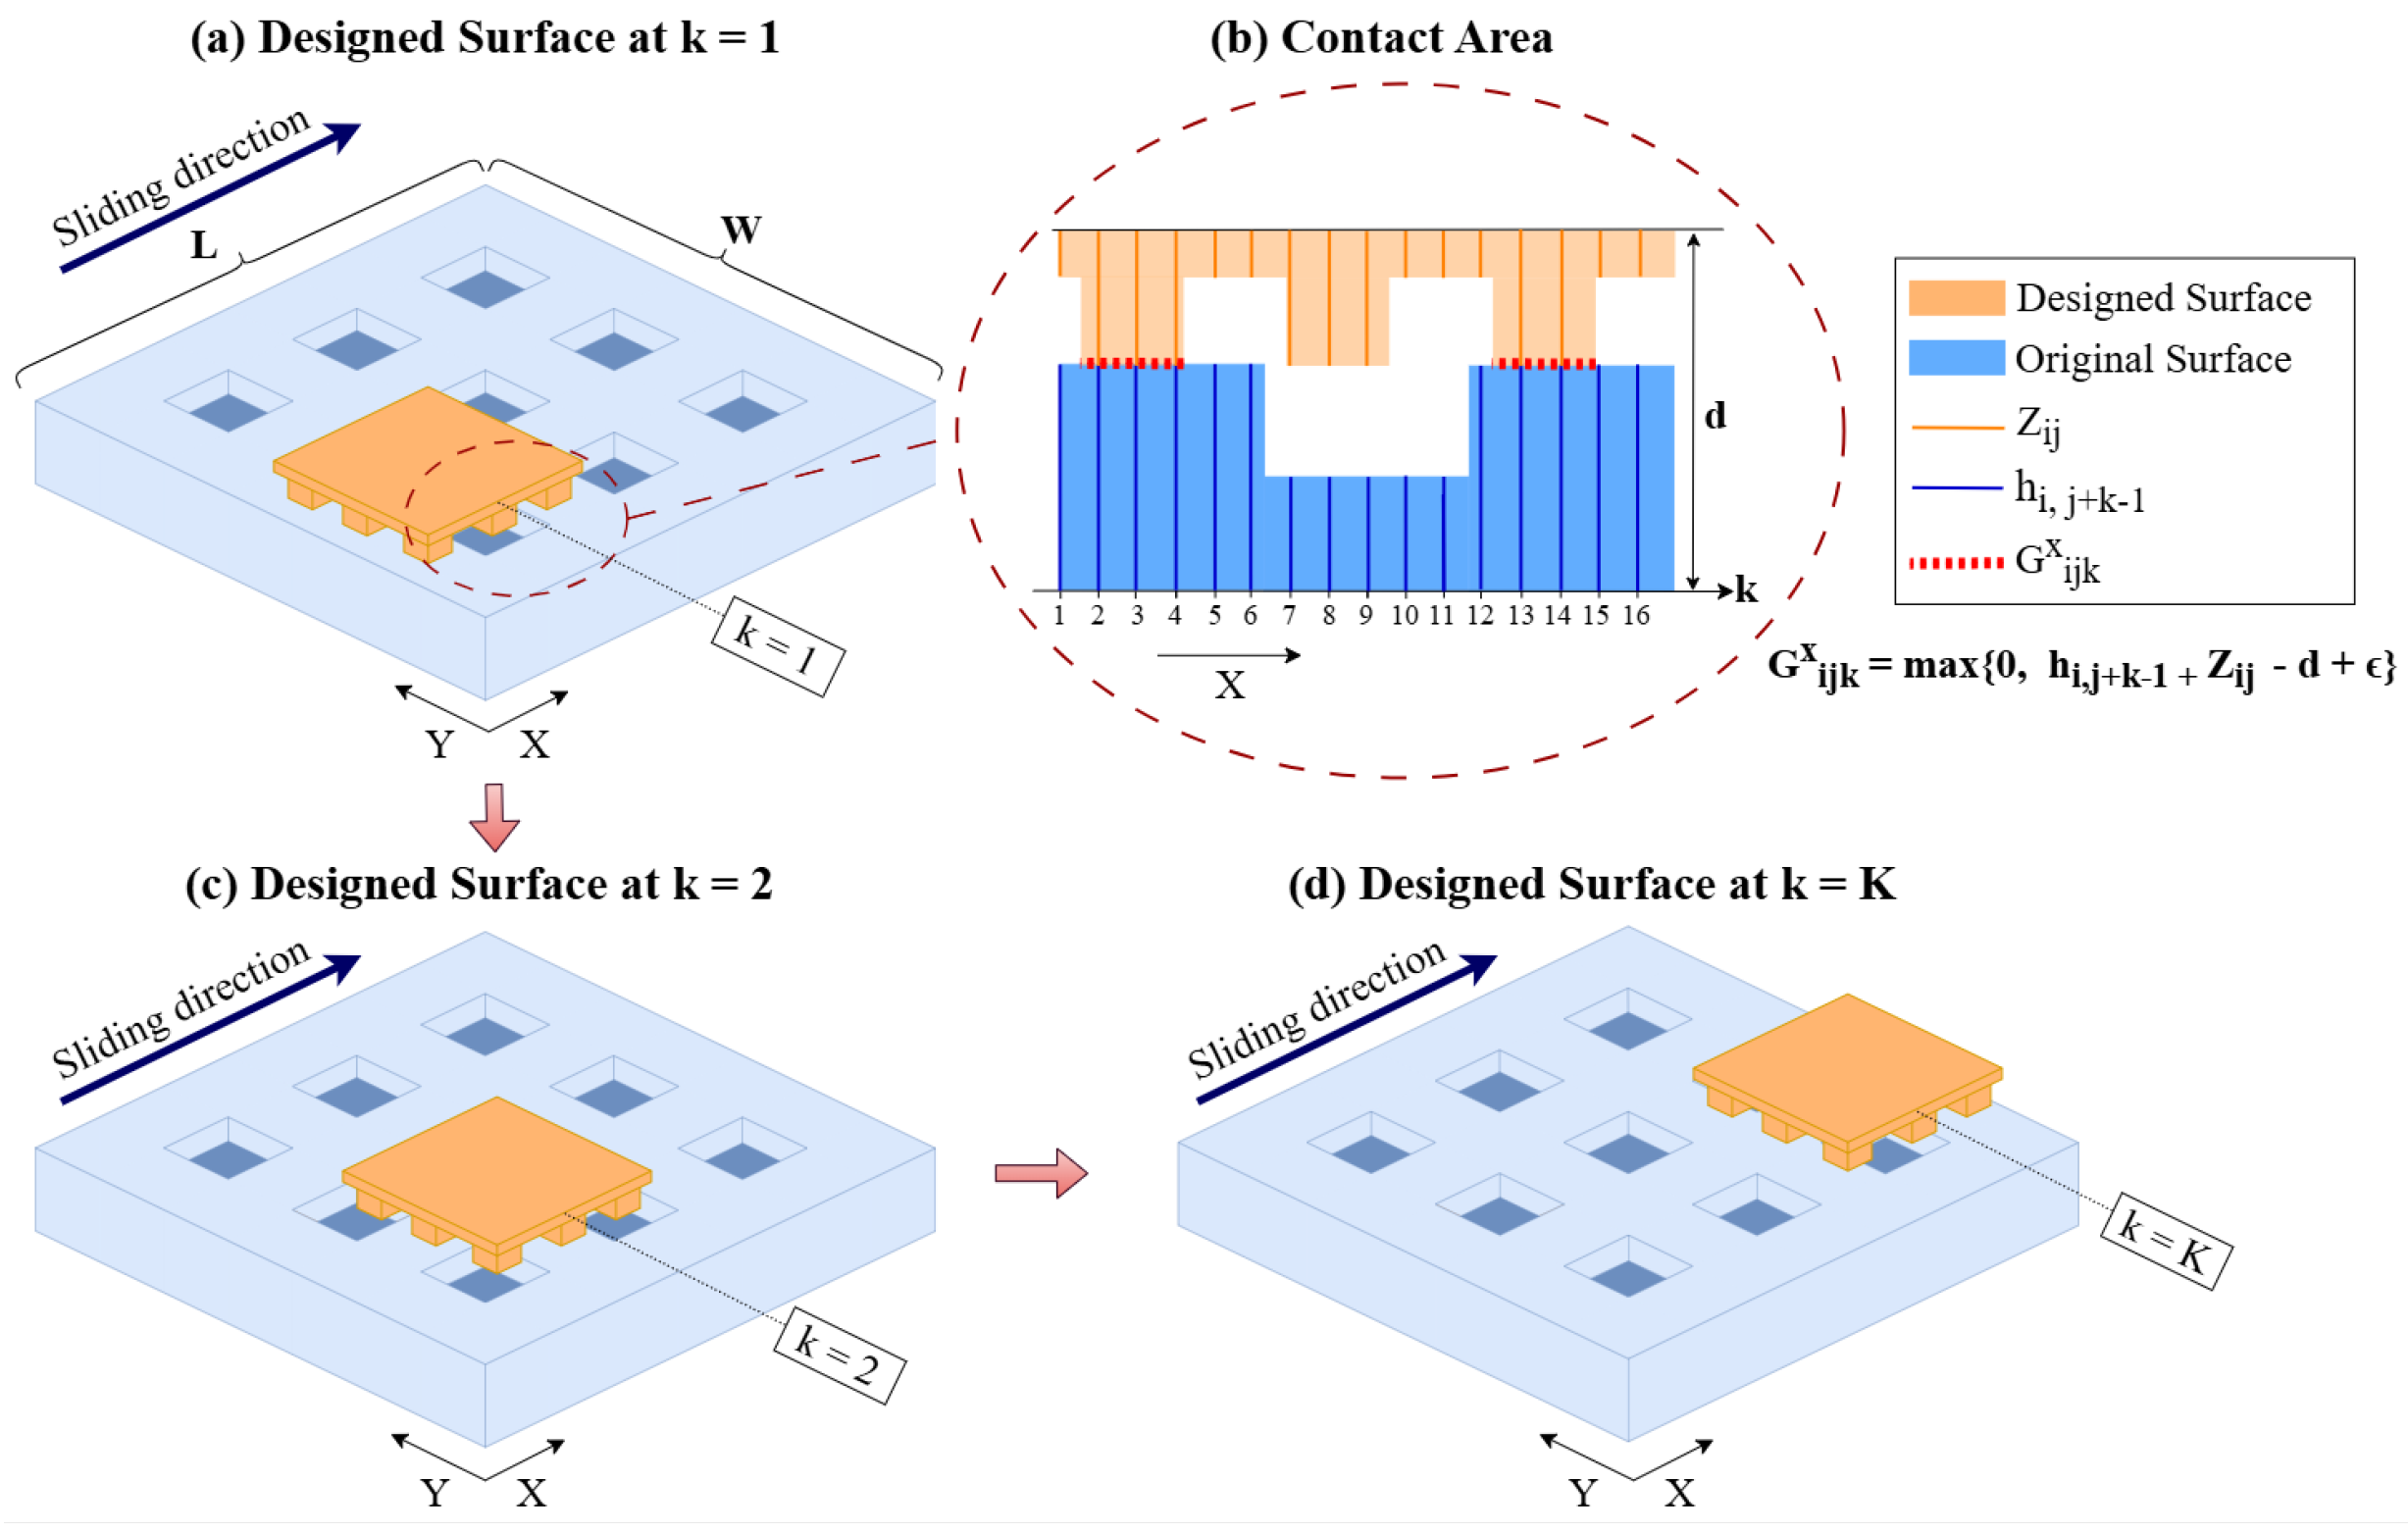
Consider that we are given the width and length of a surface, and the corresponding height, , for each point . We propose a mathematical model to design the texture of a new surface with dimensions ()—that is, to determine the height of each point . We refer to this as the designed surface. The objective of the proposed model is to minimize the contact area between the two surfaces and deformation during a linear sliding of the designed surface along the X axis in dry conditions.
The model captures the unit contact between the two surfaces via
. Unit contact is measured at different points
k, as the designed surface slides along the
X axis. Let
represent the maximum distance between the lower and upper surfaces of solids in contact. Then,
In Equation (
1),
if
,
if
. We acknowledge that based on (
1), the two surfaces are in contact when
. For this reason, we adjust the definition of (
1). Let
be a very small positive number such that if
, then
, and if
, then
. In this case,
Equations (
2) and (
3) enforce the unit contact to be a positive number smaller than
. This numerical manipulation is necessary to show mathematically that the two surfaces touch.
Figure 1 illustrates our notation and the contact area as the designed surface slides along the
X axis.
Figure 1a illustrates the original surface (in the bottom) and the designed surface (in the top) at position
, and before sliding begins.
Figure 1b illustrates the contact area between two surfaces, notations we use, and our calculations of the contact area.
Figure 1c,d illustrate the two surfaces in contact in positions
and
during sliding of the designed surface along the
X axis. This example illustrates a surface with dimples. Similar notation and modeling can be used for surfaces that have pillars.
In the next section, we present a mathematical model which we develop based on the following assumptions:
- (i)
There is minimum texture deformation during sliding in dry conditions;
- (ii)
The designed surface is smooth to minimize friction and wear;
- (iii)
The sliding distance of the designed surface is limited by the dimensions of the original surface;
- (vi)
The surfaces cannot commensurate to avoid interlocking of the surface features;
- (v)
The dimensions of the surface features are such that buckling does not occur under a given normal force.
3.2. A Non-Linear Optimization Model
We propose a non-linear program (NLP) to model and solve the problem defined in
Section 3.1.
Table 1 summarizes the model parameters and the decision variables.
The objective function (
4) minimizes the total contact area at different points
k, during sliding of the designed surface in dry conditions along the
X axis.
To minimize texture deformation, the contact pressure should remain below the yield strength of the surface material. Let
represent the yield strength of material
m, and let
p represent the normal load of contact area.
This is equivalent to
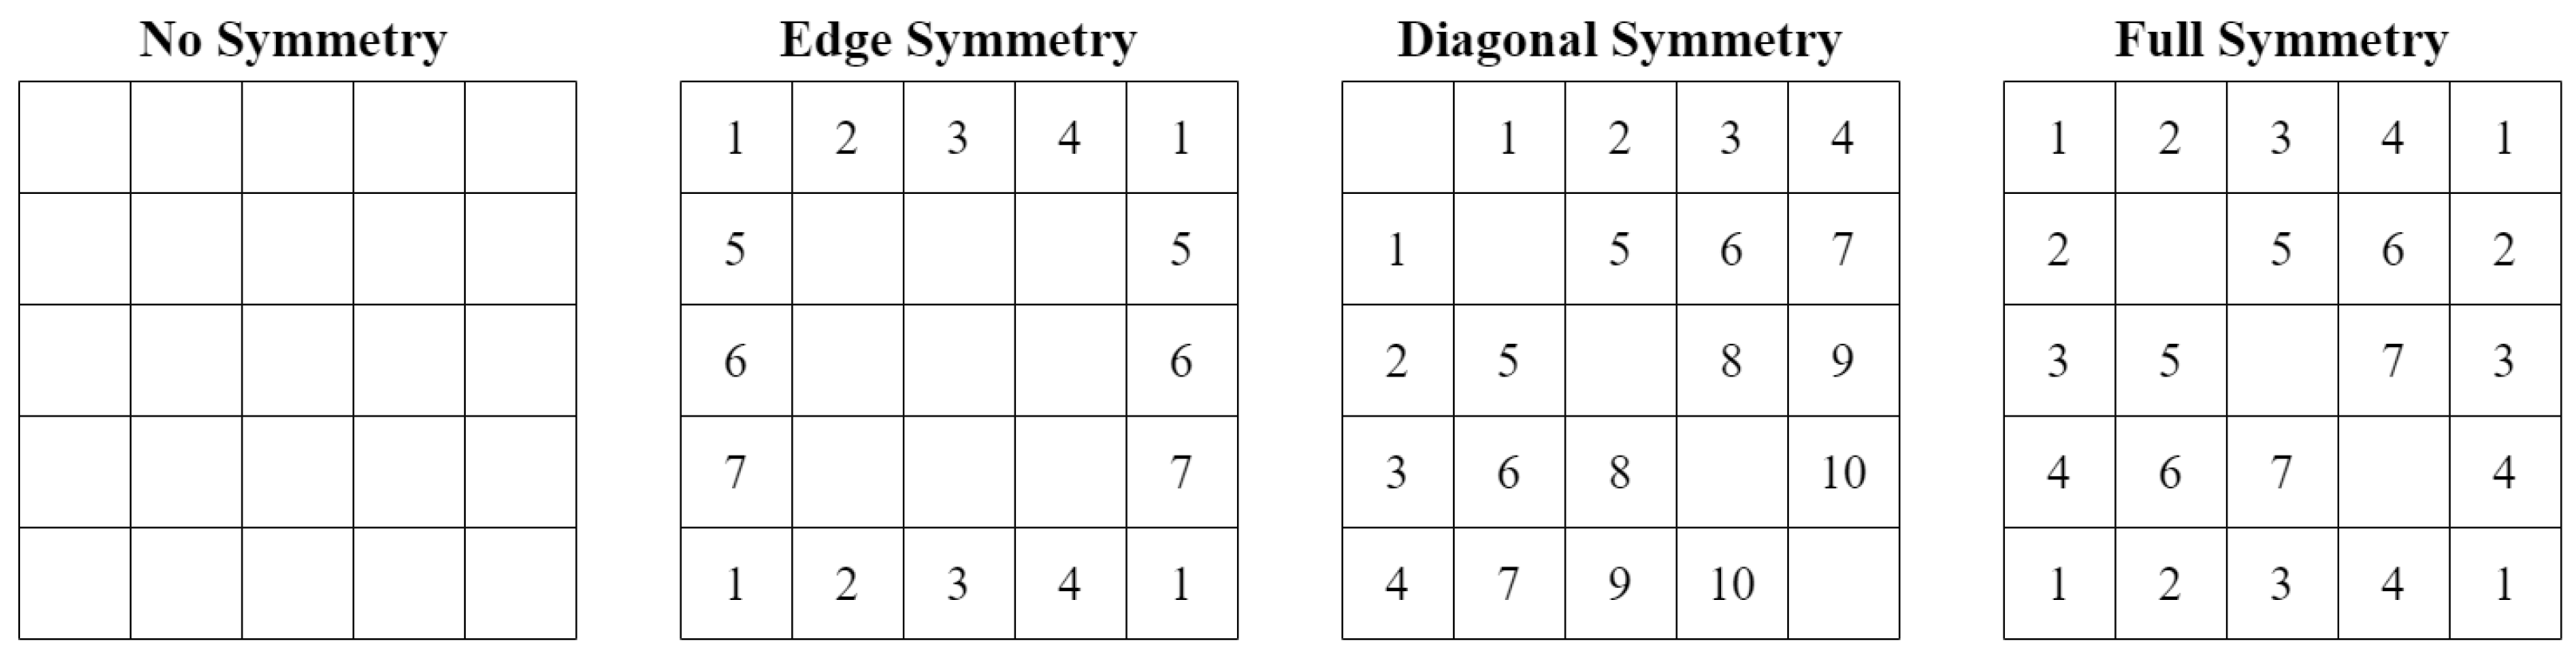
Symmetrical shapes ensure uniform distribution of stresses and loads across the surface, reducing uneven wear, and simplify the manufacturing process, reducing production costs. We use constraints (
7)–(
9) to impose symmetry in the designed surface. Constraints (
7) and (
8) impose symmetry along the edges of the surface. Constraints (
9) impose symmetry along the diagonal of the designed surface and are therefore used to enforce the symmetry of square shapes. Collectively, these constraints impose the full symmetry of the designed surface.
Figure 2 illustrates these symmetry patterns for a surface with dimensions
In this figure, squares with the same number have the same value of
.
In surface texturing, asperity (that is, sharp edges) can create points of high stress concentration that could lead to fractures and failure of the material under load and during operations [
1,
7]. Hierarchical micro/nano structures that feature longer nanohairs or nanopillars on top of the micropillars are particularly susceptible to deformation and breakage during sliding friction tests [
7]. In addition, manufacturing designed surfaces with sharp edges can be more challenging and costly. To ensure a smoother surface, we modify the objective function by including two additional terms:
where
and
and represent the absolute difference between neighboring points with and with , respectively. The parameters and are penalty terms. The values of and determine the relative importance of the different terms in the objective. For example, if is a very large number, the model will find solutions for which the value of is minimized. In fact, when , resulting in a flat surface.
Conversely, when , the magnitude of does not influence the objective function, allowing for the solution with large differences between neighboring points and resulting in non-smooth surfaces. The parameter has a similar effect. Via our numerical analysis, we determine to ensure that the designed surface is smooth but not flat.
In summary, our proposed NLP model minimizes (
10) subject to (
2), (
3), (
6)–(
9) and (
11)–(
13). The full problem formulation can be found in the
Appendix A. Notice that the focus of this model is on minimizing the contact area as the designed surface slides in dry conditions along the
X-axis. This model can be adopted to minimize contact area as the designed surface moves along the
Y-axis. In this case, the objective function minimizes
.
3.3. A Linear Optimization Model
The non-linearity of the NLP model is due to the objective function (
10) and constraints (
2), (
6), (
11) and (
12).
We approximate the continuous domains of the integrations in (
10) by discretizing them into a grid of points. For example, we discretize the integration region
of
by dividing the interval
into
w sub-intervals of width
; and by dividing
into
l sub-intervals of width
. The corresponding sub-intervals have dimensions
Thus,
We follow a similar approach to discretize
and
The following is the resulting linear objective function:
Constraints (
2), (
11) and (
12) can be linearized by introducing binary variables and additional constraints [
23]. We linearize constraints (
2) by substituting them with the following constraints (for all
).
We linearize constraints (
11) and (
12) by substituting them with the following constraints (for all
).
The proposed integer linear program (ILP) minimizes (
15) subject to (
3), (
7)–(
9), (
13) and (
16)–(
25). This is an exact approximation of the NLP optimization model; therefore, solutions to ILP are also solutions to the NLP model. A full formulation of the ILP can be found in the
Appendix B.
3.4. An Illustrative Example
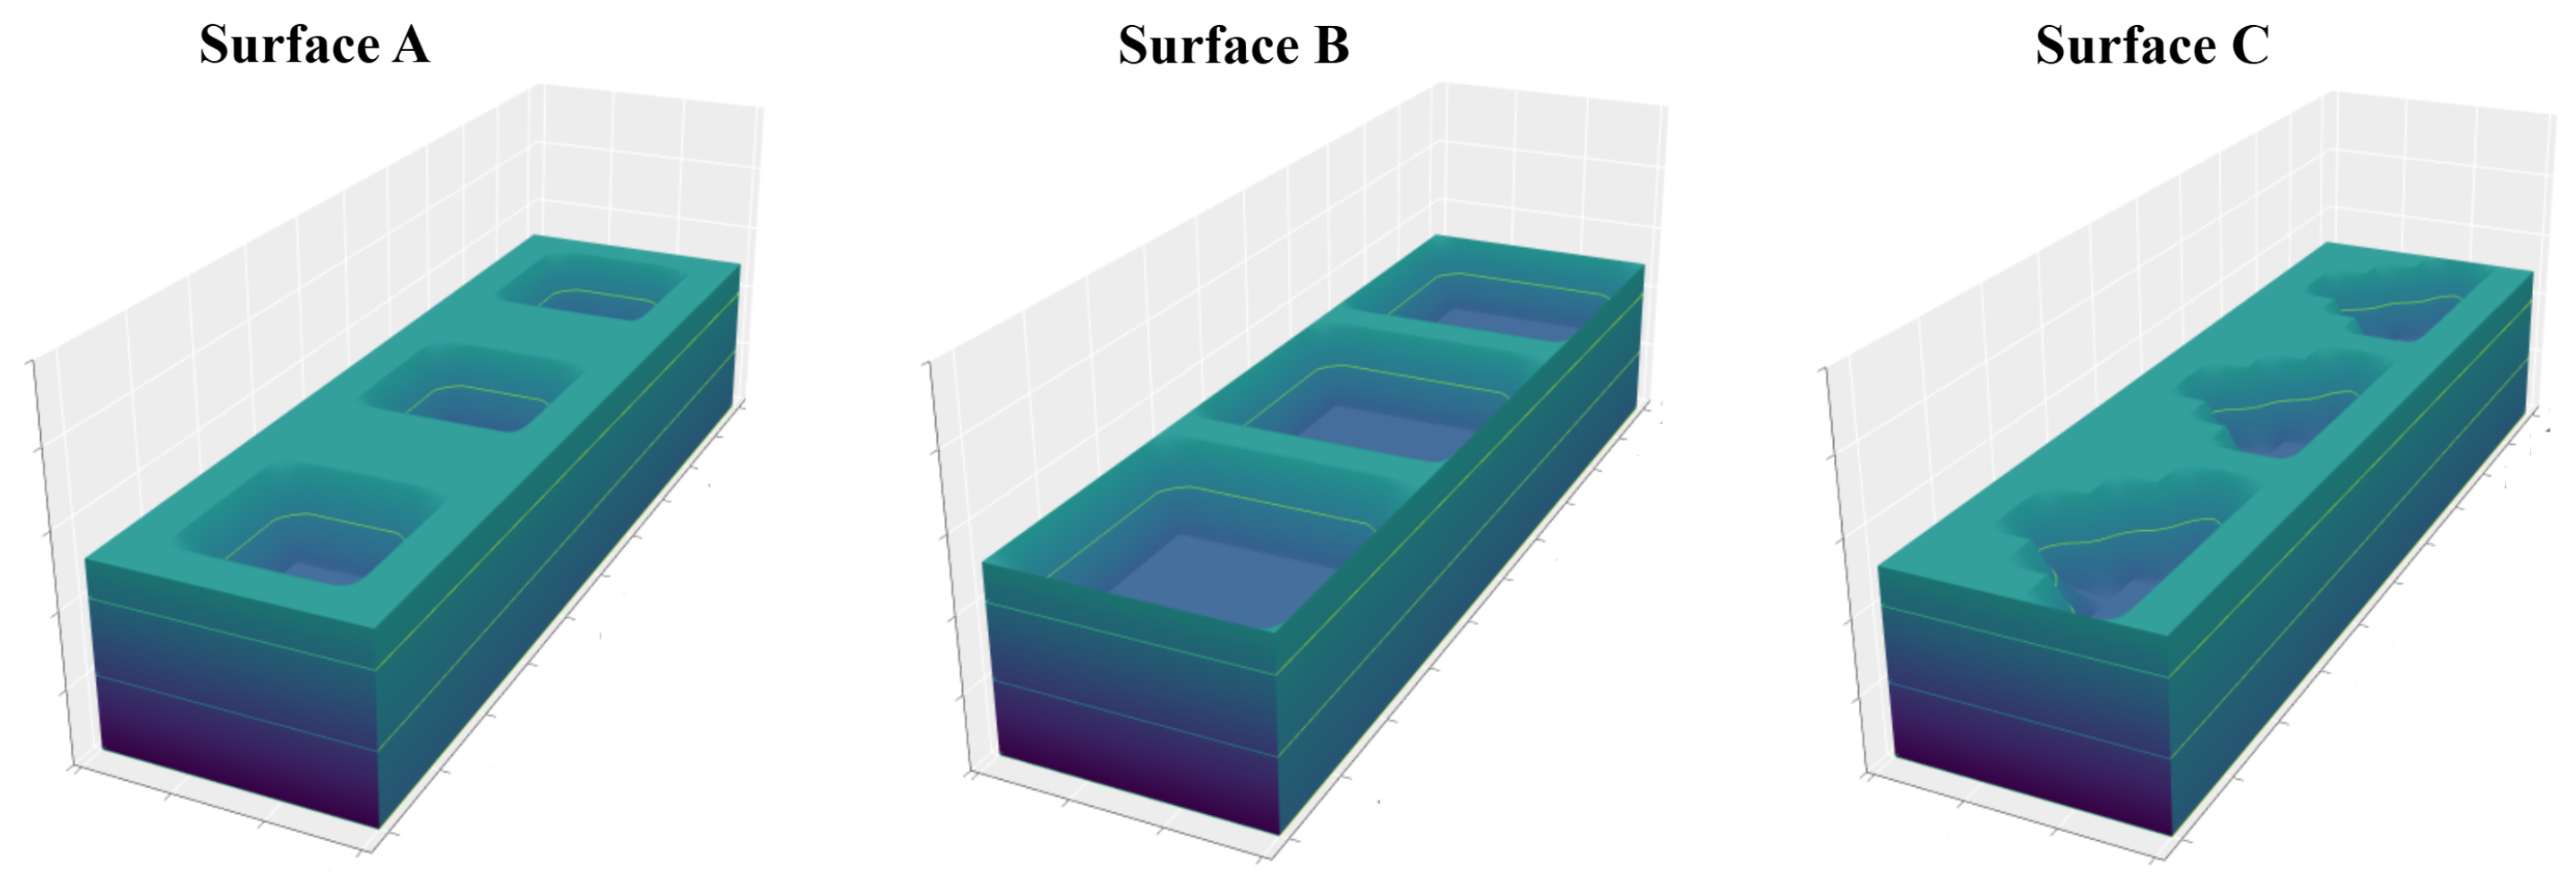
Figure 3 presents three dimpled surfaces, each with dimensions
mm,
mm. The shape and size of the dimples are different for each surface. We use the following values for model parameters,
,
,
7 mm,
mm,
mm. The material used in these surfaces is assumed to have a yield strength of 2 MPa. We impose full symmetry of the designed surface via constraints (
7)–(
9).
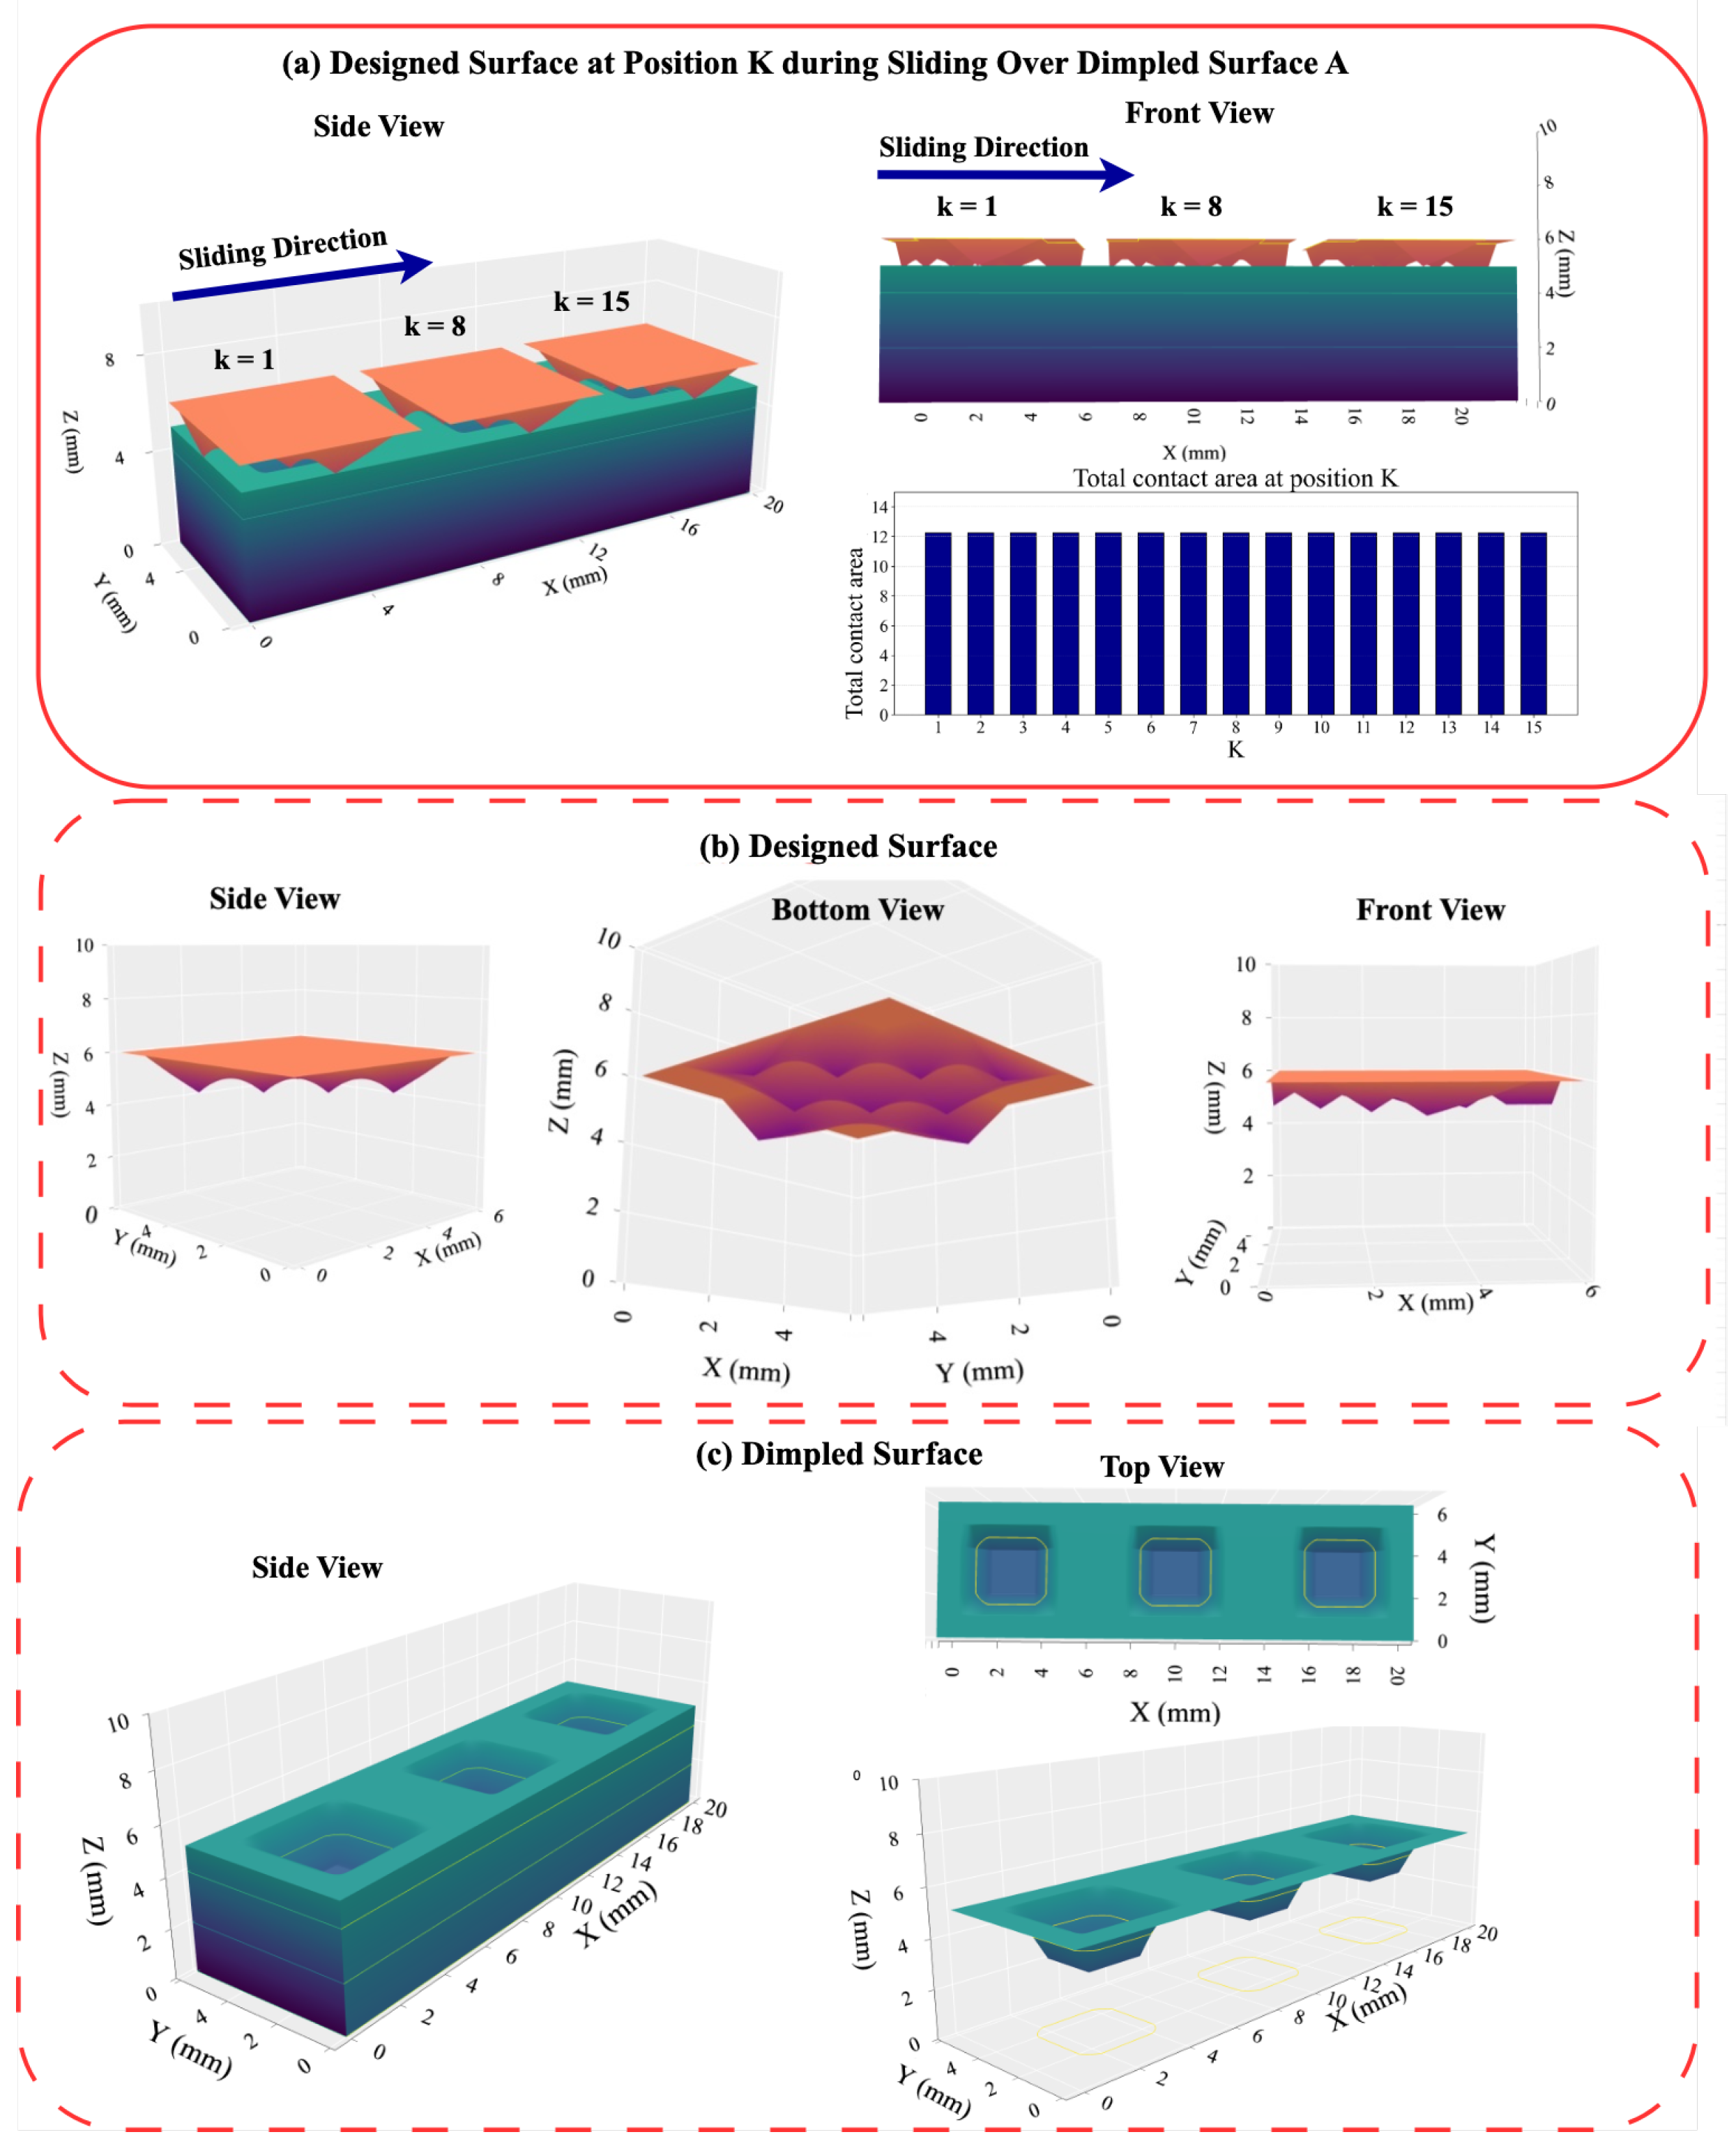
Figure 4a illustrates the contact area between the two surfaces at different positions during sliding of the designed surface along the
X axes.
Figure 4b presents views of the designed surface from different angles and
Figure 4c presents views of the dimpled surface from different angles.
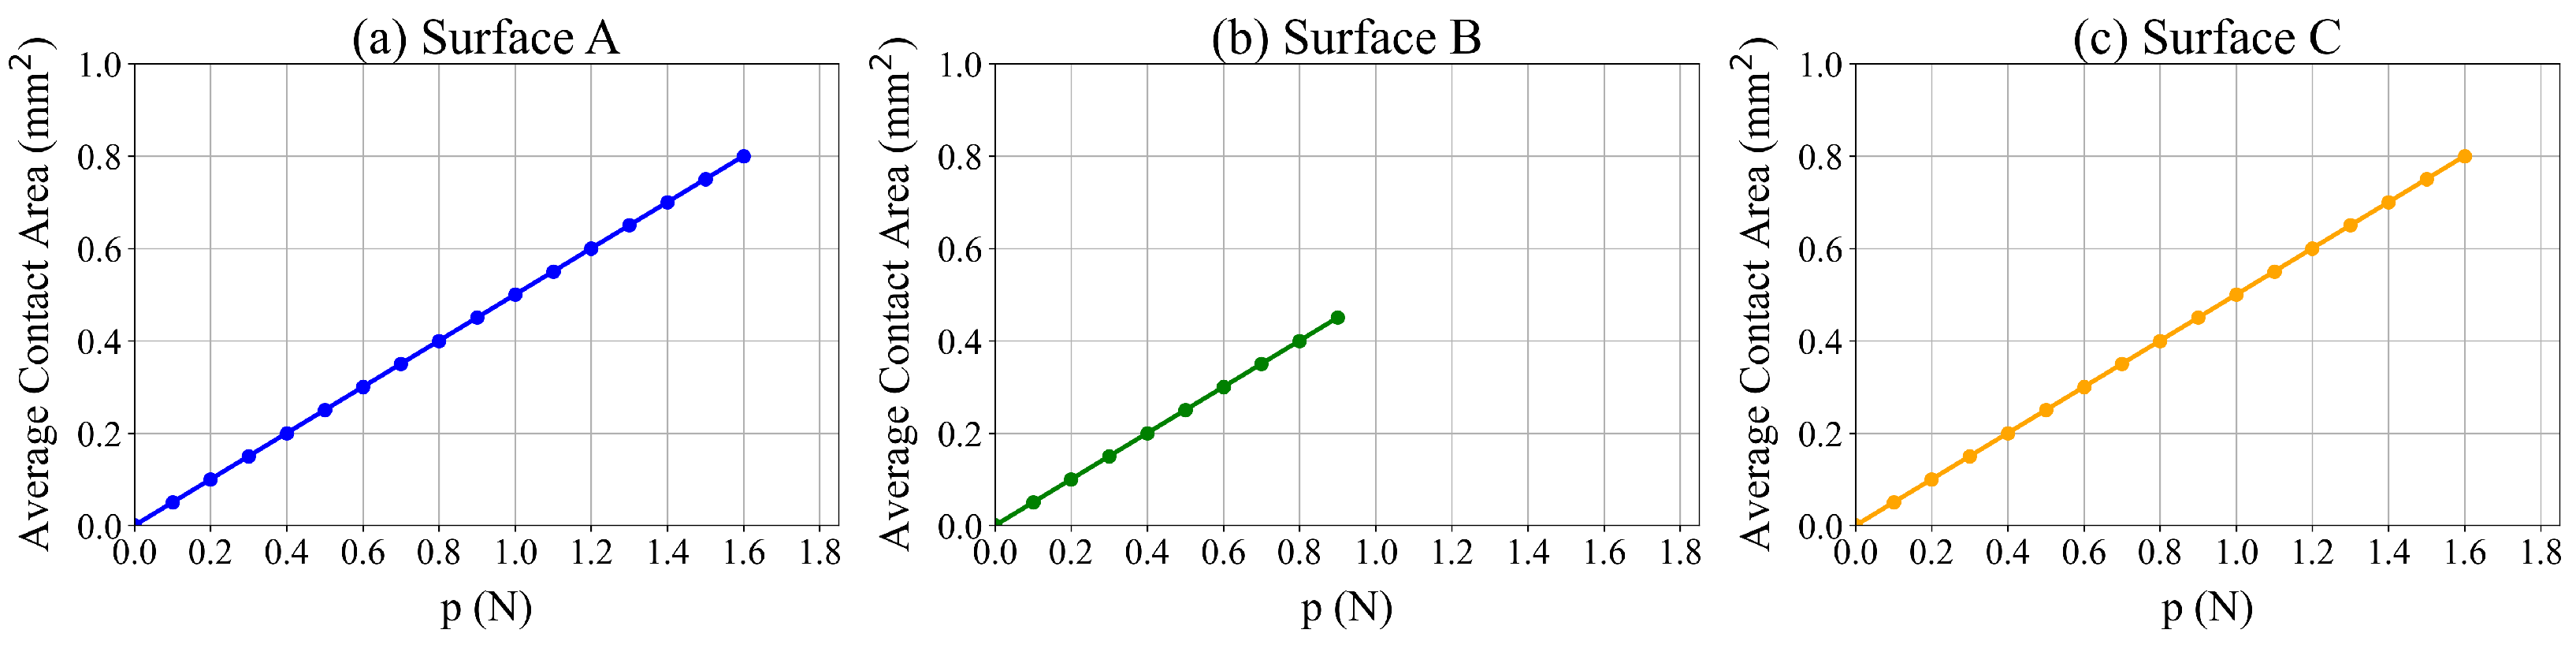
We conduct a sensitivity analysis to determine the impact of the normal unit load on contact (
p) on the average contact area. In these experiments, the value of
p varies from 0 to 1.6 Newton (N). The total load depends on the dimensions of the designed surface. The results of these experiments are summarized in
Figure 5. These results indicate that the average contact area increases with
p. Additionally, the maximum unit load for Surfaces A and C is 1.6 N and the average contact area is 0.8 mm. For Surface B, the corresponding values are 0.9 N and 0.5 mm. Larger loads would lead to deformation of the texture.
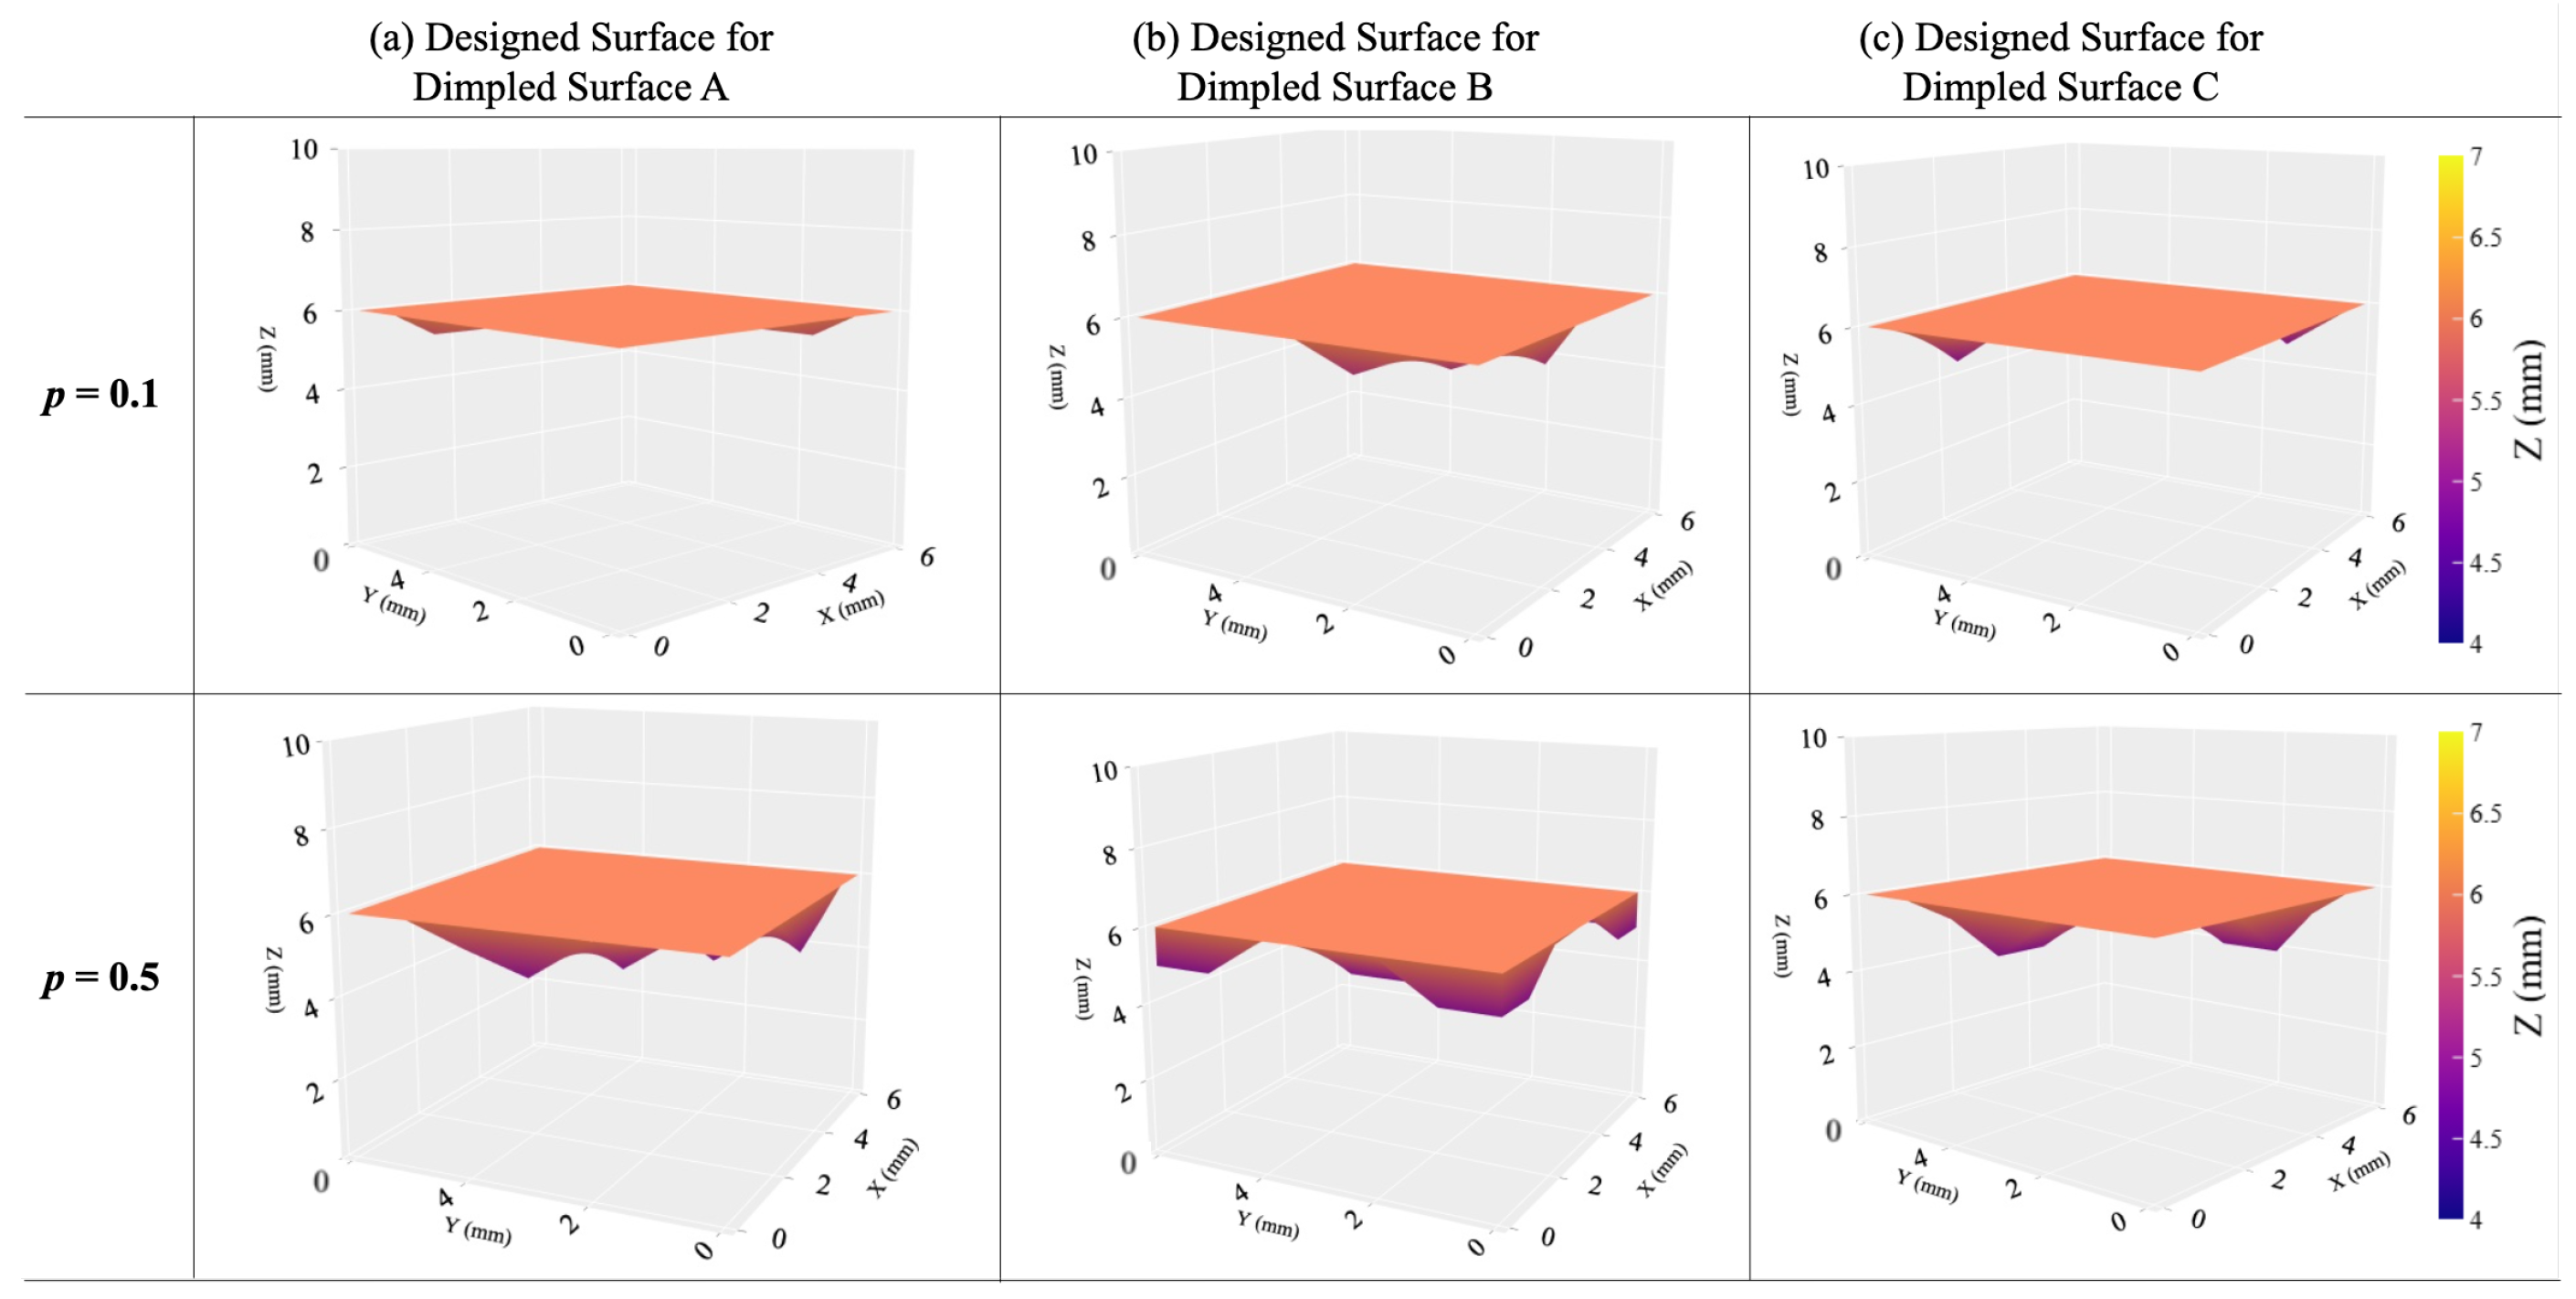
Figure 6 gives 3D representations of the designed textured surfaces for
N and
N. Notice the deeper indentations and more pronounced height variations of the designed surface for higher loads. When the normal load increases beyond
N, the designed surface becomes flat to maximize the contact area.
Table 2 presents the distribution of the contact area for different surfaces and different values of
p. Based on these results, the contact area increases with load to minimize texture deformation. Furthermore, the shape of the dimples impacts the distribution of the contact area.
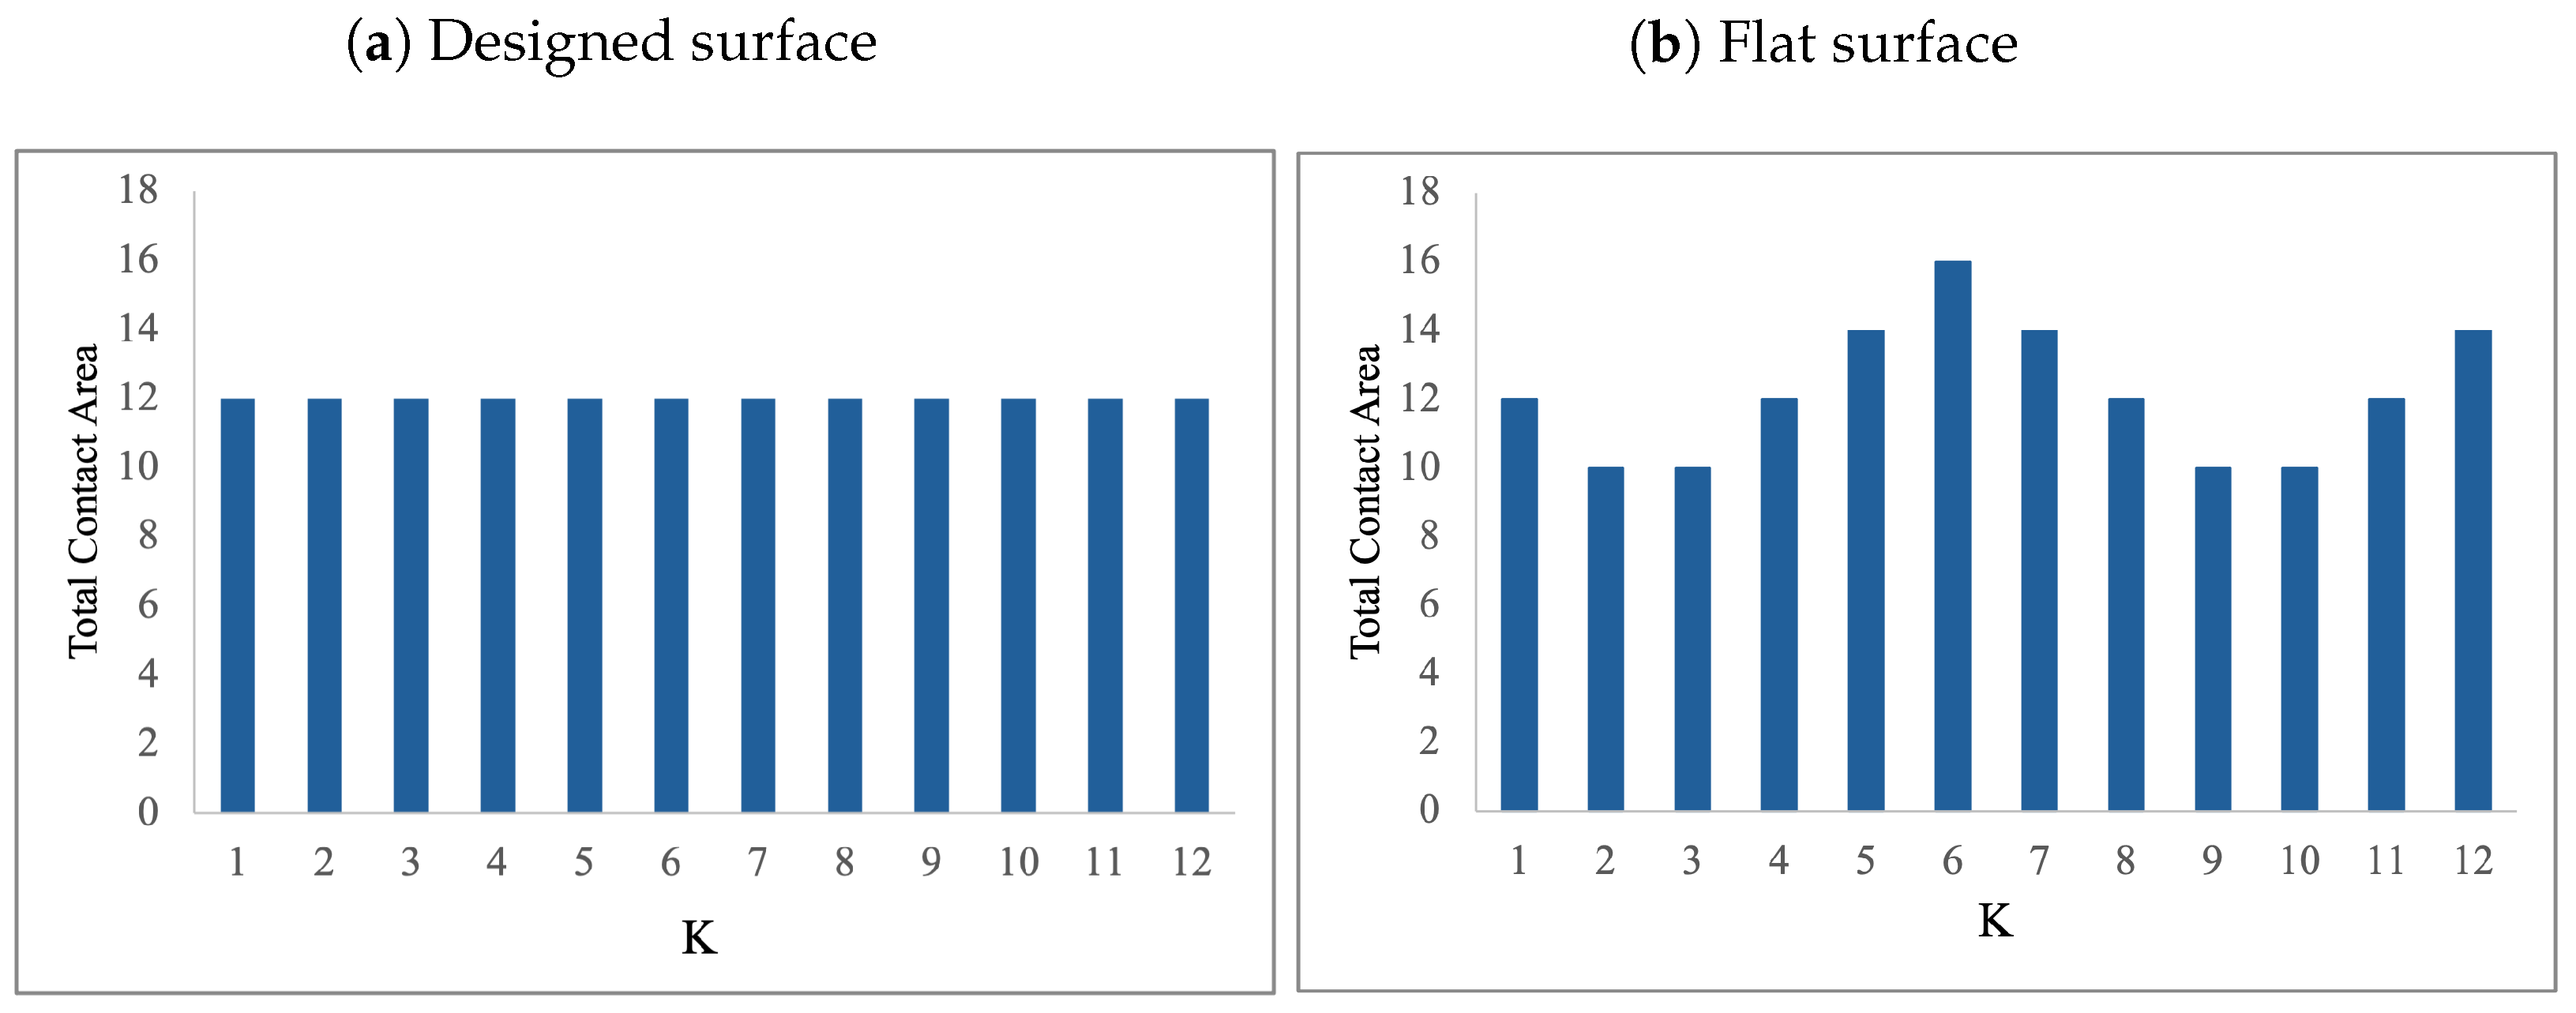
In order to demonstrate the advantage of using the proposed optimization model, we conduct the following experiment. We calculate the contact area between Surface A and a flat surface at different positions during its horizontal sliding. We assume that the flat surface has the same dimensions as the designed surface,
mm,
mm.
Figure 7 presents the distribution of the total contact area between Surface A and the designed surface (
Figure 7a), and between Surface A and the flat surface (
Figure 7b). The overall total contact area is larger for the flat surface as compared to the designed surface. Additionally, the contact area for the designed surface is always the same—12 mm
2—which presents a sturdier design as compared to the flat surface for which, at 4 (out of 12) positions, the contact area is 10 mm
2.
4. Solution Approach for Large-Scale Applications
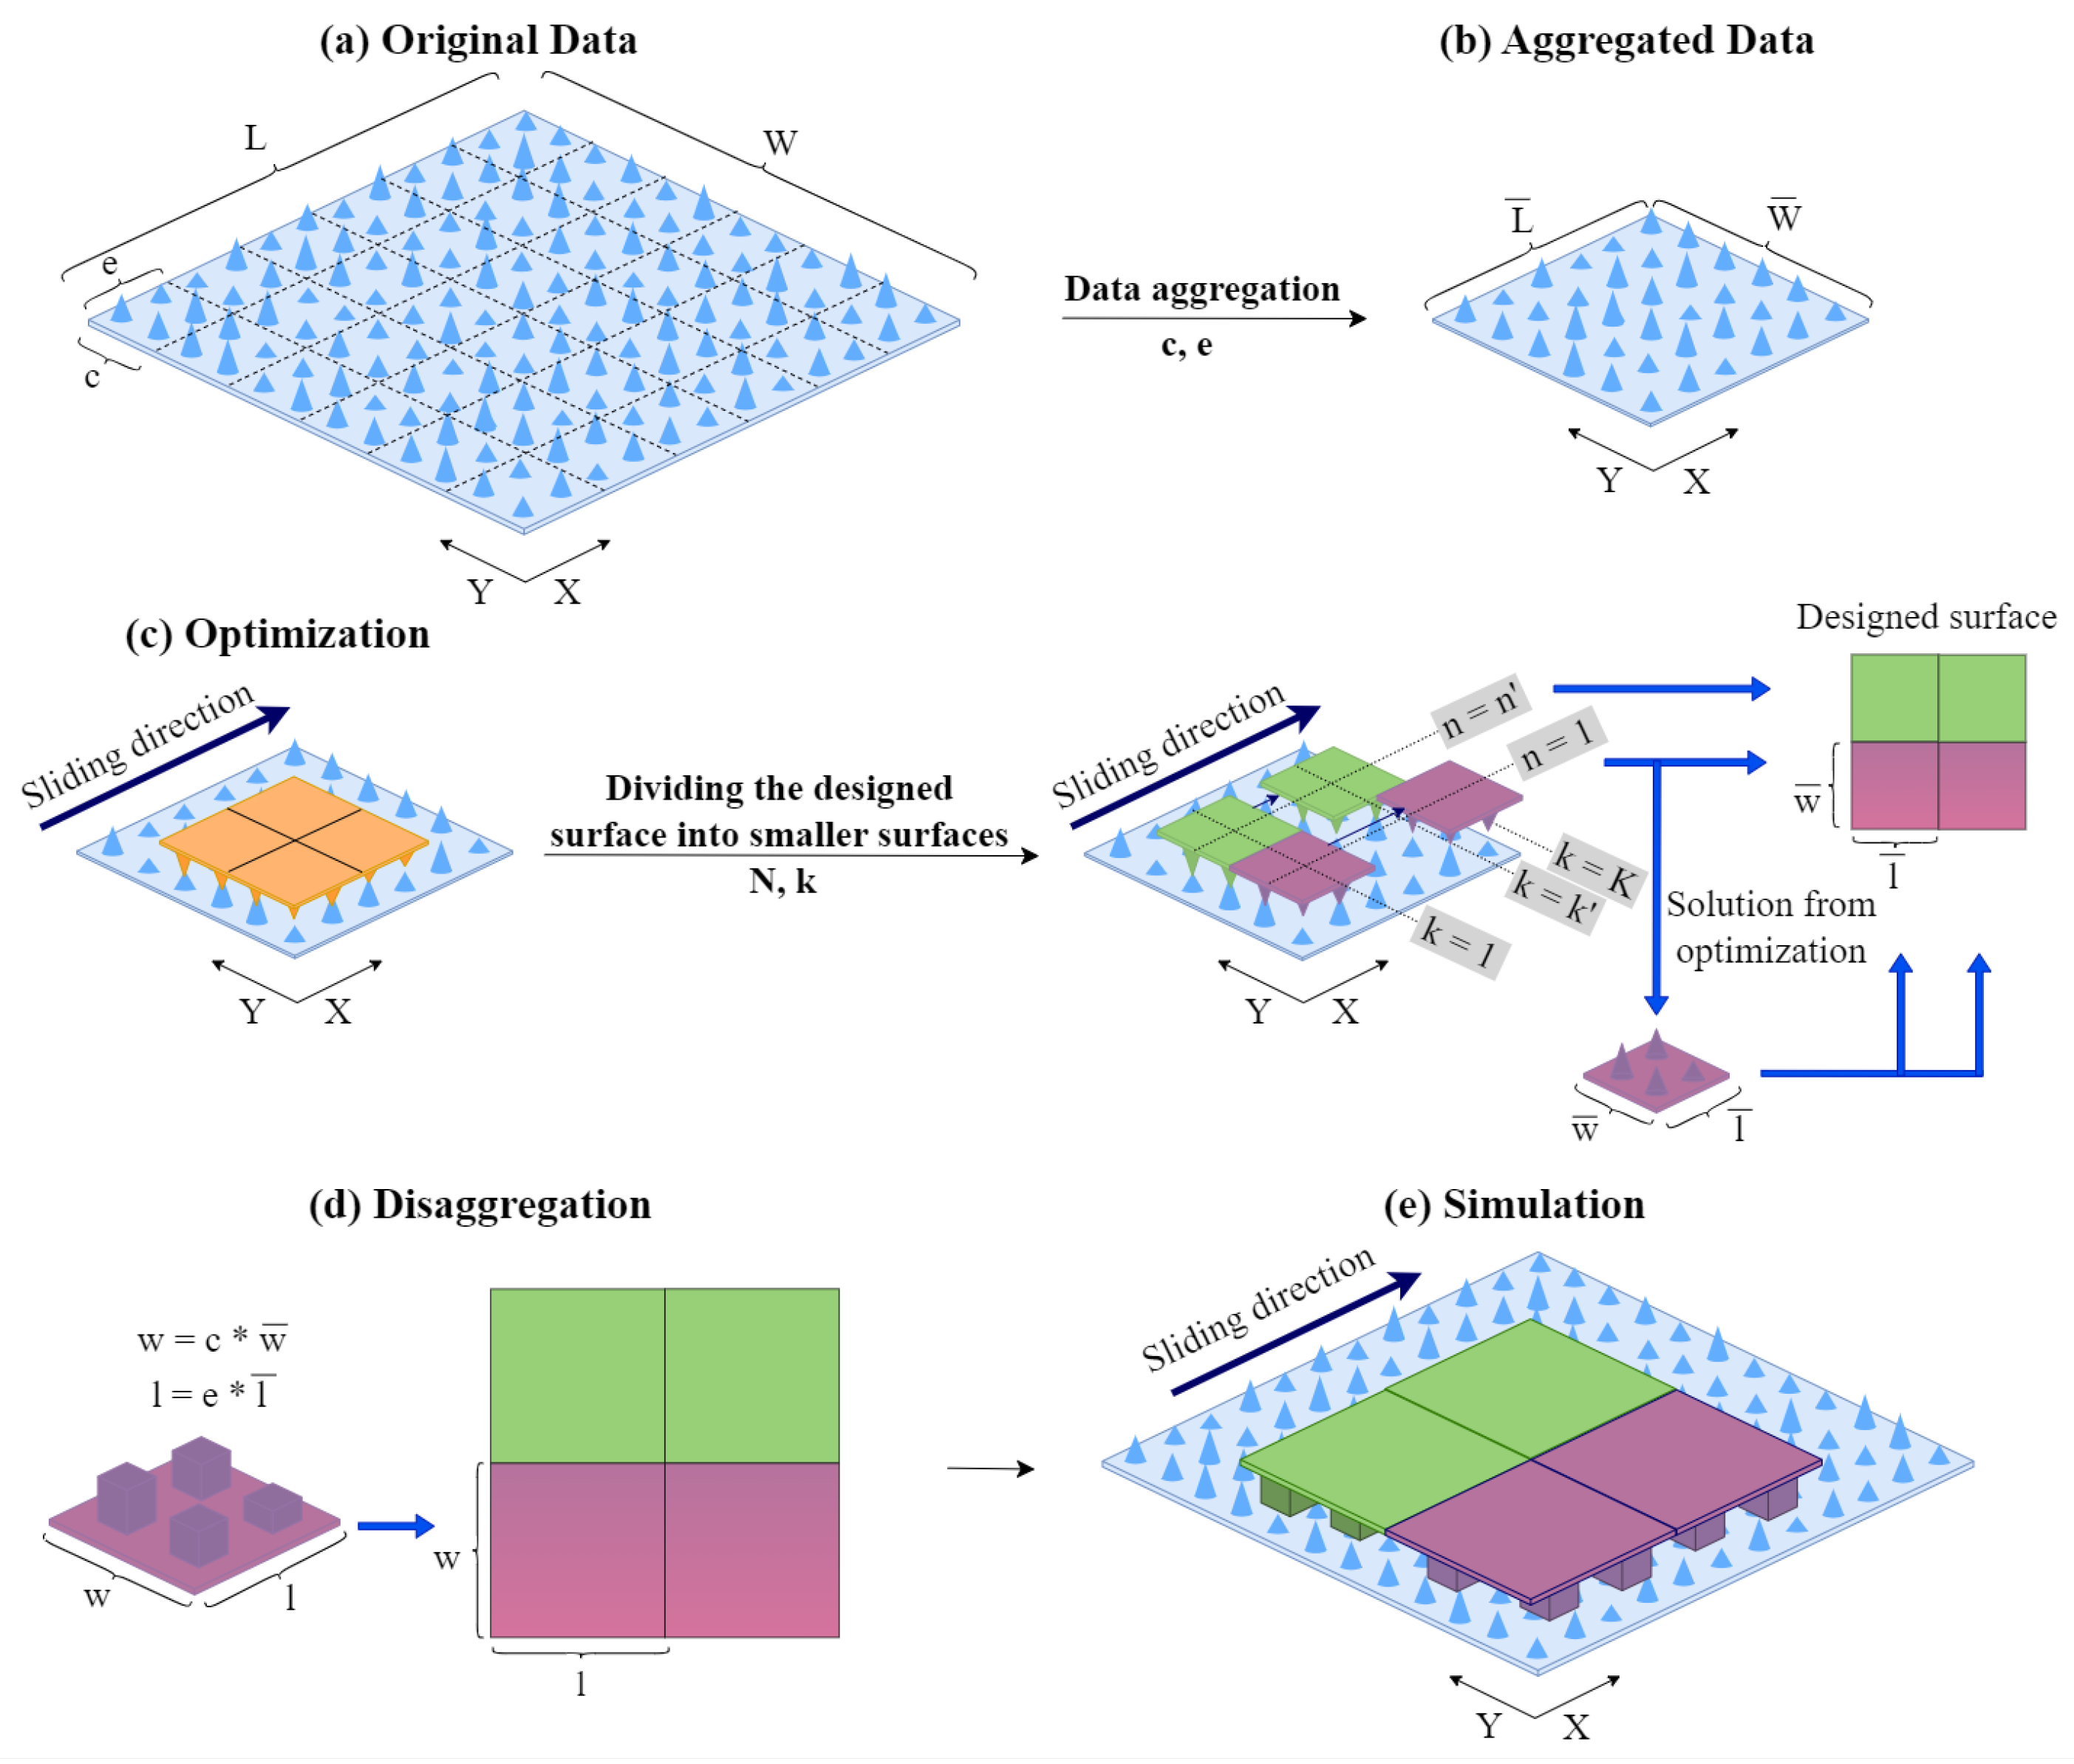
The proposed ILP model poses significant computational challenges for large-scale applications. To address these challenges and improve the computational efficiency of the optimization model, we propose the following solution approach. This approach consists of a data aggregation step, an optimization step, and a data disaggregation step. The proposed approach is summarized in
Figure 8.
- I.
Data Aggregation
In this step, we aggregate the data to reduce its dimensionality. Let
S denote the set of heights
of all discrete points on the surface. Thus,
. We divide this set into
groups, and each group contains
data points. Thus,
and
. Each group of data is represented by
. To determine the value of
, we consider the group maximum value, minimum value, and average value, as shown below.
After aggregation, our data set reduces to . By our experimental analysis, we evaluated the impact of different representations of on the quality of the solutions obtained.
- II.
Optimization
To reduce computational effort, we decompose the ILP model into models of smaller size. The overall solution of ILP is an aggregation of the solutions found from solving these smaller sized models. Each model uses the aggregated data from Step I.
The motivation for decomposing the model is that high levels of data aggregation (as and ) lead to solutions of poor quality. We explore via our experiments the trade-offs between data aggregation and model decomposition on the quality of the solutions found.
We solve a total of N optimization sub-models and, for each sub-model, the designed surface has dimensions . We refer to this as unit designed surface. We set and . For problem , the corresponding data set includes such that and The solution of the optimization model determines the values of for
Each optimization model determines the values of
that minimize the total contact area between the unit designed surface and the surface with dimensions
as the unit designed surface slides along the
X axis. We assume that this design will repeat itself several times. We aggregate the solutions of the
N optimization models to determine the final design of the designed surface. The designed surface with dimensions
consists of
unit surfaces with dimensions
, for
.
Figure 8 summarizes our solution approach.
- III.
Data Disaggregation
In this step, we use the optimization results to determine the design of the surface to be fabricated. Since the solutions are derived from the aggregated data, we assign the value to a group of adjacent points.
5. Numerical Analysis
5.1. Lotus Leaf Case Study
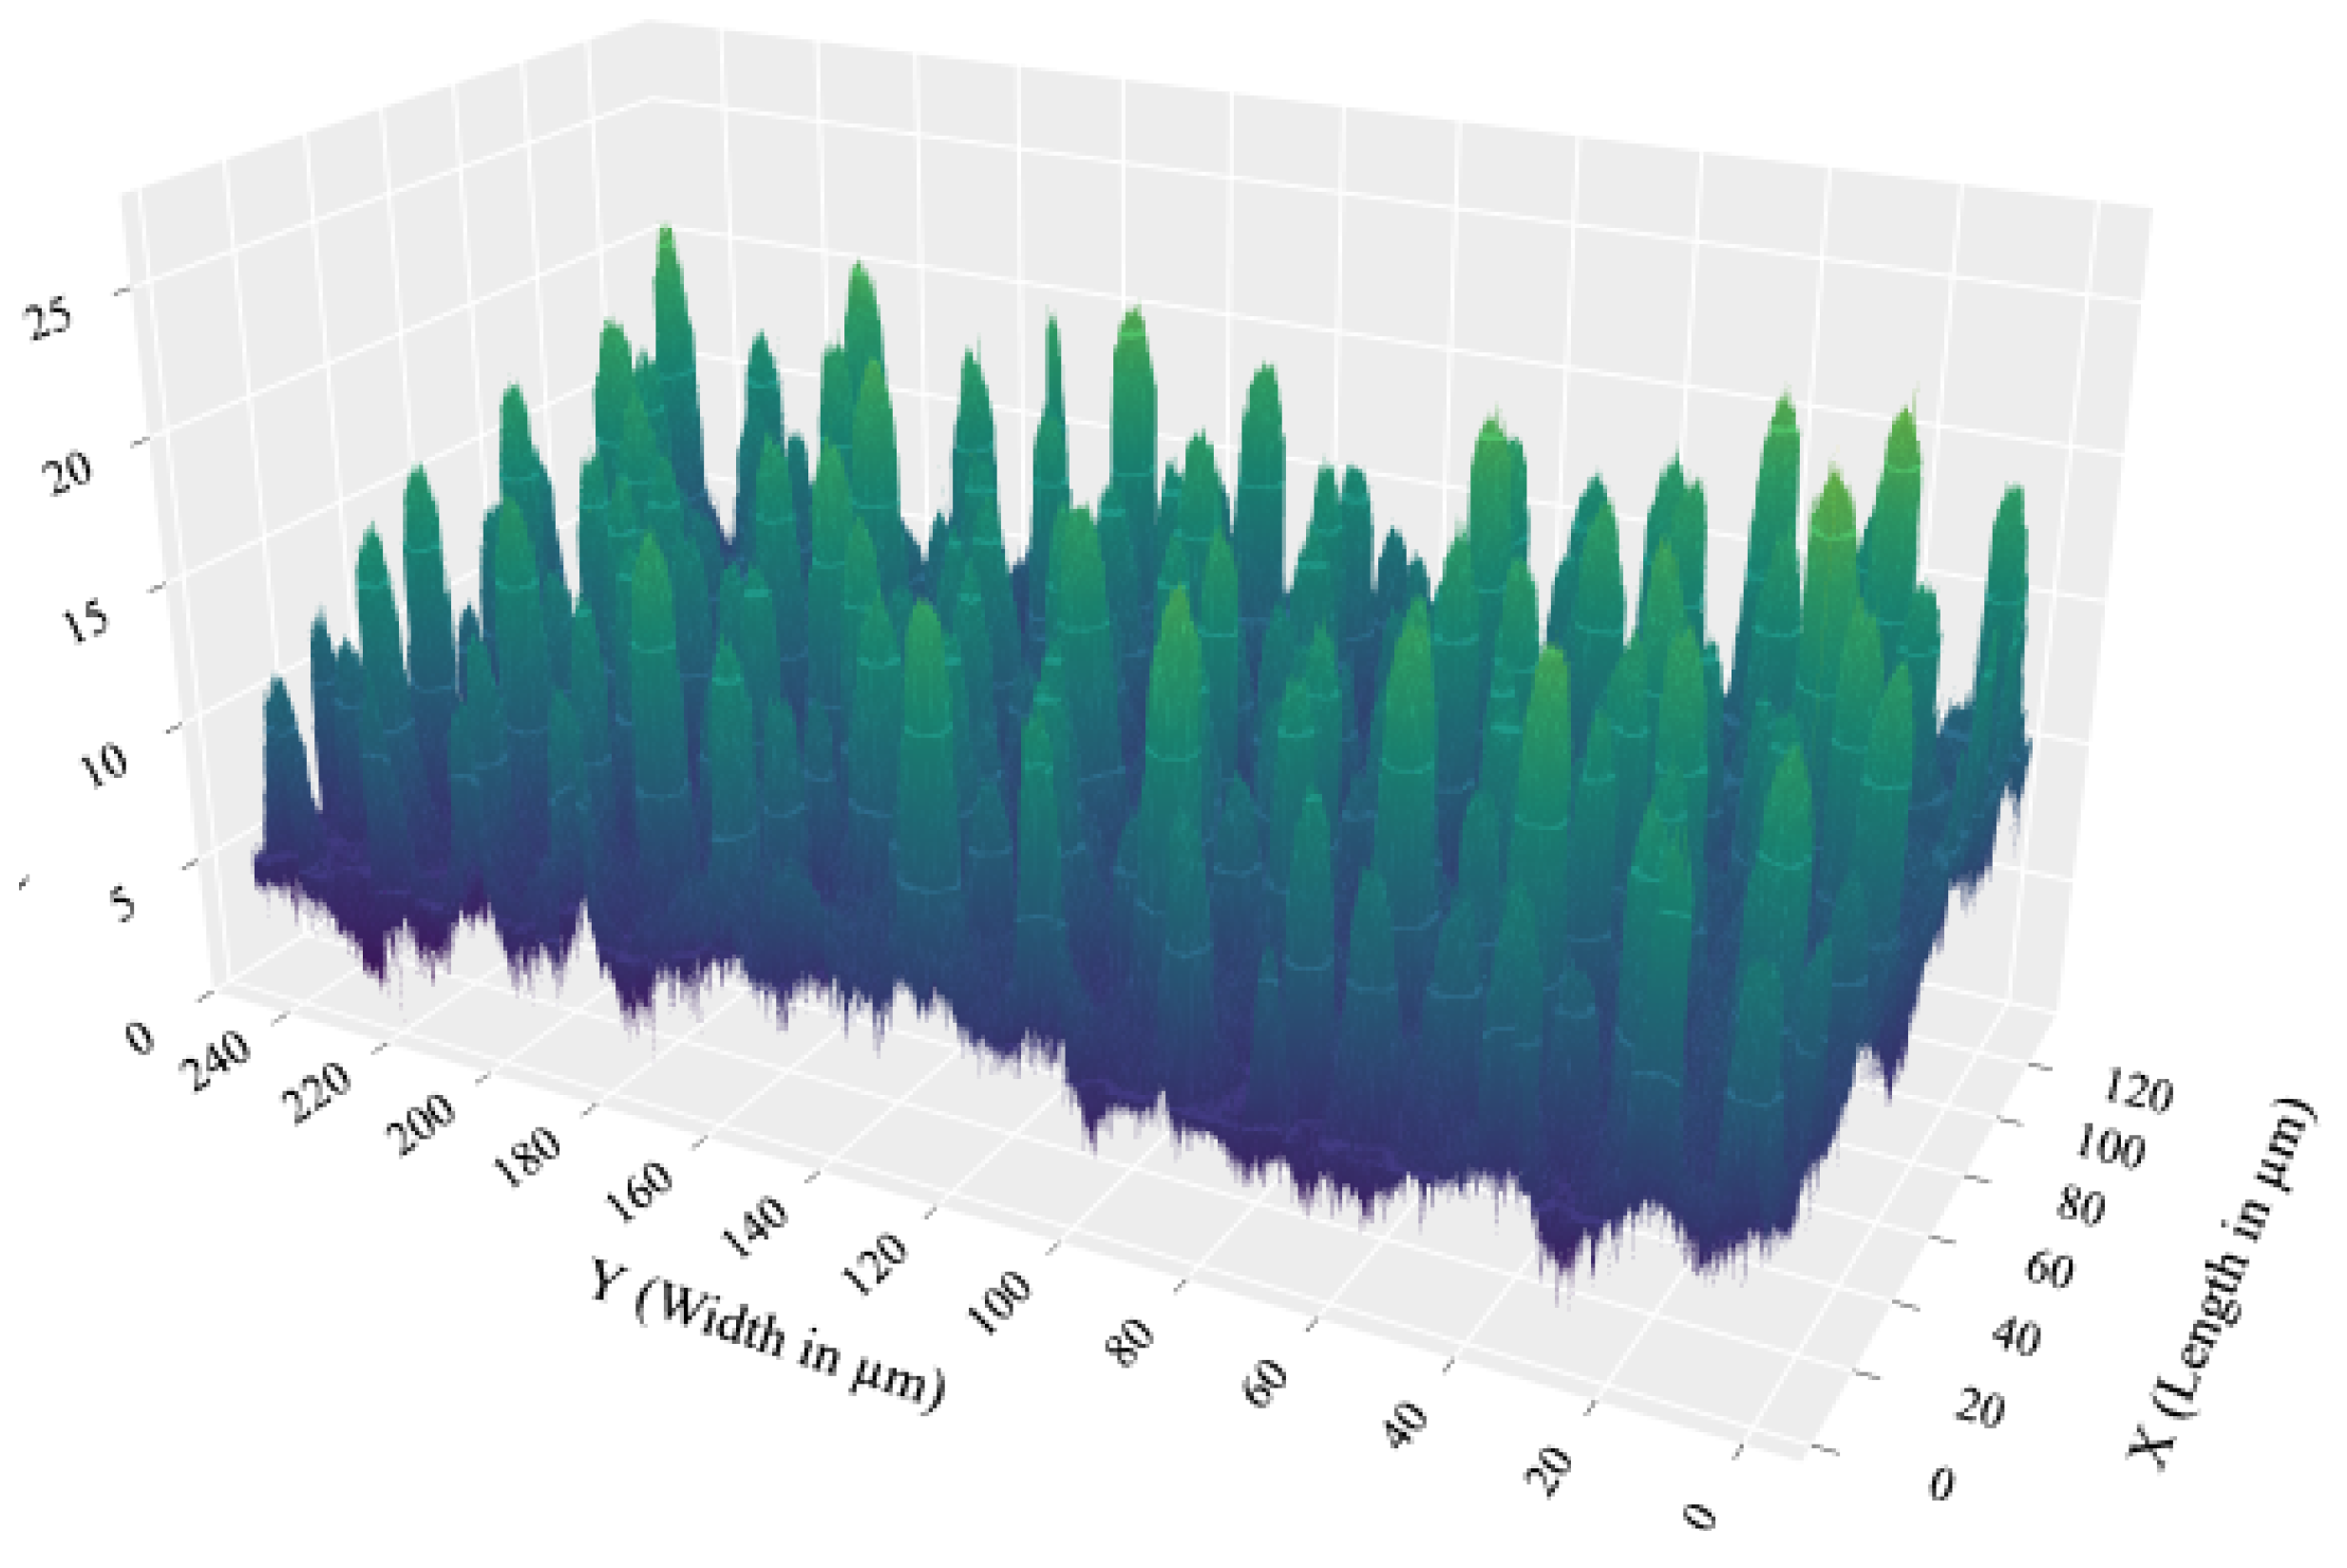
To evaluate the performance of the proposed model and solution approach, we use the lotus leaf surface shown in
Figure 9. This surface is divided into a grid consisting of
rows and
columns. The dimensions of each point in this grid are (
) 92.808 by (
) 92.808 nanometers (nm). The data provide the height (
) of each point on the grid and are stored in a comma-separated value (CSV) file.
5.2. Experimental Setup
The experiments presented in this section are performed using Python 3.11.5. The ILP optimization model is solved using Gurobi version 11.0.0. We use the High-Performance Computing (HPC) system at the University of Arkansas, which is equipped with Dual Intel Xeon 6130 processors (16 cores per CPU, 32 cores per node) and 192 GB of RAM. We utilized eight threads to solve each model, and we solved our models in parallel.
Figure 10 illustrates our solution approach for sample data of size
and
from the surface of the lotus leaf. This corresponds to 37.12
m × 18.56
m (micrometers).
Figure 10a presents the original data, while
Figure 10b presents the aggregated data (
and
). As a result,
and
Figure 10c presents the results of the optimization model for
, along with the unit designed surface with dimensions
and
Figure 10d presents the results of disaggregation step.
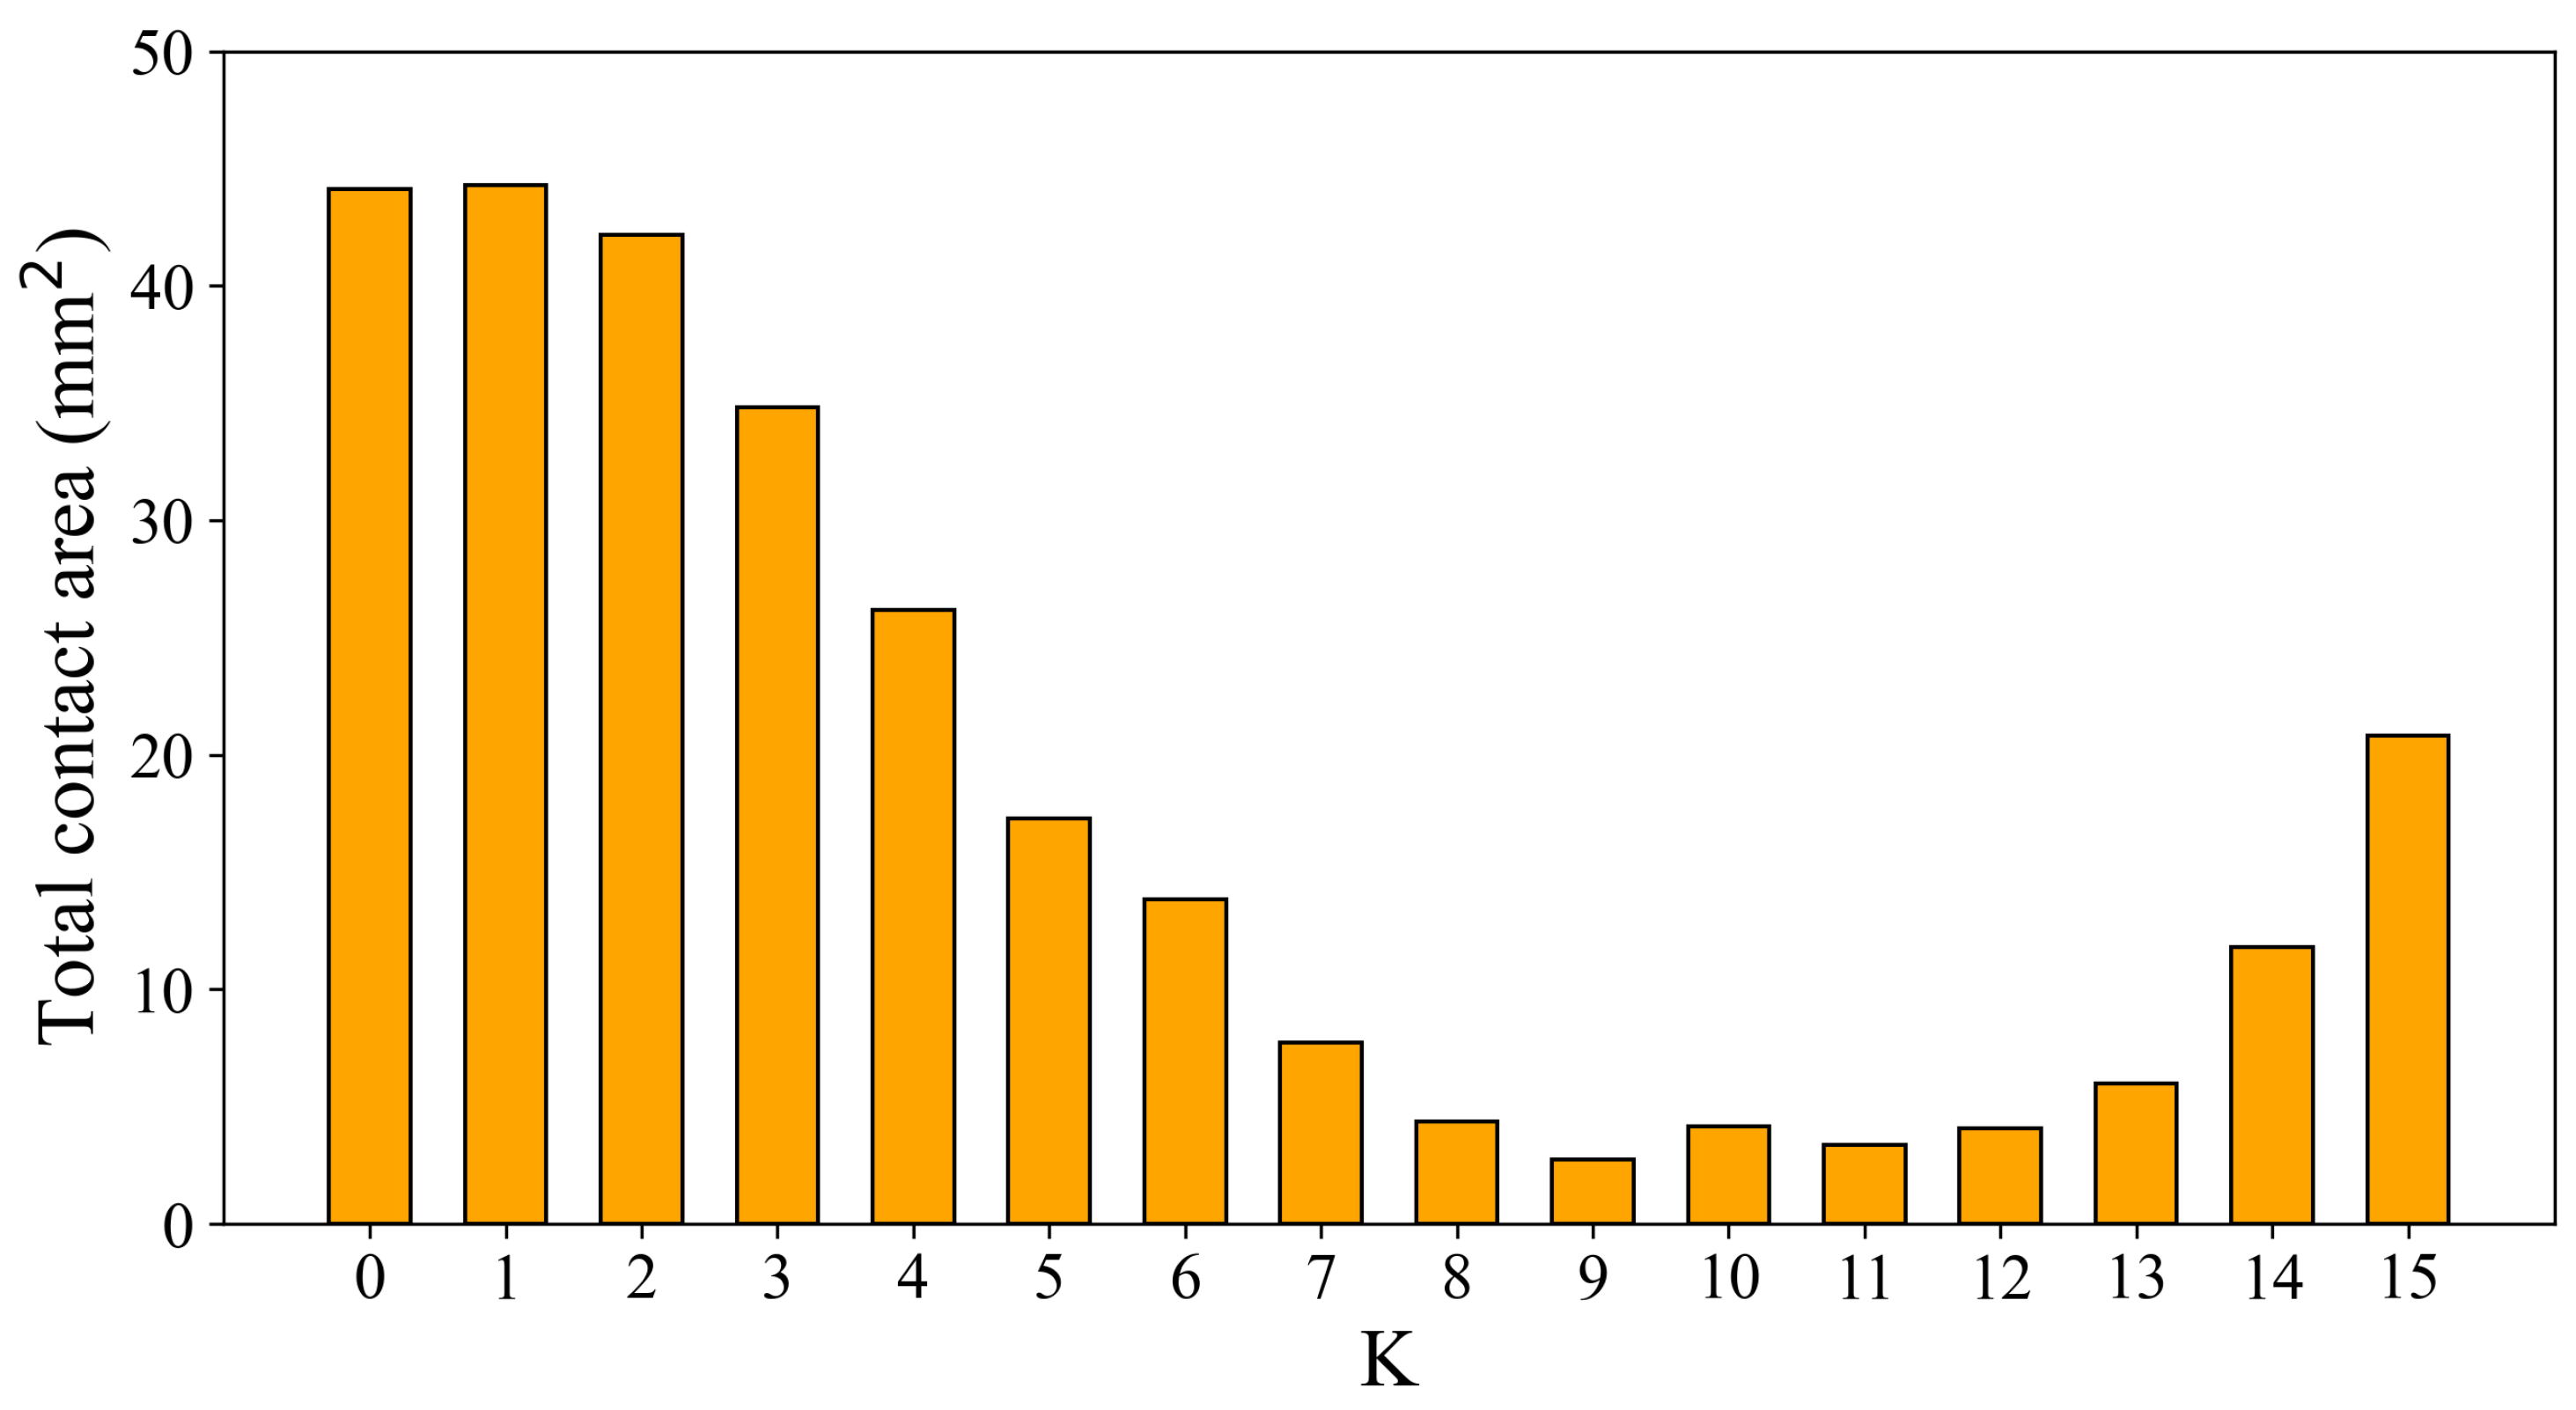
Table 3 presents the distribution of the contact area and
Figure 11 presents the total contact area at position
during the sliding of the designed surface along the
X axis. The results of
Figure 11a reveal that the contact area varies from 0 to 8
m and 72% of the observations have contact area of zero.
5.3. Sensitivity Analysis
The focus of this analysis is to evaluate the impact of the modeling and solution approaches we propose on the designed surface. We report the total CPU time to solve the ILP model using Gurobi. A terminating criterion for this solver is a solution error gap of 5%.
To validate the quality of the solutions obtained via the proposed approach, we conduct simulations. The designed surface used in the simulation model is created using the results of the disaggregation step (described in
Section 4). We simulate the sliding of the designed surface and calculate the corresponding contact area.
We use the following parameter values for our base case model:
,
,
,
,
. The values of
are calculated using (
26). Of the symmetry-imposing constraints, the ILP model solved includes only (
7) and (
8). In the discussion below, we will only mention the parameters whose values are changed during the sensitivity analysis.
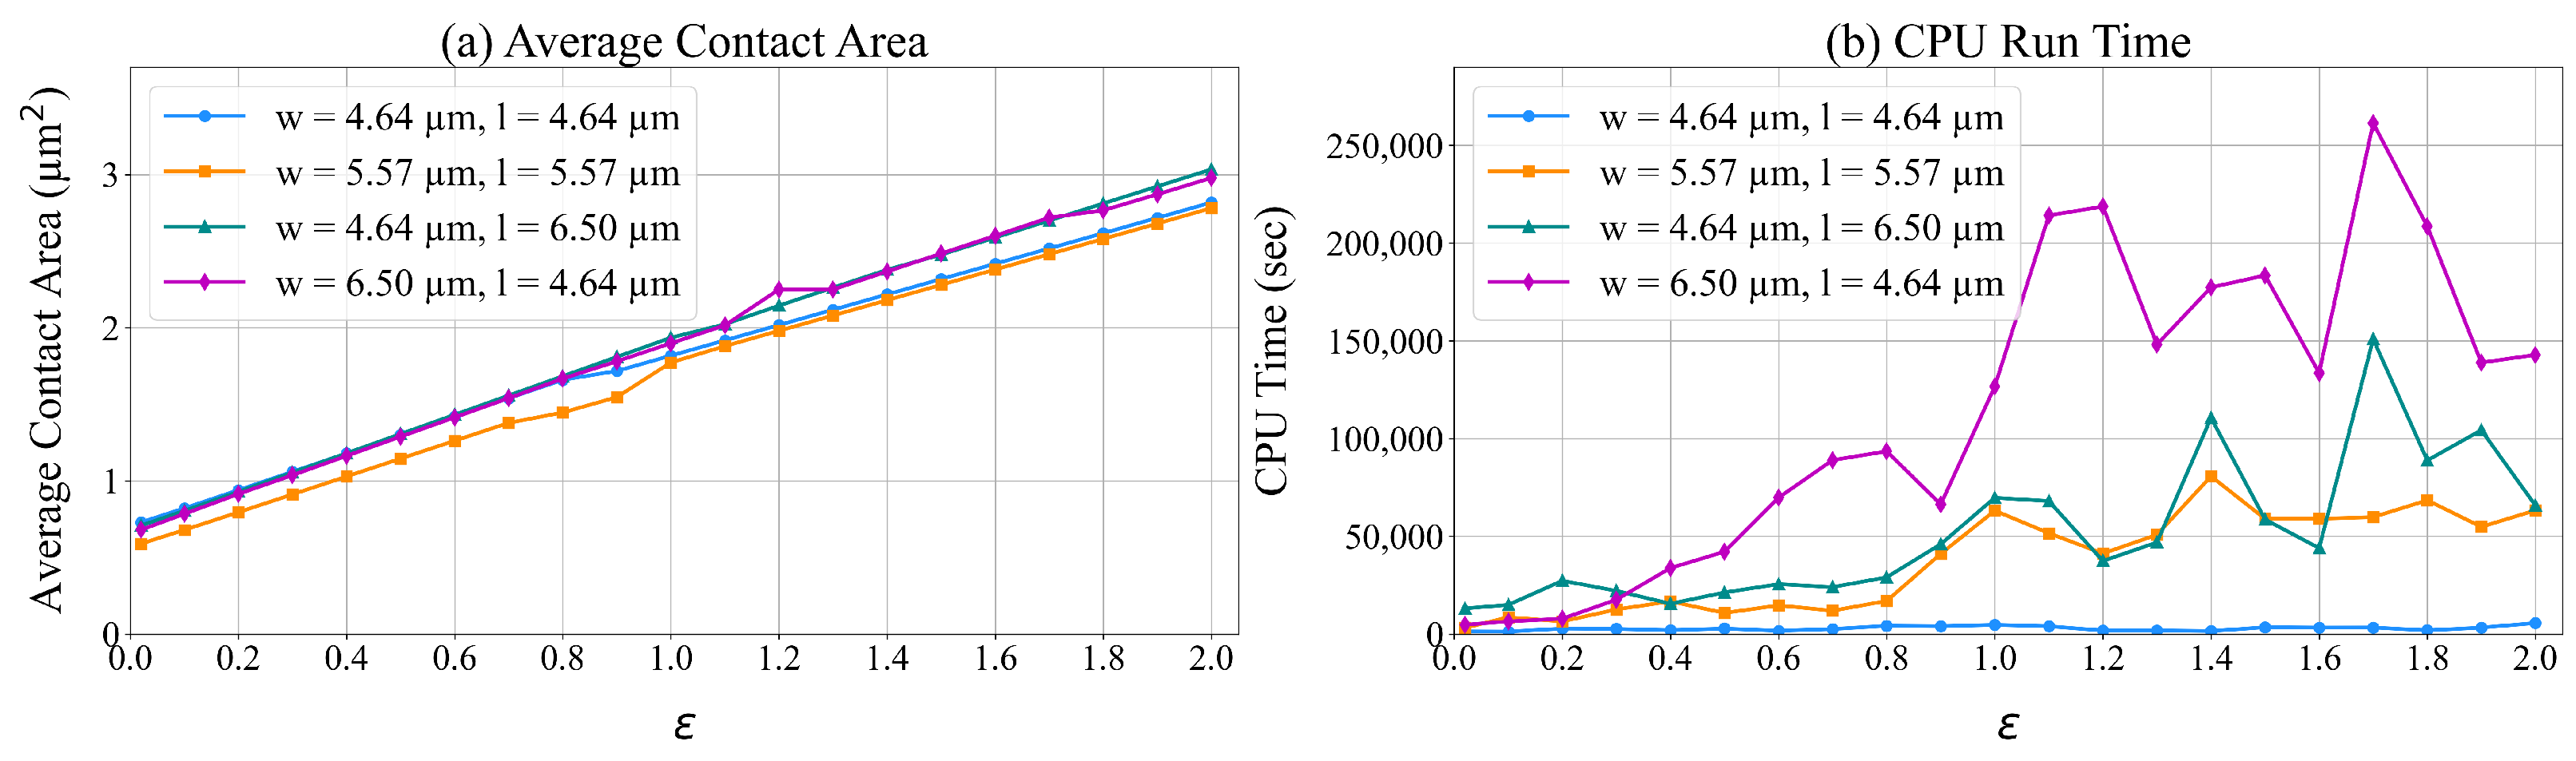
5.3.1. Value of Unit Load in Contact p
In constraint (
16), changes in
p impact
. We tested the model for different values of
between 0.02 μm
2 and 2.0 μm
2. In these experiments, we tested units designed surfaces with different dimensions:
(4.64
m),
(5.57
m),
(4.64
m) and
(6.50
m), and
(6.50
m) and
(4.64
m).
Figure 12 presents the average contact area during simulation and the CPU time to solve the corresponding ILP models. Based on these results, increasing the value of
p increases the average contact area for every surface. This increase is necessary to reduce surface deformation as unit load
p increases.
Figure 12b shows an increase in the run time of ILP with values of
p,
w, and
l.
The lines in
Figure 12a show small fluctuations since the solutions presented are within 5% of optimality. This is mainly because the problems are difficult to solve, as demonstrated via the results of
Figure 12b. There are several factors that affect the run time of the Gurobi solver, which explain the fluctuations observed in
Figure 12b. For example, (i) using parameters such as optimality gap tolerance—in our case—affects when the solver stops, leading to variations in run time; (ii) the number of nodes explored by the Gurobi solver and the efficiency of pruning can vary significantly depending on the problem instance; (iii) the Gurobi solver uses various heuristics and cutting planes that may lead to non-uniform performance across problem instances; (iv) variations in processor load, memory usage, and parallel thread execution can impact runt imes.
In order to maintain a low run time, we set to 0.2 μm2 on the remaining experiments we present.
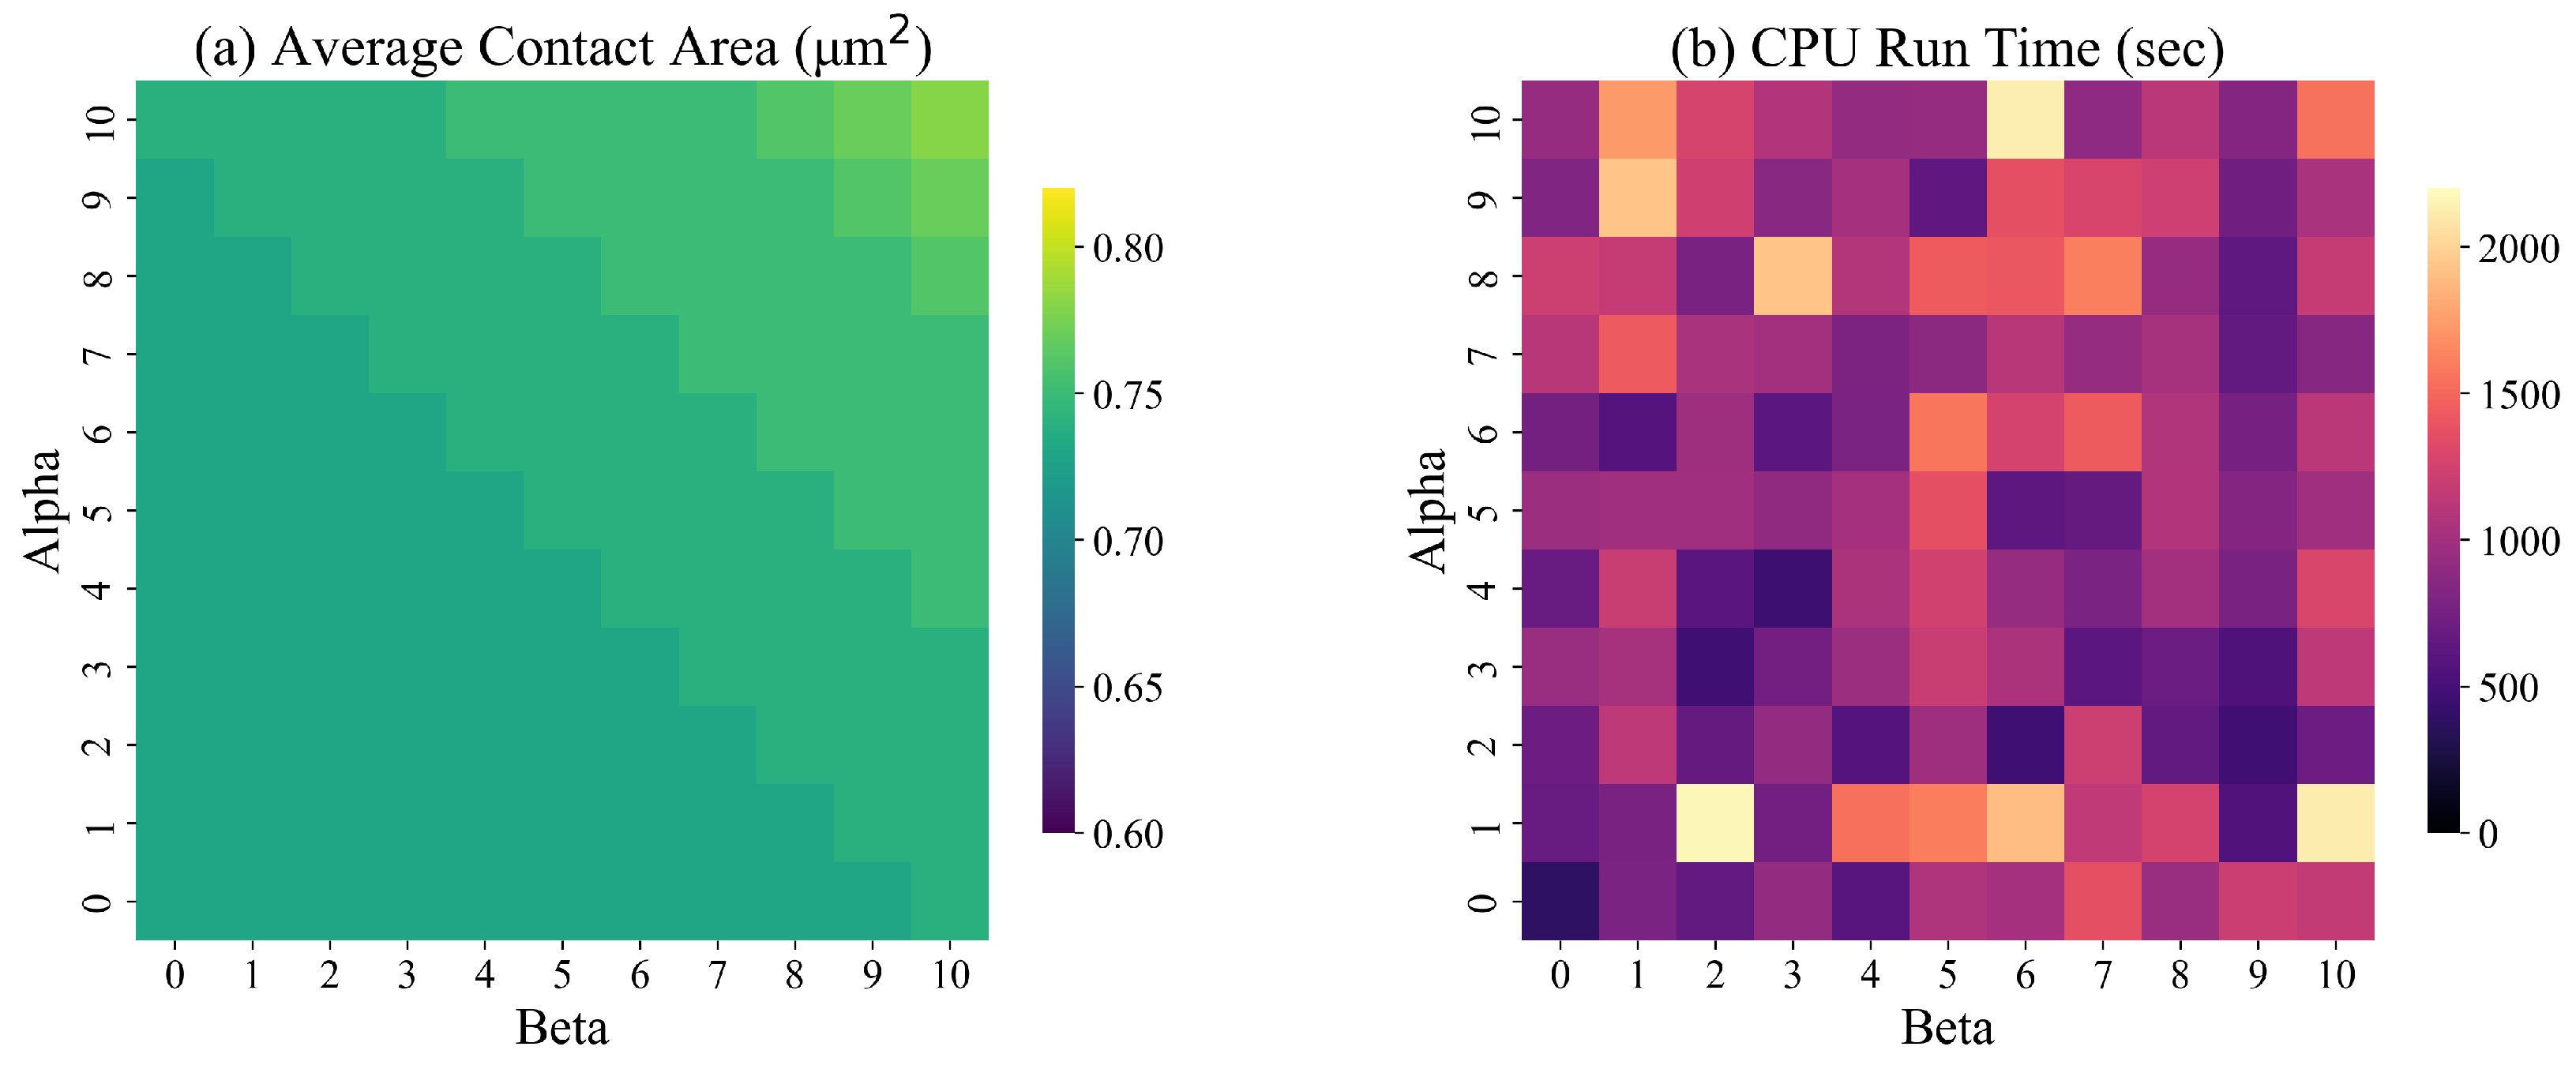
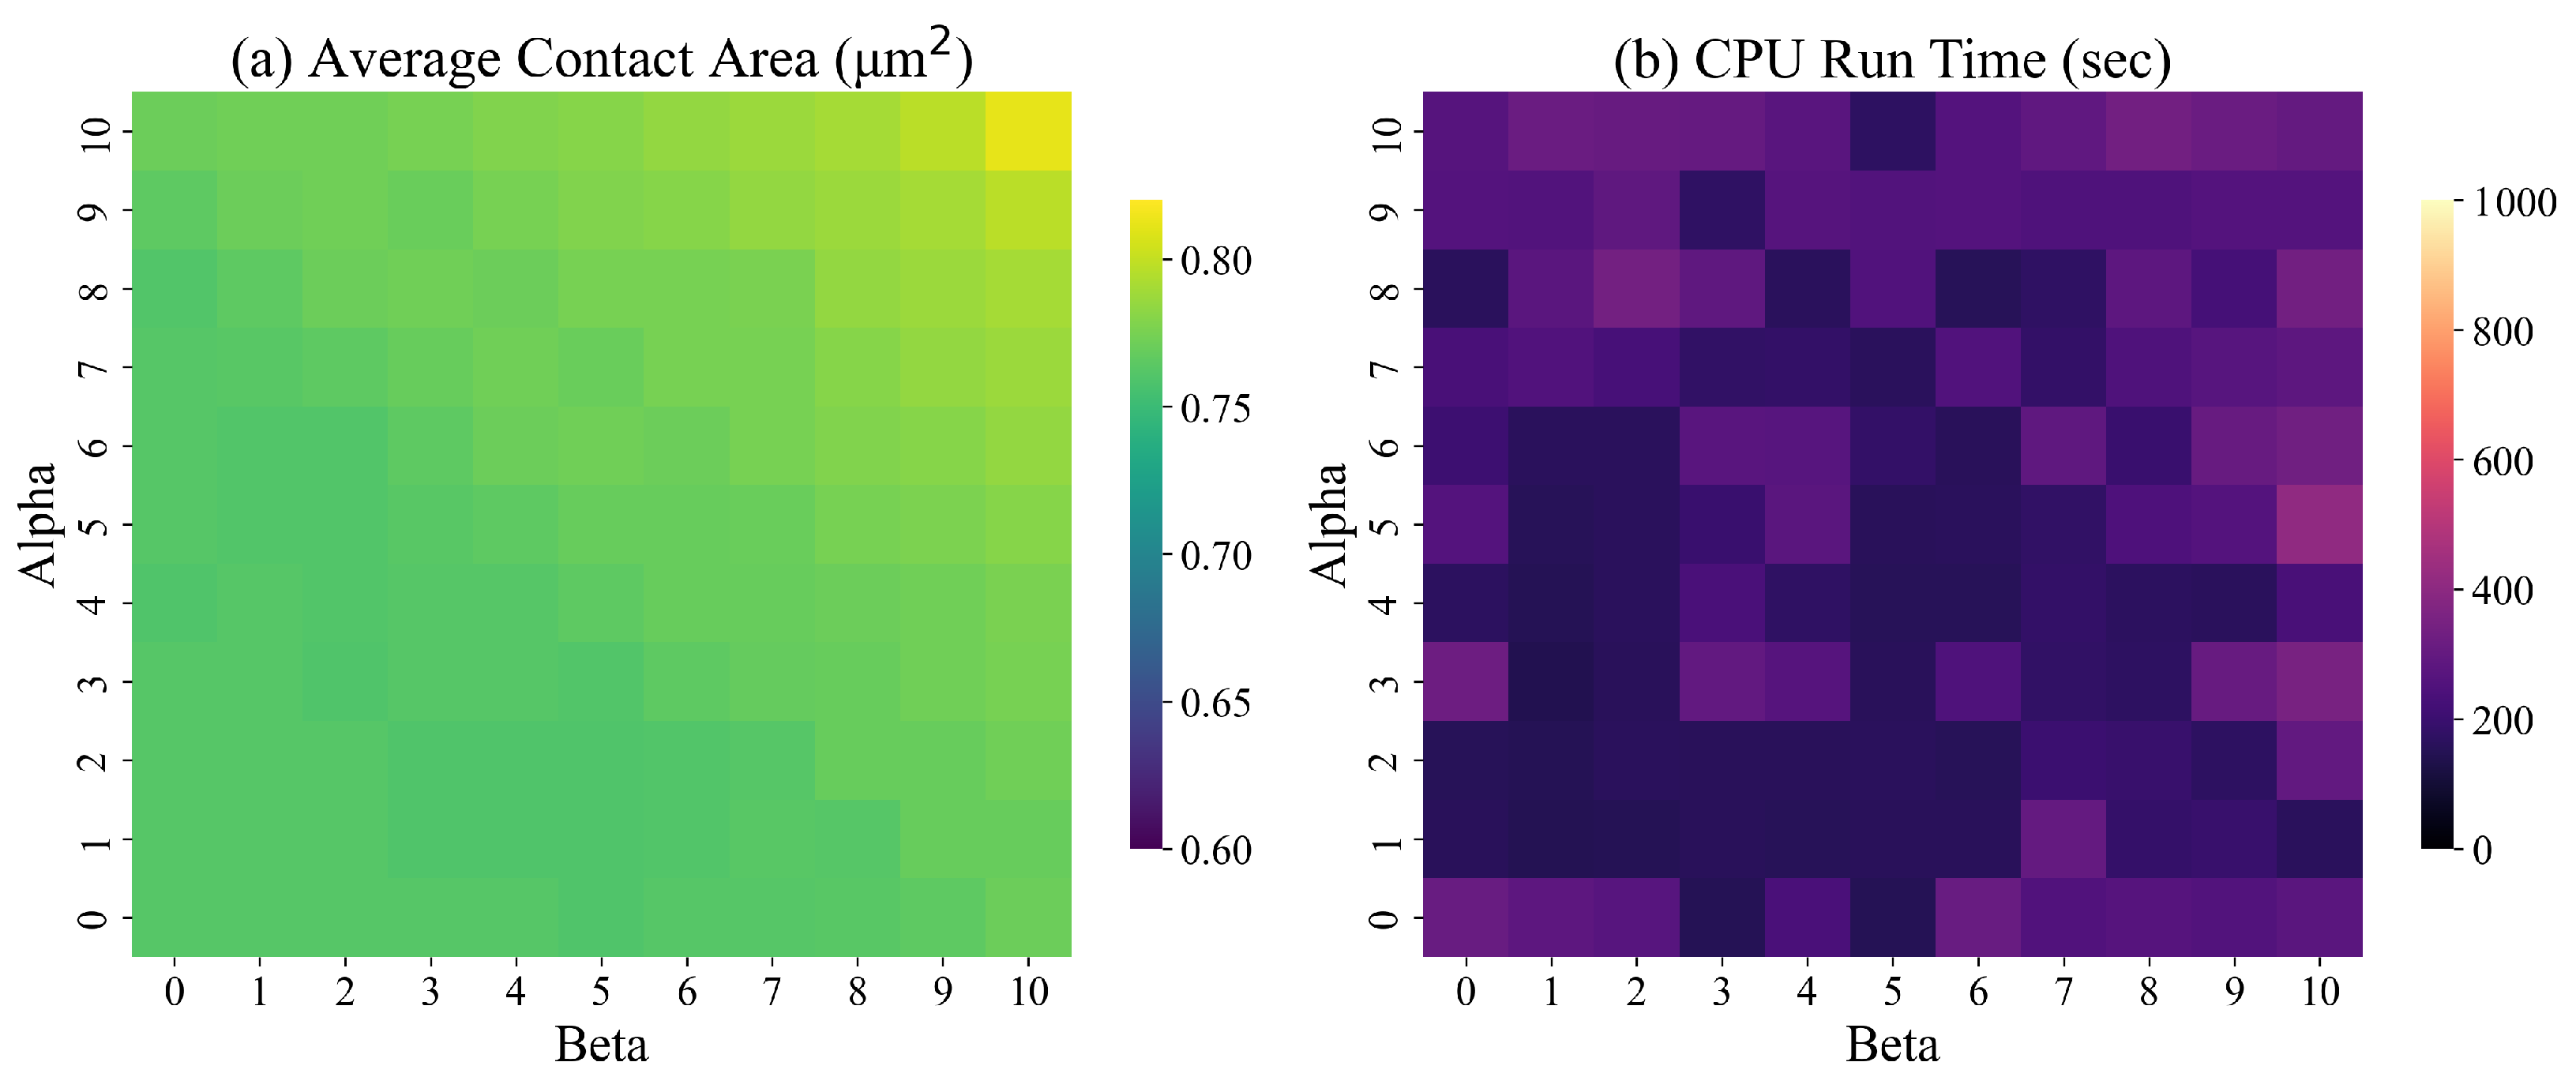
5.3.2. Values of and
In the objective function (
10), the values of
and
affect the texture (smoothness) of the surface. We tested our solution approach for different values of
and
between 0 and 10 for designed surfaces with dimensions
= 50 (4.64
m).
Figure 13 presents the average contact during simulation and the run time of the ILP model for different combinations of
and
. Based on the results of these experiments, the average contact area increases with
and
. No discernible trend in CPU time is evident.
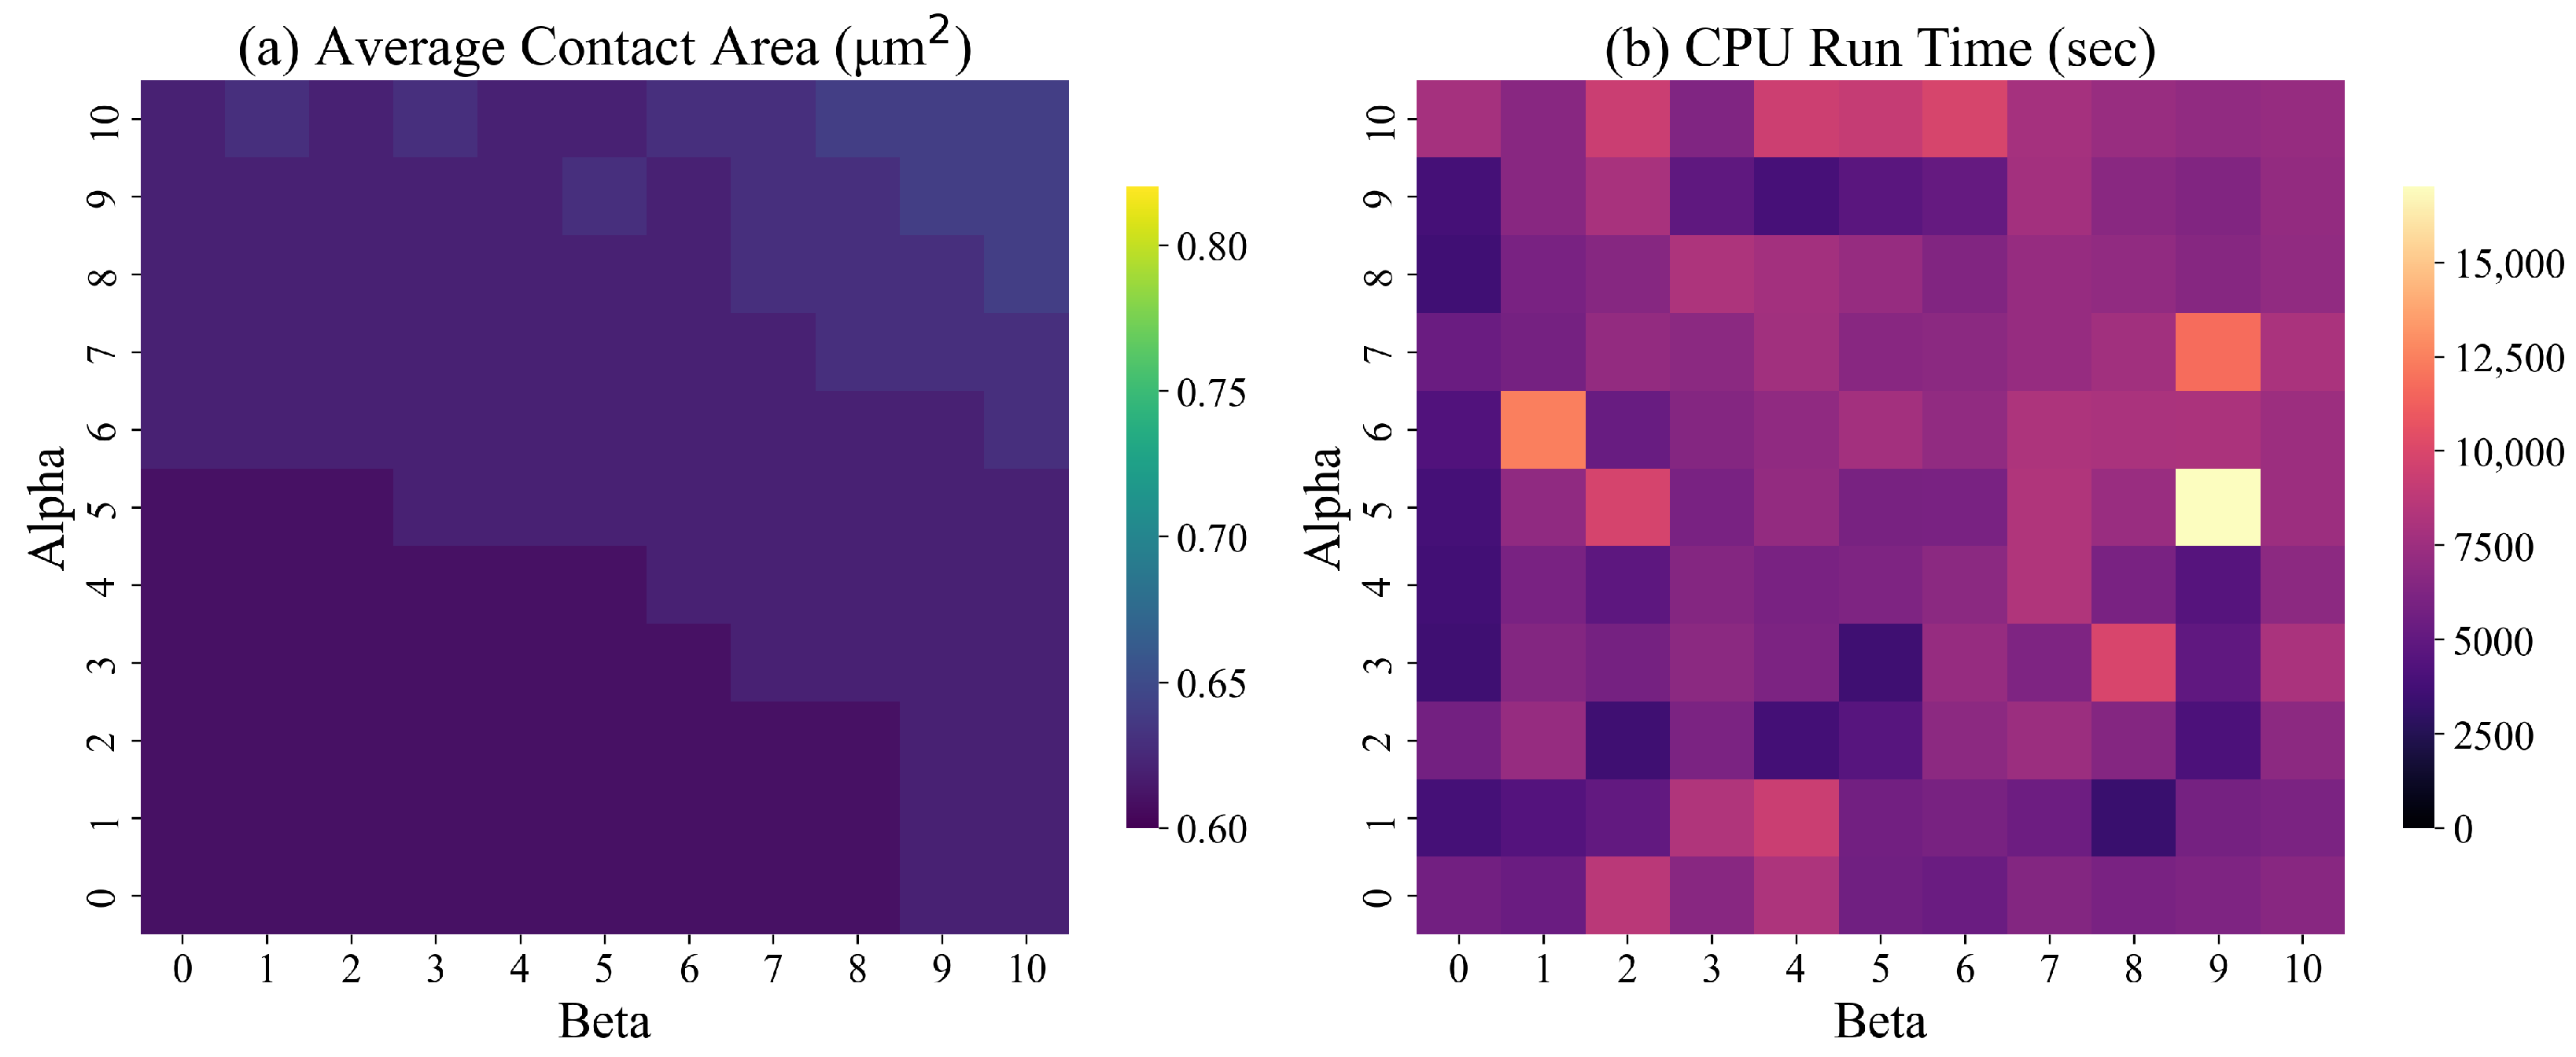
We repeated the experiments by including constraints (
9) for a fully symmetric designed surface. The results are presented in
Figure 14.
We repeated the experiments by excluding all symmetry imposing constraints, (
7)–(
9). The results of these experiments are presented in
Figure 15.
The results of
Figure 13,
Figure 14 and
Figure 15 show that the average contact area is smallest if the model does not impose shape symmetry. However, the corresponding run time of the model is the largest. Based on these findings, to minimize the average contact area and maintain low CPU times, we set
.
We conducted hypothesis testing to determine whether the difference in the average contact area for fully symmetric and partially symmetric and fully symmetric and non-symmetric designed surfaces are statistically significant. We conducted paired t-tests. The hypothesis testing of partially and fully symmetric surfaces yielded a t-statistic of and a p-value of , indicating no statistically significant difference in the contact area for the two surfaces. In contrast, the hypothesis testing of fully and non-symmetric surfaces yielded a t-statistic of and a p-value of . This result indicates a statistically significant difference in the contact area for the two surfaces.
The results of these experiments highlight the trade-offs between solution quality, run time of the ILP model, and practicality and cost of manufacturing the designed surfaces. The ILP model that imposes full symmetry of the designed surface is easier to solve. Fully symmetrical shapes ensure an even distribution of stresses and loads across the surface, lowering the risk of surface failure. Fully symmetrical shapes are easier to manufacture, reducing production time and costs. However, the corresponding contact area is the largest.
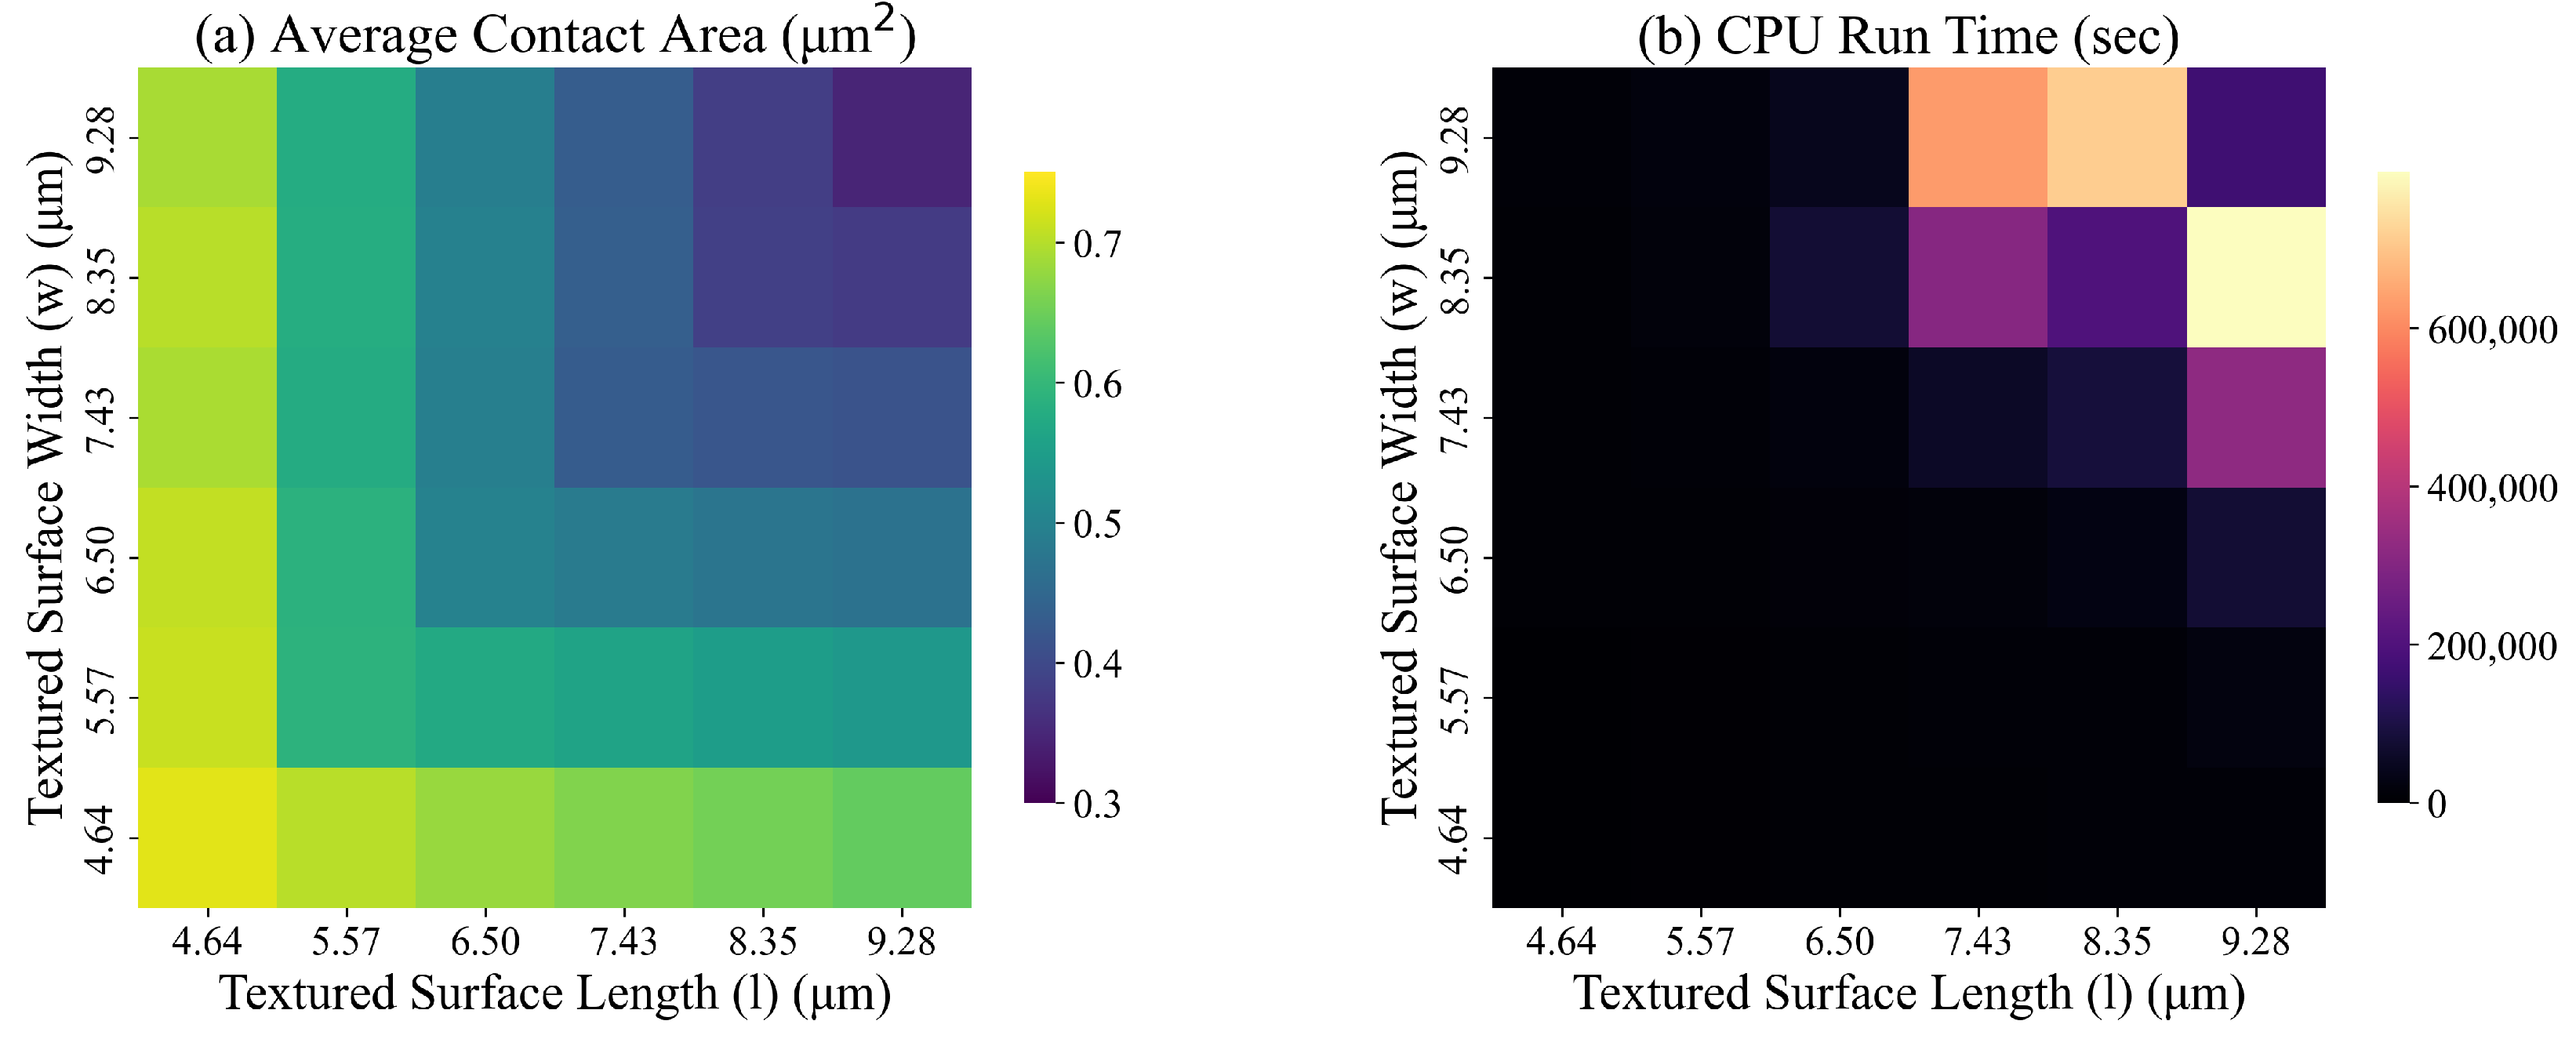
5.3.3. Size and Shape of the Unit Designed Surface
We test square and rectangular shapes of different dimensions by changing the values of
and
Due to the high computational demands of solving the ILP model for
= 100 (9.28
m),
= 90 (8.35
m), we use an error gap of 6% as a stopping criterion for Gurobi. For the remaining experiments, we use an error gap of 5%.
Figure 16 summarizes the results of these experiments.
Based on the results of these experiments, the average contact area decreases, and the ILP run time quickly increases with the size of the designed surface. We also observe that square-shaped surfaces exhibit a smaller average contact area compared to rectangular-shaped surfaces with similar surface areas. To strike a balance between the computational time and solution quality, we use = 80 (7.43 m), = 80 (7.43 m) in our experiments.
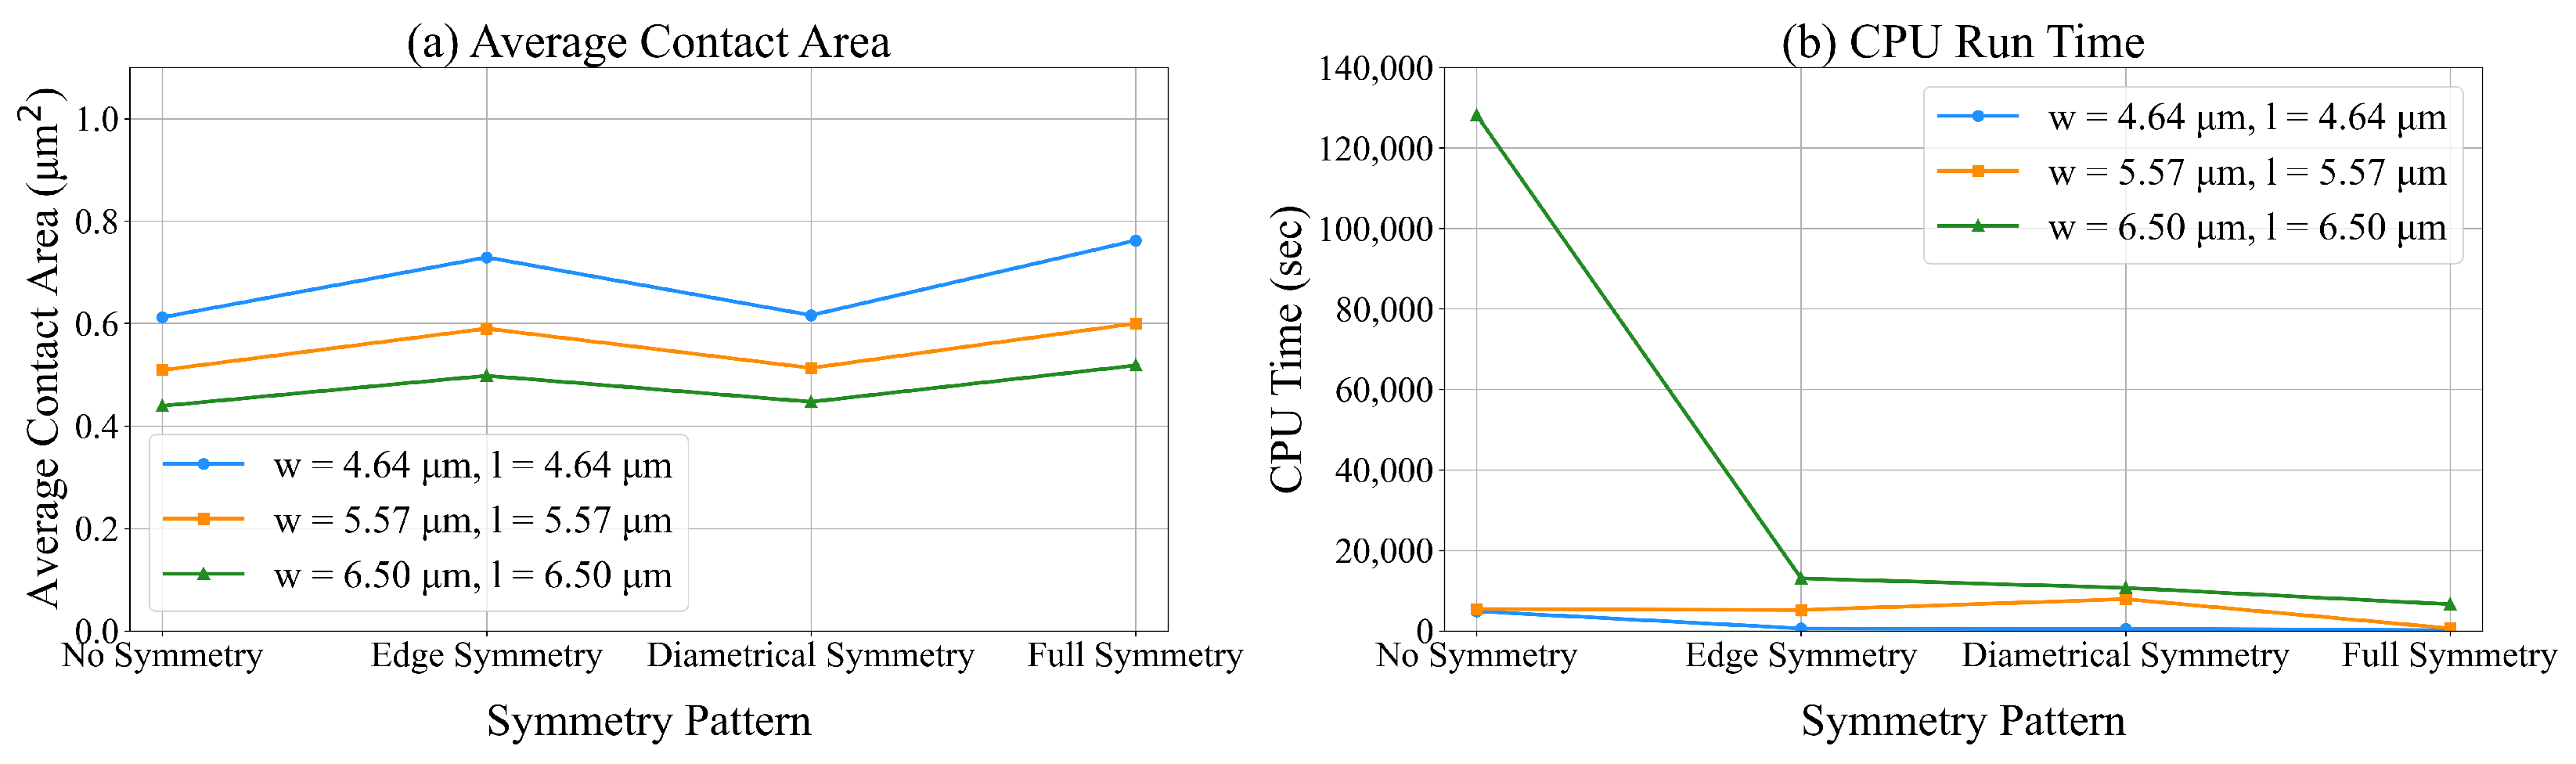
5.3.4. Symmetry of the Designed Surface
We compare different symmetry patterns of the unit designed surface of size
= 50 (4.64
m). The symmetry patterns considered are full symmetry, partial symmetry, and no symmetry. Based on the results presented in
Figure 17, the average contact area is smallest in models without symmetry-imposing constraints. However, the CPU run time for these models is the largest. The average contact area for models that impose symmetry along the diagonal is close to that of structures without symmetry-imposing constraints. The corresponding CPU run time for these models is low. Models that impose full symmetry lead to solutions with the highest contact area and lowest CPU run time. These results are consistent with the results presented in
Figure 13,
Figure 14 and
Figure 15.
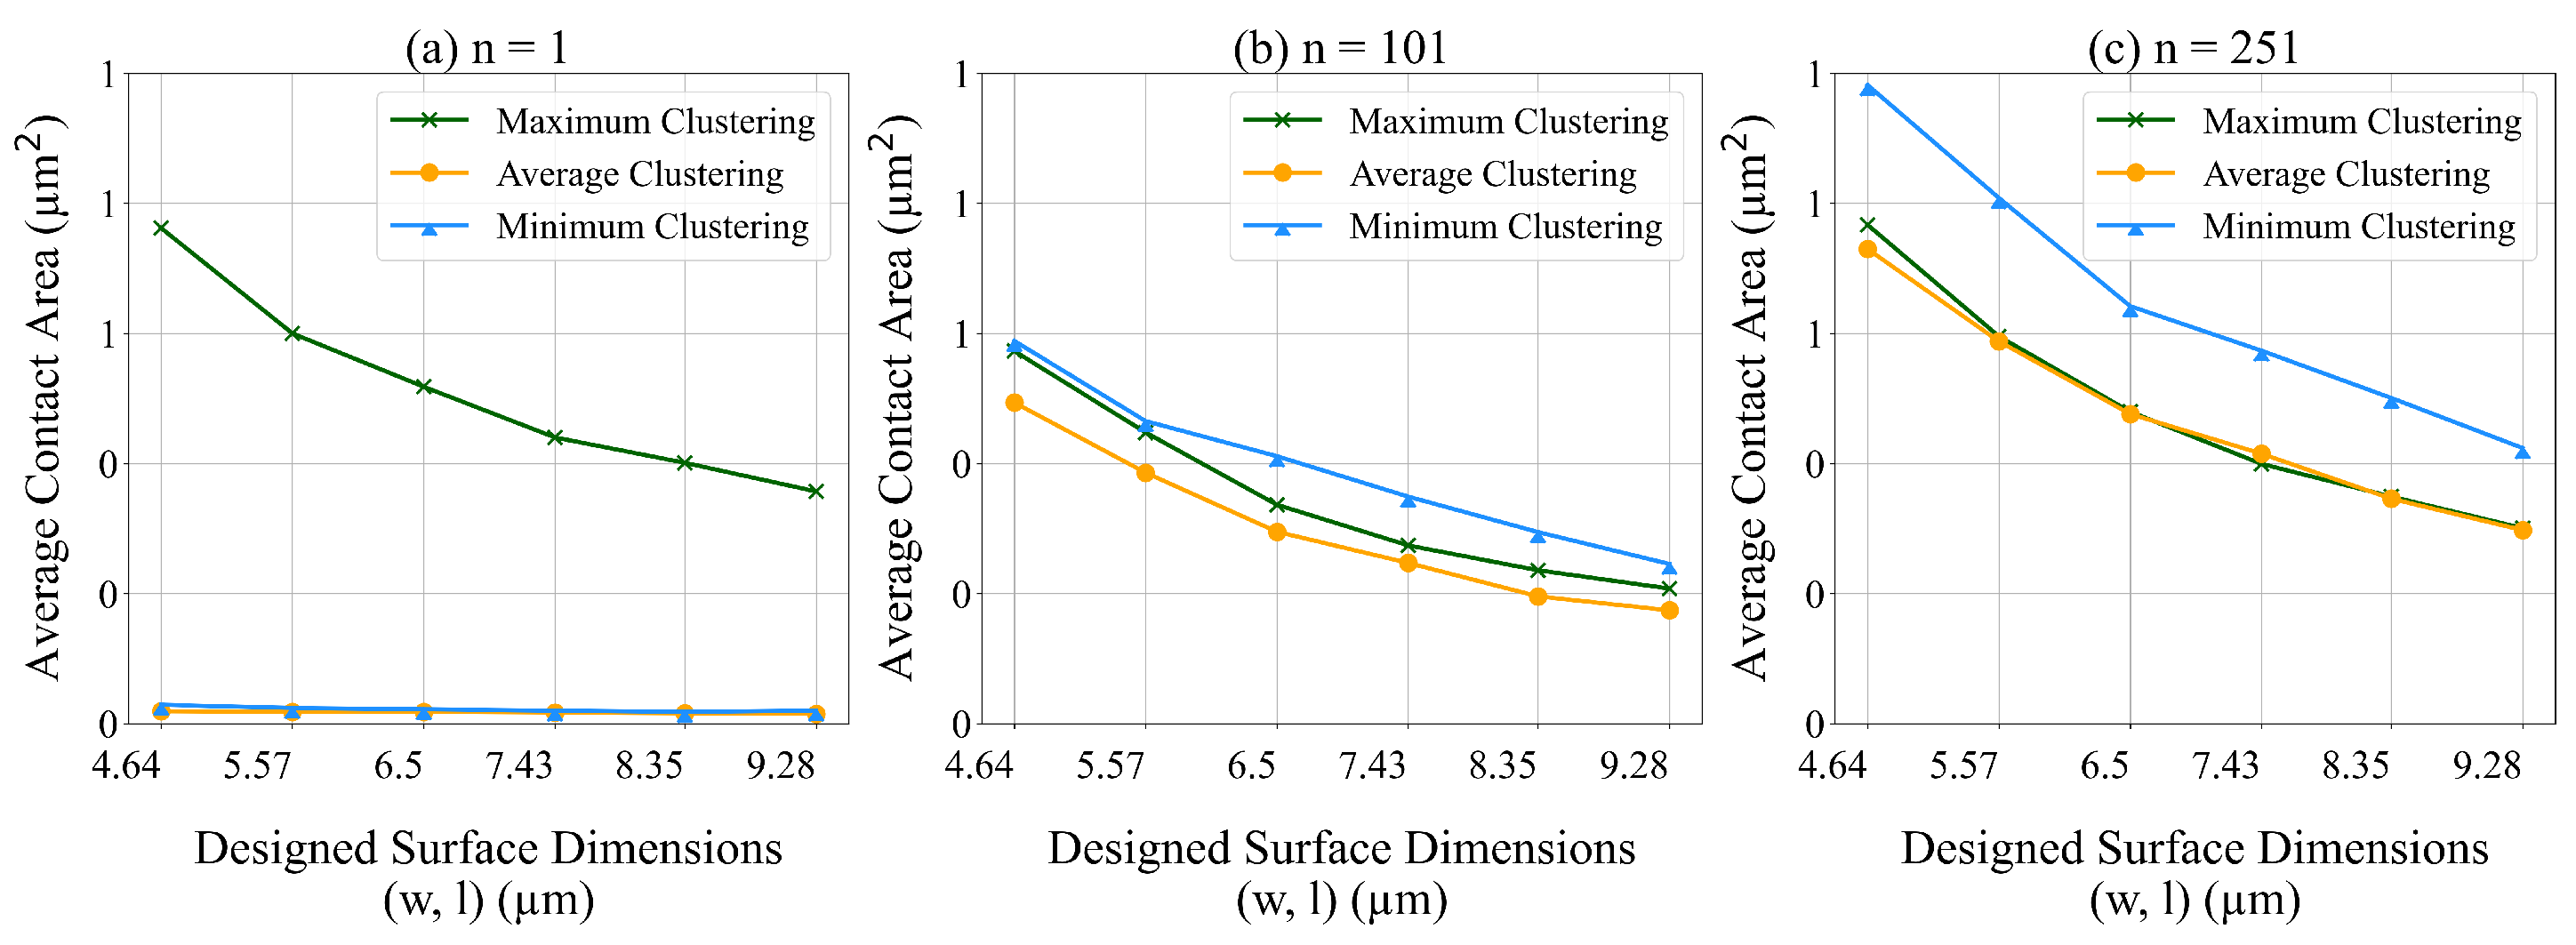
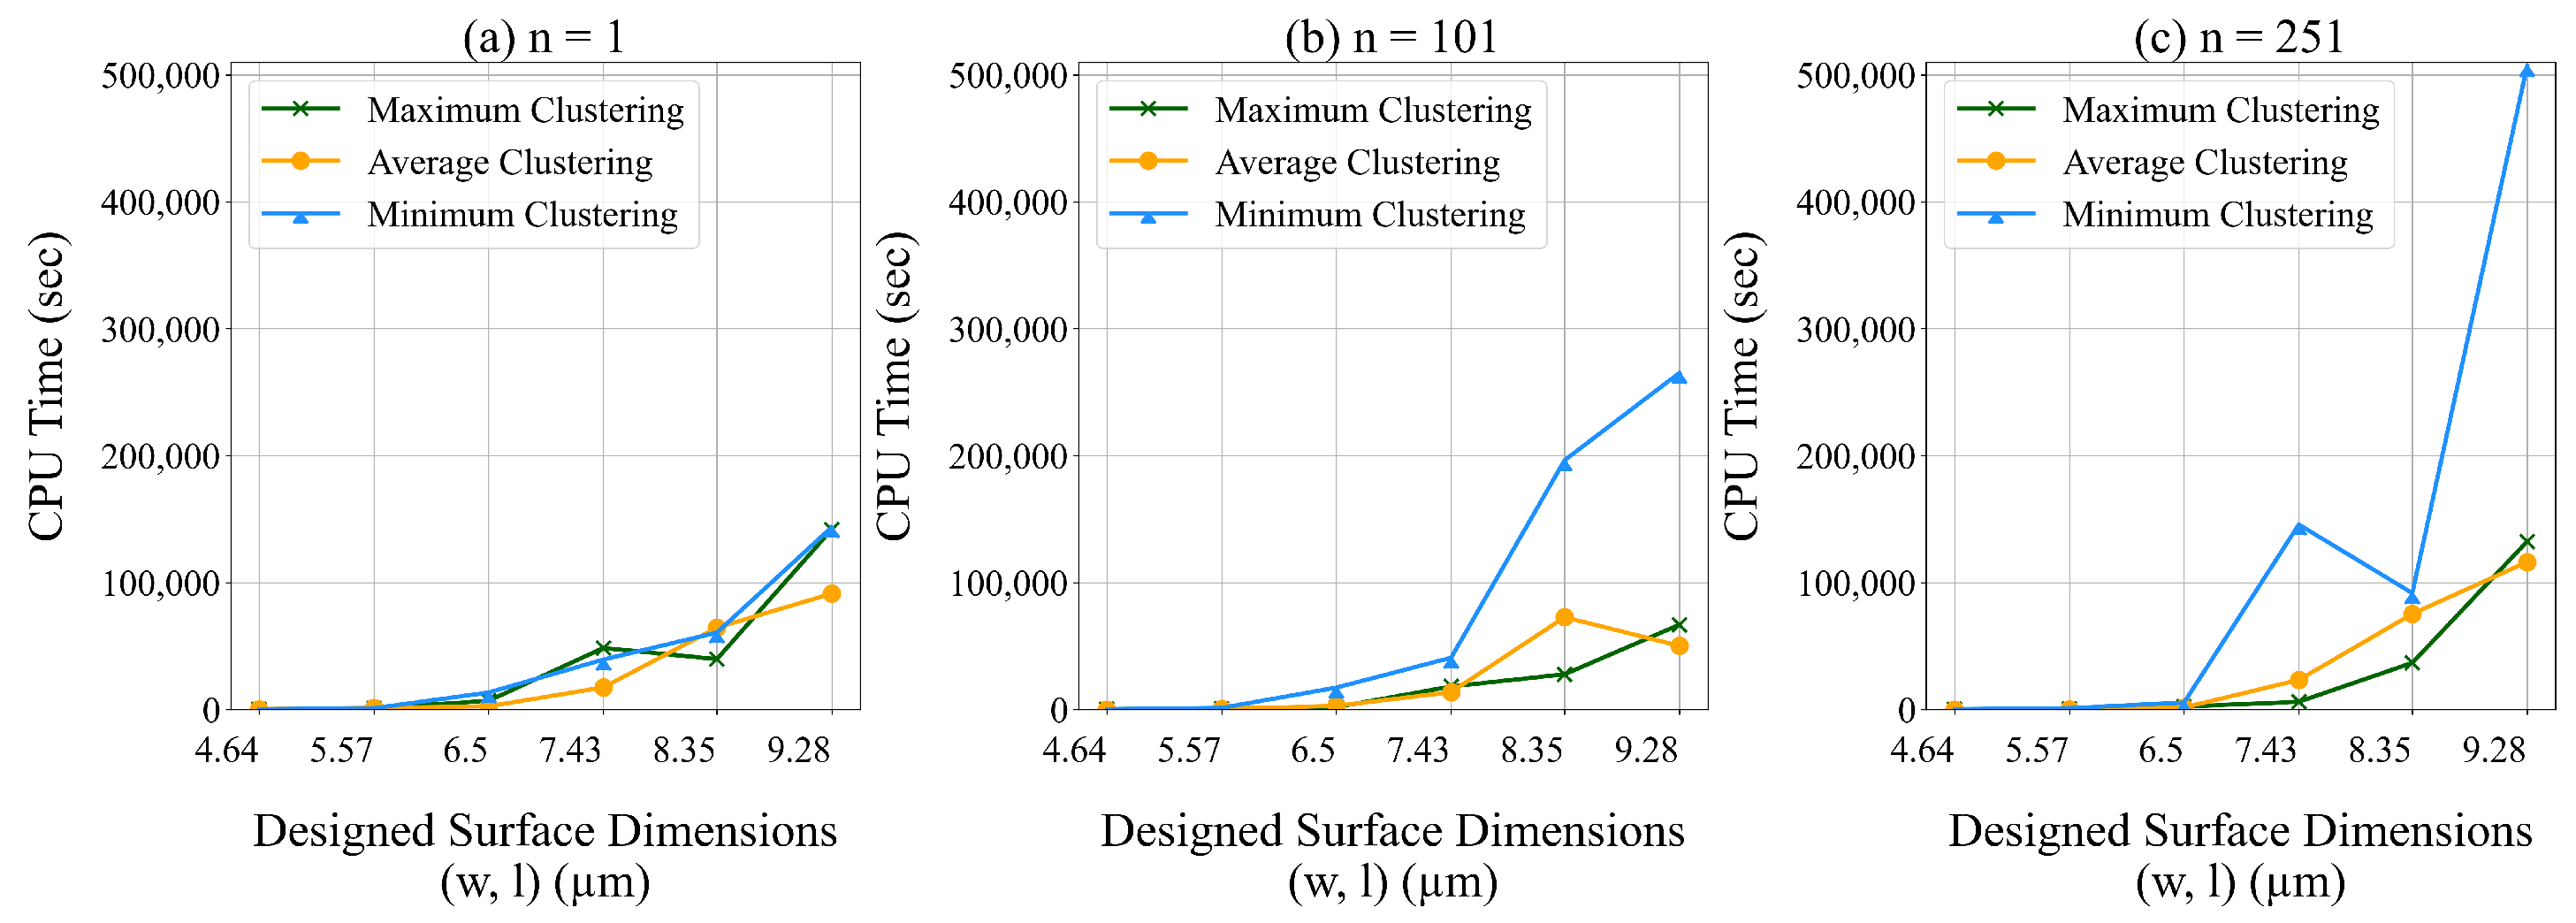
5.3.5. Clustering Method
We employed three methods for representing the aggregated data. We use Equations (
26)–(
28) to calculate the maximum, minimum, and average values within each data cluster. We test the performance of each method on the average contact area. We also test the impact of the dimensions of unit designed surface on the average contact area. In these experiments, the unit designed surface is fully symmetric.
In
Figure 18 and
Figure 19 we present the average contact area and computational time for different values of
We observe that the average contact area decreases and the CPU run time increases with the dimensions of the unit designed surface. Using the average of the data to represent the cluster (e.g., using (
28) to determine
) results in the lowest average contact area. Using the average and minimum of the data to represent the cluster results in the lowest CPU run time.
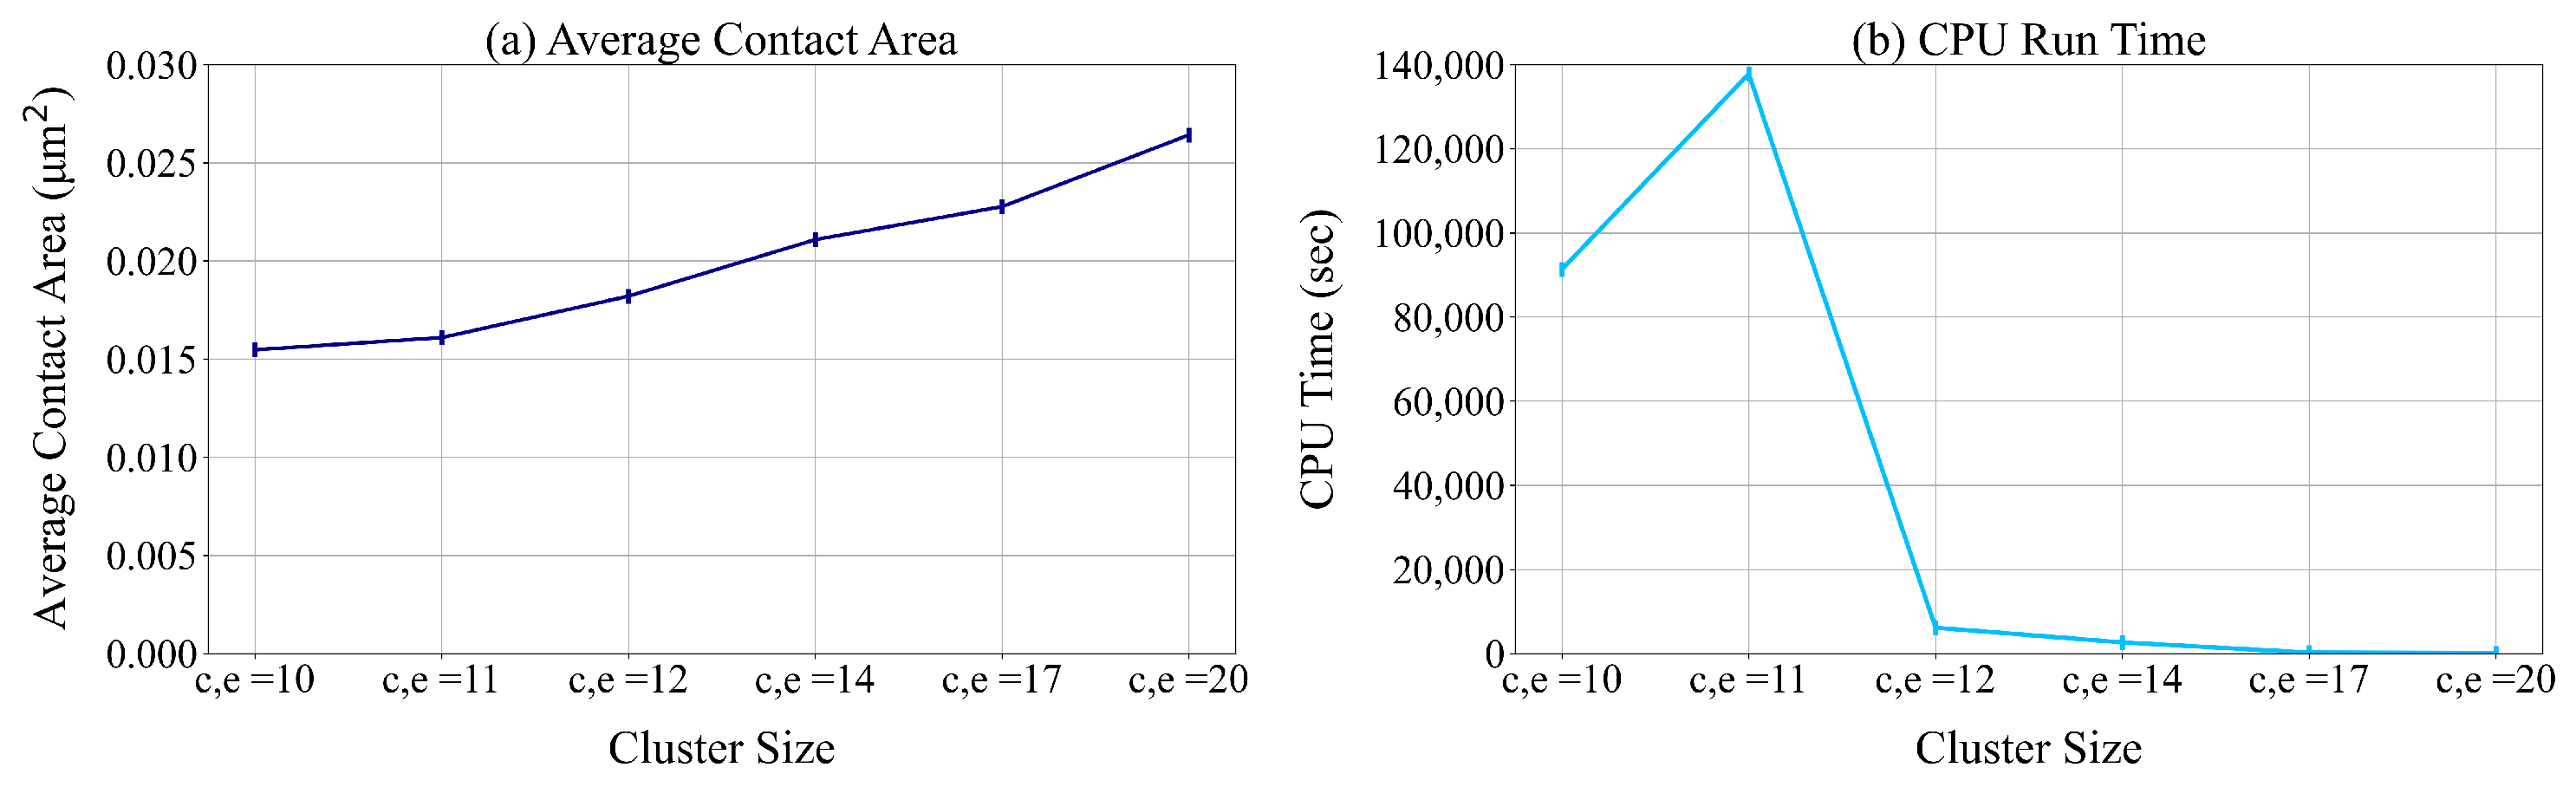
5.3.6. Cluster Size
We test the impact of the size of data aggregation on the average contact area and CPU run time for fully symmetric unit designed surface of different sizes. We change the values of
c and
e from 10 to 20. The results of these experiments are presented in
Figure 20. These results indicate that a high level of data aggregation deteriorates the quality of the solutions found. However, aggregating the data reduces the computational time required to solve the ILP model.
6. Conclusions
We propose a novel non-linear program (NLP) to design textured surfaces to enhance the tribological performance of micro- and nano-electromechanical systems (MEMS/NEMS). The objective of our proposed model is to determine feature size, shape, and arrangement that minimize the real contact area between interacting surfaces and minimize deformation during sliding in dry conditions. Model constraints capture (i) the relationships among load at contact, the size of the contact area, and the yield strength of the material, (ii) the relationship between the symmetry of shapes in the textured surface and the size of the contact area, and (iii) the relationship between the smoothness of the textured surface and the size of the contact area. Since solving the proposed NLP is challenging, we develop a linear approximation that, for small-size problems, can be solved using commercial optimization software. We also propose a solution approach to solve large-size problems.
We conducted several experiments to test the performance of the proposed model. The results of these experiments highlight the relationships that exist among the load in contact, shape symmetry, surface smoothness, and the average contact area, the size and shape of the unit-designed surface and the average contact area, and the problem size and run time of the proposed solution approach.
The results of our experiments show that this modeling approach provides a robust framework that supports the effective design of textured surfaces for various engineering applications.
A limitation of the proposed model is that it does not account for the mechanics of deformation during sliding. While the study provides valuable insights into tribological behavior, the model does not explicitly incorporate how the surface textures deform under applied loads during sliding contact. This omission means that potential stress concentrations, material fatigue, and texture wear mechanisms are not fully captured. To improve upon this, future work could integrate deformation mechanics into the model.


