Article

Numerical Simulation of the Lubrication Performance of the Stator and Rotor Friction Pair Surface Rhombus-like Texture in Screw Pumps

1
Key Lab of Industrial Fluid Energy Conservation and Pollution Control (Ministry of Education), Qingdao University of Technology, Qingdao 266520, China
2
College of Mechanical and Electronic Engineering, China University of Petroleum (East China), Qingdao 266580, China
3
Research Institute of Exploration & Development, PetroChina, Beijing 100083, China
*
Author to whom correspondence should be addressed.
These authors contributed equally to this work.
Lubricants 2025, 13(4), 157; https://doi.org/10.3390/lubricants13040157
Submission received: 13 February 2025 / Revised: 27 March 2025 / Accepted: 31 March 2025 / Published: 2 April 2025
(This article belongs to the Special Issue Tribology of Textured Surfaces)

Abstract

To address wear failure in screw pump stator and rotor friction pairs, this study constructed a numerical model of a rhombus-like micro-dimple texture on friction pair surfaces based on the scale structure of rhombus rattlesnakes. The model was based on the fluid dynamic pressure lubrication mechanism. The CFD method was used to calculate the bearing capacity, friction coefficient, flow field pressure distribution, and flow trace distribution of an oil film carrying surface. The effects of the area rate, depth, shape, and angle of the rhombus-like dimple texture and the actual well fluid viscosity of shale oil on the surface lubrication performance of screw pump stator and rotor friction pairs were analyzed. The results demonstrated that increasing the texture area rate and the angle of the long sides and decreasing the texture angle resulted in a decrease in the oil film surface friction coefficient and an increase in the average pressure and net bearing capacity as well as the hydrodynamic lubrication performance. The average pressure increased and then decreased as the texture depth increased, while the friction coefficient of the oil film surface initially decreased and then increased. At a texture depth of 20 μm, the friction coefficient reached its lowest value while the average pressure and net bearing capacity of the oil film reached their highest value, which resulted in optimal hydrodynamic lubrication performance. When the texture depth became greater than 20 μm, vortices were gradually formed within the texture, which decreased the hydrodynamic lubrication performance. When the area rate of the rhombus-like dimple texture, depth, angle between long sides, and angle were, respectively, equal to 27%, 20 μm, 74°, and 0°, the net bearing capacity of the oil film was maximized, the friction coefficient was minimized, and the hydrodynamic lubrication performance and anti-wear effect reached their highest values. The increase in the viscosity of the actual well fluid could enhance the dynamic pressure lubrication performance and improve the bearing capacity.

1. Introduction

With the deepening of oilfield development, the proportion of thick oil wells, sandy oil wells, medium and low production oil wells, and high gas content wells has increased. Screw pumps are widely used in major oilfields due to their unique advantages [1,2,3,4,5,6]. Their core components are the metal rotor and rubber stator, which are tightly meshed to form a number of closed chambers for extracting crude oil [7,8,9]. In a high-temperature and high-pressure downhole environment, the rubber stator undergoes prolonged periodic extrusion and friction from the metal rotor, resulting in wear failure, which negatively affects the service life of the screw pump and decreases the efficiency of oil recovery [10,11,12,13,14]. Therefore, to address the problem of wear failure in the stator and rotor friction pairs of screw pumps, new technology is needed to improve friction performance. This could establish a foundation for improving the oil recovery efficiency of screw pumps.
Many studies have shown that a reasonable design of surface texture could increase the friction performance of material surfaces [15,16,17,18,19]. Therefore, the design of a suitable micro-texture on the surface of screw pump stator and rotor friction pairs would be able to avoid the wear failure between the stator and rotor. In addition, it has been demonstrated that the wear-reducing performance of surface textures is affected by their size, shape, area rate, depth, and arrangement [20,21,22,23]. Jia et al. [24] employed a laser machining system to process circular micro-pit textures on plunger pumps and demonstrated that these micro-textures effectively reduced wear through a multifunctional friction and wear tester. Carl et al. [25] fabricated linear and square textures on the surface of Ti3SiC2–TiC-type MAX phase composites using the laser surface texturing technique, and their results showed that the textures exhibited excellent wear reduction performance. Wang et al. [26] demonstrated that when the friction reciprocating frequency was low, symmetrical textures exhibited superior friction reduction performance, and the friction reduction effect of hexagonal textures surpassed that of triangular textures. However, when the friction reciprocating frequency was high, triangular textures demonstrated better performance. Peng et al. [27] examined the influence of a microgroove texture on the friction performance of the friction surface of the rotor in an oil recovery screw motor and discovered that the friction coefficient increased with the increase in depth of a certain texture angle. Wang et al. [28] studied the influence of surface texture on the friction behavior of 42CrMo metal and rubber friction pairs and discovered that the presence of texturing significantly improved the wear performance of the mating pair. Joshua et al. [29] demonstrated that the effectiveness of micro-textures was closely related to their depth characteristics. Cui et al. [30] analyzed the tribological properties of diamond-shaped textures at different depths under water lubrication conditions, and the coefficient of friction could be seen to be 1 mm pit > no texture > 0.5 mm pit. Otero et al. [31] identified that the surface texture served as an effective method to reduce the friction coefficient of the point contact, particularly under low-speed and high-pressure conditions, thereby promoting boundary/mixed lubrication.
With the development of numerical simulation technology, researchers have used numerical optimization methods to obtain micro-texture parameters with better tribological properties. Figure 1 illustrates the research progress in numerical simulation methods for surface textures. Guo et al. [32] conducted a systematic investigation into the influence of geometrical parameters and sliding speeds on tribological properties by establishing a numerical computational model of a continuous groove texture and found that the texture had better lubrication properties at lower area densities. Shen et al. [33] investigated the effects of geometrical parameters as well as the distribution and arrangement of textures on lubrication properties by numerical simulation. The results showed that geometric parameters such as depth, length, width, and angle had a significant effect on lubrication performance. Among them, the effect of area density was the most obvious, and the effect of length was the least obvious. Liu et al. [34] performed a computational investigation into micro-depressed surface features, with findings indicating that the load-bearing capacity improved as the area density increased. Hua et al. [35] created a computational model using MATLAB and utilized an equation derived from the finite element method to evaluate the pressure distribution. Their analysis revealed that pressure distribution depended largely on the texture parameters. Wei et al. [36] conducted a numerical simulation to assess how fan-shaped surface textures influence the dynamic pressure lubrication performance of fluids. Their numerical simulation found that the optimal fan-shaped texture significantly outperforms traditional textures (circular, square, rhombus, v-shaped, triangular, anti-triangular) and anti-fan textures with the same radius, depth, and operating conditions. Li et al. [37] employed mass-conserving cavitation boundary conditions and a non-dominated sorting genetic algorithm to optimize the herringbone texture. Wang et al. [38] investigated the tribological properties of smooth surfaces, square-textured surfaces, triangular-textured surfaces, and circular-textured surfaces. Their research revealed that surface texture could substantially enhance friction performance under consistent operational parameters. In particular, the square texture design exhibited superior friction performance to triangular and circular patterns. Additionally, the optimal friction behavior was observed when the surface texture depth ranged from 20 µm to 50 µm. Zhong et al. [39] employed MATLAB software to study computational models of hexagonal textures with two directional configurations and examined how geometric attributes and operational parameters influence their tribological behavior. Mao et al. [40] designed a herringbone surface texture and verified its anti-wear effect by simulation.
In summary, numerous studies have investigated circular, rectangular, triangular, and asymmetric textures, primarily applied in bearings, cutting tools, and other fields. However, existing studies on the reduction of wear on the stator–rotor friction surface of screw pumps have mainly focused on improvements in stator rubber properties [41,42,43], while those on the texture of stator and rotor friction surfaces are limited. Therefore, the introduction of surface texturing technology to increase the tribological performance of the stator and rotor friction pairs of screw pumps is of practical significance.
Based on the above analysis, to investigate the effects of micro-texture on the surface lubrication performance of screw pump stator and rotor friction pairs, inspired by bionics principles, this study proposed designing a rhombus-like texture that mimicked rattlesnake scales on the surface of screw pump stator and rotor friction pairs. A finite element model for the stator and rotor friction pairs of rhombus-like dimple-textured screw pumps was developed based on the principle of fluid lubrication. The single factor method was used to analyze the bearing capacity, friction coefficient, pressure distribution, and flow trace of different area rates, depths, shapes, and angle textures. The parameter combination of the texture exhibiting the best wear reduction effect was then selected. It is expected to decrease wear in screw pump stator and rotor friction pairs, enhance the wear performance of their surfaces, and extend the service life of screw pumps.

2. Model Analysis

2.1. Geometric Model of the Screw Pump Stator Surface Texture

The scale structure on the surface of snakes exhibits strong wear resistance, effectively reducing the friction caused by external objects on the skin. In this study, the surface texture pattern of snakeskin was selected to design the surface texture. Figure 2a shows the rhombus rattlesnake skin texture and bionic texture profiles. Figure 2b shows a schematic diagram of the friction pair of a screw pump metal rotor and rubber stator, Figure 2c presents the axial cross section of an electric submersible screw pump, and Figure 2d provides a schematic diagram of a rhombus-like micro-texture unit and its cross section on the surface of a rubber stator. The rhombus-like texture is centered within the texture unit, which has a side length (L) of 1 mm. The rhombus-like dimple-textured unit has long axes a and c and short axes b, h and α, which represent the depth and the long-side angle of the texture unit, respectively. β, h0, and u are, respectively, the angle between the center axis of the texture and the x-direction axis of its unit, the oil film gap (equal to 20 μm), and the flow velocity of the extracted fluid in the screw pump. The area rate (Sp) of the rhombus-like texture is expressed as follows:
S p = S t S × 100 %
where St is the area of the rhombus-like texture (m2), and S is the area of the texture unit (m2).

2.2. Theoretical Model for the Numerical Simulation

The actual well fluid from a shale oil well delivered by an oil recovery screw pump is considered an incompressible Newtonian fluid. Its density and viscosity were kept constant in the simulation. The calculation process only considered the impact of inertial forces while disregarding the temperature effects. The fluid dynamics calculation method based on N–S equations was used. The momentum and continuity equations were as follows [44]:
( ρ u ) t + div ( ρ η u ) = τ x x x + τ y x y + τ z x z p x + F x
( ρ v ) t + div ( ρ η v ) = τ x y x + τ y y y + τ z y z p y + F y
( ρ w ) t + div ( ρ η w ) = τ x z x + τ y z y + τ z z z p z + F z
u x + v y + w z = 0
where ρ is the density of the actual well fluid of a shale oil well (kg/m3); t is time (s); u, v, and w are the components of fluid velocity in the three directions of x, y, and z, respectively (m/s); η is the kinetic viscosity of the crude oil medium (Pa·s); τxx, τxy, and τxz are the viscous action τ in the respective directions of the components; p is the pressure of the oil film (Pa); and Fx, Fy, and Fz are the components of the volume force of the crude oil medium in the x, y, and z directions (N).
The dynamic pressure lubrication performance was described by the oil film carrying capacity and the friction force between the stator and rotor friction pairs of the screw pump. The carrying capacity of the oil film can be determined by integrating the oil film pressure, which is expressed as follows [34]:
F z = p ( x , y ) d s
The friction force of the oil film between the stator and rotor friction pairs of the screw pump can be determined by integrating the viscous shear force, which is expressed as follows:
F x = τ ( x , y ) d s
where p(x,y) is the static pressure distribution function, and τ(x,y) is the shear stress distribution function.
The friction coefficient between the stator and rotor friction pair of the screw pump is the ratio of the friction force to the bearing capacity:
f = F z / F x
Figure 3 shows the single screw pump rotor movement trajectory diagram based on Equations (9)–(11), which can be calculated using the screw pump stator–rotor friction pair between the point of engagement point speed (vx1 and vy1), the line engagement point speed v′ (vx1 and vy1), and the maximum speed of the engagement point vmax and minimum speed vmin [45]:
ν x 1 = R ω 2 e ω sin ω t 1 ν y 1 = R ω 2 e ω sin ω t 1
ν x 1 = R ω ν y 1 = R ω
ν max = R ω + 2 e ω ν min = R ω 2 e ω
where R is the radius of the semicircle (m), e is the eccentricity distance (m), ω is the angular velocity of the rotor (rad/s), and t1 is the rotation time of the rotor (s).

3. Numerical Simulation Method

3.1. Mesh Division and CFD Solution Settings

Fluent Meshing 2020 was employed to generate a polyhedral mesh for the computational fluid domain. The number of meshes can significantly affect the numerical results, and therefore, a mesh independence test was conducted. Based on the geometric complexity of the computational domain, an initial coarse mesh of 224,162 elements was first generated. To ensure mesh convergence, the mesh was systematically refined by a factor of 1.5 to 2 times the number of the previous mesh elements, resulting in subsequent mesh numbers of 327,679, 496,174, 810,470, 1,534,590, and 2,279,097. To verify mesh independence, the pressure distribution on the symmetrical axis of the texture-bearing surface was analyzed. As shown in Figure 4, it was evident that when the number of meshes exceeded 800,000, the numerical solution demonstrated high stability and convergence. Therefore, this study used an 800,000-element mesh for the calculations to ensure high accuracy and stability.
The 3D model was analyzed using the CFD software Fluent 2020. The pressure-based steady-state double precision solver was used. The turbulence model selected for this study was the k-epsilon model, as used in the study by Liu et al. [46,47]. The discrete equations were in second-order windward difference format, and the coupled algorithm was adopted for pressure–velocity coupling. In the fluid domain, the upper and lower walls were in the no-slip condition, the upper wall moved in the x-direction with a velocity (u) of 1.8 m/s, the lower wall was stationary, and inlet and outlet pressure boundary conditions were adopted. In the numerical calculation, the density of the actual well fluid in the shale oil well and the viscosity were equal to 870 kg/m3 and 0.08 Pa·s, respectively.

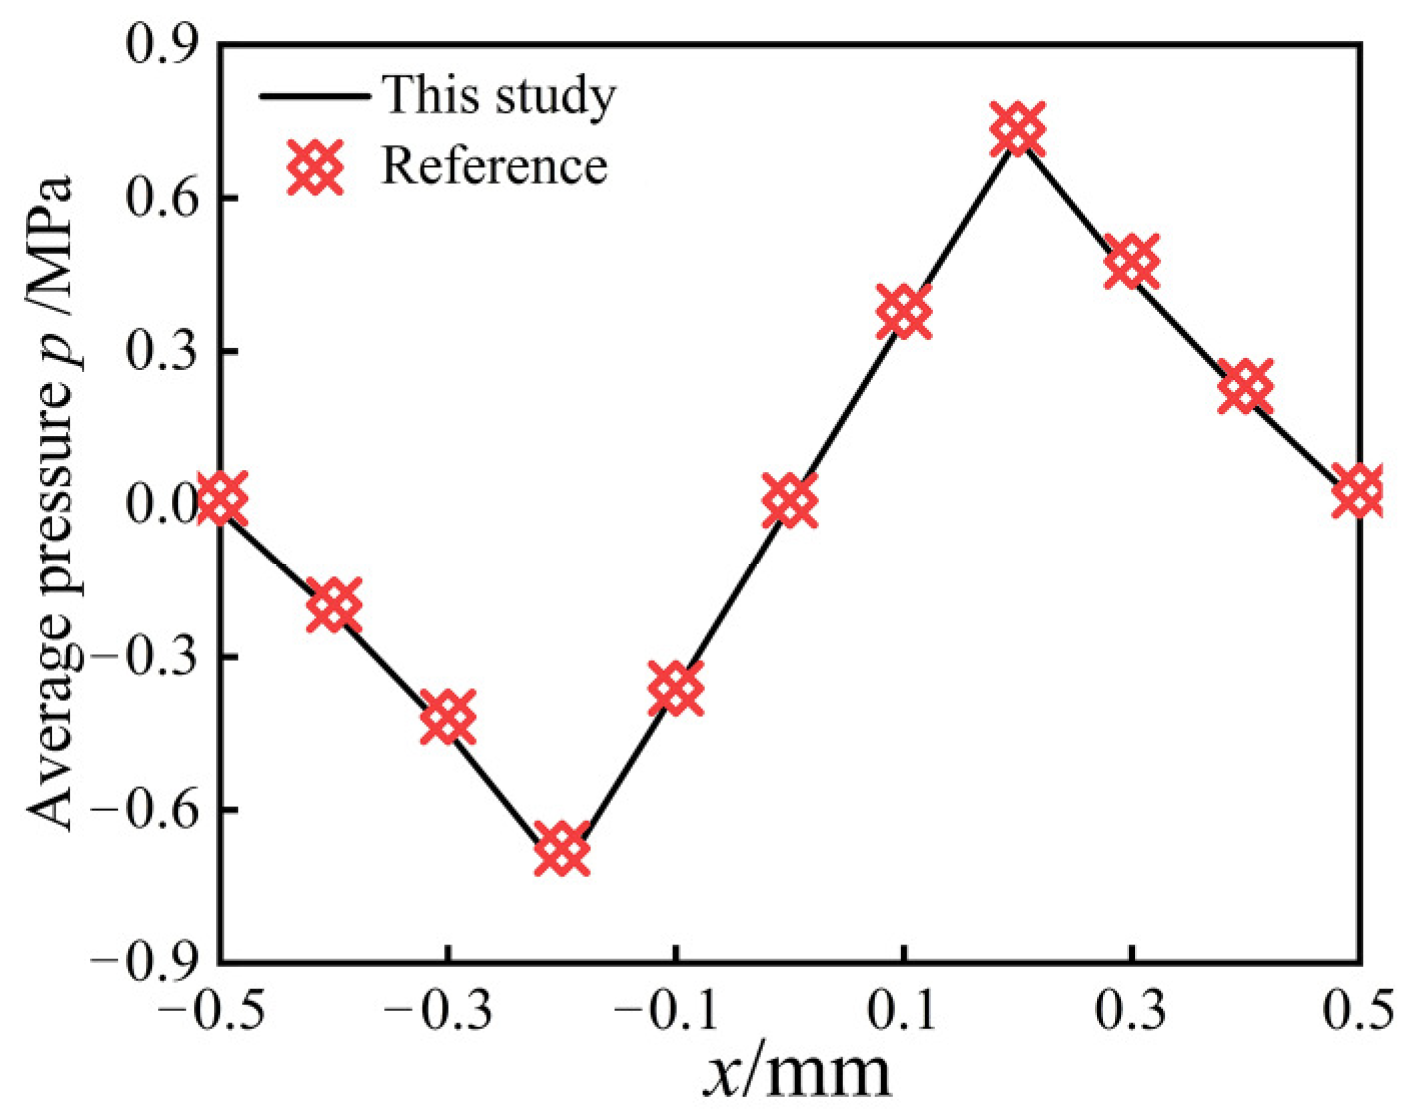
3.2. Validation of the Numerical Simulation Method

To verify the effectiveness of the numerical simulation method, the square dimple texture documented in reference [48] was numerically calculated by using the calculation method in this study. Figure 5 illustrates the fluid domain from reference [48]. The side length (l) of the fluid domain unit, side length (a) of the square texture, depth (h1), oil film thickness (h2), moving speed (u0), lubricating oil density, and viscosity were equal to 1 mm, 400 μm, 10 μm, 50 μm, 6 m/s, 891 kg/m3, and 0.098 Pa·s, respectively. The pressure data of the center line of the wall on the fluid domain were extracted, and the results obtained by the proposed approach were compared with those from reference [48]. This comparison is illustrated in Figure 6. It can be seen that the two approaches have consistent results [48], which verifies that the proposed numerical calculation method has high accuracy.

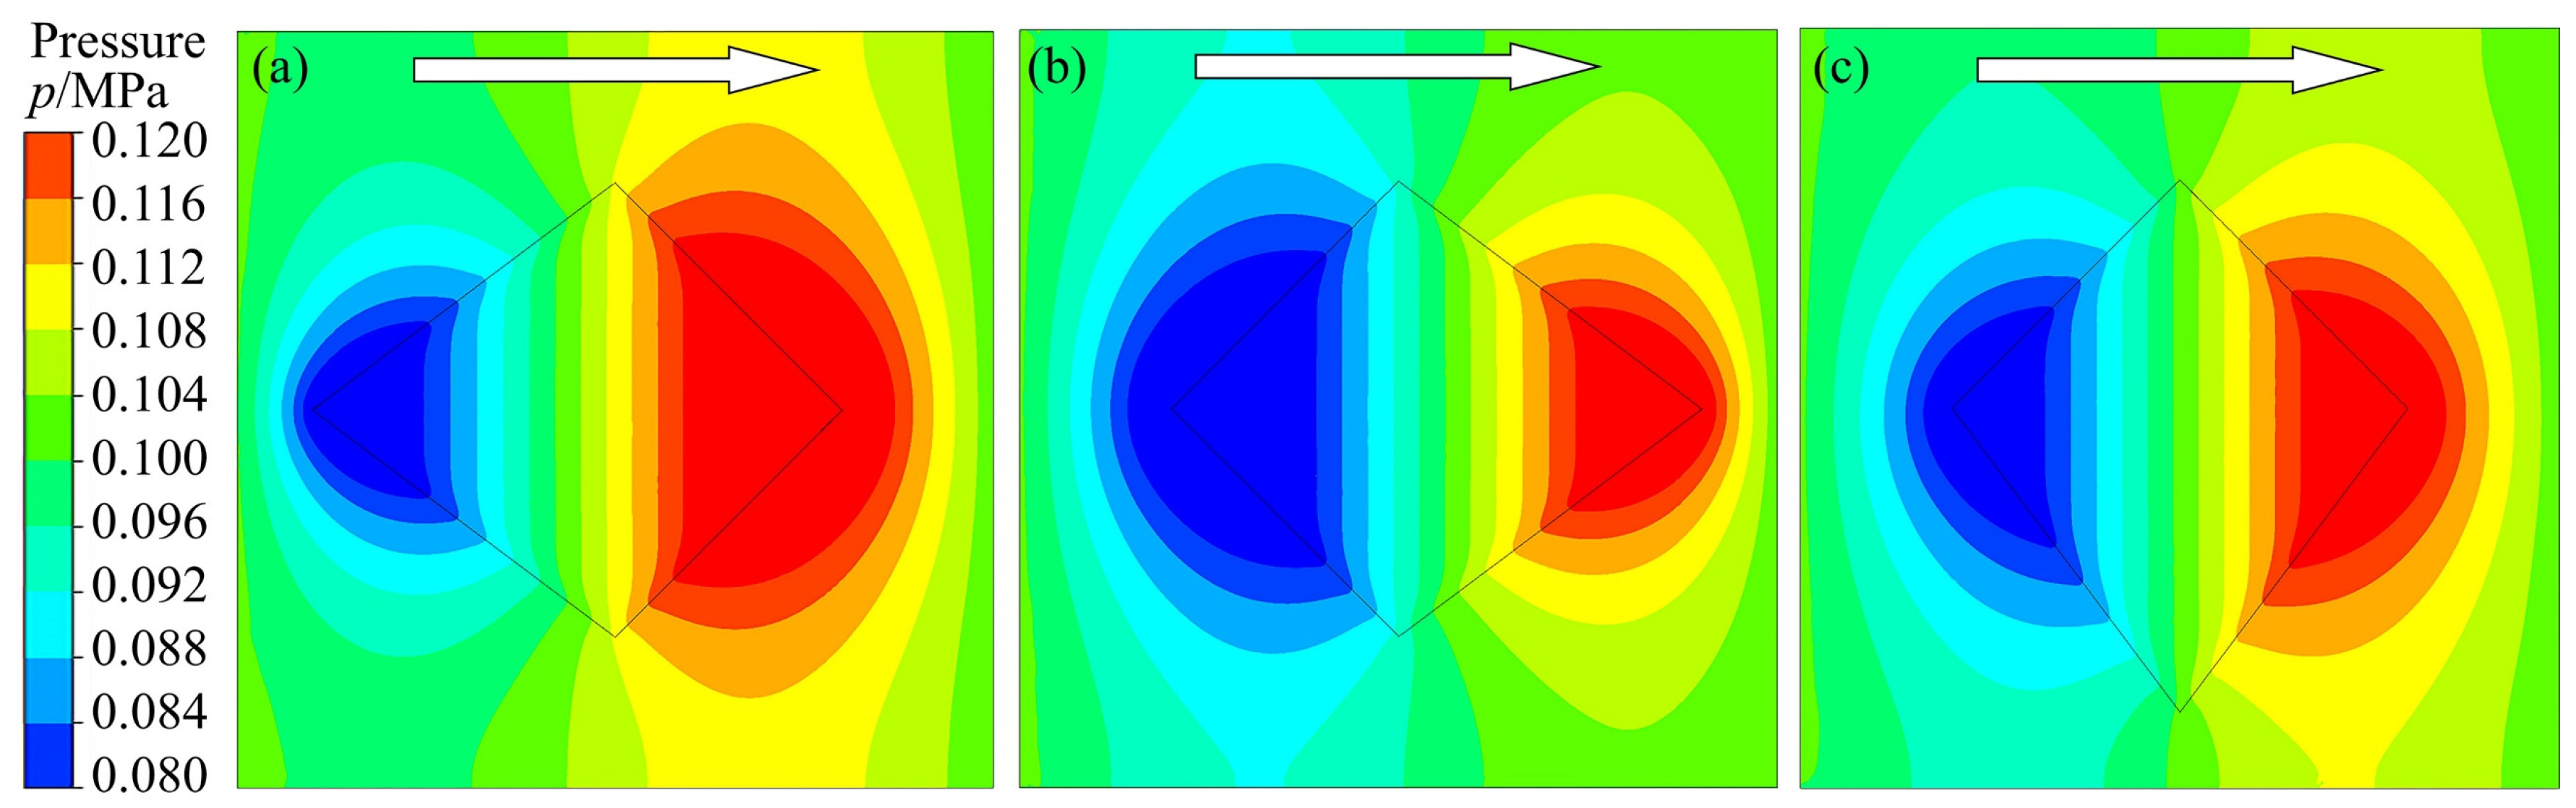
3.3. Determination of the Flow Direction of the Medium

The fixed texture long axes a and c were 400 μm and 300 μm, respectively. The short axis b and depth h were 300 μm and 50 μm, respectively. The angle β between the central axis of the texture and the x-direction axis of the texture unit was set to 0. When the flow direction of the medium was along the x, −x, and y axes, the pressure of the texture-carrying surface was analyzed. The obtained results are shown in Figure 7. The results demonstrated that the inflow direction of the medium significantly affected the pressure distribution on the carrying surface. When the flow direction of the medium was x and y, the area of the negative pressure zone of the bearing surface was smaller than that of the positive pressure zone. On the contrary, when the flow direction was −x, the area of the negative pressure zone was larger than that of the positive pressure zone, which indicated variations in net pressure and dynamic pressure lubrication performance generated by the texture. Therefore, determining the flow direction of the medium was essential.
Table 1 presents the carrying capacity and friction coefficients for different flow directions. When the flow direction of the medium was following x, the maximum friction coefficient of the oil film bearing capacity was the smallest. In contrast, when the flow direction followed −x, the maximum friction coefficient of the oil film bearing capacity reached its largest value. The friction coefficients for the three flow directions were all lower than that of the non-textured surface (0.077), which demonstrated the high anti-wear performance of the textured surface.

4. Analysis of the Numerical Simulation Results

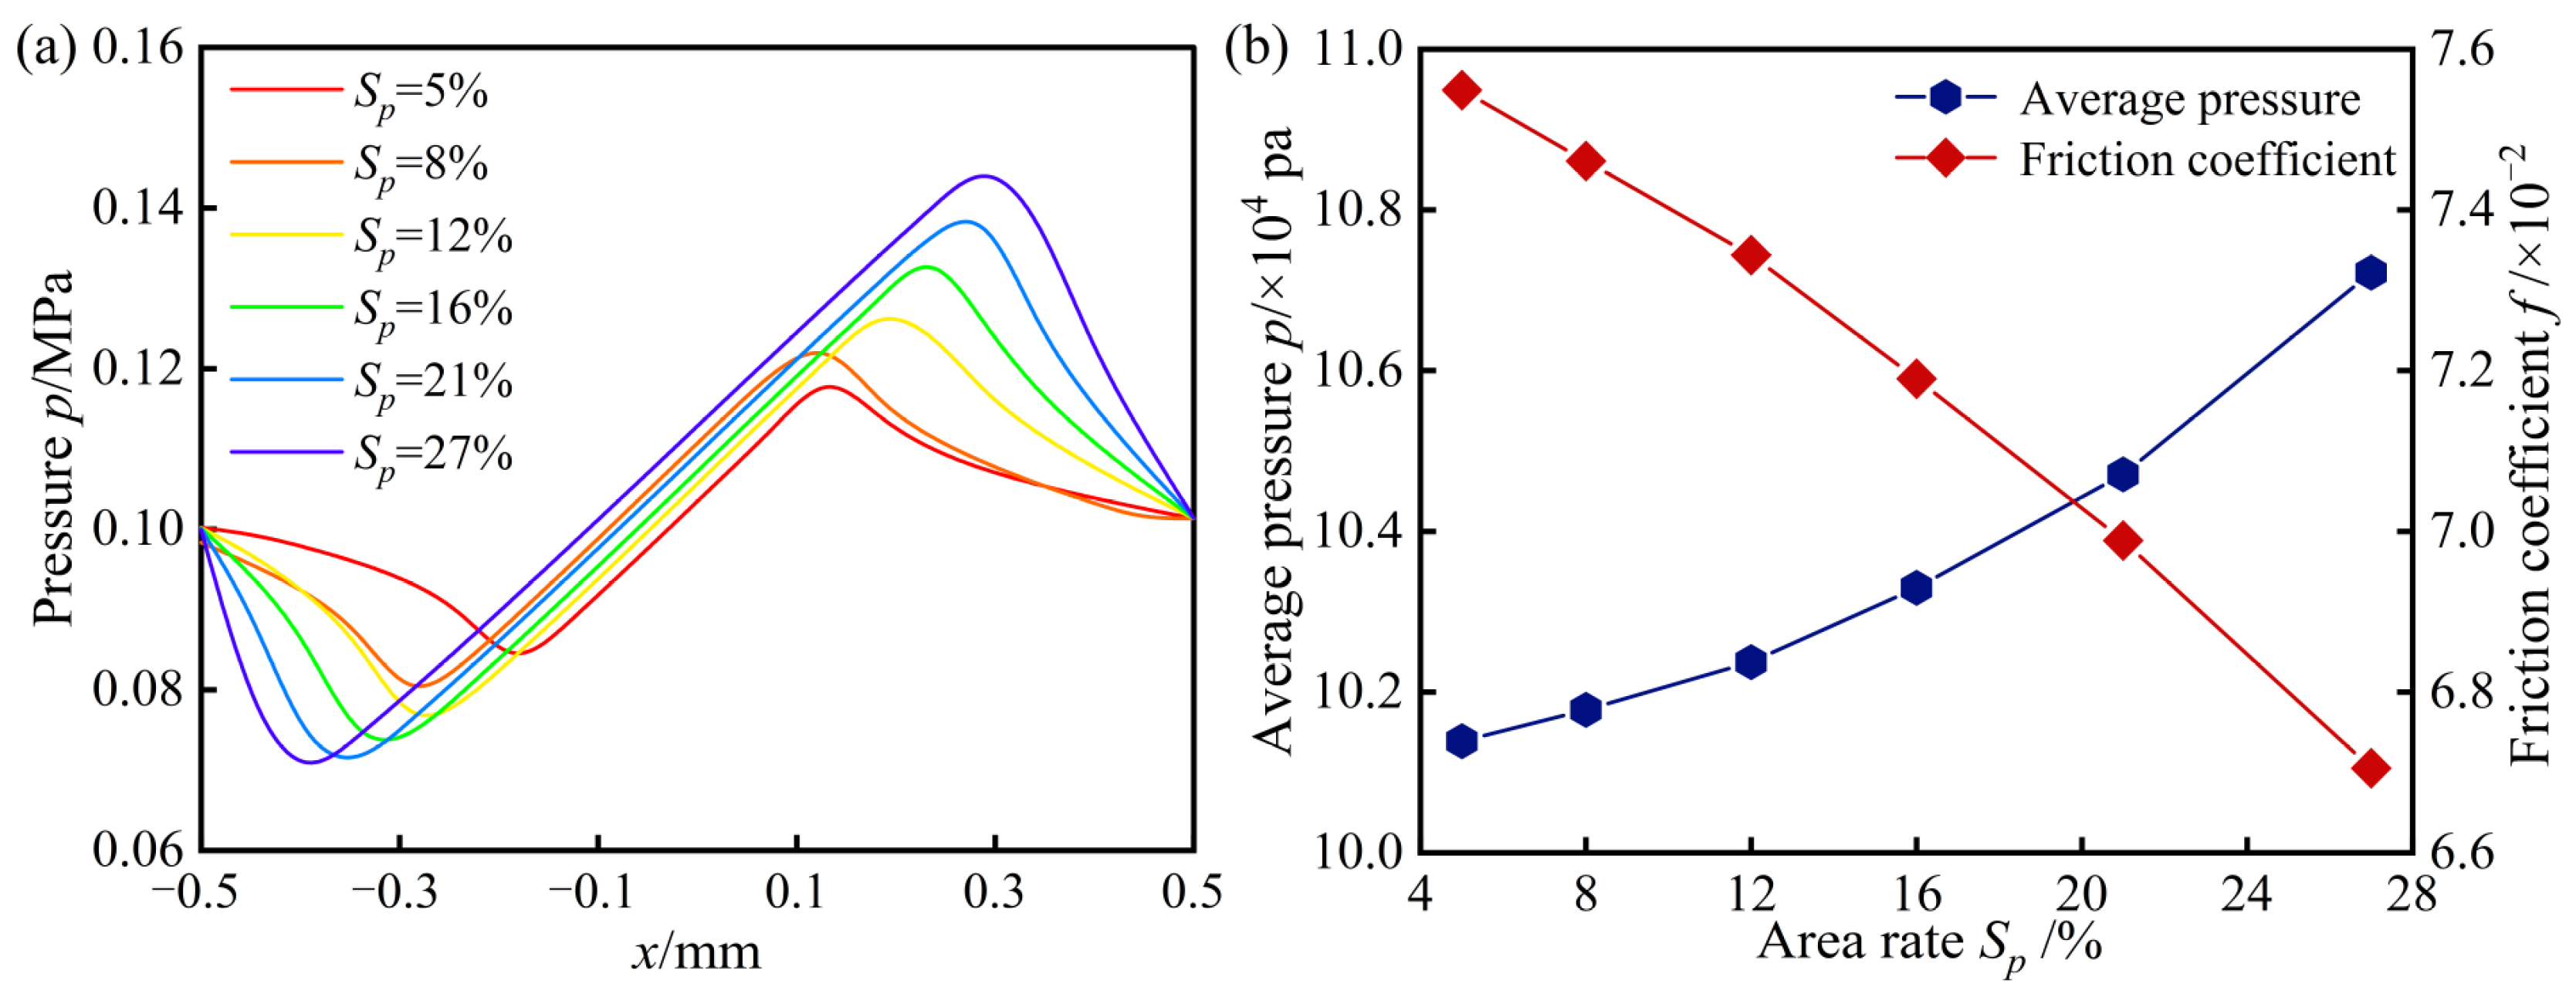
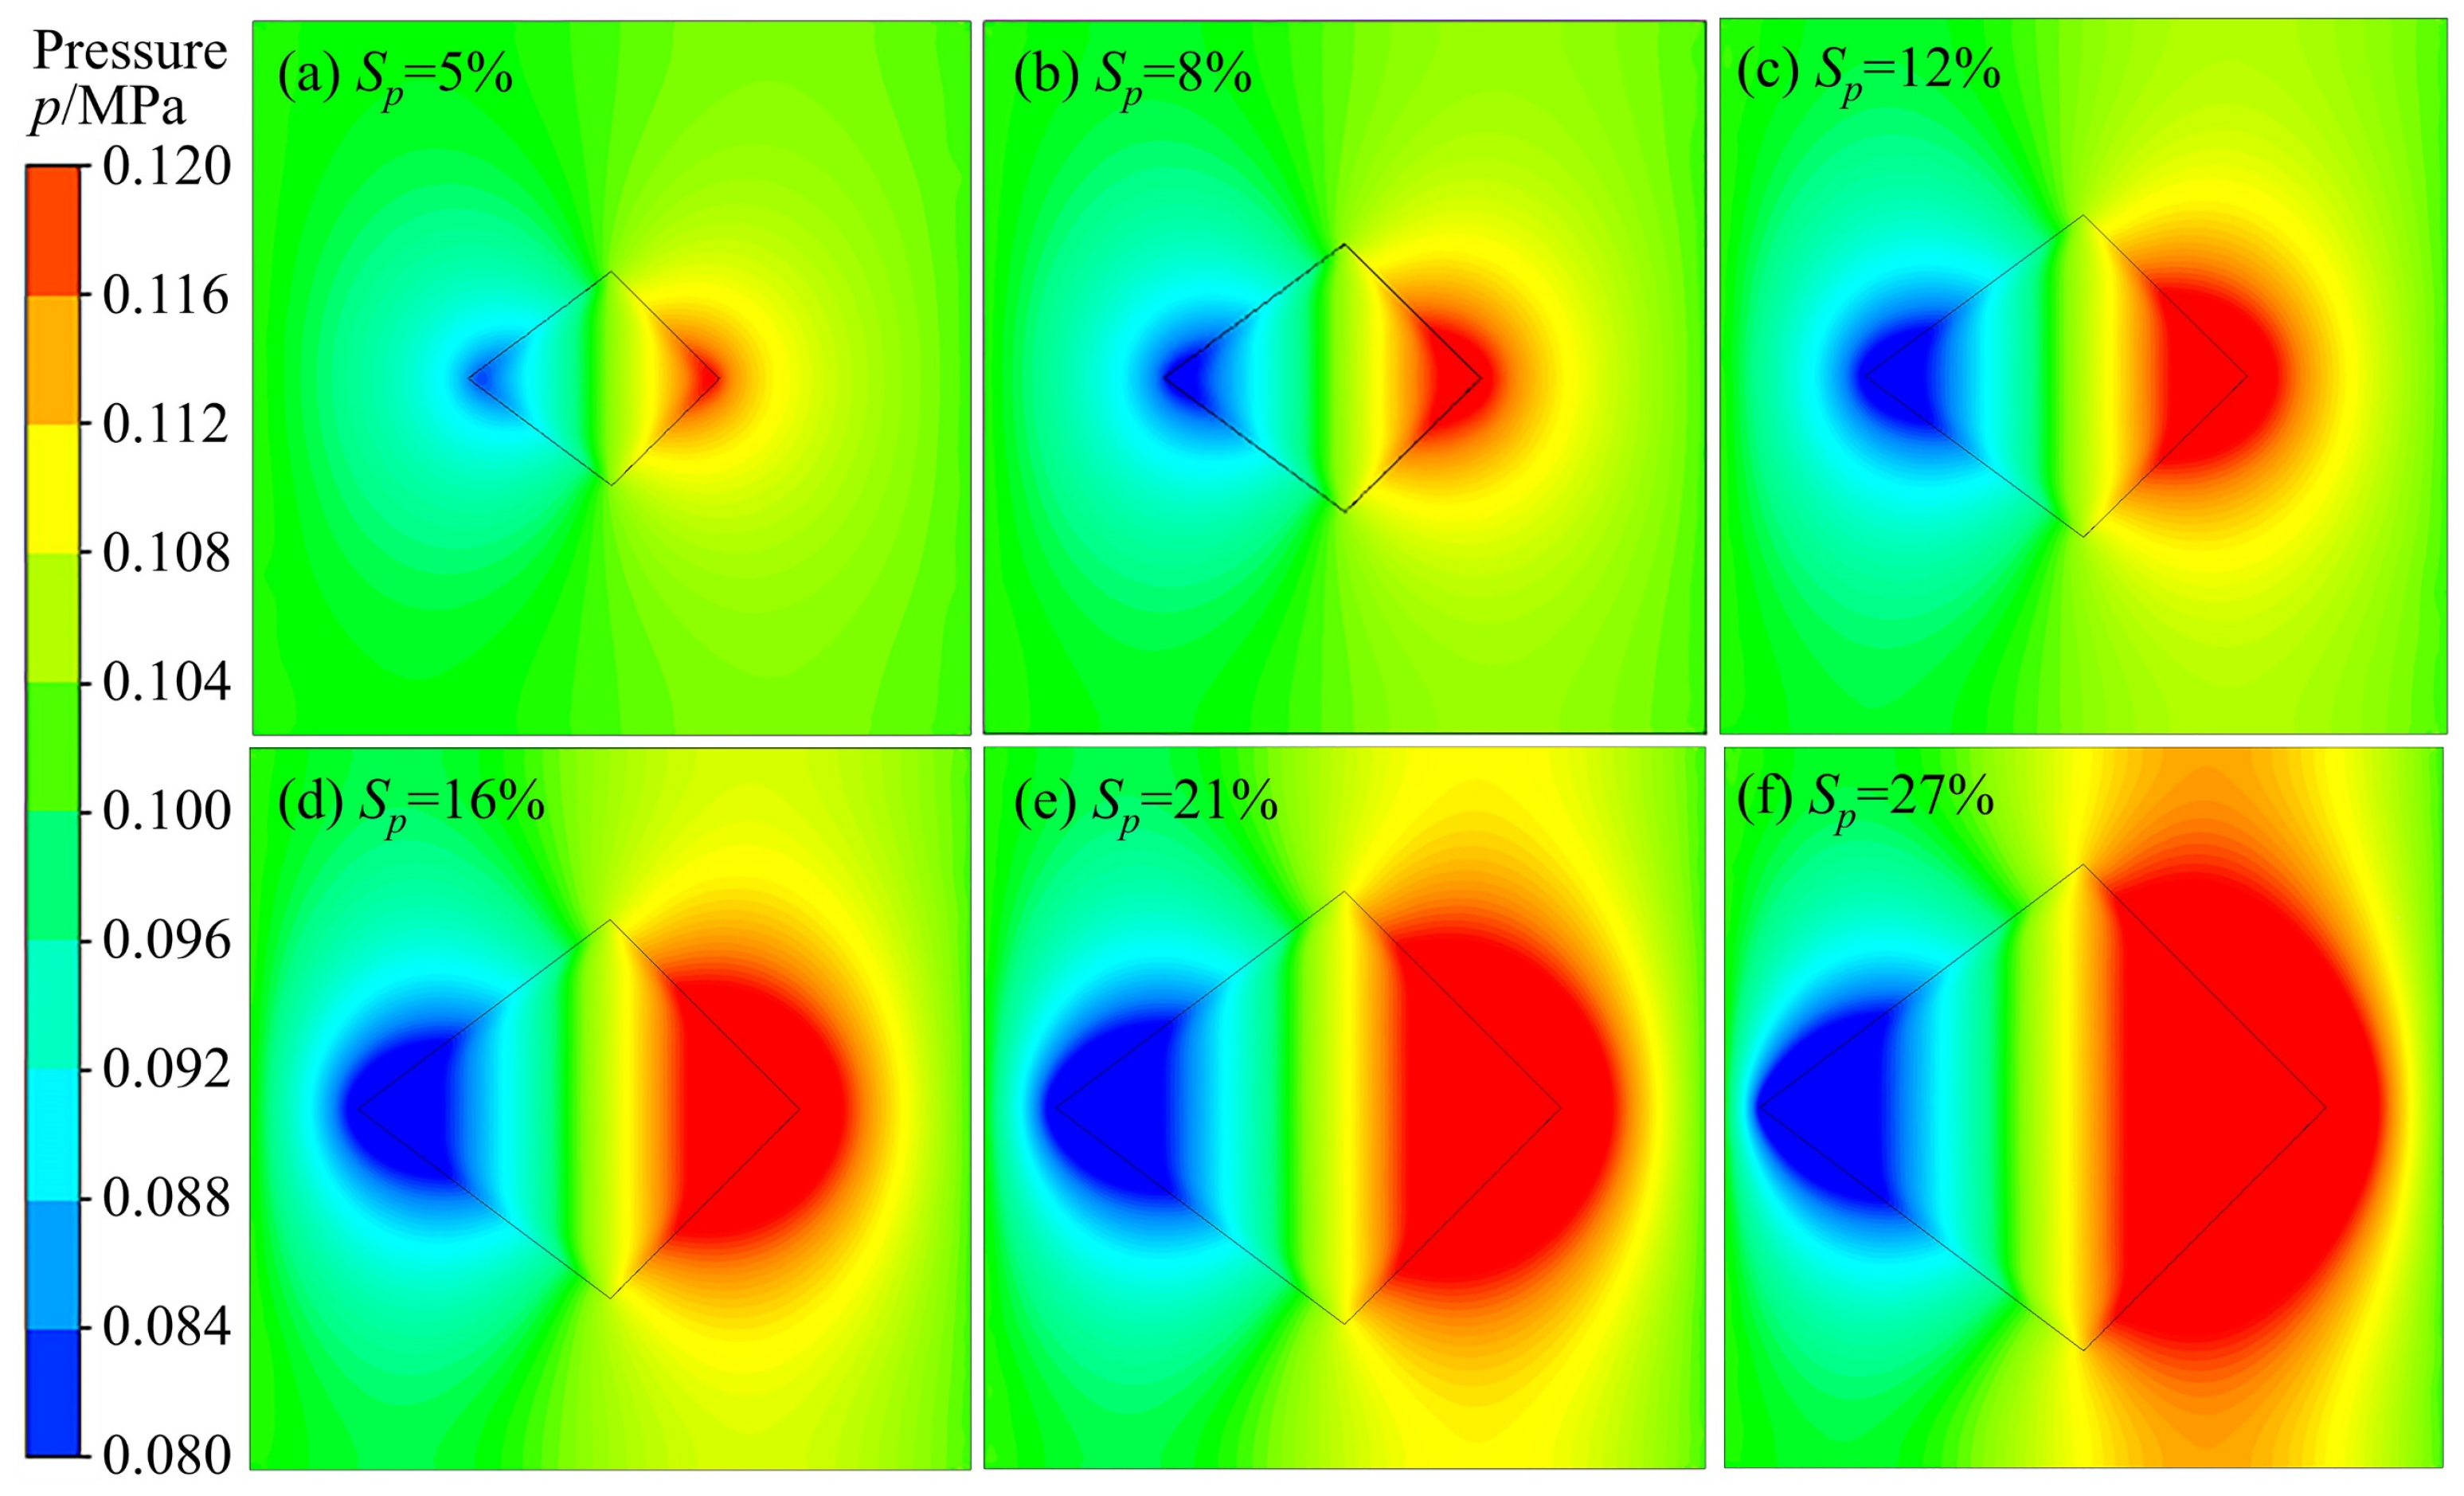
4.1. The Effect of the Texture Area Rate of Rhombus-like Micro-Dimples on the Surface Lubrication Performance of Screw Pump Stator and Rotor Friction Pairs

To analyze the effect of the texture area rate on the surface lubrication performance of the friction pair surface, texture depth h was set to 50 μm, angle β between the texture center axis and the x-direction axis of the unit body was set to 0, and the ratio of the texture long axes a and c and the short axis b was fixed. The rhombus-like micro-dimple texture was selected for numerical calculation at area rates Sp of 5%, 8%, 12%, 16%, 21%, and 27%. Figure 8a shows the pressure distribution at the center axis of the carrying surface of the texture under different texture area rates. It can be seen that the pressure distribution followed the same trend for the different texture area rates. More precisely, it started as negative and then became positive, which indicated that the studied rhombus-like micro-dimple texture effectively generated a dynamic pressure lubrication effect. Figure 8b shows the surface friction coefficient and average pressure change curves under different texture area rates. When the texture area rate increased, the surface friction coefficient decreased, while the average pressure increased. When the texture area rate Sp was 27%, the friction coefficient reached its minimum value and the average pressure reached its maximum value, demonstrating an optimal lubrication performance.
Figure 9 presents the oil film surface pressure distribution cloud diagrams at different texture area rates. It can be observed that a negative pressure region formed at the angle of the long side of the rhombus-like dimple texture, while a positive pressure region appeared at the angle of the short side. The area of positive pressure was larger than that of negative pressure, enhancing the hydrodynamic lubrication. When the texture area rate increased, the positive and negative pressure areas were expanded. When the texture area rate Sp was 27%, the difference between the positive and negative pressure areas reached its maximum value, yielding the best lubrication performance. This was because the increase in the texture area rate could make the stator and rotor friction pairs of the screw pump store more actual well fluids from shale oil wells, which affected the lubrication performance of the friction pairs and decreased the friction coefficient [49].

4.2. The Effect of the Texture Depth of Rhombus-like Micro-Dimples on the Surface Lubrication Performance of Screw Pump Stator and Rotor Friction Pairs

To analyze the effect of the texture depth on the surface lubrication performance of the friction pair, angle β between the central axis of the texture and the x-axis of the unit body was set to 0, and the texture area rate Sp was fixed at 27%. Numerical calculations were performed on rhombus-like micro-dimple textures at depths of 10, 20, 30, 40, 50, 60, 70, 80, and 90 μm. Figure 10a shows the pressure distribution at the center axis of the carrying surface for different texture depths. It can be seen that the amplitude of the maximum and minimum pressures reached its maximum value at a texture depth h of 20 μm and that the center axis gradually decreased when the texture depth h was greater than 20 μm. Figure 10b shows the surface friction coefficient and average pressure change curves at different texture depths. When the texture depth increased, the surface friction coefficient initially decreased and then increased, while the average pressure first increased and then decreased. When the texture depth h was 20 μm, the friction coefficient was minimized and the average pressure was maximized, resulting in optimal lubrication performance. The effects were attributed to the transition from the hydrodynamic lubrication effect in the texture to the mixed lubrication mechanism. When the texture depth was less than 20 μm, hydrodynamic lubrication dominated, resulting in a decrease in the friction coefficient and an increase in the bearing capacity. However, when the texture depth exceeded 20 μm, fluid resistance increased, leading to higher energy consumption and an increase in the friction coefficient.
Figure 11 shows the pressure distribution on the oil film bearing surface at different texture depths. It can be observed that as the texture depth increased, the areas of both the positive and negative pressure regions increased first and then decreased. When the texture depth exceeded 50 μm, the hydrodynamic lubrication effect in the inlet and outlet regions of the texture diminished. This might be attributed to the texture depth being too large, the velocity gradient decreased, and the extracted fluid at the bottom of the texture unable to provide a support force in time [39]. The difference between the positive and negative pressure regions was at its largest when the texture depth h was 20 μm, which indicated that the surface lubrication performance was optimal at this depth.
Figure 12 illustrates the distribution of flow traces within the rhombus-like micro-dimple structure at varying texture depths. When the texture depth increased, the distribution of flow traces significantly changed. The vortex phenomenon started to appear inside the structure when the texture depth h was 30 μm. In general, the vortex phenomenon inside the structure was gradually strengthened when the texture depth h was more than 30 μm. Due to the vortex phenomenon inside the texture, when its depth increased, the amplitude of its pressure gradually decreased. When the texture depth was large, part of the kinetic energy generated by the oil film bearing surface was converted into the energy of the vortex inside the texture, which resulted in energy loss. In addition, the texture used to generate the dynamic pressure lubrication effect was weakened, and the surface lubrication performance was decreased [50]. Theoretically, the increase in the texture depth allowed the storage capacity of the extracted fluid in the screw pump to increase. However, the vortices generated within the texture decreased this storage capacity, which negatively affected the lubrication performance. Therefore, the texture depth should not exceed a certain limit. More precisely, it should approach the thickness of the oil film between the stator and rotor of the screw pump to reach optimal lubrication performance with the rhombus-like texture.

4.3. The Effect of the Rhombus-like Micro-Dimple Texture Shape on the Surface Lubrication Performance of Screw Pump Stator and Rotor Friction Pairs

When the long axes a and c of the rhombus-like dimple structure were constant, the variation in the ratio of the long axis a and the short axis b of the structure changed angle α between the long sides of the rhombus-like micro-dimple structure, leading to a variation in its shape. To analyze the effect of the texture shape on the surface lubrication performance of the friction surface, numerical calculations were performed for rhombus-like micro-dimple textures with long-side angles α of 48.5, 51.5, 55, 59, 63, 68, and 74°, while the texture area rate Sp, texture depth h, and angle β of the texture center axis and the x-direction axis of the texture unit were fixed at 27%, 20 μm, 0°, and 0°, respectively. Figure 13 shows the variation curves of the surface friction coefficient and the average pressure for different long-side pinch angles. When the long-side angle of the texture increased, the surface friction coefficient decreased, while the average pressure increased. For a long-side angle α of 74°, the surface friction coefficient reached its minimum value and the average pressure reached its maximum value, which indicated optimal lubrication performance. This was due to the variation in the angle between the long sides of the texture, which altered the texture geometry. This variation subsequently resulted in significant modification of the pressure distribution within the flow field.
Figure 14 shows the pressure distribution cloud diagrams for different long-side angles on the friction surface. It can be observed that when the long-side angle of the texture increased, the area of positive pressure gradually decreased while that of negative pressure increased, which resulted in reduced net pressure on the texture structure and a diminished dynamic pressure lubrication effect. For a rhombus-like micro-dimple-textured structure with a long-side angle α of 74°, the difference between the positive and negative pressure areas was maximized, which indicated the best lubrication performance. This was attributed to the reduction in the long-side angle, which increased the short-side angle of the texture structure, leading to an increase in the wedge-convergence angle that generates the dynamic pressure lubrication effect. The narrowing area of the positive pressure zone decreased, and the widening area of the negative pressure zone increased, resulting in a decrease in net pressure. This change negatively affected the lubrication performance of the friction surface.

4.4. The Effect of the Rhombus-like Micro-Dimple Texture Angle on the Surface Lubrication Performance of Screw Pump Stator and Rotor Friction Pairs

To further analyze the effect of texture angle β on the surface lubrication performance of the friction surface, the texture area rate Sp, texture depth h, and angle α of the long side were, respectively, fixed at 27%, 20 μm, and 74°. Numerical calculations were carried out for the rhombus-like micro-dimple with angles β of the texture center axis and the x-direction axis of the unit body as 0, 15, 30, 45, 60, and 75°. Figure 15 shows the curves of the surface friction coefficient and the average pressure for the texture structure under different angle conditions. When the angle between the texture structure center axis and the x-direction axis of the unit body increased, the surface friction coefficient increased, the average pressure decreased, the surface friction coefficient of the texture friction surface was the smallest, and the average pressure was the largest. In addition, the lubrication performance was the best when angle β between the center axis of the texture structure and the x-direction axis of the unit body was 0°.
Figure 16 illustrates the pressure distribution cloud diagrams for the friction surface under different angle conditions. It is evident that when the angle between the texture structure center axis and the x-direction axis increased, the area of positive pressure gradually decreased while that of negative pressure increased. This demonstrates that the net pressure generated on the bearing surface of the texture structure was gradually reduced, which resulted in a diminishing dynamic pressure lubrication effect. When angle β exceeded 45°, the positive pressure area became smaller than the negative pressure area. This resulted in the low lubrication performance of the friction surface. Conversely, for β = 0°, the difference between the positive and negative pressure areas was maximized, leading to the best lubrication performance of the friction surface. The reason was that the variations in angle β between the texture center axis and the x-direction axis of the unit affected the flow path and pressure distribution of the fluid on the bearing surface. When β = 0°, fluid flow tended to establish a stable positive pressure region. However, when β increased, the fluid flow direction changed, resulting in a reduction in the positive pressure area and an expansion of the negative pressure area. As a result, the overall pressure distribution of the fluid was not conducive to the generation of a hydrodynamic lubrication effect, leading to a decrease in the lubrication performance.

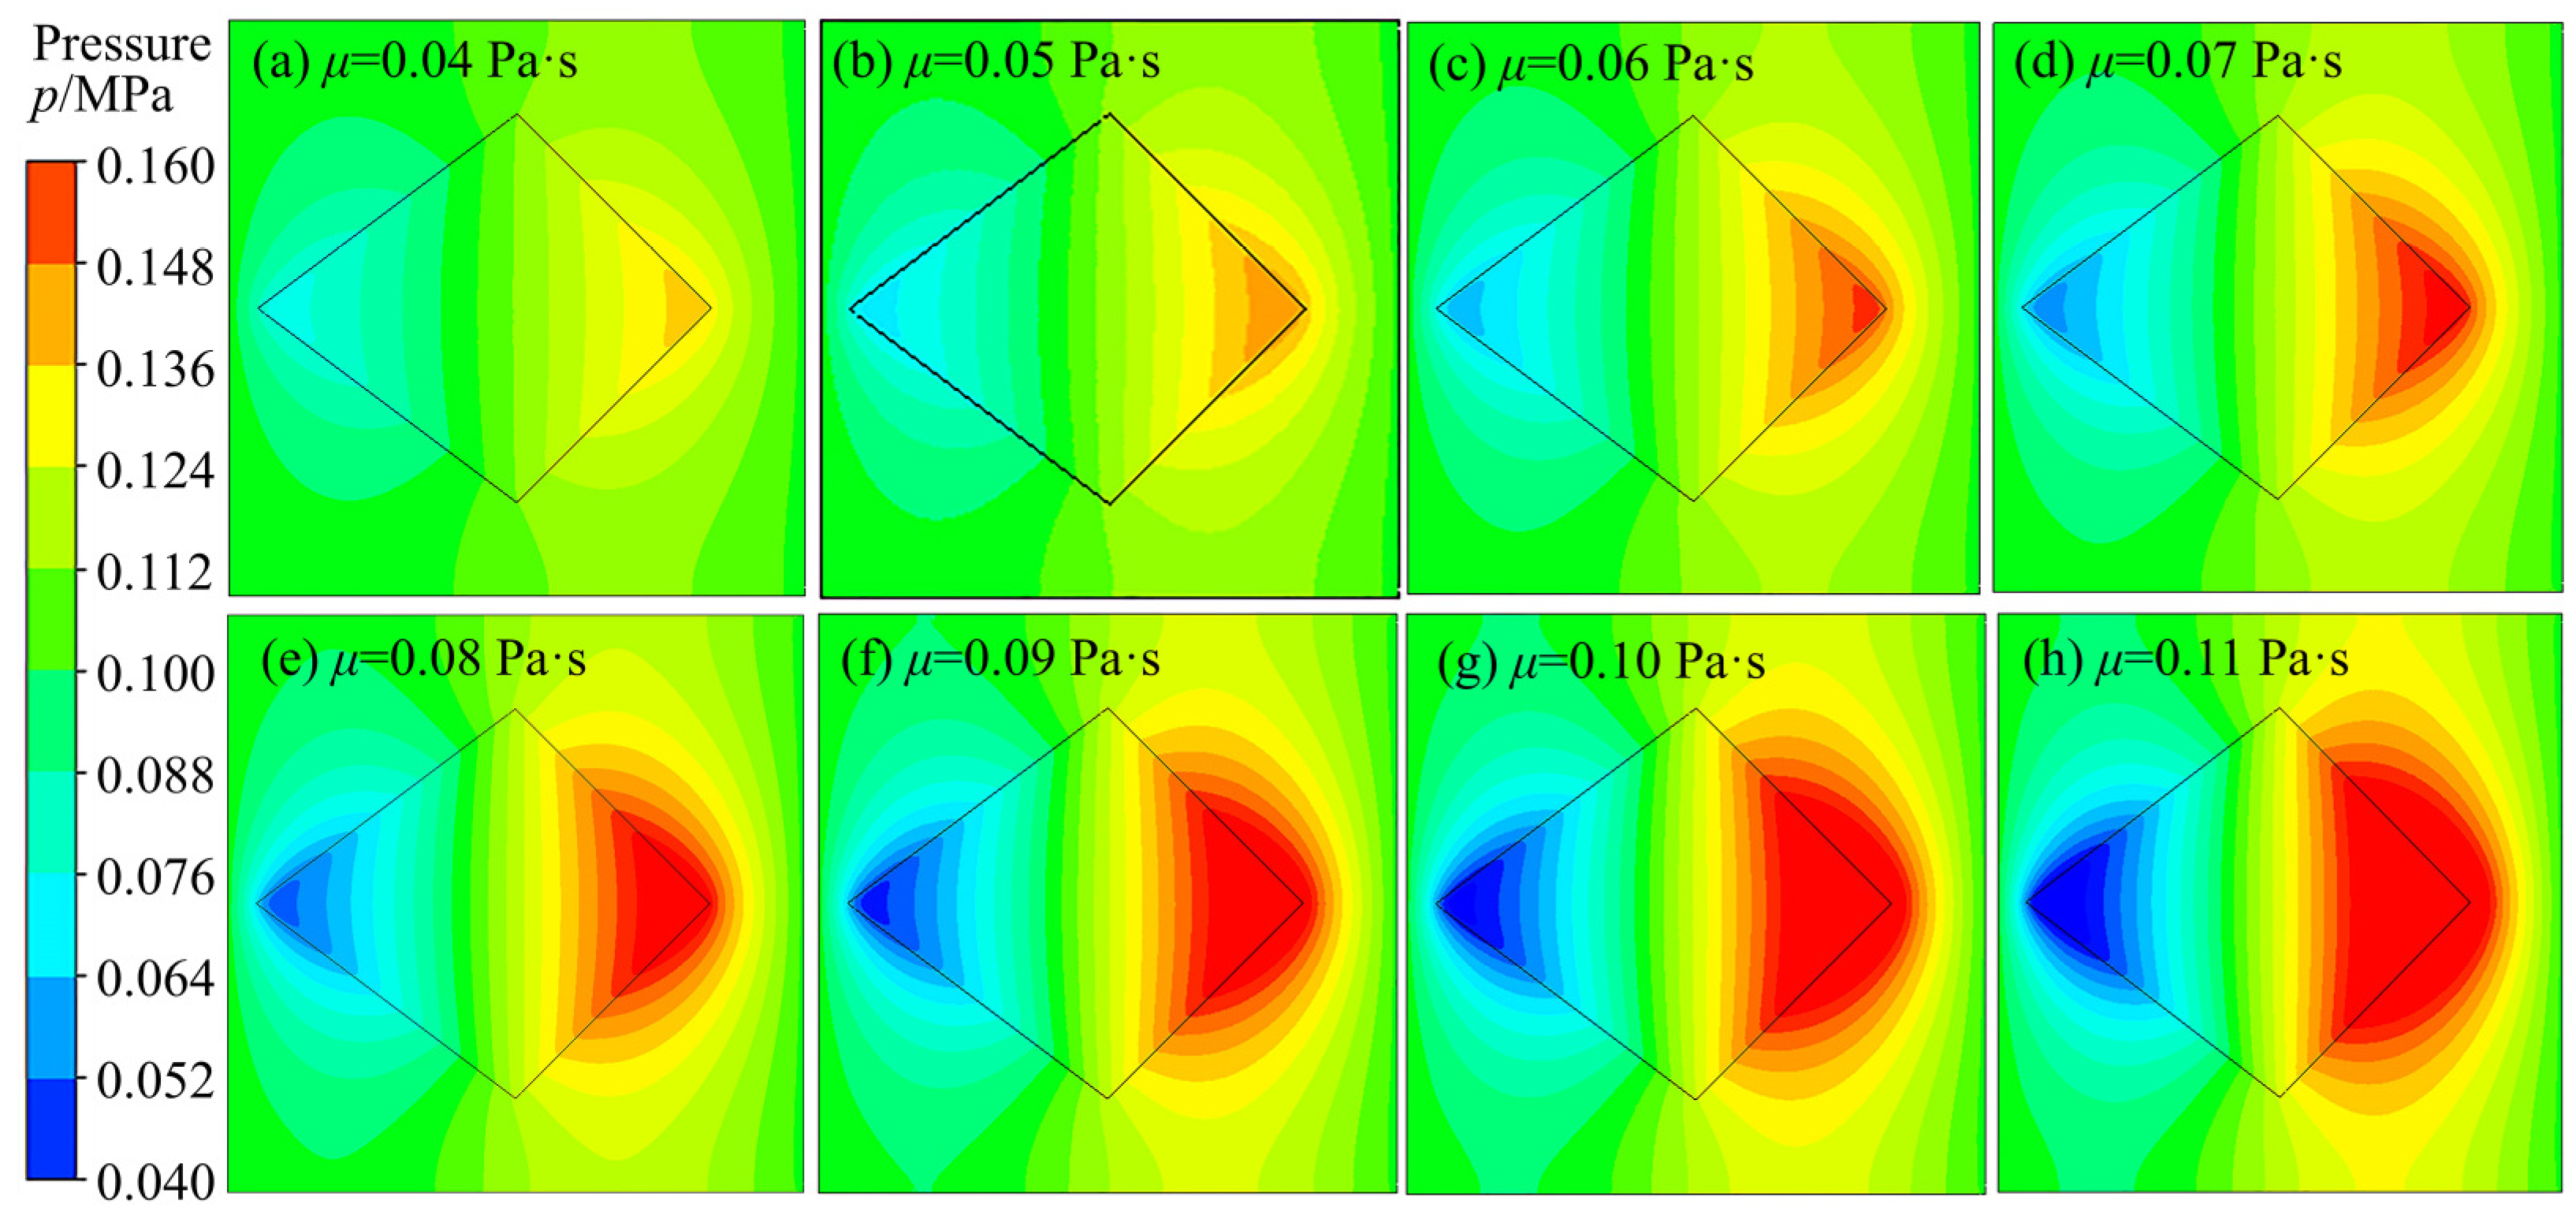
4.5. The Effect of the Actual Well Fluid Viscosity of Shale Oil on the Lubrication Performance of the Rhombus-like Micro-Dimple Texture

The change in viscosity significantly influenced the lubrication performance of the texture surface [51]. To analyze the effect of the actual well fluid viscosity on the texture lubrication performance, numerical calculations were conducted on the rhombus-like dimple texture with a fixed area rate of 27%, depth of 20 μm, long-edge angle of 74°, and an angle of 0° under different viscosity conditions. Figure 17 and Figure 18 illustrate the average pressure change of the textured surface and the pressure distribution of the bearing surface under different viscosities. The results indicated that as the viscosity of the actual well fluid increased, the average pressure on the texture surface and the bearing capacity also increased. From the pressure distribution, it was evident that both the positive and negative pressure regions were increased. Furthermore, with the increase in viscosity, the difference between the positive and negative pressure area grew larger, leading to higher net pressure generation and an enhanced dynamic pressure lubrication effect, consistent with the research results of Wang et al. [52]. This improvement could be attributed to the fact that higher viscosity facilitated oil film formation, strengthened the hydrodynamic lubrication effect, and, consequently, enhanced the bearing capacity.

5. Conclusions

This study established a finite element calculation model for stator and rotor friction pairs with rhombus-like dimple textures and investigated the influence of texture parameters on lubrication performance. The following conclusions can be drawn:
(1)
The geometrical parameters of the rhombus-like micro-dimple texture significantly affected the friction performance of the friction surfaces. When the texture area rate increased, the dynamic pressure lubrication performance of the friction pairs significantly increased. When the area rate increased, the lubricant reservoir within the texture expanded, which resulted in a decrease in the oil film friction coefficient and an increase in the average pressure and net load carrying capacity. The optimal lubrication effect was achieved at an area rate of 27%.
(2)
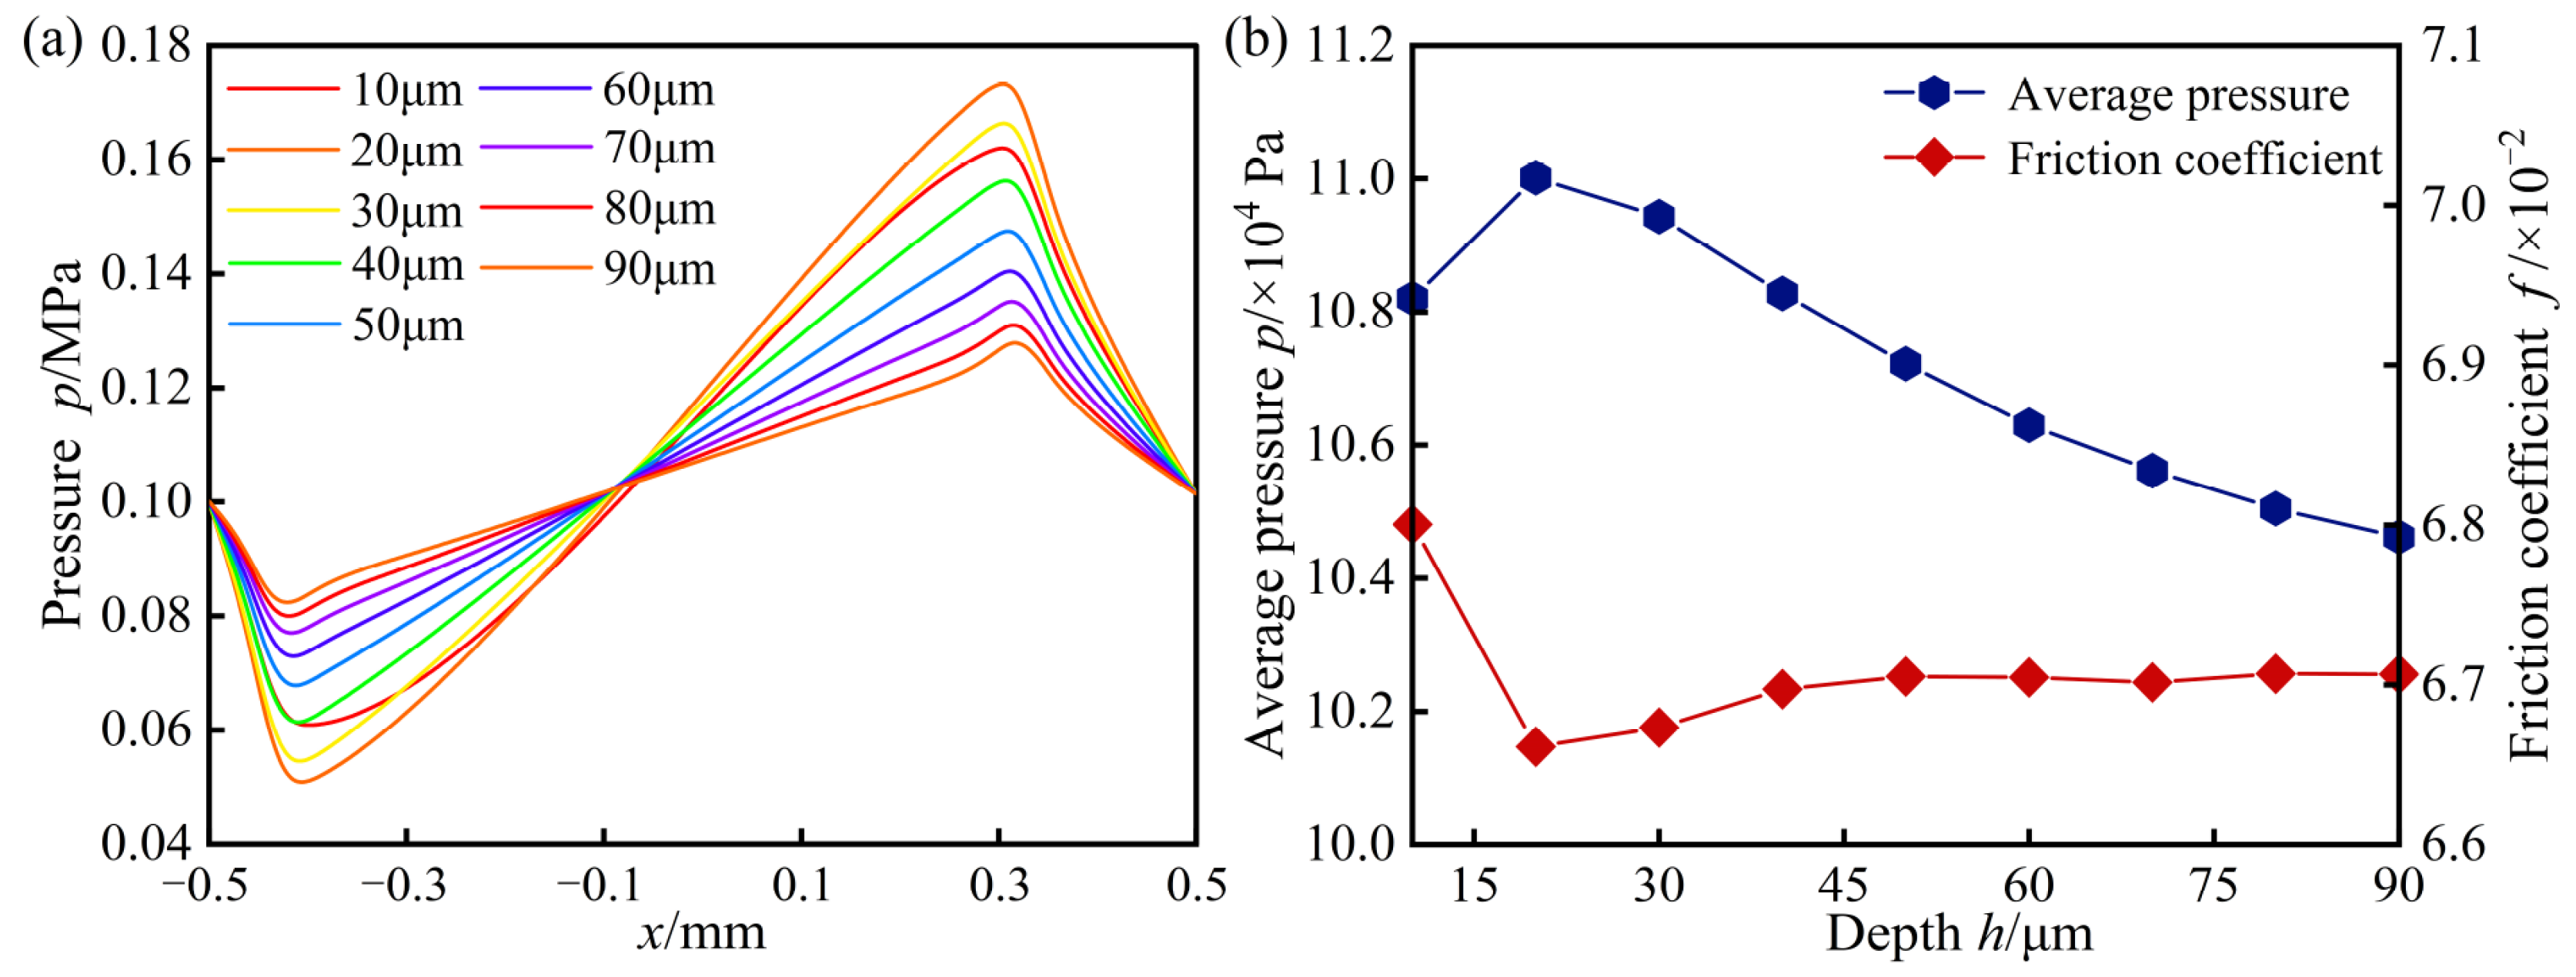
When the texture depth increased, the oil film friction coefficient first decreased and then increased, while the average pressure first increased and then decreased. When the depth became greater than 30 μm, vortices started to form inside the structure. The intensity of these vortices increased with the increase in depth, which resulted in a more significant decrease in the dynamic pressure lubrication performance. The best lubrication performance was observed when the depth was close to 20 μm, which corresponded to the thickness of the oil film between the stator and rotor of the screw pump.
(3)
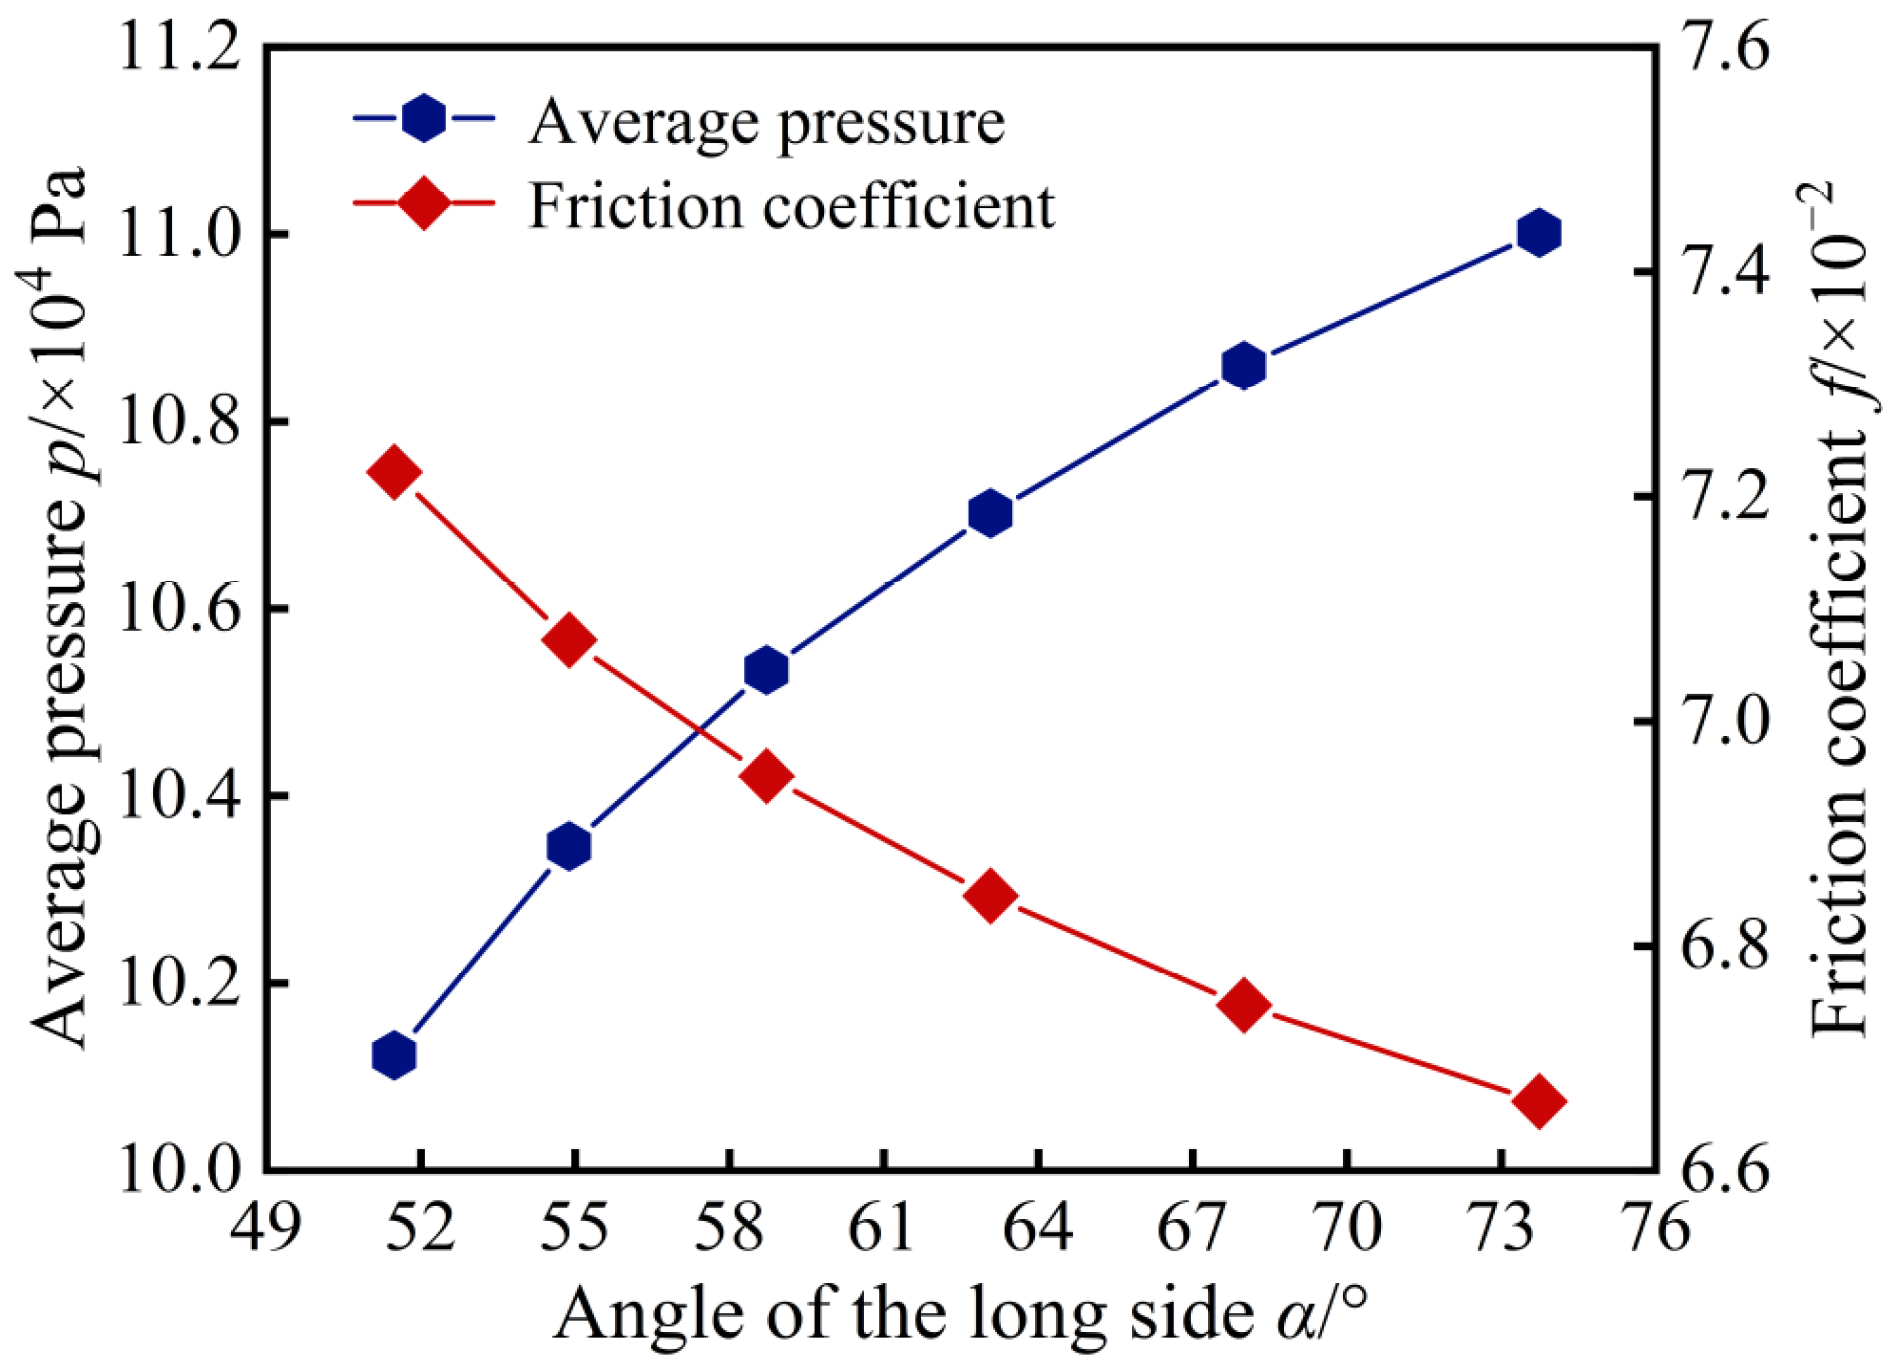
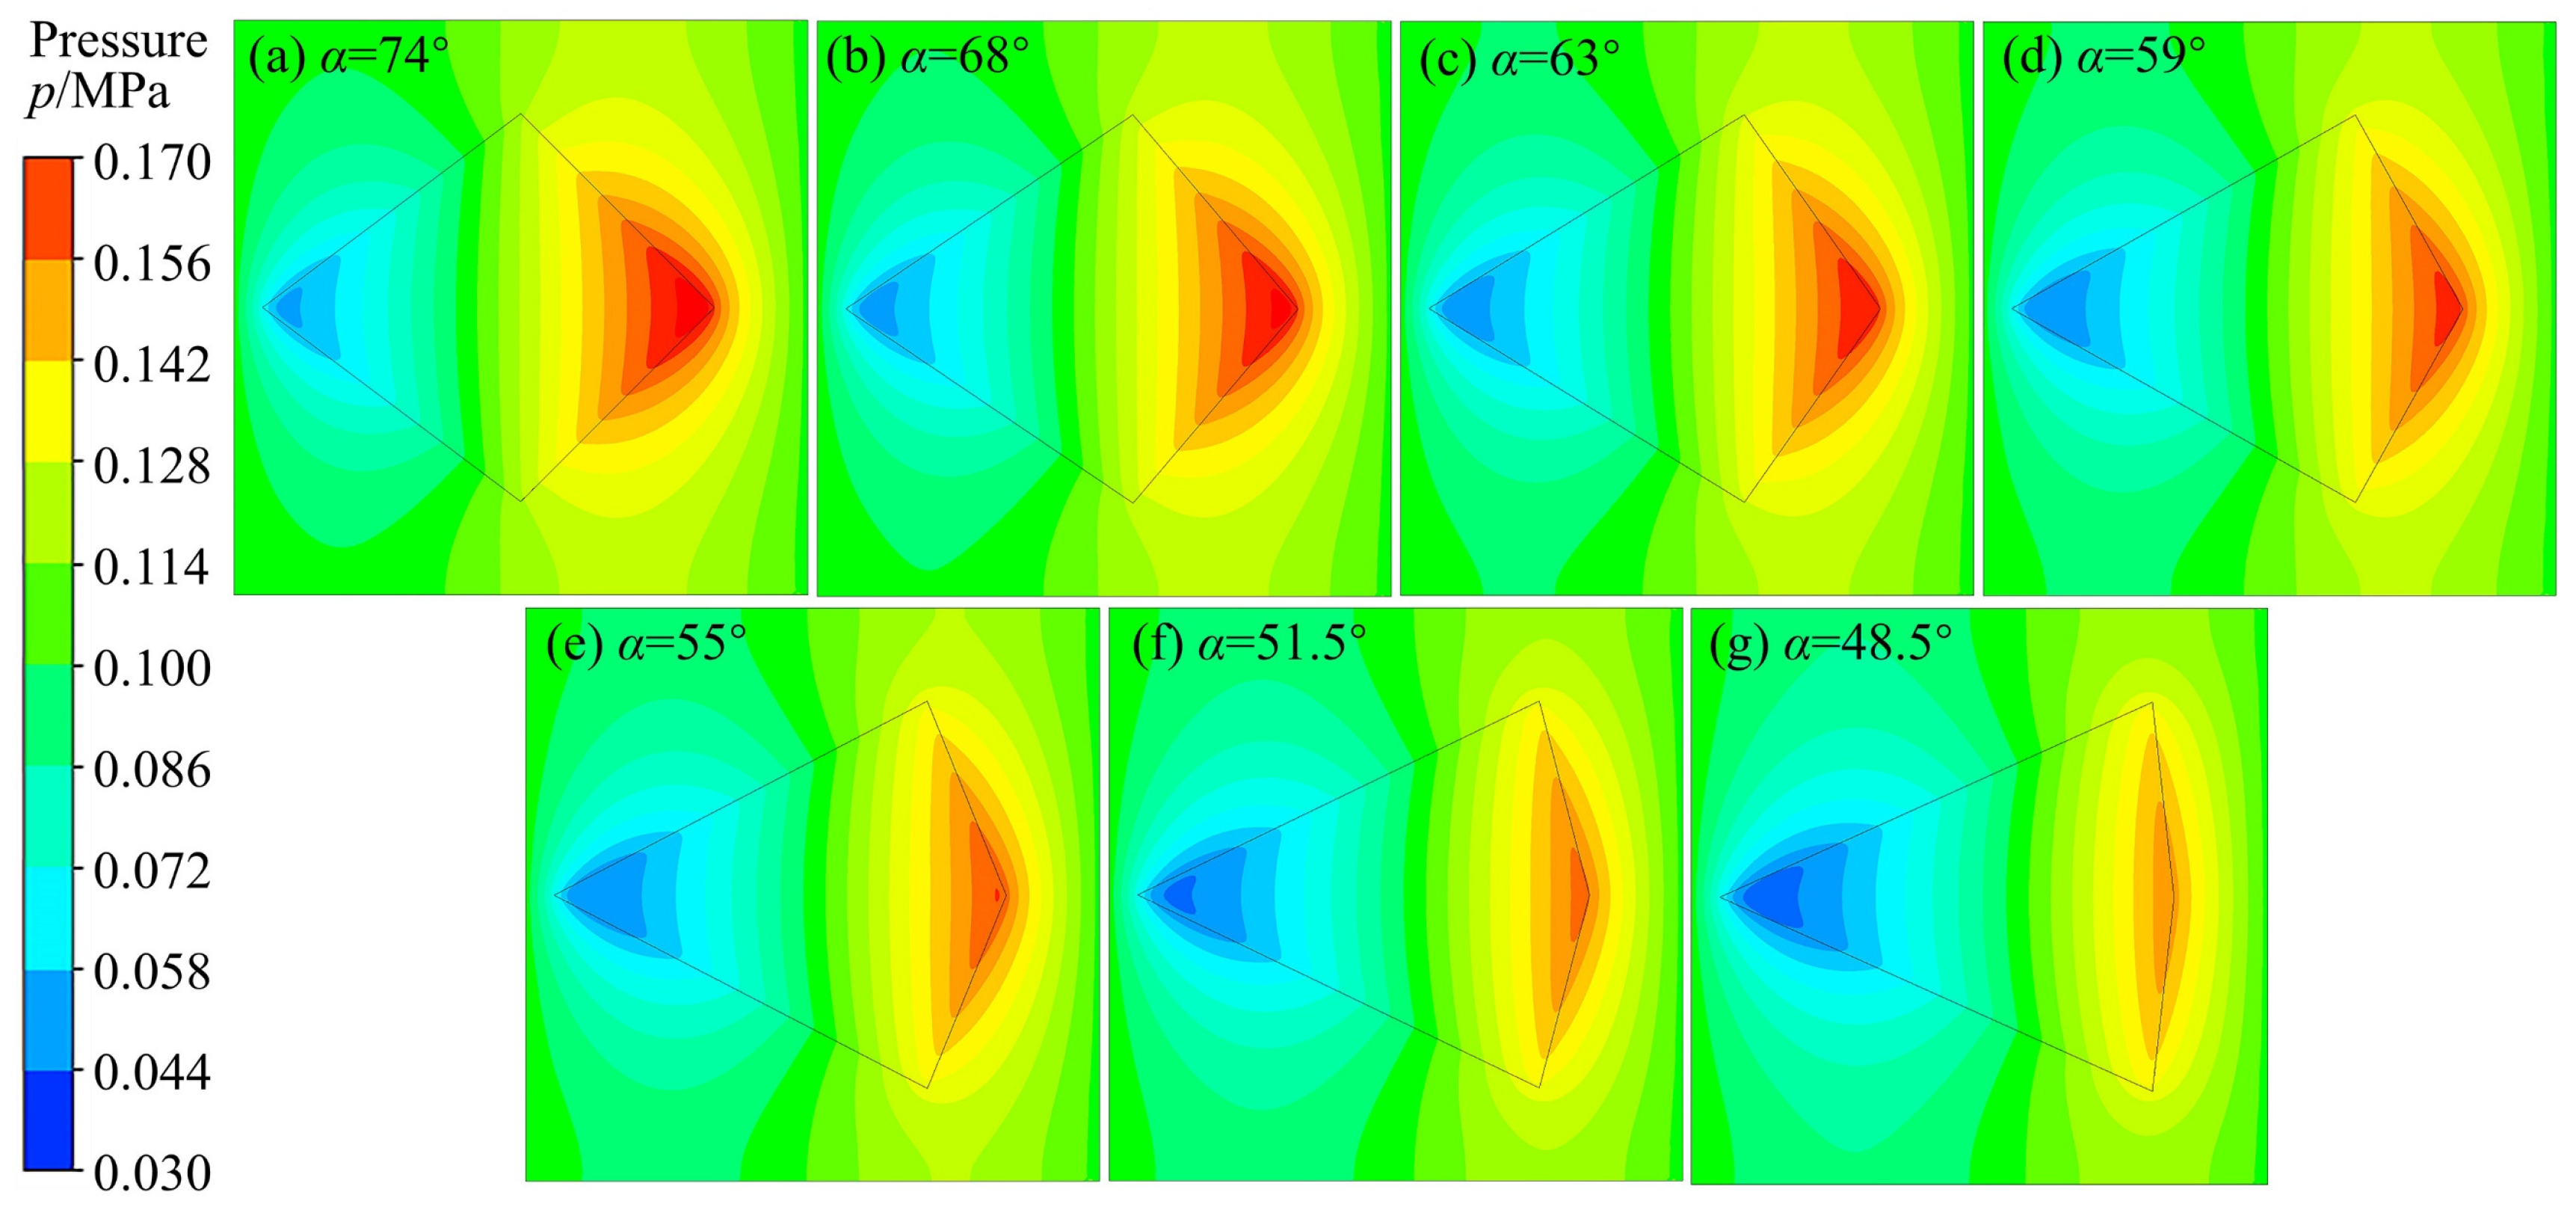
When the angle of the long side of the structure increased, the dispersing wedge angle also increased, reducing the negative pressure zone area of the oil film, increasing the positive pressure zone area, decreasing the oil film friction coefficient, and increasing the net load carrying capacity.
(4)
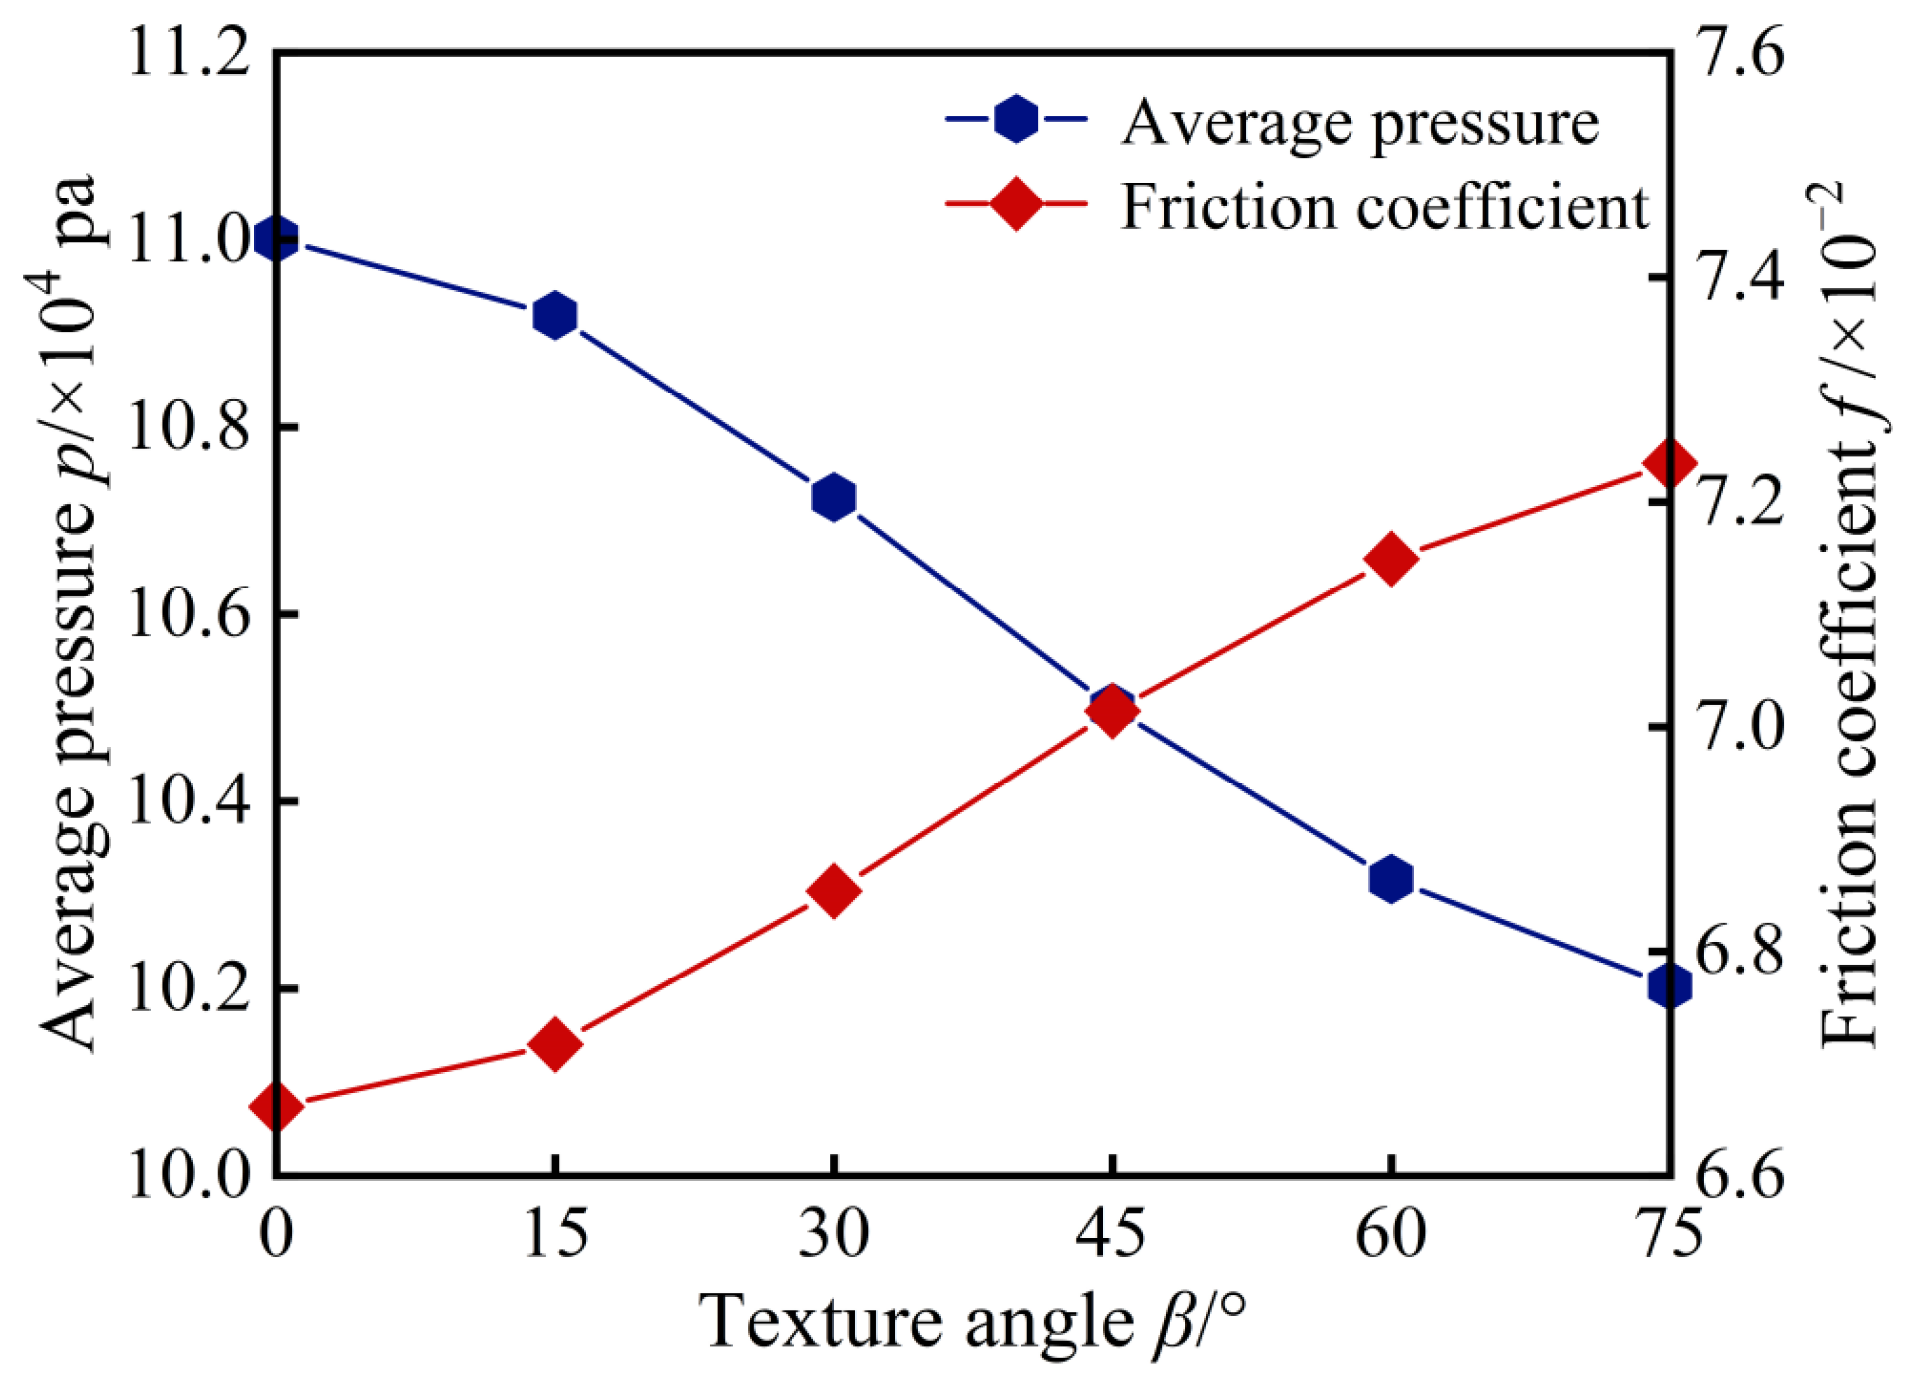
The angle between the texture center axis and the x-direction axis of the unit significantly affected the pressure distribution in the flow field. When this angle increased, the area of the negative pressure zone increased, while the positive pressure zone area decreased. This resulted in an increase in the friction coefficient and a decrease in the net bearing capacity. When the angle became greater than a certain threshold, the negative pressure area became smaller than the positive pressure area, which significantly reduced the oil film carrying capacity.
(5)
The optimal parameters for the rhombus-like dimple texture were an area rate, depth, long-side angle, and angle of 27%, 20 μm, 74°, and 0°, respectively. When the oil film had the largest net bearing capacity and the smallest coefficient of friction, the dynamic pressure lubrication was the highest and the effect of wear reduction was the most significant. The results of the study provide a theoretical basis and design guidance for improving the lubrication performance of the stator and rotor friction pairs in screw pumps.

Author Contributions

Conceptualization, X.S., X.L. and Y.S.; Methodology, X.S. and X.L.; Software, X.S.; Validation, X.S.; Formal analysis, X.S., X.L., C.L., Z.H., S.H. and X.N.; Investigation, X.S., X.L., C.L., Z.H., S.H., Y.S. and X.N.; Resources, X.L.; Data curation, X.S., Y.S. and X.N.; Writing—original draft, X.S.; Writing—review & editing, X.L.; Supervision, X.L., C.L., Z.H. and S.H.; Project administration, X.L., C.L., Z.H. and S.H.; Funding acquisition, X.L. All authors have read and agreed to the published version of the manuscript.

Funding

This study was supported by the National Natural Science Foundation of China (Nos. 52074161 and 52005281), the Taishan Scholar Project of Shandong Province (No. tsqn202211177), the Shandong Provincial Plan for the Introduction and Cultivation of Young Pioneers in Colleges and Universities (No. 2021-QingChuang-30613019), the Natural Science Foundation of Shandong Province (Nos. ZR2022ME173 and ZR2023QE011), and the Project of CNOOC Research Institute Ltd. (No. CCL2023RCPS2129RQN).

Data Availability Statement

If necessary, please contact the corresponding author.

Acknowledgments

The authors sincerely thank the anonymous reviewers for their insightful comments and suggestions.

Conflicts of Interest

Authors Zhongxian Hao and Shouzhi Huang were employed by PetroChina. The remaining authors declare that the research was conducted in the absence of any commercial or financial relationships that could be construed as a potential conflict of interest.

References

  1. FestaBianchet, S.A.; Tyner, D.R.; Seymour, S.P.; Johnson, M.R. Methane venting at cold heavy oil production with sand (CHOPS) facilities is significantly underreported and led by high-emitting wells with low or negative value. Environ. Sci. Technol. 2023, 57, 3021–3030. [Google Scholar] [CrossRef] [PubMed]
  2. Xu, J.; Deng, J.E.; Chen, Y.; Jia, L.X.; Xiao, Y.; Liu, W. Analysis of casing instability and factors influencing it in thermal production oil wells. Chem. Technol. Fuels Oils 2021, 57, 804–812. [Google Scholar] [CrossRef]
  3. Ramos, A.M.; Brown, J.C.; Rojas, M.D.C.; Kuyuco, O.; Flores, J.G. Producing extra-heavy oil from the Orinoco Belt, Cerro Negro Area, Venezuela, using bottom-drive progressive cavity pumps. SPE Prod. Oper. 2007, 22, 151–155. [Google Scholar] [CrossRef]
  4. Liu, X.F.; Liu, C.H.; Hao, Z.X.; Zheng, Y.; Zhang, K.; Wang, J.F.; Wei, S.B.; Hao, A.G.; Tao, J.L.; Cheng, H. Non-symmetric distributions of solids deposition for solid-water stratified flow in deviated tubing strings. Pet. Sci. 2023, 20, 3048–3061. [Google Scholar] [CrossRef]
  5. Gusmanova, A.; Bekbayeva, R.; Koyshieva, A.; Abylai, K. Oil withdrawal technological advancement for multilayer field. Int. J. Oil Gas Coal Technol. 2022, 30, 265–282. [Google Scholar] [CrossRef]
  6. Tavosi, S.; Alimardani, M.; Ghoreishy, R.H.M.; Mohammad, T. Fatigue failure modeling in rubber stator of downhole motors: Dependency to materials and geometry, and its application to life prediction. Eng. Fail. Anal. 2024, 159, 108072. [Google Scholar] [CrossRef]
  7. Zheng, L.; Wu, X.D.; Han, G.Q.; Li, H.C.; Zuo, Y.; Zhou, D.K. Analytical model for the flow in progressing cavity pump with the metallic stator and rotor in clearance fit. Math. Probl. Eng. 2018, 2018, 3696930. [Google Scholar] [CrossRef]
  8. Pan, L.; Tan, J.Z. Numerical investigation of contact stress between rotor and stator in a two-lead progressing cavity pump. J. Pet. Sci. Eng. 2015, 134, 176–185. [Google Scholar] [CrossRef]
  9. Sun, W.X.; Wang, Y.Q.; Wang, K.; Wang, L. Research on three-dimensional modeling of multi-thread single screw pump rotor and stator based on UG. Key Eng. Mater. 2010, 873, 114–117. [Google Scholar] [CrossRef]
  10. Guagliano, M. Fatigue failure of a bar of a twin-screw extruder for plastics. Eng. Fail. Anal. 2004, 12, 950–962. [Google Scholar] [CrossRef]
  11. Borisova, K.E.; Ivanova, T.N.; Latypov, R.G. Study of screw pump stator and rotor working capacity to increase the output. Procedia Eng. 2017, 206, 688–691. [Google Scholar] [CrossRef]
  12. Chen, J.; Wang, F.S.; Shi, G.C.; Cao, G.; He, Y.; Ge, W.T.; Liu, H.; Wu, H.A. Finite element analysis for adhesive failure of progressive cavity pump with stator of even thickness. J. Pet. Sci. Eng. 2015, 125, 146–153. [Google Scholar] [CrossRef]
  13. Lv, X.R.; Wang, S.J.; Huo, X.Y. The effect of water content in crude oil on the tribological behavior of screw pump’s stator rubber. Chin. Sci. Bull. 2014, 59, 2868–2874. [Google Scholar] [CrossRef]
  14. Shi, C.S.; Zhu, X.H.; Chen, Y.K.; Tang, L.P. Failure analysis of general stator and uniform wall thickness stator. Eng. Fail. Anal. 2018, 94, 239–248. [Google Scholar] [CrossRef]
  15. Bornillo, K.; Bovo, E.; Sorgato, M.; Lucchetta, G. Data-driven analysis of the effects of microtextured surfaces on friction reduction for plastic syringe applications. Int. J. Adv. Manuf. Technol. 2025, 136, 2583–2599. [Google Scholar] [CrossRef]
  16. Xu, G.M.; Liu, P.; Liu, A.; Zhang, C.F.; Zhang, G.; Wu, Q.Q.; Lu, H.L. Mechanically stable superhydrophobic surfaces constructed by laser surface texturing and micro-arc oxidation of TC4 alloy prepared based on SLM. Mater. Chem. Phys. 2024, 325, 129791. [Google Scholar] [CrossRef]
  17. Gu, C.X.; Cui, Y.M.; Zhang, D. Research on the optimal design approach of the surface texture for journal bearings. Lubricants 2024, 12, 111. [Google Scholar] [CrossRef]
  18. Slawomir, W.; Waldemar, K.; Pawel, P. Selected methods and applications of anti-friction and anti-wear surface texturing. Materials 2021, 14, 3227. [Google Scholar] [CrossRef] [PubMed]
  19. Pawel, P.; Waldemar, K.; Rafal, R. Surface texturing of cylinder liners: A review. Materials 2022, 15, 8629. [Google Scholar] [CrossRef]
  20. Wang, J.F.; Xue, W.H.; Gao, S.Y.; Li, S.; Duan, D.L. Effect of groove surface texture on the fretting wear of Ti–6Al–4V alloy. Wear 2021, 486, 204079. [Google Scholar] [CrossRef]
  21. Wei, H.; Chen, G.J.; Chen, Z.; Yu, Z.W.; Huang, J.S. Progress on bionic textured cutting tools: A review and prospects. J. Bionic Eng. 2023, 21, 19–55. [Google Scholar] [CrossRef]
  22. Yang, X.D.; Chen, W.G.; Zhang, Y.; Li, Z.Y.; Yang, J.W.; Dai, B.G.; Zhang, J.H.; Li, D.Y.; Qiu, Z.L. Tribological properties of MAO coating deposited on aluminum base bearing alloy with different texture shapes. Surf. Coat. Technol. 2024, 492, 131191. [Google Scholar] [CrossRef]
  23. Zhang, H.Y.; Liu, X.R.; Gong, J.Z.; Bai, S.Z.; Sun, K.; Jia, X.R. Thermohydrodynamic lubrication characteristics of piston rings in diesel engine considering transient heat transfer under the parameterized surface texture of cylinder liners. Energies 2023, 16, 7924. [Google Scholar] [CrossRef]
  24. Jia, H.K.; Zhou, Z.Y.; Yin, B.F.; Zhou, H.Q.; Xu, B. Influence of microdimple on lubrication performance of textured plunger pump. Ind. Lubr. Tribol. 2021, 73, 563–571. [Google Scholar] [CrossRef]
  25. Magnus, C.; Gulenc, I.T.; Rainforth, W.M. Ambient dry sliding friction and wear behaviour of laser surface textured (LST) Ti3SiC2 MAX phase composite against hardened steel and alumina. Wear 2022, 490, 204184. [Google Scholar] [CrossRef]
  26. Wang, J.H.; Huang, D.J.; Wang, B.; Zhang, Y.; Wang, J. Study on the tribological behavior of laser surface texturing on silicon nitride ceramic under water lubrication. Lubricants 2025, 13, 21. [Google Scholar] [CrossRef]
  27. Peng, S.J.; Huang, Z.Q.; Wang, M.L.; Xiong, C.; Chen, K. Study on the influence of surface texture parameters of oil production screw motor rotor on the tribological properties of its friction pair. Processes 2023, 11, 618. [Google Scholar] [CrossRef]
  28. Wang, M.L.; Huang, Z.Q.; Qian, W.J.; Li, G. Study of the effect of laser textured rotors on the starting performance of metal–rubber mating pairs under different lubricating media environments. Proc. Inst. Mech. Eng. Part J J. Eng. Tribol. 2024, 238, 450–463. [Google Scholar] [CrossRef]
  29. Paul Joshua, S.; Dinesh Babu, P. Friction and wear characteristics for laser surface textured rolling bearing steel: Effect of pattern density, depth, and area. Trans. Indian Inst. Met. 2022, 75, 2923–2930. [Google Scholar] [CrossRef]
  30. Cui, Z.T.; Guo, Z.W.; Yuan, C.Q. Influence of different rhombic surface textures on the tribological performance of water-lubricated bearings. Mater. Express 2020, 10, 1452–1462. [Google Scholar] [CrossRef]
  31. Otero, E.J.; Ochoa, G.E.; Vallinot, B.I.; Tanarro, E.C. Optimising the design of textured surfaces for reducing lubricated friction coefficient. Lubr. Sci. 2017, 29, 183–199. [Google Scholar] [CrossRef]
  32. Guo, Q.G.; Zheng, L.; Zhong, Y.H.; Wang, S.K.; Ren, L.Q. Numerical simulation of hydrodynamic lubrication performance for continuous groove-textured surface. Tribol. Int. 2021, 167, 107411. [Google Scholar] [CrossRef]
  33. Shen, Z.H.; Wang, F.C.; Chen, Z.G.; Ruan, X.P.; Zeng, H.H.; Wang, J.H.; An, Y.R.; Fan, X.L. Numerical simulation of lubrication performance on chevron textured surface under hydrodynamic lubrication. Tribol. Int. 2020, 154, 106704. [Google Scholar] [CrossRef]
  34. Liu, W.L.; Ni, H.J.; Chen, H.L.; Wang, P. Numerical simulation and experimental investigation on tribological performance of micro-dimples textured surface under hydrodynamic lubrication. Int. J. Mech. Sci. 2019, 163, 105095. [Google Scholar] [CrossRef]
  35. Hua, X.J.; Puoza, C.; Zhang, P.Y.; Yin, B.F.; Xie, X.; Din, J.L. Numerical simulation and experimental analysis of grease friction properties on textured surface. Iran. J. Sci. Technol. Trans. Mech. Eng. 2019, 43, 357–369. [Google Scholar] [CrossRef]
  36. Wei, Y.; Yan, H.M.; Li, S.; Wang, X.W. Numerical and experimental study of a sector-shaped surface texture in friction reduction. Tribol. Lett. 2024, 72, 60. [Google Scholar] [CrossRef]
  37. Li, Y.L.; He, Y.Y.; Luo, J.B. Multi-objective optimization of surface texture shape in fluid mechanical face seals using mass-conserving cavitation boundary condition. Proc. Inst. Mech. Eng. Part J J. Eng. Tribol. 2024, 238, 581–599. [Google Scholar] [CrossRef]
  38. Wang, Z.Q.; Sun, L.T.; Han, B.; Wang, X.Q.; Ge, Z.W. Study on the thermohydrodynamic friction characteristics of surface-textured valve plate of axial piston pumps. Micromachines 2022, 13, 1891. [Google Scholar] [CrossRef]
  39. Zhong, Y.H.; Zheng, L.; Gao, Y.H.; Liu, Z.N. Numerical simulation and experimental investigation of tribological performance on bionic hexagonal textured surface. Tribol. Int. 2019, 129, 151–161. [Google Scholar] [CrossRef]
  40. Mao, Y.K.; Chen, W.G.; Li, Y.; Dai, Y.F.; Guo, W.X.; Zhang, J.B.; Wang, Y.H.; Wang, Z.X.; Li, D.Y.; Lin, N.M. Simulation and experimental study on tribological properties of herringbone texture on 42CrMo bearing alloy steel surface. J. Mater. Eng. Perform. 2024, 34, 1364–1377. [Google Scholar] [CrossRef]
  41. Lv, X.R.; Wang, H.M.; Wang, S.J. Effect of swelling nitrile rubber in cyclohexane on its ageing, friction and wear characteristics. Wear 2015, 328, 414–421. [Google Scholar] [CrossRef]
  42. Li, Y.F.; Nie, D.L.; Cai, Z.Q. The performance analysis of screw pump stator elastomers: Polyamide 6/hydrogenated nitrile blends: Mechanical, oil resistance and tribological properties. Polym. Test. 2023, 128, 108226. [Google Scholar] [CrossRef]
  43. Qian, C.; Li, Y.L.; Zhao, J.; Wang, S.J.; He, E.Q. Thermal-oxidative aging and tribological properties of carbon nanotube/nitrile butadiene rubber composites with varying acrylonitrile content: Molecular dynamics simulations. Polym. Eng. Sci. 2023, 63, 1516–1527. [Google Scholar] [CrossRef]
  44. Wang, Z.Q.; Xu, Y.F.; Hu, S.; Ji, H.; Yang, J. Research on lubrication mechanism with fluid–solid coupling of port plate pair in swash plate axial piston pump. Proc. Inst. Mech. Eng. Part J J. Eng. Tribol. 2020, 234, 515–527. [Google Scholar] [CrossRef]
  45. Liu, X.; Shi, X.; Hao, Z.; Wei, S.; Sun, Y.; Niu, X.; Liu, C.; Li, M.; Li, Z. Effect of complex well conditions on the swelling and tribological properties of high-acrylonitrile stator rubber in screw pumps. Polymers 2024, 16, 2036. [Google Scholar] [CrossRef]
  46. Liu, X.; Sun, Y.; Liu, C.; Shi, X.; Niu, X.; Zheng, G.; Wei, W.; Wei, S.; Huang, S. Lubrication characteristics of a warhead-type irregular symmetric texture on the stator rubber surfaces of screw pumps. Lubricants 2024, 12, 397. [Google Scholar] [CrossRef]
  47. Liu, X.; Niu, X.; Liu, C.; Shi, X.; Sun, Y.; Hao, Z.; Huang, S.; Wang, Y.; Tao, H. Study on the tribological properties of multilayer concentric hexagonal laser texturing on rubber surfaces of screw pumps. Materials 2024, 17, 3708. [Google Scholar] [CrossRef]
  48. Wang, J.H.; Yan, Z.J.; Shen, Z.Y.; Pan, X.X. Three-dimensional CFD analysis of the influence of surface texture morphology parameters on lubrication performance. Lubr. Eng. 2021, 46, 37–43. [Google Scholar] [CrossRef]
  49. Schneider, J.; Braun, D.; Greiner, C. Laser textured surfaces for mixed lubrication: Influence of aspect ratio, textured area and dimple arrangement. Lubricants 2017, 5, 32. [Google Scholar] [CrossRef]
  50. Sahlin, F.; Larsson, R.; Glavatskih, B.S.; Almqvist, T. Two-Dimensional CFD-Analysis of micro-patterned surfaces in hydrodynamic lubrication. J. Tribol. 2005, 127, 96–102. [Google Scholar] [CrossRef]
  51. Tripathi, K.; Gyawali, G.; Joshi, B.; Amanov, A.; Wohn, S. Improved tribological behavior of grey cast iron under low and high viscous lubricants by laser surface texturing. Mater. Perform. Charact. 2017, 6, 24–41. [Google Scholar] [CrossRef]
  52. Wang, L.L.; Zhao, X.T.; Guo, S.H.; Wang, M. Tribological properties of surface microtexture friction pairs under different lubrication conditions. Adv. Mech. Eng. 2019, 11, 1687814019881569. [Google Scholar] [CrossRef]
Figure 1. The research progress of numerical simulation methods for surface texture. Adapted from [32,33,34,36,39].
Lubricants 13 00157 g001
Figure 2. Geometric model of the rhombus-like texture (a) rhombus rattlesnake skin texture and bionic texture, (b) stator and rotor friction pair, (c) section of stator and rotor friction pari, (d) cross-sectional profile of dimple.
Lubricants 13 00157 g002
Figure 3. Single screw pump rotor movement trajectory.
Lubricants 13 00157 g003
Figure 4. Verification of mesh independence based on pressure distribution on the axis of an oil film carrying surface.
Lubricants 13 00157 g004
Figure 5. Schematic diagram of the computational domain model in reference [48].
Lubricants 13 00157 g005
Figure 6. Comparison of pressures obtained by the computational methods in this study and reference [48].
Lubricants 13 00157 g006
Figure 7. Pressure distribution on the bearing surface for different flow directions of the medium: (a) x direction, (b) −x direction, and (c) y direction.
Lubricants 13 00157 g007
Figure 8. Curves of the friction coefficient and average pressure variation on the textured surface with different area rates: (a) pressure distribution at the center axis of the carrying surface, (b) friction coefficient and average pressure.
Lubricants 13 00157 g008
Figure 9. The pressure distribution cloud diagram of the textured surface under different area rates.
Lubricants 13 00157 g009
Figure 10. Curves of the friction coefficient and the average pressure variation in the textured surface at different depths: (a) pressure distribution at the center axis of the carrying surface, (b) friction coefficient and average pressure.
Lubricants 13 00157 g010
Figure 11. The pressure distribution cloud diagram of the textured surface at different area depths.
Lubricants 13 00157 g011
Figure 12. The internal flow trace diagram of texture under different depth conditions.
Lubricants 13 00157 g012
Figure 13. Curves of the friction coefficient and the average pressure variation in the textured surface with different long-side angles.
Lubricants 13 00157 g013
Figure 14. The pressure distribution cloud diagram of the textured surface with different long-side angles.
Lubricants 13 00157 g014
Figure 15. Curves of the friction coefficient and the average pressure variation in the textured surface with different angles.
Lubricants 13 00157 g015
Figure 16. The pressure distribution cloud diagram of the textured surface at different angles.
Lubricants 13 00157 g016
Figure 17. The average pressure change of the textured surface under different viscosities.
Lubricants 13 00157 g017
Figure 18. The pressure distribution cloud diagram of the bearing surface under different viscosities.
Lubricants 13 00157 g018
Table 1. Bearing capacity and friction coefficient for different flow directions of the medium.
Direction of FlowBearing Capacity Fz/×10−2 NFriction Coefficient f
x10.50.070
x9.750.075
y10.10.073
Disclaimer/Publisher’s Note: The statements, opinions and data contained in all publications are solely those of the individual author(s) and contributor(s) and not of MDPI and/or the editor(s). MDPI and/or the editor(s) disclaim responsibility for any injury to people or property resulting from any ideas, methods, instructions or products referred to in the content.

