Article

Study on Current-Carrying Friction Characteristics and Corrosion Resistance of Carbon Brush/Collector Ring by Copper–Graphene Electrodeposition Process

1
Hubei Key Laboratory of Hydroelectric Machinery Design & Maintenace, China Three Gorges University, Yichang 443000, China
2
College of Mechanical & Power Engineering, China Three Gorges University, Yichang 443000, China
*
Author to whom correspondence should be addressed.
Lubricants 2025, 13(4), 162; https://doi.org/10.3390/lubricants13040162
Submission received: 26 February 2025 / Revised: 30 March 2025 / Accepted: 1 April 2025 / Published: 3 April 2025

Abstract

:
The collector ring/carbon brush assembly of a hydrogenerator set is a critical component for transmitting excitation current into the self-exciting winding. Its operating environment necessitates excellent corrosion resistance and current-carrying frictional properties. The surface condition and material composition of the collector ring are key factors influencing the performance of the brush/ring interface. Coatings have proven effective in enhancing both tribological and corrosion-resistant characteristics. In this study, copper/graphene composite coatings were fabricated via electroplating, and the effects of graphene deposition rate on current-carrying friction characteristics were systematically investigated to optimize electroplating parameters. The results showed that the composite coating reduced contact resistance by 32.58% and friction coefficient by 37.59%. Electrochemical and immersion tests were conducted to evaluate the corrosion behavior under varying pressure and current density conditions. The results revealed that the optimal corrosion resistance was achieved under 1 N pressure and 12 A/cm2 current density. The copper/graphene composite coating demonstrated superior corrosion resistance compared to uncoated samples. In summary, the electroplated copper/graphene composite coatings exhibit excellent current-carrying frictional performance and corrosion resistance, offering a promising solution for enhancing the durability and efficiency of hydrogenerator collector rings.

1. Introduction

The hydropower unit, as the core component of hydropower generation and energy storage regulation, relies significantly on the performance of the carbon brush/collector ring assembly. This component greatly influences the efficiency and stability of the entire power generation system. Consequently, enhancing the collector ring’s wear resistance and conductivity is paramount. Current research focuses on extending the service life of hydrogenerator sets and improving power generation efficiency through advancements in these areas [1].
The operational mode of the brush/ring assembly primarily involves current-carrying friction and wear, which presents a challenge of coupling electrical contact with frictional forces [2,3,4,5]. Furthermore, corrosion of collector rings is particularly evident when generator sets are idle for extended periods. During the shutdown, the lack of relative movement between the brush and the collector ring can result in noticeable corrosion patterns, often manifesting as distinct brush traces on the ring’s surface. Even in standby mode, the carbon brush continues to apply pressure via spring mechanisms to maintain contact, and control circuits may carry small residual currents to ensure rapid startup capability. These conditions exacerbate corrosion risks, highlighting the need to identify optimal parameters for minimizing degradation during inactive periods [6,7,8,9,10]. In the domain of current-carrying friction, wear and corrosion are principal contributors to material degradation and equipment failure in mechanical systems [11,12,13]. Friction pairs, therefore, must exhibit superior corrosion resistance. During the relative sliding of friction pair surfaces, a chemical or electrochemical reaction between the surface material and the surrounding medium occurs, resulting in material loss due to mechanical action, a phenomenon known as corrosive wear [14,15].
To enhance the current-carrying friction characteristics and corrosion resistance of friction pairs, surface treatment technologies have become a critical focus of contemporary research [16]. Innovations in liquid additives have shown potential not only to improve the conductivity of friction pairs but also to enhance their corrosion resistance [17,18]. Concurrently, conductive and wear-resistant self-lubricating coatings, known for their high conductivity, wear resistance, low friction coefficient, high-temperature tolerance, and robustness, are extensively employed to augment the surface performance of sliding electrical contact components in high-end equipment [19,20,21]. For metallic coatings, such as Cu [21,22,23], Ag [20,21], Mo [24,25], and Ni [26], while they exhibit excellent electrical conductivity, their corrosion resistance remains an area requiring further investigation. Graphene, with its unique properties—such as inertness, impermeability, and toughness—emerges as an ideal coating material for enhancing both corrosion resistance and conductivity. Metal-based graphene coatings have demonstrated superior corrosion resistance. Numerous studies have confirmed graphene’s dual role in boosting the electrical conductivity of metal matrices and inhibiting metal corrosion [27,28,29,30,31,32,33].
In this study, a copper–graphene nanosheet (Cu-GNS) composite coating was electroplated onto a 45 steel collector ring substrate. Recent advancements in copper–graphene composites have demonstrated their cross-domain applicability in electrical engineering. Notably, pulsed electrodeposited Cu-GNS coatings have shown remarkable performance in circuit breaker applications, where simultaneous requirements for electrical conduction efficiency and mechanical durability are paramount. Studies by [34] revealed that such composite coatings achieved a 40% improvement in arc erosion resistance and a 35% enhancement in thermal dissipation compared to pure copper contacts, attributed to graphene’s exceptional electron mobility and thermal conductivity. These findings corroborate the material’s potential for applications requiring coupled electrical–thermal–mechanical performance, including but not limited to hydrogenerator collector rings. The successful implementation of circuit breakers provides valuable insights for optimizing graphene dispersion and interface bonding in sliding electrical contact systems. By analyzing the relationship between the deposition rate of Cu-GNS and the current-carrying friction characteristics, we identified the optimal composite plating parameters. The contact resistance, friction coefficient, and wear rate of the samples were evaluated to determine the most corrosion-resistant current-carrying conditions. Finally, the corrosion resistance of the two samples was compared under the best working conditions. The principal novelty of this work lies in establishing a parameter optimization framework for copper–graphene electrodeposition specifically tailored for hydrogenerator collector rings. This study pioneers the demonstration of graphene’s dual functionality in simultaneously enhancing current-carrying capacity (32.58% contact resistance reduction) and corrosion resistance (2.21 × 10⁻⁵ A/cm2 corrosion current density) under actual generator operating conditions, addressing a critical gap in large-scale hydropower equipment surface engineering.

2. Materials and Experimental Section

2.1. Production of Coating

Cu coating and Cu–GNS composite coating were prepared on the collector ring by electroplating. Graphene nanosheets (GNSs) were purchased from Joyhang Metallic Materials, Foshan, China, using nanoscale GNS. First, the surface roughness of Ra 0.6 μm was obtained by polishing the collector ring with 2000-grit sandpaper (sequential polishing from 800 to 2000 grit). Then, the polished collector ring was ultrasonically cleaned in ethanol. A copper sheet was used as the anode, the collector ring substrate was used as the cathode, and the plating was carried out in the plating solution at room temperature. The bath consisted of CuSO4·5H2O (100 g/L), H2SO4 (50 g/L), and 1 L of distilled water. Electroplating of Cu–GNS composite coatings was performed using the procedure as shown in Figure 1. Different amounts of graphene (0.2, 0.4, 0.6, 0.8, 1 g/L) were added to the plating solution as the reinforcement phase. Additionally, 0.5 mg/L of sodium dodecyl sulfate (SDS) was introduced to improve the uniform dispersion of graphene in the bath. During the plating process, current density (0.5, 1, 1.5, 2, 2.5 A/dm2), stirring speed (100, 140, 180, 220, 260 r/min), and plating time (1, 5, 10, 15, 20 min) were selected. By adjusting stirring speed, graphene content, electroplating time, and current density, composite coatings under different electroplating parameters were prepared.

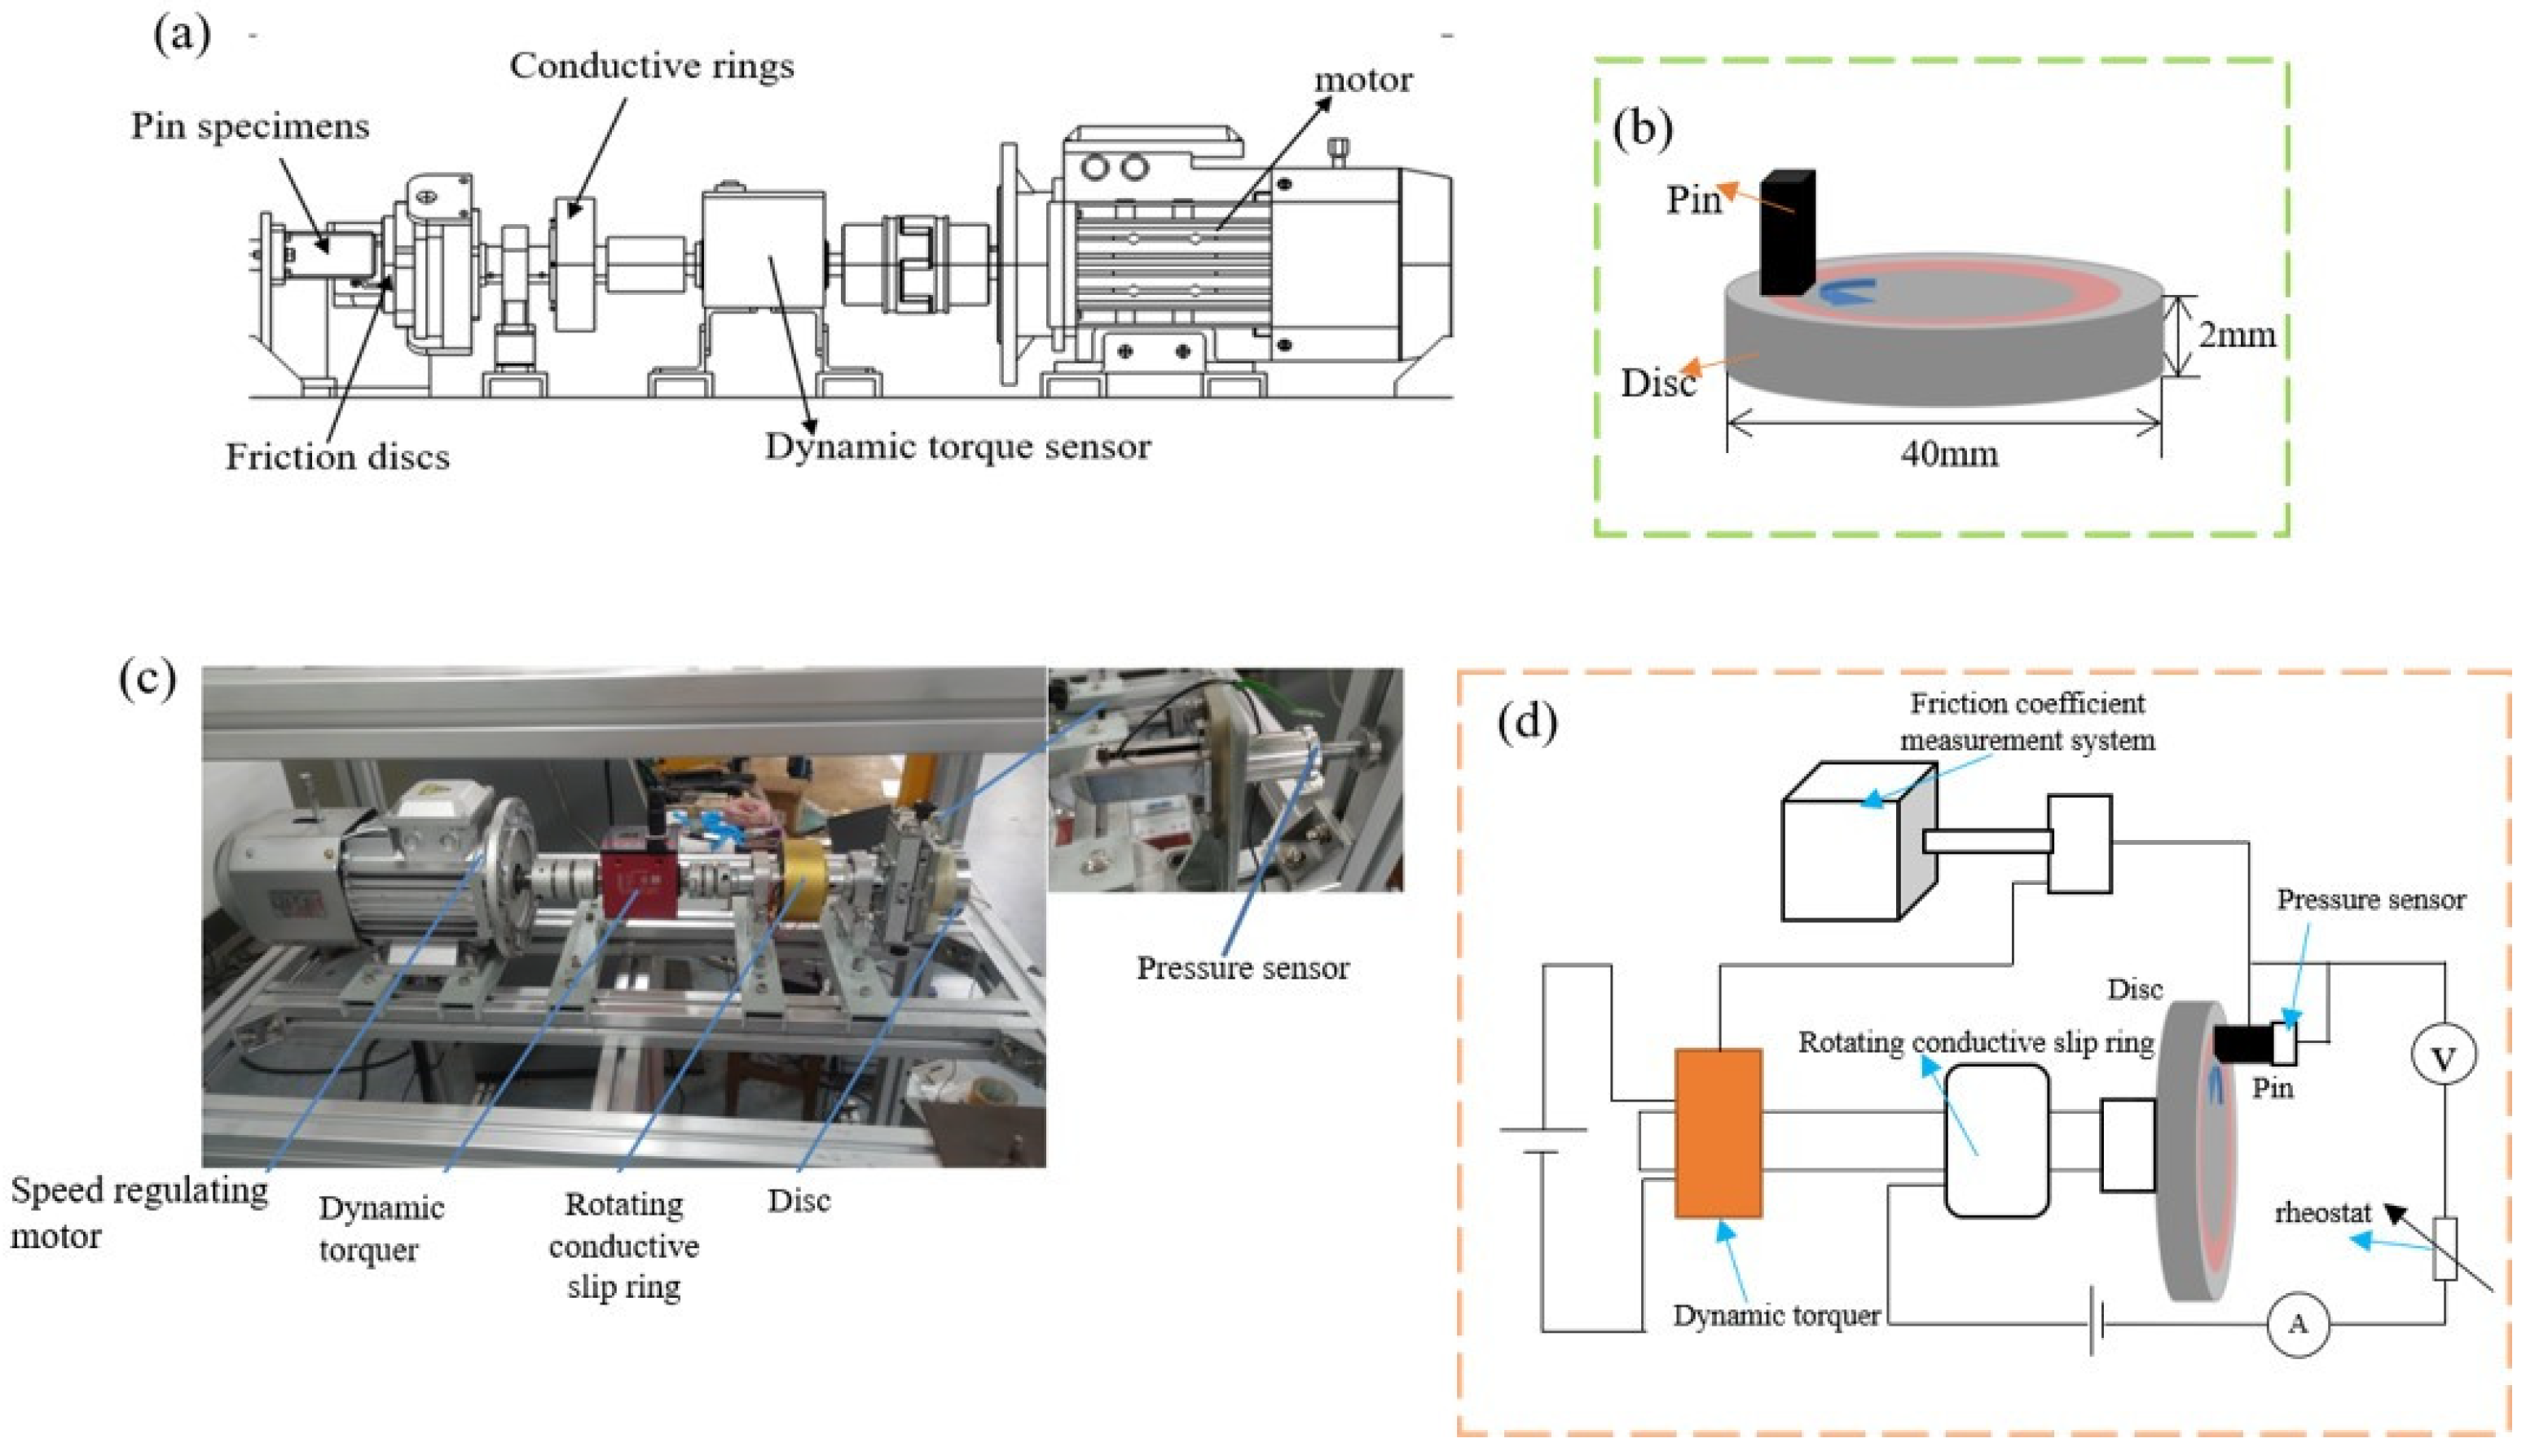
2.2. Current-Carrying Tribological Experiment

In this study, the sliding current-carrying friction and wear test of a pin (D172 carbon rod)/disk (45 steel) was carried out. Each tribological test was repeated four times under the same conditions to ensure data reliability, and the average values were used for analysis. The composition of 45 steel is as follows: C: 0.42–0.50, Si: 0.17–0.37, Mn: 0.50–0.80, S: 0.035, P: 0.035, Cr: 0.025, Ni: 0.25, Cu: 0.25, and the residue composition is Fe. The simulation of the sliding friction process of the carbon brush in the collector ring of a hydrogenerator was performed. The current-carrying friction characteristics were measured using a self-made current-carrying wear testing machine for a pin (width and height of 6 mm × 6 mm × 12 mm) and disc (diameter of 20 mm), as shown in Figure 2. The experimental parameters were set as follows. Current densities in actual hydroelectric generator collector rings are typically in the range of 5–15 A/cm2. We chose an intermediate value of 9 A/cm2 to represent typical operating conditions while avoiding extreme values to ensure that the experimental results reflect actual performance; the load is equivalent to a contact pressure of 0.0032 MPa (1 N), which is based on the typical range of pressures applied by the carbon brushes and collector rings through the spring mechanism in actual operation (0.5–2 N), and a standard value of 0.0032 MPa (1 N) was chosen to simulate the actual contact pressure; the hydrogenerator speed is typically 100–300 arc/min. To simulate the actual contact pressure to avoid excessive wear of the carbon brushes due to high loads; the turbine generator’s rotational speed is usually between 100–300 rpm. An intermediate value of 0.21 m/s (200 rad/min) was chosen to cover common operating conditions and to ensure that the experimental conditions are consistent with the dynamics of the actual mechanical motion. A testing time of 1000 s and a sliding distance of 210 m were chosen to ensure that the experiment captures the steady state of the friction pair. In contrast, a shorter test time may not be able to reflect the long-term wear behavior, and a longer test time would be a waste of resources. Shorter test times may not reflect long-term wear behavior, while longer test times would waste resources. Real-time torque and pressure, current, and voltage were measured during the test. After the tribological tests, electrical contact resistivity was calculated according to Ohm’s law. The difference in mass of the pin before and after the test was measured using a PTY-A220 electronic balance (Huazhi Electronic Technology Co., Ltd., Putian, China) with an accuracy of 0.001 mg. The friction coefficient was calculated using Formula (1), where FN is the applied load, Ff is the friction force, NB is the number of contact friction pairs, r is the radius of friction, Tt is the friction torque, T is the load torque, and T0 is the no-load torque. This experiment was conducted in an environment where the temperature and relative humidity changes were minimal, ensuring they did not significantly impact the results.
μ = F f F N = N n · F F · r N B · F N · r = T t N B · F N · r = T T 0 N B · F N · r

2.3. Coating Corrosion Resistance Test

Making electrochemical testing methods is crucial in corrosion research. In this study, an CH1760e electrochemical workstation (Figure 3a) was employed to measure the open circuit potential and polarization curves of the original sample under various pressures (0, 0.3, 0.6, 1, and 1.5 N) in a 3.5% saline solution. Concurrently, the open circuit potential, impedance, and polarization curves of the collector ring, Cu layer, and Cu–GNS composite electroplating were analyzed based on the pressure test results. As depicted in Figure 3a, the reference electrode (RE) was a saturated calomel electrode (SCE), the counter electrode (CE) was a platinum sheet, and the working electrode (WE) was the sample under investigation. Before testing, the sample was encapsulated with epoxy resin, exposing only a 1 cm2 area. The sample was then immersed in the electrolyte, ensuring direct alignment of the test surface with the platinum electrode, and electrochemical experiments were initiated. Potentiodynamic polarization tests were performed with a potential range of −1.5 V to 0.5 V (vs. OCP) at a scan rate of 1 mV/s. Electrochemical impedance spectroscopy (EIS) was conducted in the frequency range of 100 kHz to 10 MHz, with 10 points per decade and a sinusoidal voltage amplitude of 10 mV. All electrochemical and immersion corrosion tests were performed four times and analyzed using average values. The corrosion tests were conducted under carbon brush contact conditions. A D172 carbon brush (6 mm × 6 mm × 10 mm) was pressed against the sample surface via a spring-loaded mechanism, and the applied pressure was monitored by a Futek LSB200 load cell. This setup simulated the actual brush/collector ring interface during generator operation. Figure 3b illustrates the immersion corrosion test under external current application. To simulate corrosion caused by residual current during generator shutdown, immersion tests were conducted in a 3.5 wt% NaCl solution with a D172 carbon brush pressed against the sample surface (1 N load). A fixed current density (0–12 A/cm2) was applied using a DC power supply (Model: Keithley 2231A-30-3, Keithley, Cleveland, OH, USA, Jiangsu Province, China).

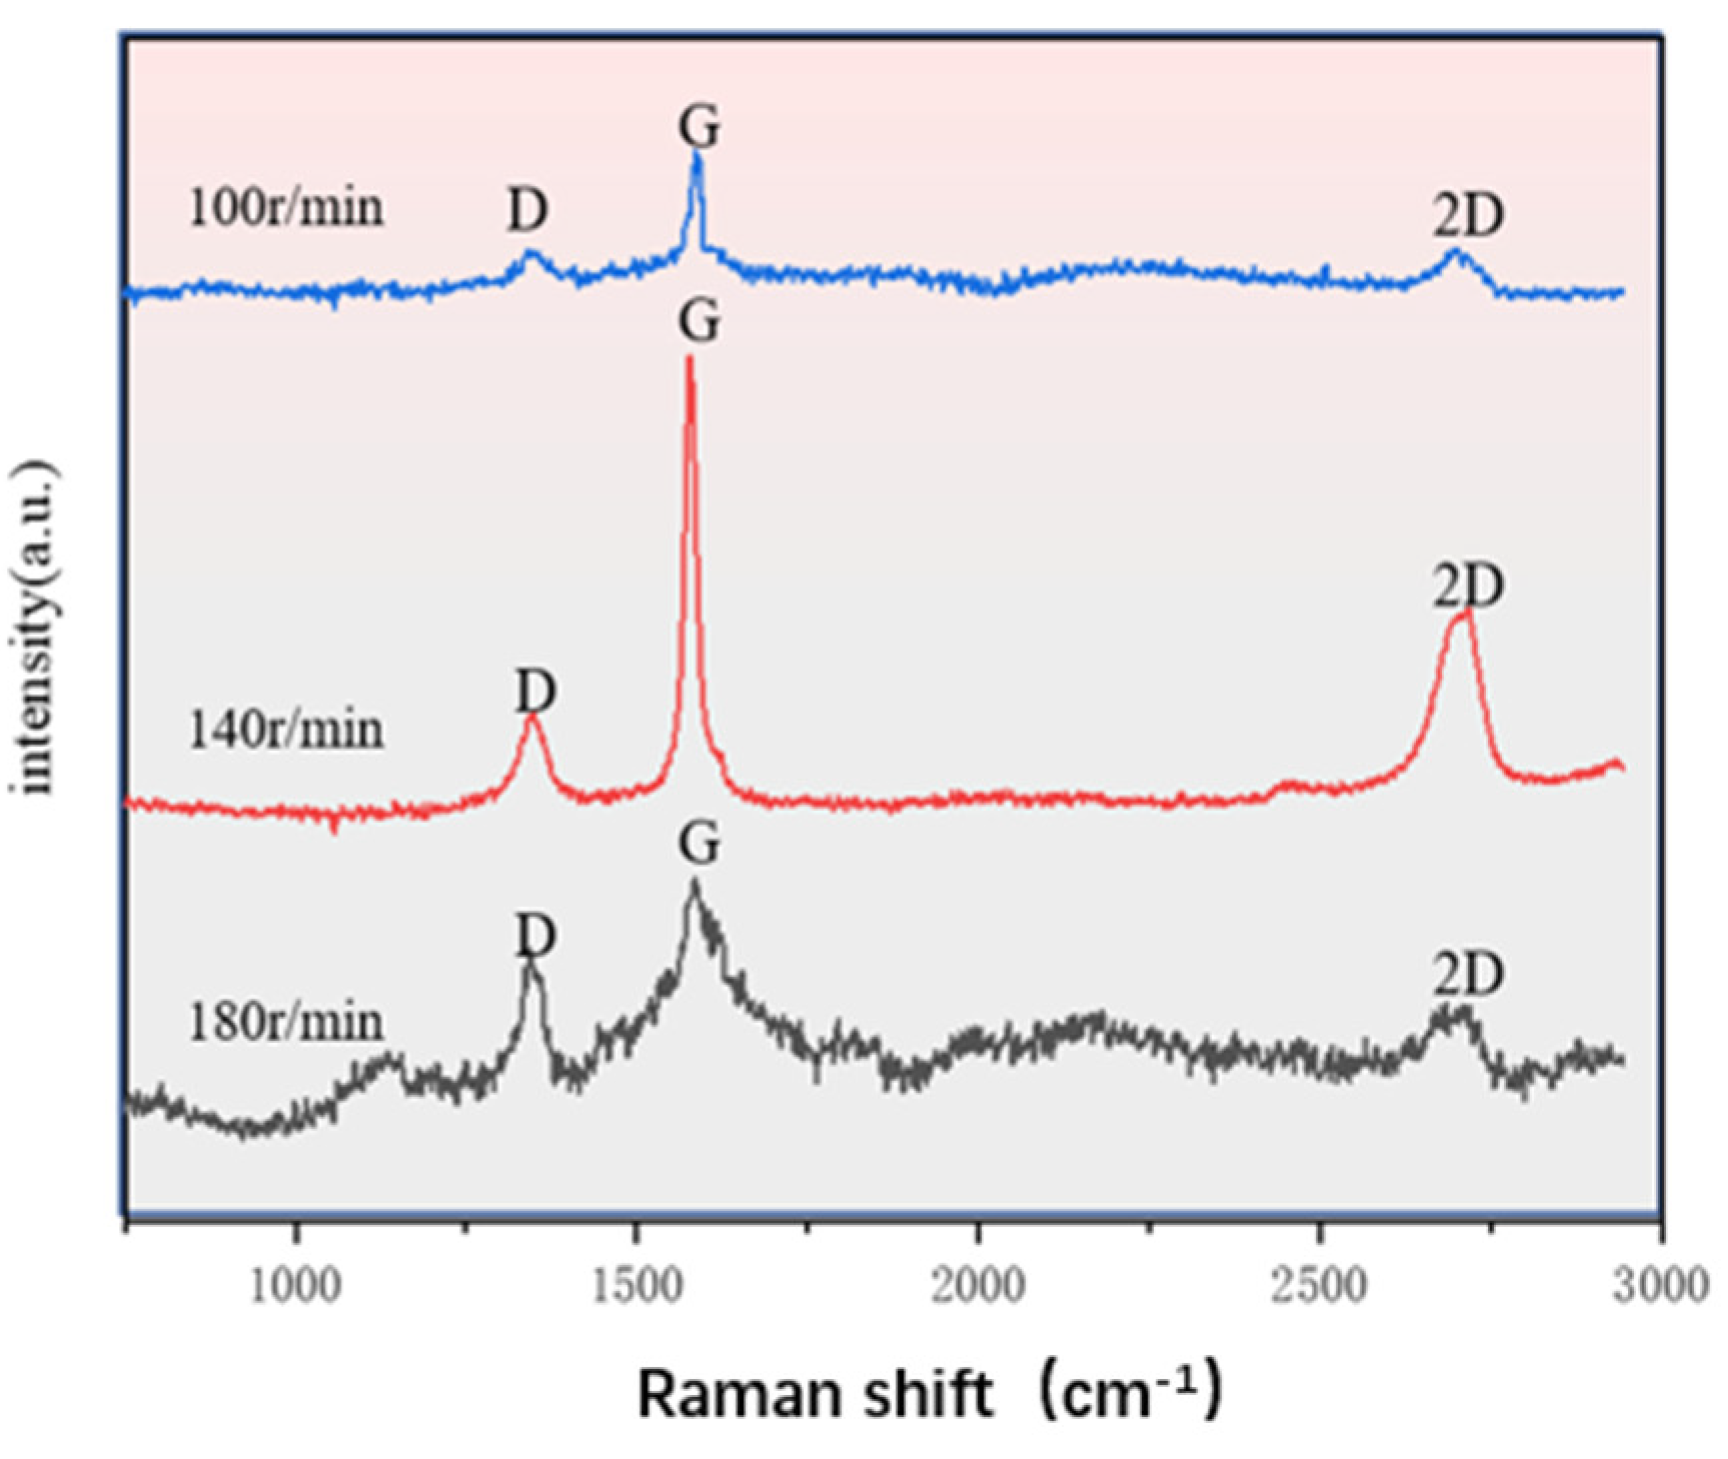
2.4. Raman Spectroscopy Analysis and EDS

Raman spectroscopy was analyzed using [instrument model, e.g., Horiba LabRAM HR Evolution, Irvine, CA, USA] with a laser wavelength of 532 nm, spot size of ~1 μm, and a power setting of 5 mW to avoid sample damage. Before testing, the sample surface was ultrasonically cleaned with ethanol and dried, both with a silicon standard (520.7 cm−1), to calibrate the instrument. The scanning range was 100–3200 cm−1 with a resolution of less than 1 cm−1 (grating: 1800 gr/mm). The integration time was 10 s, three times accumulated and averaged to improve the signal-to-noise ratio. The instrument wavelength was calibrated during the test using a standard silicon wafer and focused on the sample surface through a 50× objective lens. All spectral data were baseline corrected and deconvolution processed to accurately identify the characteristic peaks of graphene (D, G, 2D). Scanning electron microscopy (SEM) and energy dispersive X-ray spectroscopy (EDS) were performed using a Zeiss Sigma 300 field emission scanning electron microscope (Carl Zeiss AG, Oberkochen, Germany) equipped with an Oxford X-MaxN 80 mm2 silicon drift detector (SDD). The graphene deposition rate was quantified by analyzing optical microscopy images (Figure 4) using ImageJ software (V1.8.0.112). Eight regions (100 μm × 100 μm) were selected per sample, and adaptive thresholding (Otsu method) was applied to segment graphene regions. The deposition rate was calculated as the percentage of graphene-covered pixels relative to the total area. Results were validated via SEM/EDS and Raman spectroscopy.

3. Results and Discussion

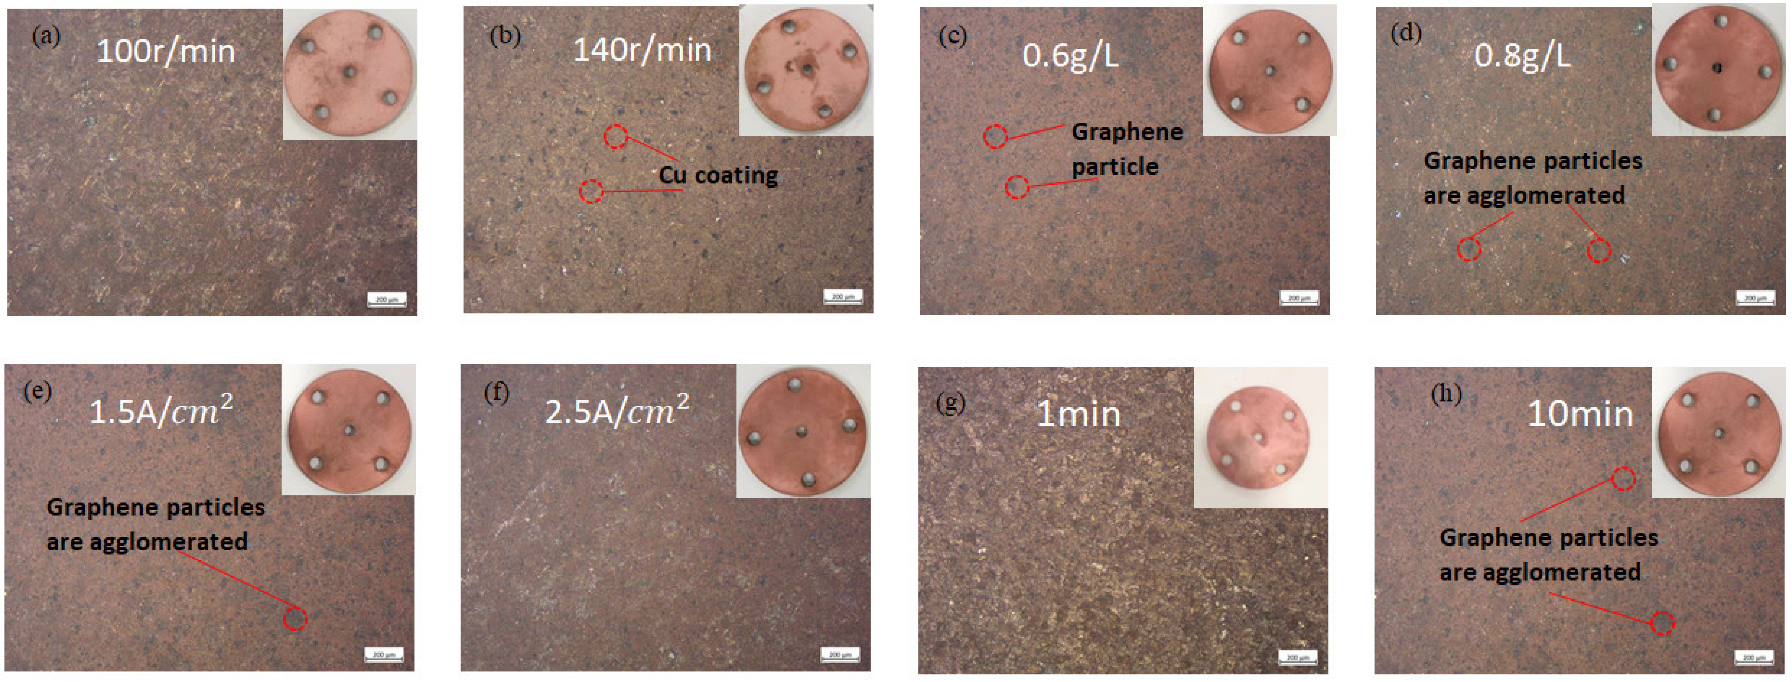
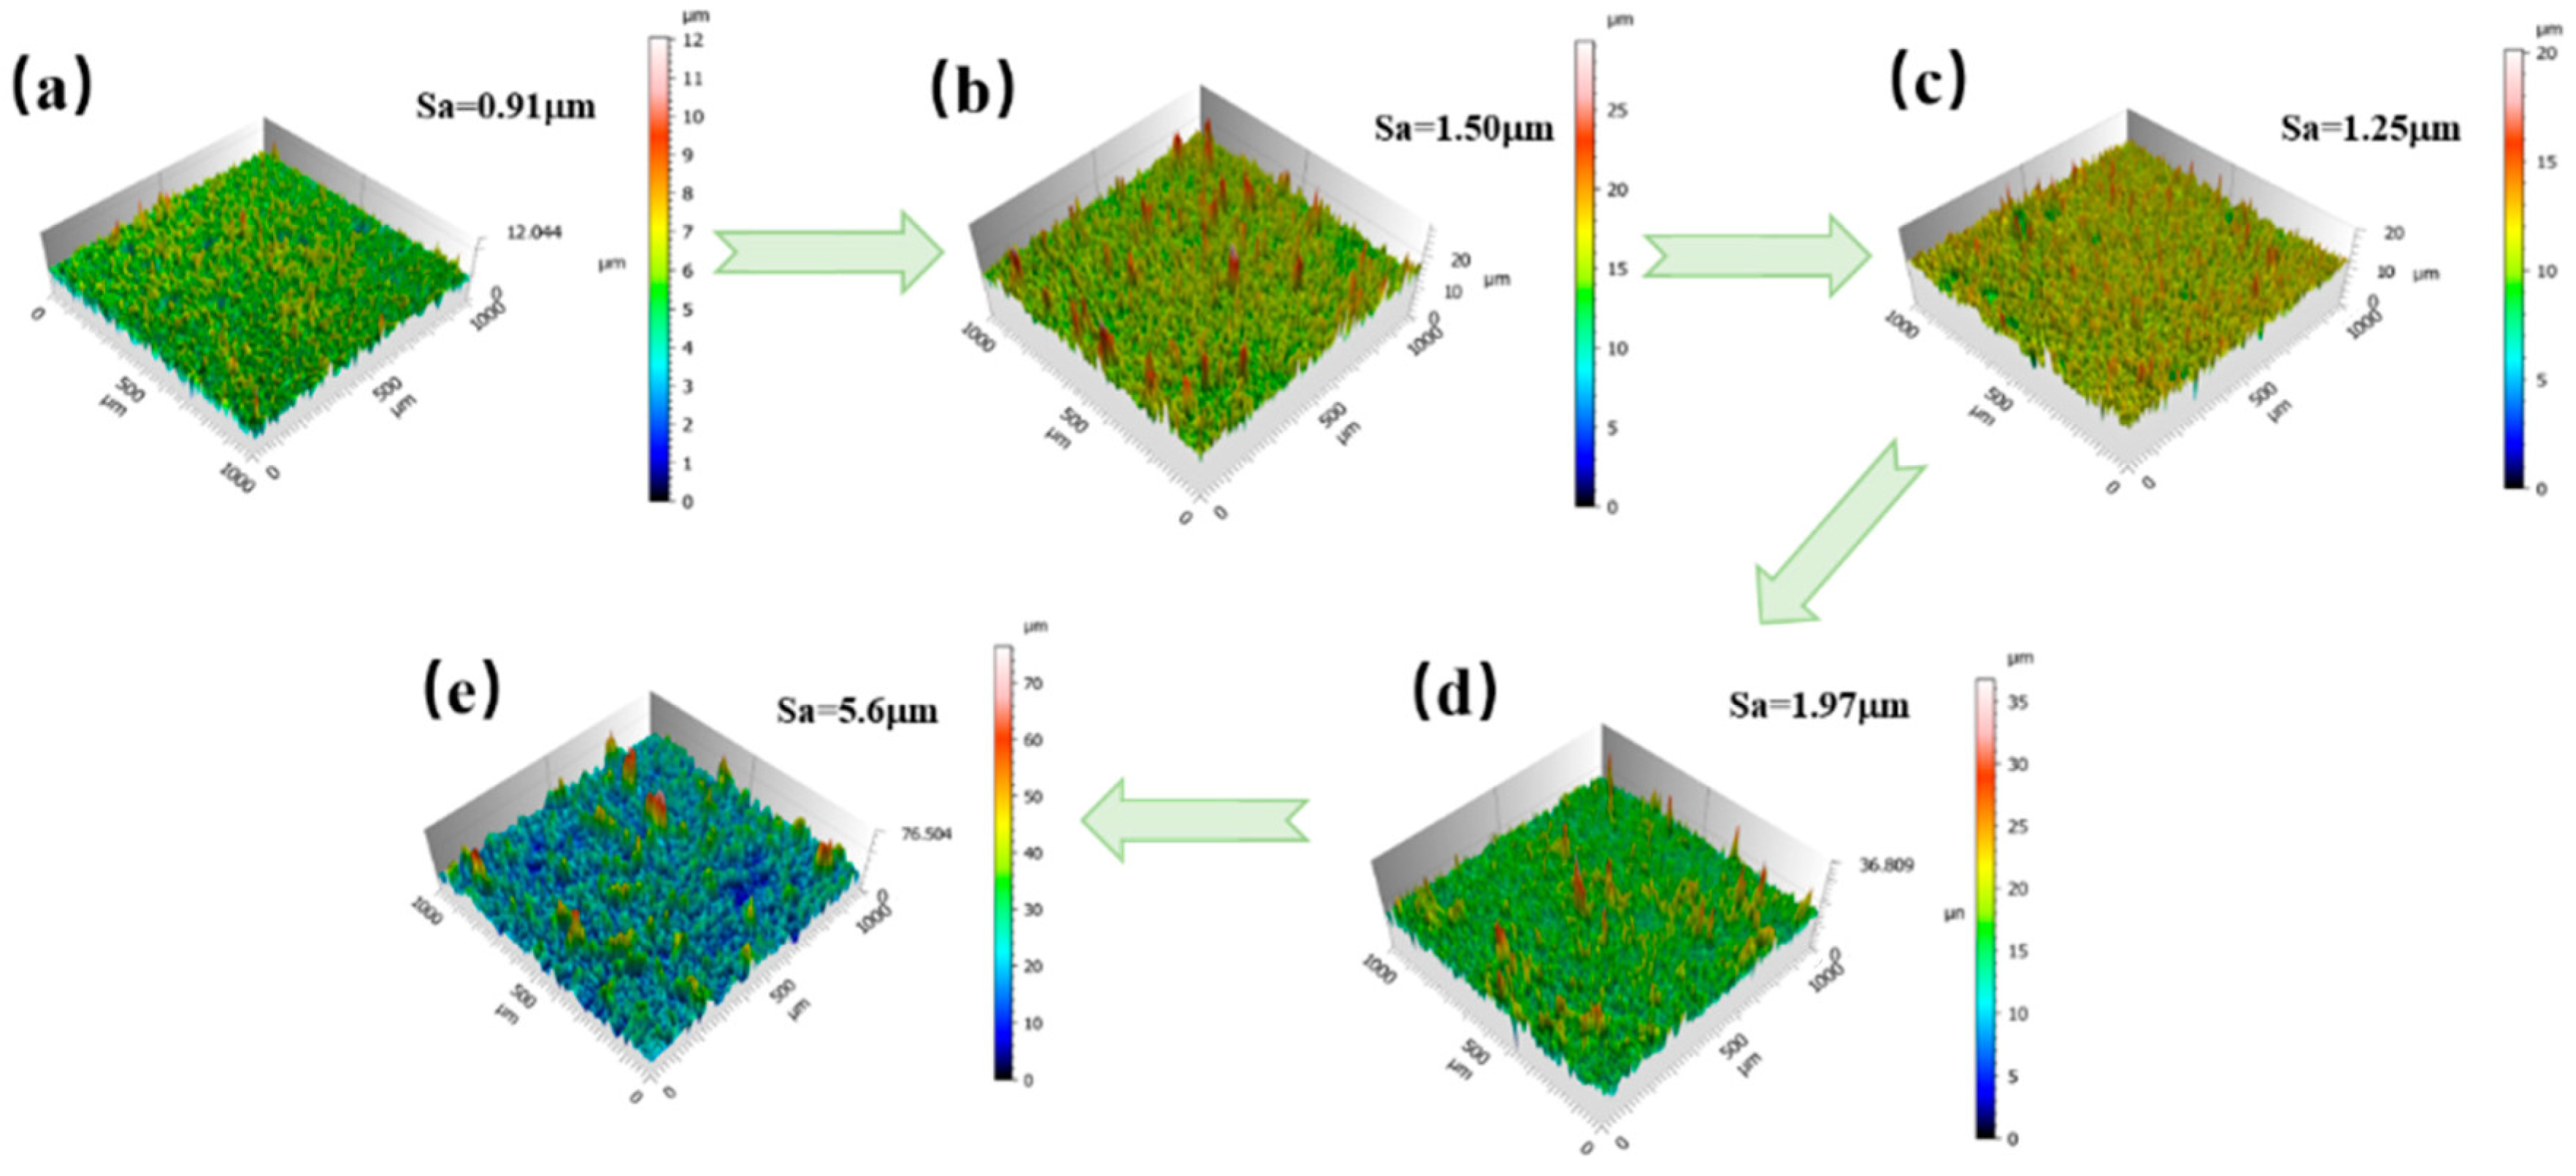
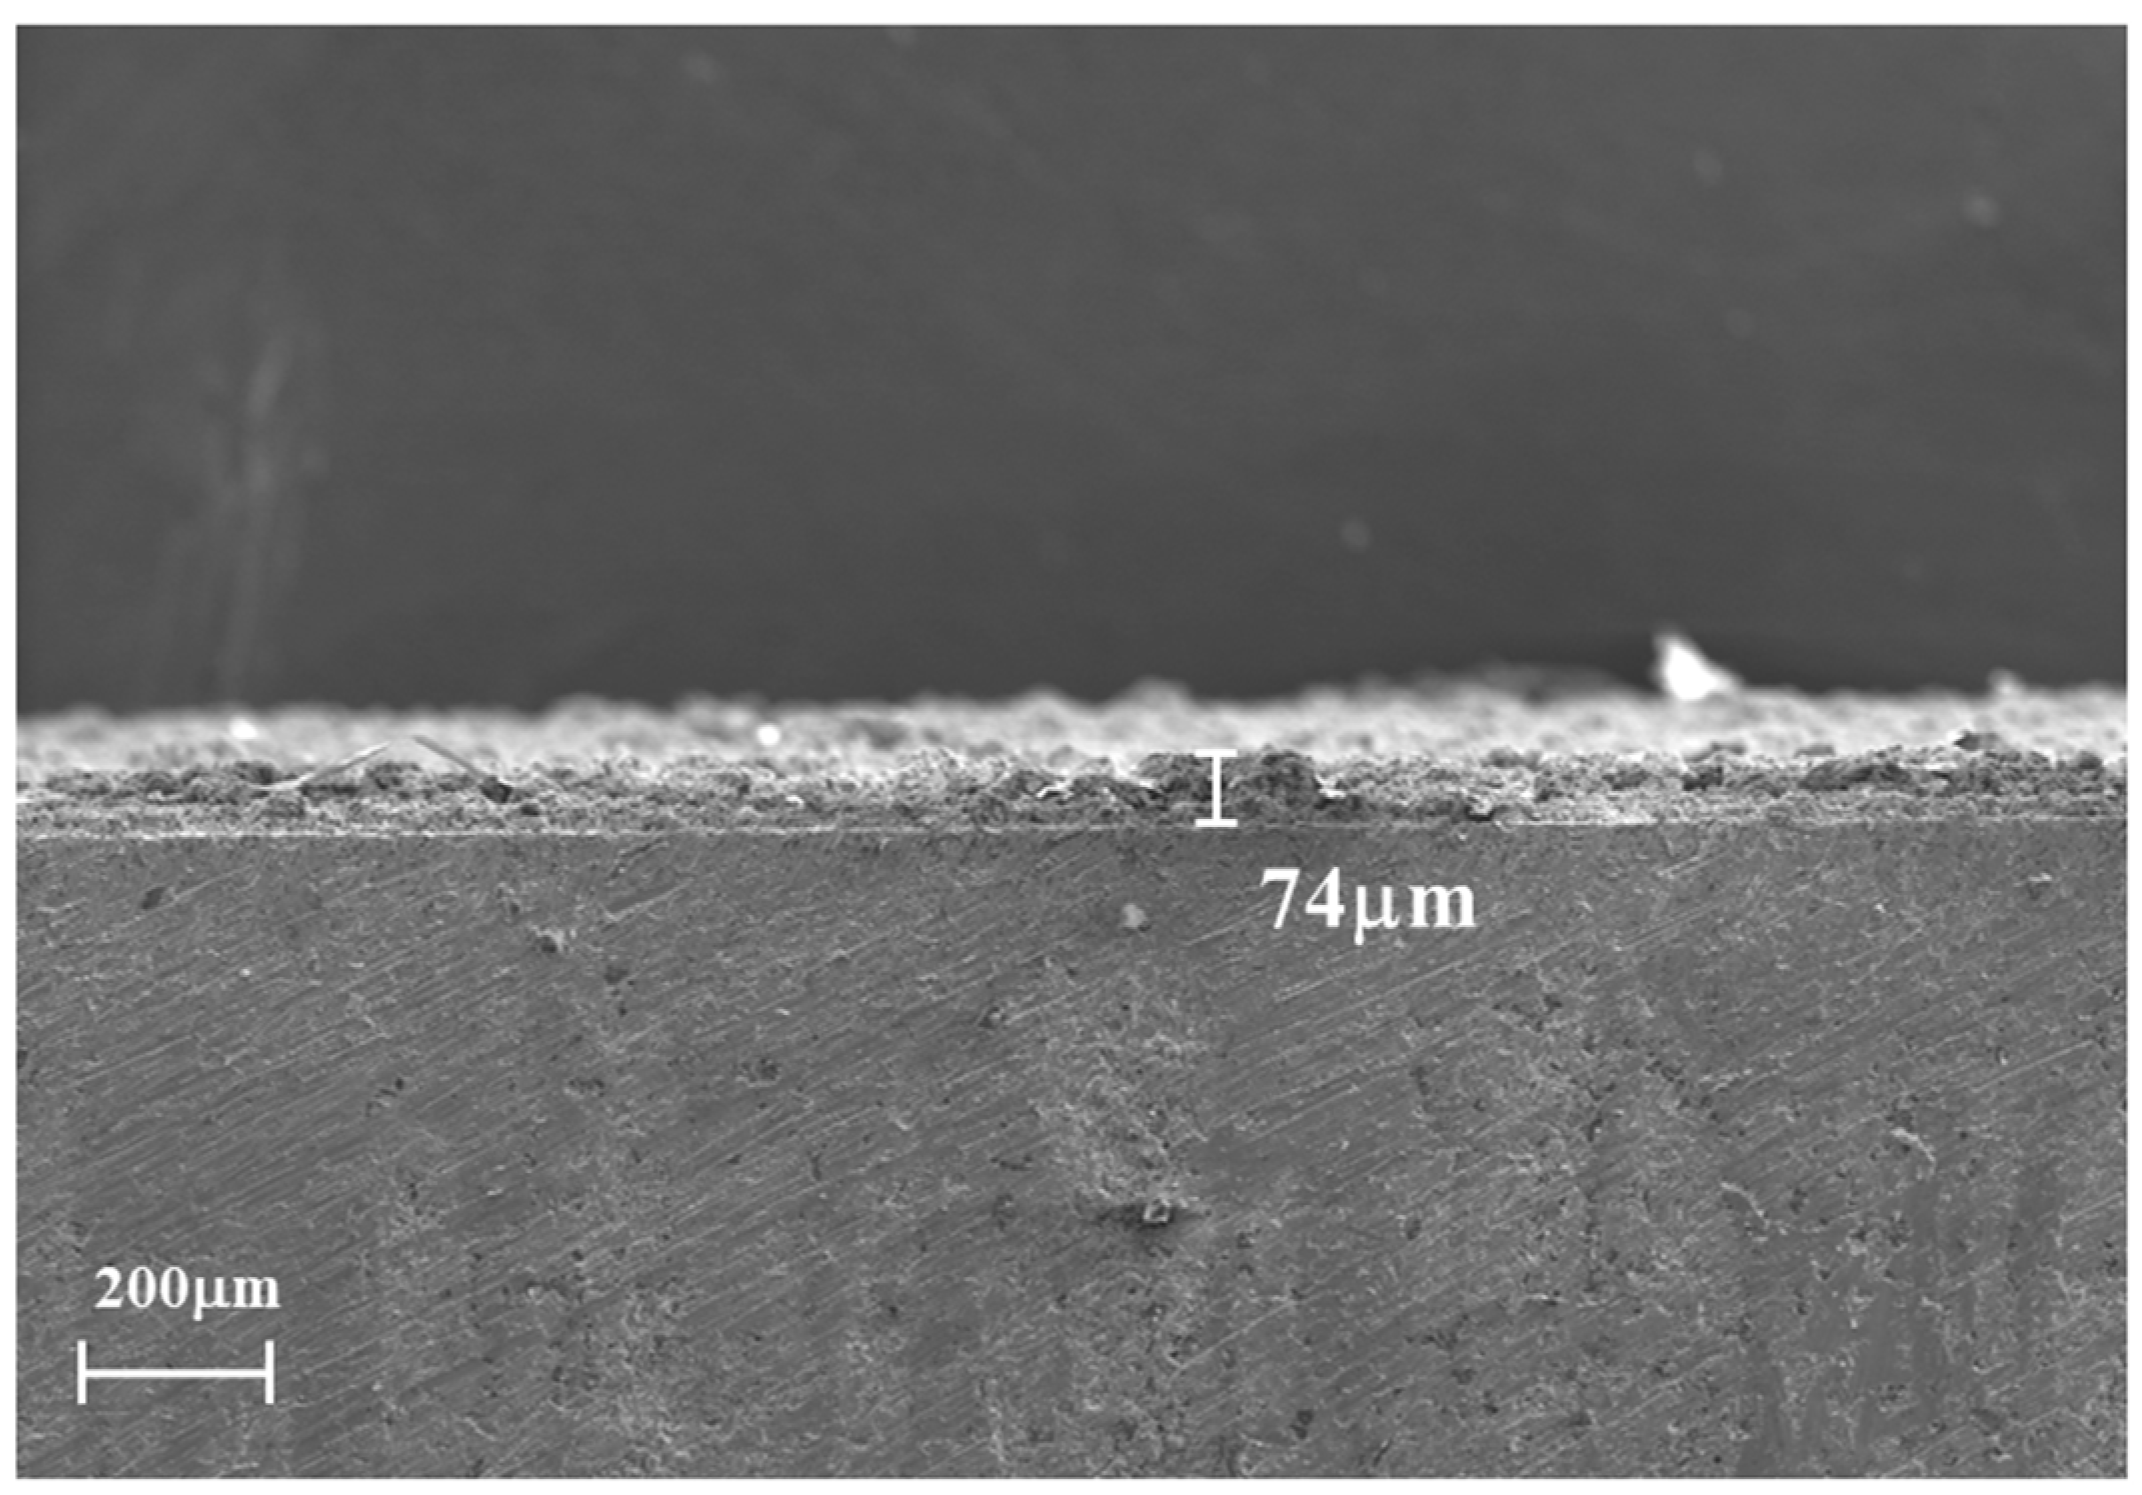
3.1. Composite Coating Characterization

Figure 4 presents the optical microscope morphology and macroscopic images of the composite coating under various electroplating parameters. Eight distinct areas on the sample surface were selected to calculate the graphene deposition rate, with the average value used as the final result. Figure 5 illustrates the graphene deposition rate of the Cu–GNS composite coating under different electroplating conditions.
Based on the graphene deposition rate, the experiment first identified the optimal stirring speed by maintaining a plating time of 10 min, a current density of 1.5 A/dm2, and a graphene nanosheet (GNS) concentration of 0.2 g/L, while varying the stirring speed. Figure 4 shows the macroscopic morphology of the Cu–GNS composite coating under different stirring intensities, along with the surface morphology observed under an optical microscope. At a stirring speed of 100 r/min, the surface morphology and gloss of the composite coating were similar to that of the Cu coating, with no apparent graphene particles observed. As the stirring speed increased, the color of the composite coating gradually darkened and the gloss diminished. At a stirring speed of 140 r/min, black GNS particles became visible on the sample surface. As shown in Figure 5a, the highest GNS deposition rate of 4.1% was achieved at this stirring speed. However, when the stirring speed was further increased to 220 r/min, the surface of the composite coating became uneven, with significant GNS agglomeration, deteriorating the overall appearance of the coating. This observation is consistent with the findings reported in the literature [35], and thus, 140 r/min was selected as the optimal stirring speed.
Figure 4c,d show the morphology of the collector rings with graphene contents of 0.6 g/L and 0.8 g/L. Based on the previous findings, the stirring intensity was set at 140 r/min, with other conditions remaining constant. As depicted in Figure 5b, the maximum GNS deposition rate of 9.89% was achieved at a GNS content of 0.8 g/L. When the GNS content exceeded 0.8 g/L, the deposition rate began to decline. Therefore, a GNS content of 0.8 g/L was selected as the optimal concentration.
Figure 4e,f shows the surface morphology of the composite coatings at current densities of 1.5 A/cm2 and 2.5 A/cm2. As illustrated in Figure 5c, the GNS deposition rate initially decreases, then increases, and subsequently decreases again with increasing current density. Specifically, at a current density of 0.5 A/cm2, the GNS deposition rate is 8.7%; at 1 A/cm2, the rate is 7.6%; at 1.5 A/cm2, the rate reaches a maximum of 9.3%; and at 2 A/cm2, the rate drops to 5.3%. At lower current densities, the electrodeposition rate is slow, allowing for extended interaction time between the precipitated metal ions on the electrode surface and the GNS, leading to homogeneous GNS deposition. However, lower current densities may not sufficiently drive GNS particles into the coating, resulting in lower overall deposition. As the current density increases, the electrodeposition rate accelerates, causing a rapid reduction of metal ions and increasing the likelihood of GNS particle embedding, thereby enhancing deposition. At this stage, a moderate current density is conducive to the co-deposition of GNS and the metal coating, with the optimal deposition achieved at 1.5 A/cm2. However, further increases in current density result in excessively fast electrodeposition rates, causing rapid reduction of metal ions on the electrode surface and the formation of a dense metal layer, which hinders GNS embedding. Additionally, higher current densities may cause local overheating and bubble generation, obstructing GNS deposition and resulting in a subsequent decrease in deposition. Therefore, 1.5 A/cm2 is identified as the optimal electroplating current density.
Figure 4g,h show the macroscopic morphology of the composite coatings at plating times of 1 min and 10 min, as well as the surface morphology observed under an optical microscope. When the plating time was 1 min, no obvious GNS particles were observed on the surface of the composite coating, and the surface morphology and gloss were similar to that of the Cu coating. According to Figure 5d, the GNS deposition rate was only 0.53% at a plating time of 1 min. The GNS deposition rate exhibited an initial increase followed by a decrease with increasing plating time. At a plating time of 10 min, the GNS deposition rate reached 9.36%. Therefore, a plating time of 10 min was determined to be optimal.
Subsequently, the current-carrying friction characteristics under different electroplating parameters were analyzed. While determining the optimal electroplating parameters, the current-carrying friction characteristics of the collector ring and the Cu–GNS composite coating under these optimal conditions were compared. Additionally, the mechanisms of friction wear and conductivity were analyzed.
Figure 6 shows that the roughness of the surface of the Cu–GNS composite plating increases with the increase of plating time, and the surface of the plating becomes rough and uneven. Afterward, the current-carrying friction and wear characteristics of the composite plating layer under different plating times are analyzed to further determine the plating time. The microscopic morphology and chemical composition of the specimens prepared under the optimal plating process conditions were characterized in Figure 7, which shows the cross-sectional area of the composite layer with a thickness of 74 μm. Meanwhile, obvious C peaks can be seen in the EDS spectra in Figure 8, which confirms the presence of the GNS and its embedding in the Cu-based composite layer. The composite layer mainly contains Cu and C elements, the content of Cu is 75.0 wt.%, and the content of C is 25.0 wt.%. The blue color in the figure represents the distribution of Cu elements and the green color represents the distribution of C elements, and the EDS results further show that the GNS has been deposited in the composite layer and the distribution is relatively uniform.
Figure 9 shows the Raman spectra of Cu–GNS composite coatings prepared under different stirring intensities. Raman spectra were analyzed for samples prepared at stirring intensities of 100 r/min, 140 r/min, and 180 r/min. The Raman results for the three samples reveal three prominent characteristic peaks at 1349.1 cm−1, 1584.4 cm−1, and 2720.9 cm−1, corresponding to the D peak, G peak, and 2D peak of GNS, respectively [36], confirming the presence of GNS in the composite coatings. Additionally, at a stirring intensity of 180 r/min, the Raman spectra exhibit more miscellaneous peaks, and the GNS characteristic peaks are weak, indicating a lower GNS content in the composite coating. The variation in the intensity of the GNS characteristic peaks suggests differing amounts of GNS deposition in the composite coatings. At a stirring intensity of 140 r/min, the GNS deposition is significantly higher, which correlates with the results shown in Figure 5a.

3.2. Analysis of Current-Carrying Friction and Wear Characteristics

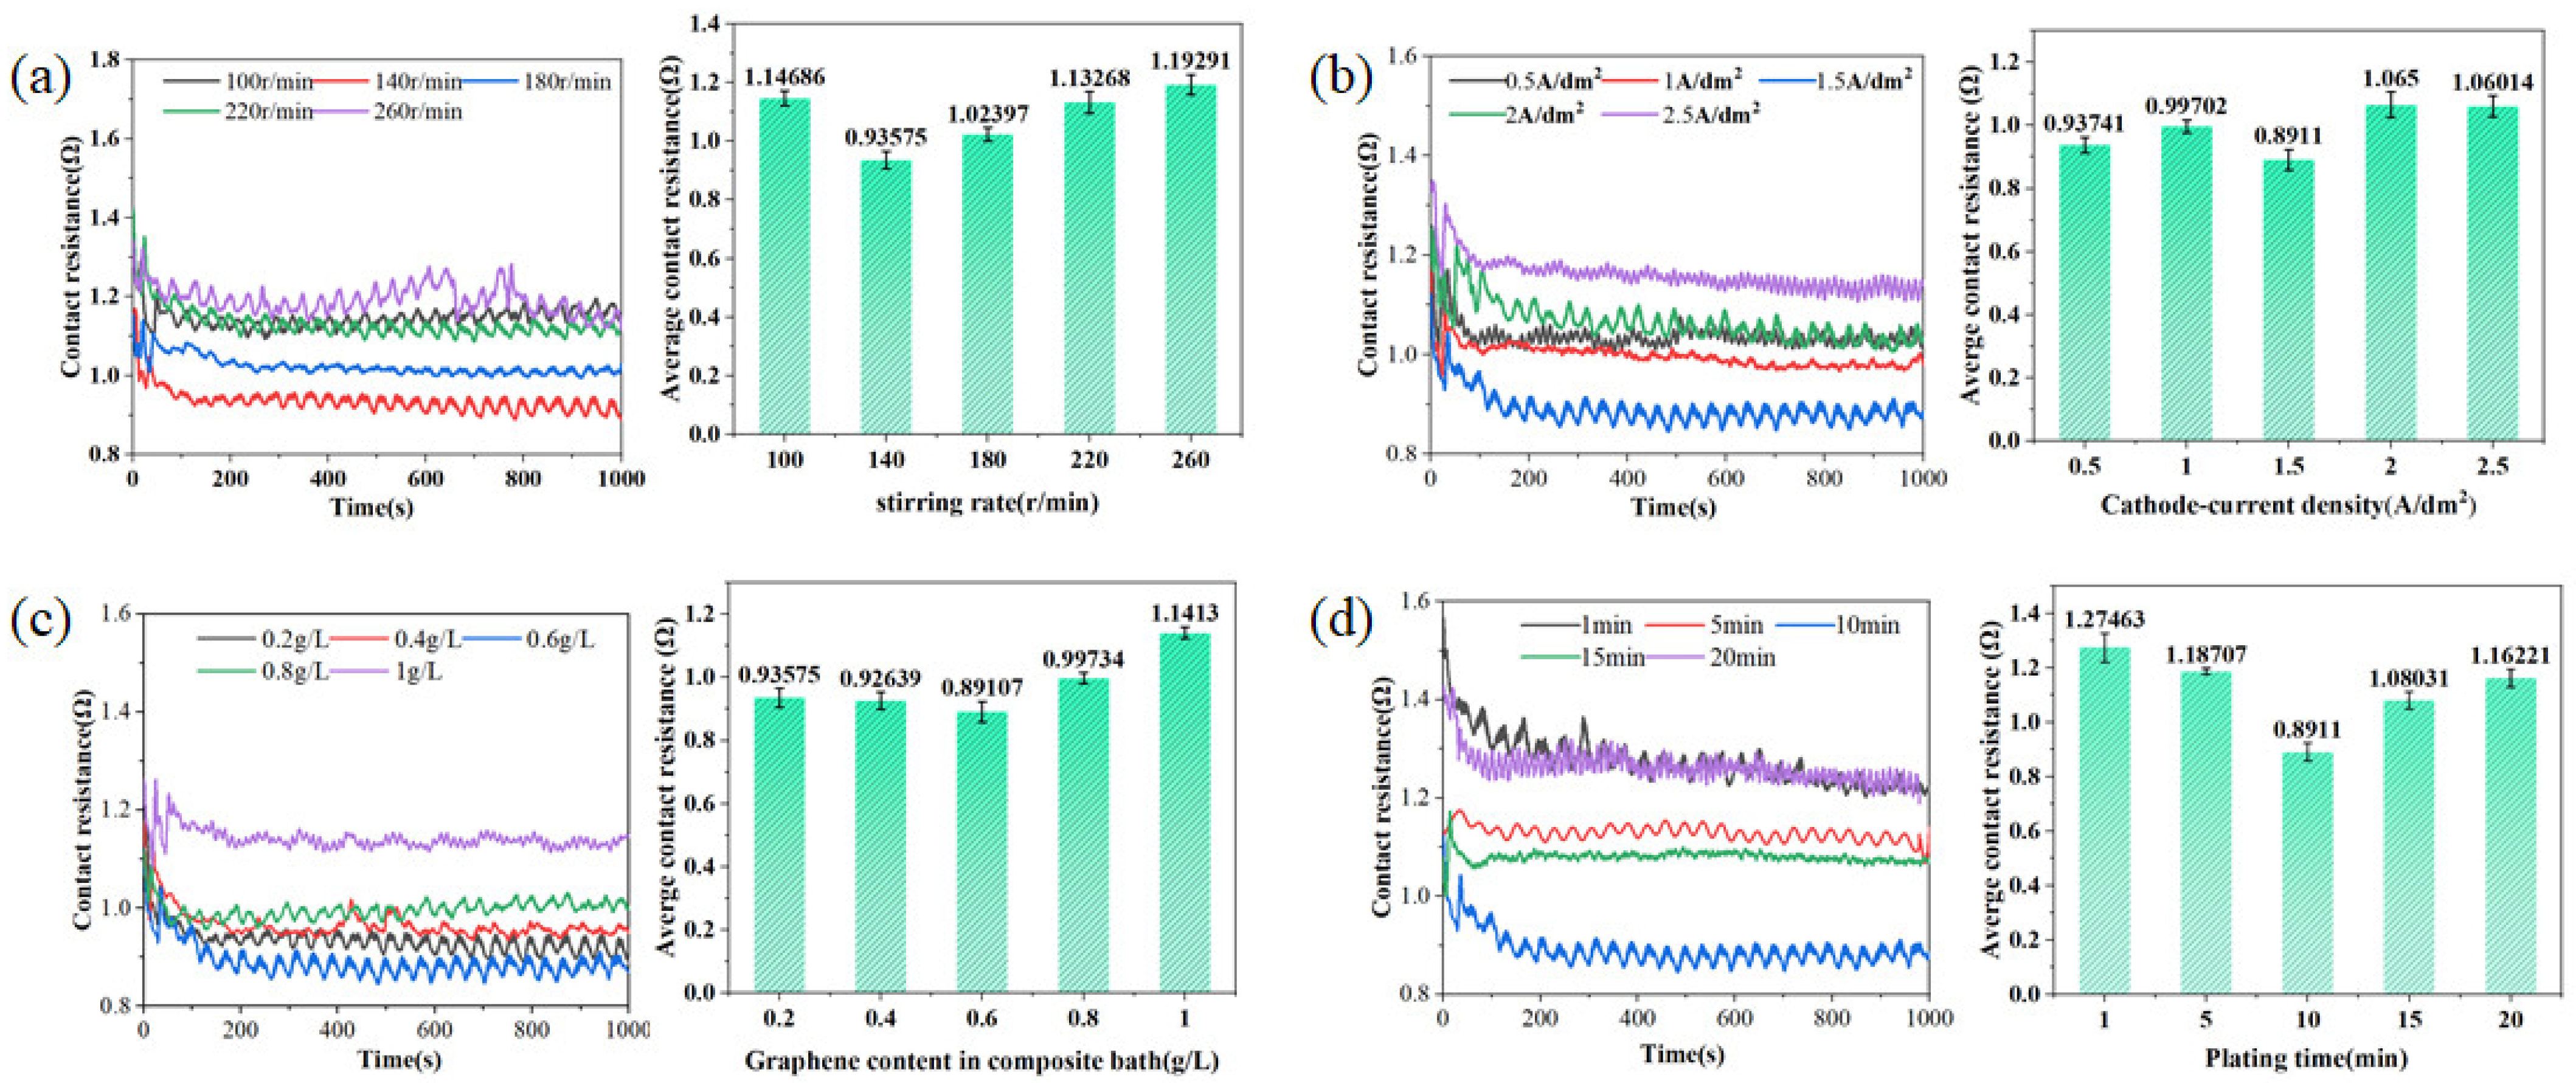
3.2.1. Cu-GNS Coating Contact Resistance Characteristics

Figure 10 illustrates the effect of Cu–GNS composite coating on contact resistance under varying electroplating parameters. As shown in Figure 10a, the average contact resistance initially decreases and then increases with increasing stirring speed, consistent with the GNS deposition rate. GNS, as a reinforcing phase, enhances the Cu layer’s conductivity on the collector ring. At a stirring speed of 140 r/min, the GNS deposition rate peaks at 4.1%, reducing the average contact resistance to 0.93575 Ω. Within the stirring speed range of 100–220 r/min, the dynamic contact resistance stabilizes within 100 s. However, at 260 r/min, the dynamic contact resistance remains unstable due to excessive stirring speed. This instability arises from incomplete Cu layer plating and uneven GNS distribution, leading to a less uniform coating and higher contact resistance. These results confirm that the optimal stirring speed of 140 r/min achieves the highest GNS deposition rate, the lowest contact resistance, and superior current-carrying friction performance.
Figure 10b depicts the dynamic contact resistance of the composite coating with varying GNS content. The average contact resistance decreases initially and then increases with rising GNS content. Although the GNS deposition rate is highest at 0.8 g/L (Figure 5b), the lowest contact resistance (0.8911 Ω) is achieved at 0.6 g/L GNS. This is because increasing graphene content in the plating solution raises the number of suspended particles, enhancing graphene incorporation into the coating. However, excessive graphene content leads to particle agglomeration, hindering adsorption onto the collector ring surface and forming voids or discontinuous conductive paths. These defects reduce electron conduction efficiency and the coating’s overall conductivity. To ensure uniform GNS deposition and optimal electrical conductivity, a GNS content of 0.6 g/L is identified as the optimal plating parameter.
Figure 10c shows the effect of current density on dynamic contact resistance, which follows a trend similar to the GNS deposition rate. At a current density of 1.5 A/dm2, the average contact resistance reaches its lowest value of 0.8911 Ω, and the dynamic contact resistance stabilizes within 100 s. Therefore, a current density of 1.5 A/dm2 is identified as the optimal condition for achieving superior performance.
Figure 10d illustrates the effect of plating time on dynamic contact resistance, showing a trend similar to the GNS deposition rate. At a plating time of 1 min, the average contact resistance is highest at 1.2746 Ω, comparable to that of pure Cu coating. The lowest average contact resistance (0.8911 Ω) occurs at 10 min. However, further increasing the plating time to 20 min raises the resistance to 1.262 Ω. Based on the macro morphology of the collector ring and the GNS deposition rate, a plating time of 10 min is identified as optimal. Further analysis of the friction and wear characteristics of the composite coating will be discussed in subsequent sections.

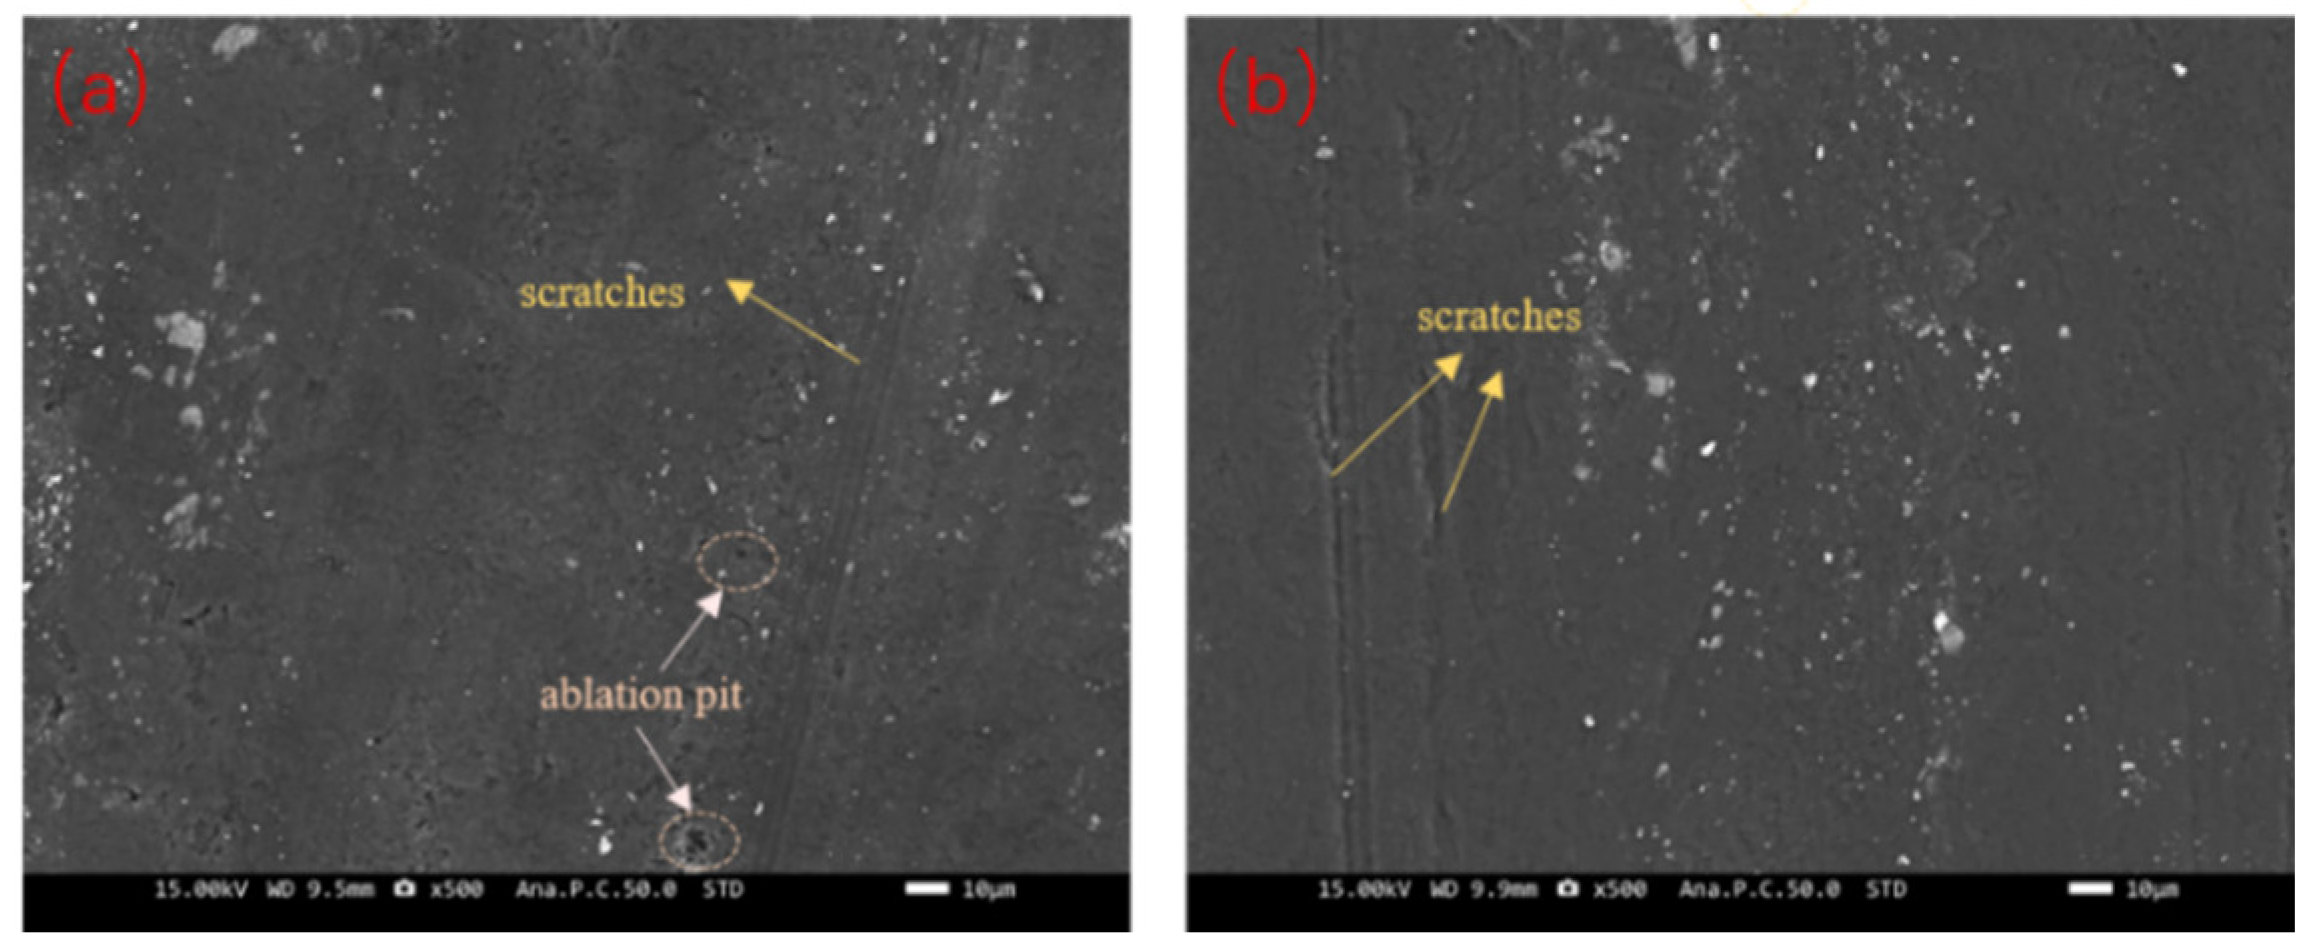
3.2.2. Friction and Wear Characteristics of Cu-GNS Coating

Figure 11 illustrates the influence of Cu–GNS composite coating on friction and wear under varying electroplating parameters. Figure 11a shows the friction coefficient and wear rate as functions of stirring speed, both of which initially decrease and then increase, consistent with the GNS deposition rate. This highlights the significant role of GNS in improving the friction and wear characteristics of the composite coating. At a stirring speed of 140 r/min, optimal performance is achieved, with the friction coefficient reaching 0.255 and the wear rate at 0.1723 g/m2·s.
Figure 11b shows the variation in friction coefficient and wear rate with different GNS contents. Both parameters initially decrease and then increase as the GNS content rises, while the GNS deposition rate peaks at 0.8 g/L. However, excessive GNS content leads to particle agglomeration, the formation of localized bumps, and increased surface roughness. The actual contact area of the rough surface is reduced (contact is concentrated at the top of the micro-bumps), leading to localized stress concentration and increased adhesive wear between the friction partners, which significantly increases the coefficient of friction and wear rate. Resulting in a higher friction coefficient and elevated wear. The Cu–GNS composite coating with 0.6 g/L GNS content demonstrates the best friction and wear performance, with a friction coefficient of 0.2149 and a wear rate of 0.1667 g/m2·s.
Figure 11c shows the variation in friction coefficient and wear rate with current density. Both parameters initially decrease and then increase, consistent with the GNS deposition rate trend. At a current density of 1.5 A/dm2, the Cu–GNS composite coating achieves the lowest friction coefficient (0.2149) and wear rate (0.1667 g/m2·s). Thus, a current density of 1.5 A/dm2 is identified as optimal for achieving superior friction and wear performance.
Figure 11d illustrates the impact of plating time on the friction and wear characteristics of the Cu–GNS composite coating. Both the friction coefficient and wear rate initially decrease and then increase with increasing plating time. At a plating time of 10 min, the Cu–GNS composite coating exhibits a friction coefficient of 0.2145 and a wear rate of 0.1667 g/m2·s.
This study confirms that the Cu–GNS composite coating achieves optimal surface conductivity, friction, and wear properties with a plating time of 10 min. The comprehensive analysis identified the optimal electroplating parameters as a stirring speed of 140 r/min, GNS concentration of 0.6 g/L, plating time of 10 min, and current density of 1.5 A/dm2. Under these conditions, the Cu–GNS composite coating demonstrates an average contact resistance of 0.8911 Ω, a friction coefficient of 0.2145, and a wear rate of 0.1667 g/m2·s. The current-carrying friction characteristics of the Cu–GNS composite coating prepared under these parameters were then compared with those of the collector ring.

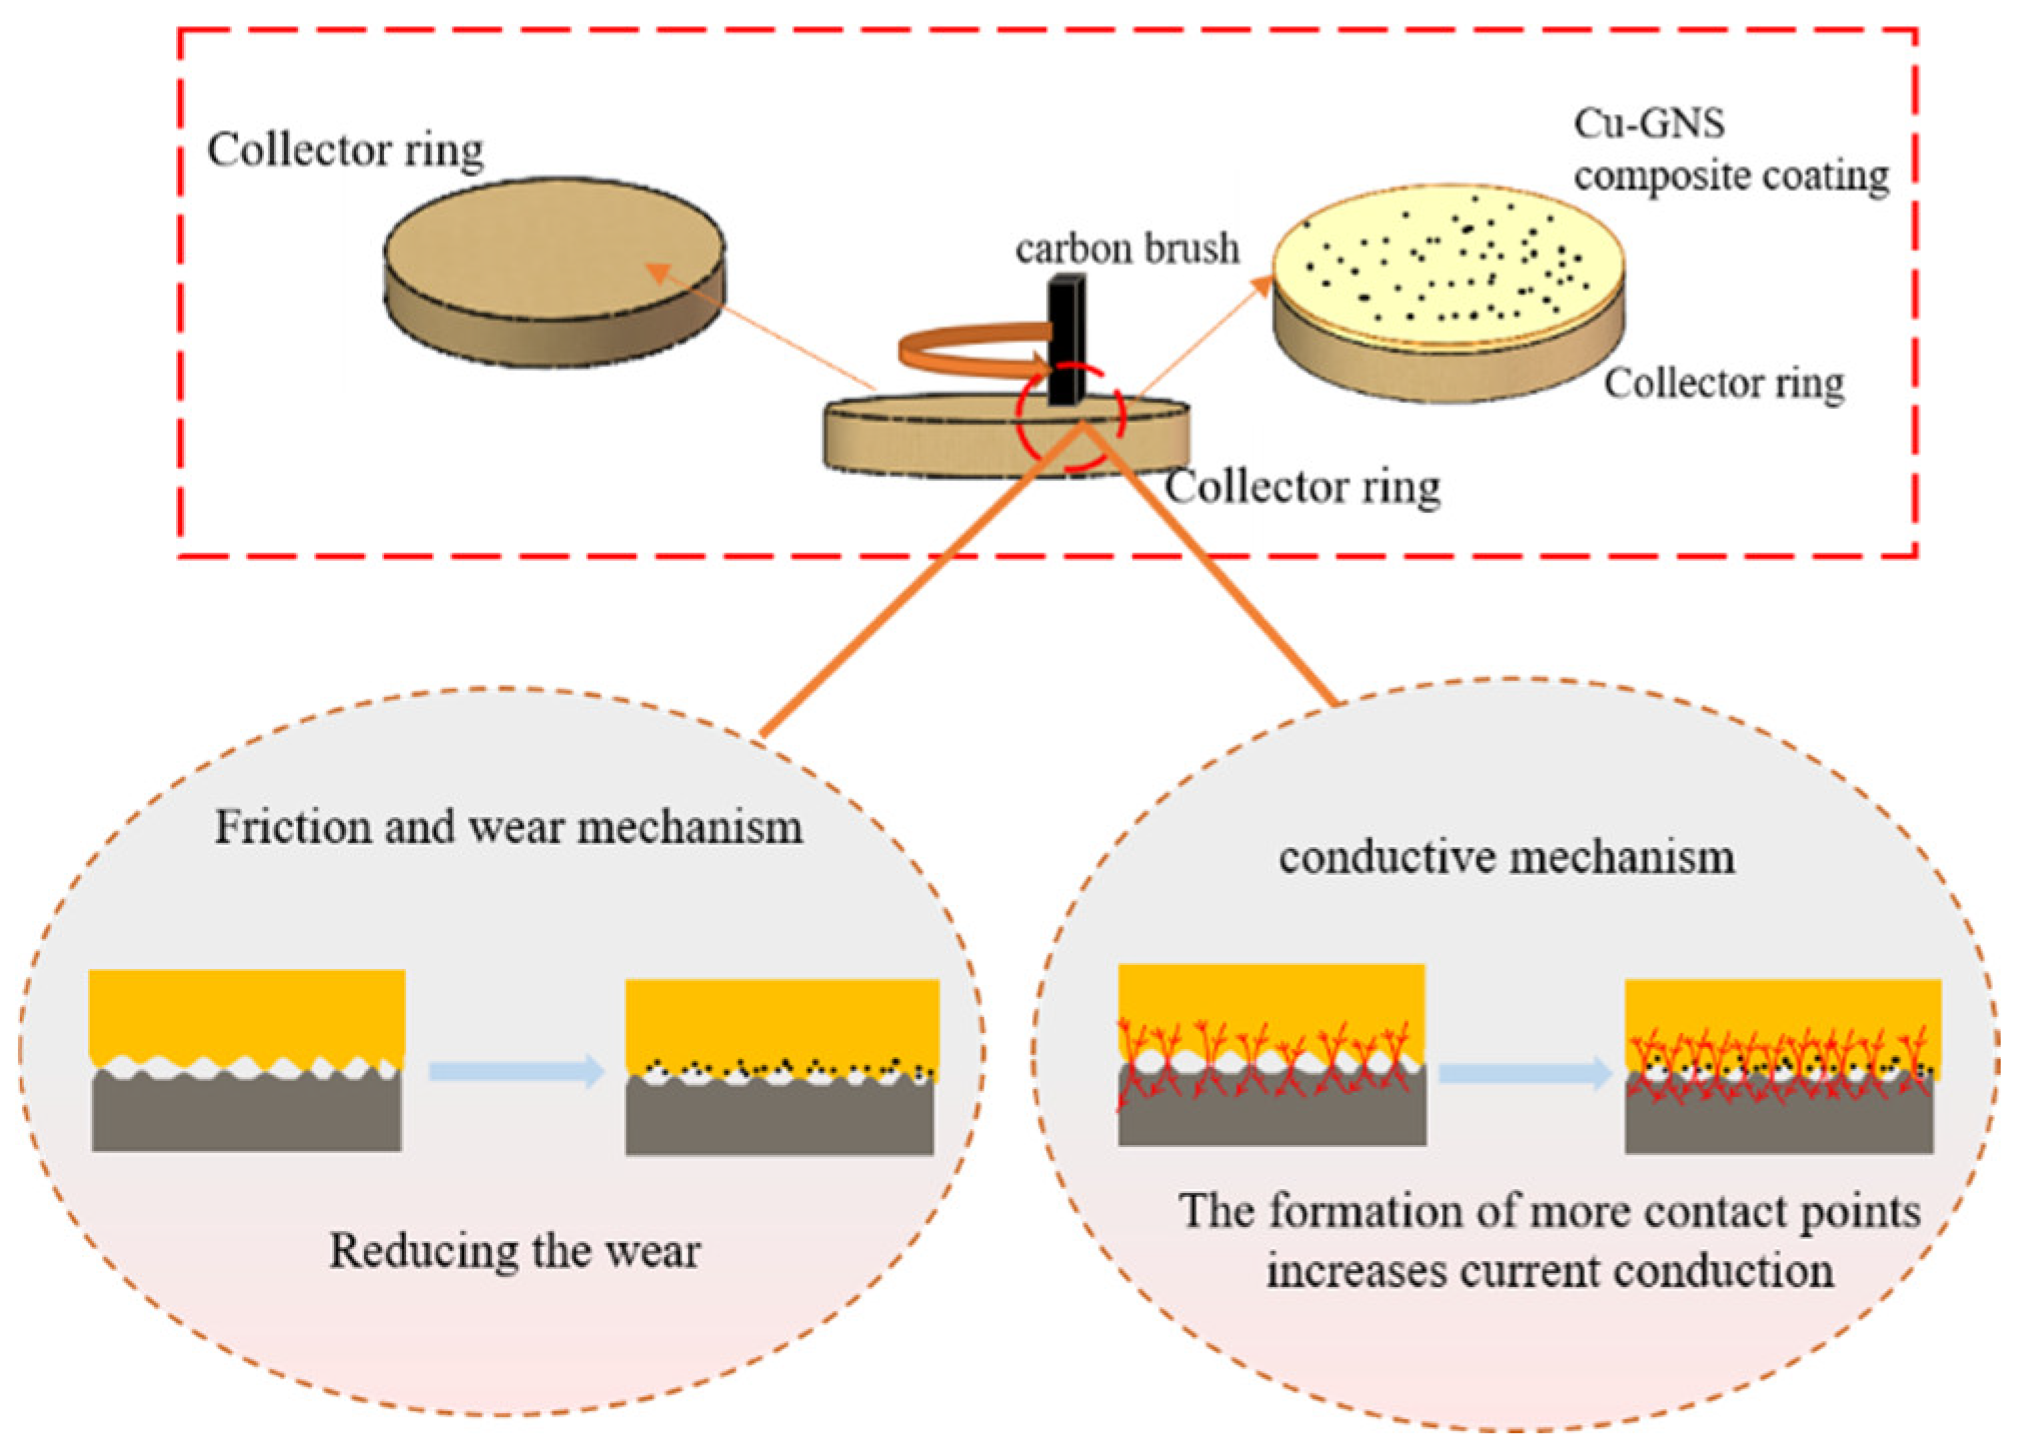
3.3. Study on Tribological Mechanism of Cu/Graphene Composite Coating

Collector ring materials must possess excellent electrical conductivity and superior wear resistance. Figure 12 compares the current-carrying friction characteristics of a conventional collector ring and the optimized Cu–GNS composite coating. The Cu-GNS coating exhibits a 32.58% reduction in contact resistance, a 37.59% decrease in friction coefficient, and an 18.16% lower wear rate compared to the conventional collector ring, significantly enhancing its performance. The superior electrical conductivity of graphene nanosheets (GNSs) ensures more uniform current distribution, reducing local overheating and arc formation. As shown in Figure 13, the wear mechanism transitions from arc erosion and mechanical wear (Figure 13a) in the carbon brush to predominantly mechanical wear (Figure 13b) with the application of the Cu–GNS composite coating.
Analysis of Figure 5 and Figure 9 shows that the GNS deposition rate aligns with Raman spectra data, while Figure 14 highlights the corresponding friction and conductivity characteristics. On the brush ring contact surface, microscopic protrusions (micro-bulges) form the contact points, significantly affecting the contact area and frictional behavior. The number, shape, and distribution of these protrusions influence the friction coefficient and wear rate, with rougher surfaces typically exhibiting higher friction coefficients. The incorporation of GNS into the Cu layer improves the coating’s electrical conductivity due to GNS’s superior conductivity, which enhances electron transport between Cu grains, increasing conductive pathways. However, excessive GNS deposition can lead to particle agglomeration, compromising coating uniformity and creating gaps that reduce conductivity. Additionally, GNS’s two-dimensional structure, with weak van der Waals forces between layers, allows GNS sheets to slide during friction, providing a lubricating effect and reducing the friction coefficient. Excessive GNS content, however, causes agglomeration, forming larger clusters that disrupt uniformity, increase internal defects, and weaken the lubrication effect, raising the friction coefficient. Therefore, the GNS deposition rate and distribution within the Cu–GNS composite coating critically affect its friction and wear properties, highlighting the importance of optimizing electroplating parameters for balanced performance.

3.4. Research on the Corrosivity of the Collector Ring

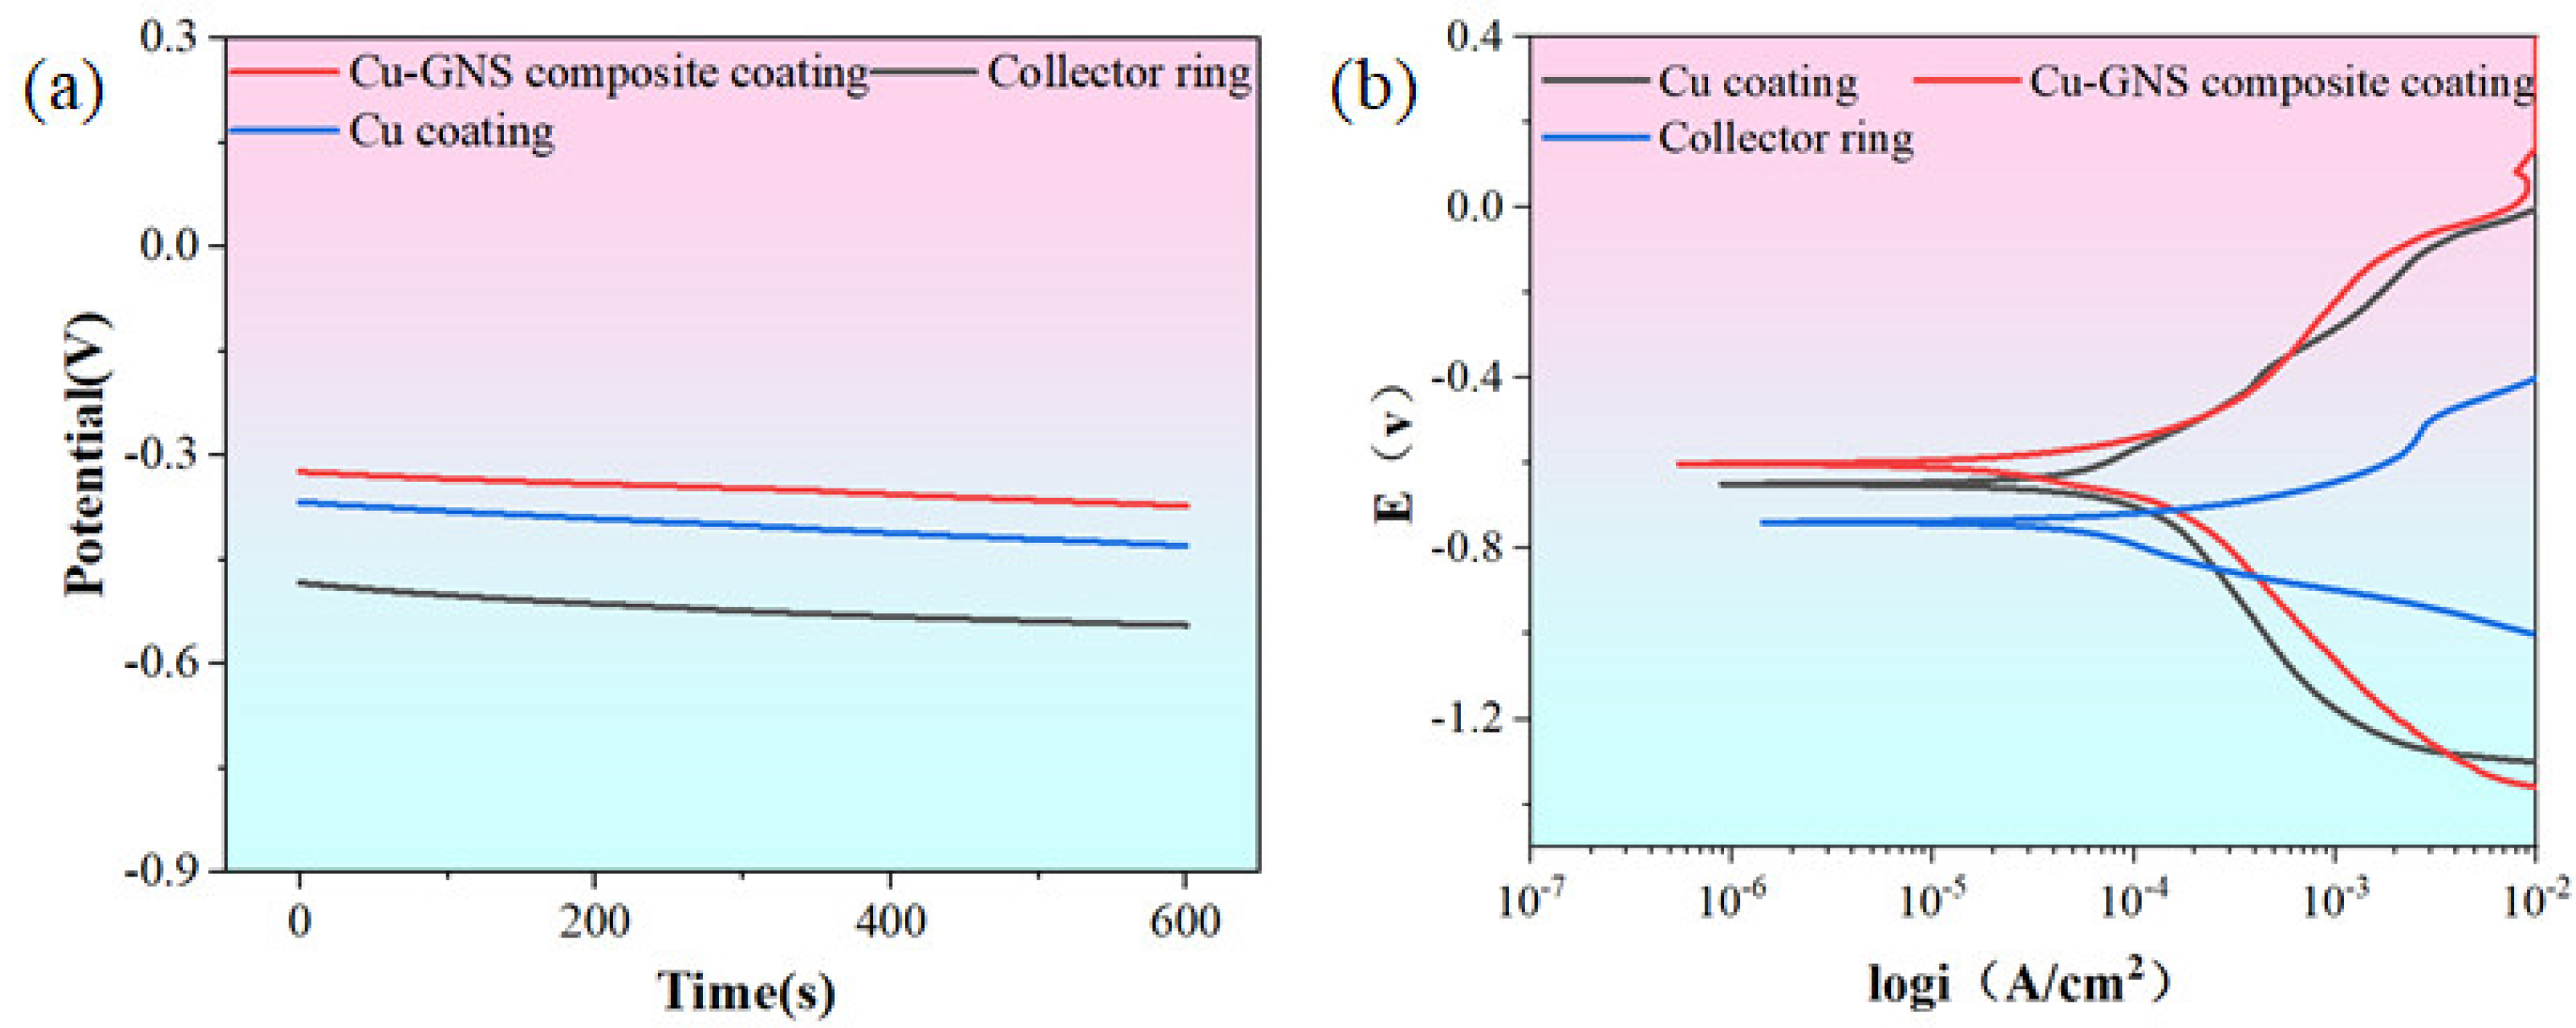
3.4.1. Experiment on Erosive Electrochemistry

Electrochemical testing offers a direct approach to studying corrosion behavior. Figure 15 illustrates the corrosion performance of collector rings under different pressures (0–1.5 N) in a 3.5 wt% NaCl solution. Figure 15a shows the open-circuit potential over time, reflecting the corrosion tendency of the collector ring; higher values generally indicate lower corrosion susceptibility. The open-circuit potential stabilizes within 600 s, with the stabilized values summarized in Table 1. In the 3.5 wt% NaCl solution, the open-circuit potential follows the order: 1 N > 0.6 N > 1.5 N > 0.3 N > 0 N, indicating the lowest corrosion tendency at 1 N. Within the 0 to 1 N range, corrosion tendency decreases but slightly increases beyond 1 N. Since open-circuit potential alone does not directly correlate with electrochemical corrosion resistance, further polarization studies are required for a comprehensive evaluation.
Figure 15b shows the potentiodynamic polarization curves of the collector ring in a 3.5 wt% NaCl solution under varying loads. In the absence of load, the self-corrosion potential is notably positive, and the self-corrosion current density is low. The polarization curves were fitted to determine the self-corrosion potential (Ecorr) and current density (Icorr), with the parameters listed in Table 2. As the applied load increases, the self-corrosion potential shifts positively, reaching its most positive value of −0.7662 V at 1 N, where the self-corrosion current density is lowest (2.47 × 10⁵ A/cm2). At 1.5 N, the potential shifts negatively to −0.9594 V, and the current density increases to 6.84 × 10⁵ A/cm2. As shown in Table 2, corrosion resistance follows the trend: 1 N > 0.6 N > 1.5 N > 0.3 N > 0 N. This suggests that an external load reduces the exposure of the matrix to the corrosive solution, enhancing corrosion resistance. However, at 1.5 N, the excessive load disrupts the passivation film, decreasing corrosion resistance. In conclusion, 1 N results in the lowest corrosion rate and highest resistance, consistent with open-circuit potential and polarization curve data.
Figure 16 illustrates the corrosion behavior of the collector ring and Cu–GNS composite coating under 1 N pressure. The electrochemical impedance spectral data were fitted by an equivalent circuit model containing a Constant Phase Element (CPE) (Figure 16d). The CPE is used to characterize the non-ideal capacitive behavior caused by electrode surface roughness or heterogeneity, and its impedance is defined as Z C P E = 1 Q ( j ω ) n , where Q is the pseudocapacitance parameter (in S · sn/cm2), and n (0 ≤ n ≤ 1) is the dispersion index. When n = 1, the CPE degenerates to an ideal capacitance. In Figure 16a, the open-circuit potential of the sample reaches a stable state within 600 s of testing. According to Table 3, it is evident that the Cu–GNS composite coating exhibits the lowest corrosion tendency, while the collector ring shows the highest. Figure 16c displays the impedance changes, where the arc radius of capacitive reactance in the electrochemical AC impedance spectrum indicates the corrosion resistance of the specimen surface. A larger arc radius corresponds to better corrosion resistance of the specimen’s surface film [37]. The figure shows that the arc radius of the Cu–GNS composite coating in the low-frequency region is significantly larger than that of the collector ring. Therefore, the Cu–GNS composite coating acts as a protective layer, enhancing the corrosion resistance of the collector ring and providing optimal protection for the substrate, consistent with the open-circuit potential test results. Figure 16b depicts the Tafel plot, illustrating the relationship between the self-corrosion potential (Ecorr) and self-corrosion current density (Icorr) for the samples. As shown in Table 4, the Cu–GNS composite coating has the highest self-corrosion potential at −0.6195 V, and its self-corrosion current density is significantly reduced to 2.21 × 10⁻⁵ A/cm2. This indicates that the Cu–GNS composite coating offers superior corrosion resistance.
The Cu–GNS composite coating consists of two parts: the substrate and the coating [38]. Electrochemical experiments were conducted on the collector ring of composite electroplating in a 3.5% NaCl solution. The double-layer capacitor (Cdl) and charge transfer resistance (Rct) play major roles in the corrosion process. Based on the analysis, the electrochemical process can be represented by the equivalent circuit of the collector ring, as illustrated in Figure 17d. In this circuit, Rs represents the solution resistance, Rct is the charge transfer resistance, Cdl is the double electric layer capacitor, Rbl is the barrier layer resistance, and Cbl is the barrier layer capacitance. As shown in Table 5, the charge transfer resistance (Rct) of the Cu–GNS composite coating has the highest value, measuring 244.4 Ω·cm2, which significantly enhances the corrosion resistance of the material.

3.4.2. Immersion Experiment

In high-power motors or generators, residual charges may persist after shutdown, causing a brief current flow. If connected to an external power source, the current can continue to pass through the collector ring and carbon brush even when the machine is off. For example, some motors maintain field excitation during shutdown, allowing a small current to preserve the magnetic field. Additionally, in environments with poor insulation or high humidity, minor leakage currents may occur, which, although minimal, can contribute to corrosion. To investigate the effect of current density on the formation of the surface film on the collector ring, Figure 17 shows macroscopic images of corrosion at varying current densities under 1 N pressure. The contact area between the carbon brush and the collector ring is clearly visible, unaffected by the corrosive liquid. Without current, no distinct boundary exists at the contact point. As current density increases, a demarcation line appears, highlighting the effect of current density on the formation and degradation of the surface film. At a current density of 12 A/cm2, this line becomes indistinct, and the surface film uniformly covers the entire collector ring. Figure 18 shows the corrosion rate of the collector ring at different current densities under 1 N pressure. In the absence of current, the naturally formed passivation film provides some protection, resulting in a slower corrosion rate. However, as current density increases, electrochemical reactions intensify, disrupting the surface film and accelerating corrosion. When the current density reaches 12 A/cm2, the corrosion rate starts to decline. Between 0 and 9 A/cm2, low current densities lead to the formation of unstable or loose films, which are ineffective in preventing corrosion.
According to the corrosion rates shown in Figure 19 or samples under 1 N pressure and a current density of 12 A/cm2, the Cu–GNS composite coating exhibits the slowest corrosion rate. This observation aligns with the electrochemical corrosion results, demonstrating that the Cu–GNS composite coating significantly enhances the corrosion resistance of the collector ring.

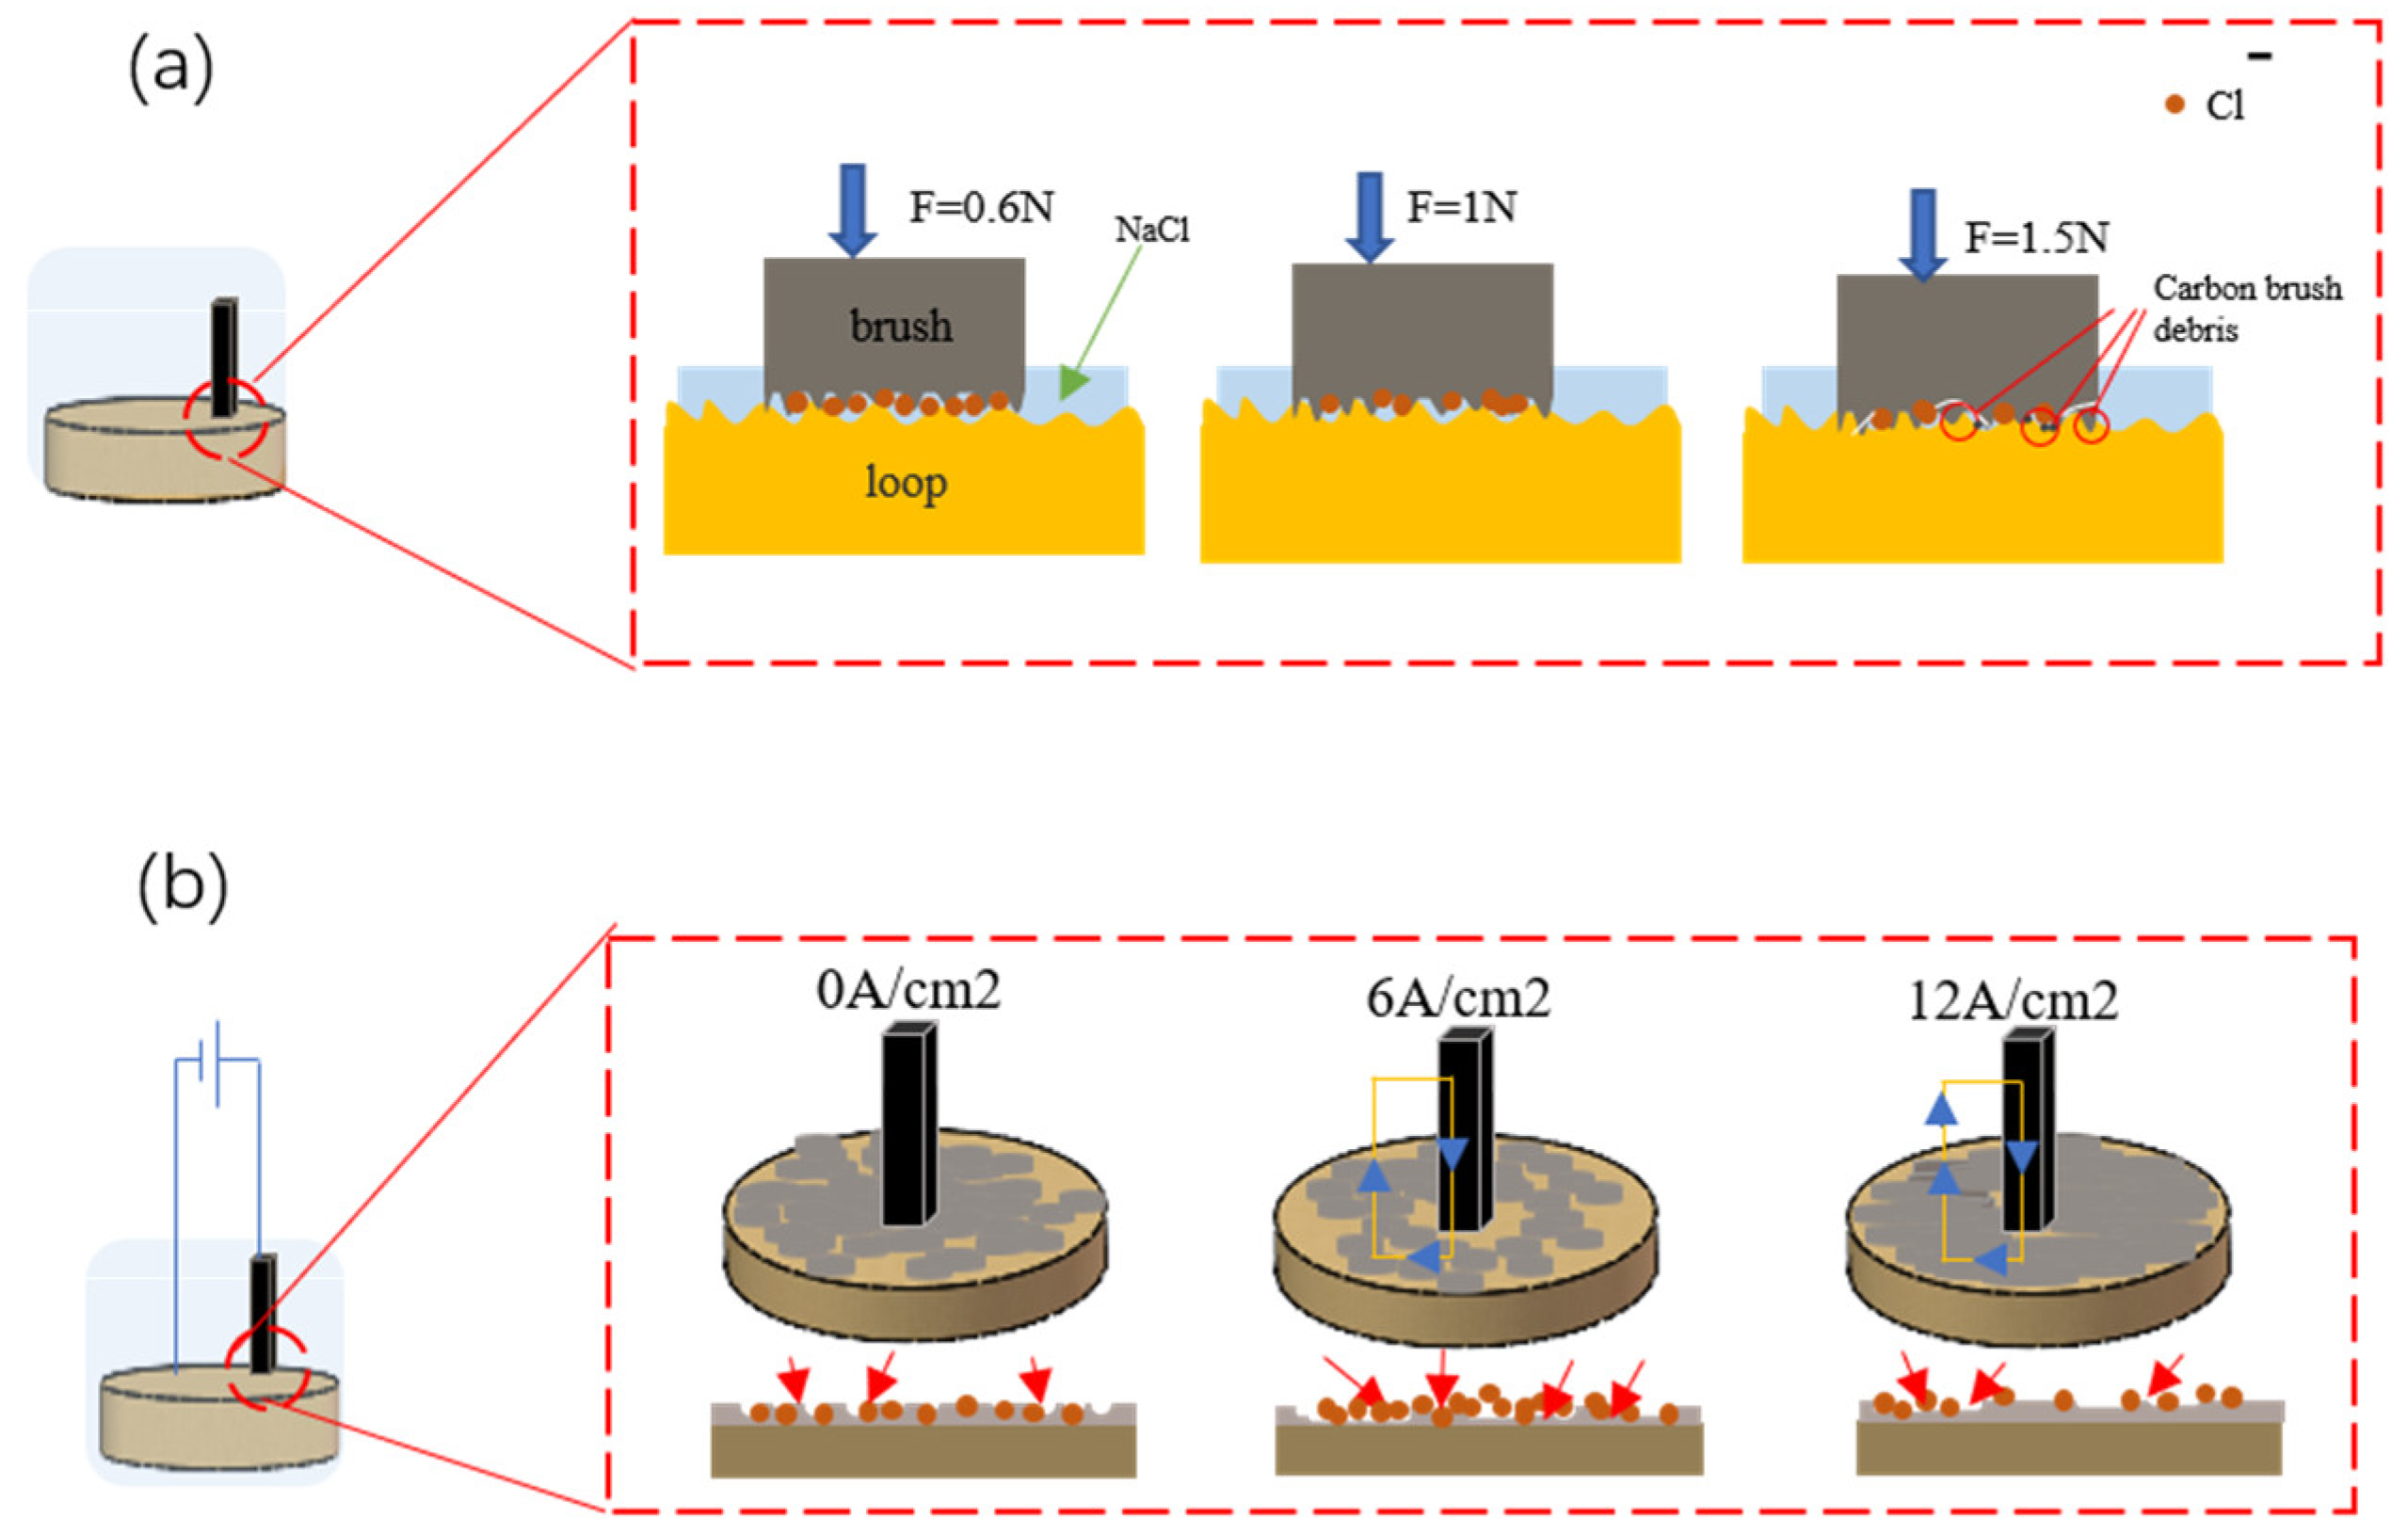
3.4.3. Corrosion Mechanism Study

Figure 20a illustrates the mechanism by which pressure affects the corrosion resistance of the collector ring. The contact between the carbon brush and the collector ring involves numerous microscopic asperities. Under low pressure, the corrosive liquid can easily penetrate the collector ring’s surface, leading to an increased corrosion rate. As pressure increases, the actual contact area between the carbon brush and collector ring expands, reducing the likelihood of corrosive liquid infiltration and enhancing corrosion resistance. However, excessive pressure may cause structural damage to the carbon brush, with particles from the damaged brush entering the brush–ring interface, negatively affecting the collector ring’s corrosion performance. Figure 20b shows the influence of current density on the corrosion resistance of the collector ring. In the absence of current, the passivation film on the collector ring’s surface is thin and relatively uniform. At low current densities, the passivation film may lack sufficient density and stability to fully prevent corrosion, resulting in a higher corrosion rate. As the current density increases, the electrochemical response promotes the growth and thickening of the passivation film, improving its density and stability, thus reducing the corrosion rate. At higher current densities (e.g., 12 A/cm2), a more stable and dense passivation film forms, further inhibiting corrosion.

4. Conclusions

In this study, it is found that the operating parameters of the turbine generator set have a great influence on the corrosion resistance of the carbon brush/collector ring, and finding the best parameters can significantly improve the corrosion resistance of the ring surface. The influence of Cu–GNS composite coating on current-carrying friction characteristics and corrosion resistance under electroplating was discussed by current-carrying friction and wear tests. We can draw several key conclusions:
  • In Cu–GNS composite coatings, the deposition rate and uniformity of graphene nanosheets (GNSs) play a crucial role in determining the current-carrying friction characteristics. The optimal electroplating parameters are a stirring speed of 140 r/min, a GNS concentration of 0.6 g/L, a plating time of 10 min, and a current density of 1.5 A/dm2. Under these conditions, the Cu–GNS composite coating demonstrates a 32.59% reduction in contact resistance, a 37.6% decrease in friction coefficient, and an 18.16% reduction in wear rate compared to conventional collector rings. Cu–GNS composite coating can greatly improve the current-carrying friction characteristics.
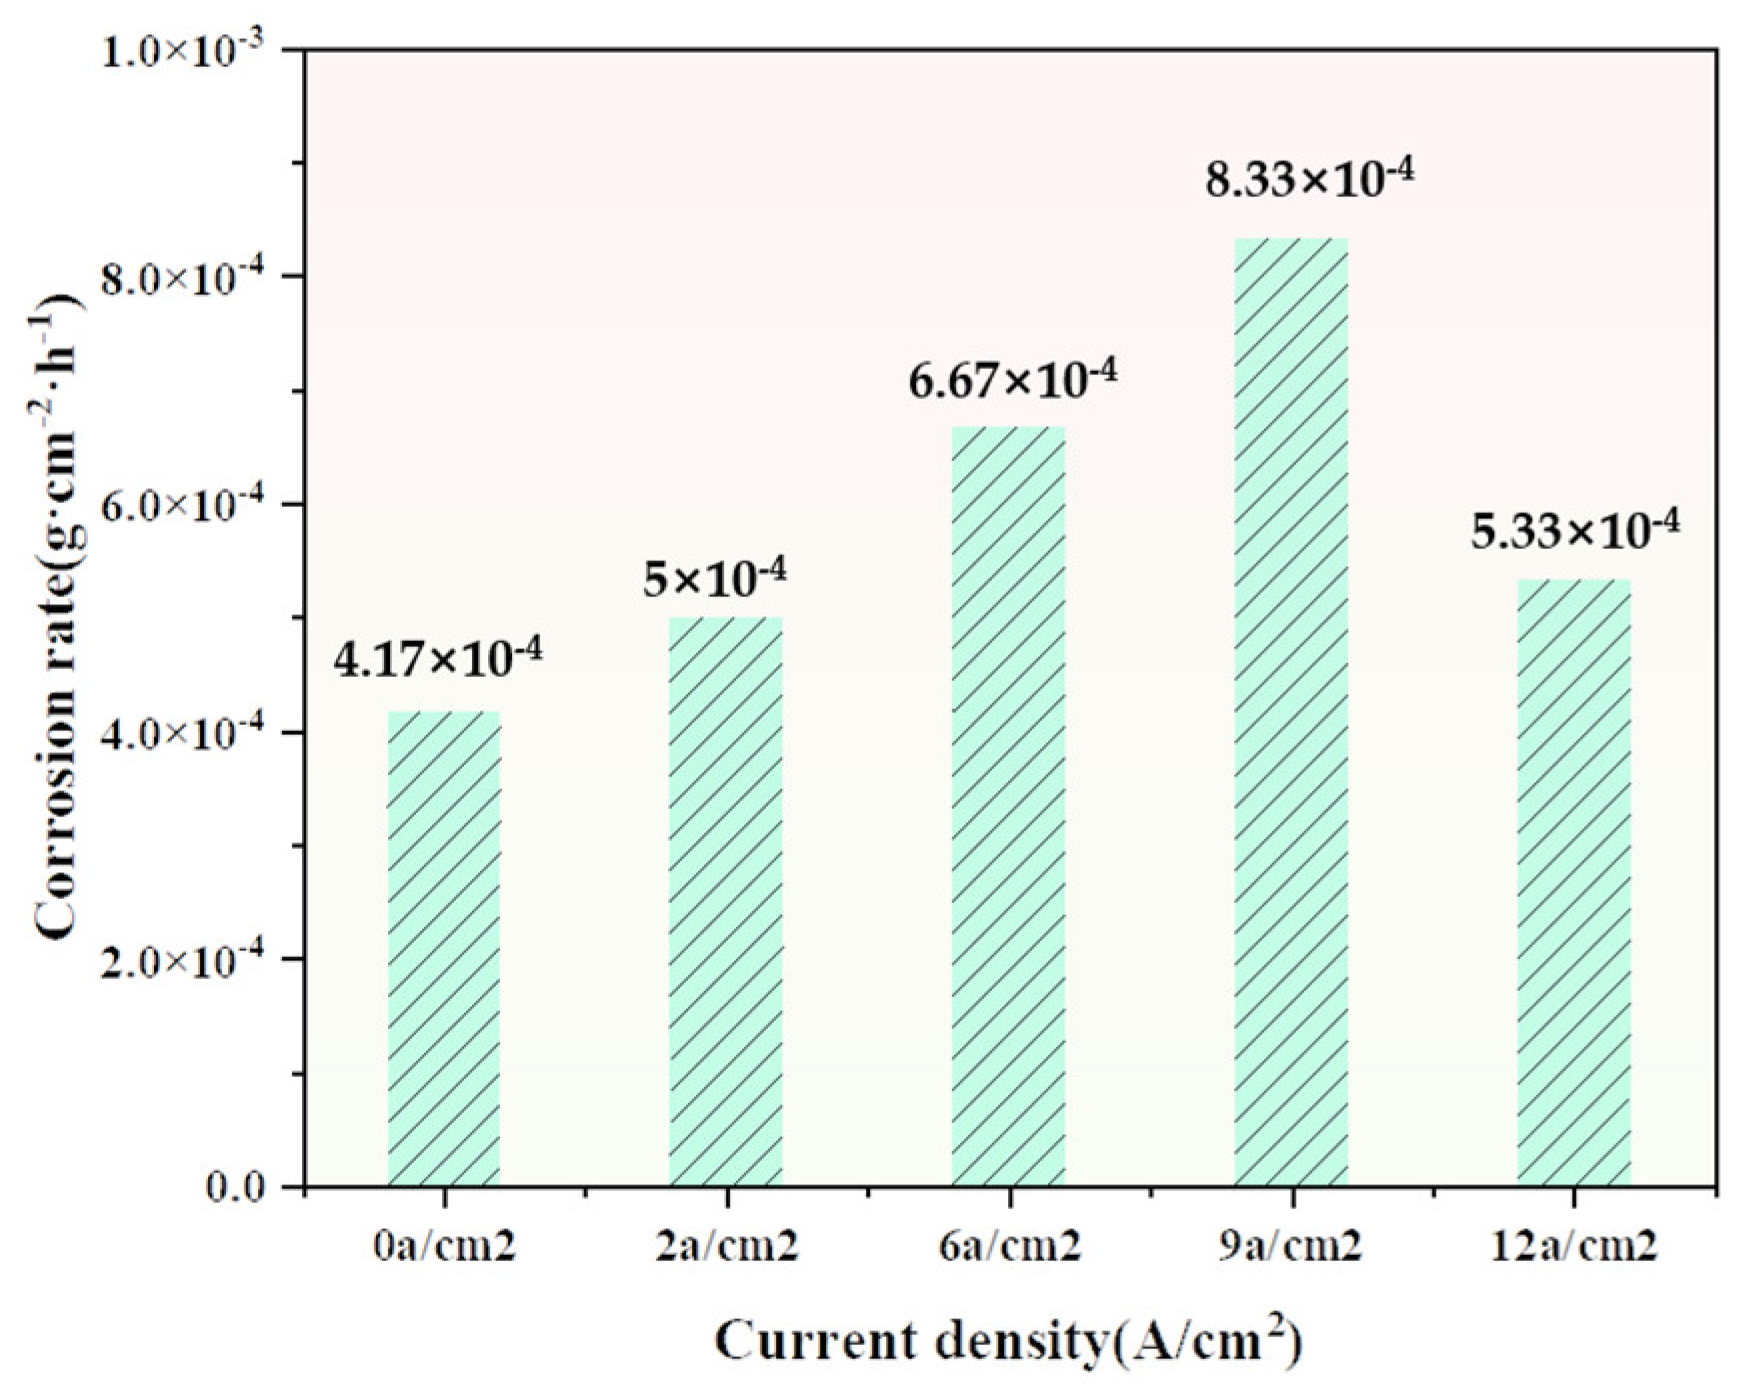
  • The pressure and current density between the brush and the collector ring have a significant impact on the corrosion resistance of the collector ring. When there is no current or the current density is 12 A/cm2 and the brush pressure on the ring is 1n, the corrosion resistance of the collector ring surface can be effectively improved. Electrochemical tests and immersion experiments confirmed that the addition of graphene greatly improved the corrosion resistance of the material.

Author Contributions

J.L.: Writing—review and editing, Writing—original draft, Visualization, Methodology, Data curation. M.Z.: Writing—review and editing, Project administration, Funding acquisition. C.L.: Visualization, Supervision, Investigation. Y.L.: Visualization, Investigation, Software. X.Z.: Visualization, Investigation, Formal analysis, Funding acquisition. All authors have read and agreed to the published version of the manuscript.

Funding

This work was supported by the National Natural Science Foundation of China (No. 52175177, 52475202), Open Fund of Hubei Key Laboratory of Hydroelectric Machinery Design & Maintenance Natural Science Foundation of Hubei Province (No. 2021KJX03), and Hubei Province Central Guidance for Local Science and Technology Development Special Project (2024CSA095).

Data Availability Statement

The raw data supporting the conclusions of this article will be made available by the authors upon request.

Conflicts of Interest

The authors declare no conflicts of interest.

References

  1. Fu, Y.; Qin, H.; Xu, X.; Zhang, X.; Guo, Z. The effect of surface texture and conductive grease filling on the tribological properties and electrical conductivity of carbon brushes. Tribol. Int. 2021, 153, 106637. [Google Scholar] [CrossRef]
  2. Huang, Q.; Song, C.; Liu, Z.; Hou, X.; Pang, X.; Sun, C.; Lu, H.; Wang, S.; Zhang, Y. Research progress on the characteristics of current-carrying tribology in electrical transmission. Space Sol. Power Wirel. Transm. 2024, 1, 37–47. [Google Scholar] [CrossRef]
  3. Yongzhen, Z.; Zhenghai, Y.; Bao, S.G.; Minle, S.; Sanmin, D. Frictional behavior of typical materials carrying current. J. Henan Univ. Sci. Technol. 2012, 33, 9–14. [Google Scholar]
  4. Tang, Q.; Huang, Y.; Sun, D.; Qunyang, L. Effect of Humidity on the Wear Behavior of Graphene Under Current Carrying Conditions. Tribol. Lett. 2025, 73, 8. [Google Scholar] [CrossRef]
  5. Li, C.; Zhao, X.; Lv, Y.; Li, Y.; Li, W.; Yang, W. Exploring the Effect of Interface Contact States on Brush/Ring Current-Carrying Friction. Lubricants 2024, 12, 461. [Google Scholar] [CrossRef]
  6. Deng, H.; Yin, L.; Chengfeng, Z.; Hong, W.; Guoqiang, G.; Juan, W. Effect of Interface Oxidation on the Friction and Wear Performance of Pantograph-Catenary Contact Pairs. Railw. Stand. Des. 2024, 68, 162. [Google Scholar] [CrossRef]
  7. Omran, H.N.; Eivani, A.R.; Farbakhti, M.; Jafarian, H.R. Tribological properties of copper-graphene (CuG) composite fabricated by accumulative roll bonding. J. Mater. Res. Technol. 2023, 25, 4650–4657. [Google Scholar] [CrossRef]
  8. Li, X.; Guo, B.; Yu, X.; Yang, C.; Zhou, S.; Cui, S.; Zhang, Z.; Li, W. Particle morphology dependence of the mechanical and electrical properties in the in-situ graphene reinforced Cu matrix composites. Compos. Part A Appl. Sci. Manuf. 2024, 179, 108032. [Google Scholar] [CrossRef]
  9. Zhang, Q.; Liu, Y.; Liao, T.; Zhang, C.; Wu, X.; Liu, Y.; Qurashi, M.S.; Zheng, F.; Song, Q.; Han, P. Graphene/Cu composites: Electronic and mechanical properties by first-principles calculation. Mater. Chem. Phys. 2019, 231, 188–195. [Google Scholar]
  10. Asnavandi, M.; Ghorbani, M.; Kahram, M. Production of Cu–Sn–graphite–SiC composite coatings by electrodeposition. Surf. Coat. Technol. 2013, 216, 207–214. [Google Scholar] [CrossRef]
  11. Pasha, M.; Kaleemulla, M. Erosive wear behavior of sprayed metal matrix composites: An overview. Proc. Inst. Mech. Part J J. Eng. Tribol. 2013, 227, 1063–1075. [Google Scholar]
  12. Ji, X.; Kunpeng, G.; Yayun, B.; Zhongfa, M.; Fengtao, W.; Dai, H. Effect of Nb addition on the corrosion and wear resistance of laser clad AlCr2FeCoNi high-entropy alloy coatings. Lubricants 2023, 12, 5. [Google Scholar] [CrossRef]
  13. Deng, C.; Yongzhen, Z.; Fei, Z.; Bao, S.G. Dynamic variation of arc discharge and its effect on corrosion direction under current-carrying sliding. Proc. Inst. Mech. Part J J. Eng. Tribol. 2019, 233, 380–392. [Google Scholar]
  14. Holmberg, K.; Erdemir, A. Influence of tribology on global energy consumption, costs, and emissions. Friction 2017, 5, 263–284. [Google Scholar]
  15. Zhan, W.; Huang, P. Numerical analysis of time-varying wear with elastic deformation in line contact. Friction 2019, 7, 143–152. [Google Scholar]
  16. Li, Z.; Lv, X.; Yaru, C.; Xueqiang, L.; Shuilin, X.; Meiyun, Z. To improve the current carrying friction pair tribological characteristics of surface treatment technology review. China Surf. Eng. 2024, 487, 130989. [Google Scholar]
  17. Chen, W.; Feng, Y.; Wan, Y.; Zhang, L.; Yang, D.; Gao, X.; Yu, Q.; Wang, D. Investigation on anti-wear and corrosion-resistance behavior of steel-steel friction pair enhanced by ionic liquid additives under conducive conditions. Tribol. Int. 2023, 177, 108002. [Google Scholar]
  18. Ye, C.; Liu, W.; Chen, Y.; Yu, L. Room-temperature ionic liquids: A novel versatile lubricant. Chem. Commun. 2001, 21, 2244–2245. [Google Scholar]
  19. Xi, H.; He, P.; Liu, S.; Guozheng, M.; Hailou, W.; Zhenlin, L. Research status and prospect of conductive wear-resistant self-lubricating coatings. Surf. Technol. 2019, 48, 353–363. [Google Scholar]
  20. Zhang, H.; Le, K.; Wang, C.; Sun, J.; Xu, S.; Liu, W. Influence of Deposition Temperature on the Structure and Current-Carrying Friction Performance of Cu Films by DC Magnetron Sputtering Technology. Lubricants 2023, 11, 8. [Google Scholar]
  21. Xia, Y.; Cao, Y.; Feng, X. A comparative study on the electrical and tribological characteristic of magnetron sputtered Ag, Cu and Al films under current-carrying friction. Ind. Lubr. Tribol. 2021, 73, 1219–1225. [Google Scholar]
  22. Skrzypek, M.; Wojciechowski, Ł.; Kałużny, J.; Boncel, S.; Marek, A.A.; Runka, T.; Błaszkiewicz, P. Carbon Nanotubes Decorated with Nickel or Copper as Anti-Wear and Extreme-Pressure Additives for Greases. Lubricants 2024, 12, 448. [Google Scholar] [CrossRef]
  23. Yan, P.; Yuhong, L.; Tongqing, W.; Xinchun, L. Effect of a Cu seed layer on electroplated Cu film. Microelectron. Eng. 2013, 105, 18–24. [Google Scholar]
  24. Hui, Y.; Liu, G.; Yan, T.; Liu, M.; Du, L. Influence of sliding frequency on current-carrying friction and wear properties of supersonic plasma sprayed Mo coatings. China Surf. Eng. 2019, 32, 109–119. [Google Scholar]
  25. Xu, J.; Zhou, L.; Ma, G.; Li, G.; Zhao, H.; Li, Y.; Tan, N.; Wang, H. Laser cladding Mo-based coatings on copper alloys to improve the current-carrying tribological properties of Cu/Al friction pairs. Surf. Coat. Technol. 2024, 487, 130989. [Google Scholar]
  26. Baiocco, G.; Menna, E.; Mingione, E.; Rubino, G.; Ucciardello, N. Effect of process parameters and film stratification on morphology and performance of auto-lubricating Ni-GnP electroplated coated steel. Eng. Fail. Anal. 2024, 161, 108223. [Google Scholar]
  27. Pritima, D.; Ravichandran, M.; Veerappan, G.; Mohanavel, V. Mechanical properties and corrosion behavior of SiC reinforced high entropy alloy (Ni-Co-Fe-Ti) matrix composites produced by microwave and conventional sintering techniques. Surf. Topogr. Metrol. Prop. 2024, 12, 045002. [Google Scholar]
  28. Wen, X.; Qu, R.; Yuwen, F.; Yanan, Q.; Tingmei, W.; Ruiqing, Y.; Jinjun, L. Genesis and Robust Tribological Property of Friction-Induced Cu-Graphene Self-lubricating Composite Under Electrical Contact. Tribol. Lett. 2023, 71, 82. [Google Scholar]
  29. Zhang, L.; Shi, Q.; Ge, X. Comparative Study of the Friction Behavior of Functionalized Graphene Oxide Additives Under Electric Stimulations. Lubricants 2024, 12, 455. [Google Scholar] [CrossRef]
  30. Hou, X.; Tang, H.; Leyang, D.; Xianglin, L.; Guanglin, L.; Zhiqiang, A.; Yanhua, J.; Chenxing, S.; Hong, W. Potassium borate/graphene nanocomposite lubricant additive with anti-friction/wear and anti-corrosion functions for marine diesel engine burning low sulfur fuel. Wear 2024, 550, 205395. [Google Scholar]
  31. Cho, K.H.; Hong, U.S.; Lee, K.S.; Ho, J. Tribological properties and electrical signal transmission of copper–graphite composites. Tribol. Lett. 2007, 27, 301–306. [Google Scholar] [CrossRef]
  32. Zhou, Y.; Zhu, R.; Zuo, X.; Wenxin, X. Tribo-electrical behaviors of CNTs-MoS2/Cu composites under sliding electrical contact with brass. Tribol. Int. 2023, 180, 108207. [Google Scholar] [CrossRef]
  33. Cao, Z.; Li, R.; Shou, M.; Luo, R.; Wei, B.; Wang, T. Mechanical properties and tribological behaviors of Ag/graphene composite coating under sliding friction and current-carrying fretting. Tribol. Int. 2024, 197, 109811. [Google Scholar] [CrossRef]
  34. Almonti, D.; Salvi, D.; Ucciardello, N.; Vesco, S. Enhanced Wear Resistance and Thermal Dissipation of Copper–Graphene Composite Coatings via Pulsed Electrodeposition for Circuit Breaker Applications. Materials 2024, 17, 6017. [Google Scholar] [CrossRef] [PubMed]
  35. Chen, J.; Li, J.; Xiong, D.; He, Y.; Ji, Y.; Qin, Y. Preparation and tribological behavior of Ni-graphene composite coating under room temperature. Appl. Surf. Sci. 2016, 361, 49–56. [Google Scholar] [CrossRef]
  36. Dresselhaus, M.S.; Jorio, A.; Hofmann, M.; Dresselhaus, G.; Saito, R. Perspectives on carbon nanotubes and graphene Raman spectroscopy. Nano Lett. 2010, 10, 751–758. [Google Scholar] [CrossRef]
  37. Kumar, B.; Kumar, D.; Chaudhry, V. Tribological and corrosion behavior of hydrided zirconium alloy. Tribol. Int. 2024, 195, 109660. [Google Scholar]
  38. Hu, N.; Dong, X.; He, X.; Browning, J.F.; Schaefer, D.W. Effect of sealing on the morphology of anodized aluminum oxide. Corros. Sci. 2015, 97, 17–24. [Google Scholar] [CrossRef]
Figure 1. Cu–GNS composite coating process.
Lubricants 13 00162 g001
Figure 2. (a) Current-carrying friction and wear testing machine. (b) The test mode is pin–disk contact. (c) Physical diagram of current-carrying friction and wear testing machine. (d) Schematic diagram of the test device.
Lubricants 13 00162 g002
Figure 3. (a) Electrochemical corrosion workstation. (b) Simulated actual corrosion device.
Lubricants 13 00162 g003
Figure 4. Optical microscope morphology and macroscopic picture of Cu–GNS composite coating with changing. (a,b) Stirring speed 100 r/min and 140 r/min. (c,d) Graphene content 0.6 g/L and 0.8 g/L. (e,f) Electroplating current density 1.5 A/cm2 and 2.5 A/cm2. (g,h) Electroplating time 1 min and 10 min.
Lubricants 13 00162 g004
Figure 5. Graphene deposition rates of Cu–GNS composite coatings under different composite plating parameters. (a) Stirring speed, (b) graphene content, (c) electroplating current density, (d) plating time.
Lubricants 13 00162 g005
Figure 6. Three-dimensional profiles of Cu–GNS composite coatings prepared at different plating times: (a) 1 min, (b) 5 min, (c) 10 min, (d) 15 min, (e) 20 min.
Lubricants 13 00162 g006
Figure 7. Cross-sectional morphology of composite plating layer under optimal plating parameters.
Lubricants 13 00162 g007
Figure 8. Surface morphology of composite layer under optimum plating parameters.
Lubricants 13 00162 g008
Figure 9. Raman spectra of Cu–GNS composite coatings prepared at different stirring speeds.
Lubricants 13 00162 g009
Figure 10. Contact resistance characteristics under different composite electroplating parameters: (a) stirring speed, (b) electroplating current density, (c) graphene content, (d) plating time.
Lubricants 13 00162 g010
Figure 11. Friction and wear characteristics under different composite electroplating parameters: (a) stirring speed, (b) graphene content, (c) electroplating current density, (d) plating time.
Lubricants 13 00162 g011
Figure 12. Comparison of current-carrying friction characteristics between the collector ring and the best Cu–GNS composite coating: (a) dynamic contact resistance, (b) average contact resistance, (c) friction coefficient, (d) wear rate.
Lubricants 13 00162 g012
Figure 13. SEM morphology of carbon brush worn on different samples. (a) Collector ring original sample, (b) Cu–GNS composite coating.
Lubricants 13 00162 g013
Figure 14. Schematic diagram of current-carrying tribological mechanism of Cu/graphene composite coating.
Lubricants 13 00162 g014
Figure 15. Research on electrochemical corrosion resistance of collector ring under different pressures. (a) Open circuit potential, (b) polarization curve.
Lubricants 13 00162 g015
Figure 16. Study on electrochemical corrosion resistance of collector ring and Cu–GNS composite coating under 1 N pressure. (a) Open circuit potential, (b) polarization curve, (c) Nyquist plot, (d) equivalent circuit diagram of EIS spectrum.
Lubricants 13 00162 g016
Figure 17. Macroscopic diagram after corrosion with different current densities under 1 N pressure. (a) 0 A/cm2, (b) 2 A/cm2, (c) 6 A/cm2, (d) 9 A/cm2, (e) 12 A/cm2.
Lubricants 13 00162 g017
Figure 18. Corrosion rate of collector ring under different current densities at 1 N pressure.
Lubricants 13 00162 g018
Figure 19. Corrosion rate of collector ring and Cu–GNS composite coating at 1 N pressure 12 A/cm2.
Lubricants 13 00162 g019
Figure 20. Influence mechanism of corrosion resistance of collector ring. (a) Research on the corrosion resistance of collector rings by pressure. (b) Research on the corrosion resistance of collector rings by current density.
Lubricants 13 00162 g020
Table 1. Stability values of open circuit potential of collector ring under different loads.
Pressure/NOpen Circuit Potential/v
0−0.59772
0.3−0.58631
0.6−0.5233
1−0.52057
1.5−0.52629
Table 2. Polarization curve fitting data.
Pressure/NEcorr (v)Icorr (A/cm2)
0−1.03419.56 × 10–5
0.3−0.88716.17 × 10−5
0.6−0.81155.05 × 10−5
1−0.76622.47 × 10−5
1.5−0.95946.84 × 10−5
Table 3. Average open circuit potential.
SampleOpen Circuit Potential/v
Collector ring−0.52057
Cu–GNS composite coating−0.3484
Table 4. Polarization curve fitting data.
SampleEcorr (v)Icorr (A/cm2)
Collector ring−0.7662 ± 0.012(2.47 ± 0.09) × 10−5
Cu–GNS composite coating−0.6195 ± 0.008(2.21 ± 0.007) × 10−5
Table 5. EIS parameters after equivalent circuit fitting.
SampleRs (Ω·cm2)Rct (Ω·cm2)Qdl (S∙sⁿ/cm2)n1Qbl (S∙sⁿ/cm2)Rbl (Ω·cm2)n2
Collector ring 5.669 ± 0.12 115.7 ± 3.5 ( 3.81 ± 0.15 ) × 10−30.75---
Cu–GNS composite coating 4.44 ± 0.09 224.4 ± 5.2 (4.98 ± 0.22) × 10−30.72(1.61 ± 0.08) × 10−36.1010.94
Disclaimer/Publisher’s Note: The statements, opinions and data contained in all publications are solely those of the individual author(s) and contributor(s) and not of MDPI and/or the editor(s). MDPI and/or the editor(s) disclaim responsibility for any injury to people or property resulting from any ideas, methods, instructions or products referred to in the content.

