Article

Rheological Properties and Lubricating Film Formation Performance of Very Low-Viscosity and Biodegradable Polyalphaolefins

1
School of Mechanical and Electrical Engineering, Guangdong University of Petrochemical Technology, Maoming 525000, China
2
Guangdong Provincial Key Laboratory of Advanced Green Lubricating Materials, Maoming 525000, China
3
School of Chemical Engineering, Guangdong University of Petrochemical Technology, Maoming 525000, China
*
Author to whom correspondence should be addressed.
Lubricants 2025, 13(2), 62; https://doi.org/10.3390/lubricants13020062
Submission received: 7 December 2024 / Revised: 27 January 2025 / Accepted: 31 January 2025 / Published: 2 February 2025
(This article belongs to the Special Issue Tribological Properties of Biolubricants)

Abstract

:
Polyalphaolefins (PAOs) are regarded as superior lubricants, but the biodegradability of the very low-viscosity PAO2/PAO4 has been ignored over a long history, despite being inherently biodegradable (PAO2/PAO4 biodegradation rate >20% by OECD guidelines). Previous studies typically concentrated on a single viscosity grade of PAO with additives, seldom engaging in comparative research efforts involving multiple low-viscosity grades of neat PAO concurrently. This study compares PAO2/PAO4 with non-biodegradable PAO6 regarding rheology and lubricating film formation. PAO2/PAO4 are Newtonian fluids with ≤10% viscosity fluctuation at high shear rates, while PAO6 shows a viscosity fluctuation of ≥15% at high shear rates. Viscosity–temperature equations are derived. An optical interference method measures lubricating film thickness. PAO2/PAO4 films are less sensitive to speed/load changes. PAO2 mainly works in boundary lubrication. Interference images show possible unique EHL characteristics of PAOs. The Hamrock–Dowson formula overestimates PAO6 film thickness at high speeds.

1. Introduction

Polyalphaolefins (PAOs) are currently one of the fastest-growing types of synthetic oils. Compared to conventional mineral oils, PAO oils exhibit superior viscosity–temperature and low-temperature flow behaviors, a high viscosity index, low Noack volatility and non-toxicity [1,2]. Low-viscosity PAOs typically refer to PAOs with a kinematic viscosity of 10 cSt or less at 100 °C, such as PAO2, PAO4, to PAO10, where the last digit indicates the kinematic viscosity of the PAO at 100 °C. They are the main base oils for lower viscosity grade engine oils, such as 0W-16 and 0W-20 [3,4]. By reducing the viscosity of engine oil, polyalphaolefins (PAO) contribute to saving at least 2% to even 25% of energy compared to traditional mineral-based engine oils, while also reducing carbon emissions [1,3,5,6]. As the demand for stricter fuel economy standards increases, automobile manufacturers are progressively inclined to adopt even lower viscosity grade oils, such as 0W-8 and 0W-12 [7,8]. Therefore, low-viscosity PAOs have broad development prospects.
Unfortunately, for several decades, the biodegradation rate of PAO has been assessed to be only 5% to 30%, leading to its classification as non-biodegradable [9,10]. This characteristic confers a significant disadvantage in contexts requiring environmental sensitivity. Actually, it is complicated to determine the biodegradability of PAOs and the results may be diverse because of the reproducibility problem. The biodegradability of lubricants has generally been assessed according to two different types of test protocols, primary biodegradability and ultimate biodegradability. Primary biodegradability is normally determined by the CEC (Coordinating European Council) L-33-A-93 test, while the ultimate biodegradability of lubricating oils is generally assessed according to the OECD (Organization for Economic Cooperation and Development) 301B or ASTM D5864 tests (which is equivalent to OECD 301B) [11,12,13]. In contrast to the CEC method for determining residual oil content, the OECD method evaluates the biodegradability of lubricating oils by measuring the amount of CO2 generated. The CEC L-33-A-93 standard from 1993 was updated to CEC L-103-A-12 in 2012 [14], but the OECD method is considered more practically significant.
The results of widespread and simple CEC tests show that PAO has a certain degree of biodegradability. Generally, the biodegradability of PAOs ranges from 20% to 80% by the CEC-L-33-A-93 test [15,16,17]. It is significant to highlight that the biodegradability of polyalphaolefins (PAOs) is contingent upon their viscosity; specifically, low-viscosity PAOs exhibit biodegradability, whereas medium to high-viscosity PAOs do not [18]. Numerous CEC test publications indicate that the biodegradability of PAO2 ranges from at least 70% to even 90%, while PAO4 exhibits a biodegradability range of 55% to 70%, and PAO6 shows a biodegradability range of 5% to 25% [1,2,6,17,19,20,21] (the reproducibility error of CEC test method does not exceed 20% [11]). Battersby and Carpenter agreed that PAO2 can reach a biodegradability value of even over 90% in the CEC test [19,22]. This is contrary to the widespread perception that PAOs are generally not biodegradable.
Generally, since the OECD test protocols are more stringent than those of the CEC test, the biodegradation values obtained from OECD or ASTM test methods are lower than those obtained from CEC test methods [15]. The OECD 301B test indicates a typical PAO degradation rate of 5% to 60% [15,17]. The Netherlands Standardization Institute reported that, according to the ASTM D5864 test, the average biodegradation rates for highly biodegradable PAO are 59% for high-biodegradable, 30% for moderately biodegradable, and 21% for low-biodegradable PAO [23]. Additionally, the biodegradation test result for PAO2, obtained by the U.S. Army using the ASTM D5864 method, is 71% [24]. They claimed that PAO2 provided good biodegradability similar to that of vegetable-based fluids. They attributed the effective composition for the biodegradation (ECB) coefficients of PAO2, PAO4, and PAO6 or above to be 0.8, 0.6, and 0.4, respectively. The OECD test indicates the biodegradation of PAO4 may be 48% [21,25]. However, Battersby conducted the OECD 301B test and showed that the biodegradation of PAO2, PAO4, and PAO6 was only about 30%, 27%, and 15–25%, respectively [26]. According to the OECD 301B test guideline, a substance is considered readily biodegradable if there is 60% of theoretical carbon dioxide production [12]. Otherwise, if the final test value is 20–60%, the substance is considered inherently biodegradable. Good agreement is normally obtained with easily biodegradable compounds, but there can be large variations between results obtained for moderate or low biodegradable substances by different laboratories. Therefore, based on the results of the more practical OECD 301B test, it is relatively safe and conservative to classify PAO2 and PAO4 as inherently biodegradable substances.
Another challenge associated with PAO is its non-polar nature, which renders neat PAO oil incapable of effectively dissolving the polar additives that are crucial for the performance of finished lubricants [27,28,29]. Consequently, numerous researchers have directed their efforts towards investigating blends of PAO with esters, as well as exploring methods to enhance the compatibility of PAO with various additives [30,31,32,33]. Furthermore, extensive research has successfully determined the necessary input parameters and computational techniques for incorporating PAOs into elastohydrodynamic lubrication simulations. The complex interplay between PAO’s viscosity, pressure, and temperature has been subjected to rigorous analysis [34,35,36,37]. Nevertheless, these studies typically concentrate on a single viscosity grade of PAO with additives, seldom engaging in comparative research efforts involving multiple low-viscosity grades of neat PAO concurrently, particularly the very low-viscosity PAO2 and PAO4. It is important to note that PAOs derived from renewable materials may demonstrate an even higher biodegradability rate, rendering them promising contenders for environmentally friendly, innovative green lubricants [16,38,39].
While previous research has provided valuable insights into the properties and applications of PAOs, our work takes a novel approach by focusing specifically on the very low-viscosity and biodegradable PAO2 and PAO4. These particular grades have not received as much attention in comparative studies involving multiple low-viscosity neat PAOs, especially considering their potential as environmentally friendly lubricants. Beyond simply replicating existing experiments or analyses, we have designed a comprehensive set of experiments, including investigating their Newtonian fluid behavior at high shear rates and the use of the optical interference method for determining lubricating film thickness. Moreover, the analysis of the Hamrock–Dowson formula’s limitations in predicting low-viscosity PAOs film thickness provides new perspectives on the application of theoretical models in lubrication science, which are crucial for the accurate prediction and optimization of lubricant performance.
This article focuses on very low-viscosity and biodegradable polyalphaolefins (PAOs), specifically PAO2 and PAO4, which are recognized as some of the most readily degradable within the category of low-viscosity PAOs. To facilitate a comprehensive comparison, we conducted concurrent experiments and analyses on non-degradable PAO6 with higher viscosity. Our research examines the rheological properties and lubricating film formation performance of these PAOs.

2. Rheological Properties of PAOs

2.1. Experimental Method

Rheological property tests were conducted on the rheometer HAAKE MARS60 using a CC27 DG concentric cylinder rotor with dual slits. The test samples were neat polyalphaolefin (PAO) base oils (no additives) of various grades from a commercial low-viscosity series, specifically PAO2, PAO4, and PAO6, as shown in Table 1.
The testing methods included the following steps:
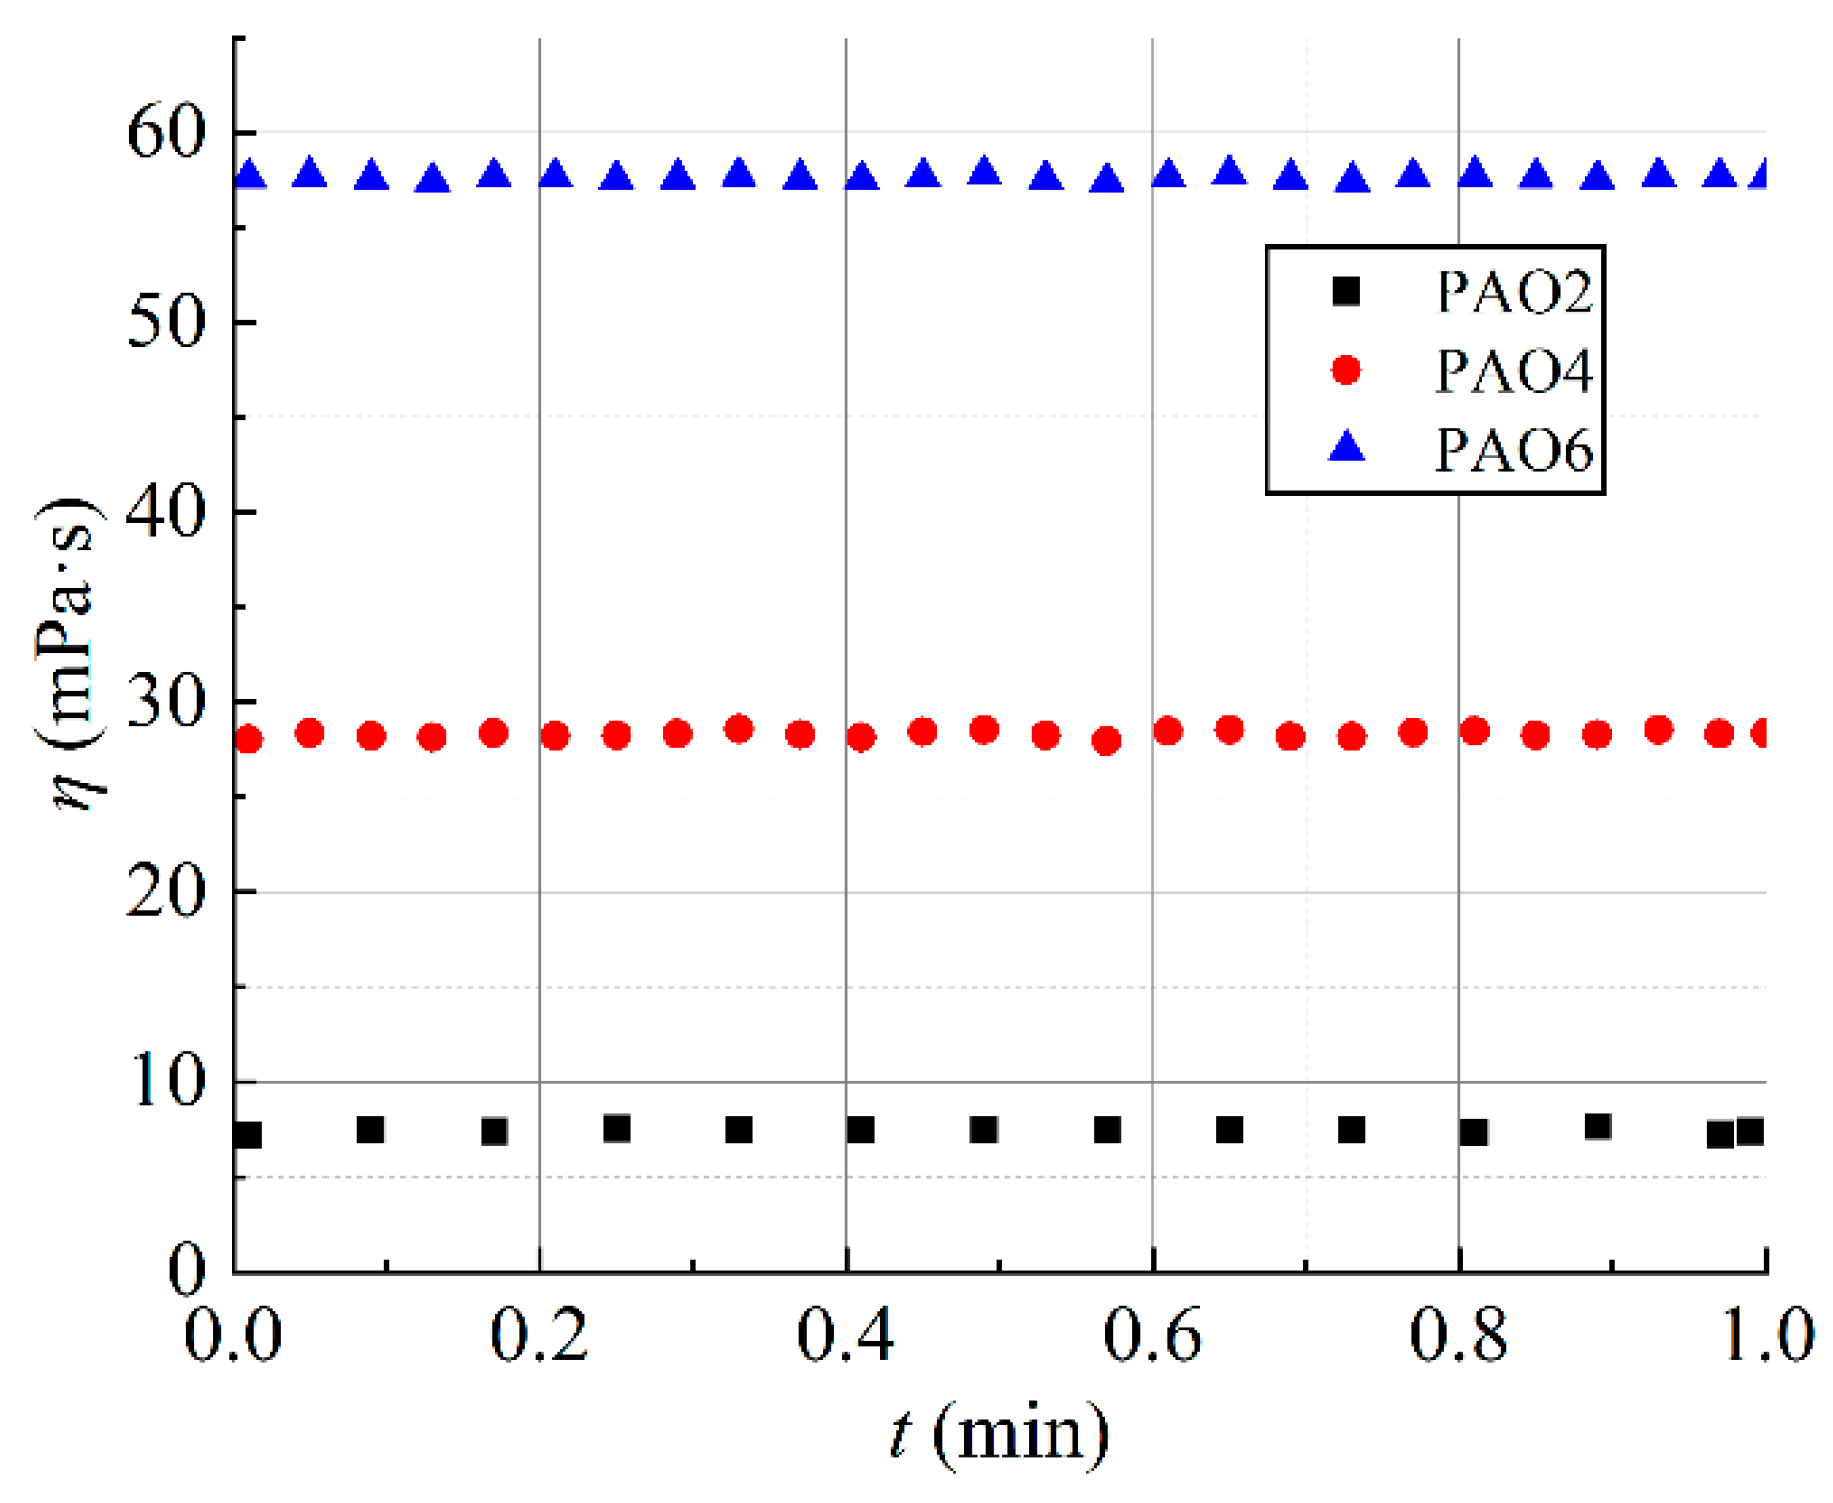
  • Test the PAO samples of different viscosities at a constant room temperature and a constant shear rate (1000 s−1) for one minute to assess whether there was shear thinning. Evaluate their thixotropic behavior.
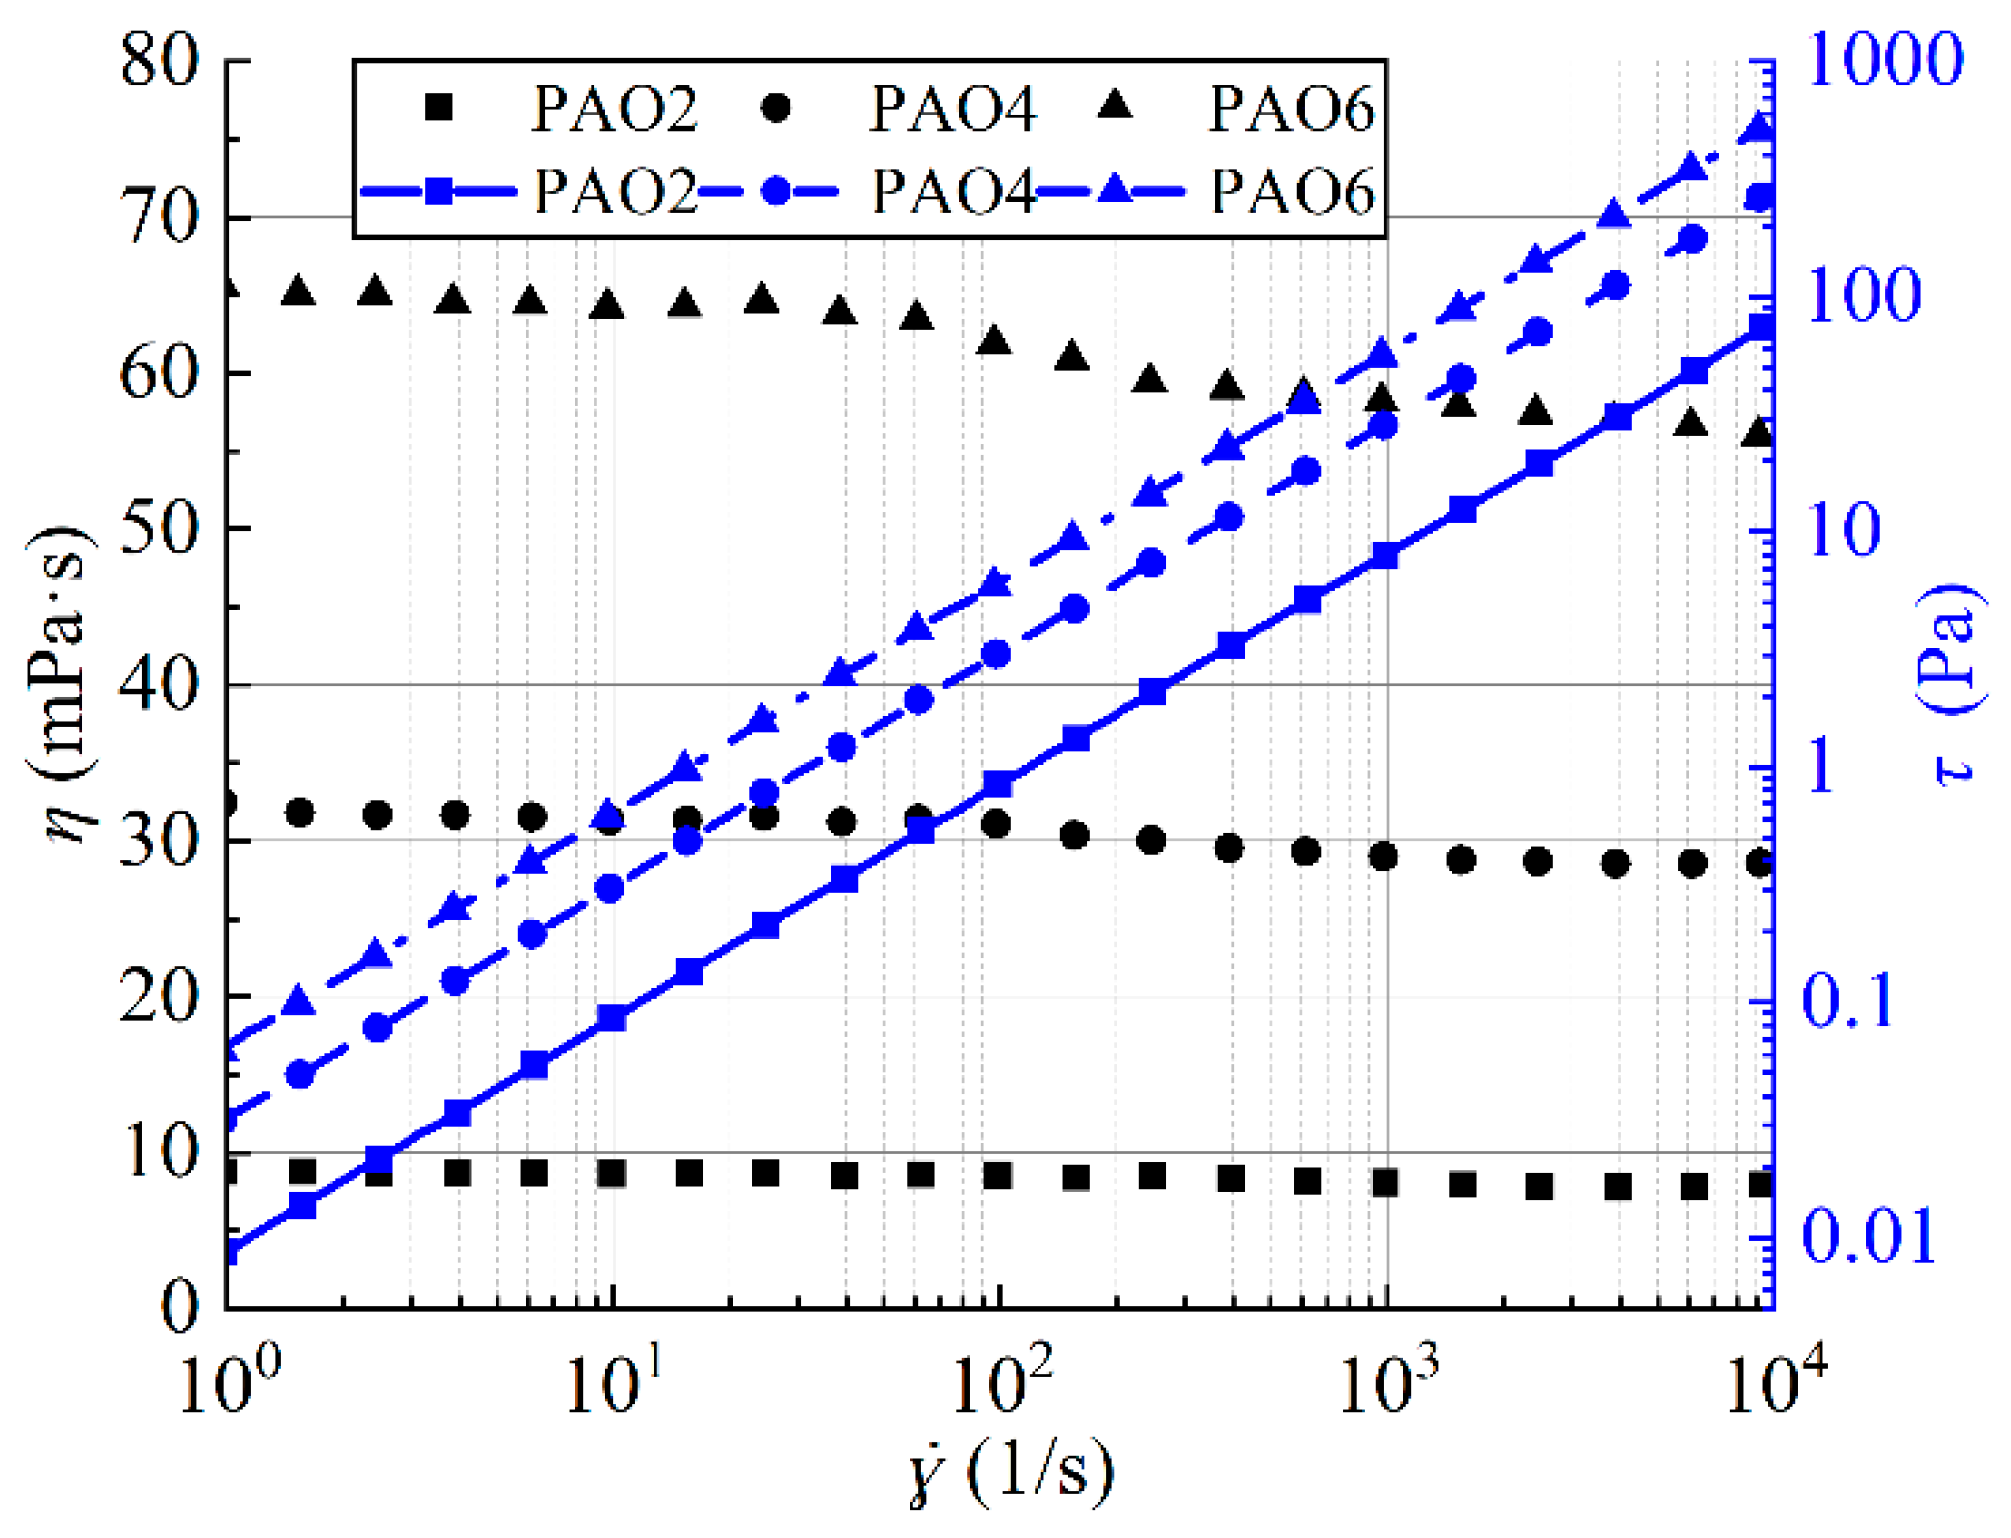
  • Examine the PAO samples with different viscosities as they were sheared from zero or a low rate to 10,000 s−1 in 1.5 min at room temperature to determine whether there was shear rate thinning. Assess their non-Newtonian properties.
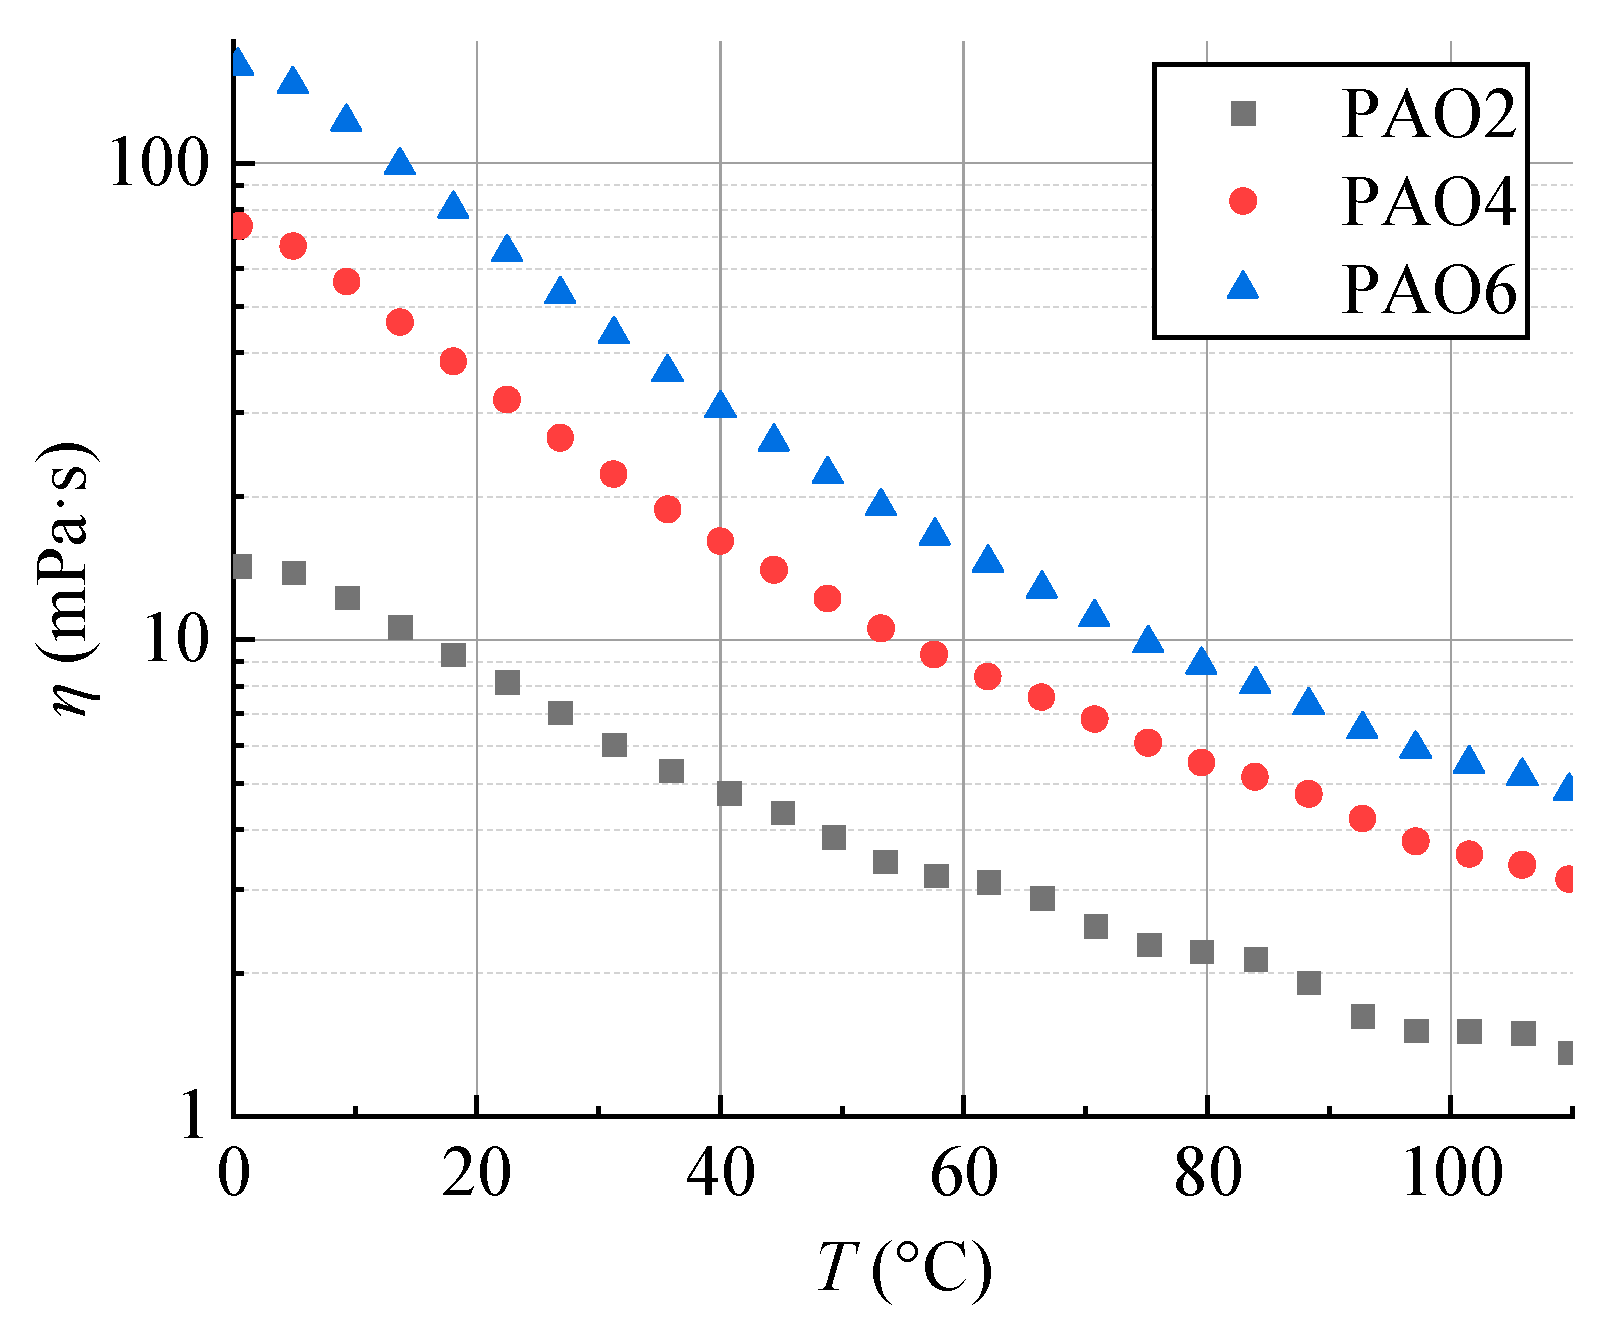
  • Investigate the viscosity changes in PAO samples of different viscosities under a constant shear rate (1000 s−1) while varying the temperature from 0 °C to 110 °C in 30 min to evaluate their visco-thermal behavior.
All rheometer measurements were performed in a controlled-shear-rate mode (CR).

2.2. Results and Discussion

Figure 1 presents the thixotropic test results of the three samples. During the stable shear process, the viscosities of the PAO samples remained essentially constant over time, i.e., the viscosity curves resembled a nearly horizontal line. The findings indicate that these PAOs do not exhibit shear thinning and they do not display the thixotropic behavior typically associated with non-Newtonian fluids.
Figure 2 displays the results of the shear strain rate tests for the samples. The graph reveals that the viscosity η remained essentially constant for all three samples throughout the shear process, and the shear stress τ exhibited a nearly linear change (using logarithmic coordinates for both axes). When the shear strain rate increased, the viscosity of the very lower-viscosity PAO2 and PAO4 slightly decreased (by approximately 9% and 12% from 100 s−1 to 104 s−1, respectively), whereas the viscosity of the higher-viscosity PAO6 had a more significant decrease (approximately 15%), which indicates a clear shear thinning effect. This decrease in viscosity might have occurred because the longer, less ordered molecular chains in PAO6 became more aligned and reduced the intermolecular interactions with increasing shear [40]. Therefore, when high-viscosity PAO such as PAO6 is used, it is essential to consider the decrease in viscosity and reduced lubricating film capacity at high shear rates. For the very low-viscosity PAOs such as PAO2 and PAO4, the viscosity decrease caused by high shear is negligible (approximately 10%). Since PAO molecules have weak polarity, it is difficult for PAOs to dissolve additives or adhere to friction interfaces, so they are often used in multi-component synthetic lubricants where the actual impact on the lubrication analysis and application can be disregarded [31]. Zhang et al. [41] tested the viscosity changes in PAO2-PAO6 at shear rates below 1000 s−1 and found no significant variations, which suggests that these PAOs can be treated as Newtonian fluids. Bair et al. [37] observed that PAO4 exhibited noticeable shear thinning only at approximately 104 kPa of shear stress. High-viscosity PAOs such as PAO100 or their mixtures tend to show more pronounced shear thinning under similar stress conditions. In this experiment, the maximum shear stress for PAO6 was only 510 Pa, which is in the low-shear-stress regime and has minimal impact on the lubrication.
Figure 3 shows the visco-thermal behaviors of the PAOs in the temperature range of 0–110 °C. The graph reveals that similar to most lubricants, low-viscosity PAOs exhibit a decrease in viscosity when the temperature increases. At high temperatures, their viscosities converged and approached the kinematic viscosities (ν, which is the ratio of the dynamic viscosity η to the density ρ at that temperature). This trend is consistent with the data in Table 1, which serve as a basis for their viscosity grade assignments. In the 0–60 °C range, there was a noticeable difference in performance among PAOs of different grades, where PAO6 had the most significant temperature sensitivity, and its viscosity substantially decreased from its initial value. This result indicates that lower-viscosity PAOs, such as PAO2, have superior low-temperature performance, display better cold flow, and facilitate better heat dissipation at the frictional interface.
There is currently no widely accepted equation to describe the relationship between the dynamic viscosity of PAO and the temperature. Reference [42] proposed the following equation:
η = A × exp ( T n ) + η c
where η is the dynamic viscosity in units of Pa·s, and T is the temperature in degrees Celsius. A, n, and ηc are constants to be determined. This article refers to this equation and uses Levenberg–Marquardt algorithm, one of the most effective and popular algorithms based on nonlinear least square methods, to fit the experimental data. The fitting results converge and yield the visco-thermal relationship curve and equation for the low-viscosity PAOs, as shown in Figure 4 and Table 2, respectively. The fitting results indicate that in the temperature range of 0–110 °C, the correlation coefficients (Adj. R-Square) are close to 1, and the fitted curve closely matches the experimental data. Thus, Equation (1) is suitable for fitting the visco-thermal curve of PAOs and can be used to predict the viscosity of PAOs at a specific temperature with reasonable accuracy under certain conditions.

3. Lubricating Film Formation Performance of PAOs

3.1. Experimental Method

A ball-on-disk tribometer, as depicted in Figure 5, was used to measure the lubricating film thickness of the PAOs under different speeds and loads based on the principles of optical interference and relative light intensity. As illustrated in Figure 5a, the experimental apparatus primarily consists of a glass disk driven by a servo motor, a lever that supports a reservoir (containing a steel ball), and a camera along with a coaxial light source positioned above the contact point. Figure 5b illustrates the measurement principle wherein the incident light produces two coherent light beams upon reflection from the two contacting surfaces of the friction pair, designated as reflected lights I and II. The camera captured the interference fringes, whose brightness, color, and order indicate the film thickness. Table 3 and Table 4 show the tribological properties of the friction pair and lubricant characteristics, respectively, for the experimental setup.
Individual tests were conducted to record the optical interference images of various PAOs under different disk rotation speeds (5, 10, 20, 40, and 80 r/min, with a gyration radius of 62 mm for the ball-disk contact point) and loads (0, 3, 6, and 9 N). During the experiment, the lubricant was continuously added to ensure a fully flooded lubrication, and there was pure rolling between the steel ball and the glass disk. To measure the dynamic film thickness, the images were analyzed using an improved method, which is based on optical interference principles and the relative light intensity as described in reference [43]. The film thickness h was calculated for each condition using Formula (2).
h = λ 4 π n d ( 1 ) k arccos I ¯ k arccos I ¯ 0 + ( k + sin k π 2 ) π
Here, λ is the wavelength of monochromatic light for the measurement, which is 600 nm in this case; nd is the refractive index of the lubricant; k is a defined interference half-order for the convenience of analyzing the optical interference images. I ¯ k is the relative light intensity at the current measurement point, I ¯ k = 2 I I k , max I k , min I k , max I k , min , and I is the absolute light intensity at that point, I k , max is the maximum light intensity within the interference half-order, and I k , min is the minimum light intensity within the same half-order. I ¯ 0 is the relative light intensity at the center of the film with zero thickness, I ¯ 0 = 2 I 0 I 0 , max I 0 , min I max I min ; I0 is the corresponding absolute light intensity; I 0 , max is the maximum light intensity at zero film thickness; I 0 , min is the minimum light intensity at zero film thickness.

3.2. Results and Discussion

Figure 6 shows optical interference images of PAO6 under a constant load (3 N) for the glass disk at various rotation speeds.
As shown in Figure 6, when the glass plate rotated at a speed of 20 r/min or above, the interference fringes exhibited a distinct horseshoe shape. This unique characteristic of elastohydrodynamic lubrication occurred because of the elastic deformation of the friction pair materials and the need to maintain flow balance at the inlet and outlet. At the exit of the friction pair, a constriction of the lubricant was visible, which resulted in a thinner lubrication film (with the lubricant entrance on the left and the exit on the right). The thinnest film thickness was observed in the earlobe regions on both sides. At lower speeds (5 r/min and 10 r/min), the lubrication film in the central area was more uniform, which made it more difficult to detect the necking phenomenon. According to the classical elastohydrodynamic lubrication theory, when the rotational speed of a friction pair is low, the lubrication film is relatively thin, which potentially indicates a transition from elastohydrodynamic to boundary lubrication conditions.
Figure 7 shows interference images of the PAO4 lubrication film under a constant load (3 N) with a glass disk at different speeds. The characteristic horseshoe pattern of elastohydrodynamic lubrication became apparent only when the speed exceeded 40 r/min, which is consistent with previous results: PAO4 has a lower viscosity than PAO6, so PAO4 is less likely to form thicker films. This behavior is more evident in PAO2, as shown in Figure 8, where the horseshoe feature is hardly observable at the maximum tested speed of 80 r/min; only a gradual dimming of the fringe brightness at the contact center is noticeable. Due to its significantly lower viscosity than PAO4 and PAO6, PAO2 is less prone to elastohydrodynamic lubrication and remains predominantly in a boundary lubrication regime.
After the light intensity at zero film thickness and the interference order under the target operating conditions were calibrated, the minimum film thicknesses at different speeds (with a constant load of 3 N) were calculated using Equation (2). Then, these values were plotted to show the change in minimum film thickness with speed, as illustrated in Figure 9.
As shown in Figure 9, the lubrication film thicknesses for different viscosity-grade PAOs generally increase with the entrainment velocity, as predicted by the classical elastohydrodynamic lubrication theory. However, the extent to which the viscosity influences the film thickness varied among different viscosity-grade PAOs. PAO2, possessing the lowest viscosity, displayed the least sensitivity to speed. Its increase in film thickness was not significant at higher tested speeds, whereas PAO6 demonstrated a considerably greater increase in film thickness at high speeds. These findings suggest that low-viscosity PAOs such as PAO2 are less likely to form relatively thick films than high-viscosity PAOs. When using low-viscosity PAO, to prevent the friction pair from transitioning to boundary lubrication or dry friction and causing wear, one should maximize the rotational speed and consider the use of a composite lubricant. This selection can involve adding high-molecular-weight thickeners to improve the viscosity at low temperatures or incorporating a higher-viscosity lubricant to ensure a higher overall viscosity, particularly at low temperatures [44,45].
To maintain a constant glass disk speed (80 r/min), experiments were conducted to test various PAO lubricants under different loads (3 N, 6 N, and 9 N) on the friction pair. Figure 10 shows the interference images of PAO4.
As Figure 10 shows, the Hertz contact area at the contact center of the friction pair increased as expected when the load increased, but there was neither significant change in brightness at the image center nor horseshoe fringe. Similar observations were made for other PAOs (PAO2 and PAO6). This result suggests that increasing the load has a minimal effect on the lubrication film thickness. After the light intensity and interference order had been calibrated, the minimum film thickness was calculated using Equation (2) for all PAOs, and Figure 11 shows the resulting curves of the change in film thickness with increasing load.
Figure 11 clearly shows that the minimum film thickness of PAO2 remained virtually unchanged under varying loads, which indicates the minimal impact of the load on the film thickness. PAO4 and PAO6 experienced a decrease in film thickness, and PAO6 had a more noticeable change. According to the classical elastohydrodynamic lubrication theory, an increase in load leads to a thinner film, but the change is less pronounced than that with speed variations [40]. The analysis suggests that the lower-viscosity PAO2 and PAO4 have smaller viscosity–pressure coefficients (1.390–1.403 × 10⁻⁸ m2/N, as shown in Table 4) than conventional paraffin-based base oils (1.5–2.4 × 10⁻⁸ m2/N), which result in a less significant effect of pressure on the lubricant. Consequently, the film thicknesses of PAO2 and PAO4 remained relatively constant under increased pressure during the experiments.
Figure 12 shows the lubrication regimes chart (Greenwood chart) of the PAOs studied in this paper [46,47,48]. Figure 12a shows the distribution of lubrication regimes with speed changes under a constant load (3 N). It can be seen from Figure 12a that the lubrication regimes of several PAOs are all in the VE region, that is, the elastohydrodynamic lubrication zone, but they are closer to the boundary between the VE region and the IE region. Therefore, at this time, using the elastohydrodynamic lubrication calculation method, there may be a large deviation (30%) between the calculated results and the actual film thickness [40]. It should be noted that with the increase in speed in the figure, the lubrication regime is moving towards the IR region (Ge decrease), and the PAO with higher viscosity is closer to the IR region than the PAO with lower viscosity. Figure 12b shows the lubrication regimes of each PAO changing with load at a constant speed (80 r/min). Similarly to Figure 12a, the PAO with higher viscosity is closer to the IR region than the PAO with lower viscosity, and the lubrication regimes of several PAOs are all in the VE region and close to the boundary between VE region and IE region. However, unlike Figure 12a, with the increase in load, the lubrication regime gradually moves away from the IR region (Ge increase). When moving away from the IR region, the deviation of using the elastohydrodynamic lubrication calculation method may be relatively small.
Additionally, because of the pure rolling and no sliding of the experimental conditions, and the relatively low speed, where thermal effects are neglected, the isothermal elastohydrodynamic lubrication theory is considered applicable. Therefore, the Hamrock–Dowson formula can be used to calculate the thickness of the lubricating film for the studied PAOs under VE region conditions [49]. The dimensionless minimum film thickness is
H min * = 3.63 G * 0.49 U * 0.68 W * 0.073 ( 1 e 0.68 ε )
Here, H min * is the dimensionless minimum film thickness. G* is the dimensionless material parameter, and G* = αE′; α is the pressure–viscosity coefficient, which describes the change in viscosity with respect to pressure; E′ is the composite Young’s modulus, which only depends on the materials of the friction pair. U* is a speed parameter and defined as U * = η 0 U E R x ; η0 is the initial viscosity of the lubricant; U is the entrainment velocity; Rx is the equivalent curvature radius along the direction of the entrainment velocity. W* is the dimensionless load parameter, and W * = W E R x 2 ; W is the actual load on the friction pair. ε is the ellipticity (ε = 1 for circular contact). When the entrainment velocity U remains constant, the speed parameter U* remains unchanged. When the load parameter W* varies, a smaller material parameter G* leads to a smaller change in film thickness. Thus, a smaller pressure–viscosity coefficient results in a smaller thickness change.

4. Comparison Between Theoretical Calculations and Experimental Results

Based on the rheological performance tests of PAOs, low-viscosity PAOs can be considered Newtonian at lower shear rates, which enables analysis using numerical methods for the isothermal point contact elastohydrodynamic lubrication (EHL) calculations. Therefore, a theoretical analysis of the lubrication state under experimental conditions was conducted using this numerical approach. The fundamental equations for isothermal point contact EHL problems include the Reynolds equation, film thickness equation, deformation equation, visco-elasticity equation, and density–pressure equation [50]. Because of the circular contact, relatively light load and low speed conditions in the experimental case, the side leakage effect is neglected. At this time, the Reynolds equation is
x ρ h 3 η p x + y ρ h 3 η p y = 12 U ρ h x
where ρ is the density of the lubricant; η is the viscosity of the lubricant; U is the average velocity, and U = (u1 + u2)/2, u1 and u2 are the tangential velocities of the upper and lower surfaces, respectively; p is the pressure; h is the film thickness; x is the coordinate along the motion; y is the coordinate perpendicular to the motion.
The film thickness equation is
h ( x , y ) = h 0 + x 2 2 R x + y 2 2 R y + v ( x , y )
where h0 is a film thickness parameter to be determined in the calculation, Rx is the equivalent radius of the surfaces in the x direction, Ry is the equivalent radius of the surfaces in the y direction, and v is the elastic deformation.
The elastic deformation equation is [51]
v ( x , y ) = 2 π E Ω p ( s , t ) ( x s ) 2 + ( y t ) 2 d s d t
where E′ is the equivalent elastic modulus, 1 E = 1 2 1 ν 1 2 E 1 + 1 ν 2 2 E 2 , ν1 and ν2 are the Poisson’s ratios of the two surfaces, and E1 and E2 are the elastic moduli of the two surfaces.
The viscosity–pressure equation is [52]
η = η 0 exp ln η 0 + 9.67 1 + 5.1 × 10 9 p 0.68 1
where η0 is the viscosity reference.
The density–pressure equation is [53]
ρ = ρ 0 1 + 0.6 p 1 + 1.7 p
where ρ0 is the density reference, and the unit of pressure p is GPa.
By applying dimensional normalization and differential discretization to Equations (4)–(8), iterative calculations can be performed to obtain a numerical solution for the lubrication film thickness under specific operating conditions. Figure 13 shows the lubrication film profile of PAO4 under the same load but with different glass disk rotational speeds.
The central profile of the lubrication film thickness along the entrainment velocity direction in Figure 13a shows the following: (1) At lower glass disk speeds, the necking phenomenon at the lubricant outlet is not significant; a noticeable contraction phenomenon only occurs when the speed is at least 40 r/min (which corresponds to an entrainment velocity of U = 0.260 m/s); (2) When the entrainment velocity increases, the point of contraction moves closer to the contact center; (3) As shown in Figure 13b, the thinnest film thickness occurs at the ears of the horseshoe-shaped fringes, which are on either side of the entrainment velocity direction. This finding indicates that the theoretical calculations are consistent with the interference patterns in Figure 7.
Hamrock and Dowson [49] fitted universal formulas for the minimum film thickness (Equation (3)) and central film thickness (Equation (9)) for point contact based on their numerical calculations of several common lubricants under load parameters W* of (0.1106–1.290) × 10−6 and speed parameters U* of (0.8416–50.5) × 10−12.
H c * = 2.69 G * 0.53 U * 0.67 W * 0.067 ( 1 0.61 e 0.73 ε )
Here, H c * is the dimensionless central film thickness. In the experiment, the calculated load parameter W* and speed parameter U* for PAO based on its initial viscosity and actual load and speed were (0.151–0.452) × 10−6 and (0.166–19.2) × 10−12, respectively, as shown in Table 5.
As shown in Table 5, all load parameters are within the range that corresponds to the film thickness equation fitted by Hamrock and Dowson, and they are located in the low-load region. Most of the speed parameters are within the speed parameter range associated with the film thickness equation fitted by Hamrock and Dowson. For PAO2 and PAO4 with lower viscosities, the speed parameters (in bold in the table) become too small when the operating speed is low, which deviates from the speed parameter region for the fitted film thickness formula. Compared with Figure 6, Figure 7 and Figure 8, when the speed parameter is small, there is no noticeable horse-shoe feature of elastohydrodynamic lubrication in the interference images. PAO4 and PAO6 exhibit elastohydrodynamic lubrication features only when the speed parameter exceeds 4.64 × 10⁻¹² (underlined in Table 5). Therefore, PAO2 will exhibit noticeable elastohydrodynamic lubrication at approximately 140 r/min (with a gyration radius of 62 mm and an entrainment velocity of 0.909 m/s). Figure 13 shows the experimental results under varying speeds and a constant load (3 N) for comparison with the calculations based on Equations (3) and (4).
As shown in Figure 14, the experimental results for the minimum and central film thicknesses generally follow the same trend as Hamrock–Dowson film thickness formula, where the thickness monotonically increases with increasing speed. The results for the same PAO are not significantly different from the calculated values, which indicates that Hamrock–Dowson formula remains applicable for low-viscosity PAOs and low-speed conditions and can predict the lubrication film thickness generally. In Figure 14a,b, the minimum film thickness calculated using Hamrock–Dowson formula is closer to the experimental results than the central thickness. However, in more demanding scenarios, the Hamrock–Dowson formula slightly overestimates the actual thickness at higher speeds, and the difference between calculated and experimental results for PAO6 with a higher viscosity may be more significant than those for PAO2 and PAO4. The reason is as follows: as the rheological performance tests in Figure 2 show, compared to PAO2 and PAO4, PAO6 exhibits more pronounced shear thinning behavior at higher shear rates, which leads to a larger deviation when it is treated as a Newtonian fluid in the numerical calculations. Zolper’s previous investigations also proved that, low-molecular-mass PAOs, including PAO4 exhibited Newtonian film-forming ability at the specific entrainment speeds [54].
In Figure 15, the experimental results for various loads (with a glass plate rotation speed of 80 r/min) are compared to the calculations using Hamrock–Dowson film thickness formula. When the load changes from 3 N to 6 N and 9 N, there is a noticeable deviation between the minimum or central film thicknesses of the very low-viscosity PAO2 and PAO4 and the calculated values, but this deviation remains relatively consistent. The calculated thickness consistently exceeds the experimental values, which is consistent with the analysis in Figure 14. Hence, the formula tends to overestimate the actual thickness at higher speeds. However, for PAO6 with a higher initial viscosity, the minimum film thickness calculated via the formula may be either smaller or larger than the experimental value; unlike the situations of PAO2 and PAO4, the calculated central thickness of PAO6 is consistently smaller than the experimental values. Estimating the actual film thickness for high-viscosity PAO6 using this formula may prove challenging.

5. Conclusions

This study compared the rheological properties and lubricating film formation performance of biodegradable PAO2 and PAO4 with non-biodegradable PAO6. The key findings are as follows:
  • PAO2 and PAO4, as very low-viscosity PAOs, behave like Newtonian fluids with a viscosity fluctuation of no more than 10% at high shear rates. They do not show significant thixotropic behavior or shear thinning. In contrast, PAO6, a higher-viscosity PAO, exhibits a more significant shear thinning effect with a viscosity fluctuation of ≥15% at high shear rates. This indicates that high-viscosity PAOs need special consideration of non-Newtonian effects in high-shear-rate applications.
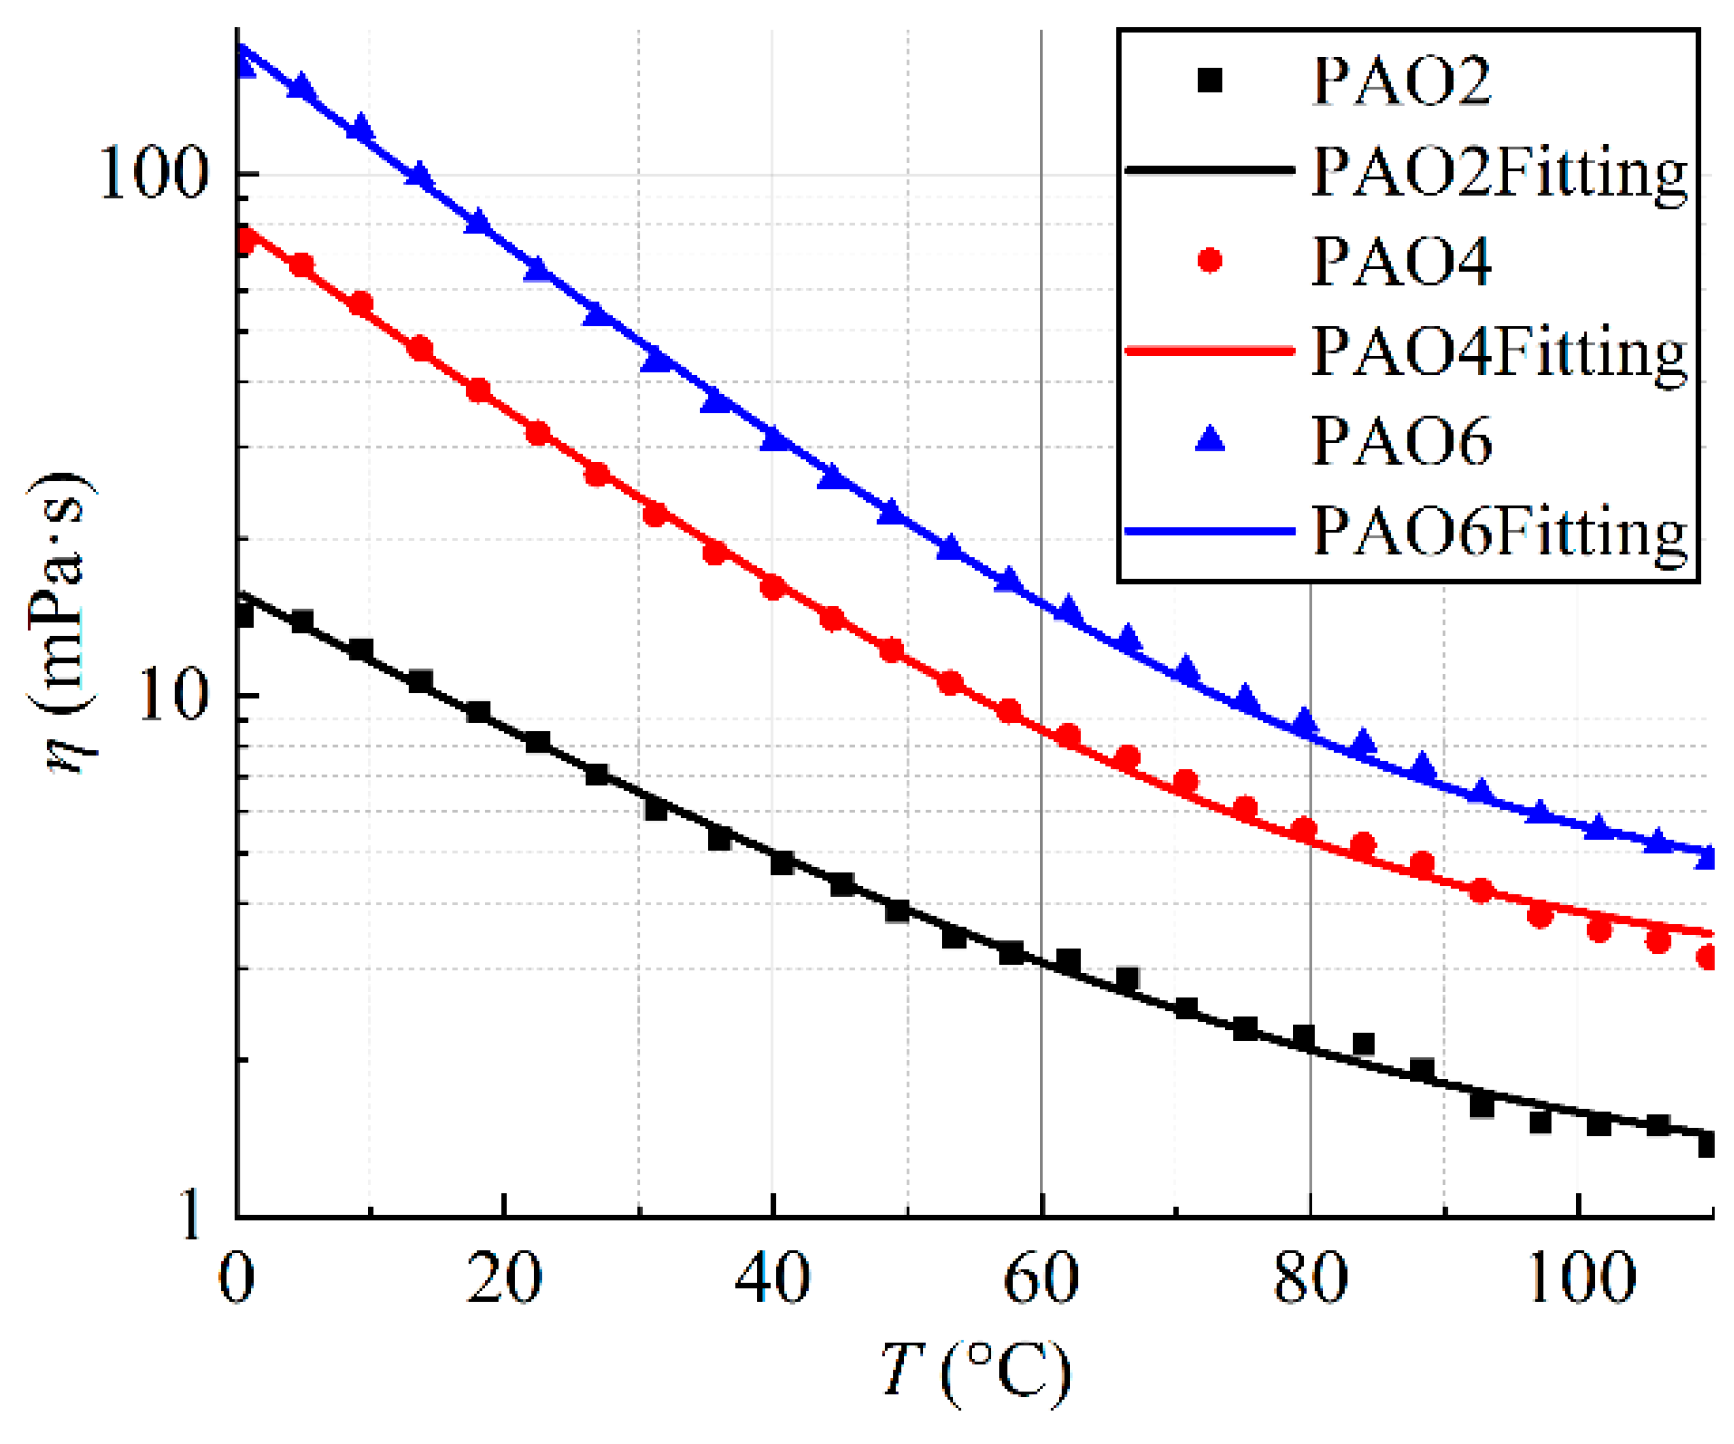
  • PAO2 has superior low-temperature performance and better cold flow characteristics compared to PAO6. PAO6 is more sensitive to temperature changes, with its viscosity dropping significantly within the 0–60 °C range. A viscosity–temperature equation was derived to predict the viscosities of PAO2, PAO4, and PAO6 at specific temperatures.
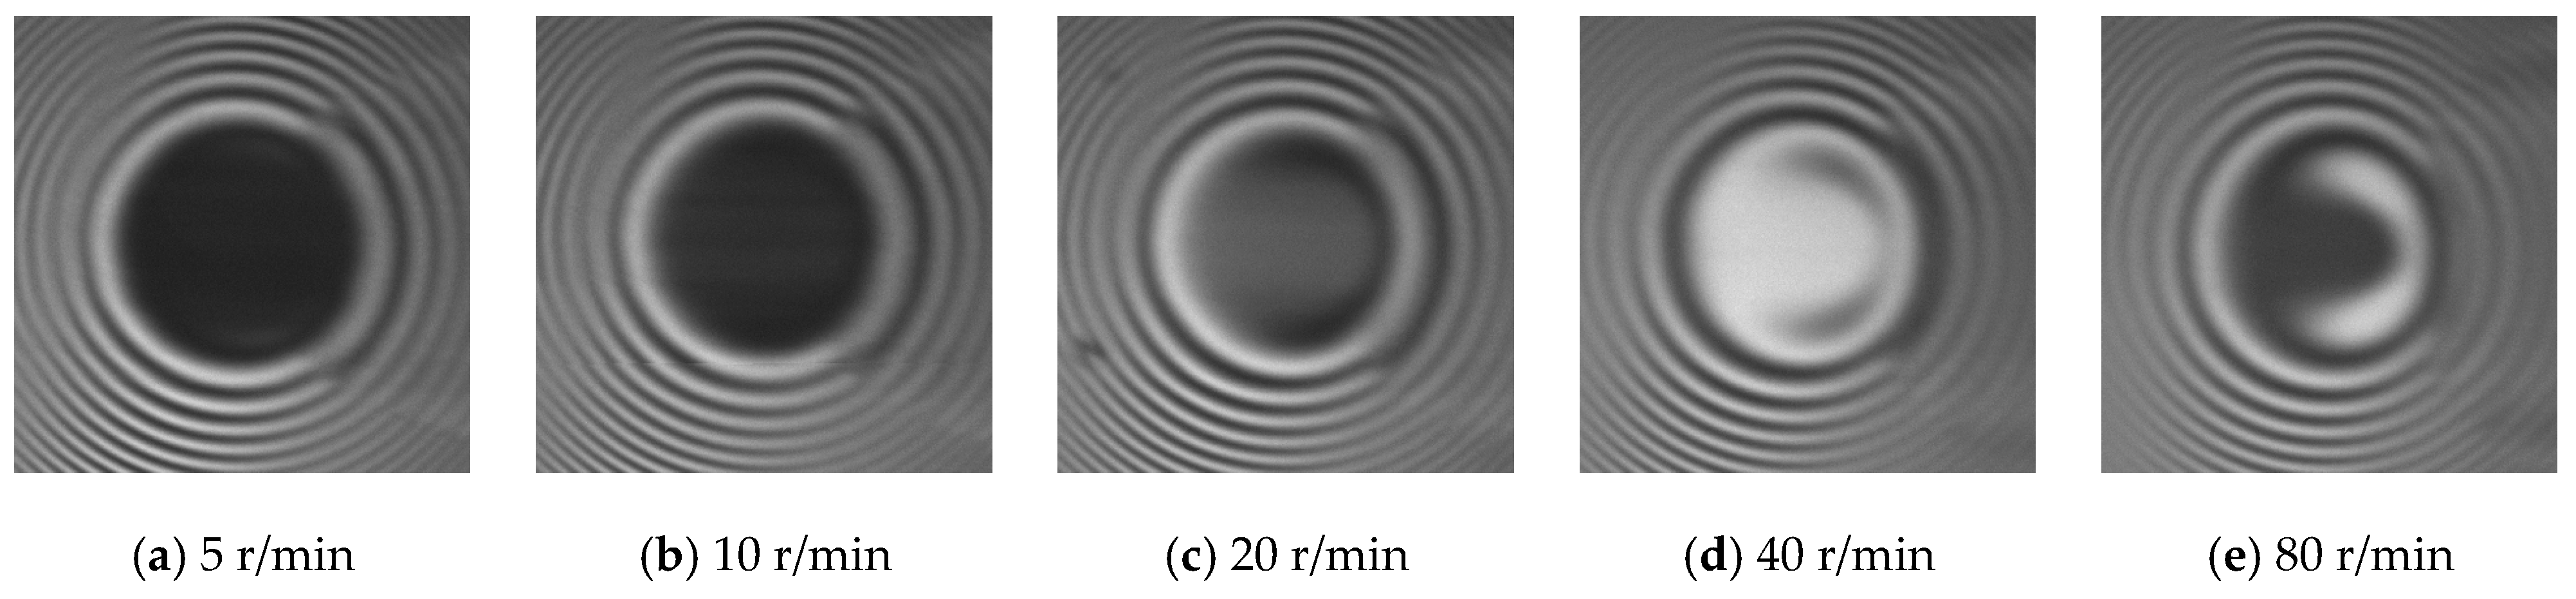
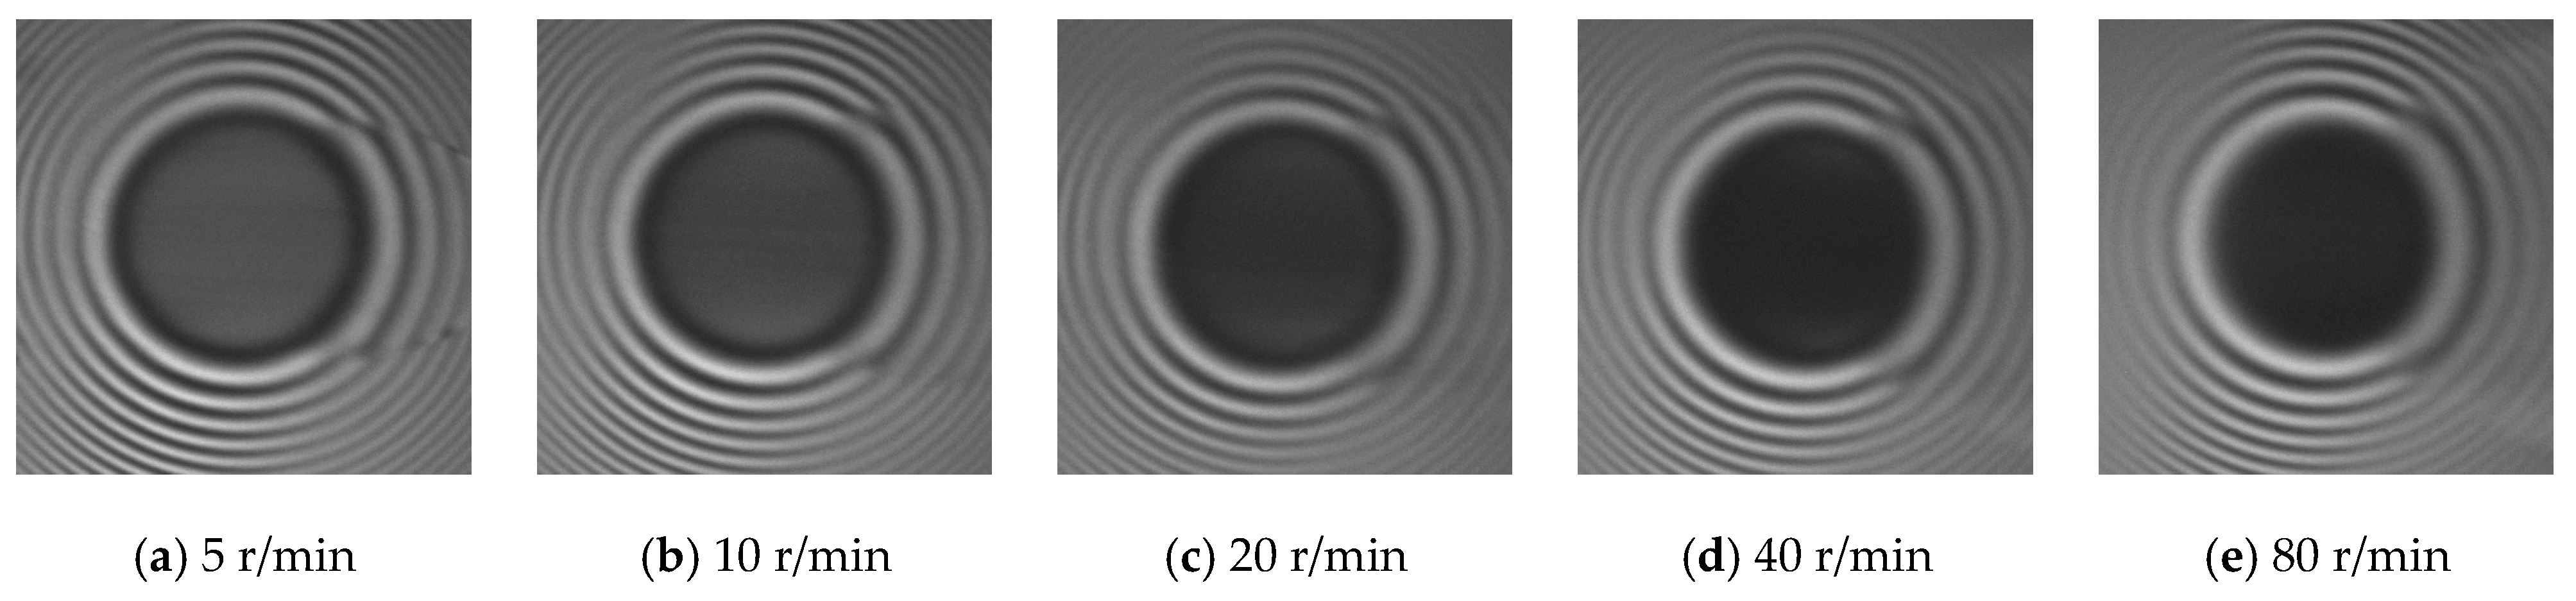
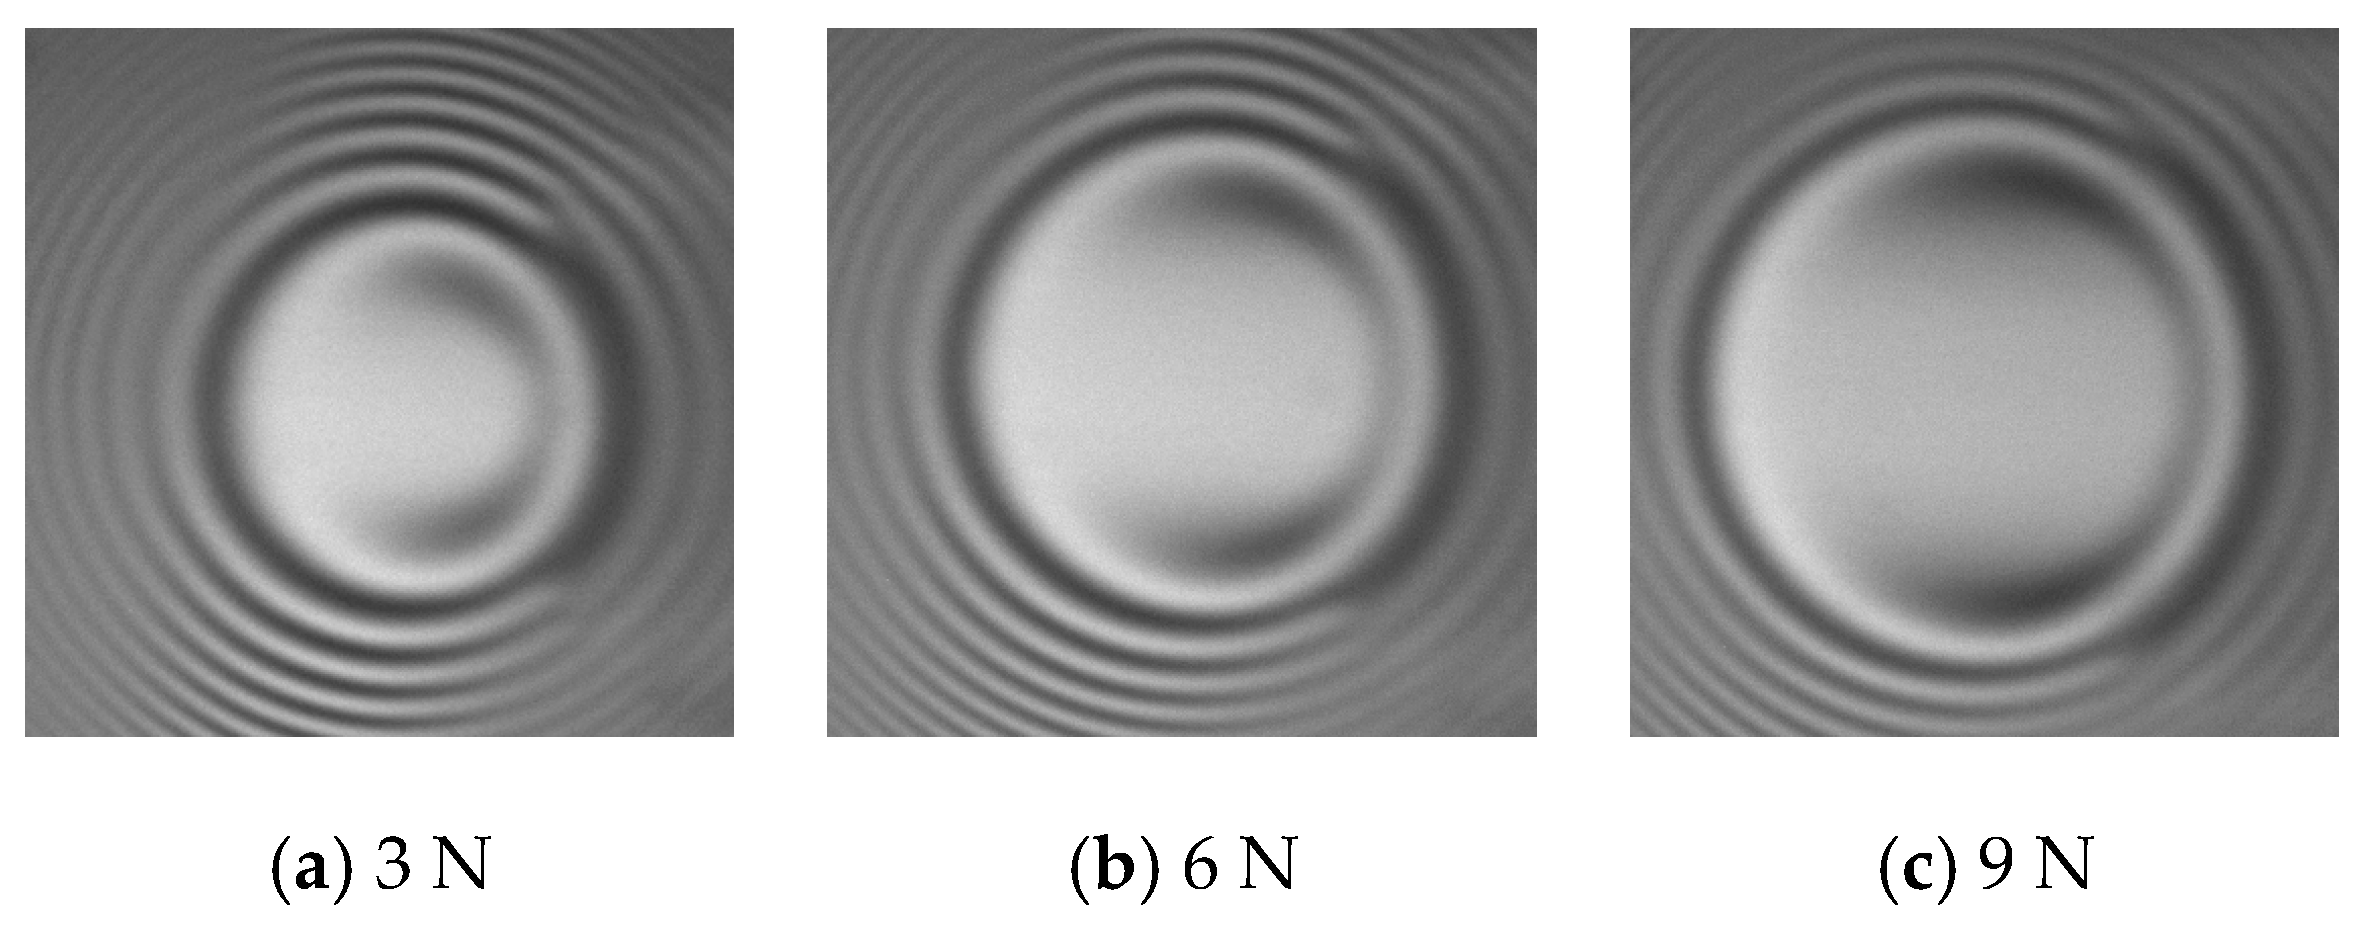
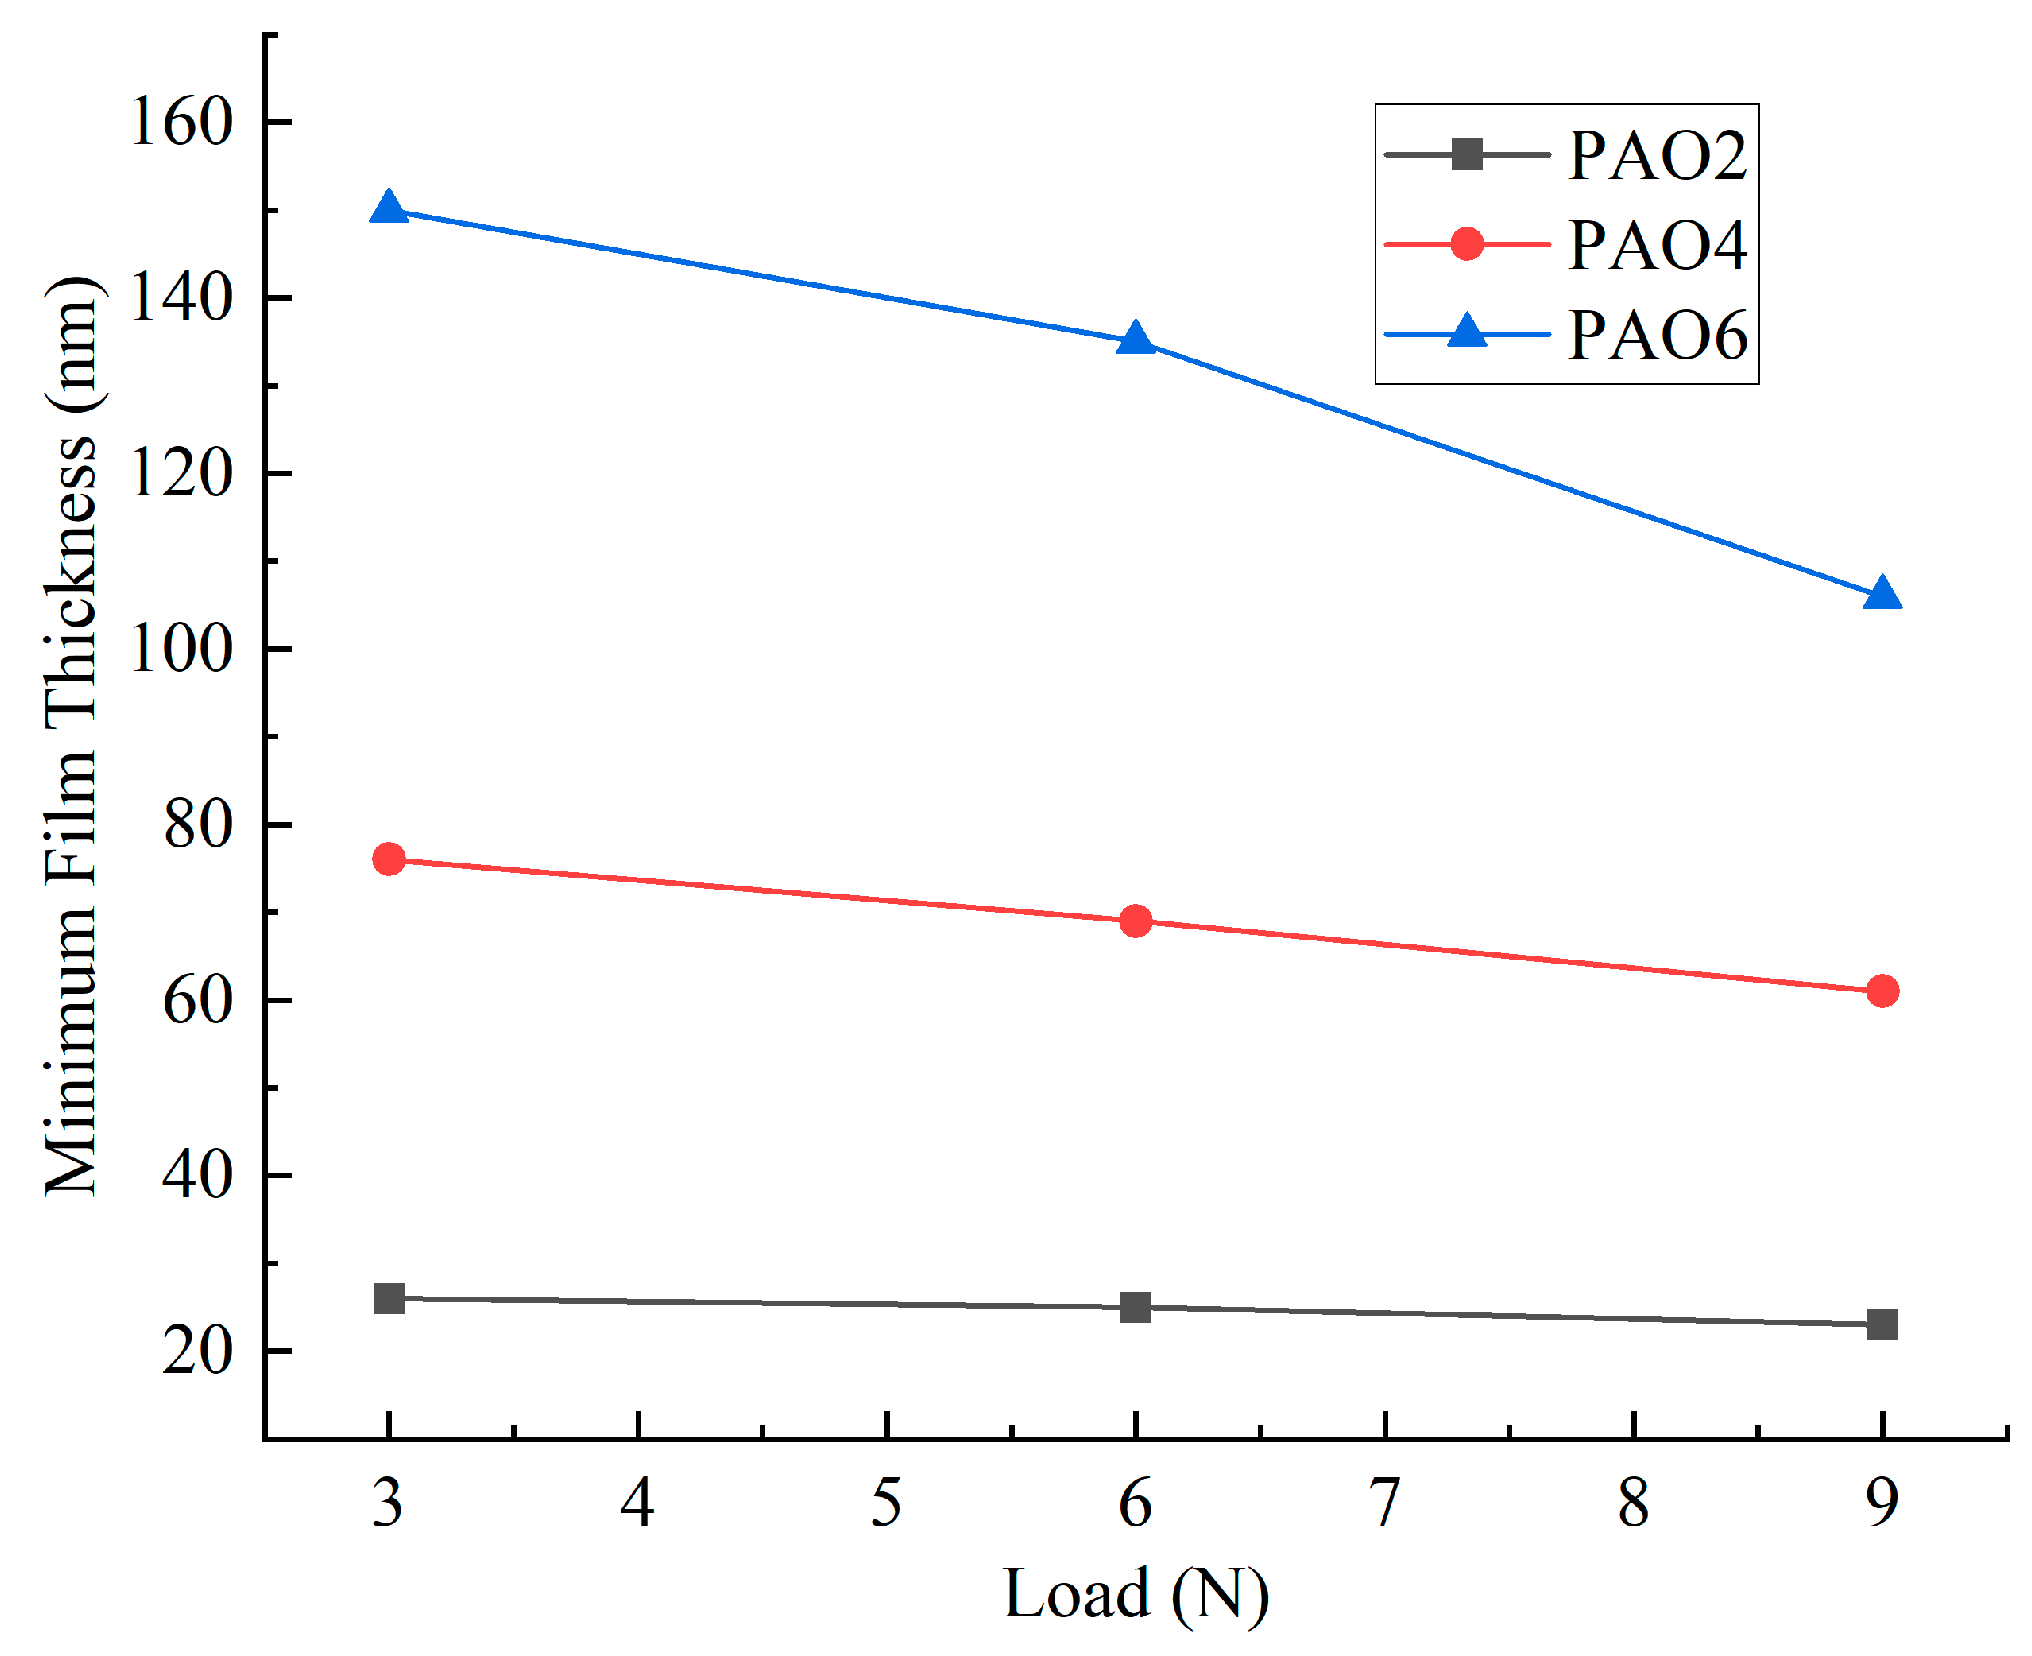
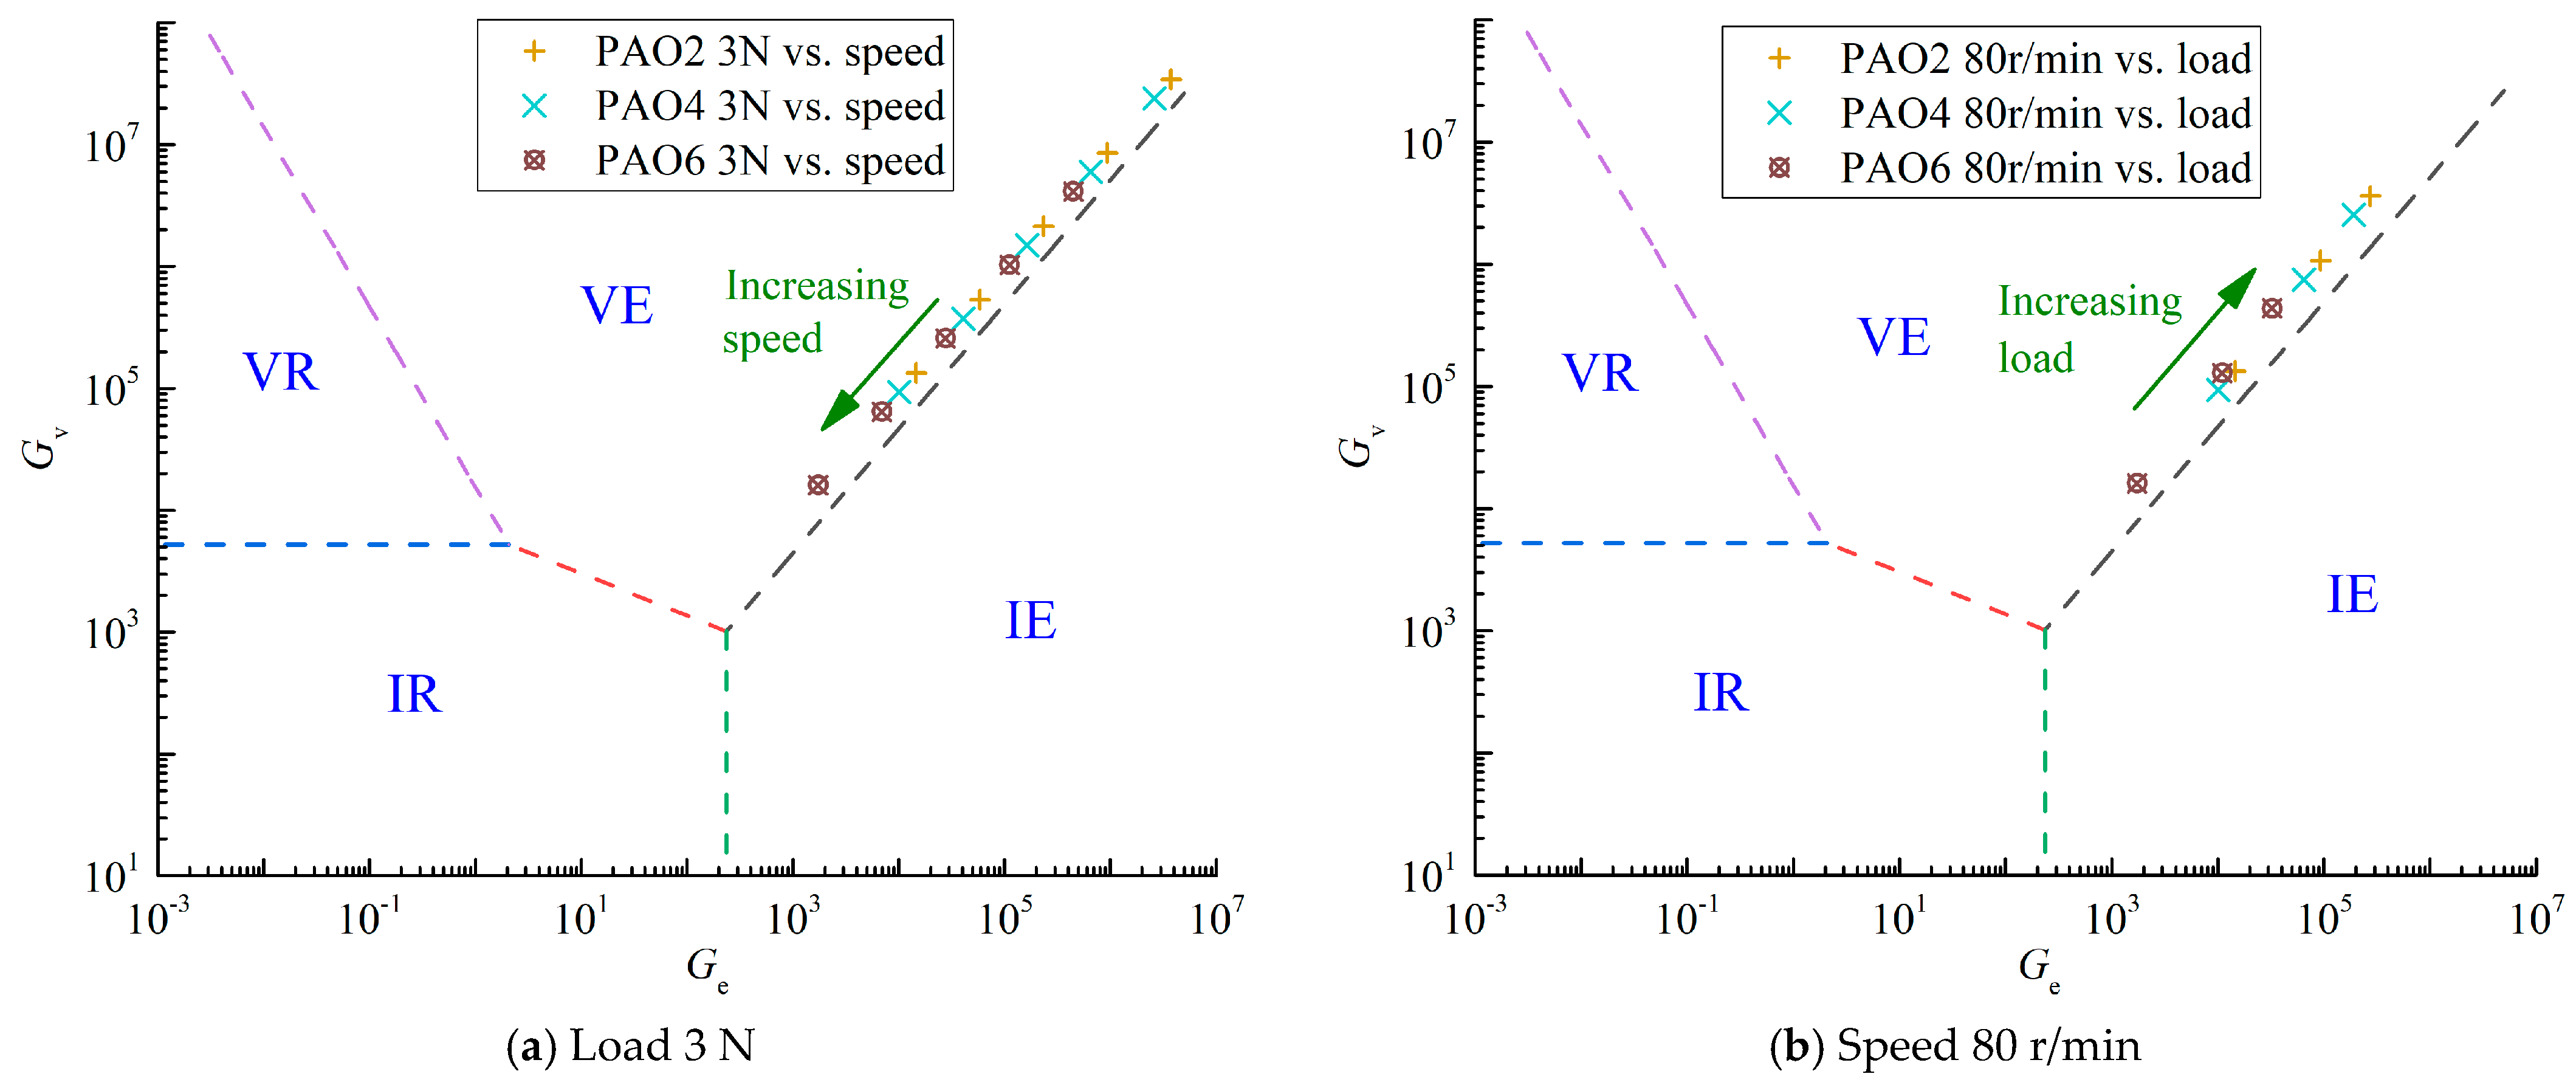
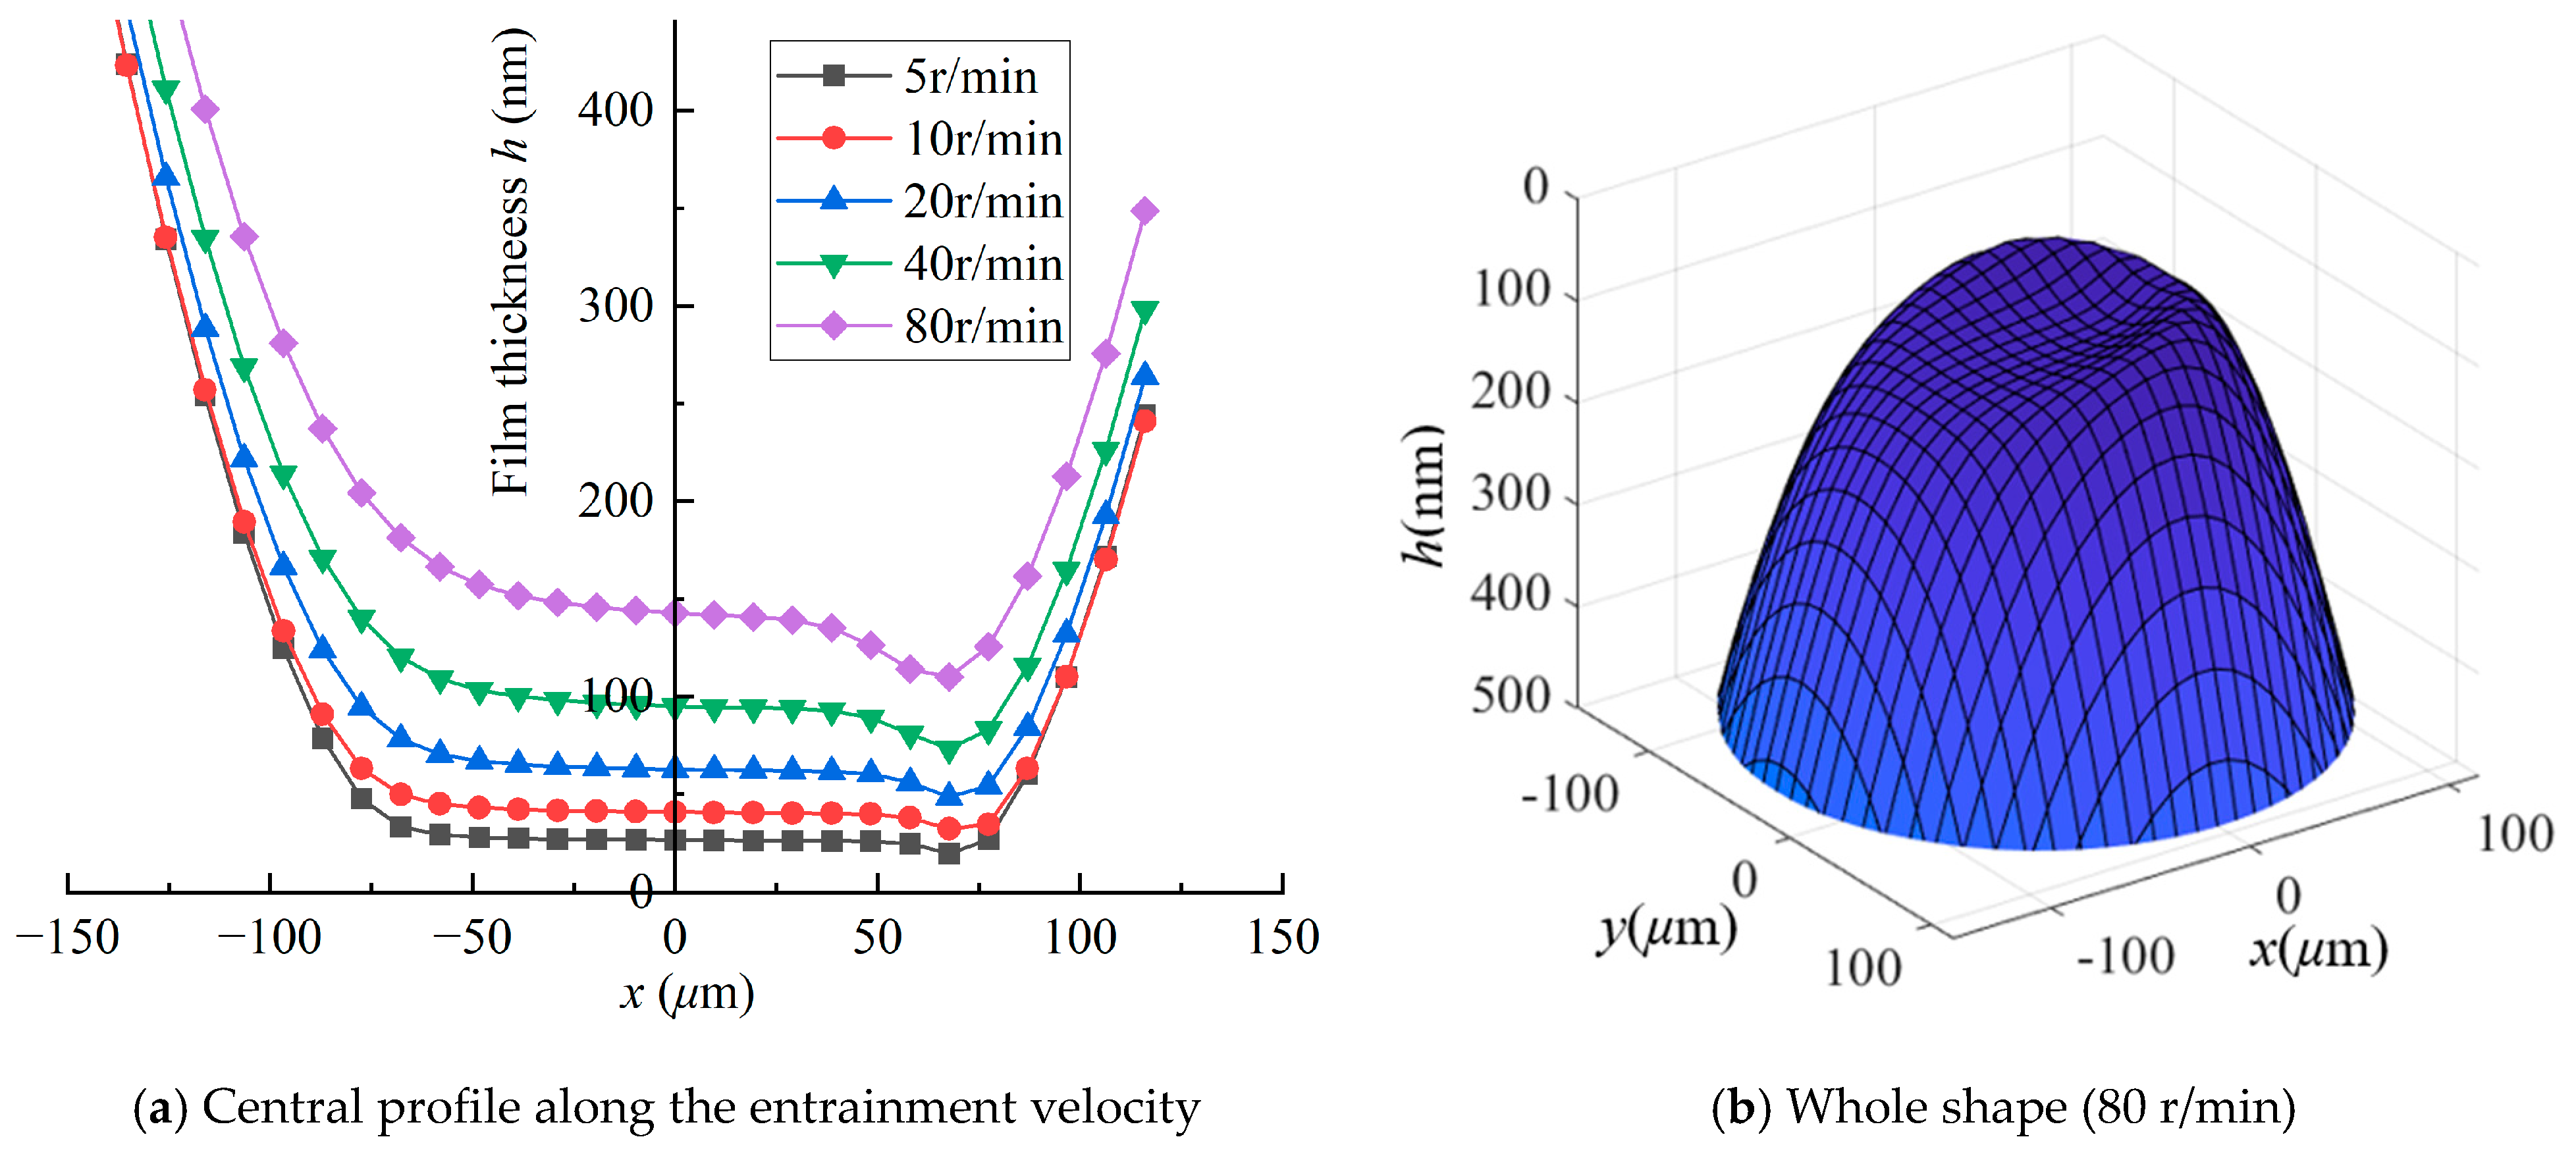
  • PAO2 and PAO4 films are less likely to form a uniform lubricating film as thick as that of PAO6 under certain conditions, based on the optical interference test results. PAO2 mainly operates in a boundary lubrication regime. Moreover, both speed and load have a smaller effect on the lubricating film thickness of PAO2 and PAO4 compared to PAO6.
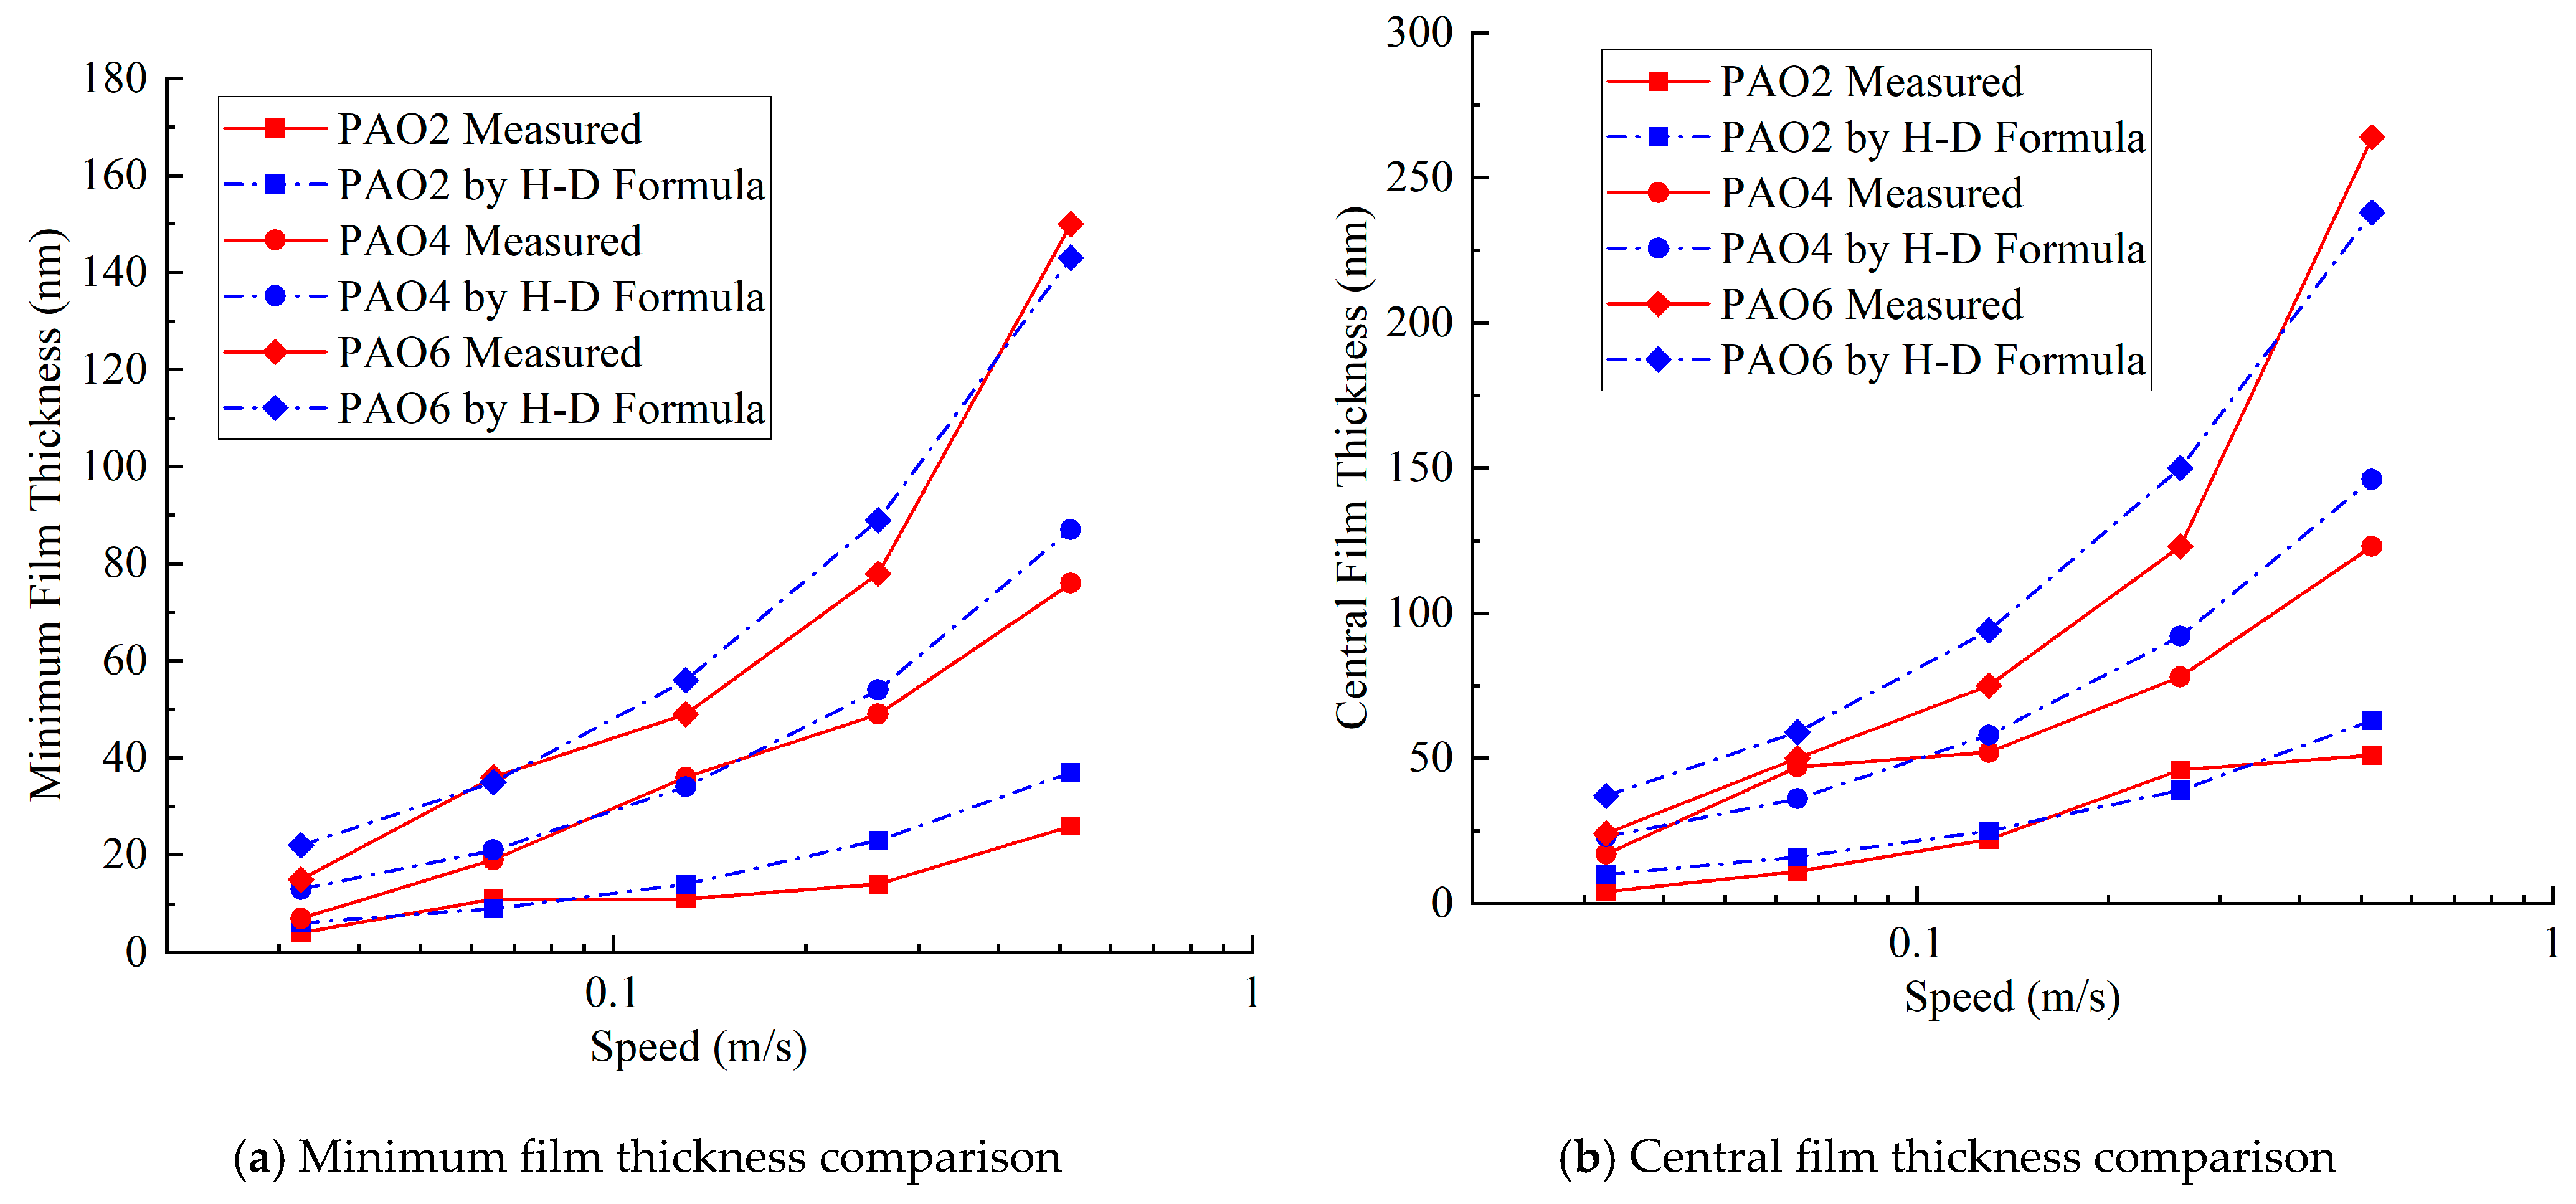
  • The Hamrock–Dowson formula overestimates the lubricating film thickness of PAO6 at high speeds. However, for very low-viscosity PAOs (PAO2 and PAO4), the isothermal elastohydrodynamic lubrication theory is applicable, and the Hamrock–Dowson formula can calculate values consistent with experimental measurements, providing a stable prediction of the lubricating film thickness for PAO2 and PAO4 generally.

Author Contributions

Investigation, Z.H.; resources, H.W. (Haiquan Wang) and Y.L.; writing—original draft preparation, Y.C.; funding acquisition, H.W. (Hui Wang). All authors have read and agreed to the published version of the manuscript.

Funding

This research was funded by Guangdong Provincial Key Laboratory of Advanced Green Lubricating Materials (202408), Maoming Green Chemical Industry Research Institute (MMGCIRI-2022YFJH-Y-044) and Maoming Science and Technology Project (2020521).

Data Availability Statement

Data are contained within the article.

Acknowledgments

The kind support from Caisong Mo, Xuqiang Feng, and Caiyun Ren was highly appreciated.

Conflicts of Interest

The authors declared that they have no potential conflicts of interest with respect to the research, authorship, and/or publication of this article.

Nomenclature

γ ˙ Shear rate [s−1]
I ¯ k Relative light intensity at the measurement point
I k , max Maximum light intensity within the interference half-order
I k , min Minimum light intensity within the interference half-order
I ¯ 0 Relative light intensity at the center of the film with zero thickness
I 0 , max Maximum light intensity at the center of the film with zero thickness
I 0 , min Minimum light intensity at the center of the film with zero thickness
H min * Dimensionless minimum film thickness
H c * Dimensionless central film thickness
ρDensity [g/m3]
AConstant of relationship between dynamic viscosity of PAO and temperature
EComposite Young’s modulus, 1 E = 1 2 1 ν 1 2 E 1 + 1 ν 2 2 E 2 , [Pa]
E1, E2Young’s modulus of two surfaces [Pa]
G* Dimensionless material parameter
GeDimensionless elasticity parameter
GvDimensionless viscosity parameter
hFilm thickness [m]
h0Film thickness parameter to be determined in the calculation [m]
IAbsolute light intensity at the measurement point
I0Absolute light intensity at the center of the film with zero thickness
kDefined interference half-order
nConstant of relationship between dynamic viscosity of PAO and temperature
ndRefractive index
pPressure [Pa]
RxEquivalent curvature radius along the direction of the entrainment velocity [m]
RyEquivalent curvature radius perpendicular to the direction of the entrainment velocity [m]
tTime [min]
TTemperature [°C]
UEntrainment velocity [m/s]
U* Dimensionless speed parameter
WLoad [N]
W* Dimensionless load parameter
xCoordinate along the direction of the entrainment velocity [m]
yCoordinate perpendicular to the direction of the entrainment velocity [m]
αPressure–viscosity coefficient [m2/N]
εEllipticity
ηDynamic viscosity [Pa·s]
η0Viscosity at atmosphere pressure [Pa·s]
ηcConstant of relationship between dynamic viscosity and temperature
λWavelength [nm]
ν1, ν2Poisson’s ratio of two surfaces
τShear stress [Pa]

References

  1. Rudnick, L.R. Polyalphaolefns. In Synthetics, Mineral Oils, and Bio-Based Lubricants; CRC Press: Boca Raton, FL, USA, 2020; p. 20. [Google Scholar]
  2. Bartz, W.J. Lubricants and the environment. Tribol. Int. 1998, 31, 35–47. [Google Scholar] [CrossRef]
  3. Hope, K. PAO Contributions to Energy Efficiency in 0W-20 Passenger Car Engine Oils. Lubricants 2018, 6, 73. [Google Scholar] [CrossRef]
  4. Kang, G.; Zhang, F.; Liu, H.; Wei, B.; Jin, Z.; Lv, H. Rapid Separation and API Grades Identification of Base Oil in Low Viscosity Gasoline Engine Oil SN 0W-16. ACS Omega 2024, 9, 21270–21275. [Google Scholar] [CrossRef]
  5. Ishizaki, K.; Nakano, M. Reduction of CO2 Emissions and Cost Analysis of Ultra-Low Viscosity Engine Oil. Lubricants 2018, 6, 102. [Google Scholar] [CrossRef]
  6. Benda, R.; Bullen, J.; Plomer, A. Synthetics basics: Polyalphaolefins—Base fluids for high-performance lubricants. J. Synth. Lubr. 1996, 13, 41–57. [Google Scholar] [CrossRef]
  7. Van Rensselar, J. The bright future for PAOs. Tribol. Lubr. Technol. 2021, 77, 28–32. [Google Scholar]
  8. Rahim, K.A.; Al-Humairi, S.N.S. Influence of Lubrication Technology on Internal Combustion Engine Performance: An Overview. In Proceedings of the 2020 IEEE 8th Conference on Systems, Process and Control (ICSPC), Melaka, Malaysia, 11–12 December 2020; pp. 184–189. [Google Scholar]
  9. Harold, S. Biodegradability: Review of the Current Situation; Lubrizol Corporation: Wickliffe, OH, USA, 1993. [Google Scholar]
  10. Honary, L.; Richter, E. Biobased Lubricants and Greases: Technology and Products, 1st ed.; John Wiley & Sons, Ltd.: Chichester, UK, 2011; pp. 187–190. [Google Scholar]
  11. Coordinating European Council. Test Method for the Biodegradability of Two-Stroke Cycle Outboard Engine Oils in Water; CEC L-33-T-93; Coordinating European Council: Brussels, Belgium, 1995. [Google Scholar]
  12. Organisation for Economic Co-Operation and Development. OECD Guidelines for the Testing of Chemicals. Test No. 301: Ready Biodegradability 1992. Available online: https://www.oecd.org/en/publications/test-no-301-ready-biodegradability_9789264070349-en.html (accessed on 1 October 2024).
  13. ASTM D5864-23; Standard Test Method for Determining Aerobic Aquatic Biodegradation of Lubricants or Their Components. ASTM: Philadelphia, PA, USA, 2023.
  14. Völtz, M. New CEC test method L-103 for lubricant biodegradability. Tribol. Schmier. 2012, 59, 23–26. [Google Scholar]
  15. Boyde, S. Green lubricants. Environmental benefits and impacts of lubrication. Green Chem. 2002, 4, 293–307. [Google Scholar] [CrossRef]
  16. Johnson, M.; Miller, M. Eco-friendly fluids for the lubricants industry. Tribol. Lubr. Technol. 2010, 66, 28–34. [Google Scholar]
  17. Sherman, J.; Totten, G.E.; Shah, R.J.; Forester, D.R. Chapter 13|Synthetic Lubricants: Nonaqueous. In Fuels and Lubricants Handbook: Technology, Properties, Performance, and Testing; ASTM International: West Conshohocken, PA, USA, 2019. [Google Scholar]
  18. Zwierzycki, W.; Górny, K. Trends in the process of greening lubricants. Q. Tribol. 2020, 290, 91–98. [Google Scholar] [CrossRef]
  19. Carpenter, J.F. Biodegradability and toxicity of polyalphaolefin base stocks. J. Synth. Lubr. 1995, 12, 13–20. [Google Scholar] [CrossRef]
  20. Kržan, B.; Vižintin, J.; Vižintin, J.; Kalin, M.; Dohda, K.; Jahanmir, S. Use and Development of Biodegradable Oils. In Tribology of Mechanical Systems: A Guide to Present and Future Technologies; ASME Press: New York, NY, USA, 2004. [Google Scholar]
  21. Beran, E. Experience with evaluating biodegradability of lubricating base oils. Tribol. Int. 2008, 41, 1212–1218. [Google Scholar] [CrossRef]
  22. Battersby, N.S. The biodegradability and microbial toxicity testing of lubricants—Some recommendations. Chemosphere 2000, 41, 1011–1027. [Google Scholar] [CrossRef]
  23. De Wilde, B.; Mortier, N.; van Eekert, M.; Briassoulis, D.; Mistriotis, A.; van der Zee, M. Knowledge Based Bio-Based Products’ Pre-Standardization; Netherlands Standardization Institute (NEN): Delft, The Netherlands, 2015. [Google Scholar]
  24. Rhee, I.-S. Assessing the Biodegradability of Hydraulic Fluids Using a Bio-Kinetic Model. Tribol. Trans. 2008, 51, 68–73. [Google Scholar] [CrossRef]
  25. Roell, B.C.; Otto, A.; Kuchta, T. Environmentally Acceptable Hydraulic Lubricants. In Environmentally Friendly and Biobased Lubricants, 1st ed.; Brajendra, K., Sharma, G.B., Eds.; CRC Press: Boca Raton, FL, USA, 2016; pp. 136–139. [Google Scholar]
  26. Battersby, N.S. Biodegradable Lubricants: What Does ‘Biodegradable’ Really Mean? J. Synth. Lubr. 2005, 22, 3–18. [Google Scholar] [CrossRef]
  27. Cyriac, F.; Yi, T.X.; Poornachary, S.K.; Chow, P.S. Influence of Base oil Polarity on the Tribological Performance of Surface-Active Engine Oil Additives. Tribol. Lett. 2021, 69, 87. [Google Scholar] [CrossRef]
  28. Jablonka, K.; Glovnea, R.; Bongaerts, J.; Morales-Espejel, G. The effect of the polarity of the lubricant upon capacitance measurements of EHD contacts. Tribol. Int. 2013, 61, 95–101. [Google Scholar] [CrossRef]
  29. Dresel, W. Synthetic base oils. In Lubricants and Lubrication; Wilfried Dresel, T.M.P., Ed.; Wiley-VCH Verlag GmbH & Co. KGaA: Hoboken, NJ, USA, 2017; pp. 83–116. [Google Scholar]
  30. Cen, H.; Morina, A.; Neville, A. Effect of base oil polarity on the micropitting behaviour in rolling-sliding contacts. Lubr. Sci. 2019, 31, 113–126. [Google Scholar] [CrossRef]
  31. Jiang, S.; Li, S.; Liu, L.; Wang, L.; Mominou, N. The tribological properties and tribochemical analysis of blends of poly alpha-olefins with neopentyl polyol esters. Tribol. Int. 2015, 86, 42–51. [Google Scholar] [CrossRef]
  32. Fan, M.; Yang, D.; Wang, X.; Liu, W.; Fu, H. DOSS– Based QAILs: As Both Neat Lubricants and Lubricant Additives with Excellent Tribological Properties and Good Detergency. Ind. Eng. Chem. Res. 2014, 53, 17952–17960. [Google Scholar] [CrossRef]
  33. Guimarey, M.J.G.; Comuñas, M.J.P.; López, E.R.; Amigo, A.; Fernández, J. Thermophysical properties of polyalphaolefin oil modified with nanoadditives. J. Chem. Thermodyn. 2019, 131, 192–205. [Google Scholar] [CrossRef]
  34. LaFountain, A.; Johnston, G.J.; Spikes, H.A. Elastohydrodynamic Friction Behavior of Polyalphaolefin Blends. In Tribology Series; Dowson, D., Taylor, C.M., Childs, T.H.C., Dalmaz, G., Berthier, Y., Flamand, L., Georges, J.M., Lubrecht, A.A., Eds.; Elsevier: Amsterdam, The Netherlands, 1998; Volume 34, pp. 465–475. [Google Scholar]
  35. Larsson, R.; Larsson, P.O.; Eriksson, E.; Sjöberg, M.; Höglund, E. Lubricant properties for input to hydrodynamic and elastohydrodynamic lubrication analyses. Proc. Inst. Mech. Eng. Part J J. Eng. Tribol. 2000, 214, 17–27. [Google Scholar] [CrossRef]
  36. Nakamura, Y.; Hiraiwa, S.; Suzuki, F.; Matsui, M. High-Pressure Viscosity Measurements of Polyalphaorefins at Elevated Temperature. Tribol. Online 2016, 11, 444–449. [Google Scholar] [CrossRef]
  37. Bair, S.; Flores-Torres, S. The Viscosity of Polyalphaolefins Mixtures at High Pressure and Stress. J. Tribol. 2018, 141, 021802. [Google Scholar] [CrossRef]
  38. Pichler, J.; Maria Eder, R.; Besser, C.; Pisarova, L.; Dörr, N.; Marchetti-Deschmann, M.; Frauscher, M. A comprehensive review of sustainable approaches for synthetic lubricant components. Green Chem. Lett. Rev. 2023, 16, 2185547. [Google Scholar] [CrossRef]
  39. Mannekote, J.K.; Kailas, S.V. Biodegradability and Ecotoxicity Evaluation of lubricants. In Environmentally Friendly and Biobased Lubricants; CRC Press: Boca Raton, FL, USA, 2016; pp. 151–165. [Google Scholar]
  40. Wen, S.; Huang, P. Principles of Tribology, 2nd ed.; Wiley: Singapore, 2017. [Google Scholar]
  41. Du, S.; Zhang, C.; Luo, Z. Combination of diketone and PAO to achieve macroscale oil-based superlubricity at relative high contact pressures. Friction 2024, 12, 869–883. [Google Scholar] [CrossRef]
  42. Wang, Y.; Gao, X.; Shen, Y.; Lin, J. Dynamic Viscosity-Temperature Characteristics and Models of Various Lubricating Oils. Recent Pat. Eng. 2023, 17, 23–31. [Google Scholar] [CrossRef]
  43. Chen, Y.; Huang, P. An Improved Interference Method for Measuring Lubricant Film Thickness Using Monochromatic Light. Tribol. Lett. 2017, 65, 120. [Google Scholar] [CrossRef]
  44. Panwar, P.; Schweissinger, E.; Maier, S.; Hilf, S.; Sirak, S.; Martini, A. Effect of polymer structure and chemistry on viscosity index, thickening efficiency, and traction coefficient of lubricants. J. Mol. Liq. 2022, 359, 119215. [Google Scholar] [CrossRef]
  45. Ueda, M.; Wong, J.S.S.; Spikes, H. Influence of dumbbell base oil blends on micropitting. Tribol. Int. 2023, 185, 108578. [Google Scholar] [CrossRef]
  46. Esfahanian, M.; Hamrock, B.J. Fluid-Film Lubrication Regimes Revisited. Tribol. Trans. 1991, 34, 628–632. [Google Scholar] [CrossRef]
  47. Hamrock, B.J.; Dowson, D. Minimum Film Thickness in Elliptical Contacts for Different Regimes of Fluid-Film Lubrication; NASA: Washington, DC, USA, 1978. [Google Scholar]
  48. Greenwood, J.A. Elastohydrodynamic Lubrication. Lubricants 2020, 8, 51. [Google Scholar] [CrossRef]
  49. Hamrock, B.J.; Dowson, D. Isothermal Elastohydrodynamic Lubrication of Point Contacts: Part III—Fully Flooded Results. J. Tribol. 1977, 99, 264–275. [Google Scholar] [CrossRef]
  50. Huang, P. Numerical Calculation of Elastohydrodynamic Lubrication: Methods and Programs; Wiley: Singapore, 2015; pp. 84–94. [Google Scholar]
  51. Gohar, R.; Rahnejat, H. Fundamentals of Tribology; Imperial College Press: London, UK, 2008. [Google Scholar]
  52. Roeland, C.J.A. Correlation Aspect of the Viscosity-Temperature-Pressure Relation of Lubrication Oils. Ph.D. Thesis, Delft University of Technology, Delft, The Netherlands, 1966. [Google Scholar]
  53. Dowson, D.; Higginson, G.R. A Numerical Solution to the Elasto-Hydrodynamic Problem. J. Mech. Eng. Sci. 1959, 1, 6–15. [Google Scholar] [CrossRef]
  54. Zolper, T.J.; He, Y.; Delferro, M.; Shiller, P.; Doll, G.; LotfizadehDehkordi, B.; Ren, N.; Lockwood, F.; Marks, T.J.; Chung, Y.-W.; et al. Investigation of Shear-Thinning Behavior on Film Thickness and Friction Coefficient of Polyalphaolefin Base Fluids with Varying Olefin Copolymer Content. J. Tribol. 2016, 139, 021504. [Google Scholar] [CrossRef]
Figure 1. Time-dependent measurement of low-viscosity PAOs.
Lubricants 13 00062 g001
Figure 2. Shear-dependent measurement of low-viscosity PAOs (20 °C).
Lubricants 13 00062 g002
Figure 3. Temperature-dependent measurement of low-viscosity PAOs.
Lubricants 13 00062 g003
Figure 4. Fittings of viscosity–temperature relationship of PAOs.
Lubricants 13 00062 g004
Figure 5. Experimental apparatus and measurement principle.
Lubricants 13 00062 g005
Figure 6. Light interference images of PAO6 versus speed (Load 3 N).
Lubricants 13 00062 g006
Figure 7. Light interference images of PAO4 versus speed (Load 3 N).
Lubricants 13 00062 g007
Figure 8. Light interference images of PAO2 versus speed (Load 3 N).
Lubricants 13 00062 g008
Figure 9. Minimum film thickness of PAOs versus speed (Load 3 N).
Lubricants 13 00062 g009
Figure 10. Interference images of PAO4 versus load (Speed 80 r/min).
Lubricants 13 00062 g010
Figure 11. Minimum film thickness of PAOs versus load (Speed 80 r/min).
Lubricants 13 00062 g011
Figure 12. Greenwood chart for the PAOs (ellipticity ε = 1, G e = W * 8 / 3 / U * 2 , G v = G * W * 3 / U * 2 , IR = Iso-viscous Rigid, IE = Iso-viscous Elastic, VR = Viscous Rigid, VE = Viscous Elastic).
Lubricants 13 00062 g012
Figure 13. Lubricating film shape of PAO4 versus speed (Load 3 N).
Lubricants 13 00062 g013
Figure 14. Comparison of experimental results with Hamrock–Dowson film thickness formula calculation results versus speed (Load 3 N).
Lubricants 13 00062 g014
Figure 15. Comparison between experimental results and Hamrock–Dowson formula results for various loads.
Lubricants 13 00062 g015
Table 1. Basic properties of the neat PAO samples *.
Kinematic Viscosity (mm2/s)Viscosity IndexDensity (15 °C, g/cm3)
40 °C100 °C
PAO25.01.70-0.798
PAO419.04.101260.820
PAO631.05.801380.827
* From the product datasheet.
Table 2. Visco-temperature equation of low-viscosity PAOs.
Fitting Visco-Thermal EquationAdj. R-Square
PAO2 η = 0.0148 × exp ( T 30.24007 ) + 0.04143 0.99710
PAO4 η = 0.07788 × exp ( T 23.05567 ) + 0.00284 0.99862
PAO6 η = 0.17428 × exp ( T 21.83711 ) + 0.00387 0.99787
Table 3. Material properties of the tribopair.
MaterialPoisson’s RatioModulus of Elasticity/PaRadius of Curvature/mSurface Roughness/nm
Steel ballGCr150.2802.07 × 10110.01272
Glass diskCrown glass K90.2098.13 × 10105
Table 4. Relevant lubricant properties of tribological experiments.
ItemDynamic Viscosity η/mPa·s aRefractive Index nd bPressure–Viscosity Coefficient α/×10−8 m2/N c
PAO281.4421.390
PAO4281.4531.403
PAO6581.4581.408
a Measured in Section 2. b From the product datasheet. c From Reference [41].
Table 5. Load parameters and speed parameters in the experiments.
Load Parameter W* (×10−6)Speed Parameter U* (×10−12)
3 N6 N9 N5 r/min10 r/min20 r/min40 r/min80 r/min
PAO20.1510.3020.4520.1660.3320.6631.332.65
PAO40.5801.162.324.649.28
PAO61.202.404.819.6219.2
Disclaimer/Publisher’s Note: The statements, opinions and data contained in all publications are solely those of the individual author(s) and contributor(s) and not of MDPI and/or the editor(s). MDPI and/or the editor(s) disclaim responsibility for any injury to people or property resulting from any ideas, methods, instructions or products referred to in the content.

