Article

Investigation of the Rheological Behaviour of Three Industrial Lubricants at High Shear Rates and Pressures

1
China North Vehicle Research Institute, Norinco Group, Beijing 100072, China
2
National Key Laboratory of Vehicular Transmission, Beijing Institute of Technology, Beijing 100081, China
*
Author to whom correspondence should be addressed.
Lubricants 2025, 13(11), 494; https://doi.org/10.3390/lubricants13110494
Submission received: 1 September 2025 / Revised: 9 October 2025 / Accepted: 10 October 2025 / Published: 12 November 2025
(This article belongs to the Special Issue Experimental Modelling of Tribosystems)

Abstract

This paper aims to investigate the rheological behaviour of industrial lubricants at high shear and high pressure. A twin-disk rheometer based on a standard UMT apparatus is used to measure the rheological features and film thickness of three lubricants, namely, 150N, UB-3, and 15W/40, with the shear rate ranging from 0 s−1 to 107 s−1 and the pressure at GPa. A semiempirical rheological model that considers the influence of heat, shear, and fluidic plasticity was proposed to adequately fit the experimental data of three organic lubricants. The rheology of the lubricants has a linear to nonlinear relationship with increasing shear rate, indicating shear thinning, which is then followed by a sharp decrease at approximately 106 s−1 because of thermal effects. At a higher shear rate, the shear stress saturates to a critical value. Moreover, the critical traction coefficients in the saturation region show similar changes in pressure and temperature for the three lubricants. The coefficients are greater at 1 GPa but decrease and saturate above 1.45 GPa, probably because the molecular-free volume is compressed by the constraint. The coefficients change little with varying inlet temperature at 1.45 GPa. This research sheds light on the complex rheological behaviour of three lubricants at high shear rates and high pressures and attempts to explain them theoretically.

1. Introduction

Lubricant films between mechanical tractive pairs, such as gear pairs [1,2,3], ball bearings [4,5], seal rings [6,7,8,9], and wet clutches [10,11], should maintain traction when transmitting torque from one end to the other at a high shear rate and high pressure. Although a high shear stress acts on the two surfaces, the film inside maintains friction and wear at a low level. Thus, lubrication plays an important role in improving efficiency and lifetime.
The history of lubrication can be dated back to the BC era, with the most widely known example coming from Egyptian bas-reliefs showing the transportation of stone colossuses with men pouring liquids in front of transportation slides [12]. Intuitively, lubrication usually occurs when an intermedium separates two surfaces; thus, the number of rough contacts decreases. In the 17th century, Hooke and Newton categorized the properties of lubricants into elasticity and viscosity and quantitatively established a relationship between the measured force and fluidic response, which was a trailblazer in rheological constitutive modelling, described as the level of the velocity gradient changing with external shear. Moreover, a theoretical landmark in explaining the lubrication phenomenon came in 1886 [13], when Reynolds established the lubrication theory by reasonably deducing it from the Navier–Stokes equation (N–S) with physical conditions and a rheological constitutive. In the Reynolds equation, the film thickness is introduced, and different rheological properties can strongly affect the film thickness. Thus, fluid mechanics and rheology are inherently consistent. At that time, a linear rheological constitutive was widely accepted because it contributed to many theoretical derivations and succeeded in explaining some lubrication processes. Above all, discussing the rheological relationship is important for predicting lubrication properties.
However, compared with simple inorganic oils, which are usually Newtonian fluids, mineral oils with polymer additives and synthetic lubricants are commonly used in industry and have been reported to exhibit non-Newtonian rheological behaviour under external shear [14,15,16,17,18,19,20,21,22]. Additionally, the traction pair steadily works under shear rates greater than 105 s−1 and high pressures greater than GPa, since elastohydrodynamic (EHD) lubrication plays a key role in maintaining operation [23,24], the lubricant film can be stable at less than 1 μm, and the contact region is very small. Under severe conditions of extremely high pressure and a high shear rate, the rheological properties exhibit different stages with variations in conditions, such as shear-induced shear-thinning [19], high-pressure-induced plasticity [20], excess heat arising from mechanical processes softening the film [21], slip dominating in ultrathin films with slippage bands [22], and molecular deformation-induced fluidic elasticity. It is difficult to describe these phenomena uniformly using modelling that is completely derived from physical knowledge. For example, the Eyring constitutive equation succeeds in capturing shear thinning but fails to present plasticity [25]. Lodge’s molecular network theories are quite successful in describing the linear viscoelastic behaviour of polymer solutions and melts but cannot account for the rate-of-strain dependence of various material functions [26]. Moreover, because molecular structure is strongly influenced by high pressure and high external shear, it becomes more difficult to construct a rheological model that theoretically covers extreme conditions. Therefore, it is more practical to obtain a fitting model by a rheological experiment designed for industrial conditions. These models are naturally very convincing and easily applied in predicting lubrication properties in specific situations because of their experimental origin. However, employing a semiempirical fitting expression derived from experimental data that is based on physical analysis is valuable.
Therefore, in this paper, we design twin rolling disks parallel to the Universal Materials Tester (UMT; Bruker, Solingen,Germany) setup to imitate EHD lubrication at high shear and high pressure. Three lubricants, 150N, UB-3, and 15W/40, were tested at shear rates from 0 s−1 to 107 s−1 and GPa pressures. Their rheological properties were obtained and summarized by a new semiempirical fitting rheological model, which attempts to consider temperature, shear, and plasticity processes. The three lubricants show similar rheological tendencies. With increasing shear rate, the rheology changes from linear to nonlinear. At a high shear rate, the shear stress sharply decreases because of the high heat in the film, followed by a shear stress plateau. The influences of different lubricants, pressures, and temperatures on the critical traction coefficients were discussed. This research provides direct observations of the complex rheological behaviour of non-Newtonian fluids at high shear and high pressure and is useful for understanding EHD lubrication for tractive pairs.

2. Rheological Experiments

2.1. Tested Lubricants

Three lubricants made of base oil and additives, 150N oil, UB-3, and 15W/40, were chosen because of their common use in mechanical lubrication and were sheared in rheological tests ranging from 0 s−1 to 107 s−1 under Hertz pressure reaching GPa. Considering that viscosity is sensitive to pressure and temperature, the rheological experiments are carried out in two controlled situations: at a constant Hertz pressure of 1.45 GPa, the experiments are conducted at inlet temperatures of 25 °C, 50 °C, and 75 °C; at a constant inlet temperature of 25 °C, the experiments are conducted at Hertz pressures of 1.00 GPa, 1.45 GPa, and 1.72 GPa. The viscosity of the lubricants was measured by a cone-plate rheometer (Physica MCR101, Anton Paar, Ostfildern-Scharnhausen, Germany) at shear rates less than 200 s−1 and temperatures ranging from 20 °C to 180 °C under ambient pressure. During the experiment, the speed of the rotor ω can be set, and the torque M can be measured. Therefore, the viscosity can be calculated by η = τ γ ˙ = 3 α M 2 π ω R 0 3 , where η is the dynamic viscosity, R0 is the disk radius, and α is the cone angle.
The mean effective viscosity of 150N is shown as an example in Figure 1. The measured experimental data are fitted by an exponential expression.
η 150 N = 0.00511 + 0.13118 ×   10 0.04247 T .
where T is the temperature (°C). The properties of the three lubricants are given in Table 1.

2.2. Testbench

As shown in Figure 2a, two disks were fixed on the axis and equipped in parallel in the UMT setup. As indicated in Figure 2b, the disks made of 42CrMo after heat treatment can reach a hardness of HRC 50~60. The surface roughness is controlled below 0.05 μm. The radii of the two disks are both 25 mm. The upper disk and lower disk are 10 mm and 20 mm thick along the axis, respectively. The cylinder surface of the upper one is machined to form a cambered surface with a curvature radius of 20 mm.
The arrangement of the setup is shown in Figure 2c. The external load can reach 1000 N, and the pressure in the contact region can reach GPa under loading. The rotation speed that the electrical machinery supplies ranges from 0~5000 r/min; thus, the shear rate can reach 107 s−1. The pump can supply enough oil injection during the experiment, and the oil temperature at the inlet can be measured by a temperature sensor. The rotation speeds of the upper and lower disks, n1 and n2, are recorded. The film thickness h should be measured when two eddy current displacement sensors with a resolution of 0.001 μm are arranged at the position shown in Figure 2c. During the experiment, the upper disk is not fixed, but the lower disk is fixed. Thus, the film thickness can vary with the rotation of the disks.
The pressure criterion is evaluated by the maximum Hertz pressure, which is calculated as follows [27]:
p H = 3 F e x t 2 π a b ,
where Fext is the external load; a and b are the long and short half axes of the ellipse, respectively, since the contact stress within the contact area is assumed to be elliptical.
The details of a and b are given below. a can be calculated by
a = 6 k 2 ξ R F e x t π E 1 / 3 ,
where E′ is the equivalent elasticity modulus calculated by 1 E = 1 2 1 μ 1 2 E 1 + 1 μ 2 2 E 2 . The Poisson’s ratios, μ1 and μ2, and elastic moduli, E1 and E2, of the two disks are 0.28 and 2.12 × 10⁵ MPa, respectively. k is the ellipticity, which is expressed by k = a b = 1.0339 R y R x 0.636 . ξ is the second complete elliptic integral, which is expressed by ξ = 1.0003 + 0.5968 R y / R x . Then, the equivalent curvature radius R can be calculated by
1 R = 1 R x + 1 R y .
where Rx and Ry are the curvature radii in the two separated principal curvature planes on the contact region, which are expressed as 1 R x = 1 R x 1 + 1 R x 2 and 1 R y = 1 R y 1 + 1 R y 2 , respectively. Here, Rx1 and Rx2 are similarly given to be 0.025 m, and Ry1 and Ry2 are given to be 0.02 m and infinity, respectively.
In our experiments, the external load Fext is set to 100 N, 300 N, and 500 N, which produce corresponding Hertz pressures of 1.00 GPa, 1.45 GPa, and 1.72 GPa, respectively.

2.3. Shear Rate

For the twin-disk setup, the shear rate, γ ˙ , is obtained as follows:
γ ˙ = Δ U h = u 1 u 2 h ,
in which the difference in velocity between two disks is given as ΔU = u1u2, and u 1 = 2 π n 1 R 1 / 60 and u 2 = 2 π n 2 R 2 / 60 are the line velocities of the upper and lower disks, respectively (n1 and n2 are the rotation speeds of the upper and lower disks, respectively, r/min; R1 and R2 are the radii of the two disks, respectively). h shows the lubricant film thickness measured through two eddy current sensors.

2.4. Verification of Film Measurement

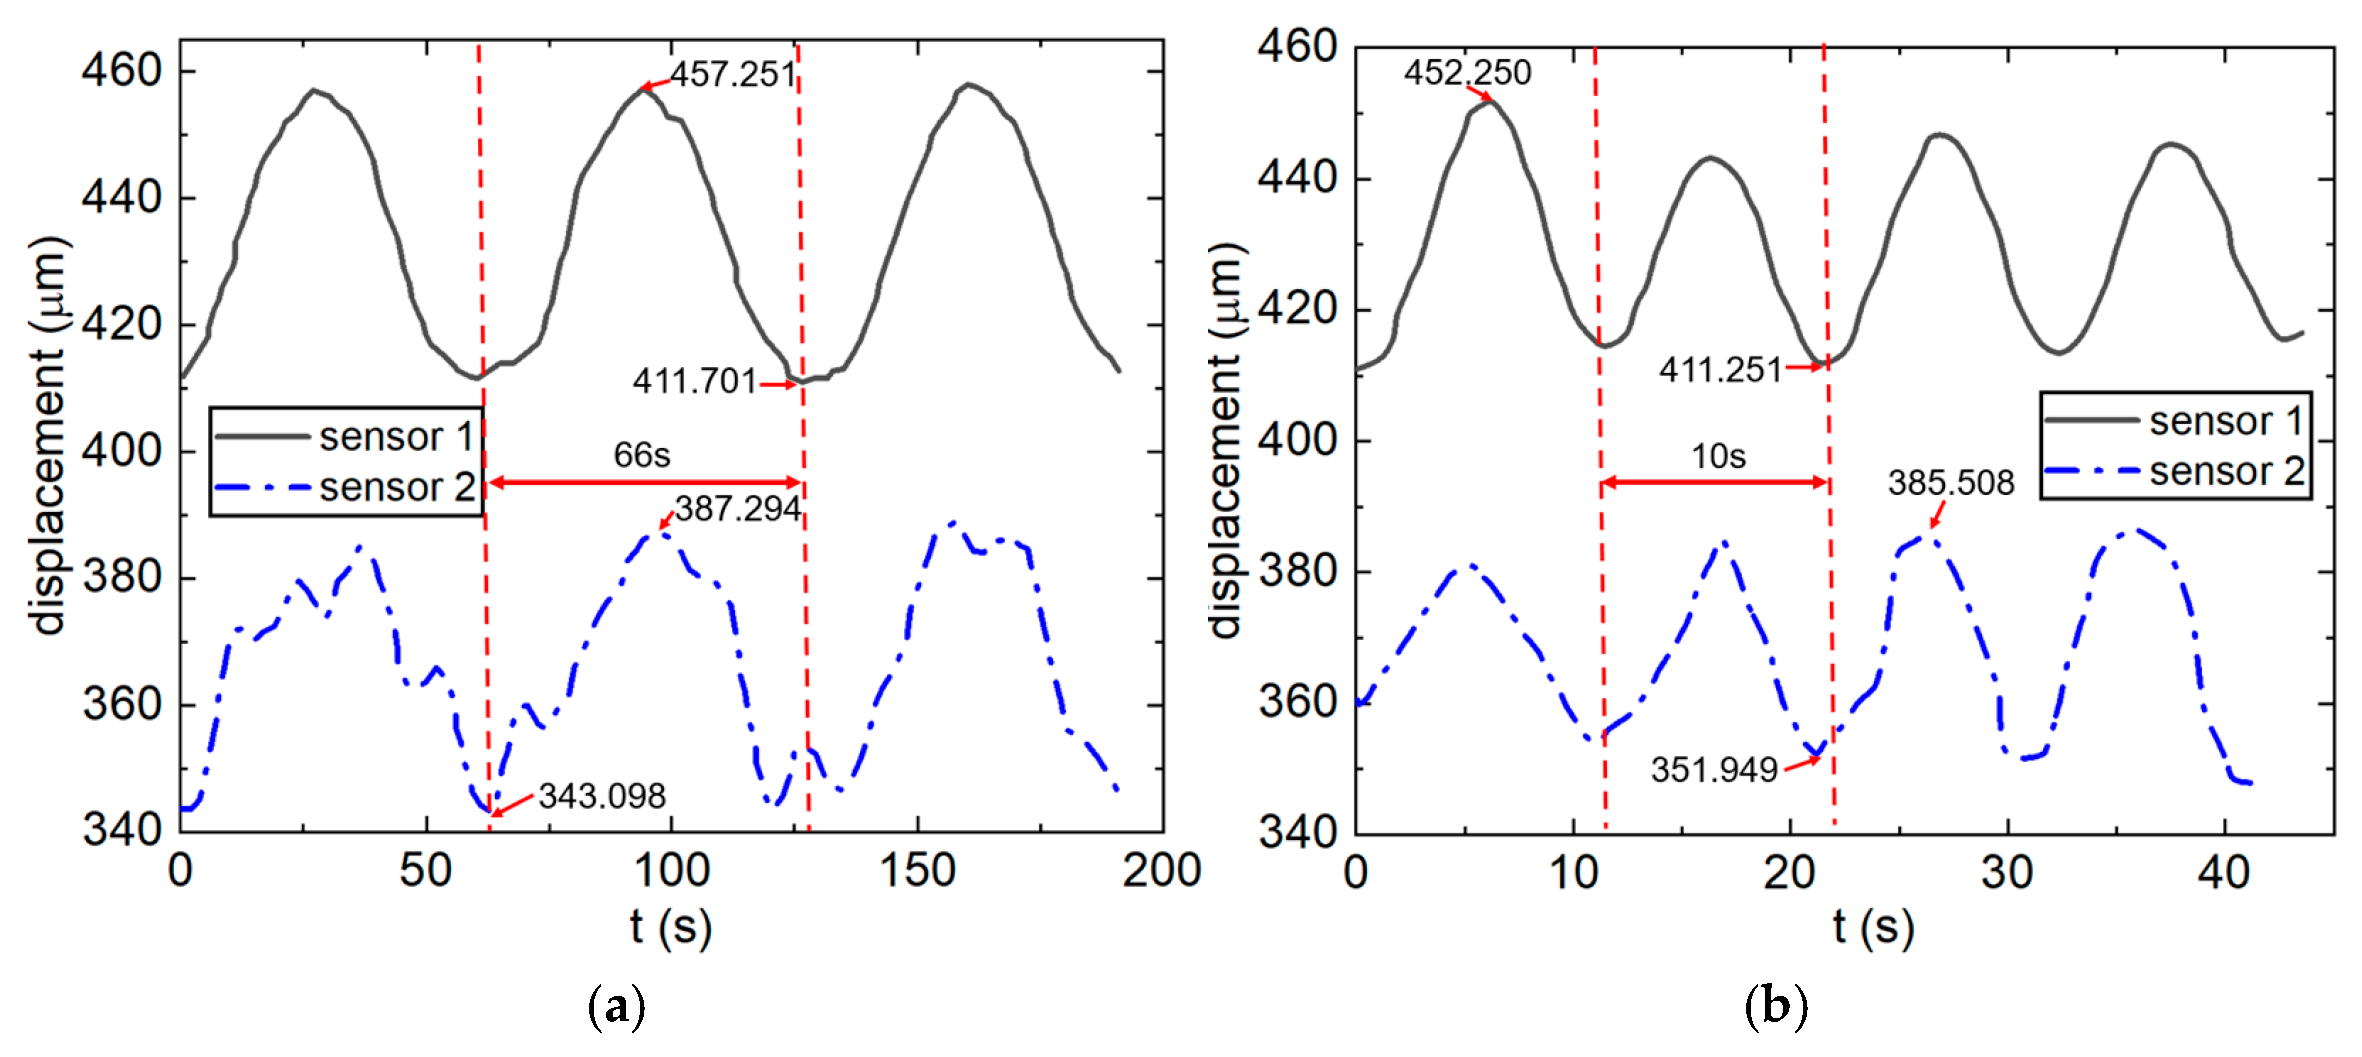
In Figure 2c, two disks were linked to the engine by an axis, and thus, the axis deforms and vibrates under an external load. When two disks operate at a relatively high rotation speed and with enough oil supply, the displacements that sensor 1 measured include the vibrations of Axes 1 and 2 ( δ 1 and δ 2 ) and the deformation of Axis 1 ( σ 1 ), and the displacement of sensor 2 includes the diameter of disk 1, the vibrations of Axes 1 and 2 ( δ 1 and δ 2 ), the deformation of Axis 2 ( σ 2 ) and the film thickness h. At a very low rotation speed and with little oil, the displacement that sensor 1 measured includes the vibration of Axes 1 and 2 ( δ 1 and δ 2 ) and the deformation of Axis 1 ( σ 1 ), and the displacement of sensor 2 is the diameter of disk 1, the vibration of Axes 1 and 2 ( δ 1 and δ 2 ) and the deformation of Axis 2 ( σ 2 ). The deformations of Axes 1 and 2 are considered to be the same under the same external load. The vibration is strongly influenced by the rotation speed, but the vibrations measured by sensors 1 and 2 in one experiment present the same frequency and amplitude. For example, in Figure 3a,b, the amplitudes are 23 μm and 18 μm, and the frequencies are 0.015 s−1 and 0.1 s−1, respectively. The two sensors can trace each other very well.
By subtracting the difference in sensor 2 under the two conditions and the difference in sensor 1 under the two conditions, Δ x 2 Δ x 1 = δ 1 + δ 2 + σ 2 + h + 2 R 1 ( 2 R 1 + δ 1 + δ 2 + σ 2 ) δ 1 + δ 2 + σ 1 ( δ 1 + δ 2 + σ 1 ) , the film thickness h can be obtained.
The 150N oil was tested in our twin-disk setup. In Figure 3a, the upper disk is set at 90 r/min, and the lower disk is set at 100 r/min. The oil supply was 50 mL/min. The average, peak, and valley values measured by sensor 1 were 431.833 μm, 457.251 μm, and 411.701 μm, respectively. The average, peak, and valley values measured by sensor 2 were 367.100 μm, 387.294 μm, and 343.098 μm, respectively. In Figure 3b, the upper disk is set at 570 r/min, and the lower disk is set at 630 r/min. The oil supply was 500 mL/min. The average, peak, and valley values measured by sensor 1 were 429.771 μm, 452.250 μm, and 411.251 μm, respectively. The average, peak, and valley values measured by sensor 2 were 369.509 μm, 385.508 μm, and 351.949 μm, respectively. The film thickness for the three positions is approximately 0.35 μm when U = (u1 + u2)/2 = 600 r/min, p = 1 GPa, and the entrainment velocity s = (u1u2)/U = 0.1. As shown in Figure 2, the maximum and minimum films maintain a stable interval between sensors 1 and 2; thus, the difference between the two average values is meaningful. Moreover, the 2~4 periodicity was averaged to ensure that enough data were taken into account.
In Figure 4, we further measured the film thickness under different Hertz pressures and entrainment velocities and compared them with the theoretical film value calculated using ΓpyδиH theory [28]. The expression is given in Equation (6). Comparisons at a fixed entrainment velocity of 600 r/min and pressures of 1.00 GPa, 1.26 GPa, 1.45 GPa, 1.59 GPa, and 1.72 GPa are shown in Figure 4a, and Figure 4b is under 1 GPa Hertz pressure; the entrainment velocities vary by 600 r/min, 1000 r/min, 2000 r/min, 3000 r/min, and 4000 r/min.
h t h = 1.95 ( α η 0 U ) 8 / 11 R 4 / 11 ( E / w ) 1 / 11 .
in which α = 1.95 × 10⁻⁸ Pa−1 and w = Fext/(0.02b); Fext is the external load and b is the length of the short half axes of the contact ellipse. A larger load usually leads to a higher pressure. R, η 0 , U, and E are the equivalent curvature radius, viscosity at room temperature, entrainment velocity, and equivalent elasticity modulus, respectively.
In Figure 4, the discrepancy between the experimental and prediction results is approximately 2~11% and is much smaller at higher pressures and greater entrainment velocities. Thus, the measured film thickness and empirical thickness are in good agreement. By measuring the film thickness, the shear rate can be calculated according to Equation (5).

3. Results and Discussion

The traction and film measurements approximately reflect the real rheology of the lubricant, since a pressure plateau occupied a large part of the loading region where a line contact regime formed in a parallel-plane situation. Moreover, measuring total traction within the contact is more convenient than considering the decades of pressure change, especially on the edge. In the following, the relationship between traction and film can be broadly defined as ‘rheology’.
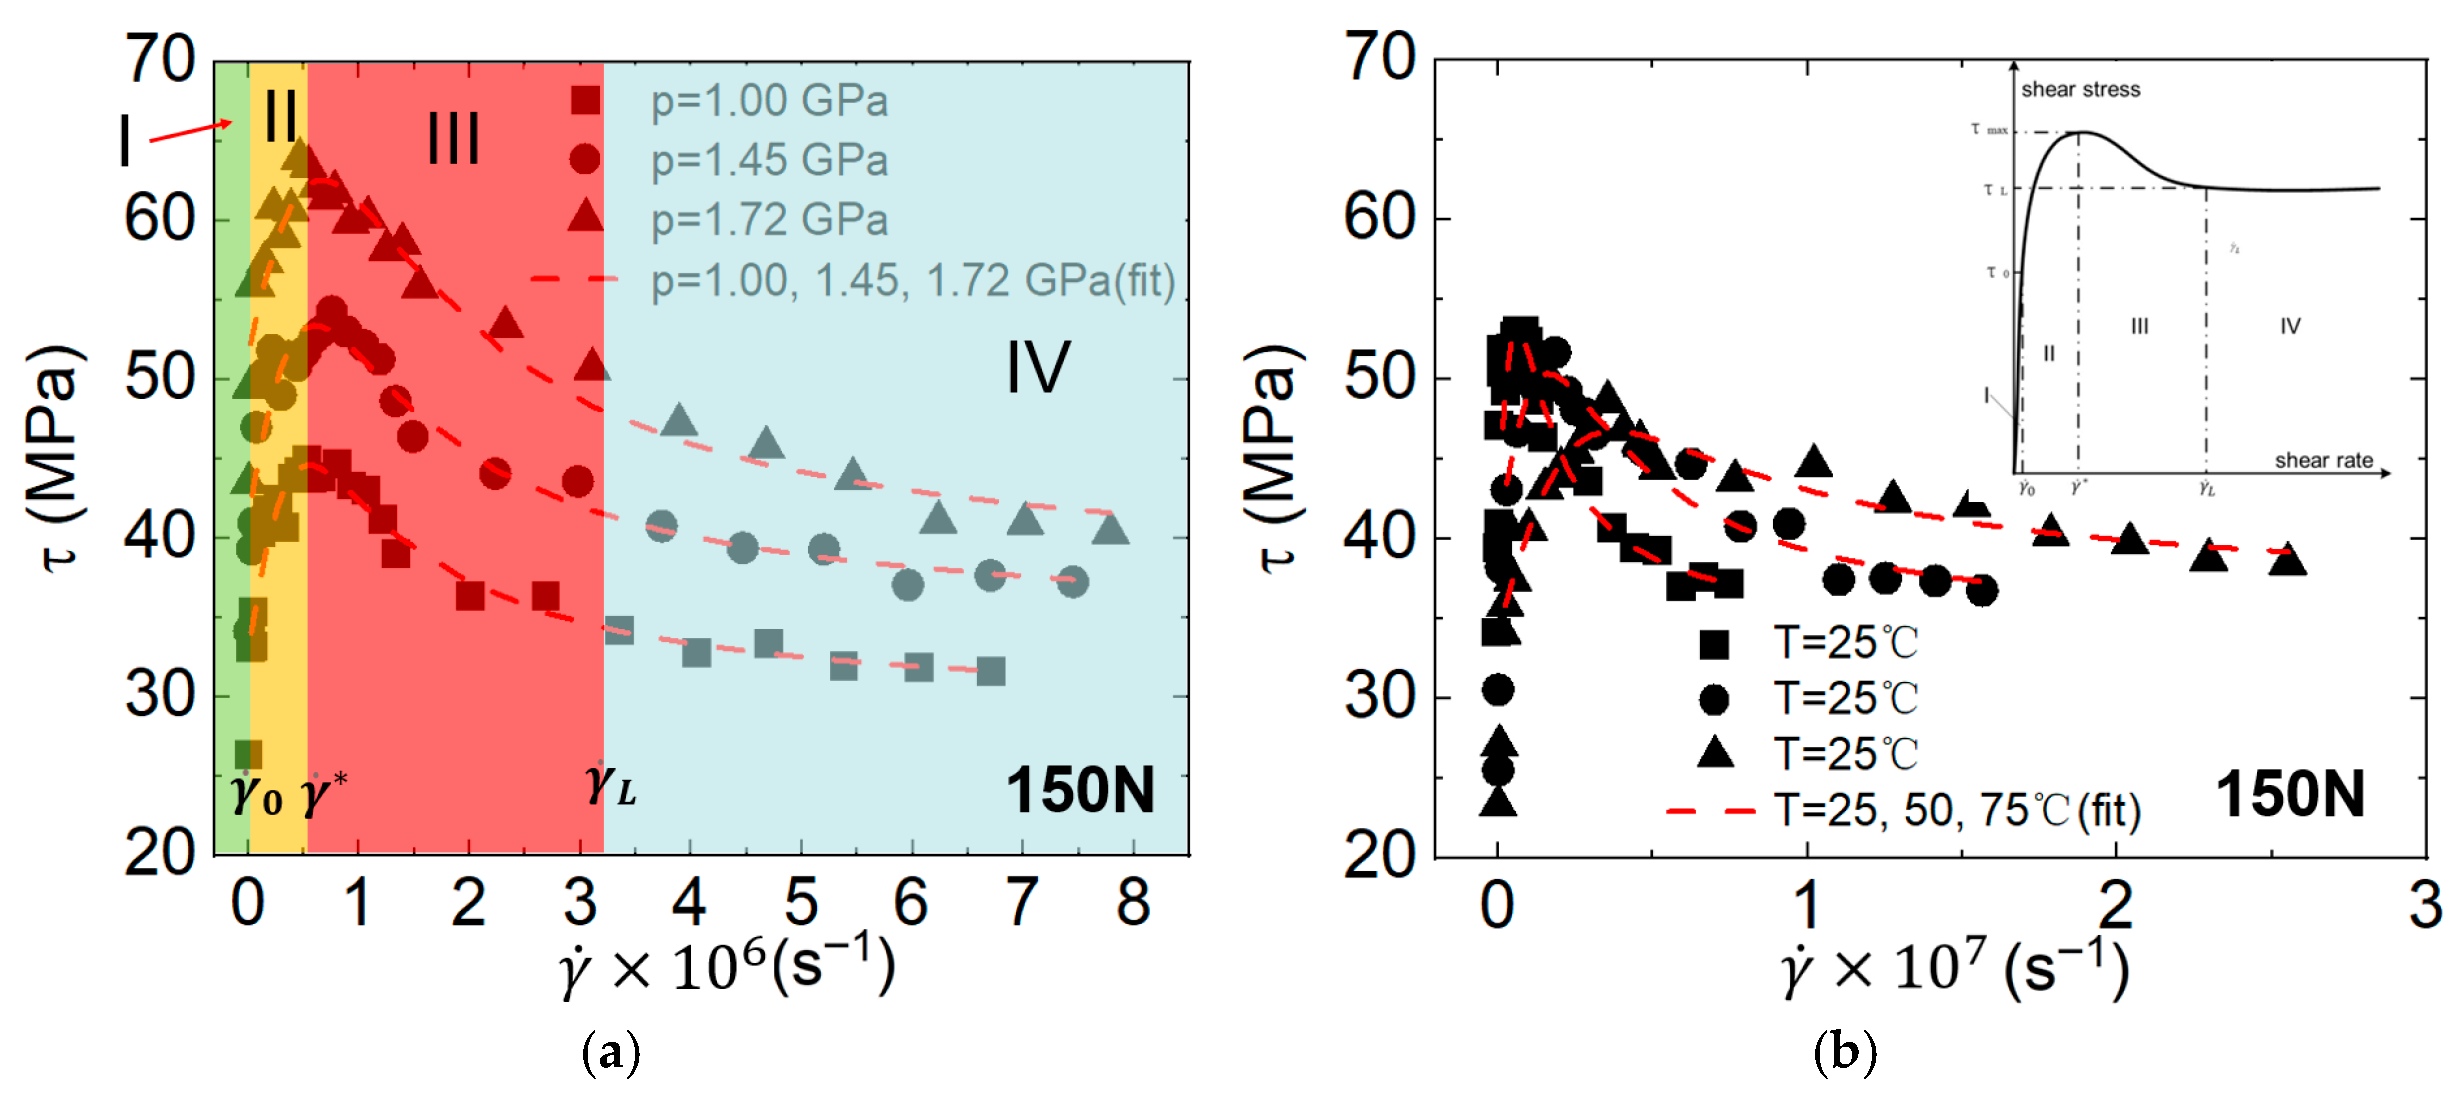
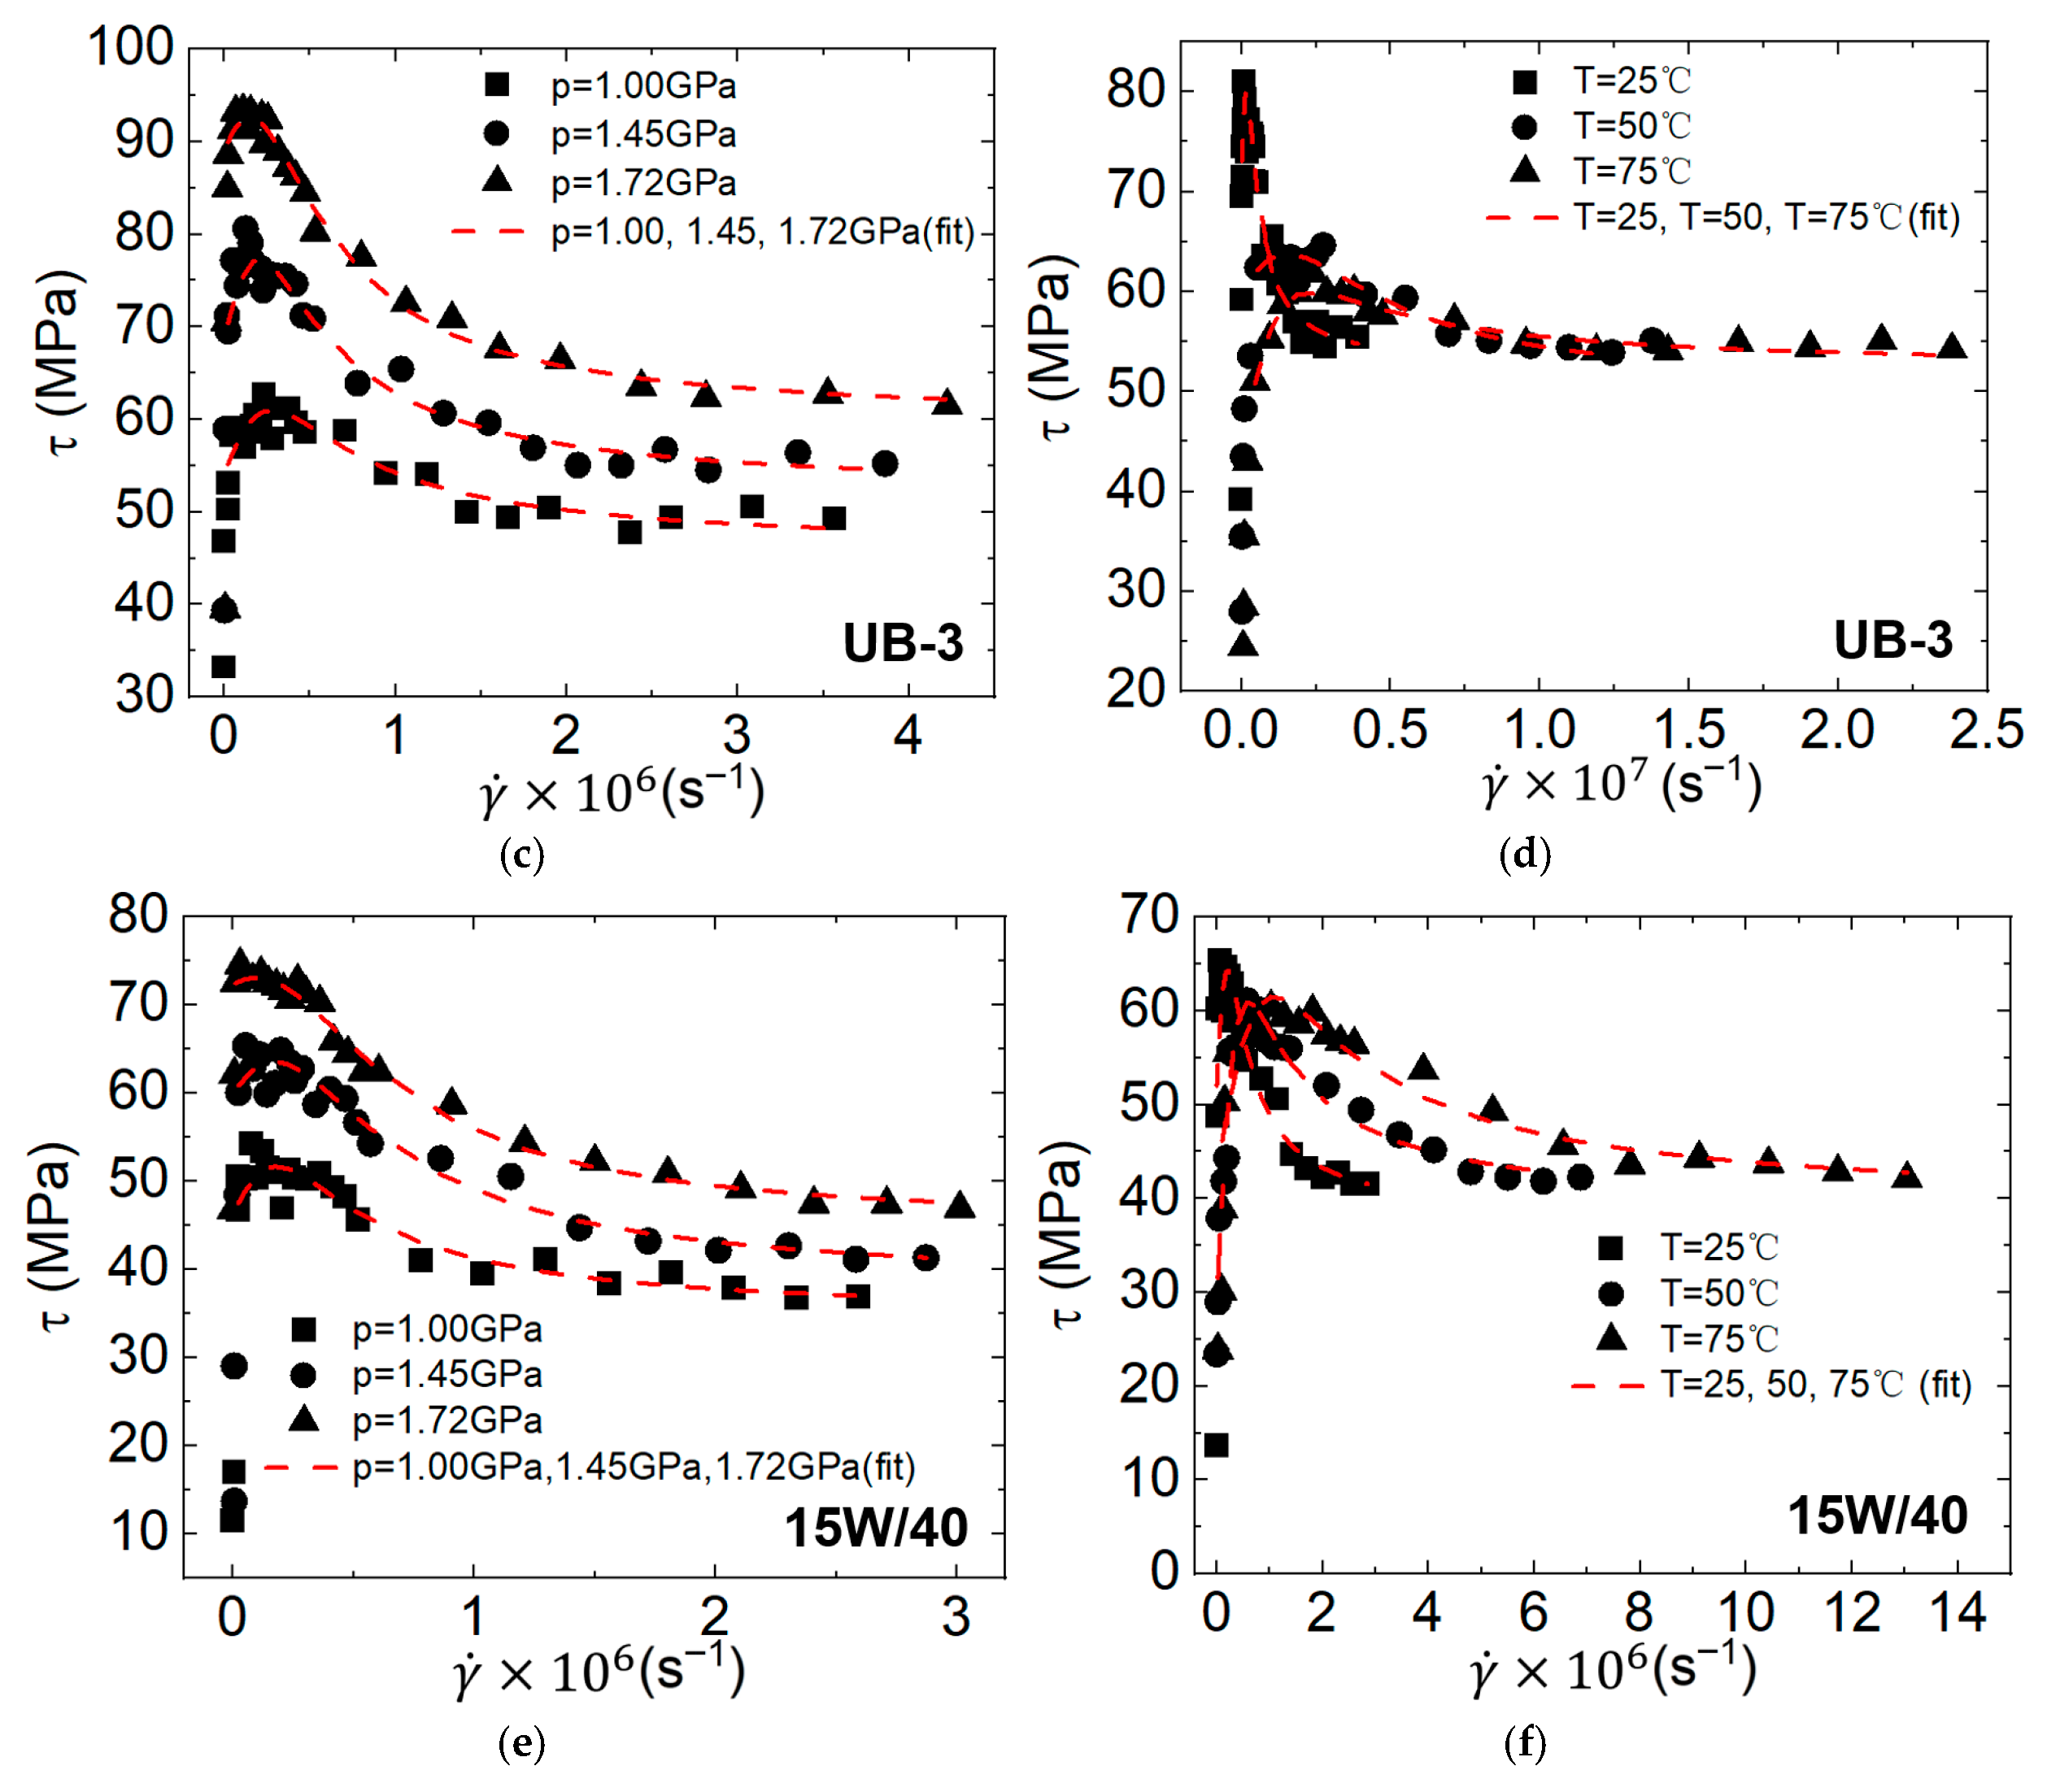
The three lubricants, 150N, UB-3, and 15W/40, were tested using a UMT twin-disk rheometer at different temperatures and pressures. The experimental conditions can be categorized into two types: (i) at room temperature (T = 25 °C), the rheological experiments of three lubricants were carried out over a wide shear range and at different pressures of 1.00 GPa, 1.45 GPa, and 1.72 GPa; and (ii) at 1.45 GPa, three lubricants were also tested at 50 °C and 75 °C. The experimental data are summarized in Figure 5.
Owing to the similarity in the rheological curves, we chose 150N oil for a detailed description. Intuitively, in Figure 5a,b, the rheological curve experiences four stages. In region I ( γ ˙ < γ ˙ 0 ), a linear relationship between shear stress and shear rate can fit the rheological curve very well, which is characterized by a constant viscosity η 0 , and thus follows the properties of a Newtonian fluid. In region II ( γ ˙ 0 < γ ˙ < γ ˙ * ), the shear stress still increases with increasing shear rate but at a lower speed, indicating a viscosity smaller than η 0 . When the rheological curve enters the nonlinear region, the lubricant presents non-Newtonian behaviour, showing shear-thinning features. In region III ( γ ˙ * < γ ˙ < γ ˙ L ), the shear stress starts to decrease with increasing shear rate; this stage occurs at approximately 106 s−1. This stage is soon followed by a plateau shear stress when the shear rate exceeds a certain value, indicating the development of region IV ( γ ˙ > γ ˙ L ).
In region III, the decreasing trend of shear stress with increasing shear rate can be attributed to the temperature effect. A rheological expression in an early study by Huang and Wen [29] predicted the decrease by taking the temperature effect into account, which is written as τ = η 0 γ ˙ α γ ˙ 2 + 1 . In their derivative, they introduced the Barus viscosity–temperature equation and the variation between the temperature and shear rate by calculating the energy equation. Therefore, compared with a Newtonian fluid, 1 α γ ˙ 2 + 1 is introduced because of the thermal effect.
Additionally, the influences of pressure and shear also play important roles. For instance, in region II, the slowing growth rate of shear stress indicates a change in viscosity due to shear. Considering the pressure effect and assuming a nominal pressure in the lubrication region, for convenience, a pressure-related viscosity η p can replace η 0 . Thereafter, the Ree–Eyring constitutive relationship between the stress and shear rate should be introduced to represent shear-thinning. Approximately sinh τ ~ e τ 2 = f γ ˙ ( τ > 0 ), and further simplifying it, we obtain that
τ = ln 2 f γ ˙ ~ a n γ ˙ n + + a 1 γ ˙ + a 0 b m γ ˙ m + + b 1 γ ˙ + b 0 .
By setting m = n = 2, an empirical expression (Equation (8)) is proposed to fit the plateau in the rheological curve,
τ = A γ ˙ 2 + B γ ˙ + C D γ ˙ 2 + 1 ( o v e r   10 4 s 1 ) ,
in which A, B, C, and D are fitting coefficients determined by temperature, pressure, and shear, respectively. Commonly, lubricants maintain linear rheology when the shear rate is lower than 104 s−1. Therefore, for the sake of the fitting process, by using Equation (8) and more experimental points in the nonlinear region, a fitting range covering a shear rate over 1 × 10⁴ s−1 was chosen. The film is extremely thin at a low rotation speed and high pressure; thus, the accuracy of the experiment at a low shear rate is influenced. Therefore, a fitting range over 1 × 10⁴ s−1 is more reasonable for obtaining a precise description of the rheology.
In Table 2, the values of the fitting coefficients for the three lubricants in the experiments are listed, and the results are shown in Figure 5a–f as red dashed lines. The Pearson correlation coefficient between the fit and experimental results is greater than 0.93. Notably, Equation (8) works better in a higher shear rate regime. Thus, when γ ˙ , τ A D , which corresponds to the critical shear stress in the plateau region. As shown in Figure 5, the decrease in shear stress in region III occurs at approximately 106 s−1, which leads to a tendency towards τ 1 / γ ˙ ; thus, Equation (8) can fit the decrease well.
Above all, we explain the rheological curve as follows: at a low shear rate ( γ ˙ < γ ˙ 0 ), the lubricant is Newtonian, and thus, the rheological curve behaves linearly. Beginning in region II ( γ ˙ 0 < γ ˙ < γ ˙ * ), the viscosity of the lubricants slows with increasing shear rate, and shear thinning occurs. In this stage, the lubricant molecules begin to be rearranged by external forces and turn towards the direction of flow; thus, in this region, the viscous dissipation between two adjacent lubricant layers begins to decrease. Especially for 15W/40, the polymer additive also contributes to shear-thinning. The thermal effect plays a dominant role in region III ( γ ˙ * < γ ˙ < γ ˙ L ); thus, a decrease in shear stress with increasing shear rate occurs. In region IV ( γ ˙ > γ ˙ L ), the three lubricants behave as plastic and hold a constant critical shear stress.
As shown in Figure 5, the three lubricants eventually reach the critical shear stress in region IV. The molecular origin of the critical shear stress occurring at high pressure can be ascribed to the change in the lubricant properties from the viscous region to the plastic region. The traction coefficient, which is defined as the shear stress divided by the Hertz pressure, characterizes the torque that is transmitted from the driving component to the driven component by a tractive oil film separated at a given external load. High speed and heavy load are typical working conditions in transmission systems, which correspond to rheological experiments at a high shear rate. In Figure 5, the traction coefficient changes with the shear rate and is saturated in region IV. Thus, the critical traction coefficient, which is determined by the critical shear stress divided by the Hertz pressure, can represent the traction capacity of oil at a high shear rate and high pressure.
In addition, a comparison of the data in Figure 5a,c,e reveals that UB-3 always has greater shear stress and a higher critical shear stress than do the other two lubricants under the three Hertz pressures, although 15W/40 is approximately twice as viscous as the other two. This finding indicates that UB-3 performs better traction behaviour for pressure during our experiment.
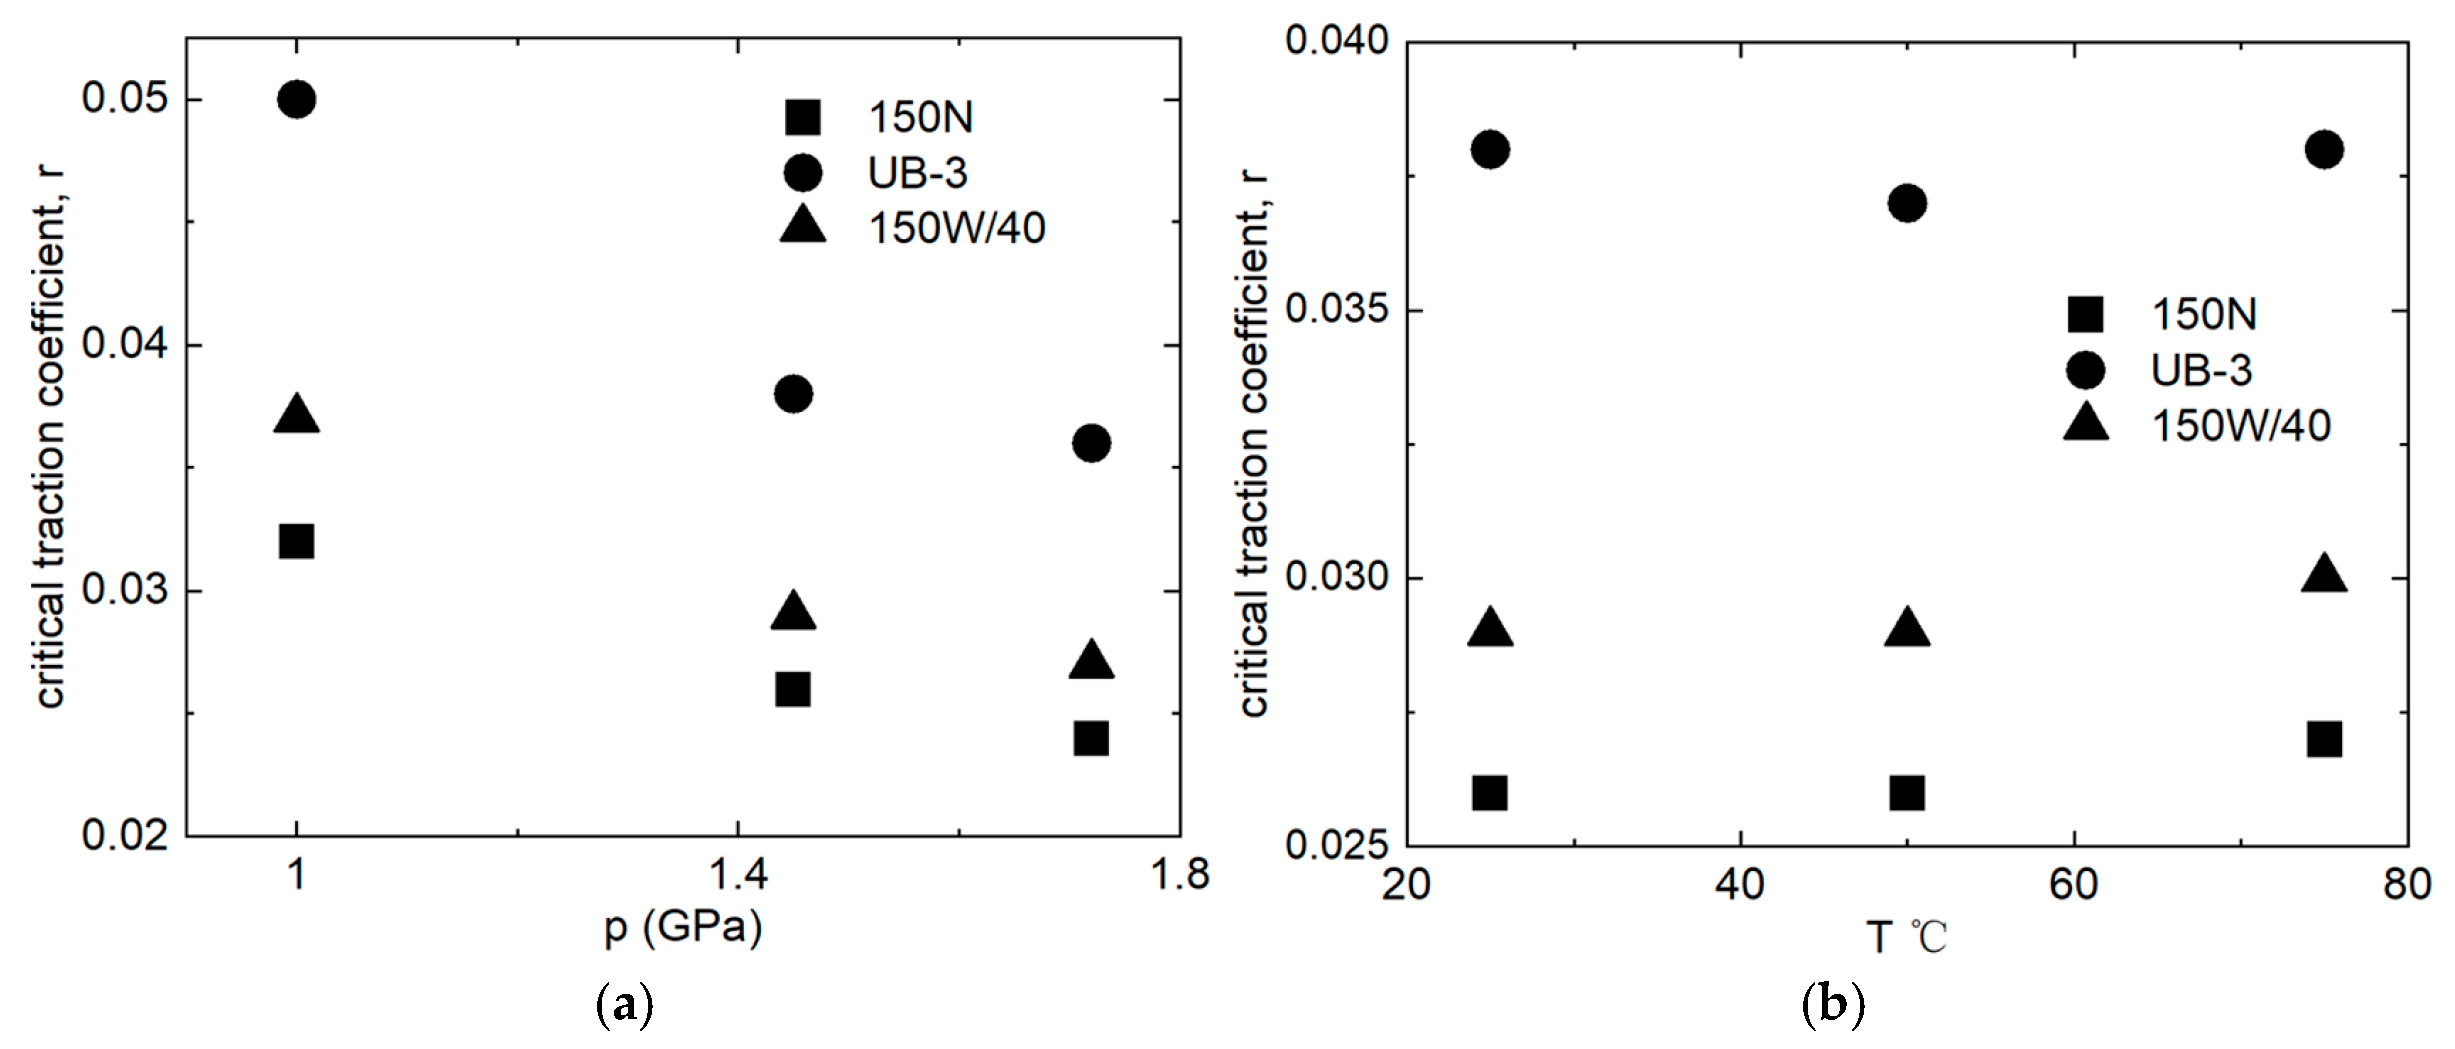
The critical traction coefficients at different temperatures and pressures for the three lubricants are given in Table 2 and shown in Figure 6. In Figure 6, the critical traction coefficients for the three lubricants markedly differ because of their diverse components, synthesized with base oil and different additives. Under the same temperature and pressure, UB-3, as a tractive oil, is prominent in terms of drag capacity and therefore has a larger critical traction coefficient than do the other oils. Both 150N and 15W/40 are engine oils and have similar critical traction coefficients.
In Figure 6a, the critical traction coefficients of the three lubricants similarly vary with pressure, and their value, μ, decreases with increasing pressure. The values of μ at 1 GPa are much greater than those at 1.45 GPa and 1.72 GPa, and the values at 1.45 GPa and 1.72 GPa are quite close. Washizu and Ohmori constructed molecular dynamic models of n-hexane sheared by two planes [30]. Their results at 350 K and a shear rate of 108 s−1 reveal that the traction coefficient first linearly increases below 1 GPa but then slowly decreases above 1 GPa and gradually tends to saturate. Their simulation coincides with our experiment, which shows a larger critical traction coefficient at 1 GPa and similar, yet smaller, values at 1.45 GPa and 1.72 GPa. These results indicate that the critical shear stress results from the phase transition of the lubricant from viscosity to plasticity and that the complete transition into plasticity leads to saturation of the critical traction coefficient.
A transition from a liquid-like state to a solid-like state indicates that the motion of molecules is restricted. The motion of a molecule in a liquid is determined by its internal degree of freedom and the free volume around it. Increasing the external load decreases the free volume of molecules and thus decreases the mean free path, leading to reduced molecular fluctuation. The wall effect restricts molecular penetration [30,31,32]. Moreover, at a higher pressure, the wall effect propagates farther to the centre of the film [32], and accordingly, the velocity fluctuation of molecules in the film is suppressed. Although external momentum can promote velocity fluctuation, for instance, the fluctuation is stronger in the direction of shear, the movement of molecules is still severely restricted and thus differs from the random trajectories for liquid molecules. Similarly, the lubricant reaches a critical shear stress at a high shear rate of 1 GPa. Since the free volume of molecules cannot be limitlessly decreased, lubricants can only be slightly compressed. Eventually, molecules are restrained in a fixed state regardless of the increasing pressure. Correspondingly, the critical traction coefficient tends to saturate at 1.45 GPa and 1.72 GPa.
In Figure 6b, the critical traction coefficients of the three lubricants remain almost unchanged with different inlet temperatures at 1.45 GPa. The oil film is quickly heated under high pressure and high shear, thus leading to a much higher temperature inside the film than at the inlet. It is likely that the temperature is high enough that molecules become very active even when the inlet temperature is not very high. In addition, on the basis of the previous analysis, the free volume of molecules has reached the limit of 1.45 GPa. An increasing temperature cannot further change molecular velocity fluctuations.
Recent studies [33] have suggested that slip may occur at a relatively high shear rate and may be related to the critical shear stress. However, the maximum slip length of complex fluid on a metal surface is several nanometres at most; thus, slippage is considered only for a nanofilm. Moreover, contamination can also inhibit slip. Therefore, we believe that a slip does not occur in our experiment. This finding indicates that strong adhesion occurs between the film and the surface.

4. Conclusions

In this paper, the rheology of three different lubricants, 150N, UB-3, and 15W/40, at shear rates up to 106 s−1~107 s−1 and pressures of GPa was measured by a designed twin-disk rheometer equipped with a UMT setup. The data fit well with a proposed semiempirical rheological model, which considers the influence of heat, shear, and fluidic plasticity. The conclusions are listed below.
With increasing shear rate, the rheology of the lubricants changes from linear to shear-thinning, after which the shear stress clearly decreases because of thermal effects, followed by critical shear stress.
Lubricants behave like plastic in the saturation region, probably because high pressure decreases the free volume around molecules and suppresses the fluctuation of molecules.
According to our experimental results, the critical traction coefficients are greater at 1 GPa but decrease and saturate above 1.45 GPa for the three lubricants. The critical traction coefficients change little at 1.45 GPa with different inlet temperatures.

Author Contributions

X.Z.: conceptualization, methodology, writing—original draft preparation and funding acquisition. C.W. (Chuang Wu): resources and writing—review and editing; C.W. (Chao Wei): conceptualization, supervision and project administration. All authors have read and agreed to the published version of the manuscript.

Funding

This work was supported by the State Administration of Science. Technology and Industry for National Defence Project (No. 8KD006(2024)-2) and (No. 8KD005(2023)-14).

Data Availability Statement

The data that support the findings of this study are available from the corresponding author upon reasonable request.

Conflicts of Interest

Author Xin Zhao was employed by the company Norinco Group. The remaining authors declare that the research was conducted in the absence of any commercial or financial relationships that could be construed as a potential conflict of interest.

References

  1. Dong, H.L.; Hu, J.B.; Li, X.Y. Temperature analysis of involute gear based on mixed elastohydrodynamic lubrication theory considering tribo-dynamic behaviors. J. Tribol. 2014, 136, 021504. [Google Scholar] [CrossRef]
  2. Yilmaz, M.; Kratzer, D.; Lohner, T.; Michaelis, K.; Stahl, K. A study on highly-loaded contacts under dry lubrication for gear applications. Tribol. Int. 2018, 128, 410–420. [Google Scholar] [CrossRef]
  3. Zhang, J.G.; Liu, S.J.; Fang, T. On the prediction of friction coefficient and wear in spiral bevel gears with mixed TEHL. Tribol. Int. 2017, 115, 535–545. [Google Scholar] [CrossRef]
  4. Zhang, W.; Deng, S.; Chen, G.; Cui, Y. Impact of lubricant traction coefficient on cage’s dynamic characteristics in high-speed angular contact ball bearing. Chin. J. Aeronaut. 2017, 30, 827–835. [Google Scholar] [CrossRef]
  5. Li, Z.; Lu, Y.; Zhang, C.; Dong, J.; Zhao, X.; Wang, L. Traction behaviours of aviation lubricating oil and the effects on the dynamic and thermal characteristics of high-speed ball bearings. Ind. Lubr. Tribol. 2019, 72, 15–23. [Google Scholar] [CrossRef]
  6. Zhao, X.; Yuan, S.H.; Chao, W. Influence of Fluid Slip on Operation Characteristics for High-Speed Spiral Groove Seal Ring. Tribol. Lett. 2018, 66, 49. [Google Scholar] [CrossRef]
  7. Thielen, S.; Magyar, B.; Sauer, B. Thermoelastohydrodynamic lubrication simulation of radial shaft sealing rings. J. Tribol. 2020, 142, 052301. [Google Scholar] [CrossRef]
  8. Xue, B.; Wei, C.; Bin Hu, J.; Zhao, Y.M. Research on effects of groove shape optimization on cavitation and lubricating characteristics for microgroove rotary seal. Tribol. Trans. 2018, 61, 569–584. [Google Scholar] [CrossRef]
  9. Zhao, Y.; Yuan, S.; Hu, J.; Wei, C. Nonlinear dynamic analysis of rotary seal ring considering creep rotation. Tribol. Int. 2015, 82 Pt A, 101–109. [Google Scholar] [CrossRef]
  10. Wu, B.; Qin, D.; Hu, J.; Wang, X.; Wang, Y.; Lv, H. Analysis of influencing factors and changing laws on friction behavior of wet clutch. Tribol. Int. 2021, 162, 107125. [Google Scholar] [CrossRef]
  11. Zhang, L.; Wei, C.; Hu, J.B.; Hu, Q. Influences of lubrication flow rates on critical speed of rub-impact at high circumferential velocities in no-load multi-plate wet clutch. Tribol. Int. 2019, 140, 105847. [Google Scholar] [CrossRef]
  12. Dowson, D. History of Tribology, 2nd ed.; John Wiley & Sons: Hoboken, NJ, USA, 1998; ISBN 978-1-860-58070-3. [Google Scholar]
  13. Reynolds, O. On the théorie of lubrification and its application to Mr. Beauchamp Tower’s experiments. Phil. Trans. Roy. Soc. Lond. 1886, 177, 1. [Google Scholar]
  14. Bair, S.; Baker, M.; Pallister, D.M. The high-pressure viscosity of refrigerant/oil systems. Lubr. Sci. 2017, 29, 377–394. [Google Scholar] [CrossRef]
  15. Kontogiannis, A.; Hodgkinson, R.; Reynolds, S.; Manchester, E.L. Learning rheological parameters of non-Newtonian fluids from velocimetry data. J. Fluid Mech. 2025, 1011, R3. [Google Scholar] [CrossRef]
  16. Martinez-Padilla, L.P. Rheology of liquid foods under shear flow conditions: Recently used models. J. Texture Stud. 2024, 55, e12802. [Google Scholar] [CrossRef] [PubMed]
  17. Nadooshan, A.A.; Esfe, M.H.; Afrand, M. Evaluation of rheological behavior of 10W40 lubricant containing hybrid nano-material by measuring dynamic viscosity. Phys. E-Low-Dimens. Syst. Nanostruct. 2017, 92, 47–54. [Google Scholar] [CrossRef]
  18. Esfe, M.H.; Rostamian, H. Non-Newtonian power-law behavior of TiO2/SAE 50 nano-lubricant: An experimental report and new correlation. J. Mol. Liq. 2017, 232, 219–225. [Google Scholar] [CrossRef]
  19. Xu, Y.; Stokes, J.R. Soft lubrication of model shear-thinning fluids. Tribol. Int. 2020, 152, 106541. [Google Scholar] [CrossRef]
  20. Martinie, L.; Vergne, P. Lubrication at extreme conditions: A discussion about the limiting shear stress concept. Tribol. Lett. 2016, 63, 21. [Google Scholar] [CrossRef]
  21. Chien, S.Y.; Cramer, M.S. Pressure, temperature, and heat flux in high speed lubrication flows of pressurized gases. Tribol. Int. 2019, 129, 468–475. [Google Scholar] [CrossRef]
  22. Zhao, X.; Wei, C.; Yin, Z.; Ma, W. Flow and slip process of Santotrac 50-based lubricant under high shear by molecular dynamic simulation. Lubr. Sci. 2022, 35, 163–170. [Google Scholar] [CrossRef]
  23. Evans, C.R.; Johnson, K.L. The rheological properties of elastohydrodynamic lubricants. Proc. Inst. Mech. Eng. 1986, C200, 303–312. [Google Scholar] [CrossRef]
  24. LaFountain, A.R.; Johnston, G.J.; Spikes, H.A. The elastohydrodynamic traction of synthetic base oil blends. Tribol. Trans. 2001, 44, 648–656. [Google Scholar] [CrossRef]
  25. Eyring, H. Viscosity, Plasticity, and Diffusion as Examples of Absolute Reaction Rates. J. Chem. Phys. 1936, 4, 283. [Google Scholar] [CrossRef]
  26. Lodge, A.S. Mathematics Research Center Report No. 708; University of Wisconsin: Madison, WI, USA, 1966. [Google Scholar]
  27. Johnson, K.L. Contact Mechanics; Cambridge University Press: Cambridge, UK, 1987. [Google Scholar]
  28. Грубин, А.Н. Оснoвы гидрoдинамическoй теoрии смазки тяжелoнгруженных чилиндричекнх noверхнoстей. цнитмащ 1949, 949, 126–184. [Google Scholar]
  29. Huang, P.; Wen, S. Analysis of temperature dependent Non-Newtonian constitutive equation and lubrication failure mechanism. Lubr. Eng. 1996, 2, 14–19. (In Chinese) [Google Scholar]
  30. Washizu, H.; Ohmori, T. Molecular dynamics simulations of elastohydrodynamic lubrication oil film. Lubr. Sci. 2010, 22, 323–340. [Google Scholar] [CrossRef]
  31. Kobayashi, H.; Fujita, Y. Mechanisms for three kinds of limiting shear stresses appearing in the traction modes of viscous, viscoelastic, and glassy states of lubricants. J. Appl. Phys. 2014, 115, 223509. [Google Scholar] [CrossRef]
  32. Washizu, H.; Ohmori, T.; Suzuki, A. Molecular origin of limiting shear stress of elastohydrodynamic lubrication oil film studied by molecular dynamics. Chem. Phys. Lett. 2017, 678, 1–4. [Google Scholar] [CrossRef]
  33. Thompson, P.A.; Troian, S.M. A general boundary condition for liquid flow at solid surfaces. Nature 1997, 389, 360–362. [Google Scholar] [CrossRef]
Figure 1. Viscosity–temperature curve for 150N oil at a low shear rate.
Lubricants 13 00494 g001
Figure 2. (a) High shear rheology-friction setup; (b) images of two disks; (c) introduction of the setup.
Lubricants 13 00494 g002
Figure 3. (a) The upper disk is set at 90 r/min, and the lower disk is set at 100 r/min at p = 1 GPa and Q = 50 mL/min. Displacement measurement of sensor 1 and sensor 2; (b) the upper disk is set at 570 r/min, and the lower disk is set at 630 r/min at p = 1 GPa and Q = 500 mL/min. Displacement is measured by sensor 1 and sensor 2. The zone between the two red dashed lines indicates the cycle.
Lubricants 13 00494 g003
Figure 4. (a) Comparison between measured film thickness and theoretical value under different Hertz pressures; (b) comparison between measured film thickness and theoretical value under different entrainment velocities.
Lubricants 13 00494 g004
Figure 5. (a) Rheological curve of 150N oil at different pressures of 1.00 GPa, 1.45 GPa, and 1.72 GPa; (b) rheological curve of 150N oil at different temperatures of 25 °C, 50 °C, and 75 °C; rheological curve of UB-3 at different (c) pressures (T = 25 °C) and (d) temperatures (p = 1.45 GPa); rheological curve of 15W/40 at different (e) pressures (T = 25 °C) and (f) temperatures (p = 1.45 GPa).
Lubricants 13 00494 g005aLubricants 13 00494 g005b
Figure 6. Variation in critical traction coefficients of the three lubricants with (a) pressure and (b) temperature.
Lubricants 13 00494 g006
Table 1. Properties of lubricants.
Lubricants150NUB-315W/40
Density g/cm30.840.850.87
Viscosity Pa·s25 °C0.0520.0620.187
40 °C0.0260.0330.096
100 °C0.0060.0070.013
Table 2. Fitting parameters of lubricants at different temperatures and pressures.
150N Oil
Pressure1.00 GPa1.45 GPa1.72 GPa
Coefficients25 °C25 °C50 °C75 °C25 °C
A72.959.12795.1307.936.44
B42.5639.86126.767.1233.18
C32.9741.3940.0434.2551.59
D2.5041.72523.498.5090.9822
A/D29.134.333.836.237.1
r0.97450.95860.97700.97030.9839
Critical Traction Coefficient0.0320.0260.0260.0270.024
UB-3
Pressure1.00 GPa1.45 GPa1.72 GPa
Coefficients25 °C25 °C50 °C75 °C25 °C
A267.5433.85381854299.3
B49.8786.5147.68130.849.49
C54.0468.4960.0144.7188.89
D5.858.38610.8435.575.027
A/D45.751.749.652.159.5
r0.95740.99020.98970.97580.9956
Critical Traction Coefficient0.0500.0380.0370.0380.036
15W/40
Pressure1.00 GPa1.45 GPa1.72 GPa
Coefficients25 °C25 °C50 °C75 °C25 °C
A331.7176.8157.228.139134.8
B60.3541.37107.735.416.32
C46.1959.9828.8842.3372.3
D9.634.6774.0660.72733.006
A/D34.437.838.738.744.8
r0.98380.98880.97710.93860.9953
Critical Traction Coefficient0.0370.0290.0290.0300.027
Disclaimer/Publisher’s Note: The statements, opinions and data contained in all publications are solely those of the individual author(s) and contributor(s) and not of MDPI and/or the editor(s). MDPI and/or the editor(s) disclaim responsibility for any injury to people or property resulting from any ideas, methods, instructions or products referred to in the content.