An Experimental Study on the Impact of Roughness Orientation on the Friction Coefficient in EHL Contact

 ,
, 
Abstract
1. Introduction
2. Materials and Methods
2.1. Materials
2.1.1. Test Rig
2.1.2. Lubricant
2.1.3. Specimens
2.2. Methods
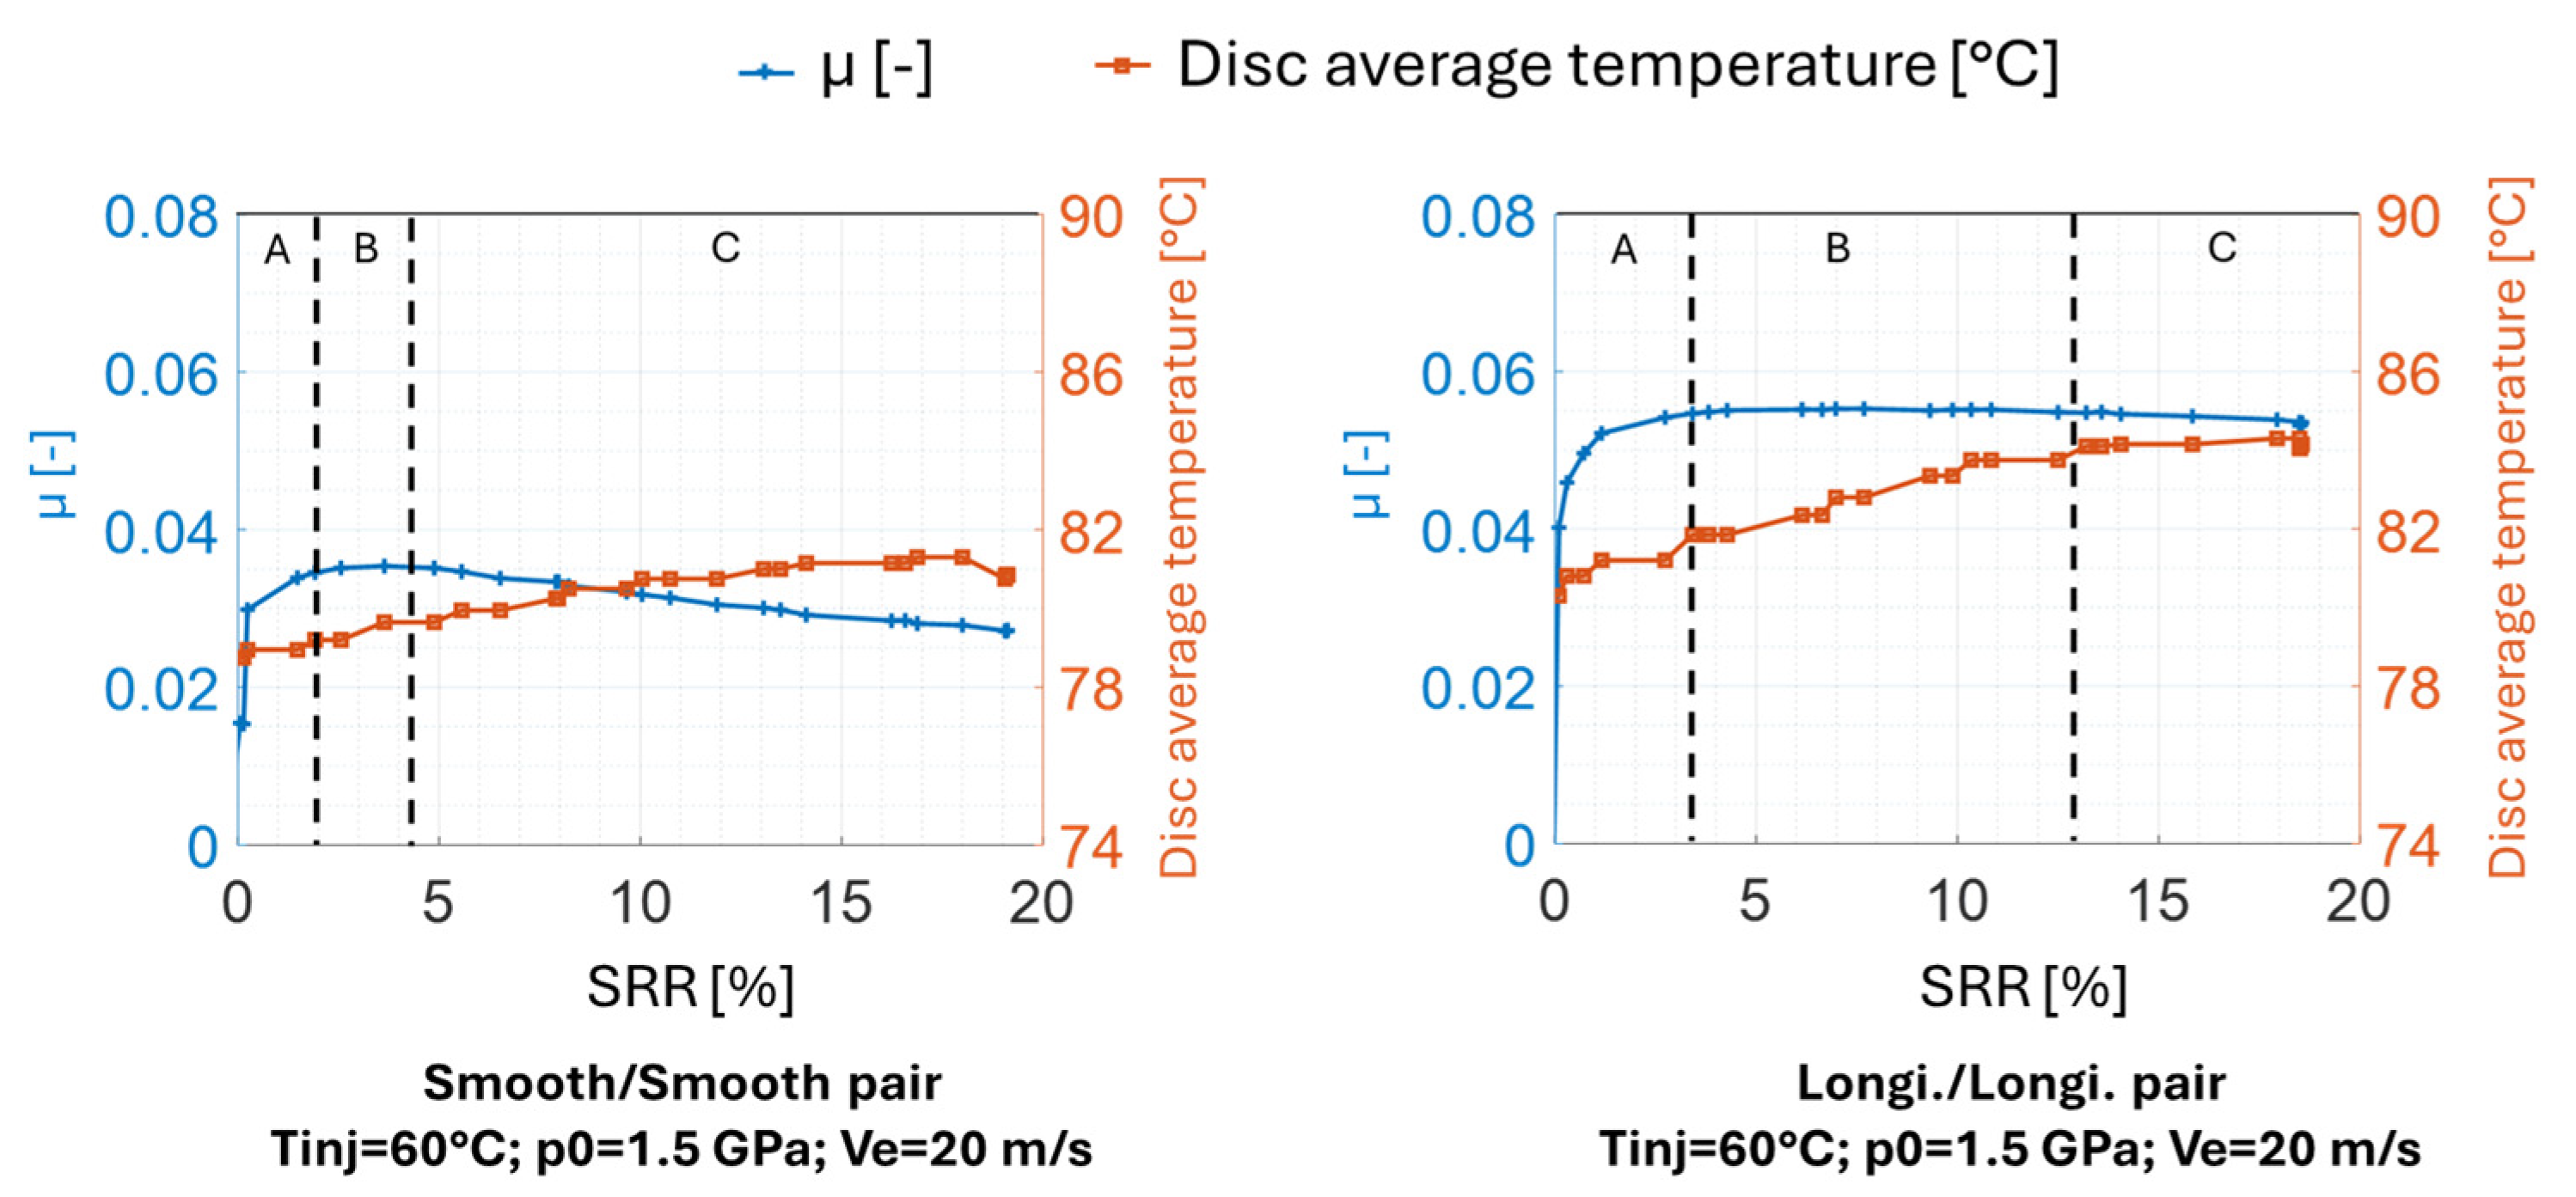
- The linear region (region A from Figure 3). The lubricant behaves as a Newtonian fluid. The slope of the curve is governed by viscosity and piezoviscosity.
- The nonlinear region (region B from Figure 3). The lubricant exhibits non-Newtonian behaviour.
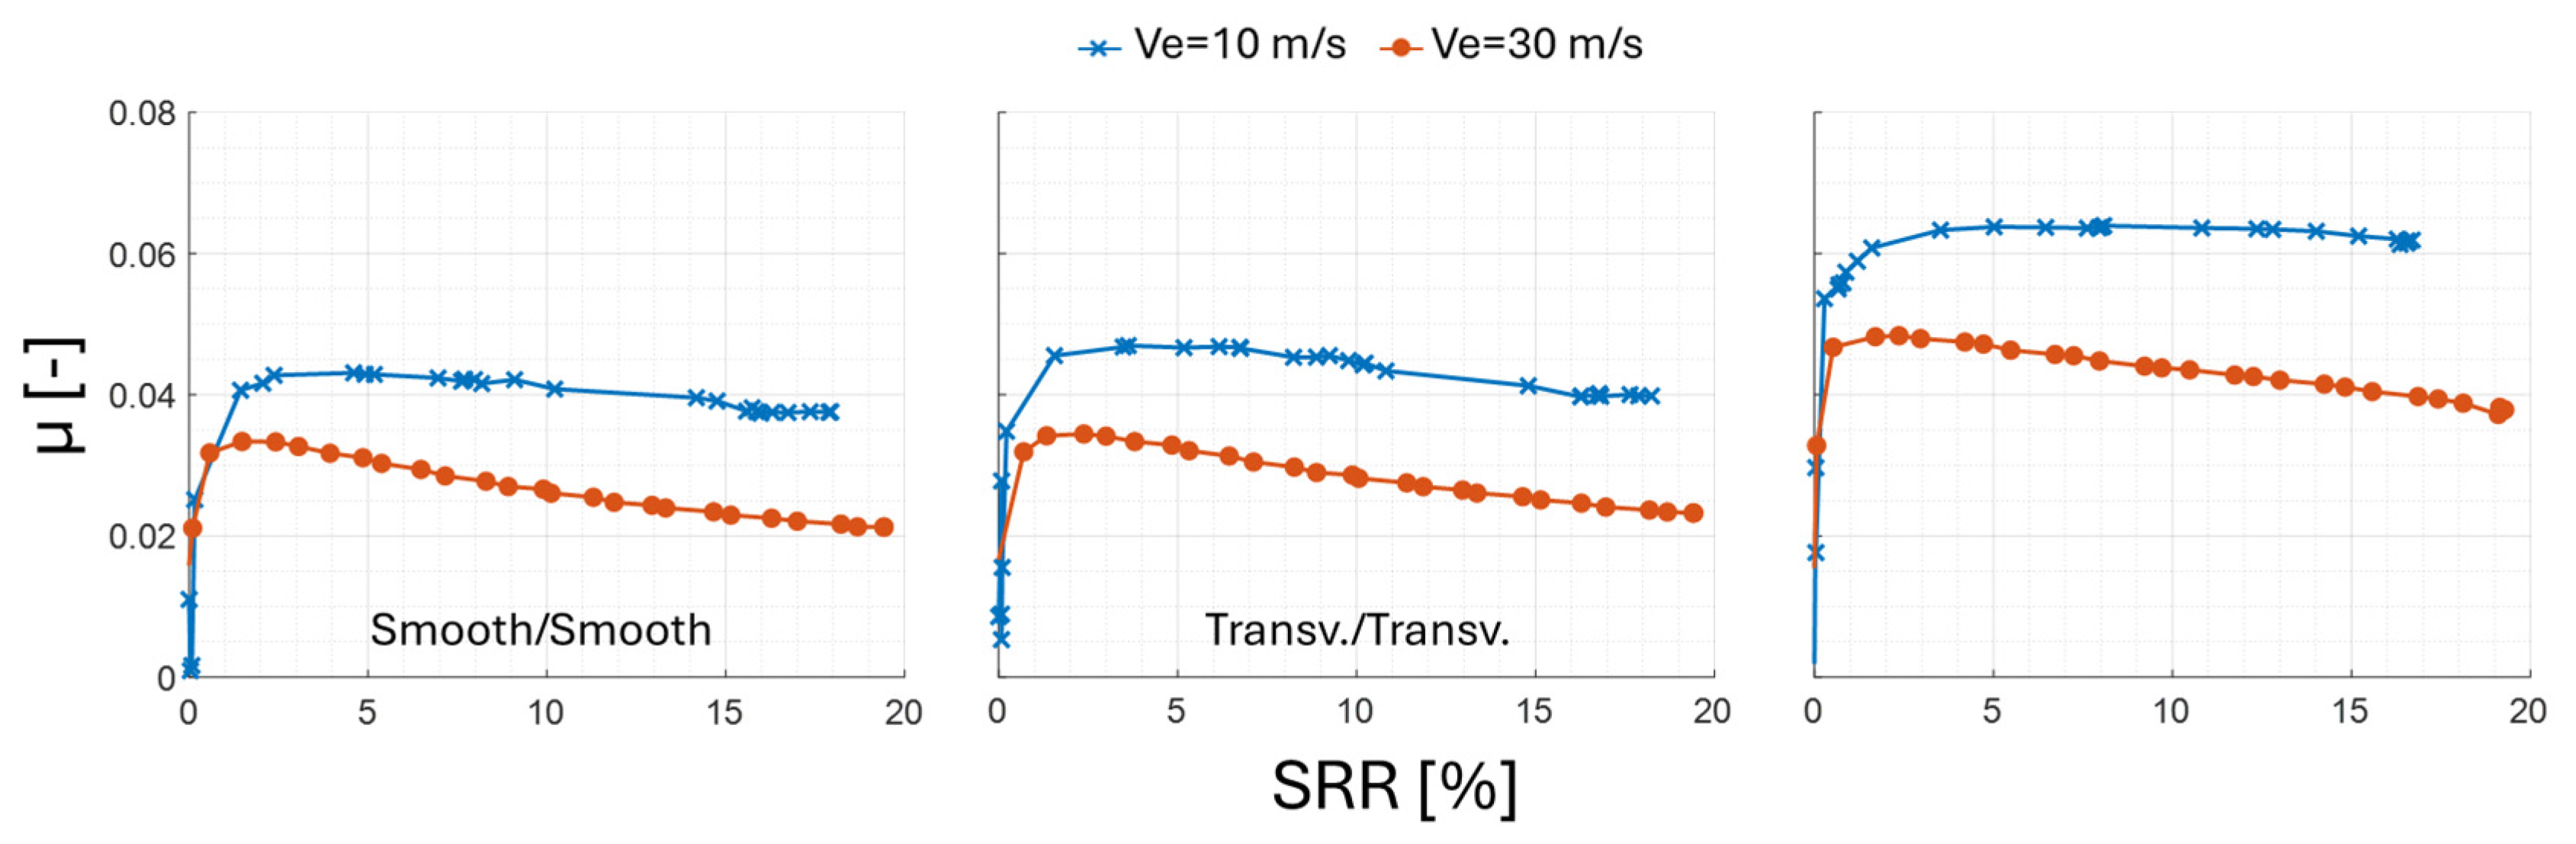
- The thermal region (region C from Figure 3). Increasing the SRR leads to higher power losses. This raises the disc bulk temperature and thus, the temperature of the oil at the contact. The oil film thickness decreases, resulting in a lower fluid shearing. The friction coefficient decreases. In our study, this phenomenon will be defined as the thermal effects. Additionally, it is noted that the higher the mean rolling speed, the greater the thermal effects. The more the fluid governs the friction, the more significant the thermal effects become (as evidenced by the greater decrease in friction observed in region C for the smooth/smooth pair compared to the longitudinal/longitudinal pair).
- Full-film lubrication: The surfaces are fully separated by the oil film. The load is solely supported by the fluid. The friction coefficient does not depend on the surface roughness.
- Mixed lubrication: The load is supported partly by the oil film and partly by surface asperities.
- Boundary lubrication: A significant proportion of the load is supported by the asperities.
- For minimum oil film thickness (configuration 1):
- ▪
- Conditions: oil injection temperature, Tinj = 60 °C; maximal Hertz pressure, p0 = 1.5 GPa; and mean rolling speed, Ve = 5 m/s;
- ▪
- Surface pairs tested: smooth/smooth, transverse/transverse, longitudinal/longitudinal, smooth/transverse, smooth/longitudinal.
- For maximum oil film thickness (configuration 6):
- ▪
- Conditions: Tinj = 60 °C, p0 = 1.2 GPa, Ve = 30 m/s;
- ▪
- Surface pairs tested: smooth/smooth, transverse/transverse, longitudinal/longitudinal.
- For intermediate oil film thickness (to explore the role of individual parameters):
- ▪
- Tests conducted on smooth/smooth, transverse/transverse, and longitudinal/longitudinal pairs;
- ▪
- Parameters varied: oil injection temperature (Configurations 2 and 3), Hertzian pressure (Configurations 3 and 4), and mean rolling speed (Configurations 3 and 5).
3. Results
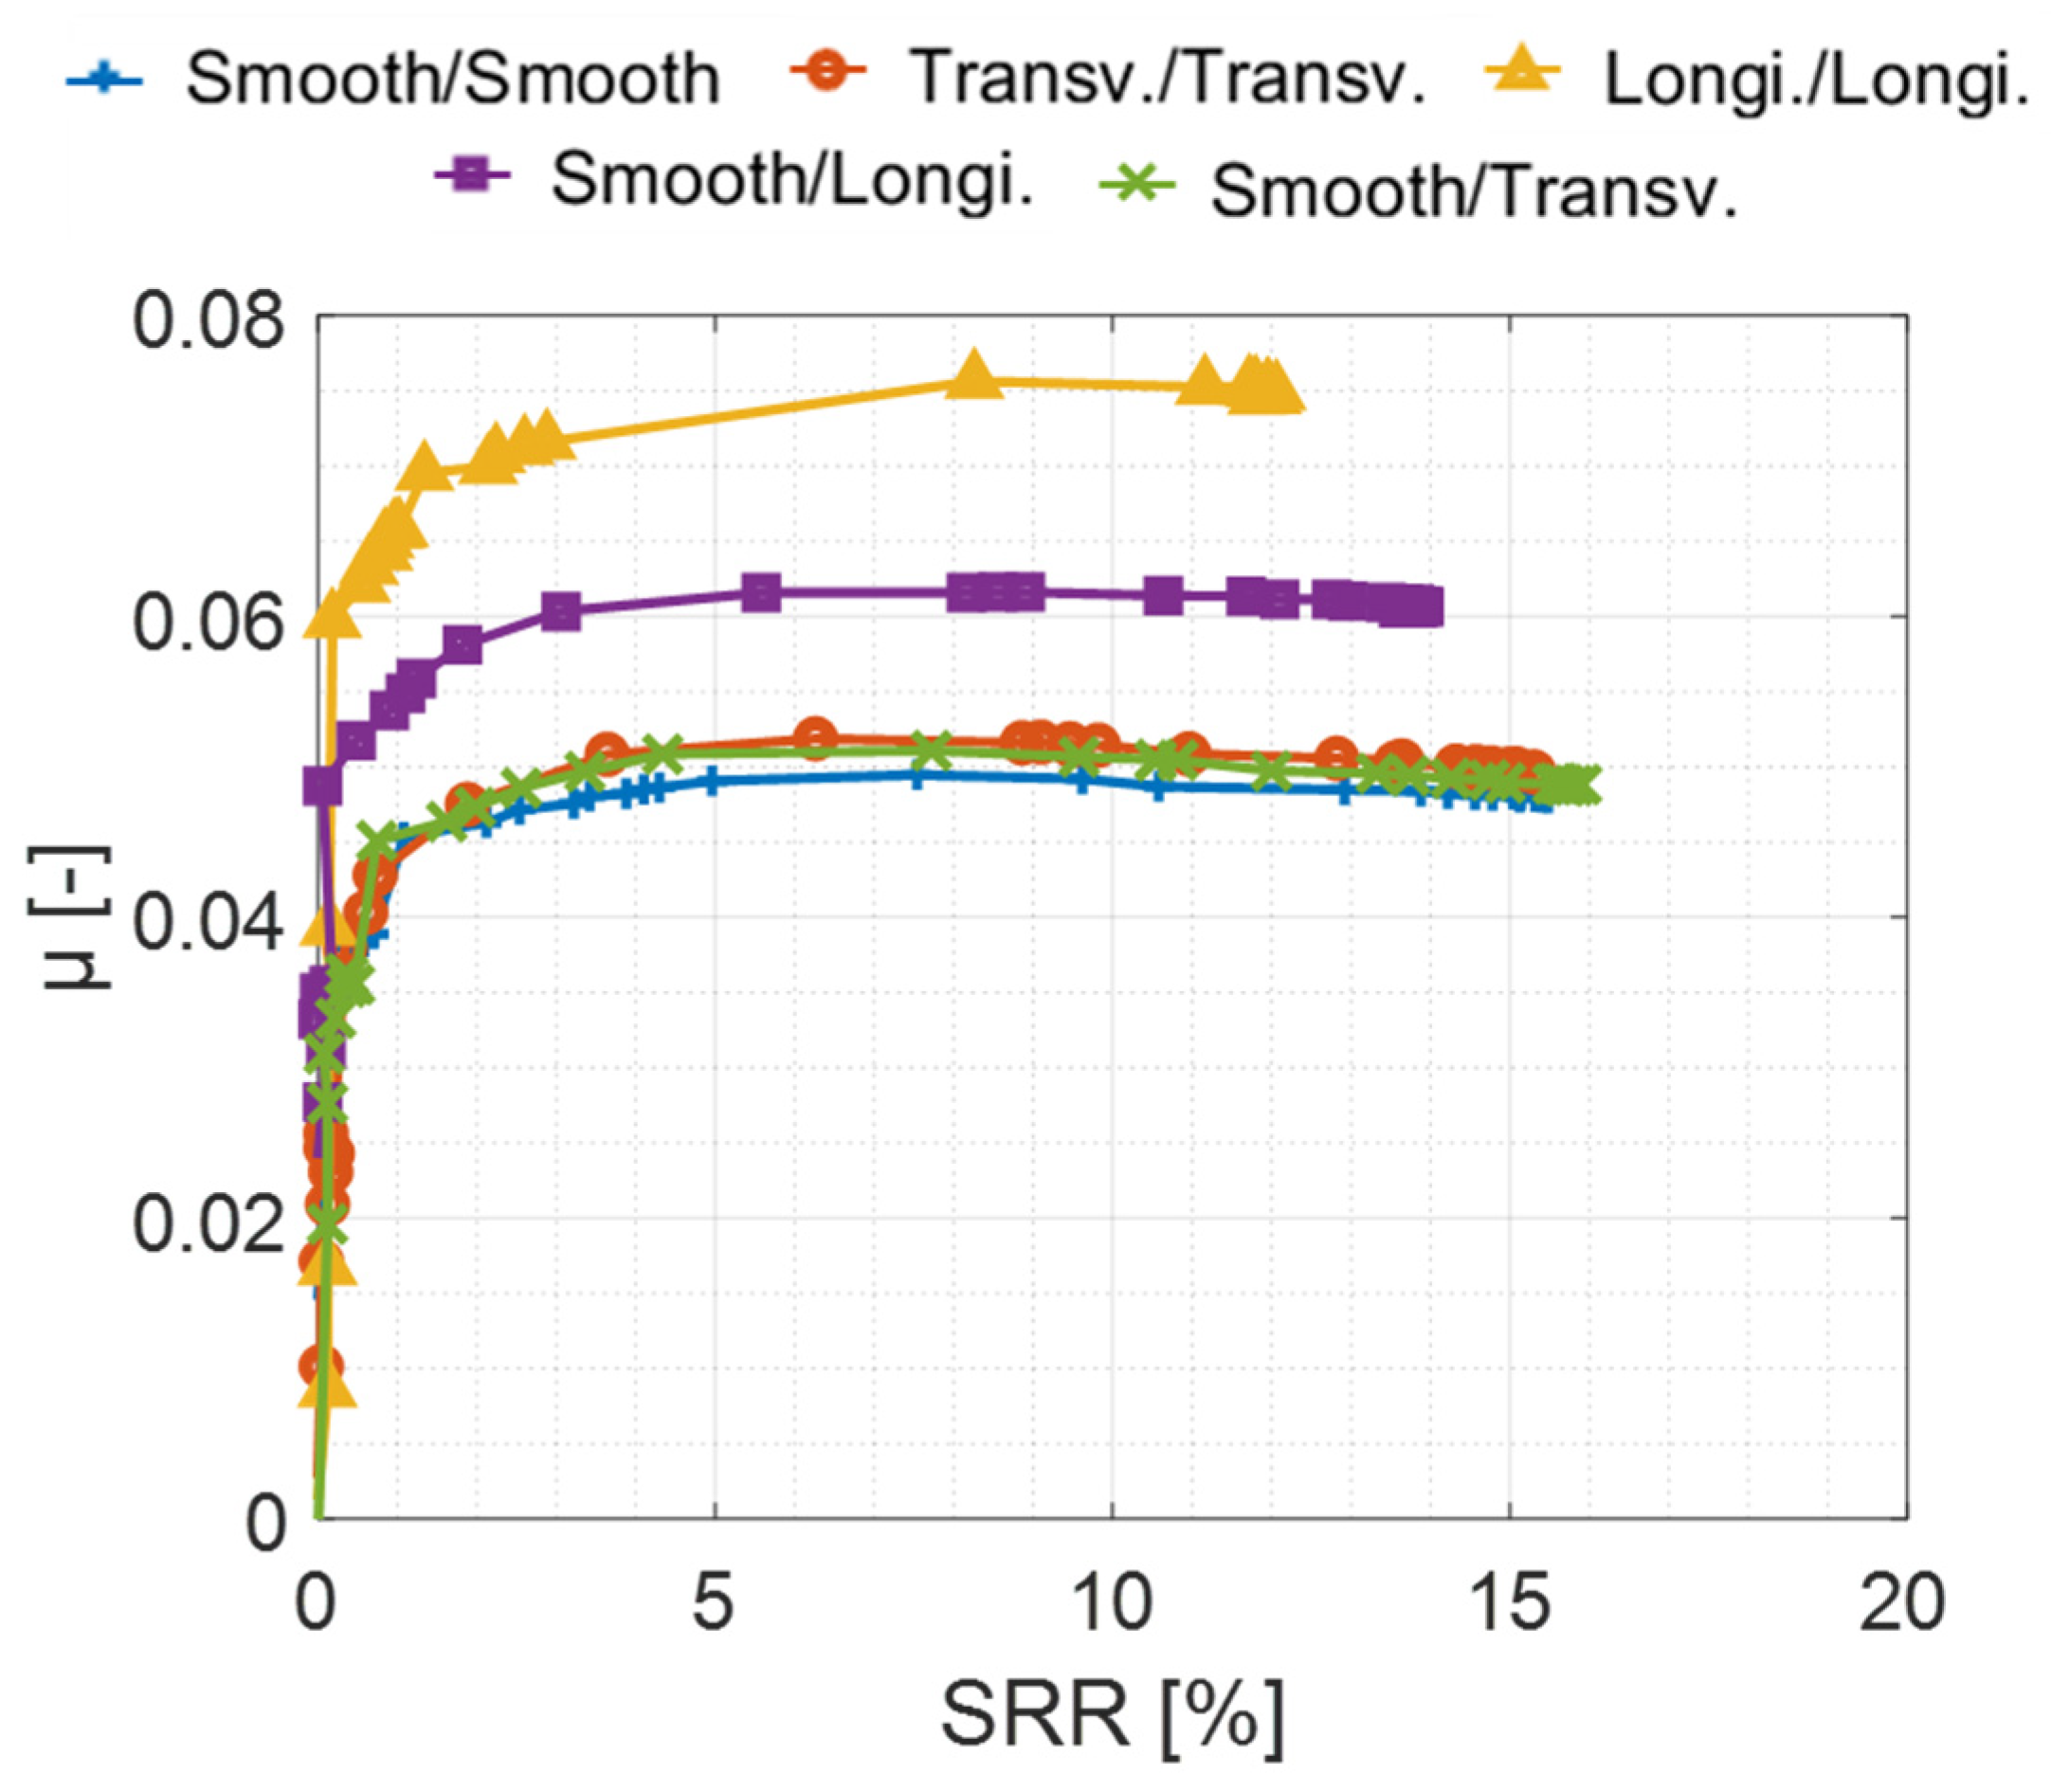
3.1. Lowest : Maximising the Influence of Asperities
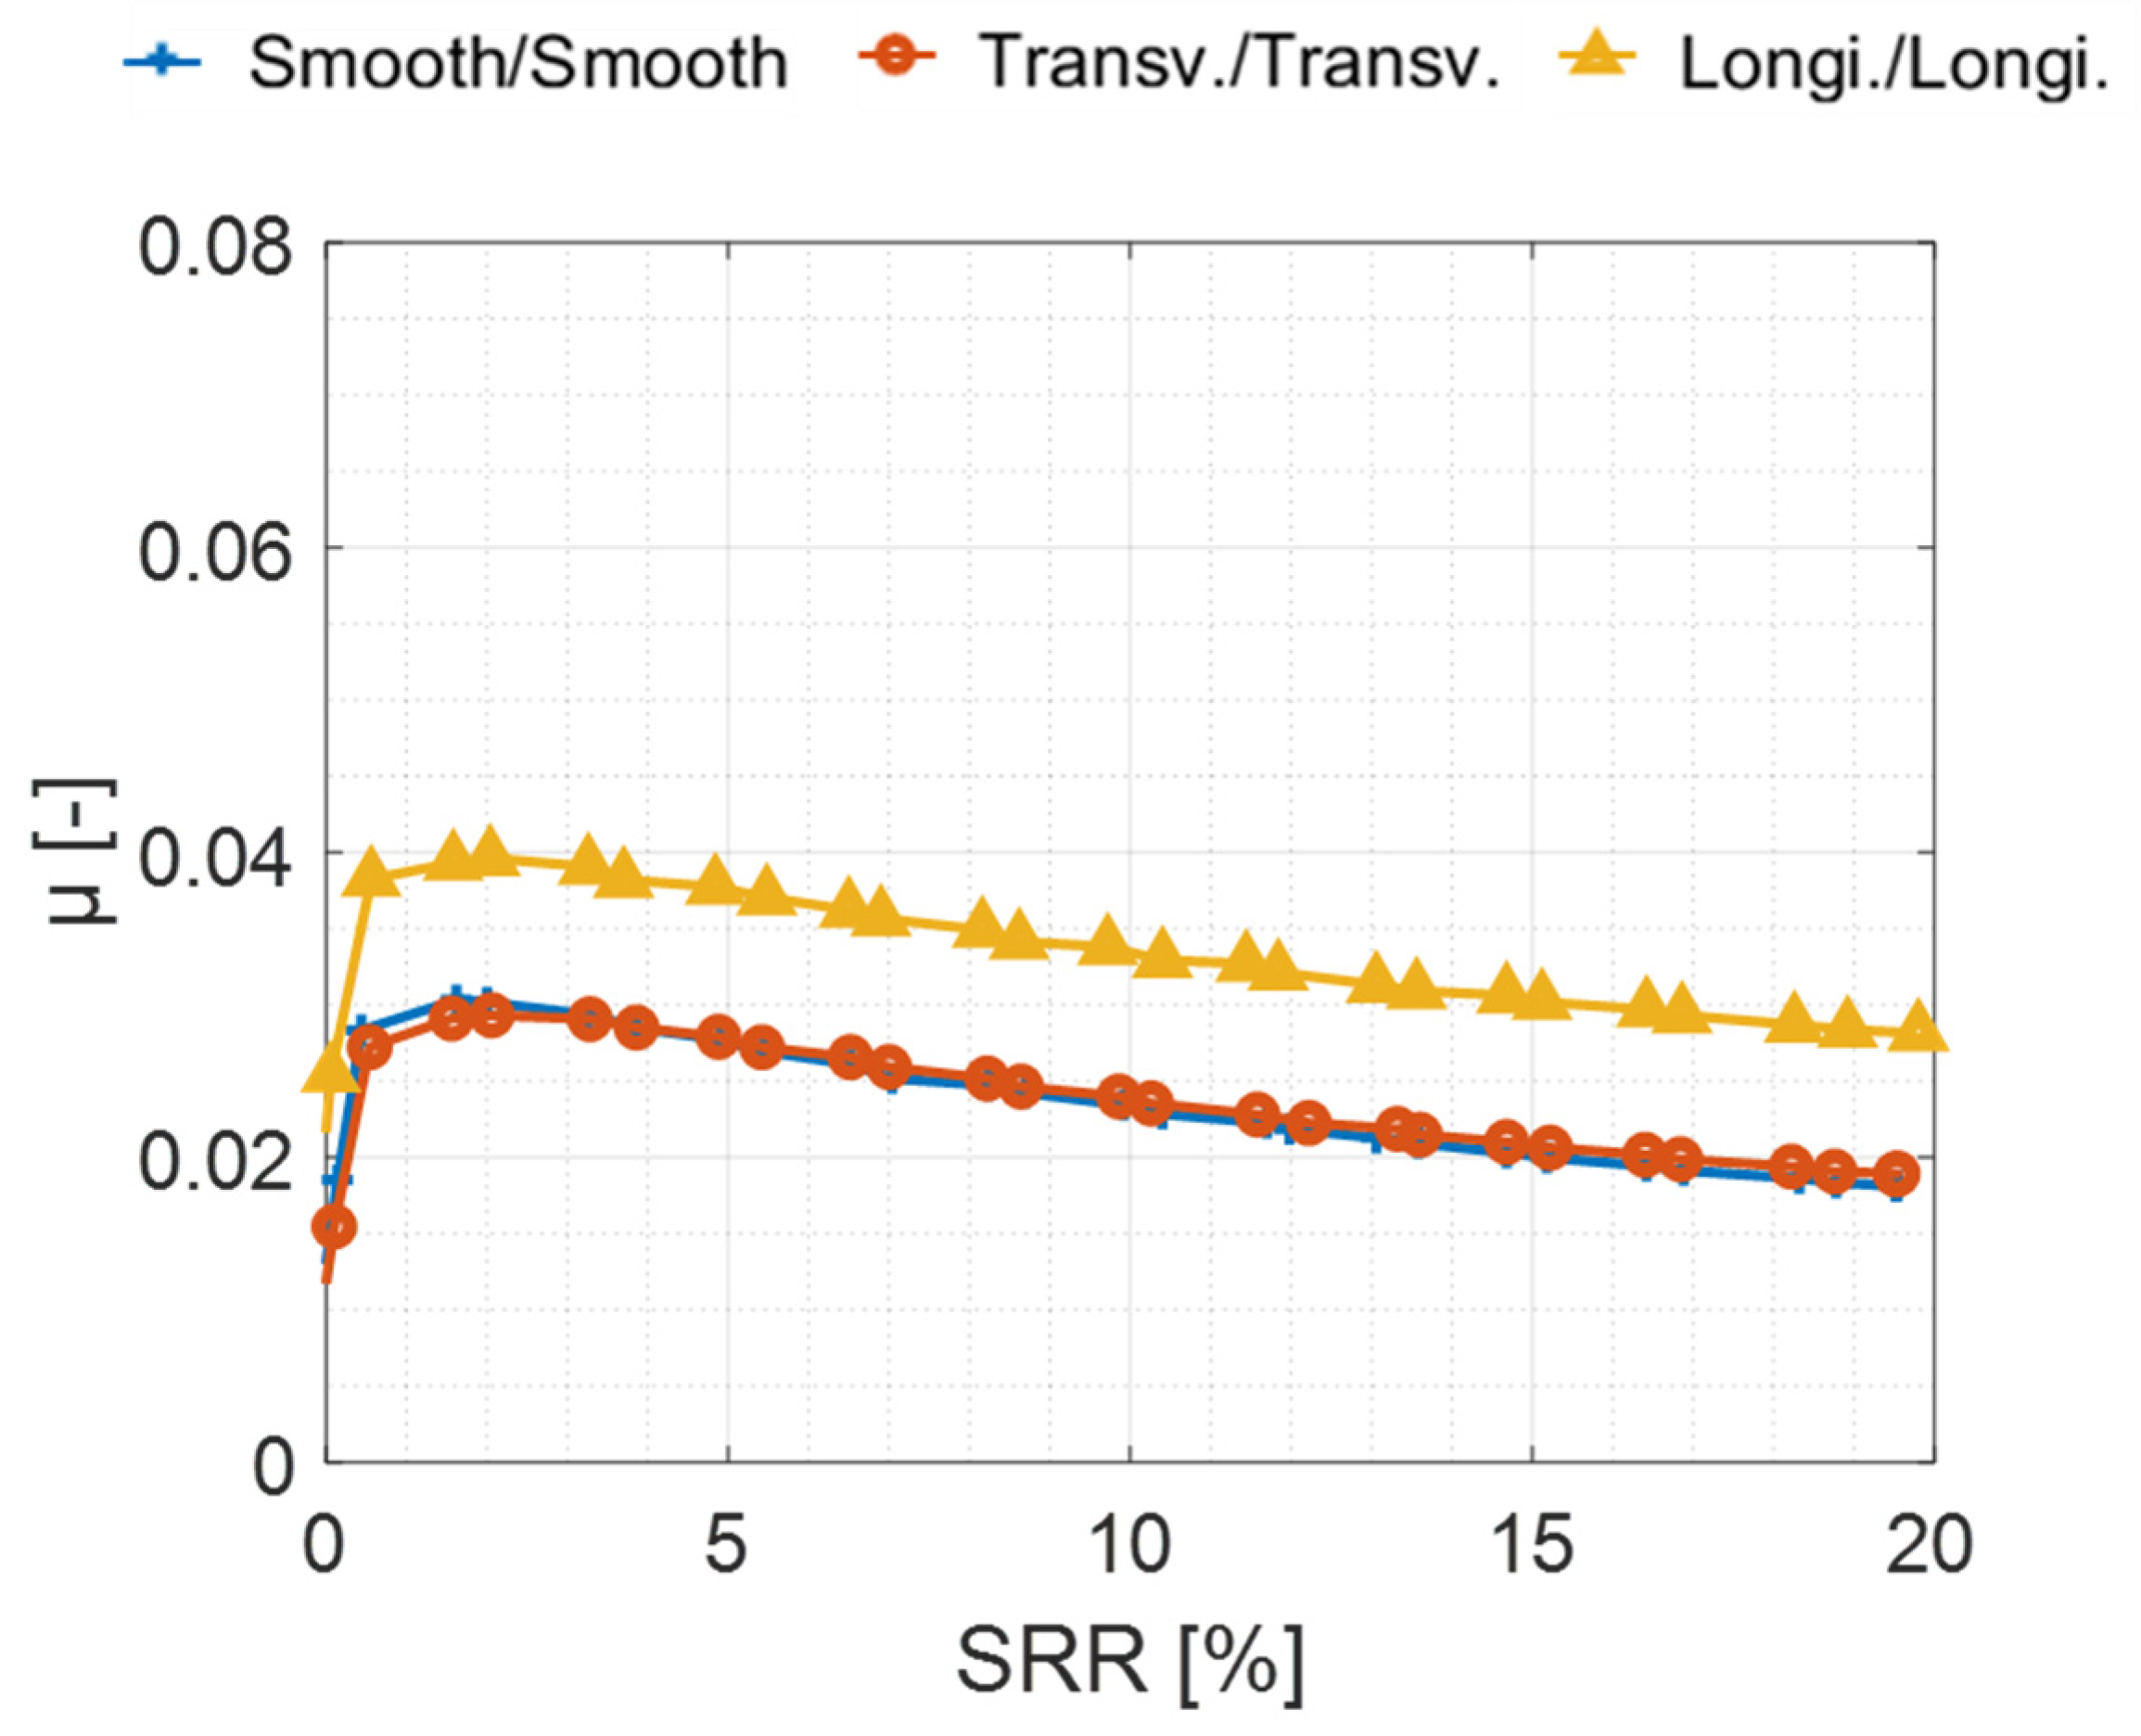
3.2. Highest : Minimising the Influence of Asperities
3.3. Intermediate Values: Influence of Operating Conditions
3.3.1. Influence of the Mean Rolling Speed
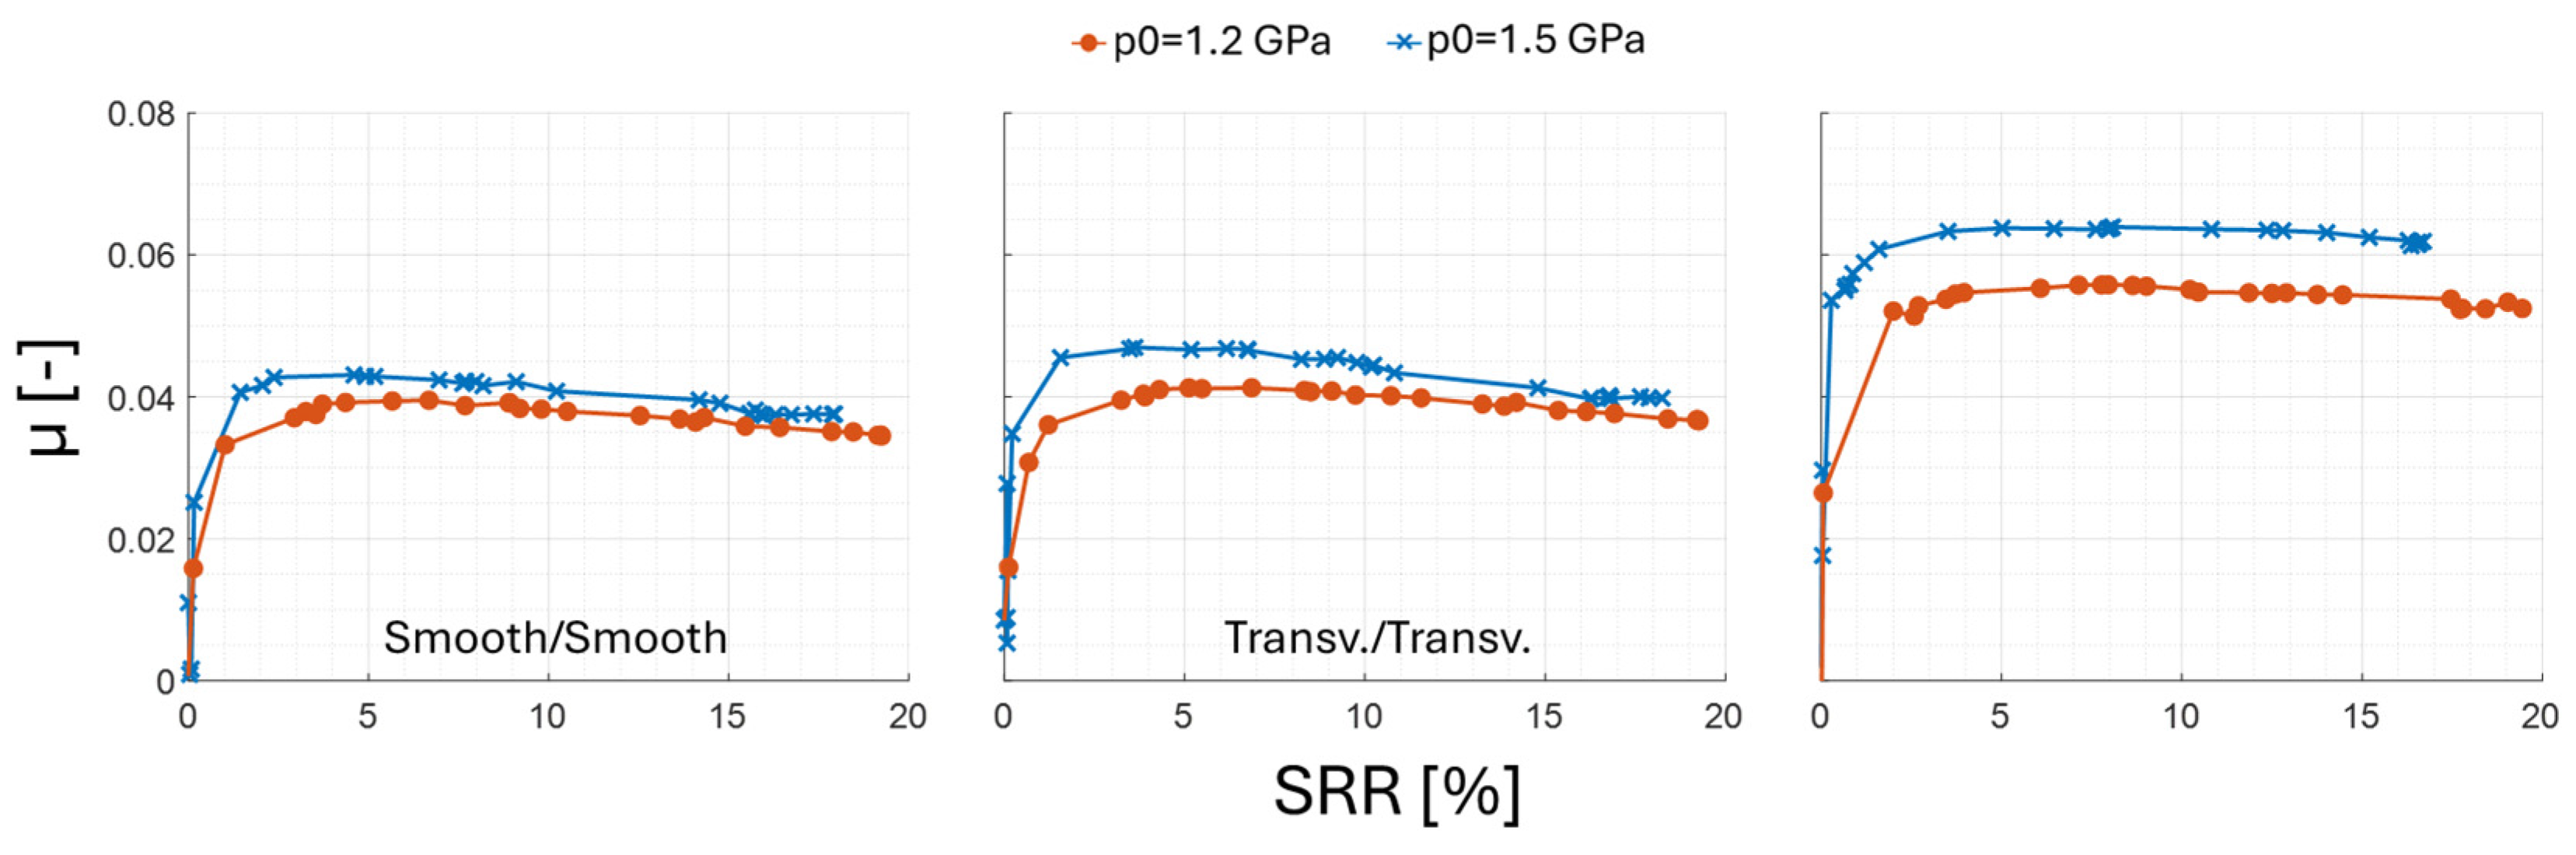
3.3.2. Influence of the Hertzian Pressure
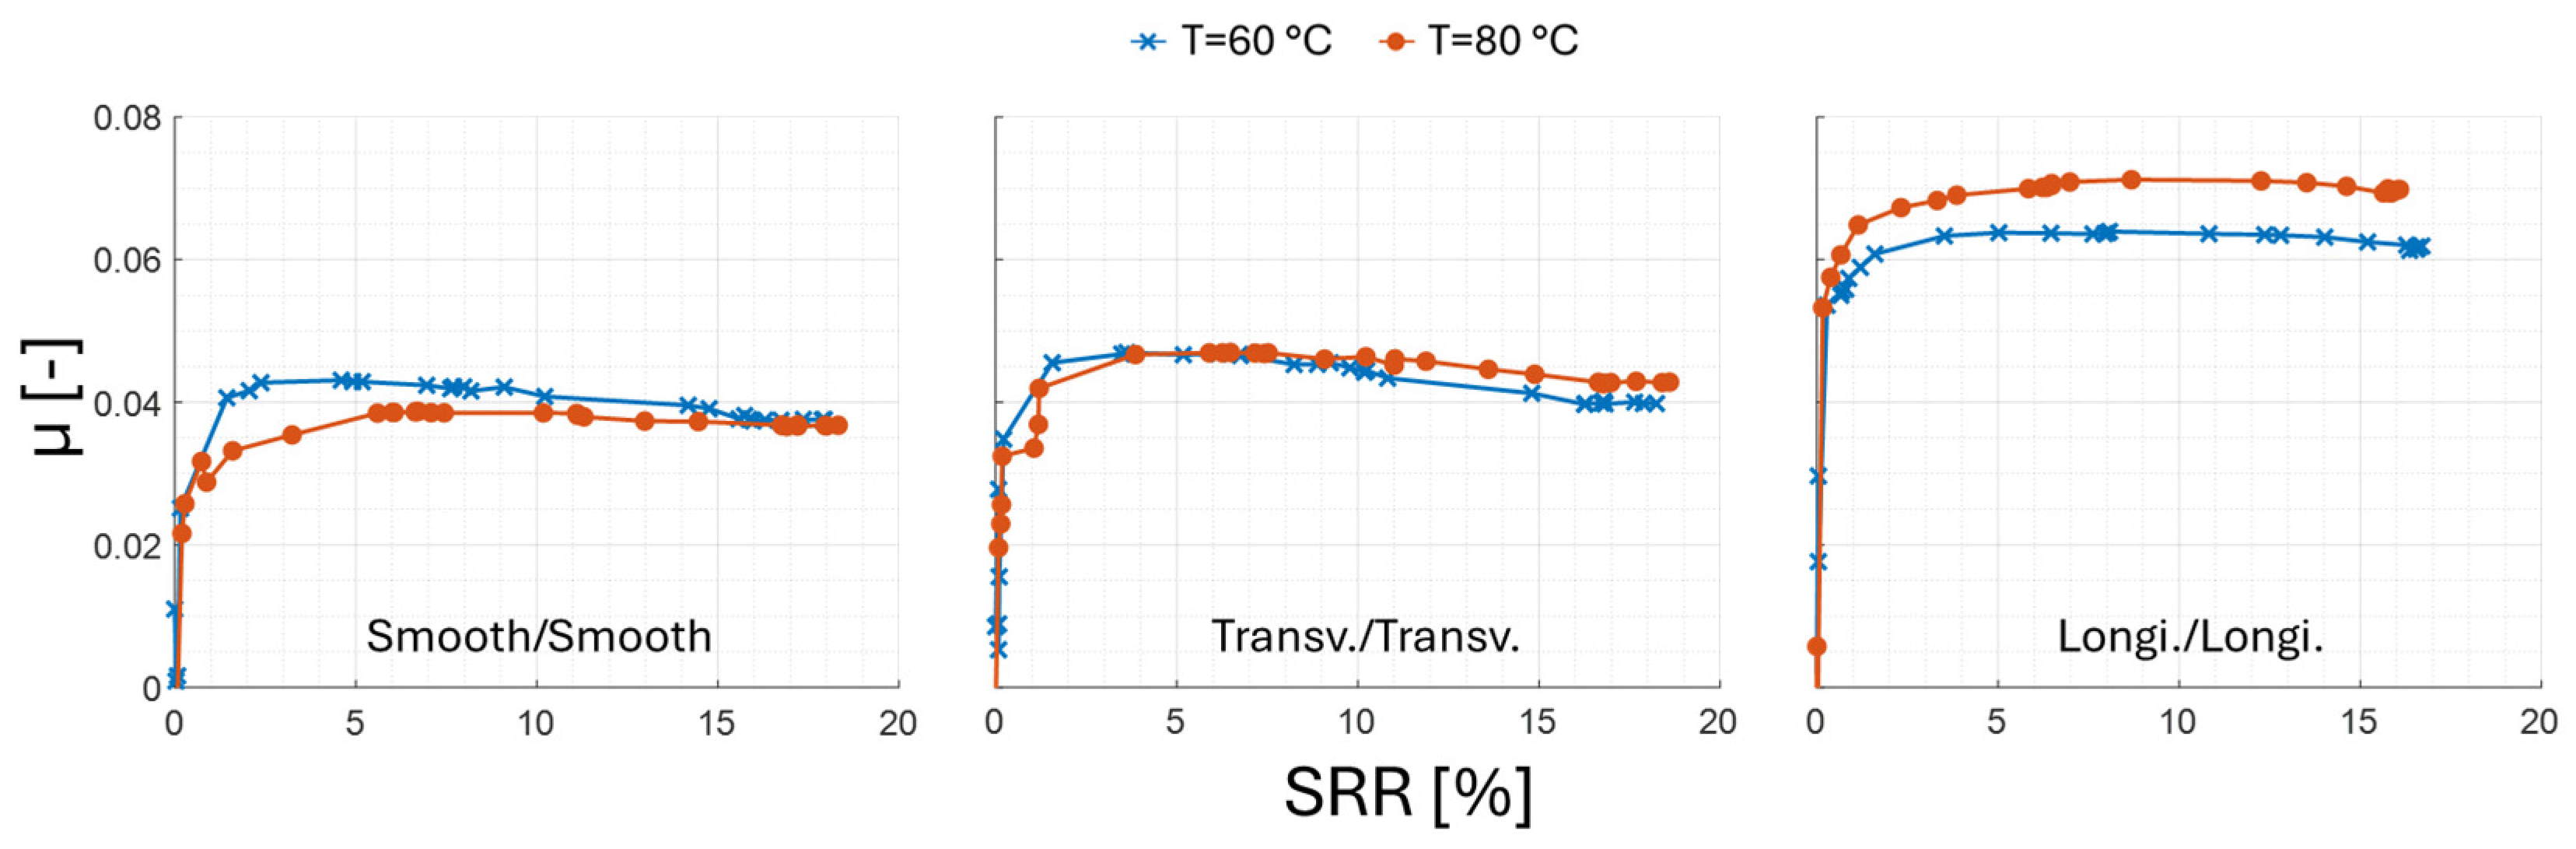
3.3.3. Influence of the Oil Injection Temperature
- The friction observed at 60 °C is higher than that at 80 °C for the smooth/smooth pair.
- The two transverse/transverse curves are identical up to an SRR of 10%. Then, at 60 °C, the friction decreases. However, at 80 °C, the friction remains constant. The decrease in the first curve (60 °C) is attributed to thermal effects.
4. Discussion
5. Conclusions
- It has been shown that longitudinal roughness results in higher friction than transverse roughness.
- Variations in operating conditions have a greater influence on the friction associated to the longitudinal roughness compared to the transverse one.
- The friction generated by the longitudinal pair, unlike the transverse pair, is consistently different from that of the smooth pair.
- The lubricant film thickness between surfaces with longitudinal roughness seems to be lower than that between surfaces with transverse roughness.
- Without considering the limitation related to the manufacturing processes, the choice of a transverse roughness (Sq ≈ 0.5 µm) for the gear teeth is convenient.
- As for REBs, the influence of roughness is not considered in most cases due to their low roughness amplitude (Sq ≈ 0.2 µm). However, in certain critical situations, such as under marginal/starved lubrication conditions (limited oil supply), transverse roughness may be more beneficial than longitudinal roughness.
Author Contributions
Funding
Data Availability Statement
Conflicts of Interest
Nomenclature
| Pa | Young modulus | |
| Pa | Reduced elastic modulus | |
| - | Complete elliptic integral of the second kind | |
| N | Normal load | |
| m | Central oil film thickness | |
| k | - | Ellipticity ratio |
| m | Width of the disc | |
| p0 | Pa | Maximum Hertz pressure |
| m | Curvature sum | |
| m | Quadratic roughness of surface i | |
| m | Quadratic roughness in the direction of rolling/sliding | |
| m | Quadratic roughness transverse to the rolling/sliding direction | |
| m | Radius in the rolling/sliding direction | |
| m | Radius transverse to the rolling/sliding direction (crown radius) | |
| m | Equivalent surface roughness | |
| Sq | m | Root mean square surface roughness |
| Tinj | °C | Oil injection temperature |
| Ve | m/s | Mean rolling speed |
| Pressure-viscosity (piezoviscosity) coefficient | ||
| - | Complete elliptic integral of the first kind | |
| - | Curvature difference | |
| - | Reduced film thickness | |
| - | Friction coefficient | |
| - | Poisson’s ratio | |
| Oil density |
Appendix A
Appendix B

| Pair | [µm] | [µm] | |
|---|---|---|---|
| Smooth | Disc 1 | 0.075 | 0.020 |
| Disc 2 | 0.050 | 0.018 | |
| Transverse | Disc 1 | 0.029 | 0.374 |
| Disc 2 | 0.048 | 0.433 | |
| Longitudinal | Disc 1 | 0.380 | 0.037 |
| Disc 2 | 0.489 | 0.039 | |
References
- Holmberg, K.; Erdemir, A. The impact of tribology on energy use and CO2 emission globally and in combustion engine and electric cars. Tribol. Int. 2019, 135, 389–396. [Google Scholar] [CrossRef]
- ISO/TR 14179-2; Gears—Thermal Capacity. Part 2: Thermal Load-Carrying Capacity. International Organization for Standardization: Geneva, Switzerland, 2001.
- Zhu, M.; Lu, X.; Li, H.; Cao, H.; Wu, F. Applicability analysis of nickel steel plate friction coefficient model based on fractal theory. Coatings 2023, 13, 1096. [Google Scholar] [CrossRef]
- Walton, D.; Cropper, A.B.; Weale, D.J.; Klein Meuleman, P. The efficiency and friction of plastic cylindrical gears. Part 2: Influence of tooth geometry. Proc. Inst. Mech. Eng. Part J J. Eng. Tribol. 2002, 216, 93–104. [Google Scholar] [CrossRef]
- Liu, P.; Rui, Y.; Wang, Y. Study of the sliding friction coefficient of different-size elements in discrete element method based on an experimental method. Appl. Sci. 2024, 14, 8802. [Google Scholar] [CrossRef]
- Bisson, E.E. Friction, Wear, and the Influence of Surfaces; American Society of Tool and Manufacturing Engineers: Dearborn, MI, USA, 1968. [Google Scholar]
- Hu, Q.; Pei, Q.; Li, P. Reducing the friction coefficient of heavy-load spherical bearings in bridges using surface texturing—A numerical study. Lubricants 2025, 13, 180. [Google Scholar] [CrossRef]
- Trzepieciński, T.; Szwajka, K.; Szewczyk, M. Analysis of coefficient of friction of deep-drawing-quality steel sheets using multi-layer neural networks. Lubricants 2024, 12, 50. [Google Scholar] [CrossRef]
- Duran, B.; Cavoret, J.; Philippon, D.; Ville, F.; Ruellan, A.; Berens, F. Influence of a transmission oil degradation on physico-chemical properties and tribological performance. Tribol. Int. 2024, 191, 109084. [Google Scholar] [CrossRef]
- Grenet De Bechillon, N.; Touret, T.; Cavoret, J.; Changenet, C.; Ville, F.; Ghribi, D. A new experimental methodology to assess gear scuffing initiation. Surf. Interfaces 2022, 16, 245–255. [Google Scholar] [CrossRef]
- Perka, P.; Kupka, I.; Hartl, M. Experimental study of real roughness attenuation in concentrated contacts. Tribol. Int. 2010, 43, 1893–1901. [Google Scholar] [CrossRef]
- Thomas, T.R. Rough Surfaces, 2nd ed.; Imperial College Press: London, UK, 1998. [Google Scholar]
- Hamrock, B.J.; Jeng, Y.R. The effect of surface roughness on elastohydrodynamically lubricated point contact. ASLE Trans. 1986, 30, 531–538. [Google Scholar] [CrossRef]
- Makino, T.; Morohoshi, S.; Saki, K. The effect of roughness orientation on mixed friction. Tribol. Ser. 1999, 36, 355–365. [Google Scholar] [CrossRef]
- Kaneta, M.; Sakai, T.; Nishikawa, H. Effects of surface roughness on point contact EHL. Tribol. Trans. 1993, 36, 605–612. [Google Scholar] [CrossRef]
- Šperka, P.; Křupka, I.; Hartl, M. Experimental study of roughness effect in a rolling–sliding EHL contact. Part I: Roughness deformation. Tribol. Trans. 2016, 59, 267–276. [Google Scholar] [CrossRef]
- Hook, C.J. Surface roughness modification in EHL line contacts—The effect of roughness wavelength, orientation and operating conditions. Tribol. Ser. 1999, 36, 193–202. [Google Scholar] [CrossRef]
- Venner, C.H.; Lubrecht, A.A. Numerical analysis of the influence of waviness on the film thickness of a circular EHL contact. J. Tribol. 1996, 118, 153–161. [Google Scholar] [CrossRef]
- Zhu, D.; Wang, Q.J. Effect of roughness orientation on the elastohydrodynamic lubrication film thickness. J. Tribol. 2013, 135, 031501. [Google Scholar] [CrossRef]
- Baumann, A.; Bertsche, B. Coefficient of friction behavior of gear oils and significance for the meshing process of spur gears: Lubrication for improved properties. Forsch. Ingenieurwes. 2022, 86, 795–805. [Google Scholar] [CrossRef]
- Morgado, P.; Otero, J.; Lejarraga, J.; Sanz, J.; Lantada, A.; Muñoz-Guijosa, J.; Yustos, H.; Wiña, P.; García, J. Models for predicting friction coefficient and parameters with influence in elastohydrodynamic lubrication. Proc. Inst. Mech. Eng. Part J J. Eng. Tribol. 2009, 223, 949–958. [Google Scholar] [CrossRef]
- Rovira, A.; Roda, A.; Lewis, R.; Marshall, M.B. Application of Fastsim with variable coefficient of friction using twin disc experimental measurements. Wear 2012, 274–275, 109–126. [Google Scholar] [CrossRef]
- Bergseth, E.; Zhu, Y.; Söderberg, A. Study of surface roughness on friction in rolling/sliding contacts: Ball-on-disc versus twin-disc. Tribol. Lett. 2020, 68, 69. [Google Scholar] [CrossRef]
- Isaac, G.; Changenet, C.; Ville, F.; Cavoret, J.; Becquerelle, S. Thermal analysis of twin-disc machine for traction tests and scuffing experiments. Proc. Inst. Mech. Eng. Part J J. Eng. Tribol. 2018, 232, 1548–1560. [Google Scholar] [CrossRef]
- Ville, F.; Nélias, D.; Tourlonias, G.; Flamand, L.; Sainsot, P. On the two-disc machine: A polyvalent and powerful tool to study fundamental and industrial problems related to elastohydrodynamic lubrication. Tribol. Ser. 2001, 39, 393–402. [Google Scholar] [CrossRef]
- Gupta, P.K.; Flamand, L.; Berthe, D.; Godet, M. On the traction behavior of several lubricants. J. Lubr. Technol. 1981, 103, 55–64. [Google Scholar] [CrossRef]
- Hansen, J.; Björling, M.; Larsson, R. Topography transformations due to running-in of rolling-sliding non-conformal contacts. Tribol. Int. 2020, 144, 106126. [Google Scholar] [CrossRef]
- Kohutiar, M.; Krbaťa, M.; Escherová, J.; Eckert, M.; Mikuš, P.; Jus, M.; Polášek, M.; Janík, R.; Dubec, A. The influence of the geometry of movement during the friction process on the change in the tribological properties of 30CrNiMo8 steel in contact with a G40 steel ball. Materials 2024, 17, 127. [Google Scholar] [CrossRef] [PubMed]
- Stelmakh, O.; Fu, H.; Kolienov, S.; Kanevskii, V.; Zhang, H.; Hu, C.; Grygoruk, V. Criteria for evaluating the tribological effectiveness of 3D roughness on friction surfaces. Lubricants 2024, 12, 209. [Google Scholar] [CrossRef]
- Krbaťa, M.; Majerík, J.; Barényi, I.; Mikušová, I.; Kusmič, D. Mechanical and tribological features of the 90MnCrV8 steel after plasma nitriding. Manuf. Technol. 2019, 19, 238–242. [Google Scholar] [CrossRef]
- Zhang, X.; Wang, J.; Fan, H.; Pan, D. Erosion–corrosion resistance properties of 316L austenitic stainless steels after low-temperature liquid nitriding. Appl. Surf. Sci. 2018, 440, 755–762. [Google Scholar] [CrossRef]
- Johnson, K.; Tevaawerk, J.L. Shear behaviour of elastohydrodynamic oil films. Proc. R. Soc. Lond. A Math. Phys. Sci. 1977, 356, 215–236. [Google Scholar] [CrossRef]
- Stribeck, R. Die wesentlichen Eigenschaften der Gleit- und Rollenlager. Z. Vereines Dtsch. Ingenieure 1902, 46, 1341–1348. [Google Scholar]
- Cocks, M.; Tallian, T.E. Sliding contacts in rolling bearings. ASLE Trans. 1971, 14, 32–40. [Google Scholar] [CrossRef]
- Tallian, T. The theory of partial elastohydrodynamic contacts. Wear 1972, 21, 49–101. [Google Scholar] [CrossRef]
- Zhu, D.; Wang, Q.J. On the λ ratio range of mixed lubrication. Proc. Inst. Mech. Eng. Part J J. Eng. Tribol. 2012, 226, 1010–1022. [Google Scholar] [CrossRef]
- Hansen, J.; Björling, M.; Larsson, R. A new film parameter for rough surface EHL contacts with anisotropic and isotropic structures. Tribol. Lett. 2021, 69, 37. [Google Scholar] [CrossRef]
- Brewe, D.E.; Hamrock, B.J. Simplified solution for elliptical-contact deformation between two elastic solids. J. Lubr. Technol. 1977, 99, 485–490. [Google Scholar] [CrossRef]
- Hamrock, B.J.; Dowson, D. Isothermal elastohydrodynamic lubrication of point contacts. Part IV—Starvation results. J. Lubr. Technol. 1977, 99, 15–23. [Google Scholar] [CrossRef]
- Jeng, Y.R. Experimental study of the effects of surface roughness on friction. Tribol. Trans. 1990, 33, 402–409. [Google Scholar] [CrossRef]
- Hertz, H. Über die Berührung fester elastischer Körper. J. Reine Angew. Math. 1881, 92, 156–171. [Google Scholar]


| Parameter | Description | Value |
|---|---|---|
| Kinematic viscosity at 40 °C [Cst] | 66 | |
| Kinematic viscosity at 100 °C [Cst] | 8.6 | |
| Density at 15 °C [kg/m3] | 867 | |
| Pressure-viscosity coefficient [GPa−1] | 20.5 |
| Material | Nitrided Steel | |
|---|---|---|
| Disc 1 (Cylindrical) | Disc 2 (Crown) | |
| E [GPa] | 210 | 210 |
| [-] | 0.243 | 0.243 |
| Hardness [Hv] | 373 | 373 |
| L [mm] | 10 | 10 |
| [mm] | 35 | 35 |
| [mm] | ∞ | 150 |
| k | 4.05 | |
| Pair | Sq [μm] | |
|---|---|---|
| Smooth | Disc 1 | 0.0818 |
| Disc 2 | 0.0678 | |
| Transverse | Disc 1 | 0.450 |
| Disc 2 | 0.493 | |
| Longitudinal | Disc 1 | 0.454 |
| Disc 2 | 0.590 | |
| Pair | [µm] |
|---|---|
| Smooth/Smooth | |
| Transverse/Transverse | |
| Longitudinal/Longitudinal | |
| Smooth/Longitudinal | |
| Smooth/Transverse |
| Surface of the Longitudinal Crown Disc Before All Tests | Surface of the Longitudinal Crown Disc After All Tests | |
|---|---|---|
| 3D surface roughness | 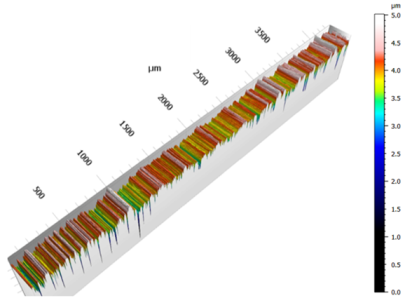 | 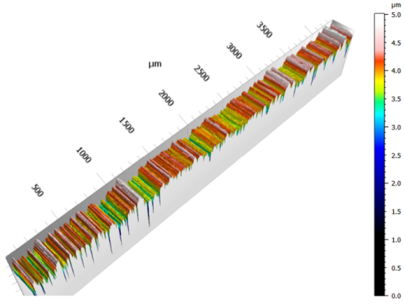 |
| 2D profile roughness | 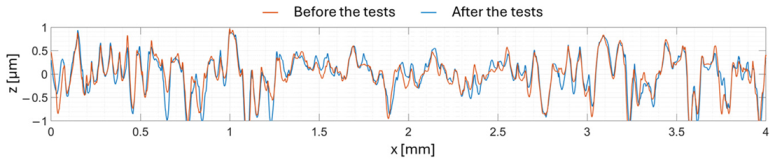 | |
| Sq | 0.598 µm | 0.590 µm |
| Relative deviation [%] | 1.3% | |
| Configuration | Oil Injection Temperature [°C] | Hertzian Pressure [GPa] | Mean Rolling Speed [m/s] | Central Oil Film Thickness [µm] |
|---|---|---|---|---|
| 1 | 60 | 1.5 | 5 | 0.76 |
| 2 | 80 | 1.5 | 10 | 0.77 |
| 3 | 60 | 1.5 | 10 | 1.22 |
| 4 | 60 | 1.2 | 10 | 1.27 |
| 5 | 60 | 1.5 | 30 | 2.55 |
| 6 | 60 | 1.2 | 30 | 2.66 |
| Pair | µ [-] at SRR = 10% |
|---|---|
| Smooth/Smooth | 0.048 |
| Smooth/Transverse | 0.050 |
| Transverse/Transverse | 0.051 |
| Smooth/Longitudinal | 0.059 |
| Longitudinal/Longitudinal | 0.075 |
| Pair | µ [-] at SRR = 10% |
|---|---|
| Smooth/Smooth | 0.023 |
| Transverse/Transverse | 0.023 |
| Longitudinal/Longitudinal | 0.033 |
| Pair | 10 m/s | 30 m/s | Evolution of µ at SRR = 10% |
|---|---|---|---|
| µ [-] at SRR = 10% | µ [-] at SRR = 10% | ||
| Smooth/Smooth | 0.040 | 0.027 | Decrease of 32.5% |
| Transverse/Transverse | 0.044 | 0.028 | Decrease of 36.4% |
| Longitudinal/Longitudinal | 0.064 | 0.045 | Decrease of 29.7% |
| Pair | 1.2 GPa | 1.5 GPa | Evolution of µ at SRR = 10% |
|---|---|---|---|
| µ [-] at SRR = 10% | µ [-] at SRR = 10% | ||
| Smooth/Smooth | 0.038 | 0.040 | Increase of 7.9% |
| Transverse/Transverse | 0.040 | 0.044 | Increase of 10% |
| Longitudinal/Longitudinal | 0.055 | 0.064 | Increase of 14.5% |
| Pair | 60 °C | 80 °C | Evolution of µ at SRR = 10% |
|---|---|---|---|
| µ [-] at SRR = 10% | µ [-] at SRR = 10% | ||
| Smooth/Smooth | 0.040 | 0.038 | Decrease of 7.3% |
| Transverse/Transverse | 0.044 | 0.046 | Increase of 4.5% |
| Longitudinal/Longitudinal | 0.064 | 0.071 | Increase of 10.9% |
| Configuration | Central Oil Film Thickness [µm] of the Smooth/Smooth Pair at SRR = 10% | [-] at SRR = 10% | [-] at SRR = 10% | [-] at SRR = 10% |
|---|---|---|---|---|
| 1 | 0.77 | 0.048 | 0.051 | 0.075 |
| 2 | 0.64 | 0.038 | 0.046 | 0.071 |
| 3 | 0.97 | 0.040 | 0.044 | 0.064 |
| 4 | 1.10 | 0.038 | 0.040 | 0.055 |
| 5 | 1.52 | 0.027 | 0.028 | 0.045 |
| 6 | 2.27 | 0.023 | 0.023 | 0.033 |
Disclaimer/Publisher’s Note: The statements, opinions and data contained in all publications are solely those of the individual author(s) and contributor(s) and not of MDPI and/or the editor(s). MDPI and/or the editor(s) disclaim responsibility for any injury to people or property resulting from any ideas, methods, instructions or products referred to in the content. |
© 2025 by the authors. Licensee MDPI, Basel, Switzerland. This article is an open access article distributed under the terms and conditions of the Creative Commons Attribution (CC BY) license (https://creativecommons.org/licenses/by/4.0/).
Share and Cite
Cordier, M.; Diab, Y.; Cavoret, J.; Majdoub, F.; Changenet, C.; Ville, F. An Experimental Study on the Impact of Roughness Orientation on the Friction Coefficient in EHL Contact. Lubricants 2025, 13, 340. https://doi.org/10.3390/lubricants13080340
Cordier M, Diab Y, Cavoret J, Majdoub F, Changenet C, Ville F. An Experimental Study on the Impact of Roughness Orientation on the Friction Coefficient in EHL Contact. Lubricants. 2025; 13(8):340. https://doi.org/10.3390/lubricants13080340
Chicago/Turabian StyleCordier, Matthieu, Yasser Diab, Jérôme Cavoret, Fida Majdoub, Christophe Changenet, and Fabrice Ville. 2025. "An Experimental Study on the Impact of Roughness Orientation on the Friction Coefficient in EHL Contact" Lubricants 13, no. 8: 340. https://doi.org/10.3390/lubricants13080340
APA StyleCordier, M., Diab, Y., Cavoret, J., Majdoub, F., Changenet, C., & Ville, F. (2025). An Experimental Study on the Impact of Roughness Orientation on the Friction Coefficient in EHL Contact. Lubricants, 13(8), 340. https://doi.org/10.3390/lubricants13080340