1. Introduction
Rice is the primary food source for more than half of the world’s population, making its efficient and low-loss harvesting a critical component of global food security [
1,
2,
3,
4]. The combine harvester is the core equipment for mechanized rice harvesting, and its operational performance directly impacts the efficiency and profitability of agricultural production [
5,
6,
7,
8]. The header platform, as the first key component of the combine harvester to come into contact with the crop, is responsible for cutting, supporting, and conveying the crop. Its working condition is a decisive factor for the reliability and operational quality of the entire machine [
9,
10,
11].
However, during field operations, the header platform is continuously exposed to a harsh environment. It is subjected not only to constant friction and impact from rice stalks, leaves, and panicles but also to entrained hard abrasives such as soil and sand. This leads to severe wear on critical components like the bottom plate and the spiral auger, sometimes even resulting in perforation (
Figure 1). This wear phenomenon not only compromises the structural integrity of the components, leading to premature failure and a reduced service life, but it also increases maintenance costs and reduces conveying efficiency. The altered surface morphology can lead to material blockages and increased grain losses [
12,
13,
14]. Therefore, an in-depth understanding of the wear mechanisms of the header platform and an accurate prediction of its wear distribution patterns are of significant theoretical value and practical importance for optimizing the structural design of the header platform, developing highly wear-resistant materials, and enhancing the overall reliability of the machine.
In the realm of numerical simulation, the Discrete Element Method (DEM) has been widely recognized as a powerful tool for predicting component wear across various industries [
15,
16,
17]. For instance, numerous studies have focused on abrasive wear caused by hard, granular particles. Researchers have used DEM to model wear in tumbling ball mills by analyzing the effects of operating parameters and grinding media shape [
18], investigate erosion in gas–solid flow reactors by considering particle sphericity [
19], and predict wear in transfer chutes by coupling DEM with the Finite Element Method (FEM) to account for structural deformation [
20]. Similarly, in the field of soil tillage, DEM combined with the Archard wear model has been used to simulate the abrasive material loss on tools, with some advanced studies even incorporating dynamic updates to the tool’s geometry as wear progresses [
21]. These works collectively demonstrate the capability of DEM to link particle dynamics to surface wear.
However, these studies predominantly deal with wear caused by rigid or quasi-rigid granular media (e.g., minerals, soil, coal). The wear mechanism on a combine harvester header platform, which is primarily caused by the continuous flow of flexible, long-stalk biomass like rice stalks, presents a distinct set of challenges not fully captured by models developed for hard particle abrasion. While some research has employed DEM to study wear in biomass processing, such as in alfalfa densification dies where fatigue and abrasive wear were analyzed [
22], the specific dynamics of conveying large populations of flexible stalks and its direct, quantitative relationship to wear distribution remain less explored. Furthermore, the broader field of DEM wear simulation has seen significant methodological advancements, including the development of alternative wear models and novel computational approaches like using spherical boundary elements to improve efficiency [
23], all aimed at enhancing the fidelity and feasibility of wear prediction. This highlights a critical gap: a lack of systematic, multi-faceted validation that connects a first-principles analytical model, a high-fidelity population-level simulation, and detailed real-world wear data specifically for flexible biomass-induced wear.
Numerous scholars have used DEM to conduct in-depth research on the macroscopic flow patterns [
24,
25], force states [
26,
27], and velocity distributions [
28,
29,
30] of grains during threshing, cleaning, and conveying processes. However, to accurately simulate the motion of rice stalks, it is imperative to adopt a modeling approach that can reflect their flexible characteristics. Conventional DEM models typically simplify materials into single or multiple bonded rigid spheres (rigid clumps), a method incapable of simulating key mechanical behaviors such as the bending and rebounding of stalks under load [
31,
32,
33,
34]. To address this, this study employs a more advanced flexible particle model, which involves linearly connecting a series of spherical particles using the Hertz–Mindlin with Bonding V2 contact model. This model not only simulates the contact and collisions between particles but also endows the entire particle chain with the ability to resist tension, bending, and torsion through “bonds.” This allows for a high-fidelity reproduction of the flexible deformation of real rice stalks at the macroscopic level, making the simulation results more consistent with physical reality.
Despite considerable progress in analytical and simulation research, a significant gap persists in the existing literature: there is a lack of studies that systematically compare and validate analytical models, complex system numerical simulations, and real-world wear results. Most research either stops at theoretical analysis or only demonstrates macroscopic flow through DEM simulation, failing to establish a direct, quantitative mapping relationship from “material motion trajectory” to “component wear profile.” The flow path of the material is a direct manifestation of the duration and intensity of its interaction with the component surface and should, in theory, be the core factor determining the wear distribution. Validating this central idea is crucial for developing wear-resistant designs from a fundamental perspective.
While previous studies have successfully used DEM to predict wear from rigid granular media [
18,
19,
20,
21] or to analyze the flow of flexible biomass [
24,
25,
26,
27,
28,
29,
30], a critical gap exists in the literature: a lack of systematic, multi-faceted research that connects a first-principles analytical model, a high-fidelity population-level simulation, and detailed real-world wear data specifically for flexible biomass-induced wear. This study distinguishes itself by creating a comprehensive framework to bridge this gap. Specifically, it is the first to (1) conduct a three-way quantitative comparison among an analytical trajectory, a simulated flexible stalk population trajectory, and an actual long-term wear profile; (2) introduce a novel time-sequence validation method based on corrosion color gradients. By doing so, this research aims to systematically validate the hypothesis that the “material flow trajectory determines the wear distribution” for flexible biomass systems. The specific objectives of the study include:
(1) To establish an analytical model for the motion trajectory of a rice stalk under the action of the spiral auger, thereby predicting its fundamental conveyance path from the perspective of physical principles.
(2) To conduct high-fidelity numerical simulations of the conveyance process of a rice stalk population within a full-scale header platform model using the Discrete Element Method (DEM). This will allow for the acquisition of population-level motion trajectories that more closely reflect actual operating conditions and for the analysis of the influence of key operating parameters on wear distribution.
(3) To perform in situ mapping of a combine harvester header platform that has been in long-term service to obtain its actual wear profile. This will be combined with an analysis of wear images from various service intervals to determine the actual wear evolution path.
(4) To conduct a quantitative comparison of the geometric similarity among the analytical trajectory, the simulated trajectory, and the real-world wear profile. This will systematically validate the scientific hypothesis that “the flow trajectory determines the wear distribution” and will provide an in-depth exploration of the intrinsic connections and the reasons for the discrepancies among the three.
2. Models and Methods
To understand the motion of the rice stalk from first principles, this study simplifies the stalk as a rigid particle to analyze its forces and motion under the action of the spiral auger. The following analytical model, from Equation (1) to Equation (8), is derived based on the principles of rigid-body dynamics and friction theory to describe this process.
2.1. Analytical Model and Trajectory Prediction for Wear Distribution
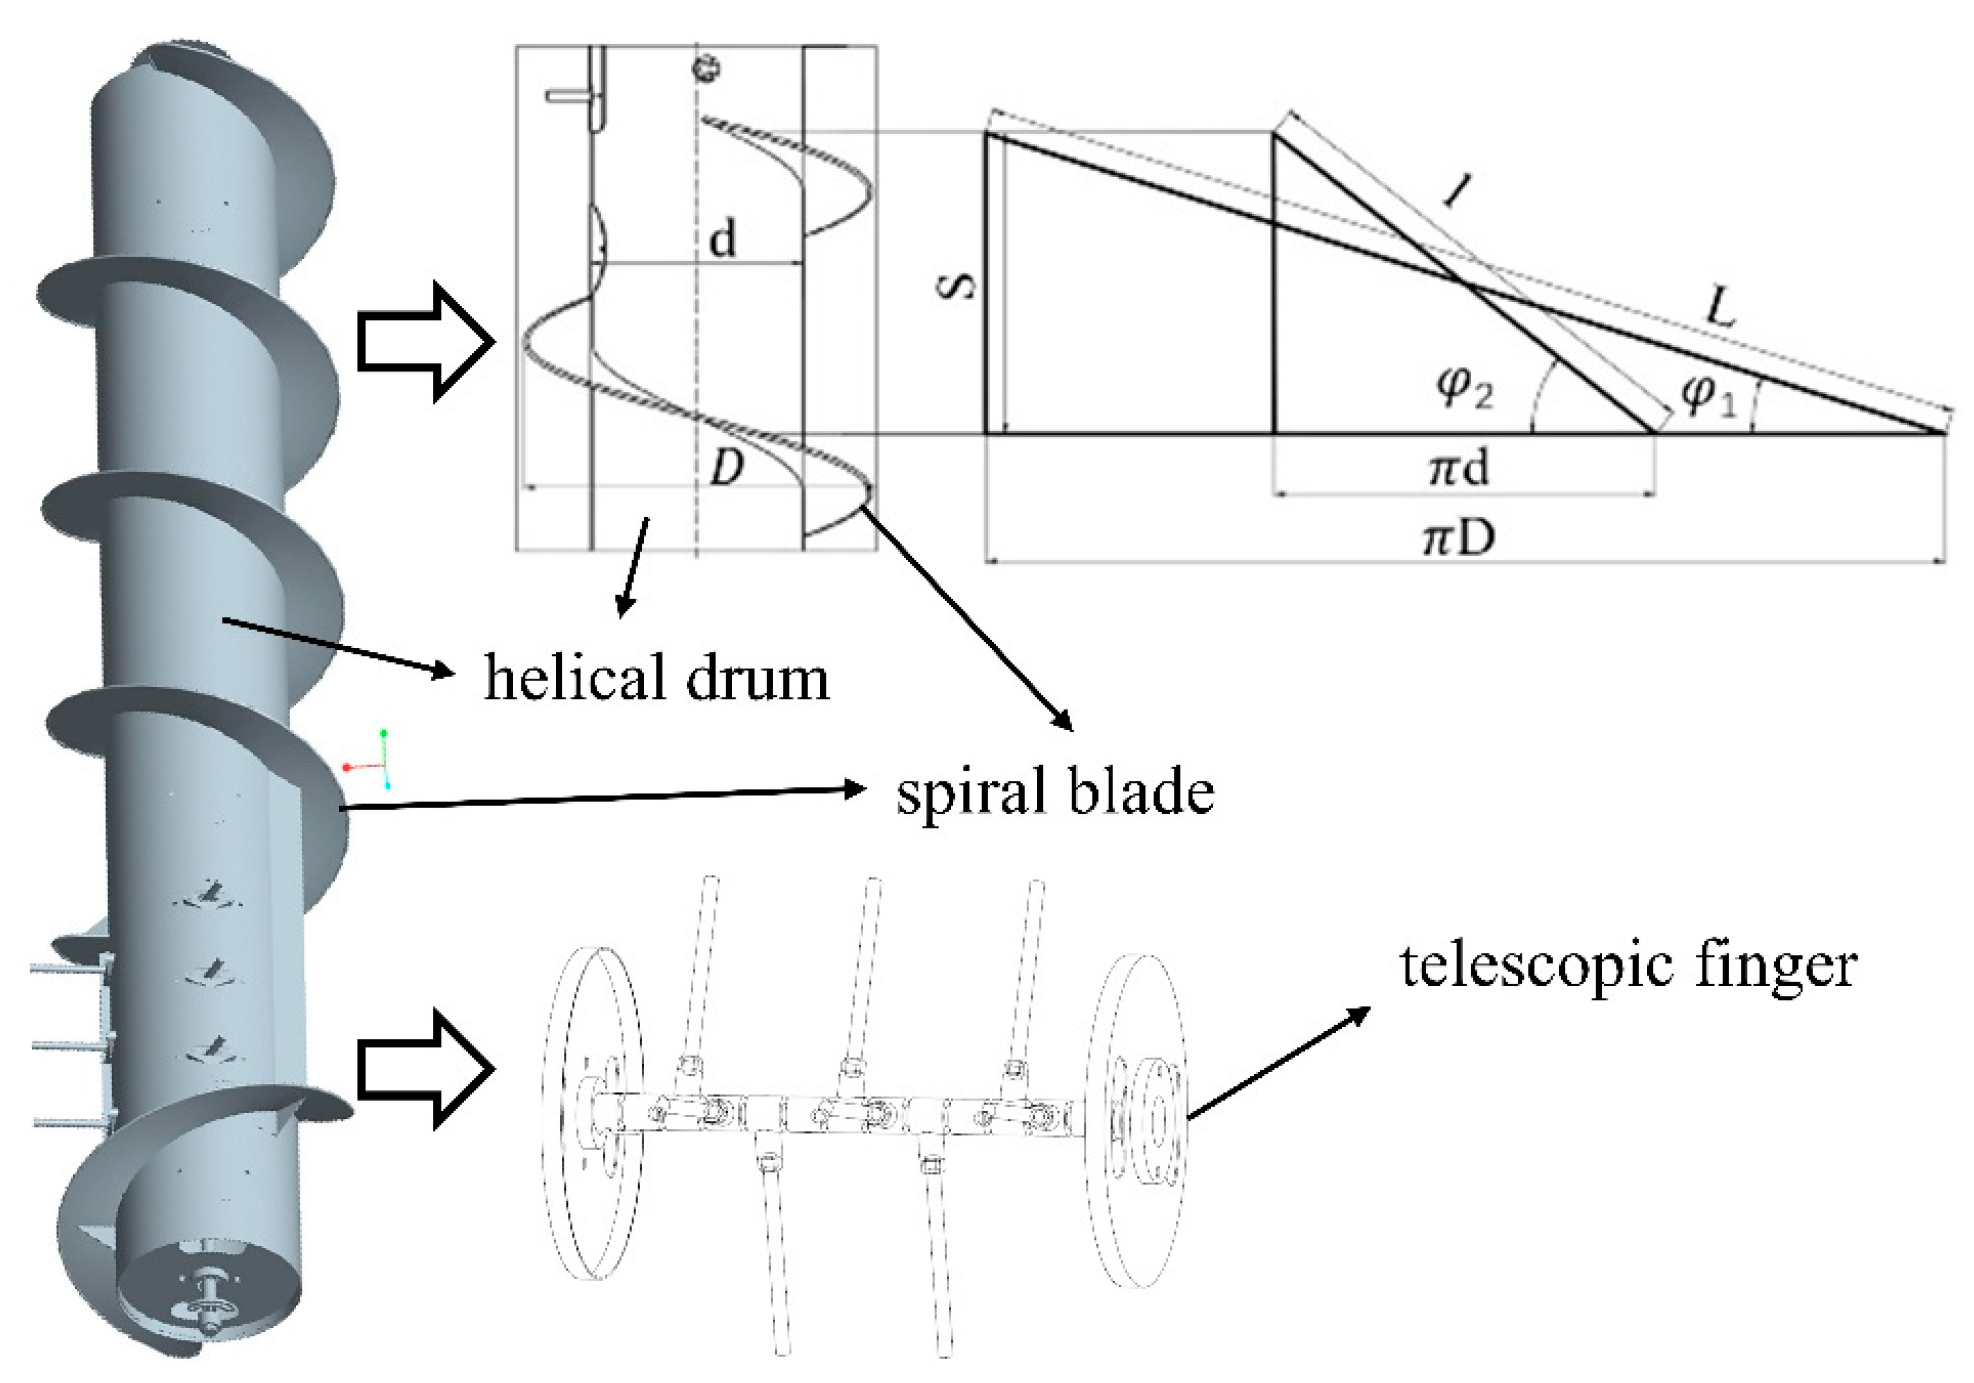
During the rotation of the spiral auger, its blades exert a normal thrust force
F1 and a tangential friction force
f1 on the rice stalk. The direction of the resultant force
F is offset from the normal by an angle
ψ due to friction (
Figure 2). This resultant force can be decomposed into an axial conveying force
FX and a circumferential force
FT, which is perpendicular to the auger’s axis. Similarly, the velocity
v of the rice stalk can also be decomposed into an axial velocity
vx (
Figure 2).
Based on the geometric relationships, the axial force (
FX) and the circumferential force (
FT) can be expressed as:
where
is the offset angle caused by friction, and
μ1 is the coefficient of friction between the stalk and the blade. From this, the axial velocity (
vx) and circumferential velocity (
vt) can be derived and expressed as:
where
S is the pitch,
n is the rotational speed of the auger, and
R is the distance from the stalk’s contact point to the central axis of the auger.
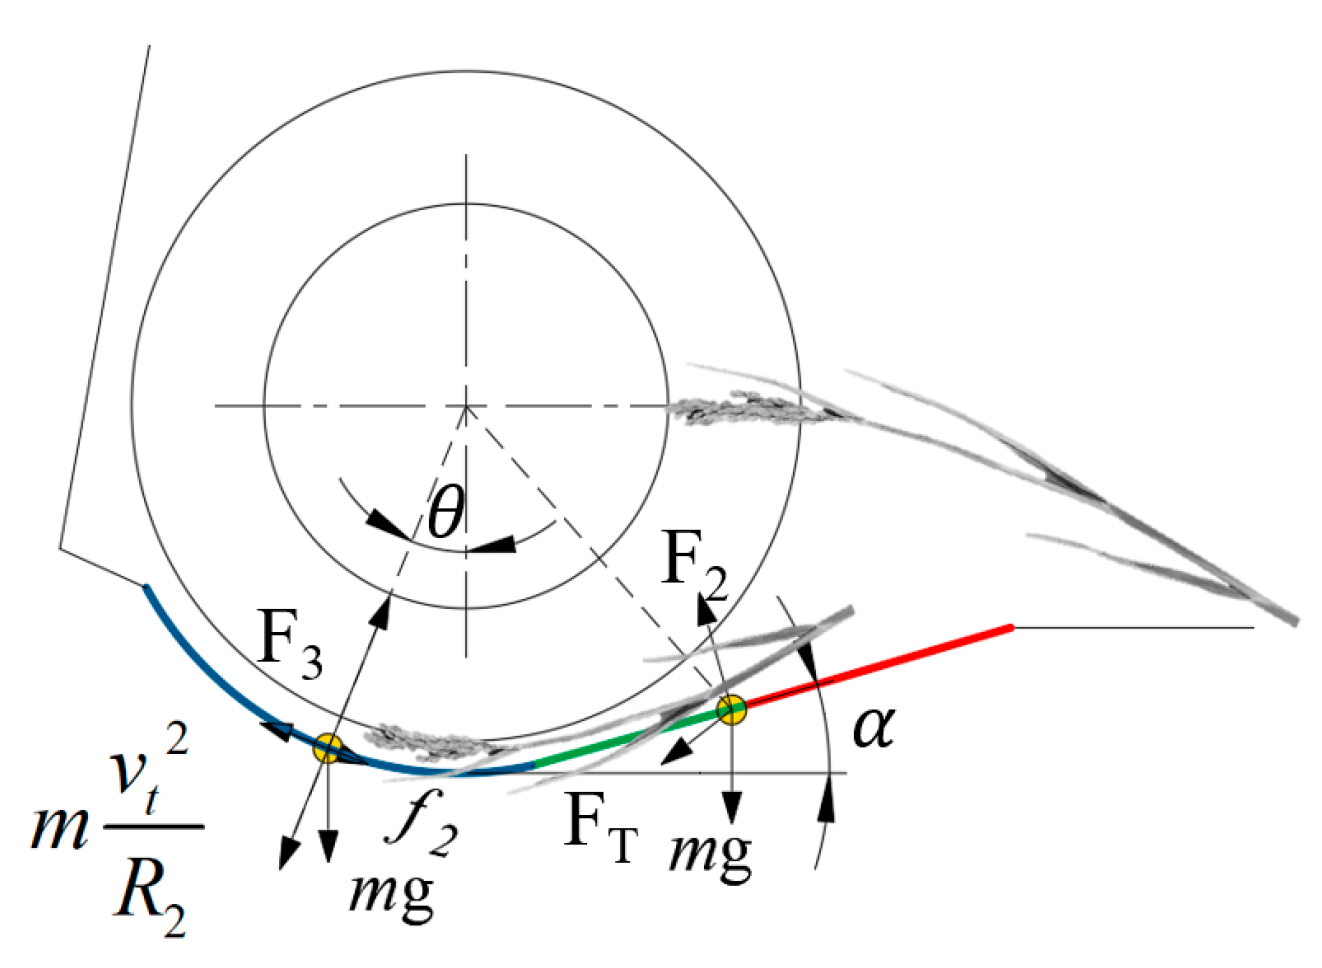
During the conveyance process, the rice stalk is concurrently subjected to a normal support force
F3 and a friction force
f2 from the bottom plate (arc section) of the header platform (
Figure 3). By comprehensively considering the stalk’s own weight (
mg), the centrifugal force, and all other applied forces, a differential equation of motion for the rice stalk in the circumferential direction can be established according to Newton’s second law.
The circumferential force provided by the spiral auger is:
The support force exerted by the bottom plate of the header platform on the stalk is:
The resultant tangential force acting on the stalk is:
According to Newton’s second law, the tangential acceleration of an object is produced by the resultant tangential force. This relationship can be expressed in its differential form as:
By combining the equations above, the final differential equation of motion that describes the variation in the rice stalk’s circumferential velocity (
vt) over time can be obtained (Equation (8)). The complete motion trajectory of the stalk on the bottom plate of the header platform can then be determined by numerically integrating this equation.
2.2. Discrete Element Model of the Header Platform-Rice System
A model of the combine harvester header platform, geometrically identical to the actual equipment, was created using SolidWorks 2019 (Dassault Systèmes, Vélizy-Villacoublay, France) 3D CAD software. It includes key components such as the header platform frame, the spiral auger, the bottom plate, and the back plate (
Figure 4). The primary dimensions of the model are: a cutting width of 2540 mm, a spiral auger outer diameter of 500 mm, and a pitch of 440 mm.
The rice stalks were represented using an advanced flexible particle model to accurately simulate their complex mechanical behaviors during the conveyance process, such as bending and torsion. This model consists of a series of spherical particles connected in a linear chain, with the particles bonded to each other via the Hertz–Mindlin with Bonding V2 contact model. This bonding mechanism enables the particle chain to resist tension, shear, bending, and torsion, thereby reproducing the flexible characteristics of a real stalk with high fidelity at the macroscopic level.
All key parameters used in the DEM model, including material properties (e.g., density, Poisson’s ratio), contact parameters (e.g., coefficients of friction and restitution), and the core bonding parameters that define flexibility (e.g., normal/tangential stiffness), were systematically calibrated using a hybrid approach. This approach combined a series of rigorous preliminary physical experiments (including inclined plane tests, uniaxial compression tests, and three-point bending tests) with numerical optimization via response surface methodology (RSM). The detailed calibration process and results have been published in our prior work [
35]. The use of these precisely validated parameters is fundamental to ensuring the accuracy of the subsequent simulation predictions.
To predict the wear distribution on the surface of the header platform within the DEM simulation, this study integrated the classic Archard wear model. This model is widely used to describe abrasive wear and is based on the fundamental assumption that the volume of material removed is proportional to the normal load and the sliding distance, and inversely proportional to the material’s hardness.
Within each simulation time step, the incremental wear depth on any given mesh element i of the header platform surface is calculated using the differential form of the Archard wear equation [
35].
where
K is the dimensionless wear constant, which represents the material’s resistance to wear. Based on the literature, the wear constant for the interaction between stalks and Q235 steel was set to 3 × 10⁻¹¹.
Pi is the average normal contact pressure (Pa) on the given mesh element. This value is computed in real-time by the DEM engine by averaging the normal contact forces from all particles acting on the element.
H is the Brinell hardness (Pa) of the softer material (in this case, Q235 steel).
Δsi is the average relative sliding distance (m) between the particles and the mesh element within the time step. This value is also tracked and computed in real-time by the DEM engine.
By accumulating the incremental wear depth on each mesh element throughout the entire simulation, a cumulative wear distribution map of the entire header platform surface can be dynamically generated. This method achieves a dynamic coupling between the macroscopic material flow dynamics and the microscopic surface wear evolution, making it possible to predict the “hot spot” regions of wear.
The simulation was conducted using EDEM 2020 software, with the key input parameters listed in
Table 1. The model setup and constraints were as follows: a particle factory was positioned 100 mm above the cutter bar, with a generation zone length of 2200 mm (to simulate full cutting width) and a width of 4 mm. This factory randomly generated 700 mm long flexible rice stalks at a rate of 800 stalks per second. To replicate the forward motion of the harvester and the initial state of the cut crop, the generated stalks were assigned an initial velocity of 1600 mm/s in the y-direction and −100 mm/s in the z-direction. As a crucial boundary condition to prevent unrealistic material blockage at the feeding channel outlet, two virtual ejectors with a linear velocity of 15,000 mm/s were implemented to remove conveyed material from the simulation domain. The total simulation time was set to 15 s to allow the system to reach a steady-state flow, and the baseline rotational speed of the spiral auger was set to 170 rpm. To investigate the influence of operating parameters, additional simulations were conducted with different rotational speeds (150 and 190 rpm) and cutting widths (1100 mm and 1650 mm).
2.3. Experimental Validation Method for Real-World Wear
To ensure the validity of the analytical model and the numerical simulation, this study employed a multi-faceted experimental approach to directly compare the predicted results with real-world physical phenomena. The methodology involved two key components: in situ mapping of the final wear profile and time-sequence analysis of the wear evolution process.
First, to obtain the actual wear data for quantitative comparison, a step-by-step in situ mapping of a harvester’s header platform was conducted. The procedure was as follows:
(1) An experimental subject was selected: a combine harvester of the same model used in the simulation, which had been in field service for approximately 1300 h.
(2) A measurement coordinate system was established on the header platform, with its origin at the intersection of the left side plate and the bottom plate’s front edge. The X-axis was aligned with the longitudinal axis of the spiral auger, and the Y-axis was defined perpendicular to the auger axis, pointing towards the rear.
(3) The macroscopic boundary of the wear region was meticulously sampled using a laser rangefinder (accuracy ± 1 mm) and a steel tape measure to record the coordinates of multiple key points.
(4) The collected point cloud data was imported into CAD software, and a smooth, digitized two-dimensional wear profile curve was generated by fitting a B-spline curve through the points (as shown in
Figure 5a). This “actual wear profile” served as the ground truth for geometric similarity analysis.
Second, to investigate the dynamic evolution of wear, a time-sequence analysis was performed. High-resolution images of header platforms from the same harvester model were collected at various service intervals (0 h, 400 h, 900 h, and 1400 h), all from harvesters operated under comparable conditions. By qualitatively comparing these images, the wear initiation point, expansion path, and high-wear zones were determined. Furthermore, a novel quantitative validation method based on corrosion color gradients was introduced. On a header with 1200 service hours, color segmentation tools in MATLAB 2024a (The MathWorks, Inc., Natick, MA, USA) were used to extract regions corresponding to different corrosion stages (e.g., bare metal, yellow rust, heavy rust), which serve as a natural proxy for wear severity and duration. These spatially distinct color zones were then compared against the spatio-temporal wear patterns predicted by the simulation.
Through a comparative analysis of the wear of the paint coating, the exposure of the metal substrate, and the changes in corrosion color (e.g., from silvery-white metal to yellow flash rust, and finally to reddish-brown heavy rust), the sequence of wear initiation, its expansion path, and the high-wear regions were qualitatively determined. This allowed for the construction of a complete spatio-temporal evolution path of the wear.
For a more in-depth quantitative validation of the wear sequence, this study introduces a novel time-sequence analysis method based on corrosion color. The corrosion process of Q235 steel in a field environment is accompanied by distinct color changes, which typically follow the progression: original paint color → exposed bare metal → yellow flash rust → reddish-brown heavy rust. This color gradient serves as a natural indicator for determining both the temporal sequence and the severity of wear. In this study, a header platform with approximately 1200 service hours was selected as a sample. Using color segmentation tools in MATLAB, color extraction was performed on its wear regions within the HSV/Lab color space to identify the areas corresponding to different stages of wear. This method was chosen over simple RGB thresholding because the HSV color space decouples color information (Hue and Saturation) from brightness (Value), making it more robust to variations in field lighting conditions during image capture. These identified regions were then used for a precise comparison with the spatio-temporal wear distribution predicted by the simulation.
3. Results and Discussion
3.1. Analysis of Analytical and Simulated Trajectories
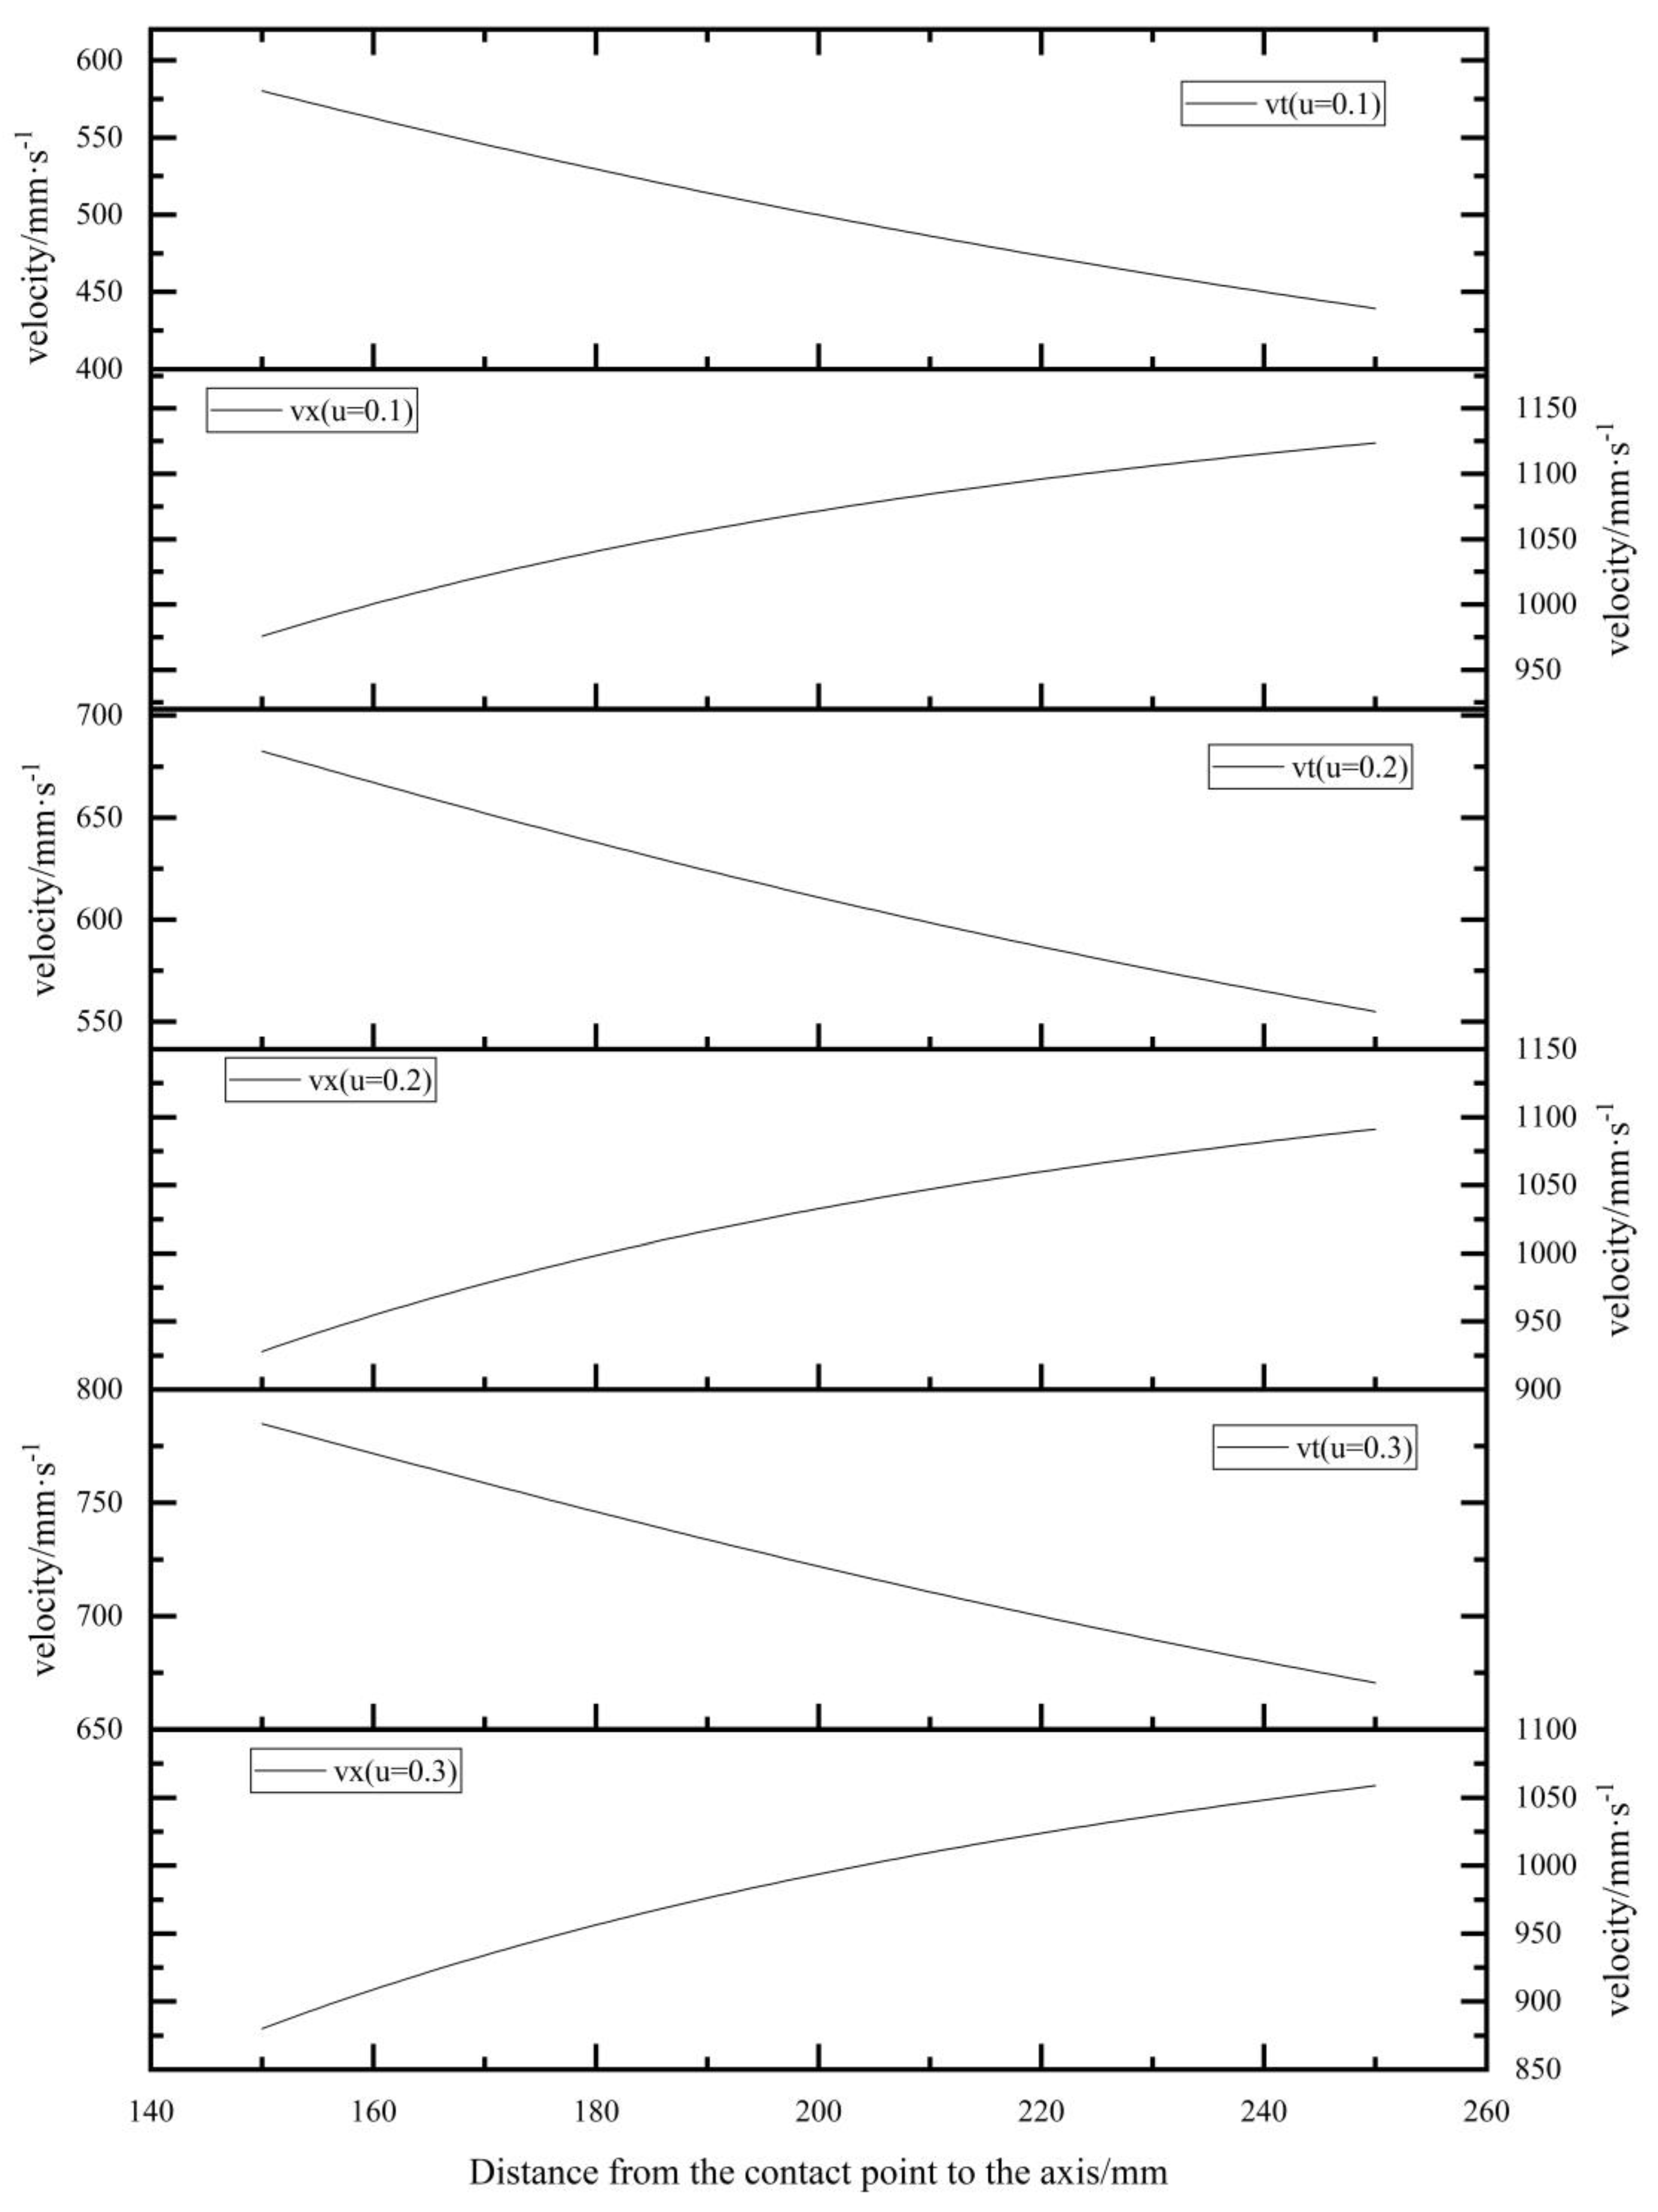
A numerical solution to the developed analytical model was obtained using MATLAB. The results (
Figure 6) indicate that the coefficient of friction has a significant impact on the conveying velocity of the stalk. When the friction coefficients between the stalk and both the auger and the bottom plate were reduced from 0.3 to 0.1, the axial conveying velocity increased from 1058.83 mm/s to 1123.59 mm/s, while the circumferential velocity decreased from 670.59 mm/s to 439.40 mm/s. This suggests that a reduction in friction is beneficial for improving conveying efficiency. This fundamental finding is in agreement with classic screw conveyor theory for granular materials, which also identifies friction as a primary factor limiting throughput [
36,
37]. However, our model provides a more nuanced view by incorporating the dynamics of a single, long body on a curved bottom plate, a departure from models that assume bulk flow or simplified particle shapes.
Figure 6.
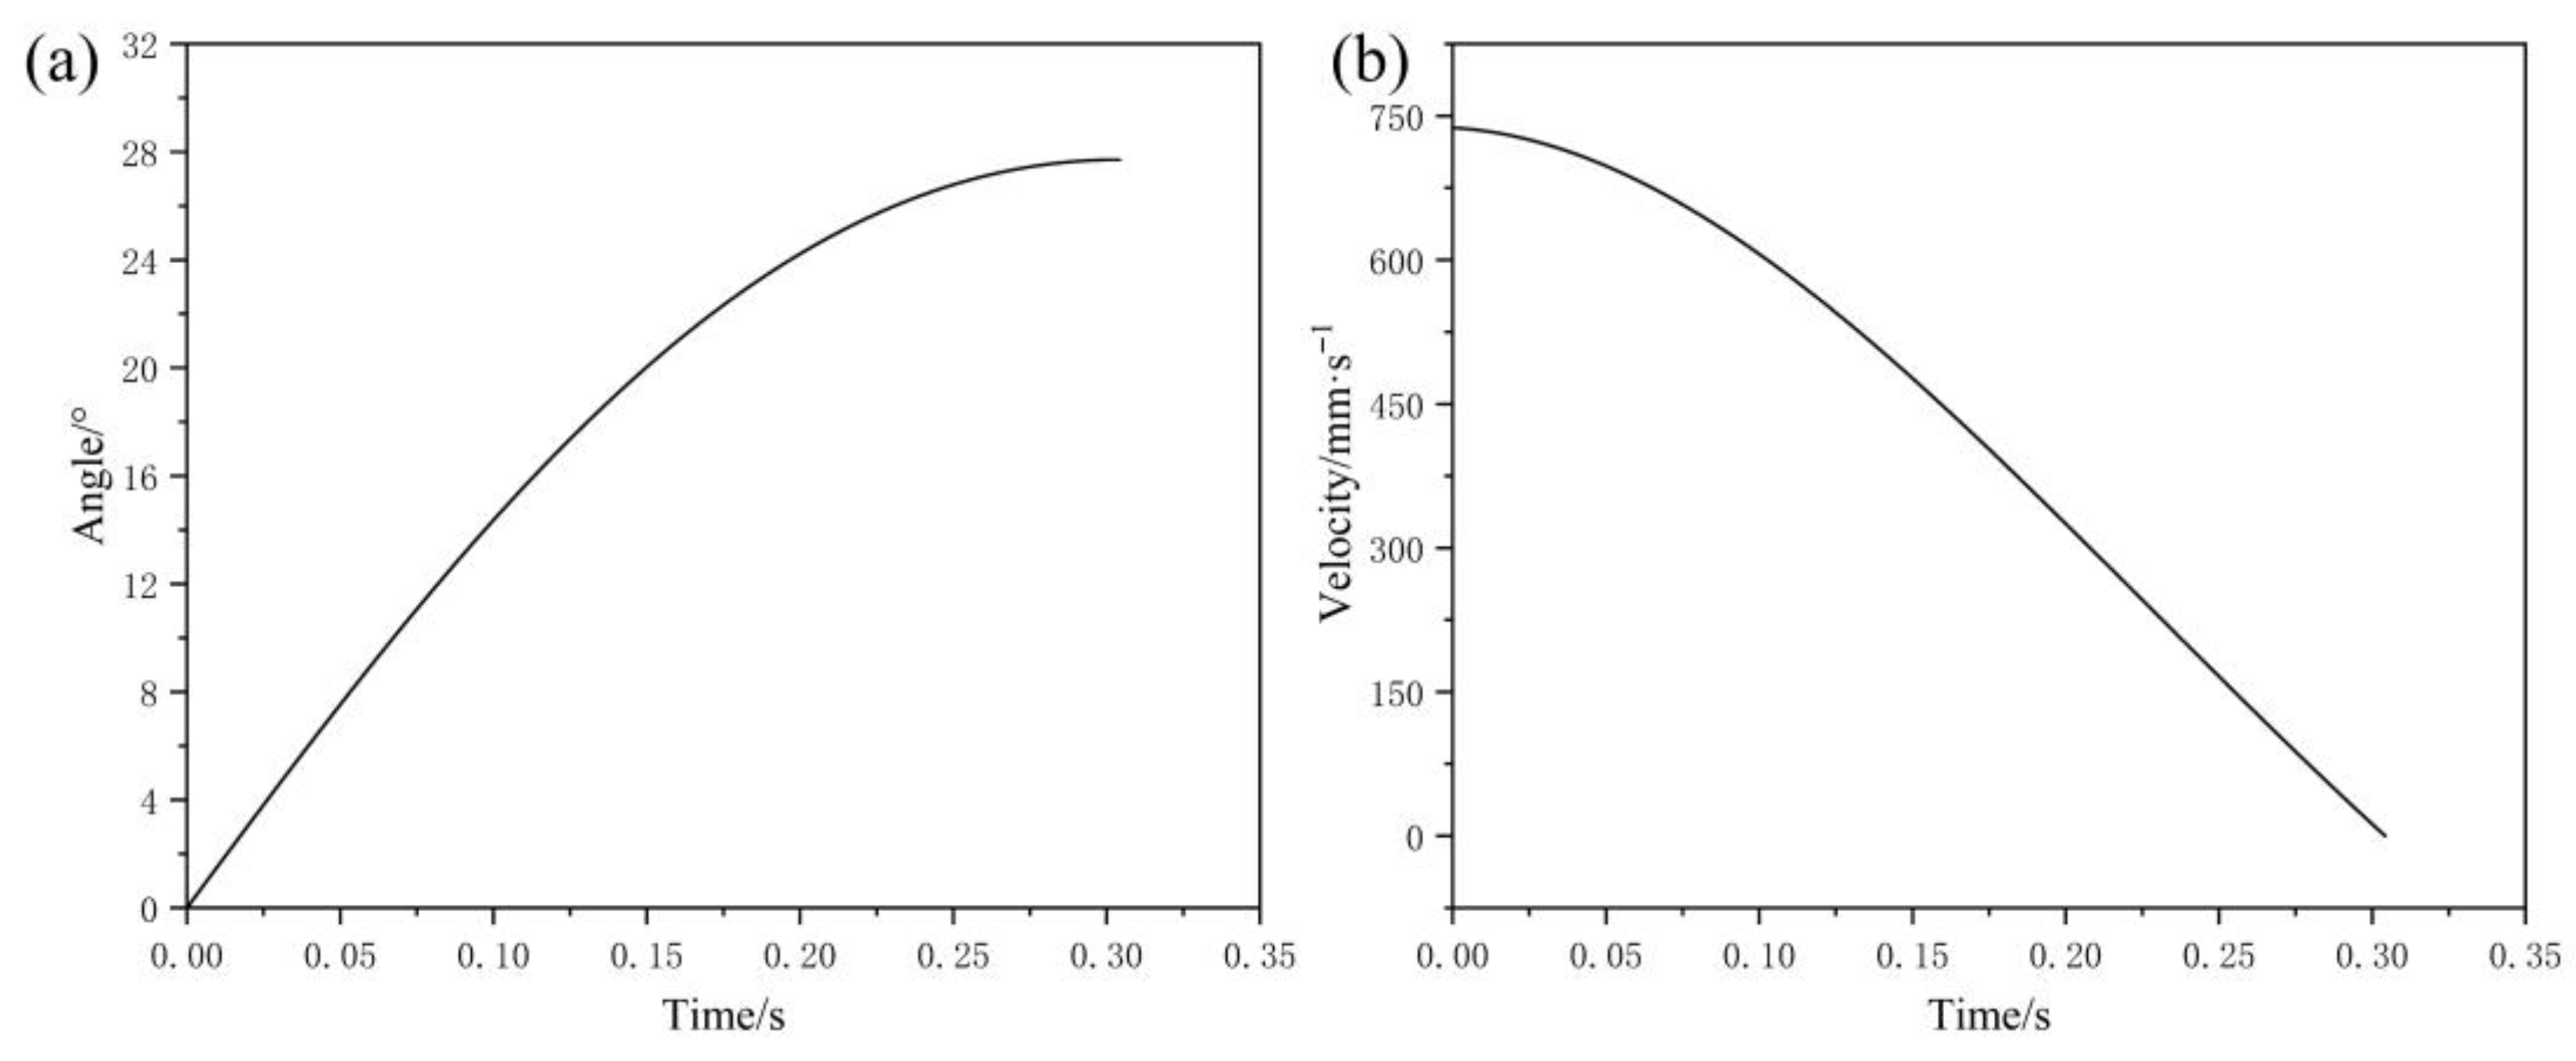
Analysis of Rice Flow Velocity under Different Friction Coefficients based on the Analytical Model. Based on the model parameters (auger speed: 170 rpm; pitch: 440 mm, etc.), the theoretical motion trajectory of the stalk’s center of mass was plotted, which presents as a smooth, parabolic-like curve that first ascends and then descends (
Figure 7).
By post-processing the DEM simulation results, the motion trajectory of the center of mass of a single stalk can be tracked.
Figure 8 illustrates the trajectories for the centers of mass of three stalks (a, b, and c) originating from different initial positions, tracked during the simulation period of 0.4 s to 0.6 s. It can be observed that once the stalks are captured by the auger blades, their trajectories rapidly converge and are conveyed axially. This convergence occurs because the rotating helical blade acts as a powerful dynamic constraint. Regardless of a stalk’s initial random position, upon contact, it is subjected to a dominant and consistently directed composite force from the blade, compelling it to follow the primary conveying path defined by the auger’s geometry and rotational motion.
Unlike the smooth curve of a single particle predicted by the analytical model, the simulated trajectories exhibit stochastic fluctuations. This is due to the collisions and compression from the surrounding stalk population, which more realistically reflects the characteristics of a bulk particle flow.
3.2. Influence of Key Operating Parameters on Wear Distribution
To investigate the effect of spiral auger speed on wear, simulations were conducted under three different operating conditions: 150 rpm, 170 rpm, and 190 rpm.
Figure 9 displays the wear depth maps at the 6-s mark for each speed. It is evident that the wear region primarily manifests as four distinct “high-wear regions.” As the rotational speed increases, both the depth and extent of wear show a general upward trend.
For instance, the maximum wear depth was 3.81 × 10
−5 mm at 150 rpm, and this value increased to 9.14 × 10
−5 mm at 170 rpm and 6.07 × 10
−5 mm at 190 rpm. This indicates that a higher rotational speed leads to a more intense frictional interaction. This trend is consistent with findings in the broader field of tribology, where increased sliding velocity and contact frequency are known to accelerate abrasive wear, even with hard abrasives like soil [
21]. Our results confirm that this principle also applies to the soft abrasive wear induced by flexible biomass. This is physically justified by the Archard wear model, where wear is proportional to both sliding distance and contact pressure. A higher rotational speed directly increases the total sliding distance per unit time. It also leads to more energetic collisions and greater compaction of the stalk population, which in turn increases the average normal contact pressure on the header surface, thereby accelerating material loss.
To explore the influence of the cutting width (which corresponds to the feed rate) on wear, simulations were performed under three conditions: half cutting width (1100 mm), three-quarters cutting width (1650 mm), and full cutting width (2200 mm). The wear maps in
Figure 10 show that as the cutting width increases, the number of wear “high-wear regions” significantly increases, and the wear region extends towards the right side of the header platform.
At half cutting width, wear is concentrated on the left side. When the full cutting width is reached, a significant wear band appears across the entire bottom plate of the header platform. This demonstrates that the feed rate and the distribution of the feeding points directly determine the coverage area of the wear. The justification is straightforward: wear can only occur where there is contact and relative motion between the crop and the surface. The cutting width defines the lateral extent of the incoming crop flow. A wider cutting width (higher feed rate) means a broader stream of material is conveyed across the header platform, naturally resulting in a correspondingly wider area of wear.
3.3. Comprehensive Validation of Simulation Predictions Against Real-World Wear
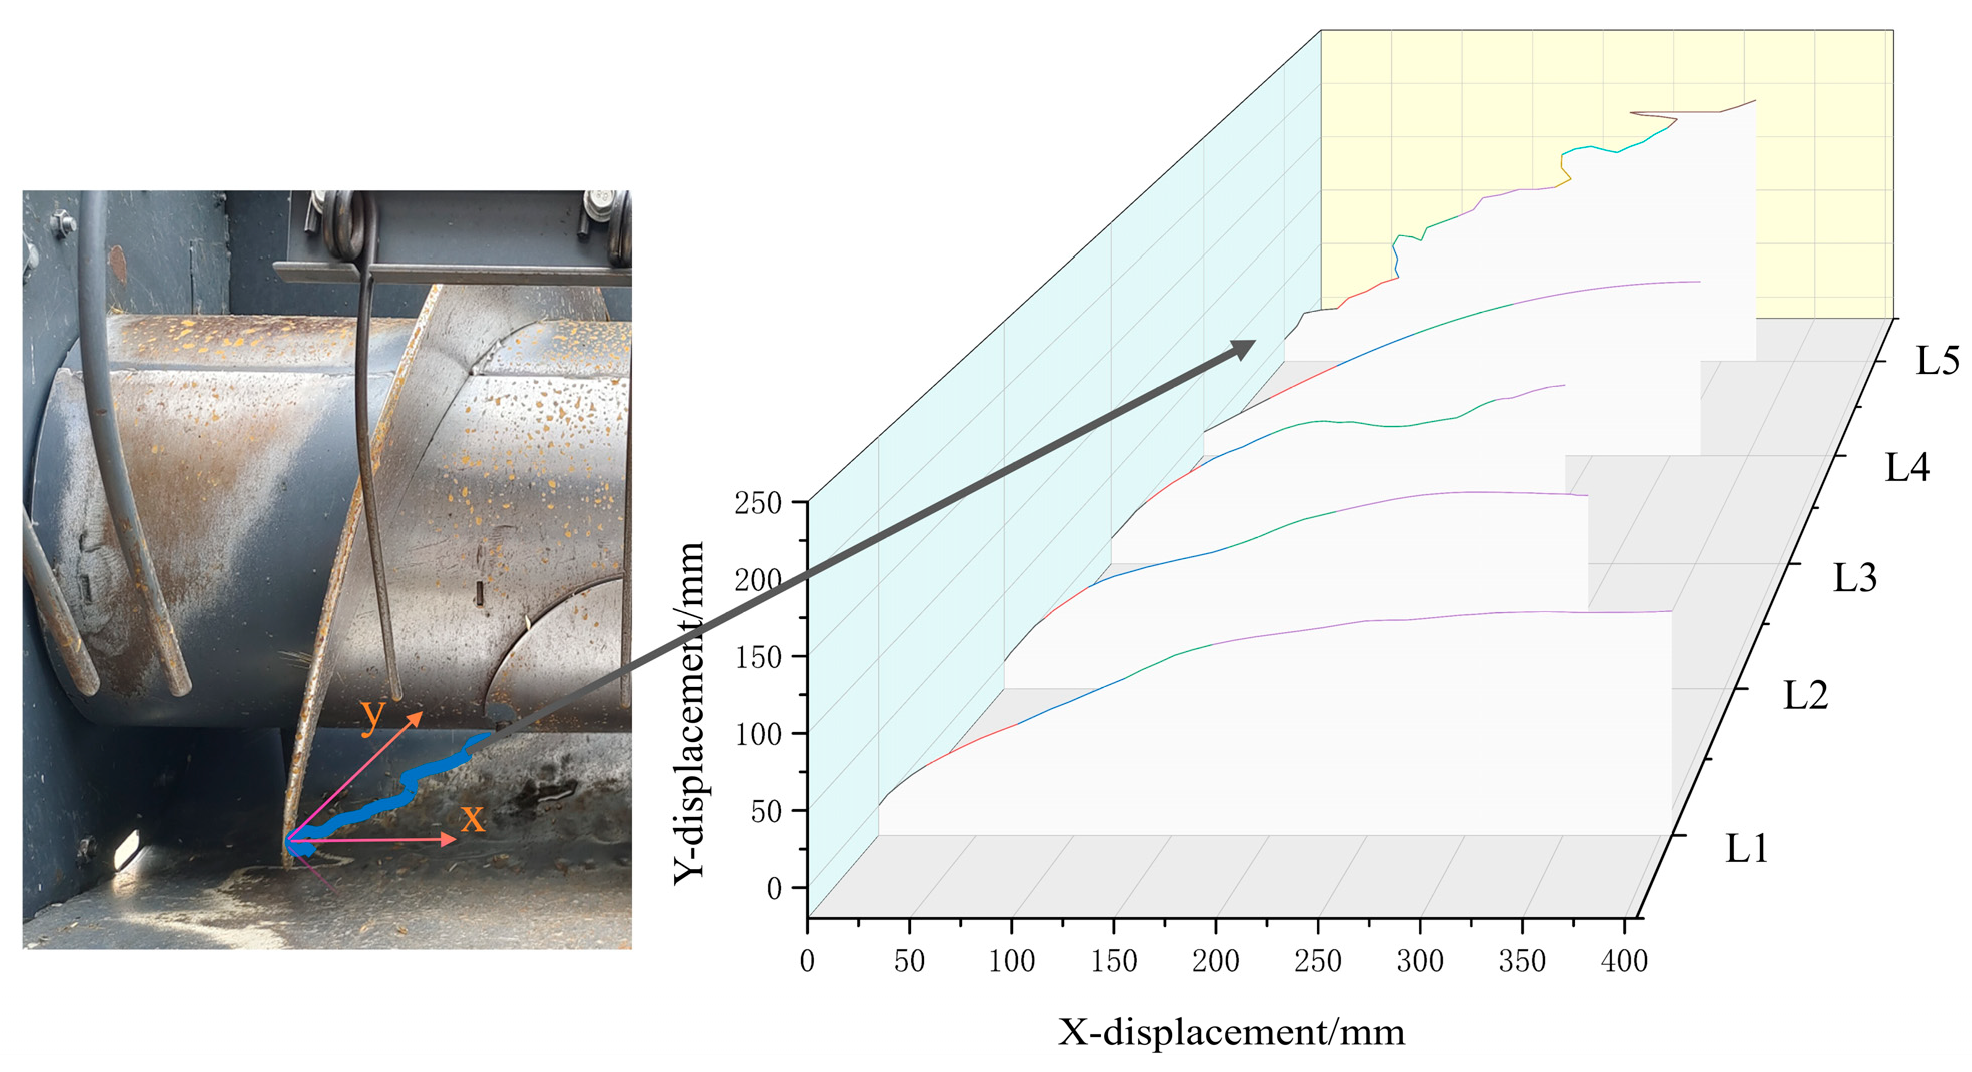
For a systematic validation, the analytical trajectory (L4), three representative simulated trajectories (L1, L2, L3), and the real-world wear profile mapped from the in-service equipment (L5) were plotted in the same coordinate system (
Figure 11).
A quantitative analysis shows:
(1) Comparison between Analytical and Simulated Trajectories: The simulated trajectories and the analytical trajectory exhibit a high degree of agreement in their macroscopic morphology and key turning points. The calculated Mean Squared Error (MSE) between them ranges from 0.4 to 6.2, indicating that the analytical model can accurately capture the core trend of the stalk’s motion.
(2) Comparison between Simulated Trajectory and Real-World Wear: The envelope formed by the simulated trajectories shows an extremely high consistency with the real-world wear profile in terms of overall shape, start/end positions, and peak regions. Evaluation using geometric similarity metrics yielded an Edit Distance of 0.14 (a metric that quantifies the minimum number of edits to transform one curve into another; lower values indicate greater similarity in local shape) and a Hamming Distance of 1 (a metric that compares the global structural sequences of two curves via a hashing algorithm; a value of 1 represents the highest similarity). Furthermore, a quantitative comparison of the areas enclosed by the simulated and actual wear profiles was conducted, revealing a relative error of only 4.9%, which corresponds to a 95.1% match in the overall wear area. This provides strong evidence that the DEM simulation can accurately predict the macroscopic wear regions.
(3) Comparison between Analytical Trajectory and Real-World Wear: The analytical trajectory shows a high degree of agreement with the real-world wear profile in certain areas (particularly in the initial wear section) but deviates after the peak region (MSE = 29.6376). This is primarily because the analytical model is an idealized, single-body model that does not account for the accumulation effect of the stalk population. In reality, a large amount of material accumulates at the end of the conveying path, which increases the wear width and depth, causing the wear profile to expand outward in this region.
Although the three curves are highly consistent at the macroscopic level, the subtle deviations between them reveal the complexity in progressing from the ideal to the real world. These deviations can be attributed to the following hierarchical factors:
(1) Sources of Deviation between Analytical and Simulated Trajectories: The analytical trajectory is a smooth curve, whereas the simulated trajectories exhibit noticeable fluctuations. This difference primarily stems from the single-particle assumption of the analytical model. The analytical model neglects the interactions within the stalk population, while the DEM simulation realistically captures group effects such as inter-particle collisions, compression, and friction. This leads to stochastic fluctuations in the trajectories, which more closely approximate the actual physical process.
(2) Sources of Deviation between Simulation and Reality: The boundary of the simulated profile is generally smoother than that of the real-world wear profile. This is mainly because the DEM simulation is conducted in an idealized environment and does not fully account for the complex factors of actual field operations. For example, real-world factors such as corrosion effects (caused by stalk juices and moisture), random scratching by hard impurities (e.g., soil, sand), and the synergistic effects of wear and corrosion all contribute to greater micro-scale irregularities and localized pits on the actual worn surface, making its profile more complex.
(3) Sources of Deviation between Analytical Model and Reality: The analytical trajectory aligns well with the real-world wear profile in the initial wear section but shows a significant deviation after the peak region (MSE = 29.6376). This is a composite result of the two previously discussed sources of deviation. The single-body assumption of the analytical model makes it incapable of predicting the material accumulation effect at the end of the conveying path. In reality, stalks gather in large quantities near the feeding channel outlet, increasing the contact pressure and the area of interaction. This leads to a significant increase in the width and depth of wear, causing the real-world wear profile to expand substantially outward in this region—a phenomenon that the simplified analytical model cannot predict. This accumulation phenomenon is a direct result of a “bottleneck effect” at the outlet. The feeding channel has a finite throughput capacity. When the spiral auger conveys material at a rate exceeding this capacity, the stalks physically pile up while waiting to be fed into the next component. This densification of the crop population inherently increases the contact pressure and interaction area against the header floor, leading to accelerated localized wear that a single-body model cannot capture.
In summary, through a hierarchical analysis of the sources of deviation, this study not only validates the accuracy of each model within its respective scope of applicability but also provides a deep understanding of the connections and differences between each model and the real world. This, in turn, allows for a more comprehensive assessment of the effectiveness and limitations of the research methodology.
3.4. Correlation Between the Wear Evolution Path and Trajectories
By analyzing the images of header platforms at different service intervals (
Figure 12), the evolution path of wear can be clearly observed. In the initial stages of operation (e.g., at 400 h), wear first appears in the material convergence zone—specifically, at the end of the spiral auger near the feeding channel outlet. This location corresponds exactly with the material’s terminal region as predicted by both the analytical and simulated trajectories.
As the service time extends (from 900 h to 1600 h), the wear region progressively expands from this point backward, against the direction of the analytical/simulated trajectories, towards the feeding side. Both the width and depth of the wear continuously increase. The final shape of the macroscopic wear band that forms is in good agreement with the predicted trajectories. This qualitative observation provides solid, real-world evidence for the thesis that the material flow trajectory is the primary determinant of the wear distribution.
To further validate the model from a spatio-temporal perspective, this section introduces a wear time-sequence analysis method based on corrosion color. The corrosion process of Q235 steel in a field environment is accompanied by distinct color changes, which typically follow the progression: paint color → exposed bare metal (silvery-white) → yellow flash rust → reddish-brown heavy rust. This color gradient serves as a natural indicator for determining both the temporal sequence and the severity of wear.
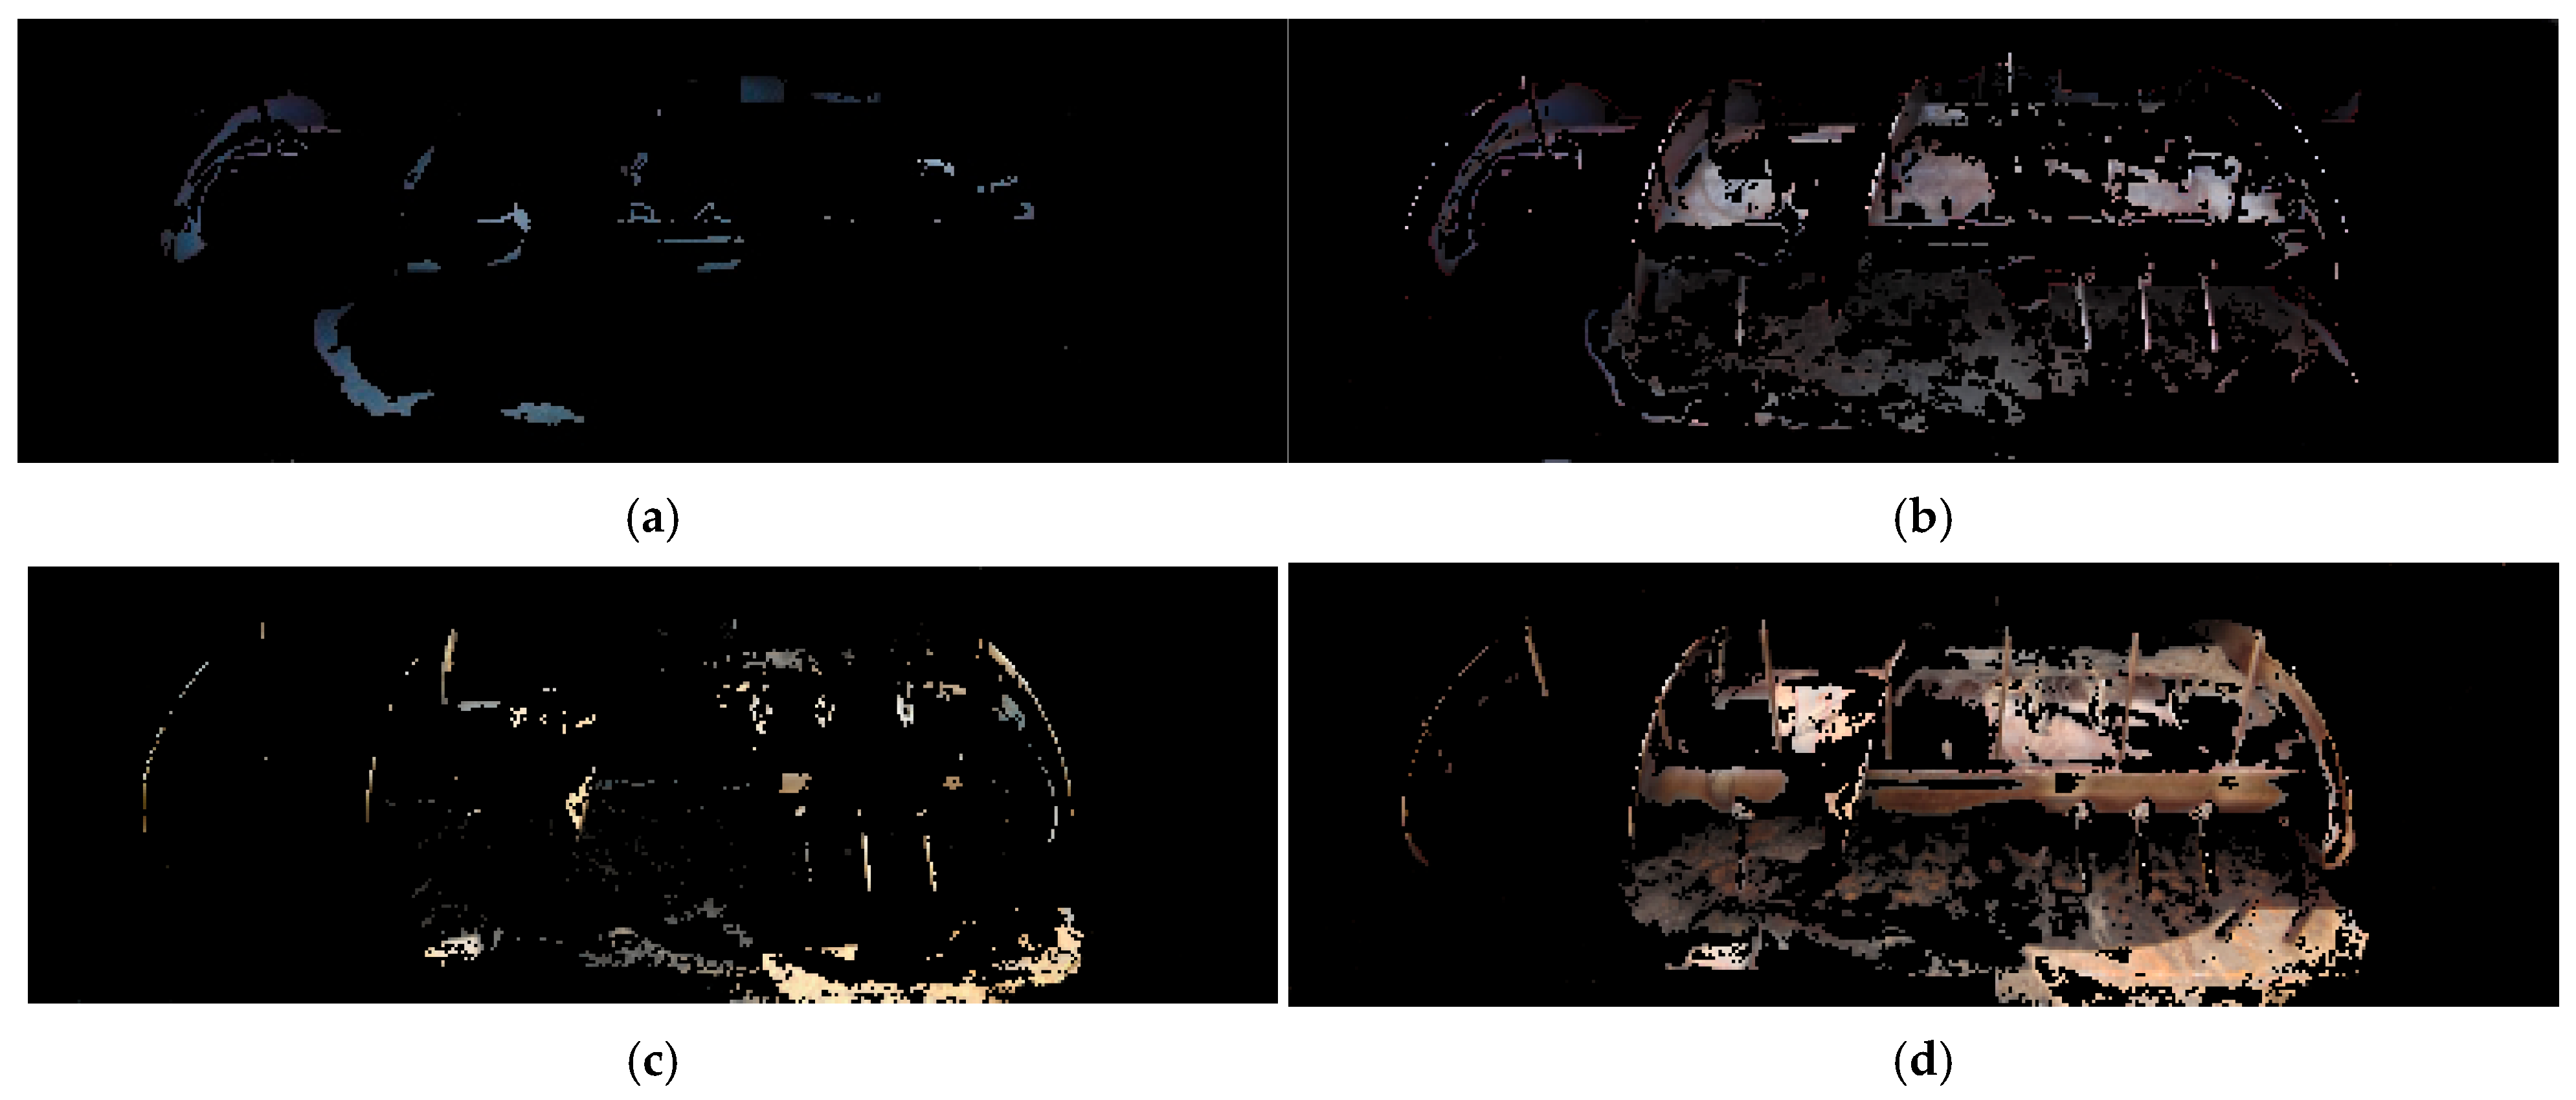
In this study, MATLAB was used to perform color segmentation on an image of a header platform that had been in service for approximately 1200 h (
Figure 13). The specific methodology was as follows: first, the image was converted from the RGB color space to the HSV (Hue, Saturation, Value) color space, which provides a more distinct separation of color, saturation, and brightness. Then, by defining precise H, S, and V threshold ranges for blue (paint), grayish-black (bare metal), yellow, and rust-red, the image was binarized. This process allowed for the quantitative extraction of the pixel regions corresponding to different stages of wear.
The results of the color segmentation are presented in
Figure 14. The analysis reveals the following:
(1) Validation of the Core Wear Region: The rust-red region (
Figure 14d), which represents the area where wear initiated earliest and is most severe, is concentrated below the axis of the spiral auger, near the feeding channel outlet and the retractable fingers. This spatial distribution perfectly matches the region of initial wear shown in
Figure 12b and is also in good agreement with the wear “high-wear regions” predicted by the DEM simulation and the terminal region of the analytical trajectory. This once again validates the accuracy of the model in predicting the core wear region.
(2) Validation of the Wear Initiation and Expansion Zone: The blue region (
Figure 14a), representing the remaining paint coating or the area where wear occurred last, is primarily distributed along the outer contour of the wear band. This area corresponds to the final boundary of wear expansion shown in
Figure 14d and also aligns with the initial segment of the analytical trajectory.
(3) Spatio-temporal Evolution Validation: The spatial distribution gradient from blue → grayish-black → yellow → rust-red (
Figure 14) clearly illustrates the wear evolution path from the periphery to the center and from the feeding end to the conveying end. This “color snapshot” of the final state perfectly encapsulates the entire dynamic evolution process shown in
Figure 12. It provides strong, real-world evidence for the core thesis that “the flow trajectory determines the wear distribution,” not only from a spatial dimension but also from a temporal evolution dimension. This further enhances the credibility of both the analytical model and the numerical simulation.
3.5. Microscopic Wear Mechanism Analysis
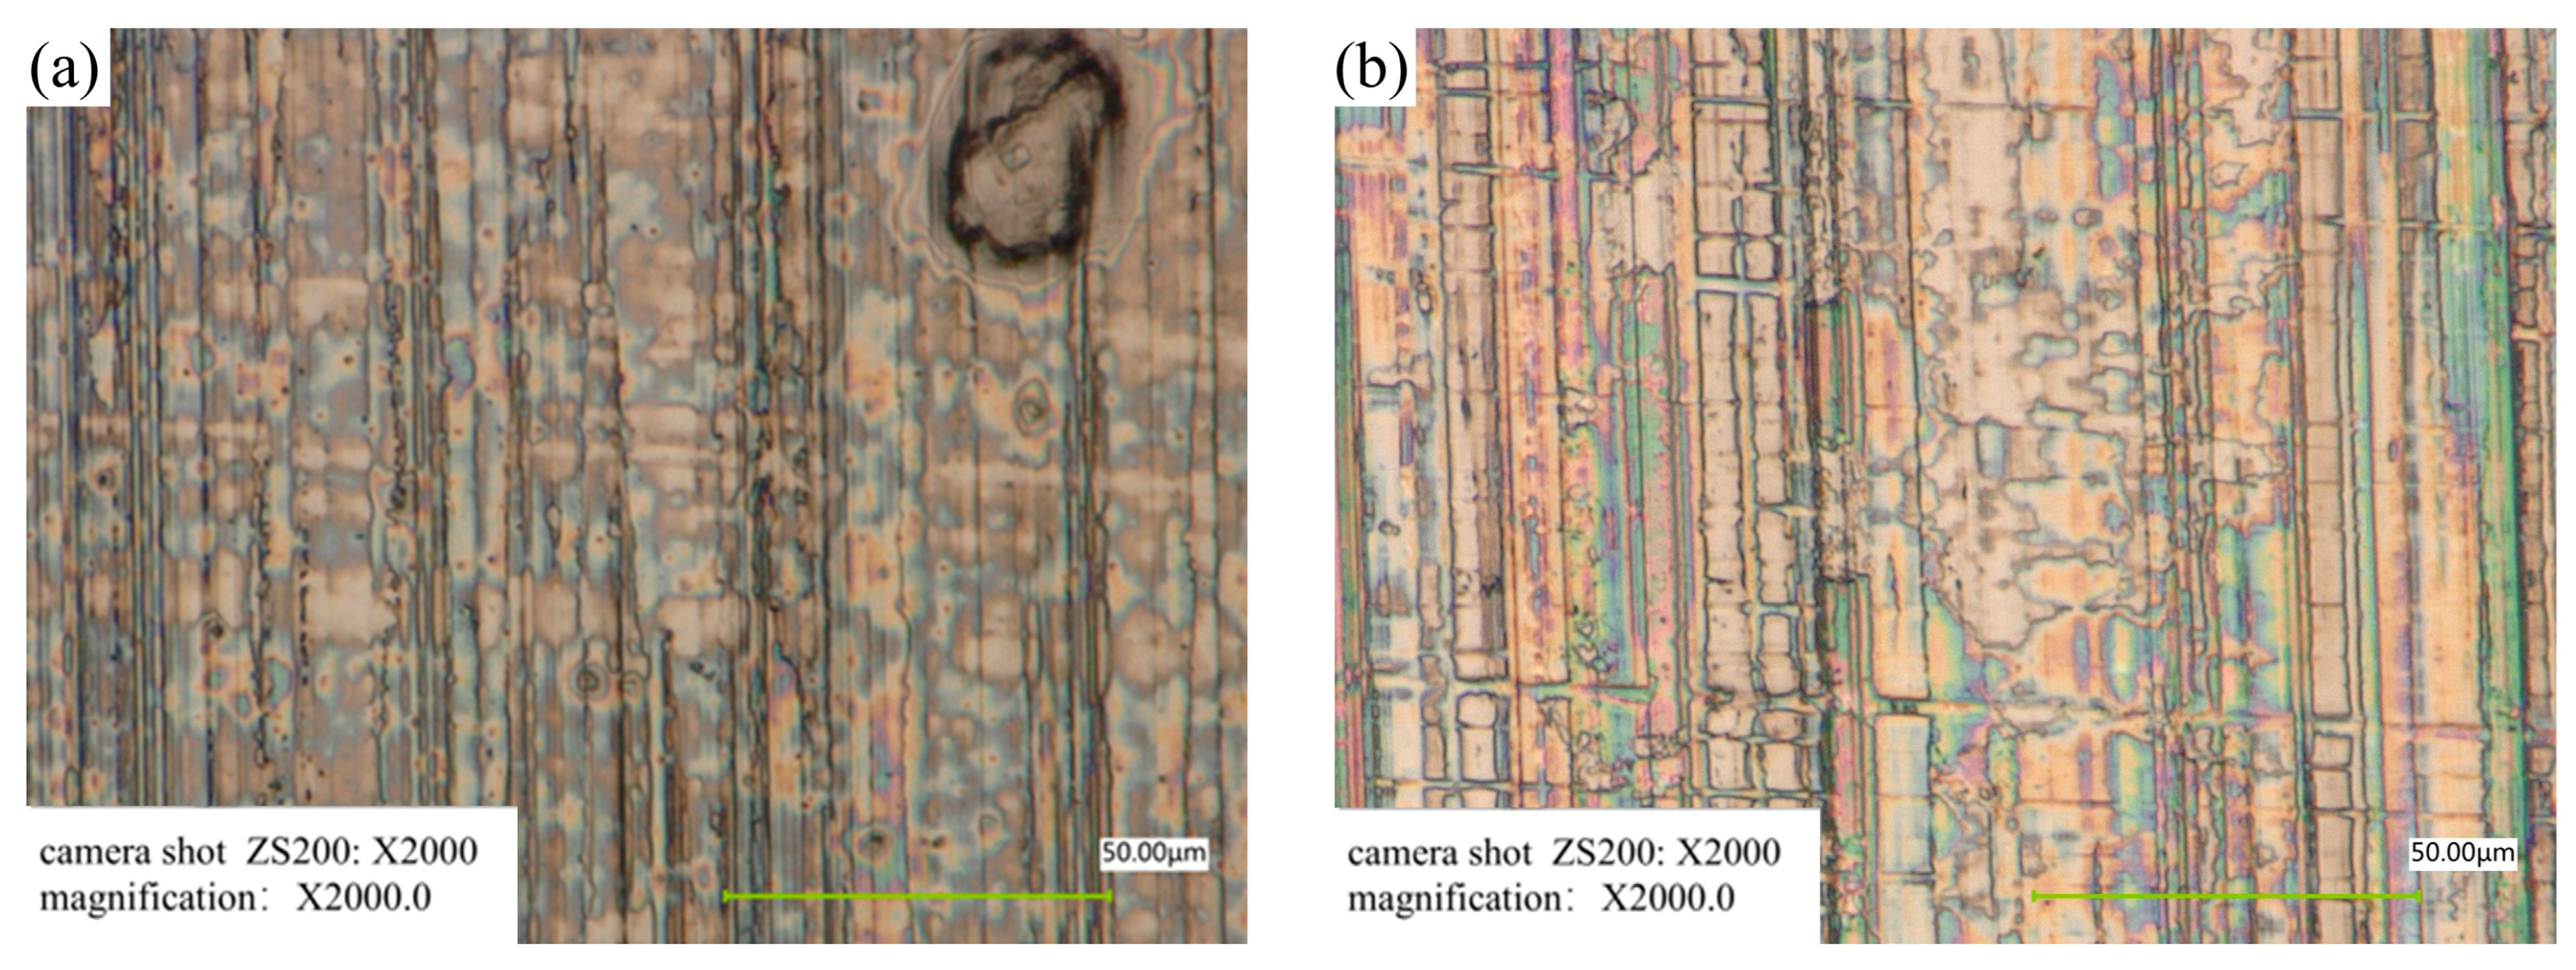
Beyond the macroscopic wear profile, an investigation into the microscopic surface topography was conducted to identify the underlying wear mechanisms. Samples from wear tests (as described in the thesis source material) were observed using a high-magnification 3D microscope (Keyence VHX-900f, Keyence Corporation, Osaka, Japan) to analyze the surface features under different conditions.
Figure 15 illustrates the distinct wear morphologies observed.
Figure 15a, from a test under mild conditions (low load and speed), shows a surface with an iridescent sheen from the transferred waxy layer of the straw and minimal deep grooves. This morphology is characteristic of mechanical polishing, where softer organic components smooth the surface. In contrast,
Figure 15b, from a test under severe conditions (high load and speed), reveals distinct, parallel plowing grooves and scratches. These features are indicative of soft abrasive wear, caused by harder silica particles on the surface of rice stalks and entrained soil particles, which actively remove material. These microscopic observations provide direct physical evidence that the overall wear on the header platform is a combination of mechanical polishing and soft abrasive wear, with the latter mechanism becoming dominant under more intense operating conditions.
4. Conclusions
This study systematically investigated the relationship between rice flow trajectories and wear distribution on a combine harvester header platform by integrating an analytical model, numerical simulations, and experimental validation. The key findings are:
(1) An analytical model based on rigid-body dynamics was successfully developed to predict the fundamental motion trajectory of a single rice stalk. This model effectively captures the influence of key parameters, such as friction, on conveying velocity.
(2) A high-fidelity DEM simulation of the flexible rice stalk population confirmed the macroscopic trends predicted by the analytical model (MSE: 0.4 to 6.2) while also capturing complex group effects. The simulation correctly predicted that higher auger speeds intensify wear, and wider cutting widths expand the wear area.
(3) A three-way comparison validated that both the analytical and simulated trajectories accurately predict the location and shape of real-world wear. The DEM simulation showed a high degree of geometric similarity to the actual wear profile, with a 95.1% match in the overall wear area (Edit Distance: 0.14). This strongly supports the core hypothesis that the material flow trajectory is the primary determinant of wear distribution.
(4) A novel validation method using time-sequence wear images and corrosion color gradients confirmed that the wear initiation and expansion path directly follows the material conveyance trajectory. The integrated “analytical–simulation–experimental” paradigm developed here provides a robust and generalizable methodology for wear prediction and service life extension in agricultural machinery.
5. Significance and Future Work
The significance of this research is primarily reflected in two aspects:
(1) Theoretical Significance: This study systematically validates the core scientific hypothesis within the field of Agri-tribology that “the material flow trajectory is the key determinant of macroscopic wear distribution.” By establishing a multi-level modeling approach, from first principles to complex system simulation, and integrating it with experimental validation, this research deepens the understanding of the interaction mechanisms between flexible biomass and metal components in agricultural applications.
(2) Practical Significance: The experimentally validated DEM-wear simulation model developed in this research can serve as an efficient and cost-effective digital tool for both design optimization and operational guidance. For manufacturers, the model can be utilized in the early design stages to predict the impact of different structural parameters (e.g., auger lead angle, blade shape) on wear. This enables the optimization of structural designs, reduces the need for expensive physical prototyping and long-term field trials, and accelerates the development process for a new generation of highly wear-resistant products. Furthermore, the findings from this study translate directly into practical recommendations for end-users to minimize wear during field operations:
Optimal Operating Mode Selection: Our results confirm that wear intensity is highly sensitive to operational parameters. A key practical recommendation is to operate the spiral auger at the lowest possible speed that still ensures adequate material flow without causing blockages. This represents a critical trade-off between maximizing component lifespan and maintaining operational efficiency.
Wear-Balancing Harvesting Strategy: Given that wear is heavily concentrated in the central material convergence zone, operators can adopt a “wear-balancing” strategy, such as alternating the use of the left and right halves of the header where possible. This approach helps to distribute wear more evenly across the platform, thereby extending the overall service life before critical failure.
Targeted Maintenance: The model’s ability to predict high-wear “hot spots” provides a scientific basis for proactive and targeted maintenance, such as reinforcing specific areas or applying wear-resistant coatings, rather than performing uniform or reactive maintenance.
Although this study has made significant progress, there are several avenues for further expansion. To address the more complex conditions of real-world scenarios, future research could focus on the following areas:
① Development of a Mixed-Abrasive Wear Model: The current model primarily focuses on the soft abrasive wear caused by rice stalks. Future research could incorporate hard abrasive particles, such as soil and sand, into the DEM simulation to develop a coupled “soft-hard” mixed-abrasive wear model, which would more comprehensively simulate the actual field wear environment.
② Model-Based Structural and Material Optimization: Leveraging the validated simulation model from this study, systematic parametric studies can be conducted to optimize the key structures of the header platform (e.g., auger lead angle, blade curvature). Furthermore, the mechanical and wear parameters of different wear-resistant materials or coatings could be introduced into the model to virtually assess their protective performance, providing a scientific basis for the application of novel materials.
③ Construction of a Corrosion-Wear Synergistic Effect Model: The actual field environment is characterized by high humidity, and stalk juices can be corrosive. Future research could explore the coupling of corrosion kinetics models with the DEM-wear model to develop an integrated model capable of simulating the synergistic effects of corrosion and wear, thereby achieving a more accurate prediction of the header platform’s service life.
