Abstract
The wire drawing process, used for both ferrous and non-ferrous metals, employs different machines depending on the material and wire diameter: breakdown, single- or multi-wire machines for non-ferrous, and bull block machines for ferrous and non-ferrous alloy wires. In all cases, wire is drawn through dies by tensile forces, with die design, material, and lubrication crucial for reducing friction, dissipating heat, and ensuring quality. Die type and geometry, lubricant, drawing speed, and machine configuration are the main process variables. The present work evaluates the effects of die type, lubricant, and drawing speed on Zn–Al alloy wire drawing (Ø2.18 to Ø2.00 mm) using a Taguchi L9 (33) design of experiments. Three lubricants (Multidraw oil/water, Multipress oil and water/oil emulsion), three dies (conventional, carbide 19.38-grade pressure die, carbide H3F-grade pressure die), and three drawing speeds (0.16 to 0.28 m/s) were tested. Results have shown that lubricant and die geometry dominate process performance. Pressure dies reduced drawing force by up to 8% versus the conventional die, and emulsion increased force by 14% compared to oils. Output wire temperatures increased with speed, peaking at 46.5 °C with water emulsion oil and pressure die with H3F carbide, while Multidraw oil kept values ~20% lower. However, emulsions lowered the die output temperatures by 15–25% compared to oils. The coefficient of friction averaged μ = 0.104, with pressure dies yielding the lowest values (0.091–0.096, ~20% below conventional). Surface quality was governed mainly by lubricant effectiveness, with pressure-drawing dies ensuring dimensional accuracy and surface cleanliness. The study identifies lubricant selection as the most influential factor, followed by die type, providing a basis for optimizing efficiency and product quality in the wire drawing of ZnAl15% alloy.
1. Introduction
Zinc–aluminum alloys are commonly used as coatings for steel to provide corrosion protection, as zinc resists alkaline corrosion, while aluminum is resistant to acidic and neutral environments. Thus, previous works have corroborated that the corrosion rate of the Zn-Al coatings decreases as the Al content increases [1,2]. Conversely, ZnAl15% alloy has shown the highest microhardness and tensile strength with excellent corrosion resistance and the best wetting ability [2,3]. In addition, Zn–Al alloy coatings offer better mechanical performance than pure zinc coatings, with ZnAl15% being the most widely used alloy in regions with highly corrosive environments, such as maritime environments.
ZnAl15% alloy (85% Zn–15% Al) consumable wire for thermal spraying is produced by continuous casting of rods, followed by hot rolling [4,5] and multi-stage wire drawing to final diameters of 1.6–3.2 mm. Drawing is carried out through tungsten carbide or polycrystalline diamond dies with lubricants such as oils, emulsions, or powders to limit friction and heat, after which the wire is spooled, cleaned, and surface-protected against oxidation. Moreover, the wire drawing process faces several challenges: the alloy’s softness and stickiness increase the risk of adhesion to dies and unstable drawing conditions; lubricant choice strongly affects friction, force stability, and surface contamination; the low melting point (~380 °C) requires strict thermal control to avoid softening or breakage. Additionally, tight dimensional tolerances (±0.05 mm) must be maintained for spray-gun feedability, and surface cleanliness is critical, as residual oxides or lubricant films compromise later spraying performance.
The geometry of the drawing die is critical in wire drawing, as it determines the inlet and exit diameters and affects the distribution of stress and lubrication in the reduction zone. Conventional dies are commonly made of tungsten carbide and natural, synthetic, or polycrystalline diamond (PCD), which provide high wear resistance and excellent performance in demanding conditions. Currently, the market offers more advanced solutions with the design of hydrodynamic drawing dies. While in a conventional drawing die, the lubricant acts by gravity or inertia, hydrodynamic wire drawing dies are specialized tools designed to reduce friction and heat during the drawing of metals, particularly soft or non-ferrous alloys such as ZnAl15%. Unlike conventional dies, hydrodynamic dies feature an internal design that facilitates the injection of the lubricant media—oil, emulsion, or synthetic fluid—at high pressure through the die. As the wire passes, the relative motion generates a pressurized fluid film that separates the wire from direct die contact, significantly lowering the friction coefficient, reducing drawing forces, and minimizing wire and die temperatures. This mechanism also improves surface quality and extends die life by preventing local overheating and tool wear. As recent studies have demonstrated [6,7], hydrodynamic dies are especially advantageous for high-speed drawing or materials prone to sticking, providing enhanced process stability and product quality compared to standard lubrication methods [8]. Thus, several key recent studies addressed advanced lubrication strategies and the influence of the die design in non-ferrous metal wire drawing.
Liquid superlubricity refers to a state of ultra-low friction achieved with specific liquid lubricants, minimizing wear and energy loss. In wire drawing, where high friction occurs at the die–wire interface, liquid superlubricity can reduce drawing force, decrease tool wear, and improve the surface quality of the drawn wire, resulting in smoother, defect-free products. According to Han et al. [9], superlubricity can be achieved using water-based solutions, oil-based lubricants, or hydrated materials, among others. Thus, wire drawing with hydrodynamic–pressure dies could improve this condition by reducing friction and drawing force compared to conventional lubrication that occurs with standard drawing dies. Overall, optimizing lubricity in wire drawing offers a pathway to higher-quality wires, longer die life, and more energy-efficient, sustainable production. In this way, hydrodynamic lubrication occurs when a continuous fluid film fully separates the wire and drawing die, minimizing friction and wear, and being more effective at high drawing speeds, supported by suitable lubricant viscosity, die geometry, and surface finish. On the contrary, at lower speeds, the film becomes thinner, leading to mixed or boundary lubrication with increased friction. However, using high-viscosity lubricants, longer die angles, and pre-coated wires can help evaluate partial hydrodynamic effects and lubrication performance. Previous works that have been consulted have concluded that, at low values of drawing speed, the reduced drawing stress is lower when larger die semi-angles are used, while the exact opposite is valid at higher values of drawing speed [7,10,11]. Thus, even if medium drawing speeds are used, it is possible to achieve better lubrication conditions when the viscosity and the semi-angle are optimal.
Previous works that have been consulted addressed the study of wire drawing under hydrodynamic conditions. Prisco et al. [7] analyzed the effect of die pressure on the lubricating regimes achieved in the wire drawing of ETP copper, varying drawing speeds between 1 and 22 m/s, and comparing die semi-angles between α = 6° and 9° using conventional dies. They concluded that a higher die semi-angle allows for improvement in the lubrication regime even at low drawing speeds, while a lower semi-angle requires higher drawing speeds for this purpose. Tattershall et al. [10] already attempted the study of favorable conditions to achieve a hydrodynamic lubrication regime in the wire drawing of copper and mild steel wires using soaps of widely varying rheological properties through a device consisting of a tube/nozzle at the entrance of the drawing die. They determined that the value of the entrance lubricant pressure depends on the clearance between the nozzle diameter and the wire and the length of the device. More recent works assessed the study using dies designed under this “hydrodynamic/pressure” concept. In this line, Suliga [6,12] investigated multi-stage wire drawing of high carbon steel from 5.5 mm to 1.7 mm at 5–25 m/s and using hydrodynamic dies, showing that at 25 m/s, uncontrolled surface and dimensional changes occur, while better quality has been obtained at lower speeds, 5–20 m/s. In a more recent work, Suliga et al. [13] investigated the drawing process, comparing conventional and hydrodynamic dies working between 5 and 20 m/s with calcium–sodium grease as lubricant and analyzing the effect on the structure and corrosion resistance of hot-dip galvanized zinc coatings that have been applied to medium-carbon steel wire. They concluded that lower drawing speeds (below 20 m/s) yield better wire quality, since higher speeds increase friction and diffusion, causing thinner coatings and structural degradation. Additionally, the hydrodynamic die outperforms the conventional die, producing wires with thicker zinc layers, smoother surfaces, and improved mechanical properties.
In the wire drawing of zinc–aluminum alloys, effective lubrication also plays a key role in extending die life and improving drawn wire quality. Thus, the correct lubricant choice is very important. Previous works have corroborated that zinc stearate in the form of soap powder is a highly effective lubricant, significantly reducing drawing force and friction compared to other tested oils [14]. However, studies have shown that low-viscosity oils or aqueous emulsions are more appropriate for achieving hydrodynamic regimes in wire drawing since solid lubricants cannot generate the necessary pressurized film and are, therefore, unsuitable [7,10]. Previous studies have investigated the Zn–Al alloy wire drawing process [15,16]; however, none have analyzed the advantages of pressure hydrodynamic dies in comparison with conventional dies, nor have they provided a systematic evaluation of different lubricant types. In this sense, although previously cited works have examined wire drawing under hydrodynamic conditions—mainly for copper or steel wires and typically at medium to high drawing speeds—the behavior of Zn–Al alloys, particularly ZnAl15%, under such regimes remains largely unexplored. In addition, existing research has focused on optimizing lubrication and die geometry at high speeds (≥5 m/s), whereas the combined influence of die design and lubricant type at low-to-medium drawing speeds has not been systematically analyzed. Moreover, most prior works have emphasized hydrodynamic effects or coating integrity in steel or copper systems, without addressing the tribological and thermal interactions specific to Zn–Al alloys, which exhibit distinct softening, adhesion, and low-melting-point challenges.
The main objective of this study is to comprehensively investigate the influence of lubricant selection, die configuration, and drawing speed on the tribological, mechanical, and thermal performance of thermally treated Zn–Al15% alloy during wire drawing, with particular emphasis on identifying the dominant parameters that govern drawing force and frictional behavior. The study aims to evaluate the comparative performance of conventional tungsten carbide dies and advanced hydrodynamic (pressure) dies under varying lubrication regimes to determine their impact on friction reduction and process efficiency. The secondary objectives include employing a Taguchi L9 experimental design to optimize key process parameters for minimal friction and improved drawing performance, establishing correlations between thermal and tribological responses to provide a data-driven framework for enhancing the overall efficiency and quality of Zn–Al wire drawing operations, and performing surface visual analyses of the drawn wires to evaluate the influence of lubrication and die configuration on surface quality.
The novelty of the present work lies in applying a Taguchi L9 (33) experimental design to quantitatively assess the relative effects of die geometry, lubricant formulation, and drawing speed in the low-speed regime (0.16–0.28 m/s) relevant for ZnAl15% alloy production. Unlike earlier studies, this research identifies lubricant selection as the dominant factor governing drawing performance, with hydrodynamic/pressure dies significantly reducing friction and drawing force, providing new insight into process optimization for Zn–Al alloys, where maintaining thermal stability and surface quality is critical. Overall, the findings provide a framework for optimizing process parameters in Zn–Al wire drawing, supporting improved control of mechanical, thermal, and surface outcomes.
2. Materials and Methods
The raw material for the present study is a ZnAl15% alloy wire with a diameter of 2.50 mm, supplied by Zinacor S.A. (Zinacor, S. A., Angleur, Belgium). This wire is produced by wire drawing from high-purity zinc–aluminum rods obtained through a Properzi continuous casting process [4], ensuring compliance with the requirements of the UNE-EN ISO 14919:2015 standard [17], which specifies the purity and quality of wires intended mainly for electric arc and flame spraying. The alloy has a density of 5.73 g/cm3, a melting temperature of Tm ≈ 382–450 °C, an ultimate tensile strength (σUTS) of the supplied wire between 110 and 150 MPa, and an elongation at break ranging from 70% to 200% according to the supplier’s material data sheet [18]. The chemical composition of the alloy is presented in Table 1.

Table 1.
Chemical composition of ZnAl15% alloy according to UNE-EN ISO 14919:2015, in weight %, where total others refer to the sum of impurities.
Specimens of the wire, in its as-delivered state, were cut at 3 m in length from the supplied coil, which had been drawn to Ø2.18 mm by a sequential process in 3 passes.
Previous works consulted have demonstrated that a heat treatment at temperatures from 150 °C to 300 °C, with time intervals between 1 and 6 h, could be susceptible to optimizing Zn-Al15% alloy properties for the wire drawing process [16,19]. It concludes that a thermal treatment between 180 and 240 °C is sufficient to induce complete decomposition of α + η phase lamellae into coarse Al-rich α particles in the Zn-rich η matrix, improving the tensile strength of the alloy while maintaining a reasonable plastic deformation capacity. Thus, the specimens were subsequently rolled into 50 mm diameter coils onto a feeding mandrel and then subjected to heat treatment at 233 °C for 2 h, followed by slow cooling to room temperature in 24 h with the door closed, using a Nabertherm model N 11/HR oven (Nabertherm GmbH, Lilienthal, Germany), which is equipped with P320-model programmable controller with heating ramp selection that enables precise control of the thermal cycle (°C/min or °C/h). The thermal treatment homogenizes the mechanical properties of the wire, providing appropriate conditions for the final process. It should be noted that, in industrial practice, diameter reductions of about 9% are typically applied when working with this type of alloy using conventional drawing dies. However, the proposed experiment transforms a Ø2.18 mm ZnAl15% wire to Ø2.00 mm, which corresponds to a reduction of 15.83% without causing wire breakage or necking of the drawn wire during the experiments. Figure 1 shows images of the supplied coil, specimens, and the oven used.

Figure 1.
(a) ZnAl15% wire as supplied; (b) sample coils; and (c) Nabertherm N11/HR lab oven.
For the reduction from the supplied diameter to 2.18 mm diameter, a set of 3 conventional, standard-grade tungsten carbide drawing dies was used (Ø2.50 → Ø2.37 → Ø2.27 → Ø2.18 mm), reducing the area by nearly 9–10% per pass. These types of dies have been supplied by Frasan, S. L. (Frasan, S. L., Miranda de Ebro, Spain).
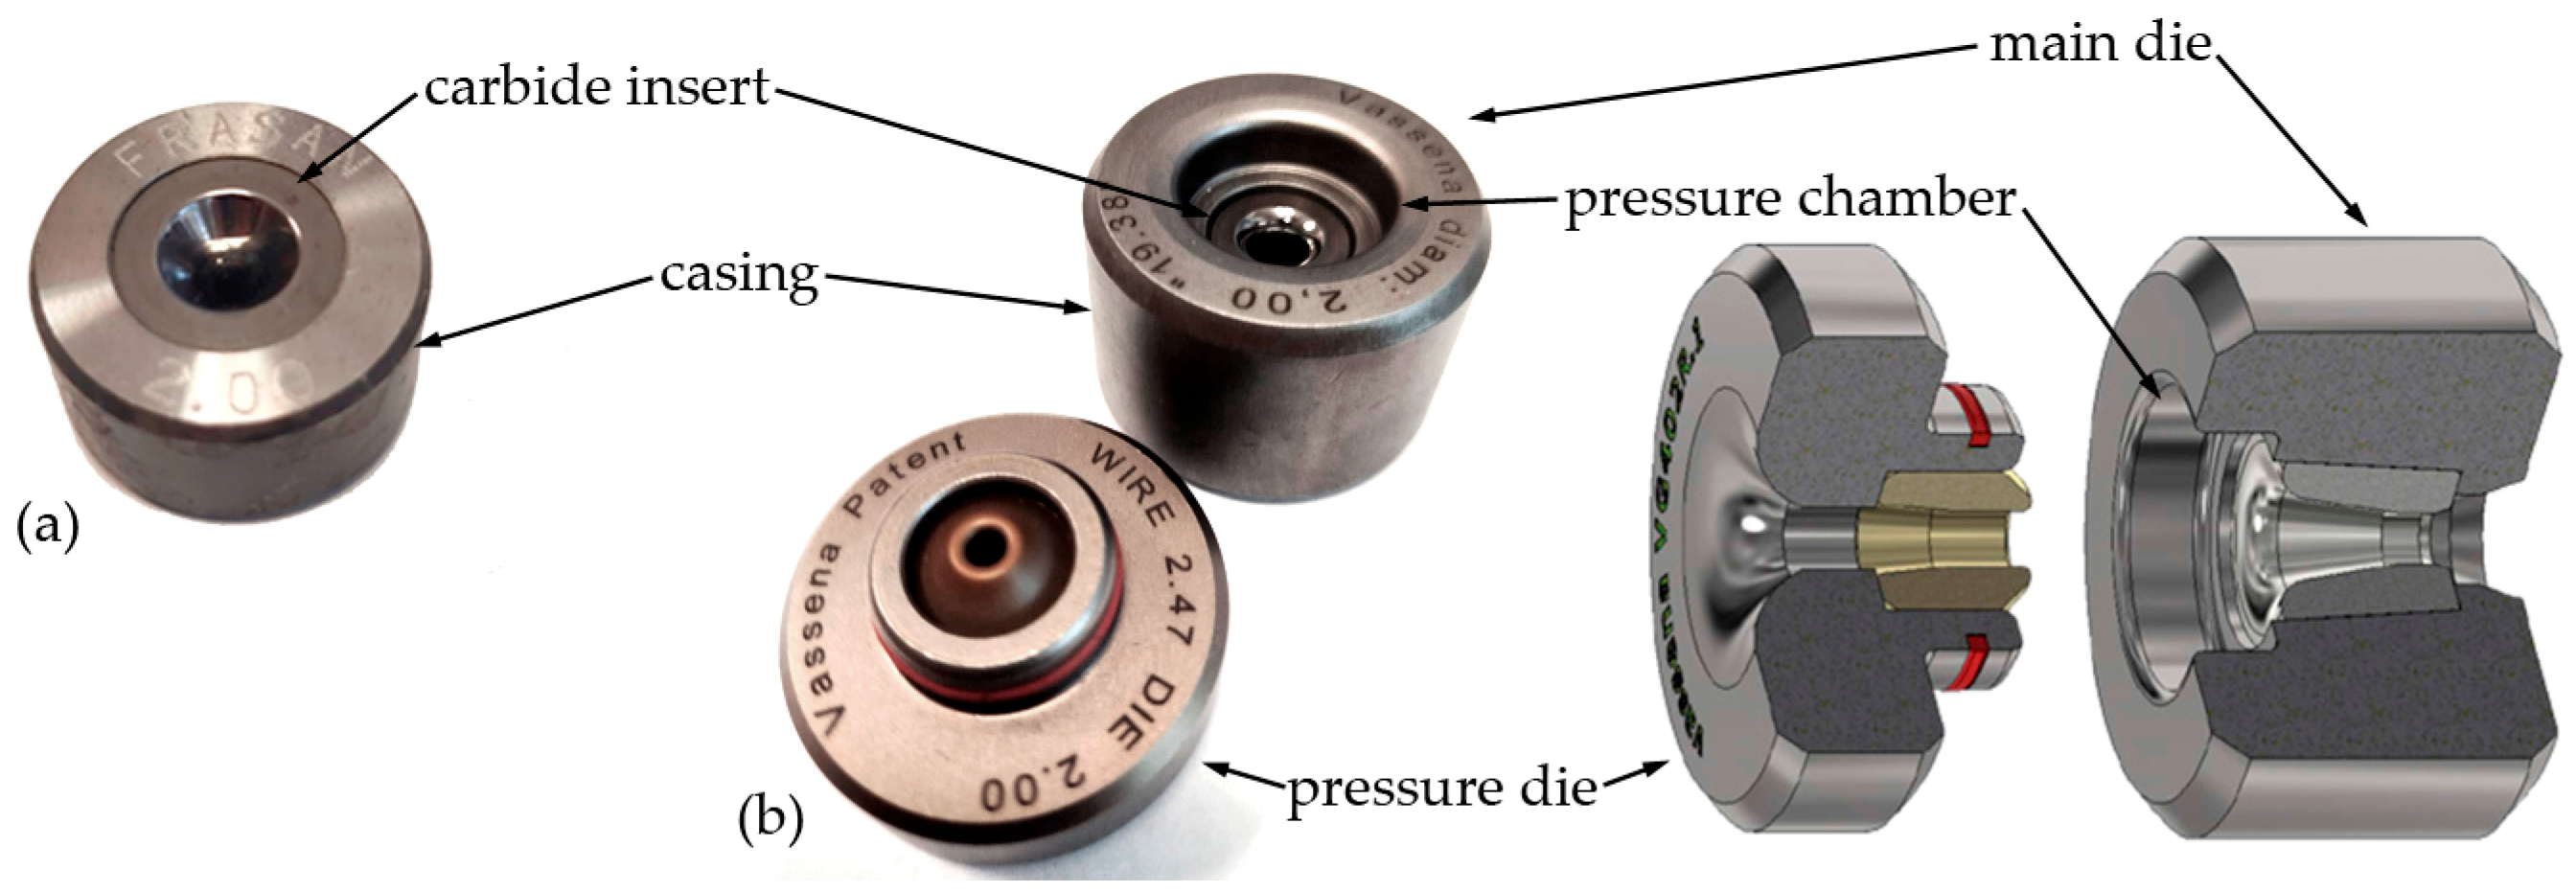
After specimen preparation and thermal treatment, a design of experiments (DoE) was intended to assess the performance of two pressure/hydrodynamic concept drawing dies (“19.38” high-grade tungsten carbide and “H3F” standard-grade tungsten carbide) and one conventional die (standard-grade tungsten carbide) in analog conditions. The pressure dies were supplied by the Vassena Filiere S.r.l. company (Vassena Filiere S.r.l., Lecco, Italy). Among these, the “19.38” concept represents Vassena’s new-generation solution, incorporating an innovative material and specialized geometry, particularly suited for final/small diameters on dry/wet drawing machines, with optimal results when combined with a pressure sleeve for increased productivity and die life. In contrast, “H3F” refers to a standard carbide nib/grade designation commonly used in conventional drawing dies but integrated into the same pressure/hydrodynamic die concept. The images in Figure 2 show the design of a conventional drawing die compared to a double body in the case of a pressure/hydrodynamic drawing die.
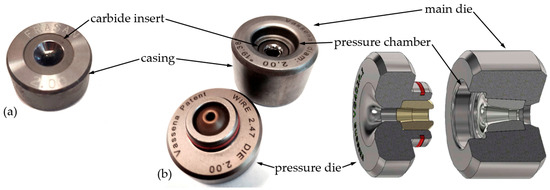
Figure 2.
Type of die: (a) conventional carbide tungsten drawing die; and (b) pressure/hydrodynamic die concept [20].
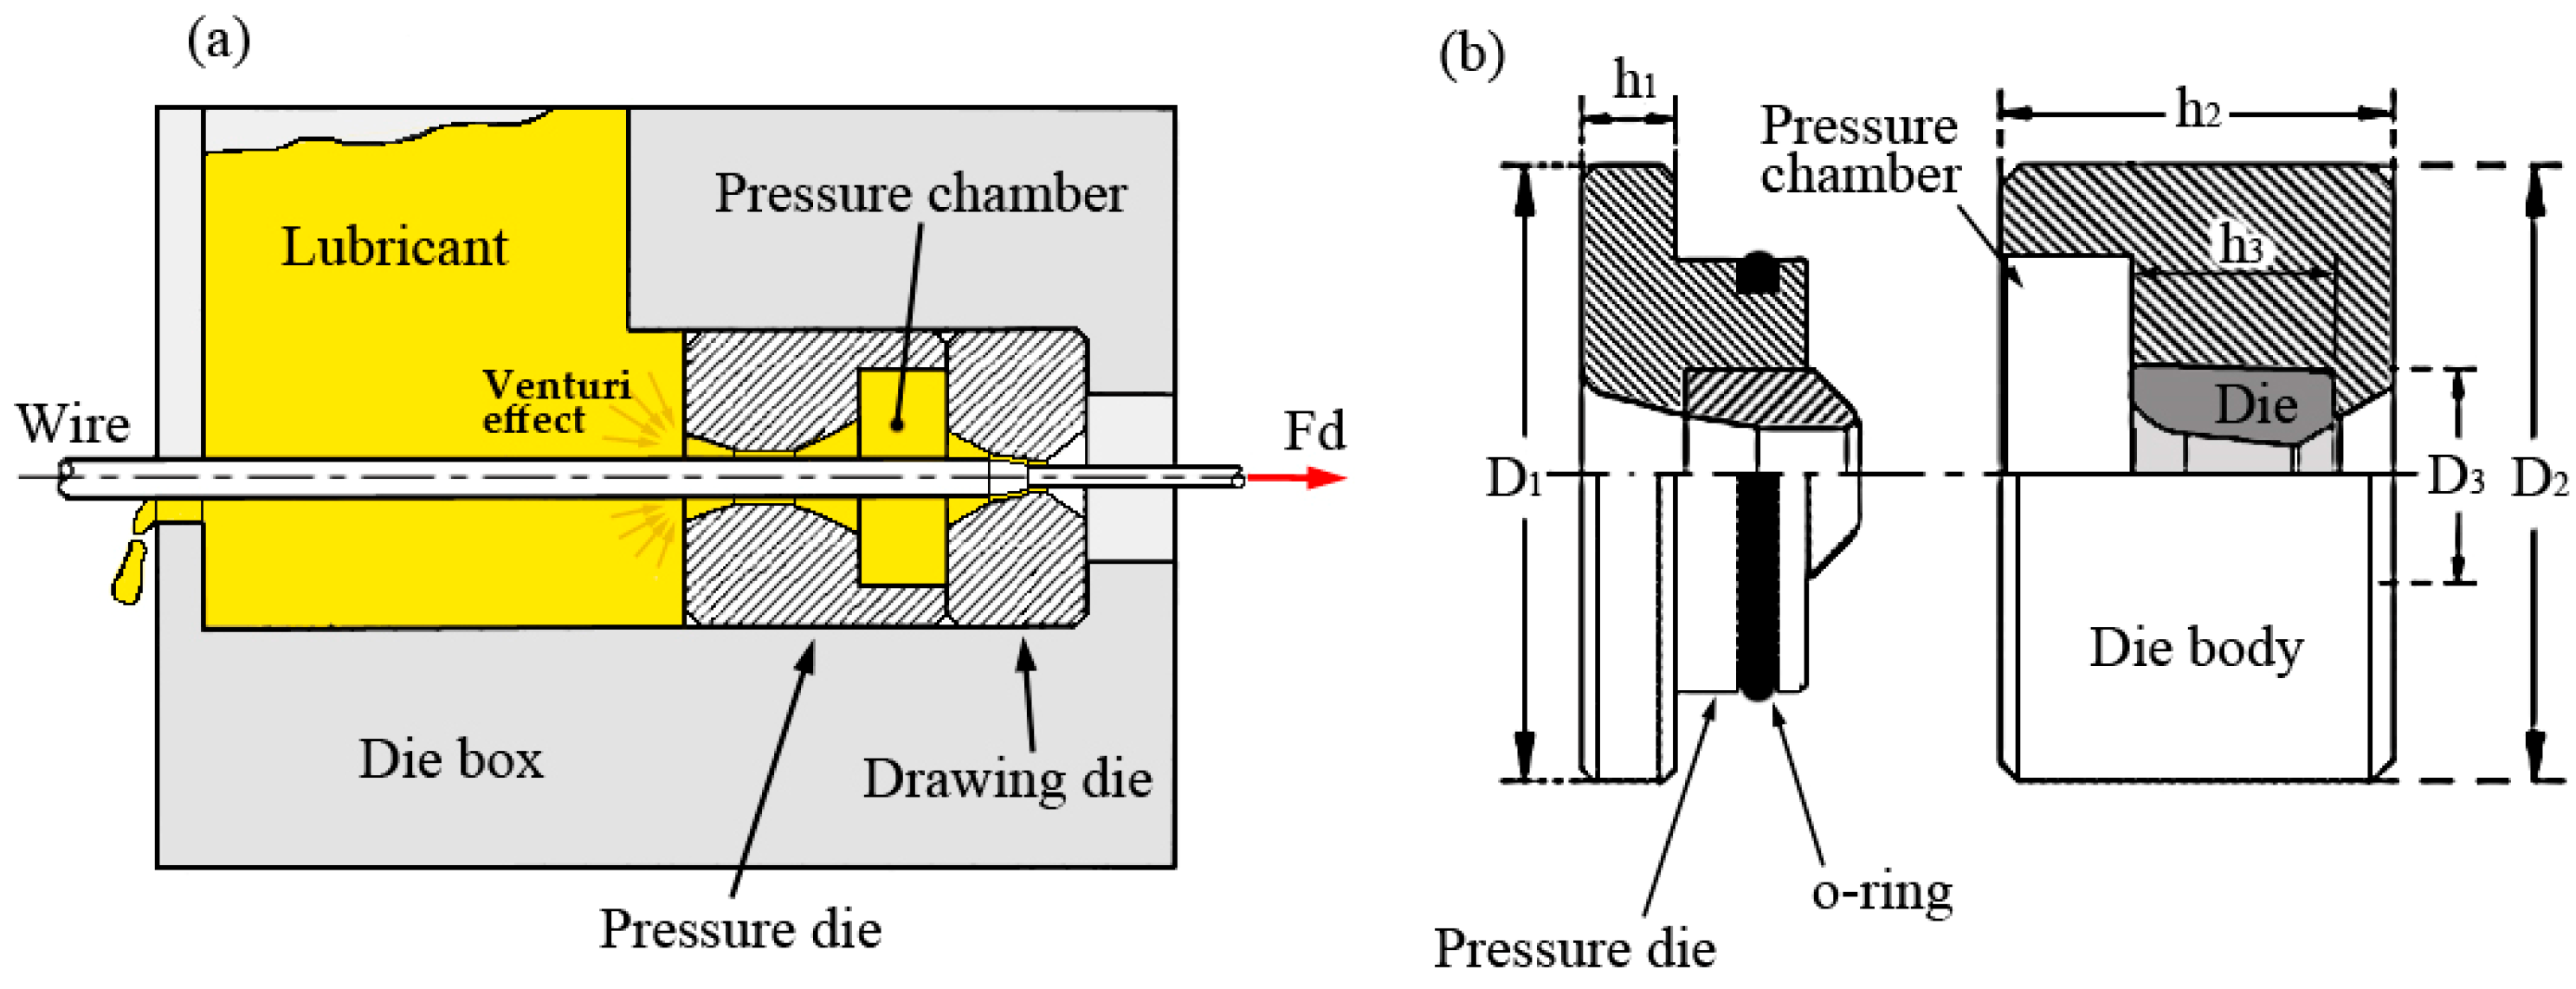
A hydrodynamic (pressure) die is based on a multi-body design concept that incorporates a lubricant reservoir at the main inlet of the die body. Thus, previous works demonstrated that a specific design generates a hydrodynamic pressure due to the relative motion between the wire and die, which forces the lubricant into the pressure chamber, forming a continuous film that separates the wire and die surfaces [21]. This film minimizes die-to-metal contact, thereby improving lubrication in the reduction zone, extending die service life, and allowing higher area reductions per pass. Additionally, the longer effective contact length improves wire quality due to the reduction in friction, which also lowers drawing temperatures [22].
The hydrodynamic/pressure concept shown in Figure 3 combines optimized geometry that forces the lubricant to accelerate through a constricted entrance zone (pressure die), in which a Venturi effect occurs—pressure drops and film thickness increases—creating effective forced lubrication. Unlike conventional dies, hydrodynamic designs promote partial or full hydrodynamic lubrication, significantly reducing friction and die wear while improving the surface quality of the drawn wire.
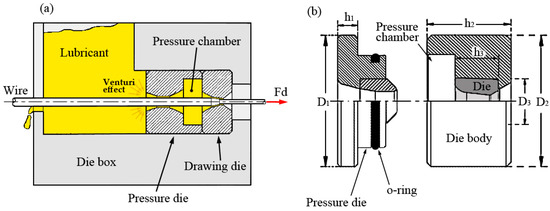
Figure 3.
Hydrodynamic/pressure die concept: (a) Venturi effect; (b) developed by Vassena Filiere S.r.l. company (Vassena Filiere S.r.l., Lecco, Italy).
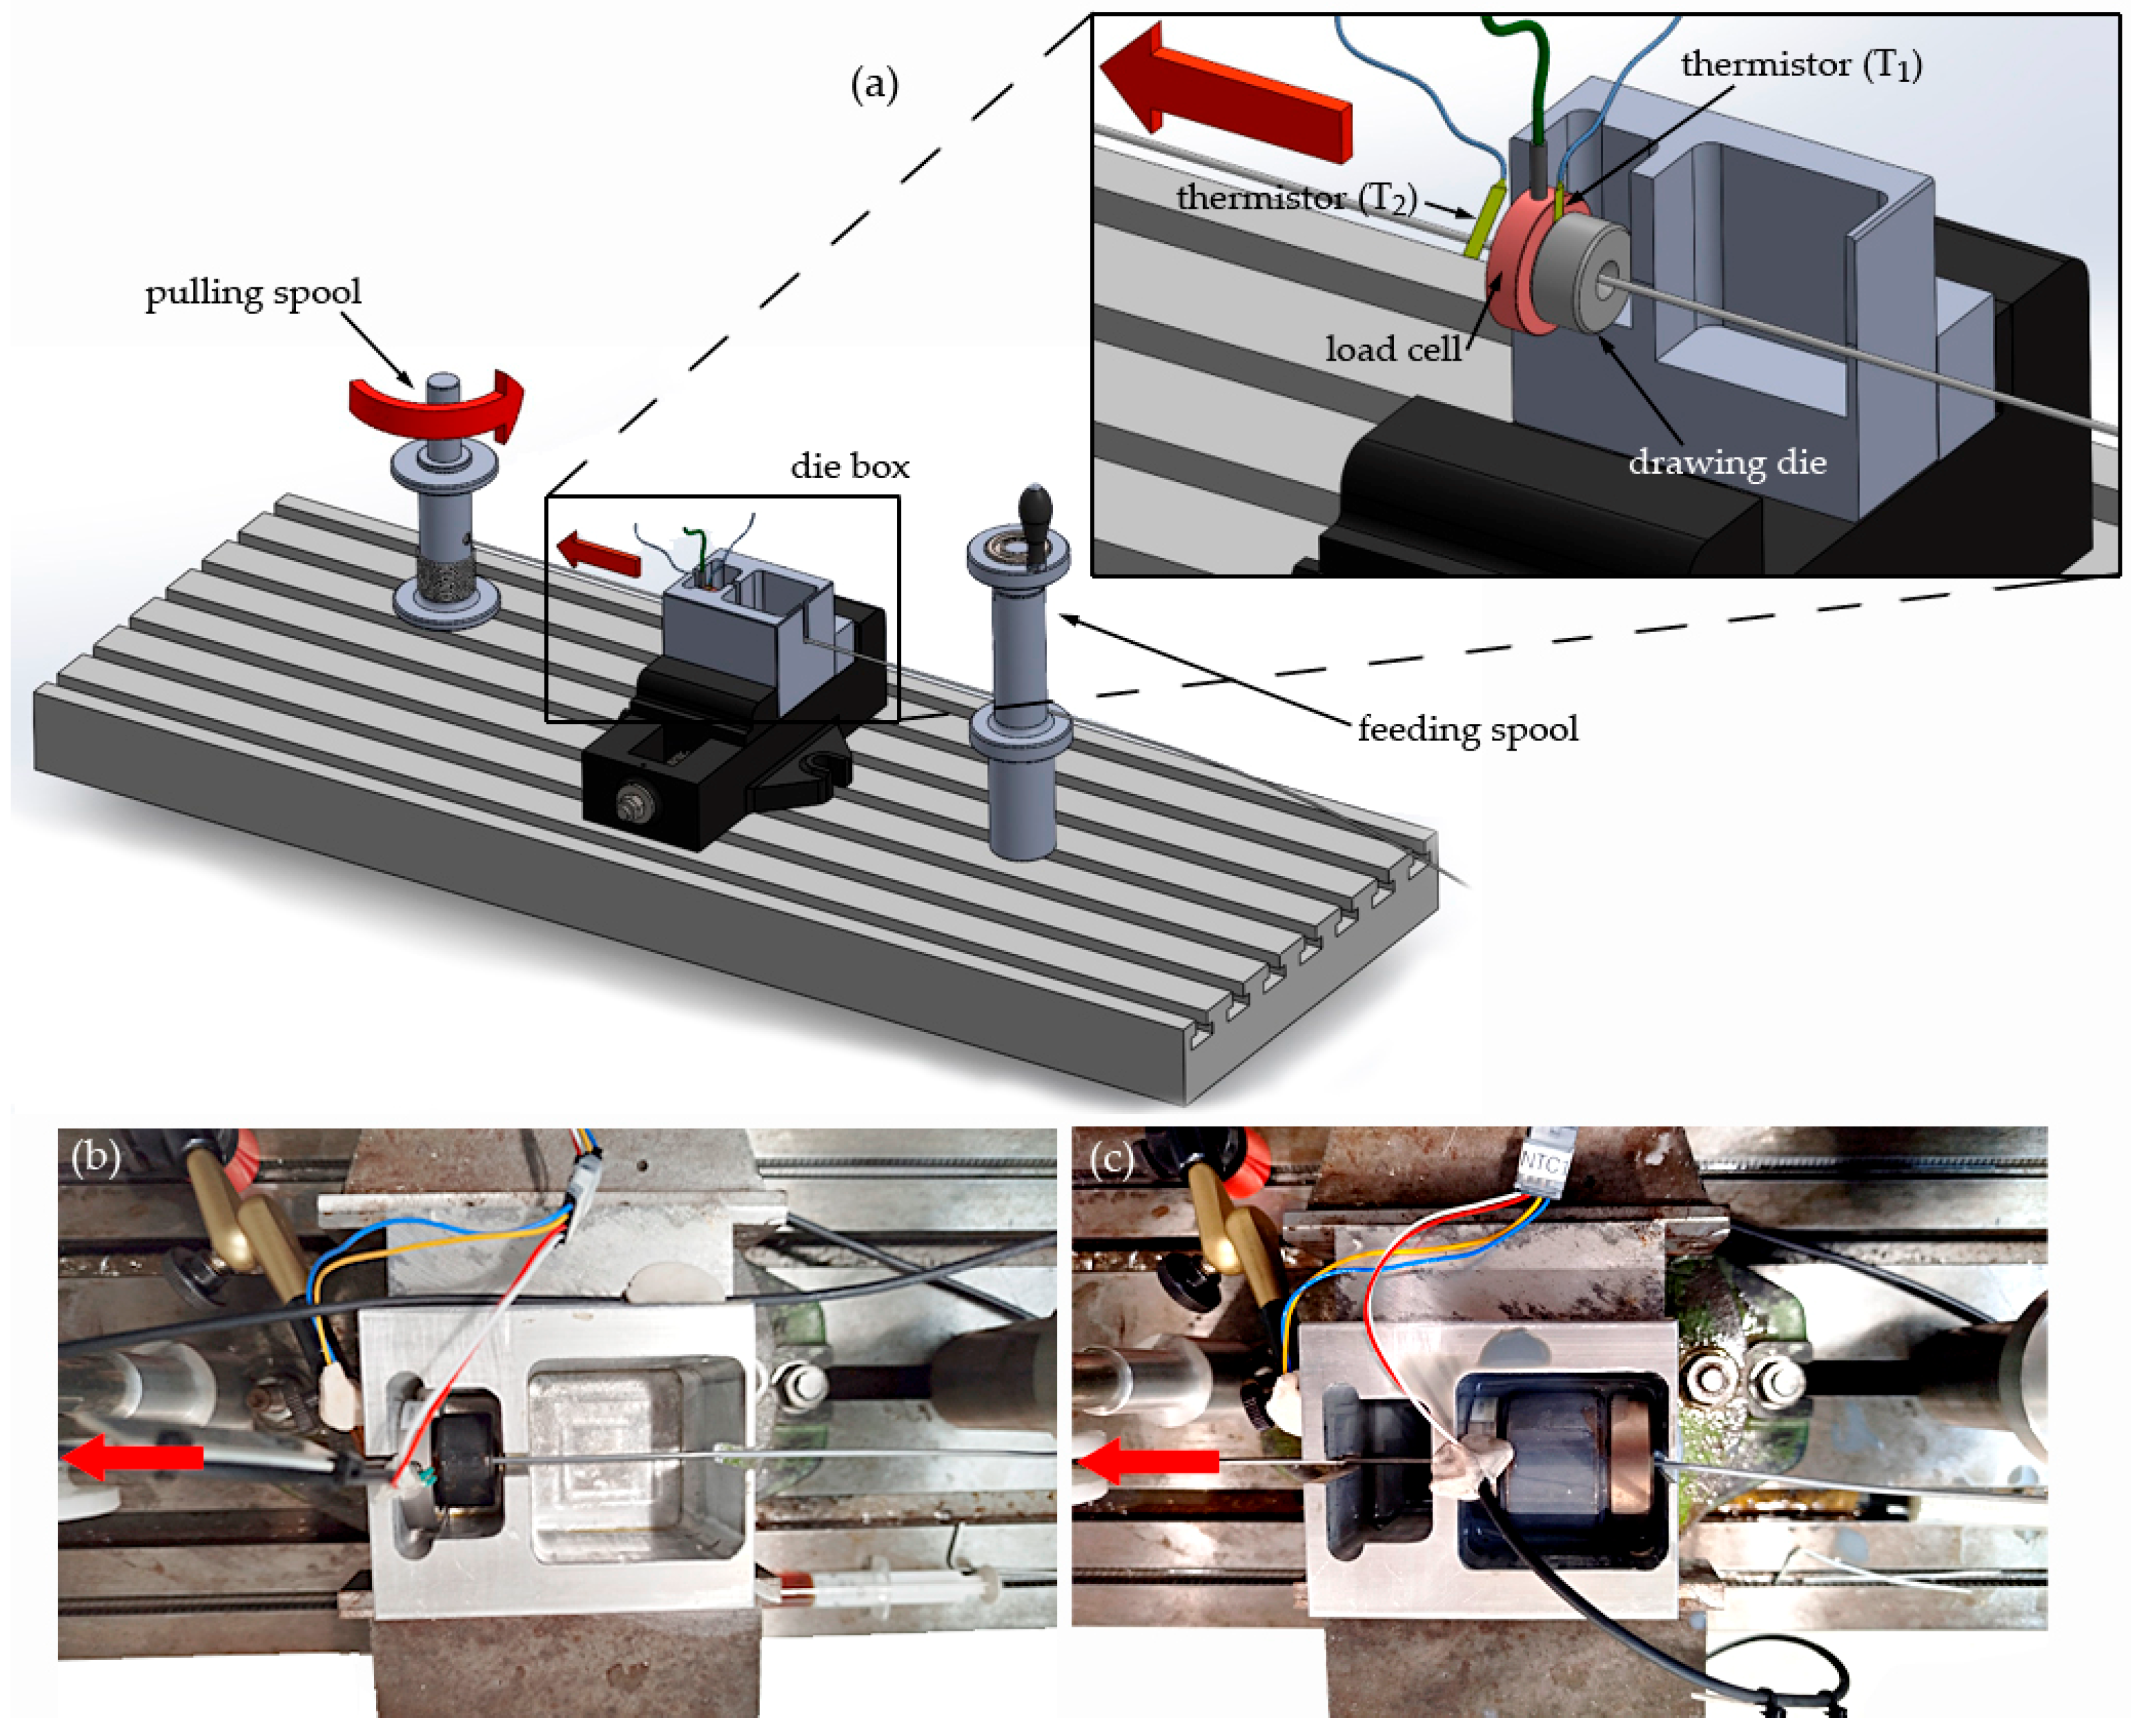
The wire-drawing sequence was performed on a vertical milling machine (model Lagun FTV-1, Lagun Machinery, S.L.U., Legutiano, Spain) adapted with a pulling spool, machined from EN-AW 6061 aluminum, and mounted on the spindle, which operated at controlled rotational speeds to generate the linear drawing speed (v) and drawing force (Fd). The die box has been designed to accommodate either type of drawing die, to hold a load cell, and to contain enough volume of lubricant. At the start of each test, the thermally treated wire specimen was placed on a free-feeding spool equipped with a crank handle. The setup has been perfectly aligned, keeping the wire horizontal relative to the table and die, while the milling machine’s vertical handwheel can be moved in the Z axis to ensure uniform winding on the pulling spool.
Drawing force (Fd) was measured with a Lorenz K-14 load cell (0.05–100 kN, stainless steel, IP60), with overall dimensions of Ø 30 × 9.4 mm and a central Ø 5.4 mm hole for wire passage (Lorenz Messtechnik GmbH, Alfdorf, Germany). It was mounted at the exit of the drawing die and connected to a Lorenz LCV model strain gauge interface, recording force vs. time data via USB with the VS3 Lorenz software version 3.06. In addition, each die was slotted transversely on the exit face to accommodate an MF55 series precision film-type NTC thermistor (Nanjing Shiheng Electronics Co., Ltd., Nanjing City, China) to measure die temperature at the exit face of the die (T1), and an additional thermistor measured the wire temperature out of the die box (T2). Both thermistors were calibrated against a PT100 platinum resistance thermometer of DIN Class A accuracy (±0.15 °C + 0.002 × |T|), which served as the reference sensor. The calibration was performed at two fixed points, 0 °C (ice–water bath) and 100 °C (boiling water), by exposing the thermistors and the PT100 to identical thermal conditions. The thermistor outputs at these reference temperatures were used to determine the calibration curve, ensuring that both sensors provided accurate and traceable temperature measurements throughout the experiments with a maximum temperature error of ± 0.2–0.3 °C. Temperature vs. time data have been recorded by the Arduino IDE software application v. 1.8.19 Arduino [23]. The temperature of the wire at the exit of the drawing box (T3) has also been measured with a thermal camera FLIR One Pro model (Teledyne FLIR LLC, Wilsonville, OR, USA) compatible with Android devices. This thermal camera has a measurement range of up to 400 °C, a sensitivity of 70 mK, and operates with a factory calibration that guarantees a maximum error of ± 3 °C (or ± 5% of the difference between ambient and scene temperatures) when the unit has been powered for at least 60 s, the ambient temperature is between 15 °C to 35 °C, and the scene (object) temperature is between 5 °C and 120 °C. Differences observed between the thermal camera and the contact sensors (thermistors and PT100) were, therefore, attributed to the camera’s intrinsic accuracy and emissivity-related effects. Equipment setup is described in Figure 4.
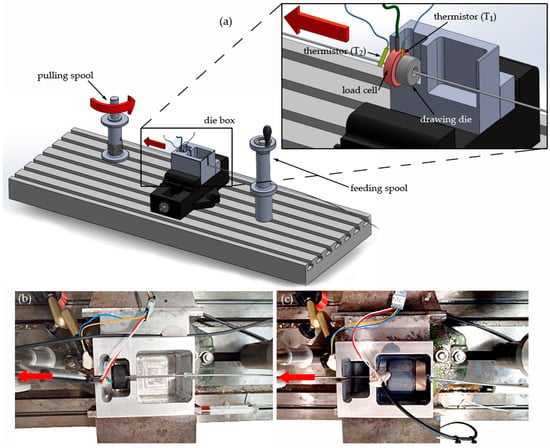
Figure 4.
Experimental setup: (a) detail of the setup with the conventional drawing die and sensors; (b) setup with the conventional drawing die; and (c) setup with the pressure drawing die. The red arrow indicates drawing direction.
In the proposed design of experiments (DoE), three different types of lubricants were used. Multidraw AL WM (Zeller + Gmelin GmbH & Co. KG, Eislingen/Fils, Germany) is a water-miscible synthetic oil (20% concentration) designed for aluminum wire drawing in intermediate and fine drawing processes, with a density of 960 kg/m3 at 15 °C and an average viscosity of 110 mm2/s at 40 °C. It is specifically based on synthetic esters enriched with anionic and nonionic surfactants, as well as inhibitors that enhance their performance. It provides excellent lubricating capacity, low foaming tendency, strong protection against microorganisms, and effective corrosion resistance. In addition, it exhibits high stability in the presence of electrolytes, making it particularly suitable for demanding applications. Multipress PEK (Zeller + Gmelin GmbH & Co. KG, Eislingen/Fils, Germany) is a mineral oil (100% oil) mainly used for pre-drawing and calibration drawing of high-strength steels, as well as stainless and acid-resistant steels, in single- or multi-stage processes. With a density of 980 kg/m3 at 15 °C and an average viscosity of 95–100 mm2/s at 20 °C, its composition is based on a pigmented mineral oil with sulfur-containing EP (extreme pressure) additives, which provide excellent resistance under demanding forming applications. Besal 35 (Brugarolas, S. A., Rubí, Spain) is a white micro-emulsifiable oil (8–10% oil + water) with a density of 1000 kg/m3 at 15 °C, with great cooling efficiency. This lubricant is designed for machining and forming processes, providing good corrosion protection and bacteriostatic stability.
It should be noted that the use of soap-based lubricants such as VICAFIL and STEELSKIN (from CONDAT) was initially considered during the preliminary design of the experiments. However, these lubricants were excluded from the present study because the wire-drawing tests were conducted on short wire lengths (approximately 1.5 m) and within a low process speed range in the laboratory setup. Under these conditions, the wire temperature would not be sufficient to melt the powder soaps, thereby preventing effective lubrication. Nevertheless, the potential of these lubricants for future research, particularly under higher drawing speeds and longer wire lengths, must be recognized.
The experimental design was based on a Taguchi L9 (33) orthogonal array, which allows the study of three factors at three levels each while reducing the number of required runs from twenty-seven in a full factorial design to only nine, as summarized in Table 2. The factors considered were lubricant type (Multidraw, Multipress, and Besal), die type (Conventional, Pressure_19.38, and Pressure_H3F), and drawing speed (0.16, 0.22, and 0.28 m/s). This approach enabled an efficient evaluation of the main effects of these parameters on the drawing process output variables (drawing force and output temperatures) while maintaining robustness in the analysis. Each experiment was repeated twice, resulting in a total of 18 specimens to ensure reproducibility and to calculate mean values of the output variables.

Table 2.
L9 design of experiments by the Taguchi method with 3 factors and 3 levels.
For each experimental run, a 3 m in length and 2.18 mm in diameter specimen was thermally treated and then tapered at one of its ends using a wire-pointing machine to allow insertion through the die. The die was mounted in the die box together with the load cell, and the tapered end of the wire was fixed to the pulling spool. Thermocouples T1 and T2 were fixed in their working position, as shown in Figure 3. Thus, the first one (T1) has been positioned between the die and the load cell, and the second one (T2) has been placed out of the die box, both in contact with the wire to record temperatures during drawing. Prior to each test, the die box was filled with lubricant, and the spindle was adjusted to the required drawing speed, with the corresponding conversion from linear speed (m/s) to spindle rotational speed (rpm) provided in Table 2. Once the experimental run was launched, the drawing force (Fd) and the wire temperature data T1 and T2 were registered as a function of time, and T3 was recorded in video format. During the drawing experiment, the Z axis in the machine was gradually displaced so that the wire was wound properly without overlapping on the pulling coil. At the end of the drawing operation, the wire was wound onto the left-hand drum (Figure 3), and the die was removed from the die holder to allow the excess lubricant to drain. Steps from the die insertion to the wire collection were repeated for the second sample. The die holder and die were carefully cleaned of lubricant, and the samples from each experiment were labeled accordingly.
In the drawing of ductile metals and alloys, the coefficient of friction (µ) can vary significantly depending on lubrication quality, material properties, and drawing conditions. When the deformation zone is adequately lubricated, the coefficient of friction can typically be reduced within the range of µ = 0.1–0.3 when a ductile alloy (wire) and tungsten carbide (die) are in contact [24,25,26]. Then, a simpler approach to calculate the coefficient of friction is to determine this constant using Equation (2), which derives from the drawing tension calculation Equation (1) proposed by [27,28].
The drawing stress (σd) can be calculated as a function of the drawing force measured in the experiment (Fd) and the cross-sectional area of the drawn wire (Af), while the die shape form factor (Δ) describes the geometry of the reduction zone in the drawing die as a function of the mean diameter (dm) and the contact length (L), both dependent on the input wire diameter (d0), the output wire diameter (df) and the reduction semi-angle (α).
Furthermore, the yield stress (σY) of the input wire is implicit in Equation (2). Accordingly, tensile tests were carried out on thermally treated Ø2.18 mm ZnAl15% alloy specimens, yielding a mean value of σY = 181 MPa after five repetitions.
Previous studies demonstrated that the hardening behavior of high Zn-content and Zn–Al alloys depends on strain, strain rate, temperature, and grain structure since this type of alloy exhibits low recrystallization temperatures, favoring its plastic deformation at ambient conditions (typical in wire drawing) and a superplastic behavior characterized by large elongations before breakage under specific conditions [29,30]. This behavior, often associated with grain-boundary sliding and rotational ability, reduces flow stress and enhances ductility. Nevertheless, it should be considered that the key requirement in wire drawing is a material with sufficient ductility at room temperature, avoiding localized necking that would compromise material continuity and cause fractures during the process. Consequently, this work has been proposed to use the strain-rate sensitivity model described by Equation (4) for the determination of the evolution of the yield limit as a function of the strength coefficient of the alloy (K), average true strain rate , and strain-rate sensitivity coefficient (m).
To obtain the value of the strain rate sensitivity coefficient m, the points (σ1, 1) and (σ2, 2) in Figure 4a have been adjusted, particularizing with the experimental values obtained from tensile tests (Figure 4b), as indicated in Table 3 and in Equation (7). Thus, and denote the strain rates corresponding to σUTS and σY, respectively. Previous works have reported the empirical correlation between the ultimate tensile strength (Rm or σUTS) and conventional yield strength (Rp0.2 or σY) with the applied strain rate [31,32]. Then, when differences in σUTS and σY arise primarily from variations in strain rate—such as those induced by different testing speeds in the plastic period, as shown in Figure 5—the strain rate sensitivity exponent (m) can be estimated by Equation (7), which has been deduced by fitting the experimental data to Equation (6) and by applying logarithms to the relationship deduced from Figure 5a and Equation (5).

Table 3.
Stress–strain-rate coordinates in the speed-change method and particularization when testing specimens at 1 = 0.00025 s−1 until the yield point (σY) at variable strain rates (2) in the plastic period.

Figure 5.
Graphical representation of the speed-change testing methods: (a) according to the speed change in the tensile test described by Dieter [31]; (b) tensile test curves obtained at different speeds in the plastic period of Ø2.50 mm ZnAl15% alloy specimens thermally treated at 233 °C for 2 h and cooled slowly in the oven for 24 h.
The strain-rate sensitivity coefficient (m) was determined through uniaxial tensile tests on ZnAl15% Ø2.50 mm wire specimens (150 mm total length, 100 mm gauge length) following UNE-EN ISO 6892-1:2020 [33]. Specimens were first loaded at 0.00025 s−1 up to the yield point to ensure consistent elastic–plastic transition, after which tests were performed in the plastic region at crosshead speeds of 12.5–100 mm/min, corresponding to strain rates from 0.00208 to 0.02500 s−1 (Equation (8)).
After determining the strain-rate sensitivity coefficient (m), the strength coefficient (K) can be calculated by substituting it into Equation (4). The values of the strain-rate sensitivity exponent (m) and the coefficient of resistance (K) are shown in Table 4, and the mean values obtained for these coefficients define the material behavior model of ZnAl15% alloy wire that has been thermally treated, as expressed by Equation (9), which models the evolution of the alloy’s yield limit.

Table 4.
Coefficients m and K calculated from the results of the tensile tests with a constant strain rate in the elastic period (1 = 0.00025 s−1) and variable strain rates (2) in the plastic period with thermally treated alloy specimens.
The study of the dimensional and surface quality of the drawn wire has complemented the work. For this, the final diameter of each drawn wire sample has been measured with a Mitutoyo micrometer with a measuring range from 0 to 25 mm and an accuracy of 0.001 mm (Mitutoyo Corporation, Takatsu-ku, Kawasaki, Kanagawa, Japan). It has then been photographed using the Leica DVM6 digital microscope (Leica Microsystems GmbH, Wetzlar, Germany), which provides a magnification range from 12× to 2350× with a resolution of up to 0.4 µm. Image acquisition and analysis were performed by the Leica Application Suite X (LAS X) software version 5.3.1, which enables reproducible parameter settings and advanced features such as extended depth of field and HDR imaging. Appropriate magnification and illumination were selected to highlight surface features such as defects, dirt, and wear, ensuring high-quality and consistent image documentation.
Once the experimental plan was executed, the results were statistically analyzed using Minitab software, version 19 (Minitab LLC, State College, PA, USA), applying regression and ANOVA models to evaluate the influence of the input variables of this study on each of the measured output variables.
3. Results and Discussion
3.1. Drawing Force, Stress Temperatures, and Diameter of the Drawn Wire
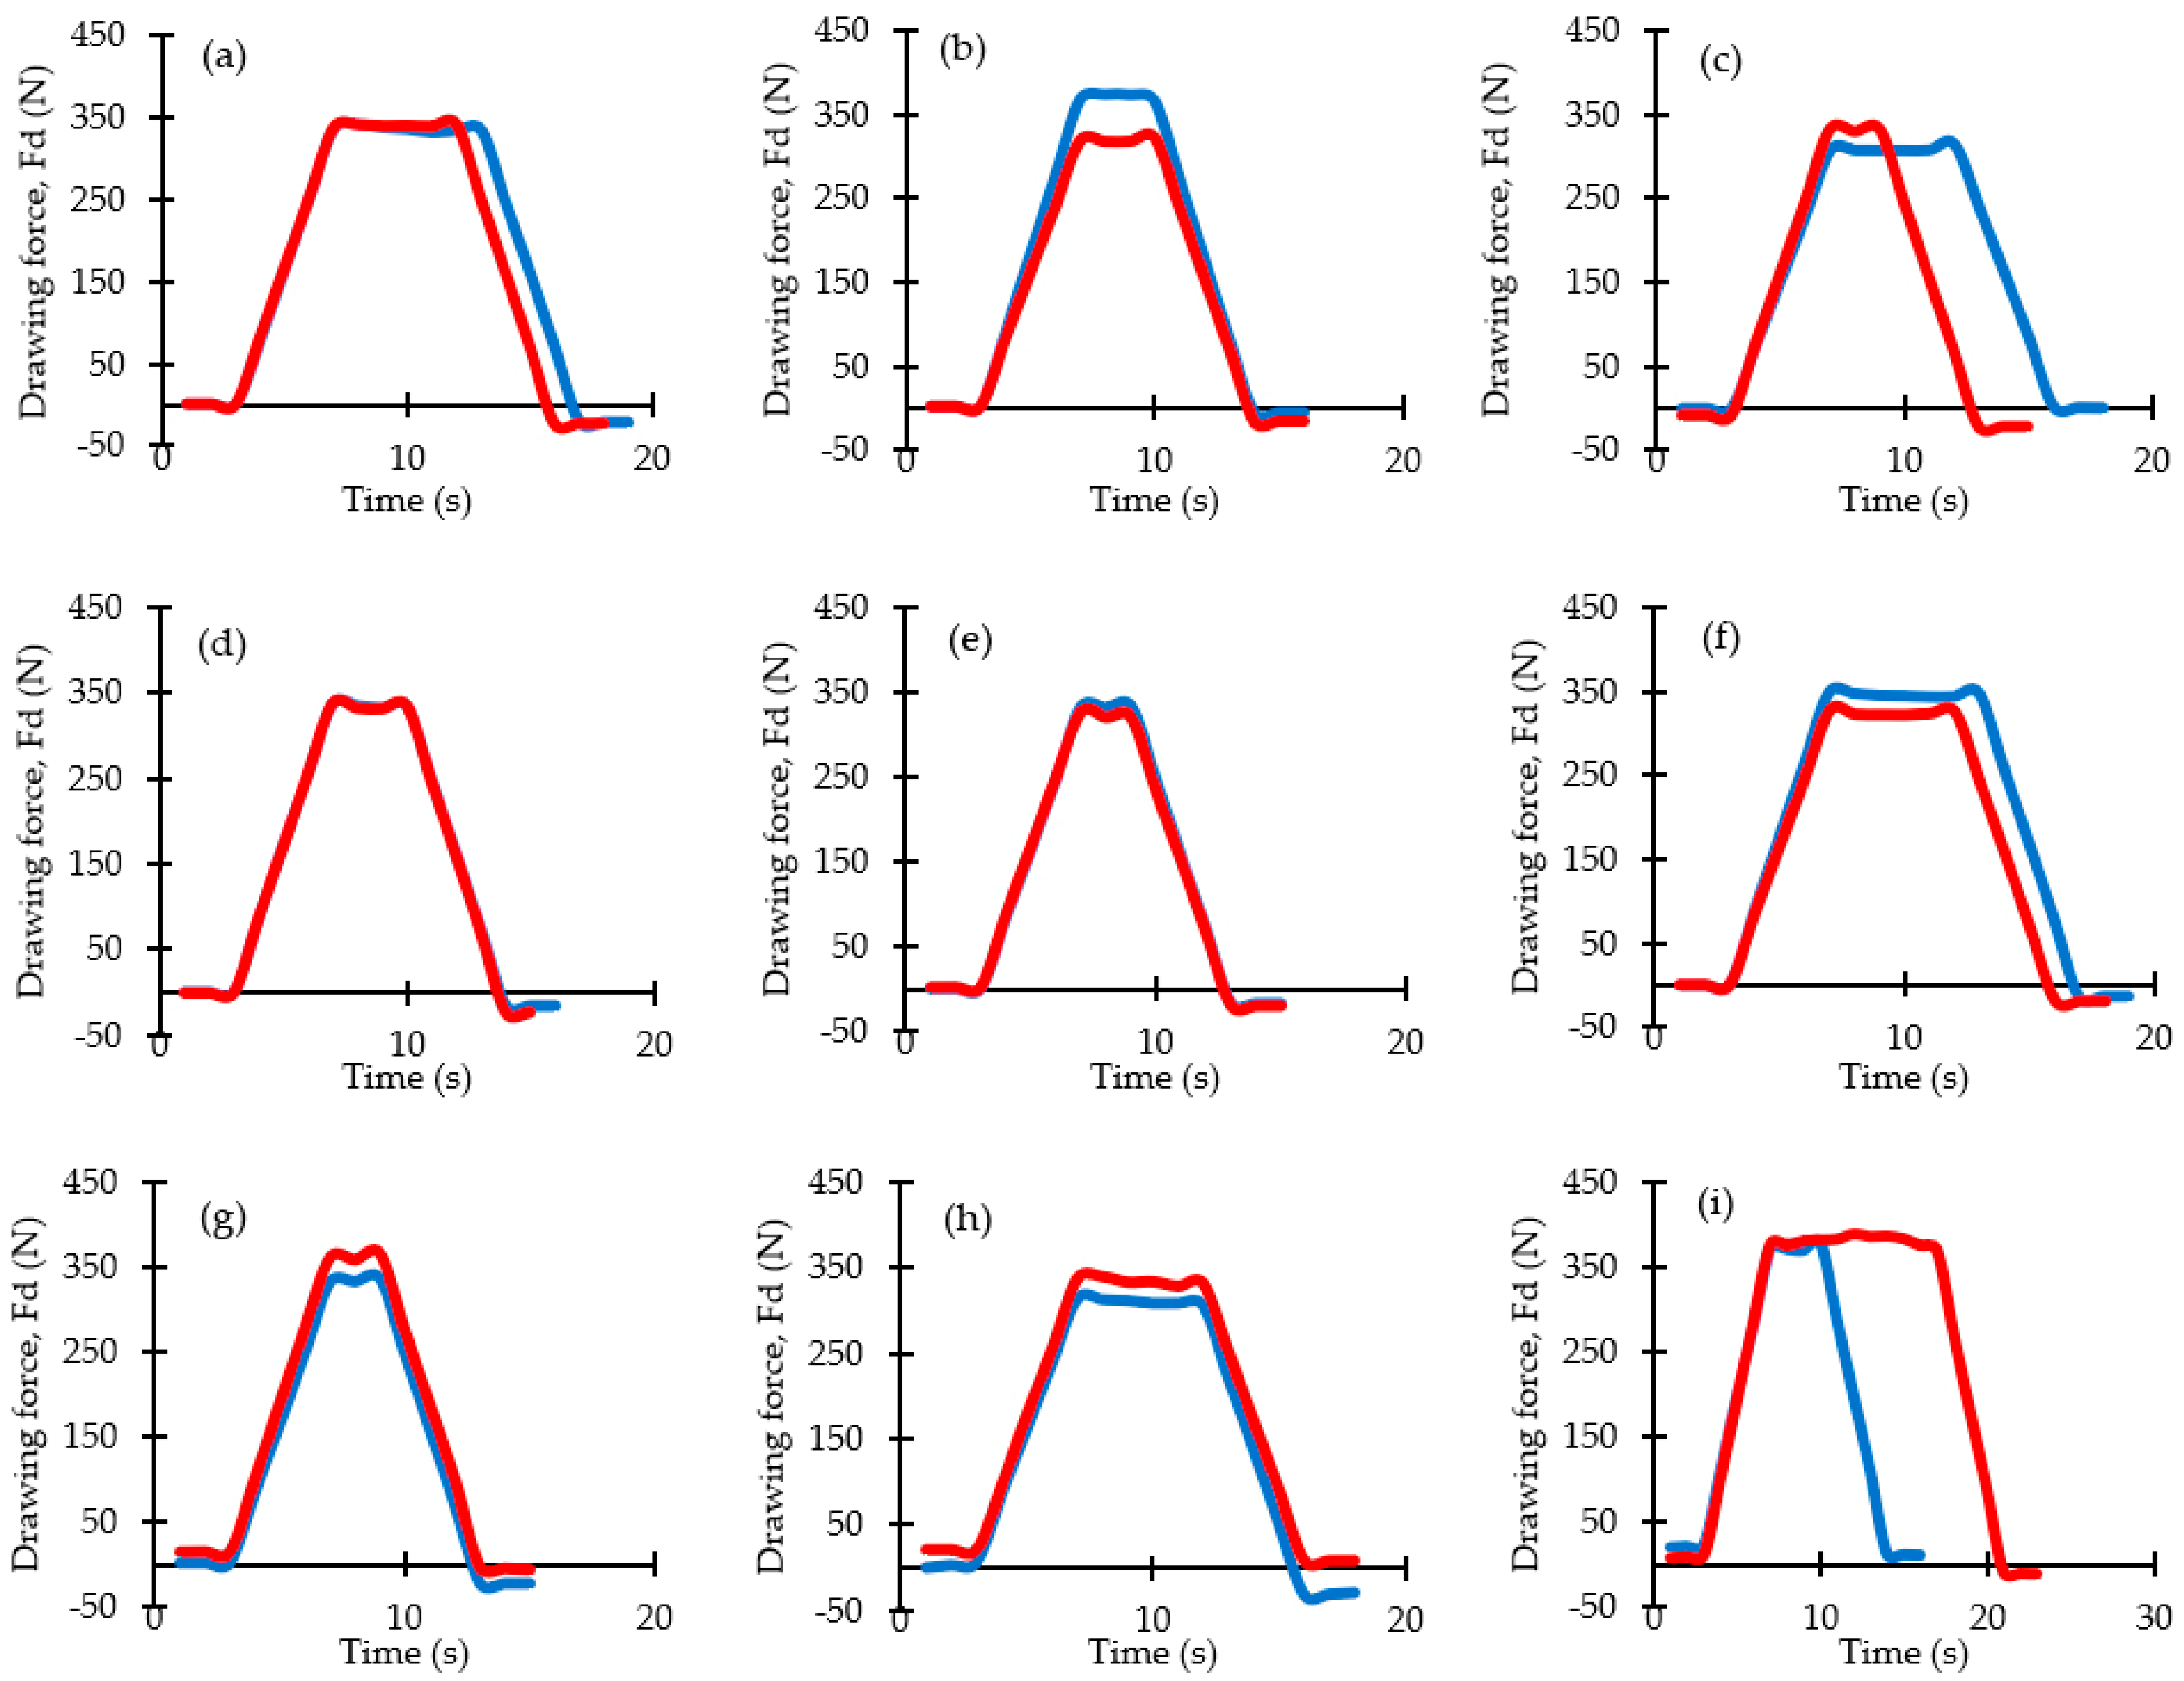
Table 5 shows the mean values obtained for the drawing force (Fd), drawn wire diameter (df), drawing stress (σd), and temperatures measured with thermocouple T1 (in contact with the drawing die, at exit face), thermocouple T2 (in contact with the wire at the output of the die box), and thermal camera T3 (contactless, at the output of the die box). The curves in Figure 6 show the evolution of the drawing force vs. time in the experiments.

Table 5.
Results of output variables measured in the experiments.
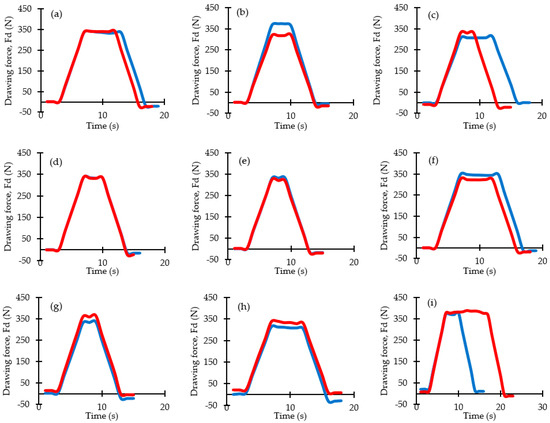
Figure 6.
Drawing force (Fd) vs. time recorded in the two iterations of each experiment run: (a–i) first–ninth run.
The observed diameter variation in the drawn wire is not attributable to die wear, since die life, typically defined by the mass of wire produced (e.g., a 2.00 mm carbide die can process 20–40 Tons, while a PCD die can reach 1000–1500 Tons), has not been consumed at all by these short-term experiments. Instead, the deviation arises from the slight stretching of the wire at the die exit due to the drawing force effect. Nevertheless, considering the usual manufacturer’s tolerance of ±0.050 mm in this type of drawn product, the final wire diameter may result slightly below the nominal die size but agrees with manufacturing tolerance.
The drawing force (Fd) results summarized in Table 3 were obtained as mean values from the force–time curves recorded by the load cell that are shown in Figure 6. The two iterations of the experiments yielded highly consistent results, with standard deviations below 10% of the force values. The curves indicate that the drawing force is governed by the maximum peak, which occurs over the stationary period during the wire drawing test. Differences in test durations between experiments 3 and 9 have been due to the circumstance of different wire lengths used in these specific experiment iterations.
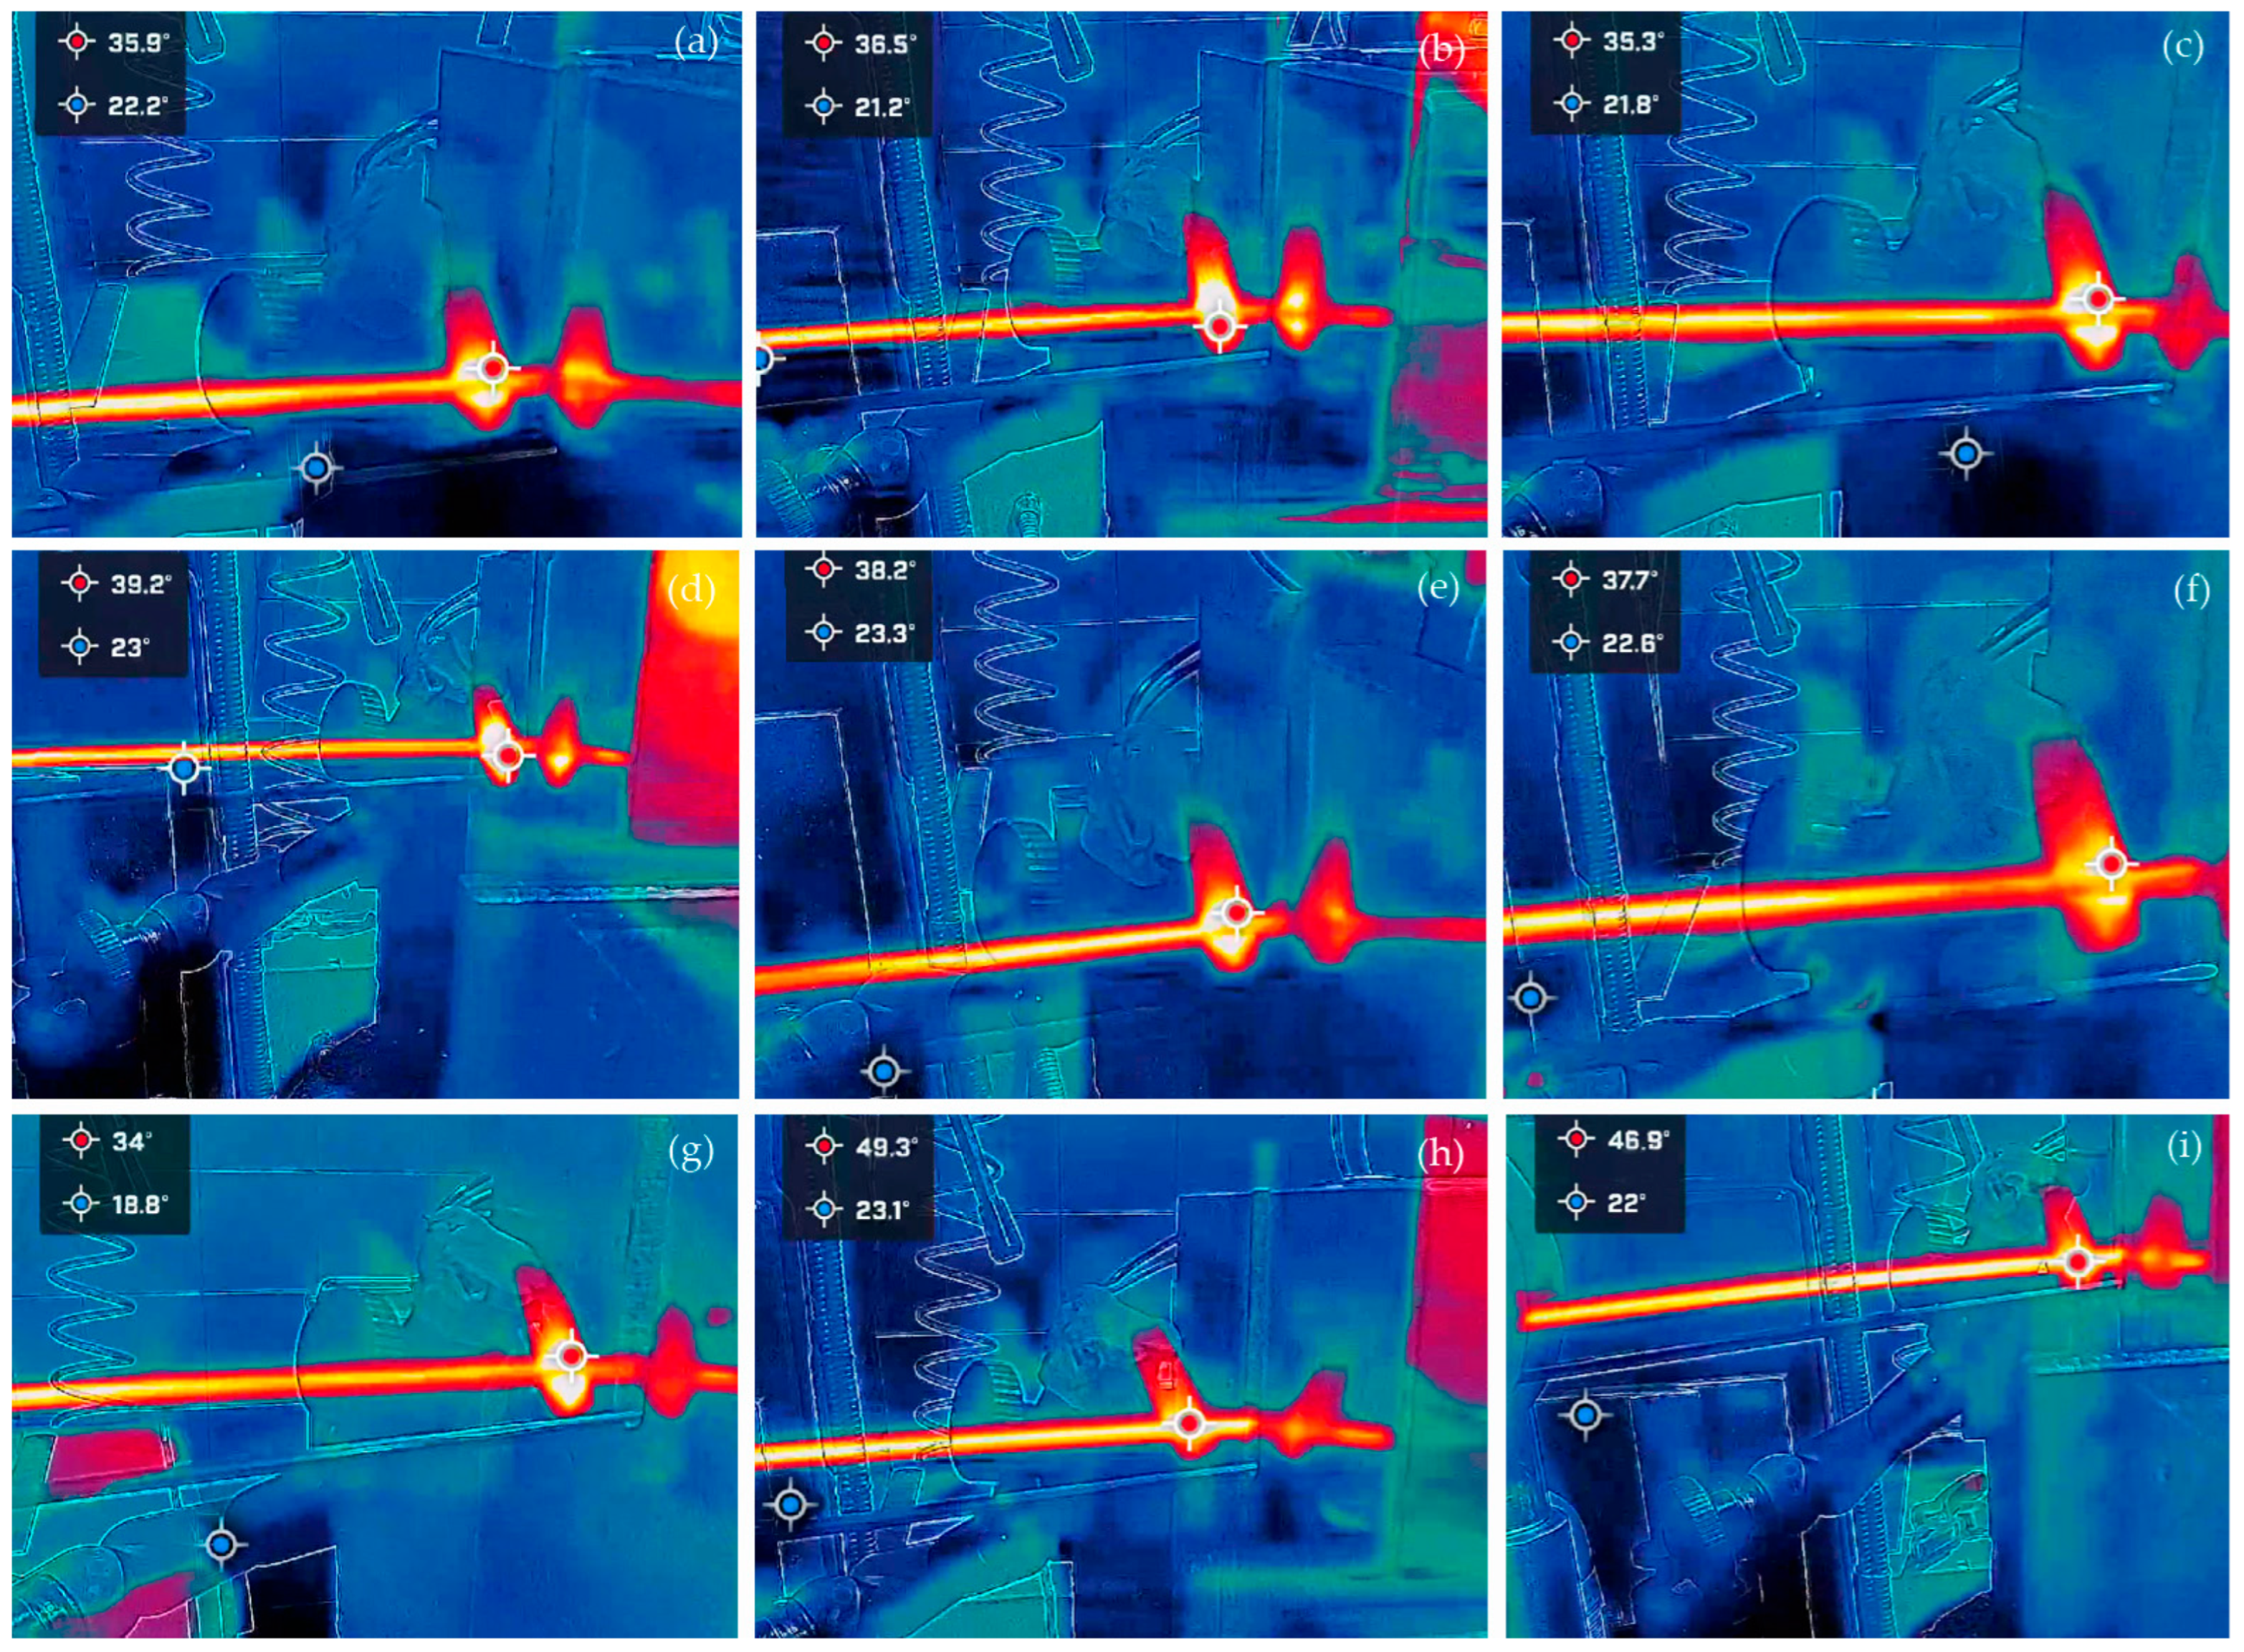
Images in Figure 7 show instantaneous values during measurements made for temperature T3 using the thermal camera during the second iteration of the set of experiments.
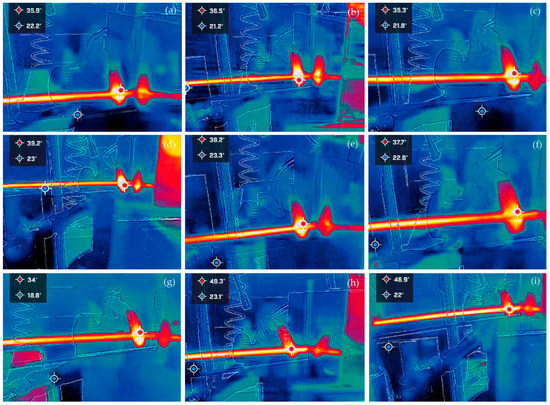
Figure 7.
Instantaneous thermal images of the drawn wire corresponding to temperature T3, recorded outside the die box during the second iteration of experiments using the FLIR ONE thermal camera: (a–i) first–ninth run.
A clear correlation can be observed between the thermocouple measurements (T1 and T2) and the thermal camera readings (T3), with T3 generally yielding slightly higher values due to its non-contact measurement method and wider capture area. This consistency validates the reliability of the experimental setup and confirms the thermal trends across the different drawing conditions. However, an anomaly was observed in runs 8 and 9, where T3 values were significantly higher than those measured with T1 and T2, reaching 49.3 °C and 46.9 °C, respectively. This discrepancy may be attributed to localized heating effects at the wire surface, likely caused by insufficient lubrication or unstable film formation in combination with the higher contact length of the pressure dies. These conditions can lead to frictional hot spots at the die exit, which are captured by the thermal camera but not fully detected by thermocouples due to their point-contact configuration. Additionally, small variations in wire positioning during camera recording may have enhanced the apparent surface temperature, contributing to the observed differences.
Overall, the comparison of thermocouple and thermal camera measurements demonstrated good agreement in most runs, confirming the robustness of the experimental methodology. The anomalies in runs 8 and 9 highlighted the sensitivity of T3 to localized thermal phenomena, which, while not always reflected in T1 and T2, provide valuable insight into transient lubrication and frictional conditions in the wire–die system.
3.2. Friction Coefficient Determination
Table 6 shows the results obtained for the friction coefficient (μ), which was calculated using Equation (2). It can be observed that when the shape factor (Δ) decreases, the contact length (Lc) increases and μ slightly decreases, indicating better lubrication conditions when using pressure dies. This behavior suggests that the hydrostatic pressure developed inside the die promotes lubricant retention and improves film stability along the die–wire interface. In contrast, higher friction values were obtained for the Besal 35 oil + water emulsion, confirming its inferior lubricating performance under the tested conditions.

Table 6.
Calculated values of the friction coefficient (μ): from yield stress values obtained by tensile testing (1) and using the material behavior model (2).
As defined in previous research that has been consulted, the lubrication regime in metal forming operations can be classified based on the Stribeck curve, which relates the friction coefficient to the dimensionless parameter η·v/P, where η is the lubricant viscosity, v is the relative speed, and P is the normal pressure. At low η·v/P values (low speed, low viscosity, or high pressure), the lubricant film is too thin to avoid contact between wire-die surfaces, leading to a boundary lubrication regime, where friction is governed by asperity interactions and chemical films, typically with μ > 0.1–0.2. As η·v/P increases, the process enters the mixed lubrication regime, where both asperity contact and hydrodynamic pressure support the contact load, resulting in moderate friction values (μ ≈ 0.05–0.1). When a continuous fluid film forms and completely separates the surfaces, a hydrodynamic lubrication regime occurs, resulting in very low friction coefficients (μ ≈ 0.001–0.05) and negligible wear [7,11,34].
Based on the results presented in Table 6, all calculated friction coefficients (μ) from both estimation methods exceed 0.05, indicating that none of the drawing conditions achieved full hydrodynamic lubrication. Thus, the obtained friction values range approximately between 0.09 and 0.15, which corresponds to the mixed lubrication regime, where the load is partially supported by the lubricant film and partially by direct asperity contact. Within this regime, moderate friction and partial surface contact occur, suggesting that the lubricant film is not fully continuous but still plays a significant role in reducing metal-to-metal interaction. Comparing the results, the pressure dies (Pressure_19.38 and Pressure_H3F types) generally exhibited lower friction coefficients than the conventional dies, indicating improved lubrication conditions due to the hydrostatic pressure effect that enhances lubricant retention in the die–wire interface.
Among lubricants, Multidraw AL WM and Multipress PEK achieved slightly lower friction than Besal 35, showing better film-forming capability under the tested conditions. The lowest friction values (μ ≈ 0.091–0.112) were recorded for Pressure_H3F dies, suggesting that this configuration most effectively promotes near-hydrodynamic conditions. In contrast, conventional dies showed the highest friction levels (μ ≈ 0.11–0.15), consistent with predominant mixed-to-boundary lubrication behavior. These values are according to those obtained in previous works that have been consulted [14,35], confirming that although full hydrodynamic lubrication was not attained at low drawing speeds, pressure-assisted dies and optimized lubricants significantly improved lubrication efficiency. Overall, the results confirmed that lubricants with higher viscosity enhanced film stability (such as Multidraw AL WM and Multipress PEK), performing better near-hydrodynamic lubrication, while more diluted emulsions like Besal 35 are less effective under the same drawing conditions.
3.3. Surface Quality and Defects
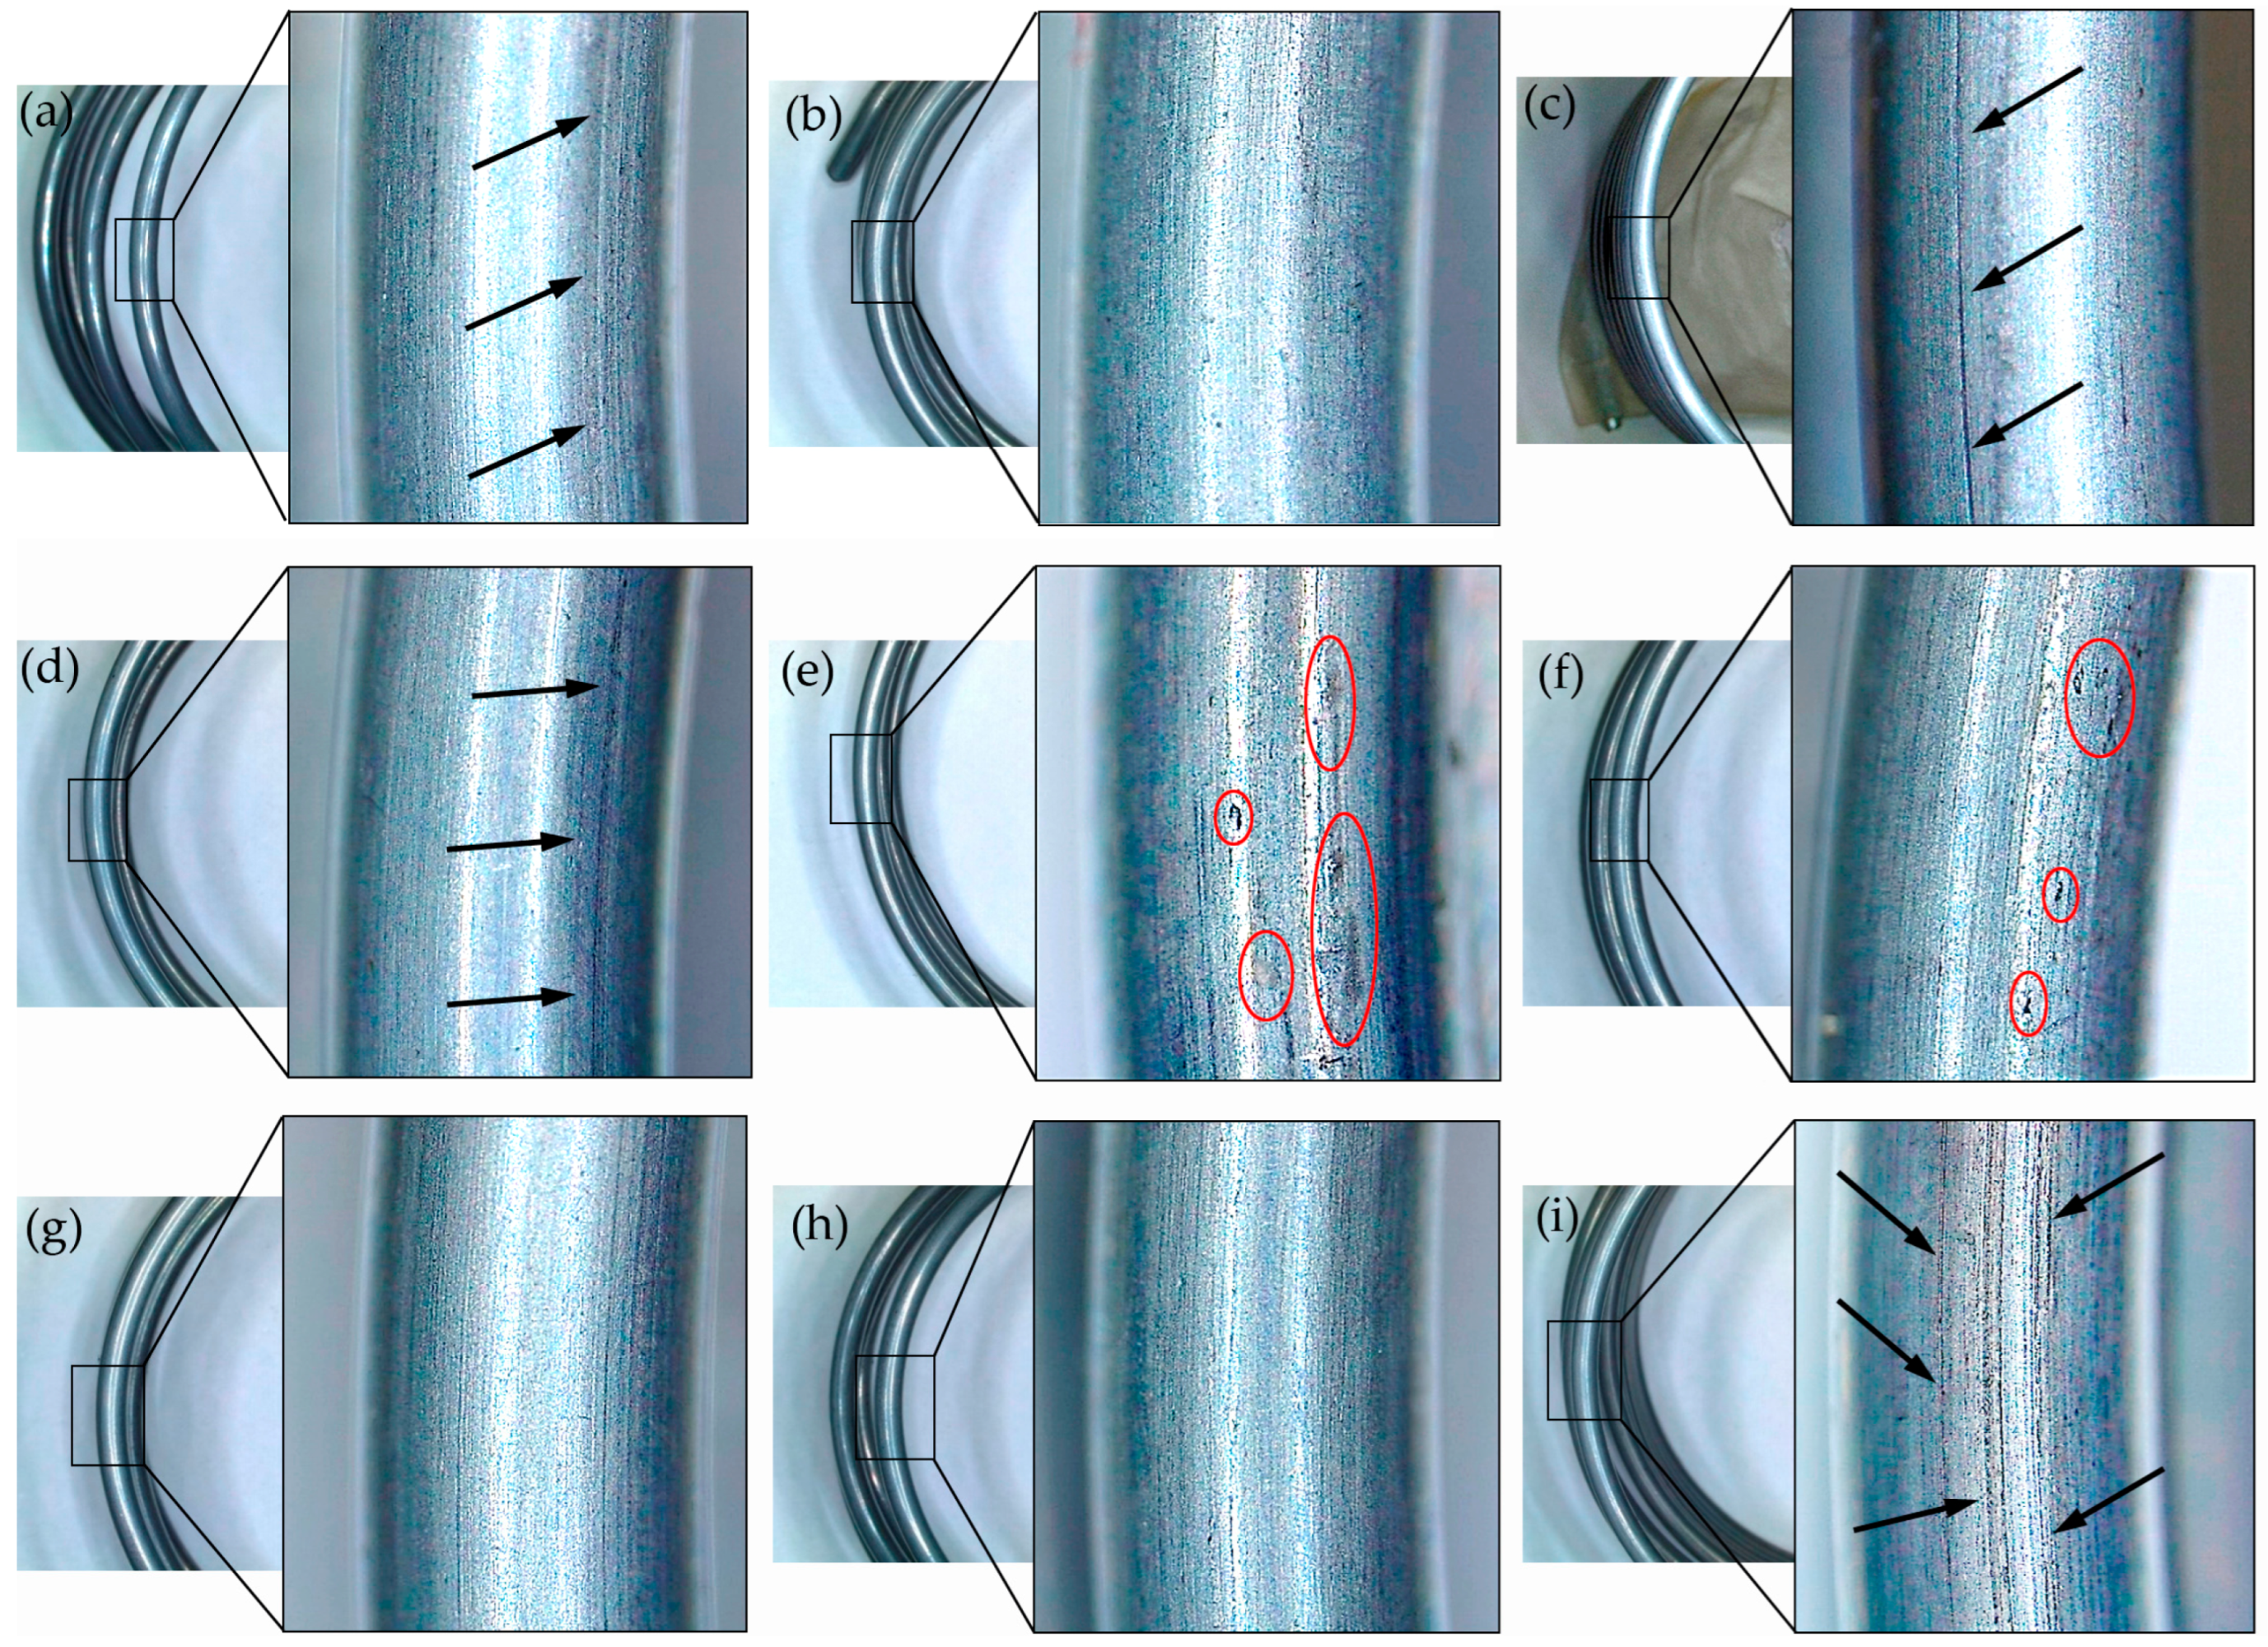
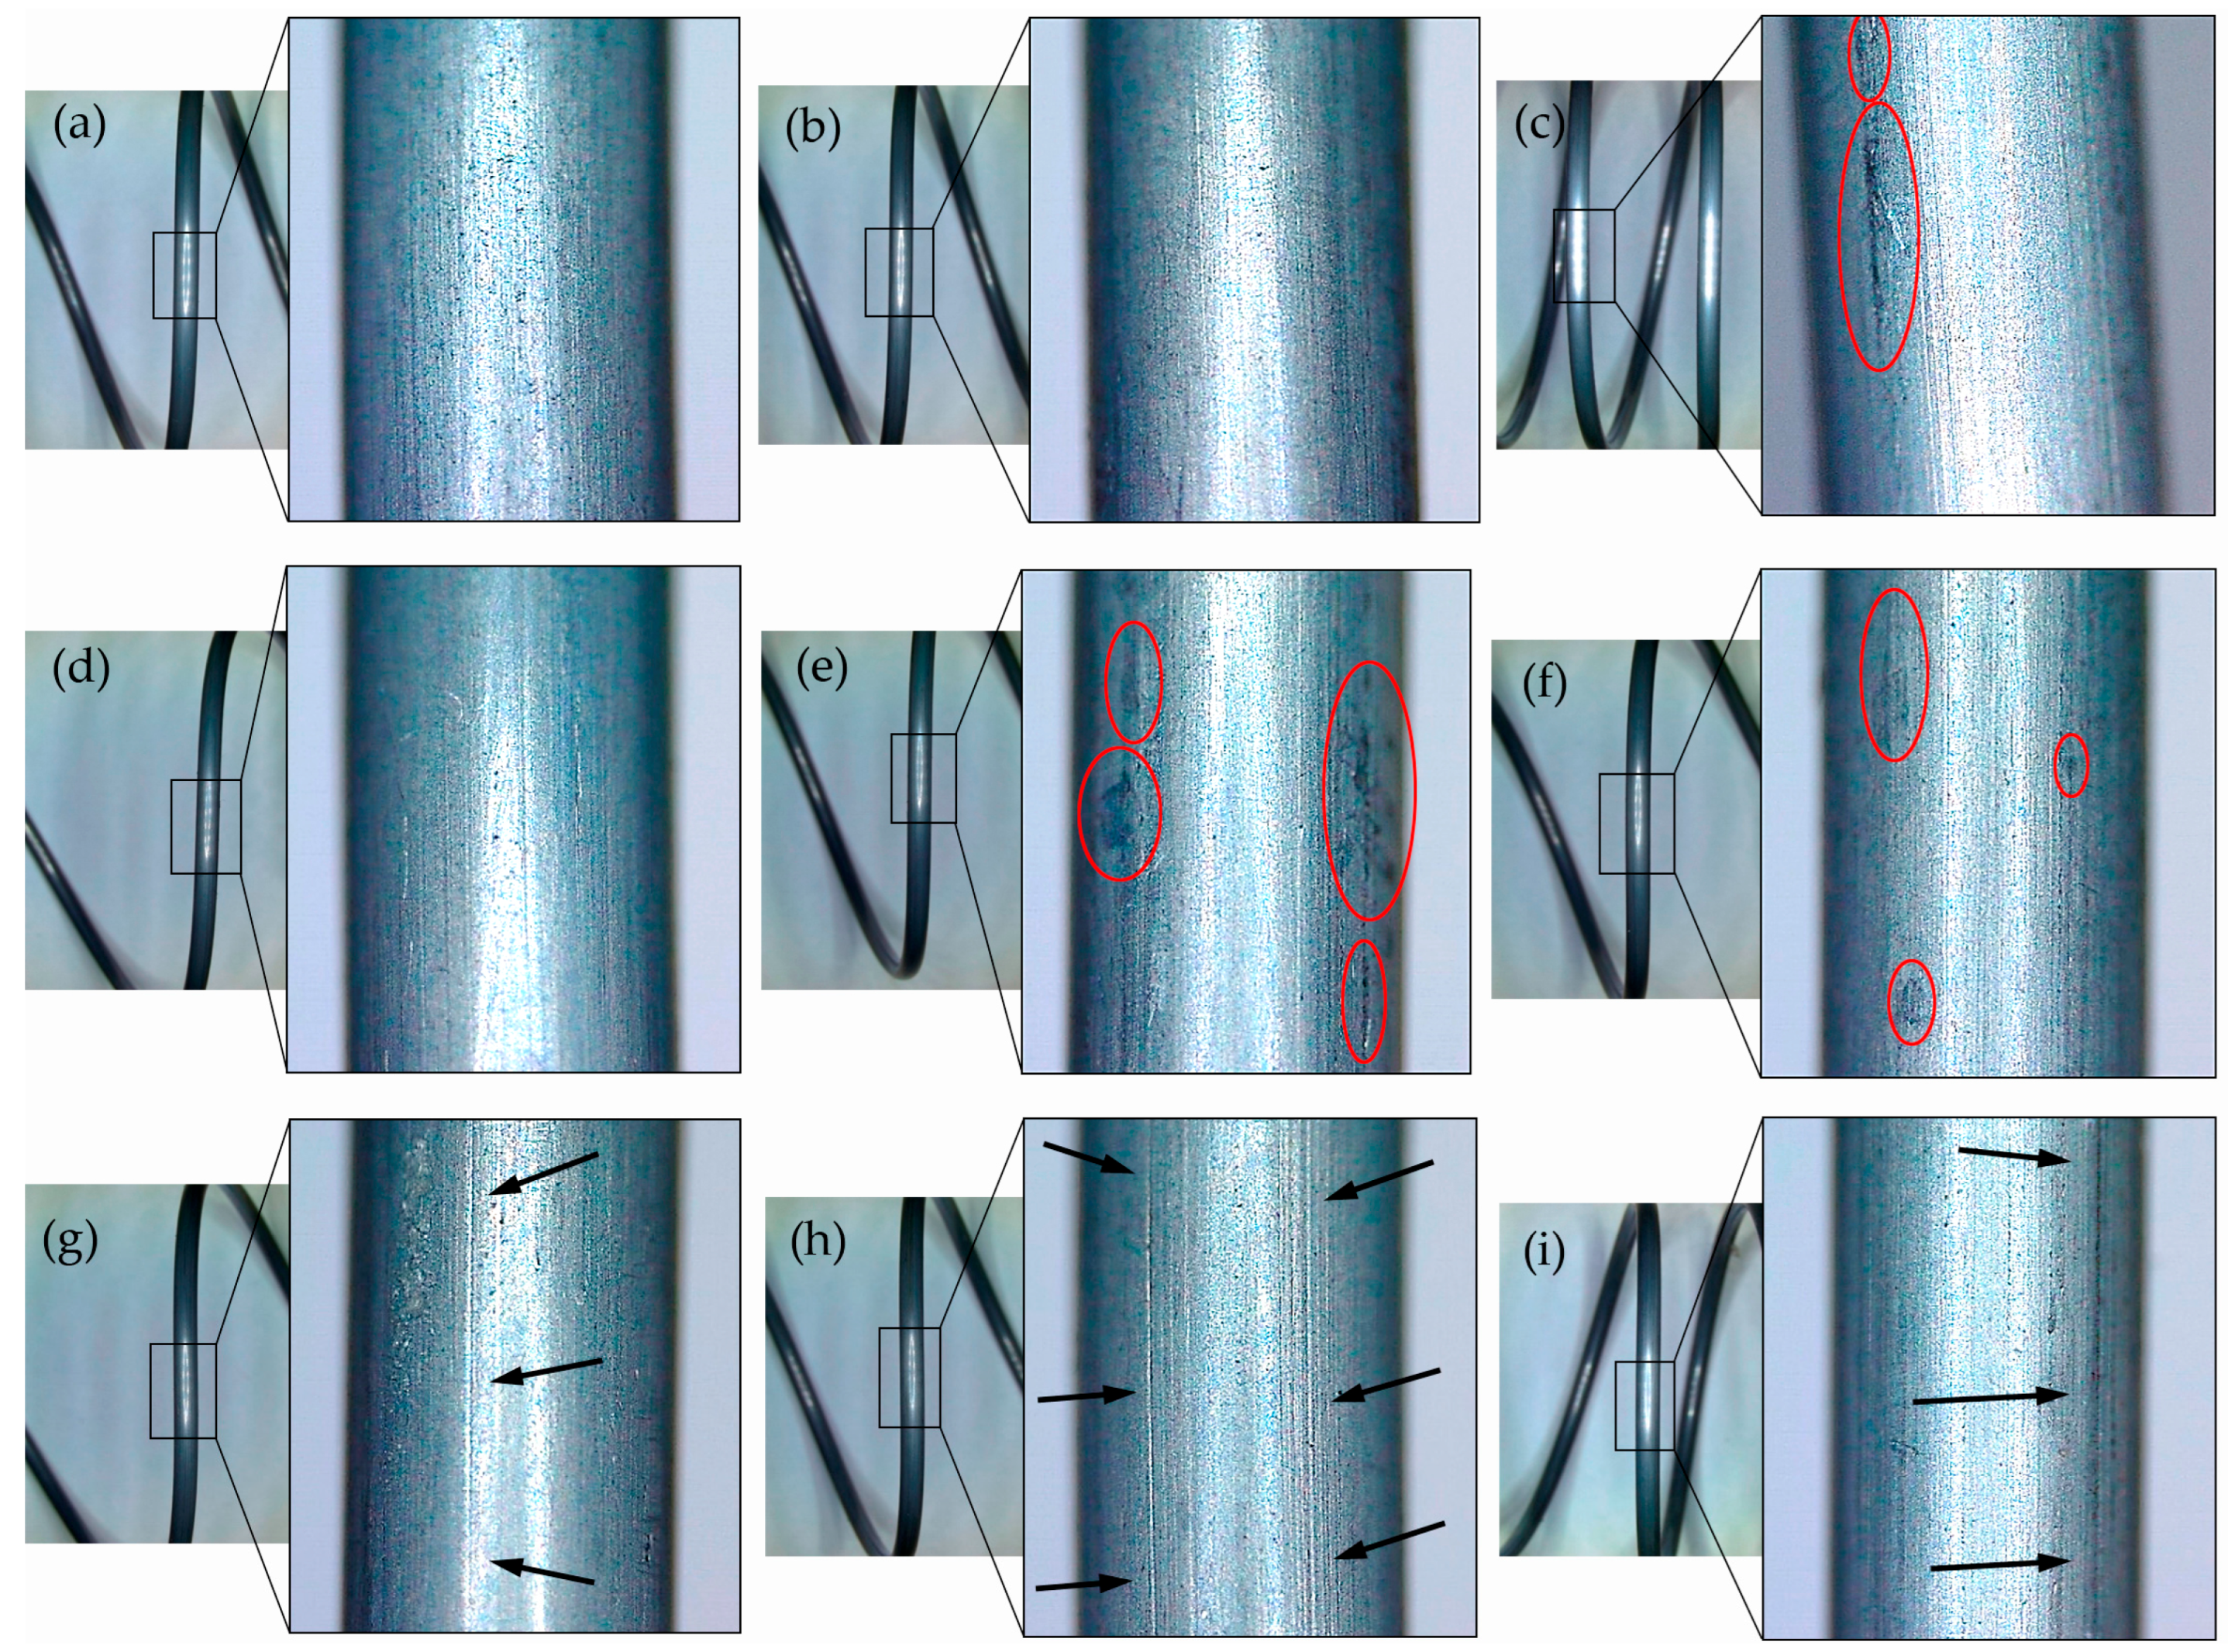
Finally, the surface quality has been evaluated by analyzing the images in Figure 8 and Figure 9, which were obtained by optical microscopy. At first glance, the wires drawn with pressure dies (pressure_19.38 and pressure_H3F) seemed to present a better surface finish; however, microscopic examination showed that the overall quality—considering marks, surface defects, and adhered impurities—was comparable to that achieved with the standard die. This indicates that surface condition depends less on die geometry and more on factors such as the lubricant type used and the cleanliness of the die and the lubricant itself.
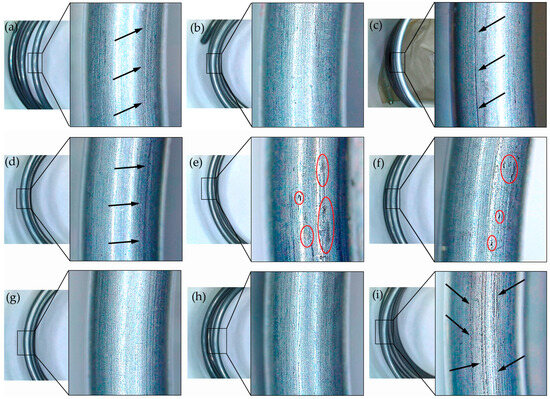
Figure 8.
Surface quality and defects observed in the drawn wires (coils from above view), with magnification of 12× (left image) and 110× (right detail): (a–i) first–ninth run. Red spots indicate impurities and stains, and black arrows indicate longitudinal marks.
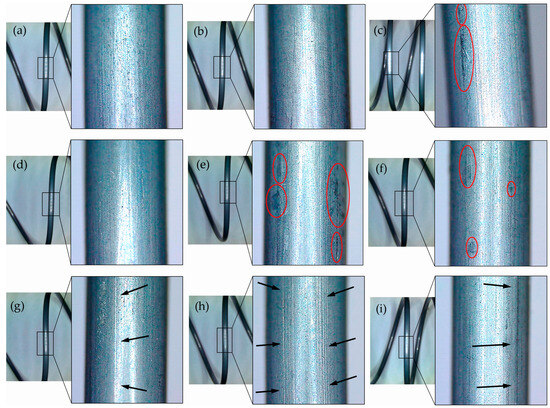
Figure 9.
Surface quality and defects observed in the drawn wires (coils from the side view), with magnification of 12× (left image) and 110× (right detail): (a–i) first–ninth run. Red spots indicate impurities and stains, and black arrows indicate longitudinal marks.
In the fifth and sixth experiments (Figure 8e,f), surface contamination was evident on the wires (dark spots marked in red), mainly caused by deposits from the Multipress PEK lubricant. Since this lubricant is intended for steel and iron alloys, it appears less suitable for the ZnAl15% wire, leading to residue accumulation. In contrast, the other lubricants tested produced cleaner wire surfaces, confirming the decisive role of lubricant selection in reducing impurities and stains.
Additional surface features, such as random longitudinal lines and marks (indicated with the black arrows in Figure 8 and Figure 9), were also detected in some experiments. These are most likely caused by entrained debris or chips dragged through the die, leaving continuous imprints on the wire. Thus, the clear longitudinal indentations seen in Figure 8a,c,d, and i may result from friction with metallic particles adhered to the wire or remaining suspended in the lubricant, observed especially in the conventional die and with H3F carbide.
Similar observations are corroborated in the images of Figure 9c,e,f, in which dark stains (dark spots marked in red) suggest that the use of Multipress PEK lubricant type further influences lubrication and surface cleanliness (Figure 8e,f and Figure 9c,e,f). Longitudinal marks (indicated with the black arrows) are also more evident in the images of Figure 9g,h,i (experiments 7th to 9th), suggesting a poor performance of the water + oil emulsion-based lubricant Besal 35 in preventing material tearing and the accumulation of abrasive metal particles during the wire drawing process. In summary, the study confirms that surface quality is governed primarily by lubricant performance, process hygiene, while die geometry plays an important role too.
3.4. Statistical Analysis of the Results
3.4.1. Drawing Force, Fd
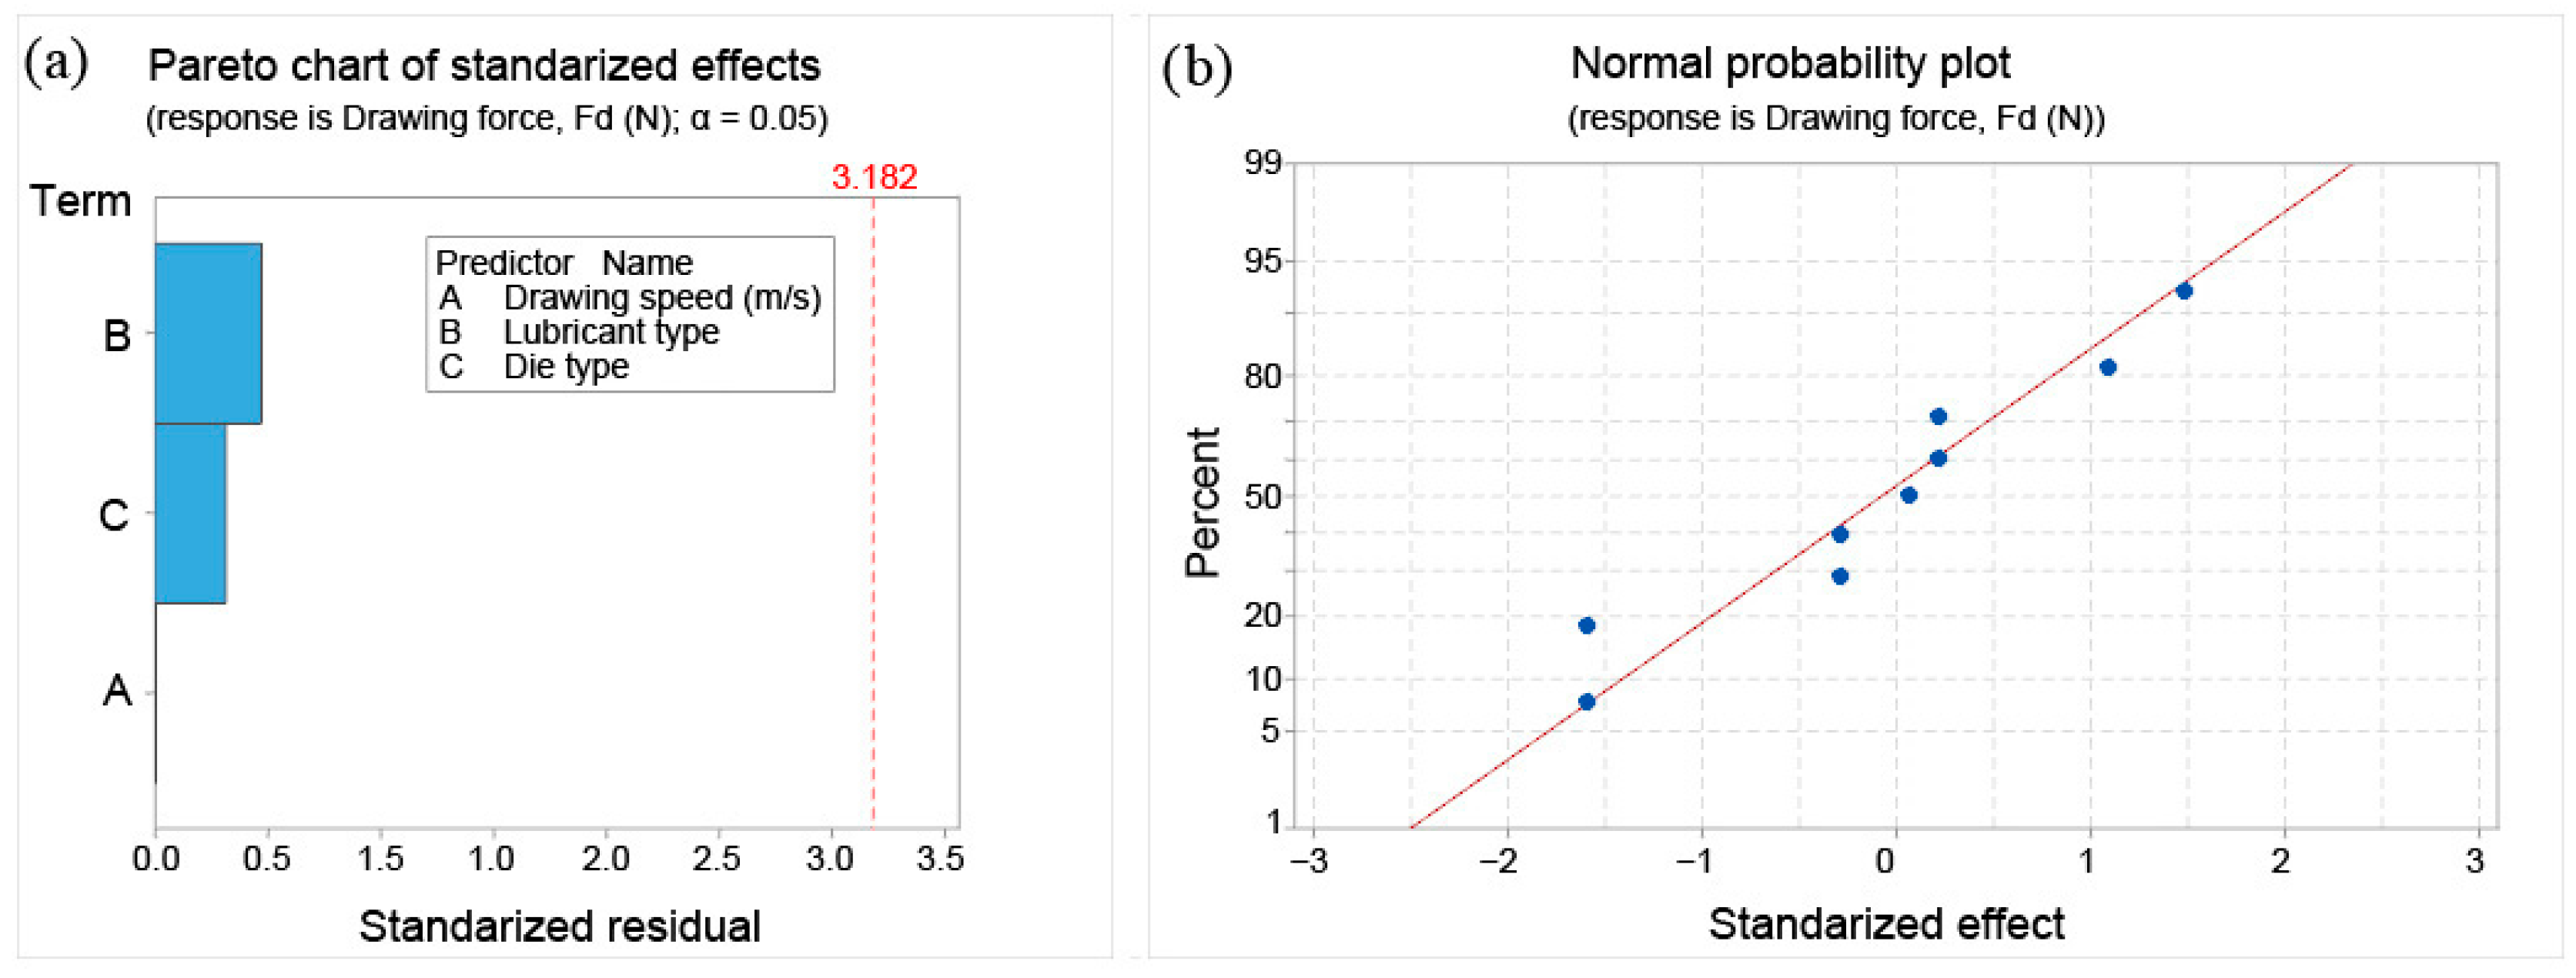
The regression model of the drawing force (Fd) is shown in Equation (10) and allows the prediction of the drawing force as a function of die type, lubricant type, and drawing speed (v). Figure 10b shows the normal probability plot of the standardized residuals of this response, and Figure 10a shows the Pareto chart of the standardized effects for each factor on the response variable. The effects plot in Figure 10 reflects the absolute effect of each input factor on the drawing force.
Lubricant type = (Multidraw AL WM, Multipress PEK, Besal 35 emulsion)
Die type = (Conventional, Pressure_19.38, Pressure_H3F)
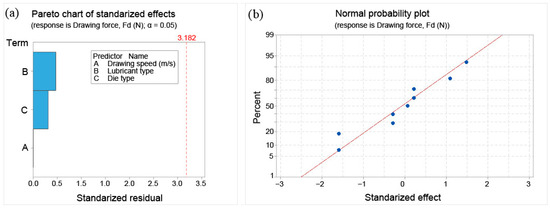
Figure 10.
(a) The influence of input variables on the drawing force (Fd) and (b) quality of the regression model.
Regression analysis yielded a low R2 (33.11%), but the normal probability plot (Figure 10b) confirmed consistency with the model. It is important to note that a linear regression model can still provide reliable predictive capability even when the R2 value is relatively low. While R2 measures the proportion of total variability explained by the model, a low value may simply reflect inherent variability or noise in the data that the model does not capture, such as complex interactions or other unmodeled factors. Predictive reliability depends more critically on the behavior of the residuals. In our case, this is precisely what occurs: the standardized residuals of both drawing force and friction coefficient models are approximately normally distributed, as confirmed by the normal probability plots, and all values fall within ±2 without significant outliers. This indicates that, despite the modest R2, the models adequately capture the central trend of the data, produce consistent predictions within the studied range, and can be considered statistically valid for analyzing the influence of the considered experimental factors.
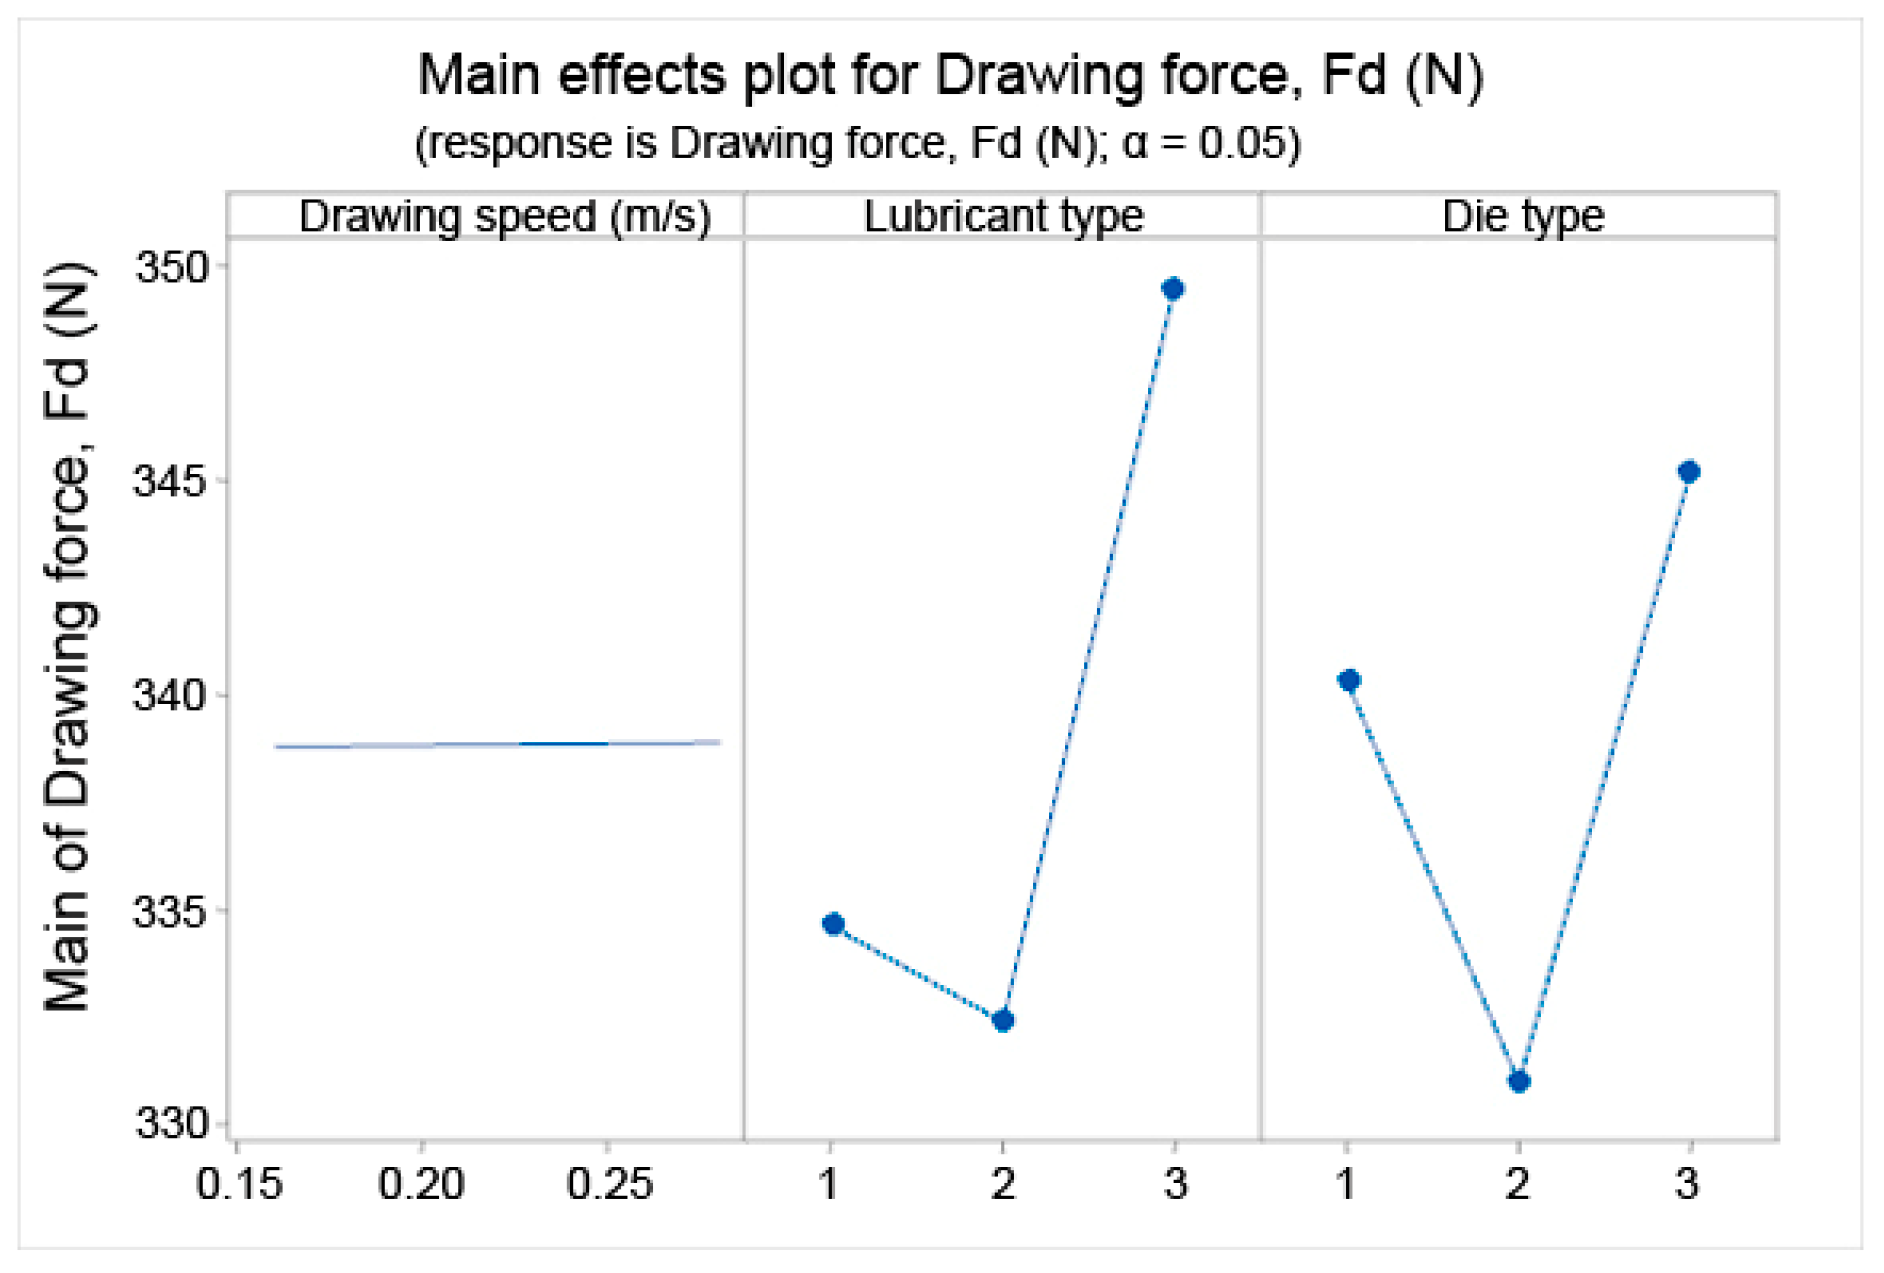
Both the Pareto chart and main effects plot (Figure 10a and Figure 11) showed that drawing speed had a negligible influence on drawing force, while lubricant and die type were decisive factors.
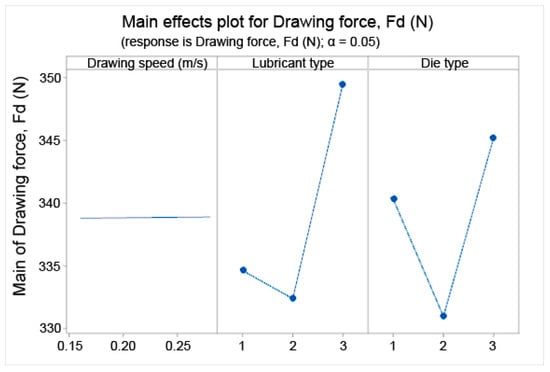
Figure 11.
Absolute effects of input variables on the drawing force (Fd). Lubricant type (1 = Multidraw AL WM, 2 = Multipress PEK, 3 = Besal 35 Emulsion) and if die type (1 = conventional die, 2 = pressure_19.38 die, 3 = pressure_H3F die).
As can be seen in Figure 10a and Figure 11, the most influential factor on the drawing force is the type of lubricant used, followed by the type of die, while the drawing speed is the factor with the lowest effect on this response variable. Emulsion with Besal 35 oil significantly increased the force compared to Multidraw AL WM oil and Multipress PEK oil, and the Pressure_H3F die led to higher forces than the standard/conventional and Pressure_19.38 die. Overall, lubricant selection was the dominant factor, followed by die type. The contour plot in Figure 12 allows for evaluating interactions among die type, lubricant, and drawing speed, identifying the combinations that yield the most favorable conditions to reduce the drawing force.

Figure 12.
Contour plots with the combined effects on the drawing force (Fd): (a) die type and lubricant type; (b) die type and drawing speed; and (c) lubricant type and drawing speed.
The use of pressure dies enabled lower drawing force with specific combinations, particularly at lower and higher drawing speeds (v). The pressure_19.38 die achieved low drawing forces even at low speeds, while the use of Besal 35 oil-based water emulsion combined with medium drawing speeds generally led to higher drawing forces.
3.4.2. Friction Coefficient, μ
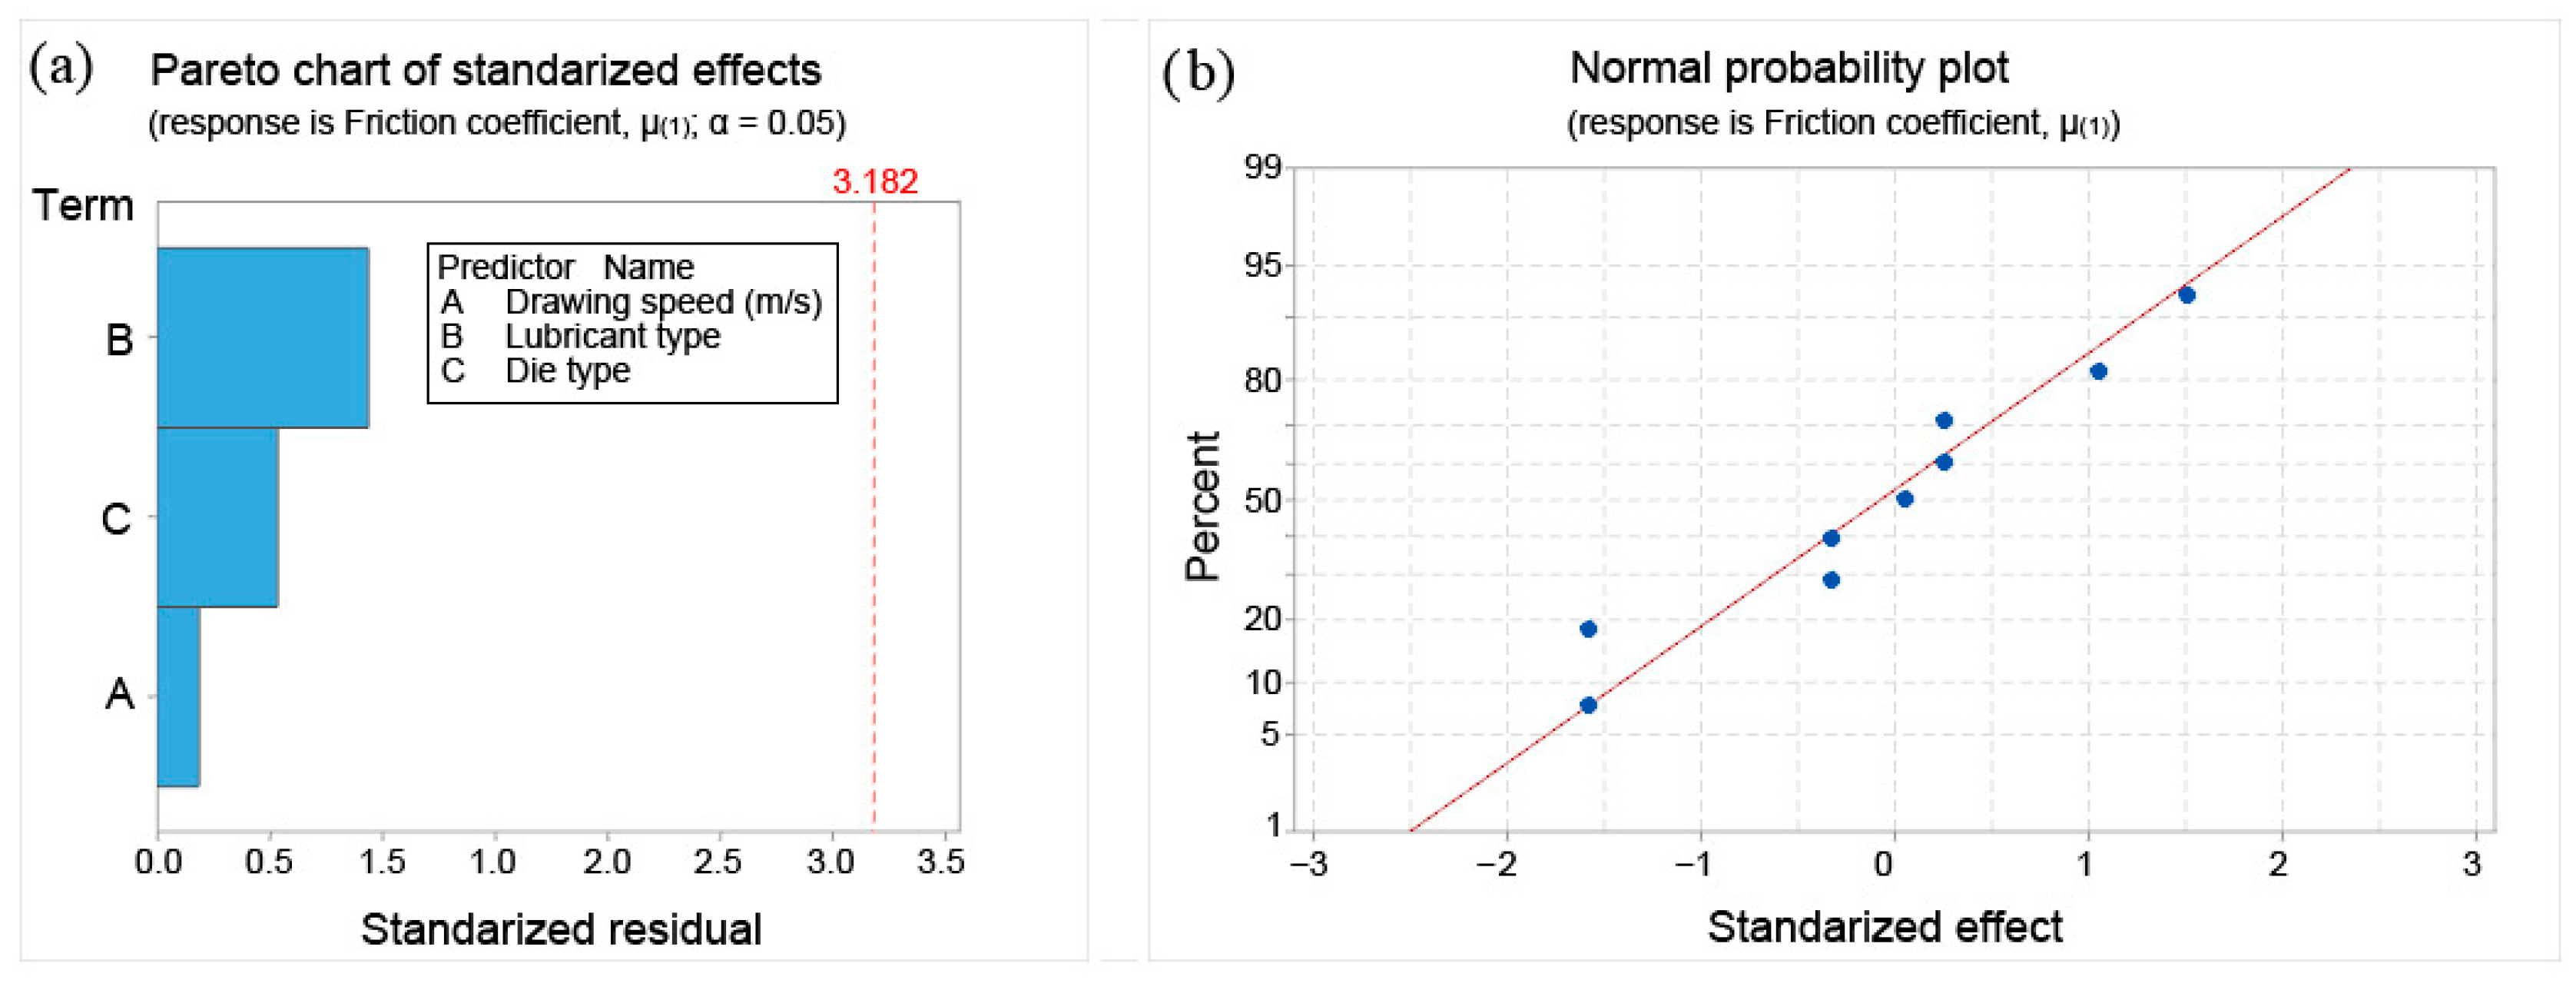
The regression model of the coefficient of friction (µ = µ(1)) is shown in Equation (11) as a function of die type, lubricant type, and drawing speed (v). Figure 13b shows the normal probability plot of standardized residuals of the output response, and Figure 13a shows the standardized effects for each factor on the response variable, while the effects plot in Figure 14 reflects the absolute effect of each input factor on the friction coefficient.
Lubricant type = (Multidraw AL WM, Multipress PEK, Besal 35 emulsion)
Die type = (Conventional, Pressure_19.38, Pressure_H3F)
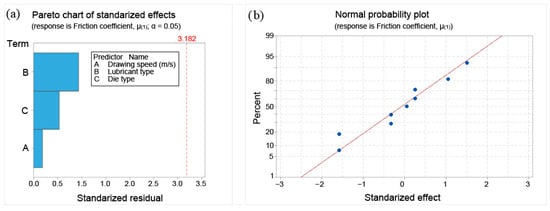
Figure 13.
(a) The influence of input variables on the coefficient of friction (µ = µ(1)) and (b) quality of the regression model.
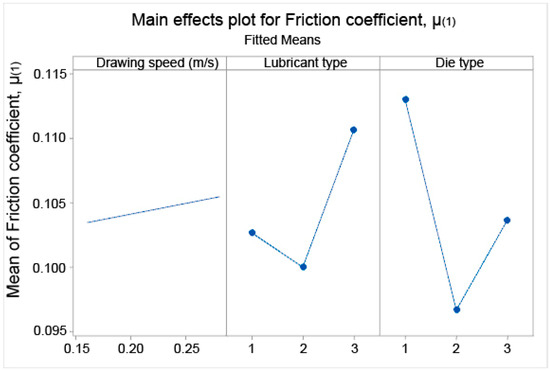
Figure 14.
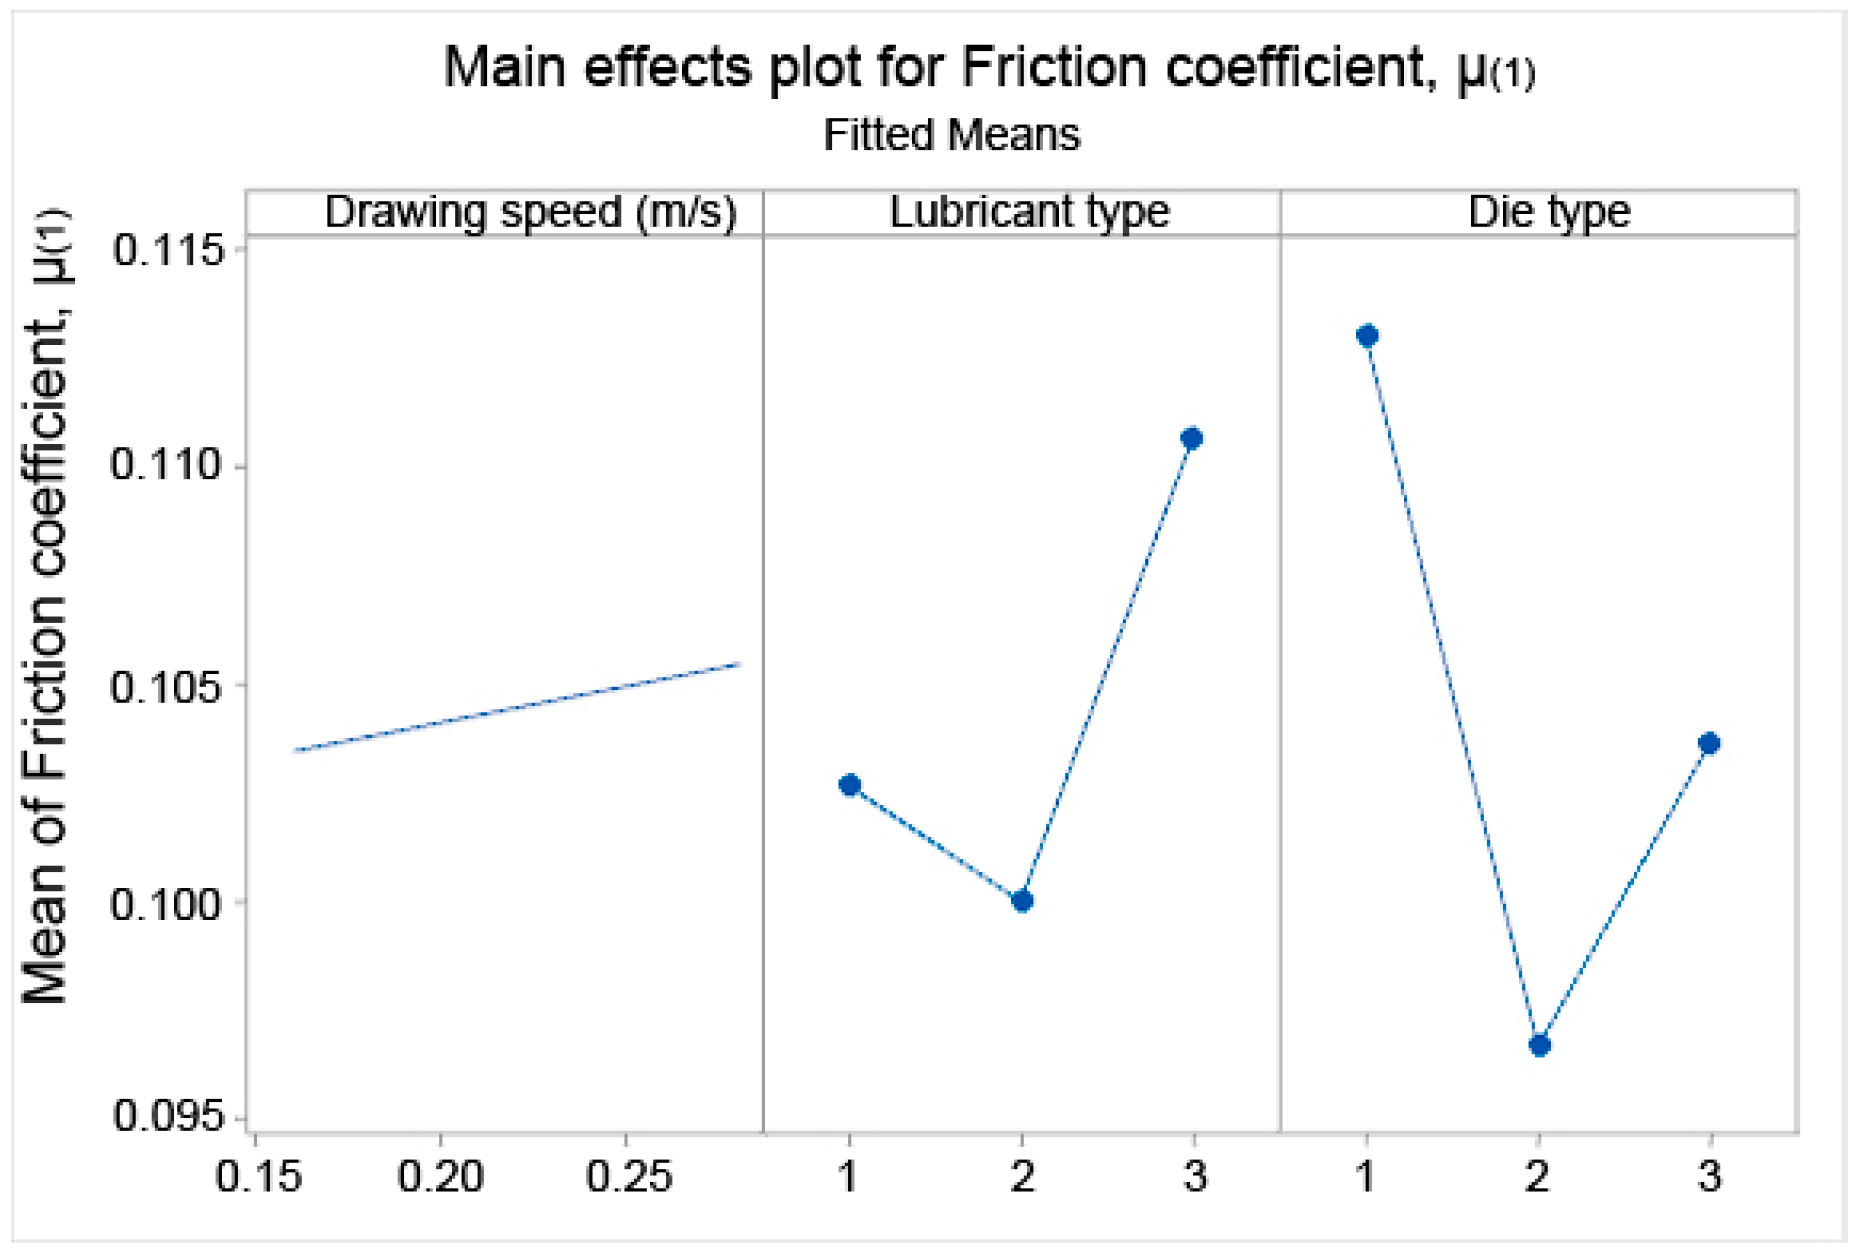
Absolute effects of input variables on the coefficient of friction (µ = µ(1)). If lubricant type (1 = Multidraw AL WM, 2 = Multipress PEK, 3 = Besal 35 Emulsion) and if die type (1 = conventional die, 2 = pressure_19.38 die, 3 = pressure_H3F die).
Although the R2 value is moderate (53.87%), the normal probability plot confirms the model’s validity. The Pareto chart (Figure 12a) and main effects plot (Figure 13) show that die type is the most influential factor on the friction coefficient, followed by lubricant type, while drawing speed has the least effect.
The contour plots in Figure 15 show the effect of the interactions among die type, lubricant, and drawing speed, identifying the combinations that allow lower values of the coefficient of friction.

Figure 15.
Contour plots with the combined effects on the coefficient of friction (µ = µ(1)): (a) die type and lubricant type; (b) die type and drawing speed; and (c) lubricant type and drawing speed.
As can be shown in Figure 15a, the lower values of the friction coefficient have been achieved when working with pressure drawing dies. The combination of pressure_H3F type die and Multidraw AL WM oil (water miscible at 20% concentration) reduces μ < 0.095, and pressure_19.38 carbide type die also throws the lower friction when combined with both Multipress oil and water + Besal 35 oil emulsion. The worst friction performance is evidenced for the conventional die type in all experimental conditions tested, as can be seen in contour plots of Figure 15a,b, increasing the friction coefficient by ≈ 26% with respect to the more favorable conditions. On the other hand, from the plots in Figure 15b,c, it is possible to interpret that lower and higher drawing speed (v) has a positive effect on the friction conditions, minimizing the friction coefficient in the wire-die interface.
3.4.3. Wire Temperature, T2
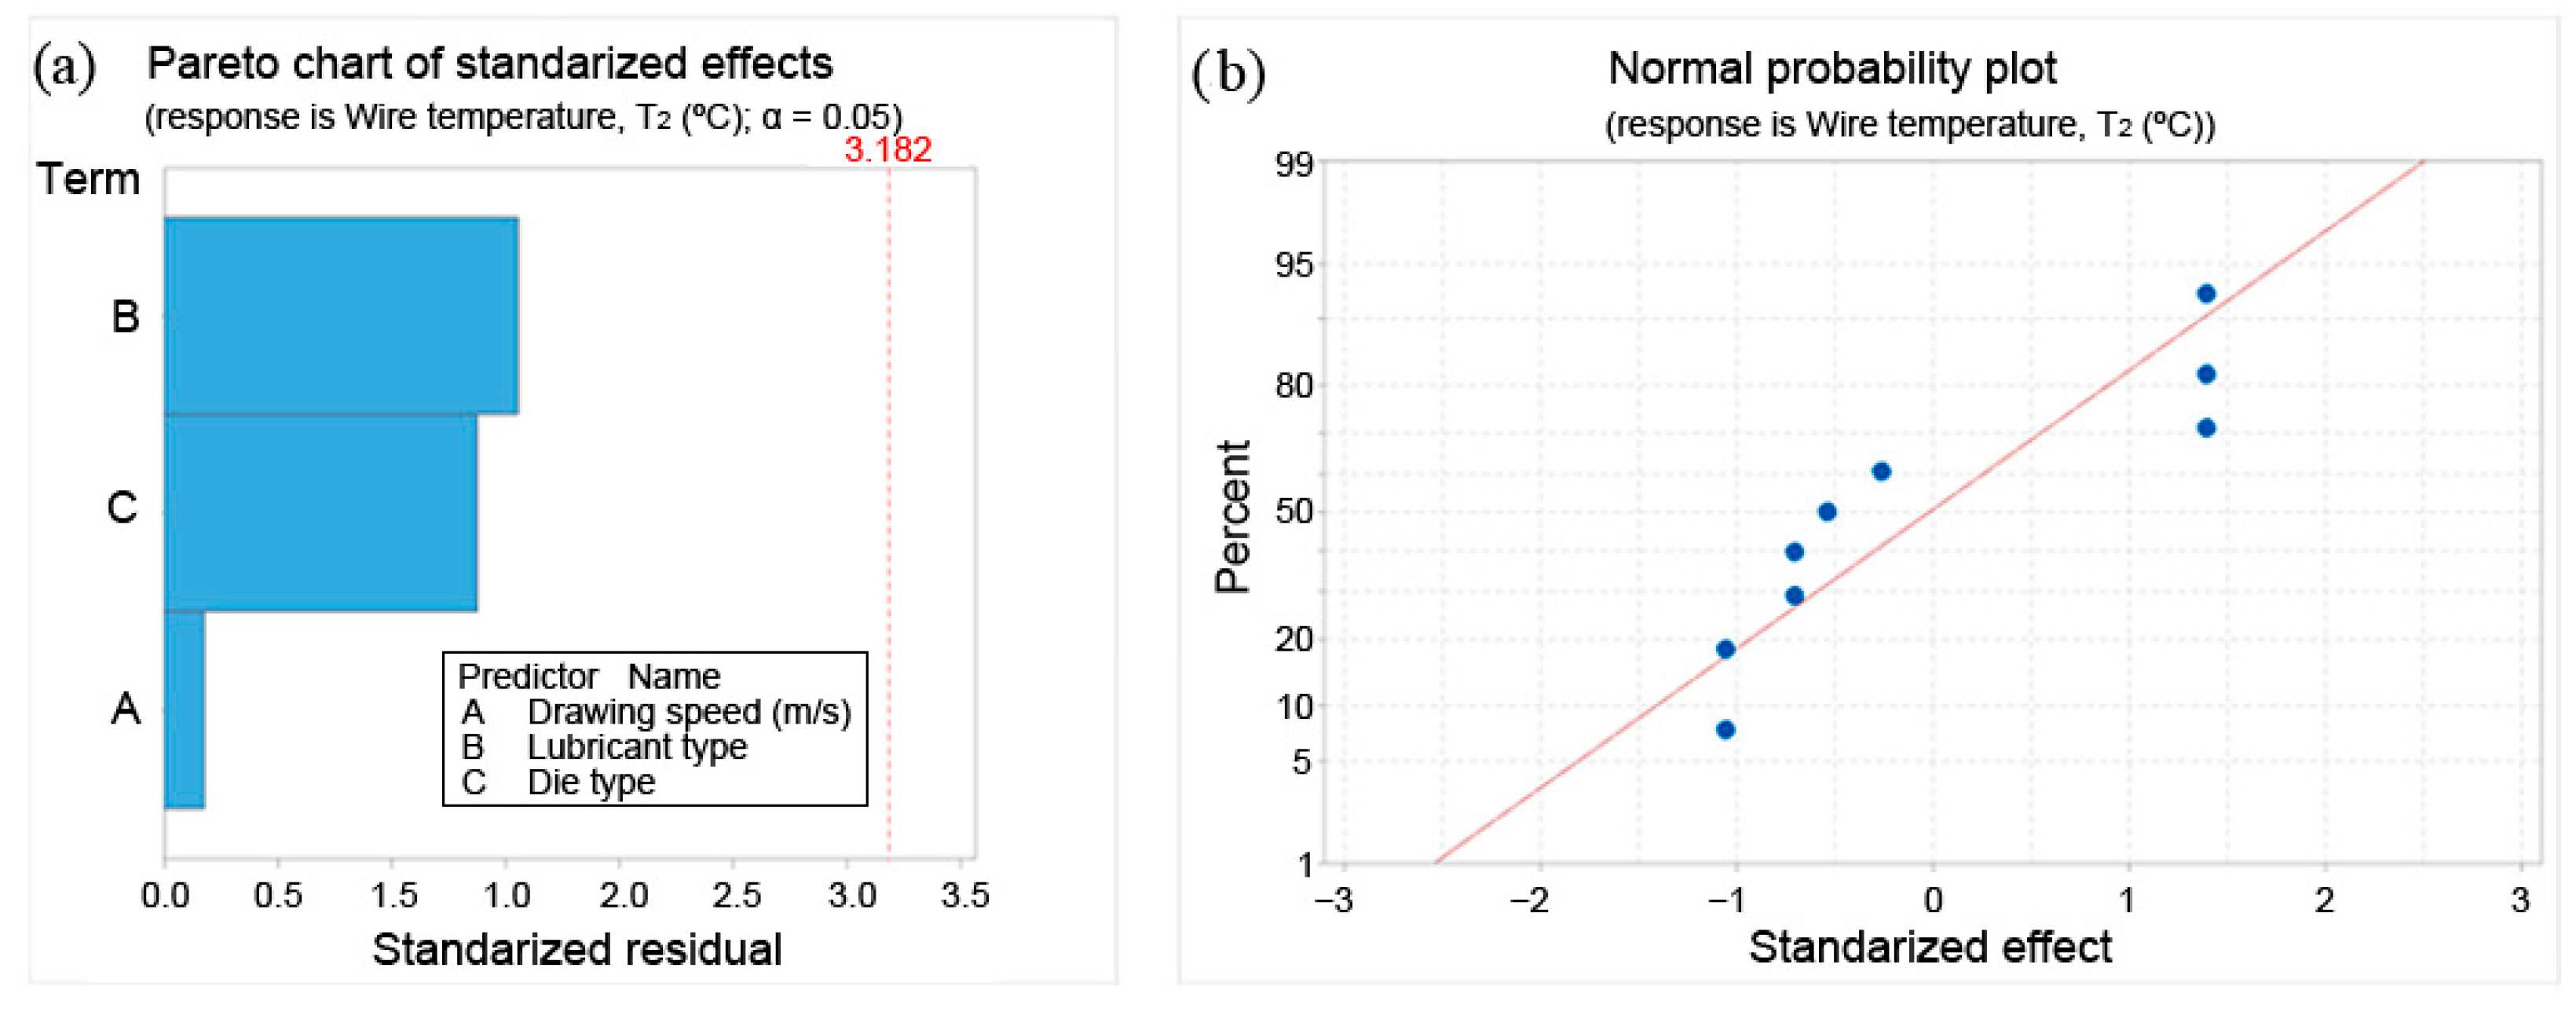
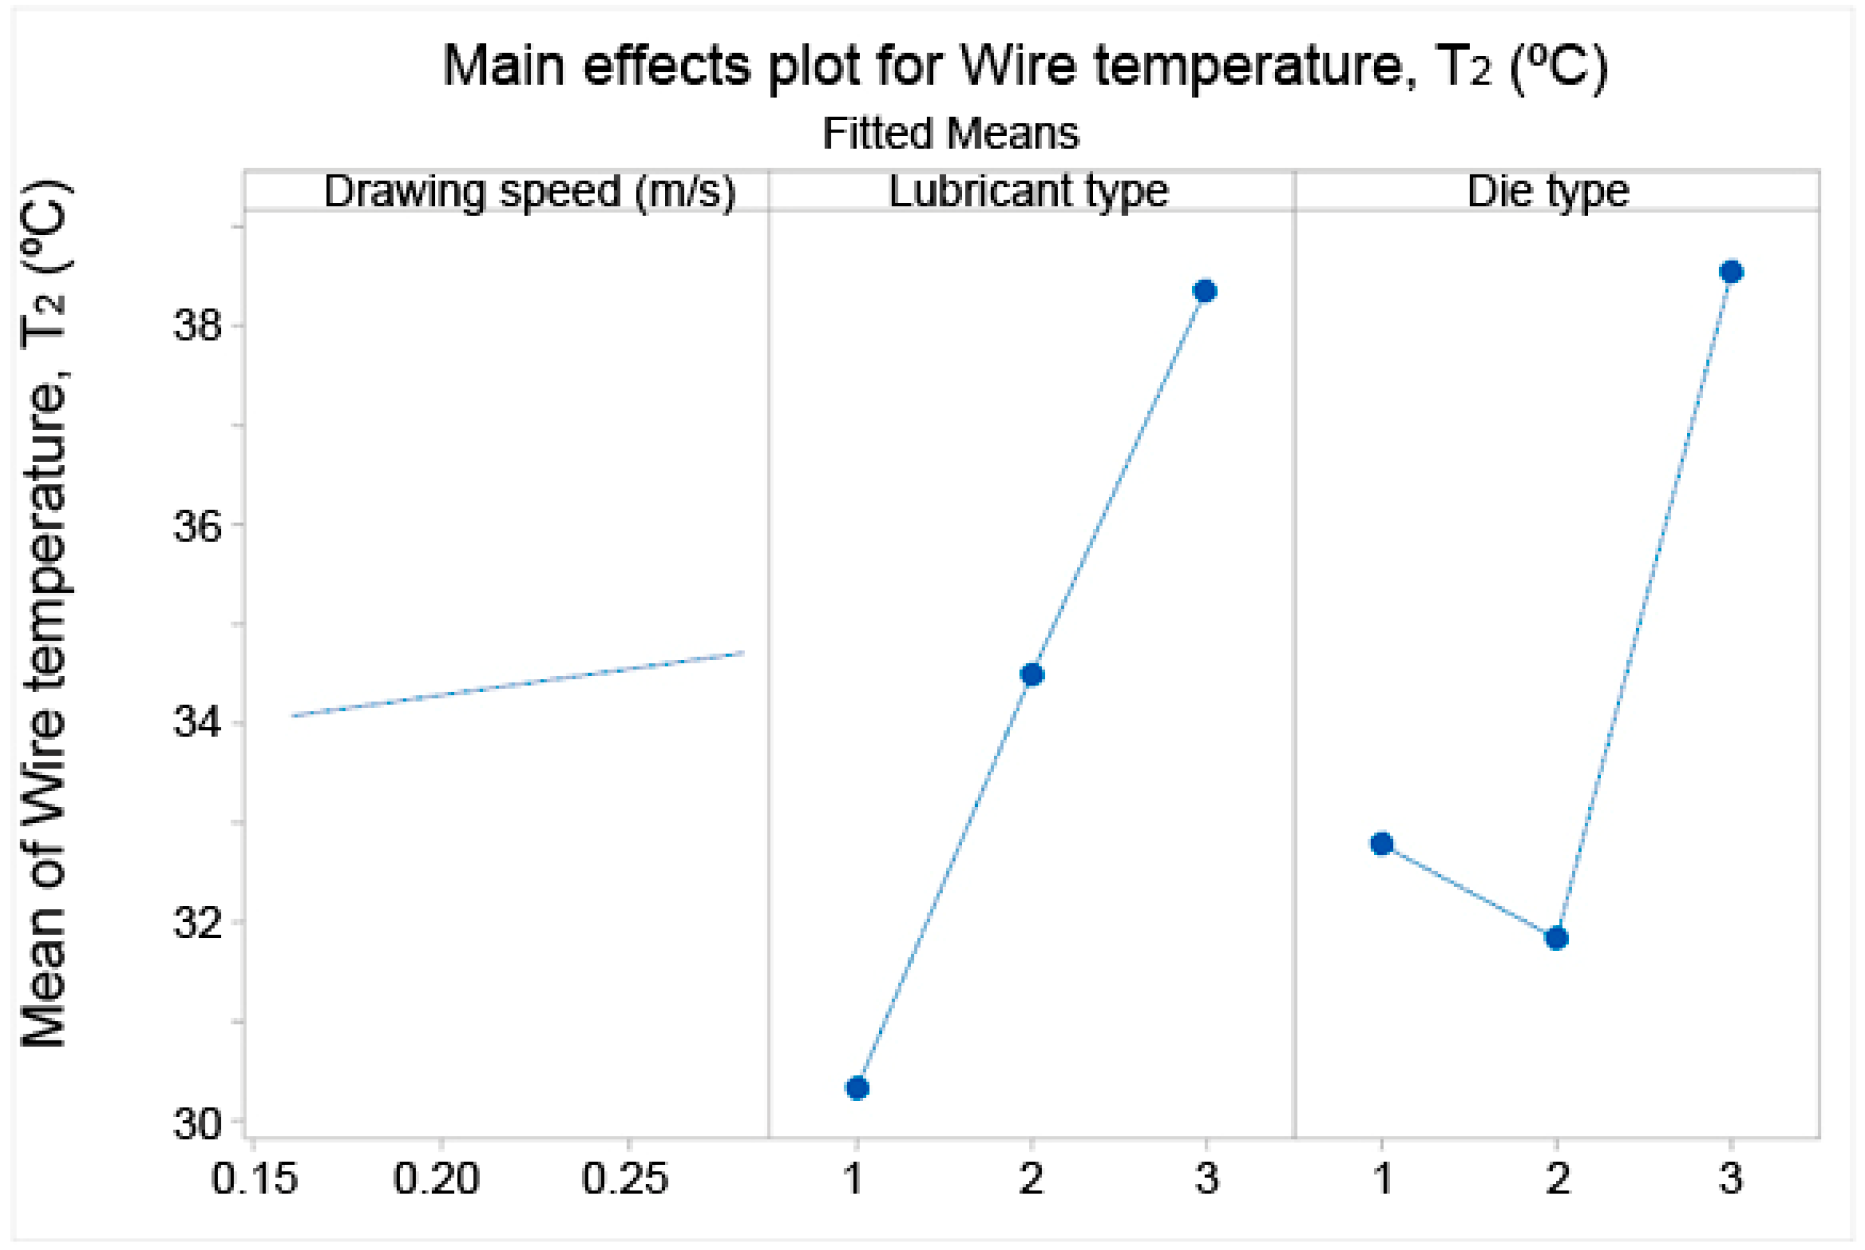
The regression model of the temperature measured on the drawn wire just out of the die box and measured by thermocouple (T2) is shown in Equation (12) as a function of die type, lubricant type, and drawing speed (v). Figure 16b shows the normal probability plot of standardized residuals concerning the output response, and Figure 16a shows the standardized effects for each factor on the response variable. The effects plot in Figure 17 reflects the absolute effect of each input factor on the friction coefficient determined from experimental data (µ = µ(1)).
Lubricant type = (Multidraw AL WM, Multipress PEK, Besal 35 emulsion)
Die type = (Conventional, Pressure_19.38, Pressure_H3F)
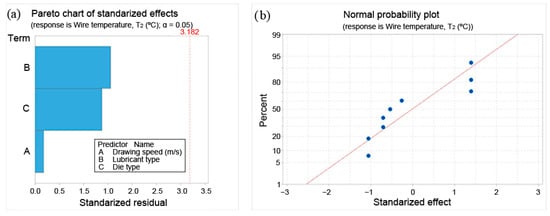
Figure 16.
(a) The influence of input variables on the wire temperature out of the die box (measured by thermocouple, T2) and (b) quality of the regression model.
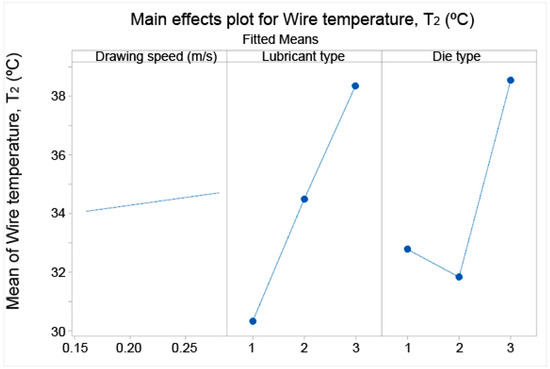
Figure 17.
Absolute effects of input variables on the wire temperature out of the die box (measured by thermocouple, T2). If lubricant type (1 = Multidraw AL WM, 2 = Multipress PEK, 3 = Besal 35 Emulsion) and if die type (1 = conventional die, 2 = pressure_19.38 die, 3 = pressure_H3F die).
The regression model achieved R2 = 76.32%, indicating a strong fit. The normal probability plot (Figure 16b) supports this, with all standardized residuals within [−2, 2]. The Pareto chart (Figure 16a) and main effects plot (Figure 17) show that lubricant type has the greatest effect on wire temperature, followed by die type, while drawing speed has the least influence.
The contour plots in Figure 18 show the effect of the interactions among die type, lubricant, and drawing speed, identifying the combinations that affect wire temperature.

Figure 18.
Contour plots with the combined effects on the wire temperature out of the die box (measured by thermocouple, T2): (a) die type and lubricant type; (b) die type and drawing speed; and (c) lubricant type and drawing speed.
Pressure_19.38 die type significantly reduced wire temperature (T2 < 30 °C) when used with Multidraw AL WM oil, while the water-based emulsion + Besal 35 oil causes the drawn wire to increase its temperature up to 35 °C < T2 < 40 °C, especially when combined with pressure-type dies, since they have a longer contact length (Lc) than the conventional type (Figure 18a). A medium value of the drawing speed (v) is related to a lower value in the temperature of the drawn wire when working with the pressure_19.38 die type, but higher temperatures occur with pressure_H3F die across the entire drawing speed range tested (Figure 18b). Contour plot in Figure 18c confirms the poor cooling performance of the water + Besal 35 oil emulsion practically throughout the entire drawing speed range.
3.4.4. Die Temperature, T1
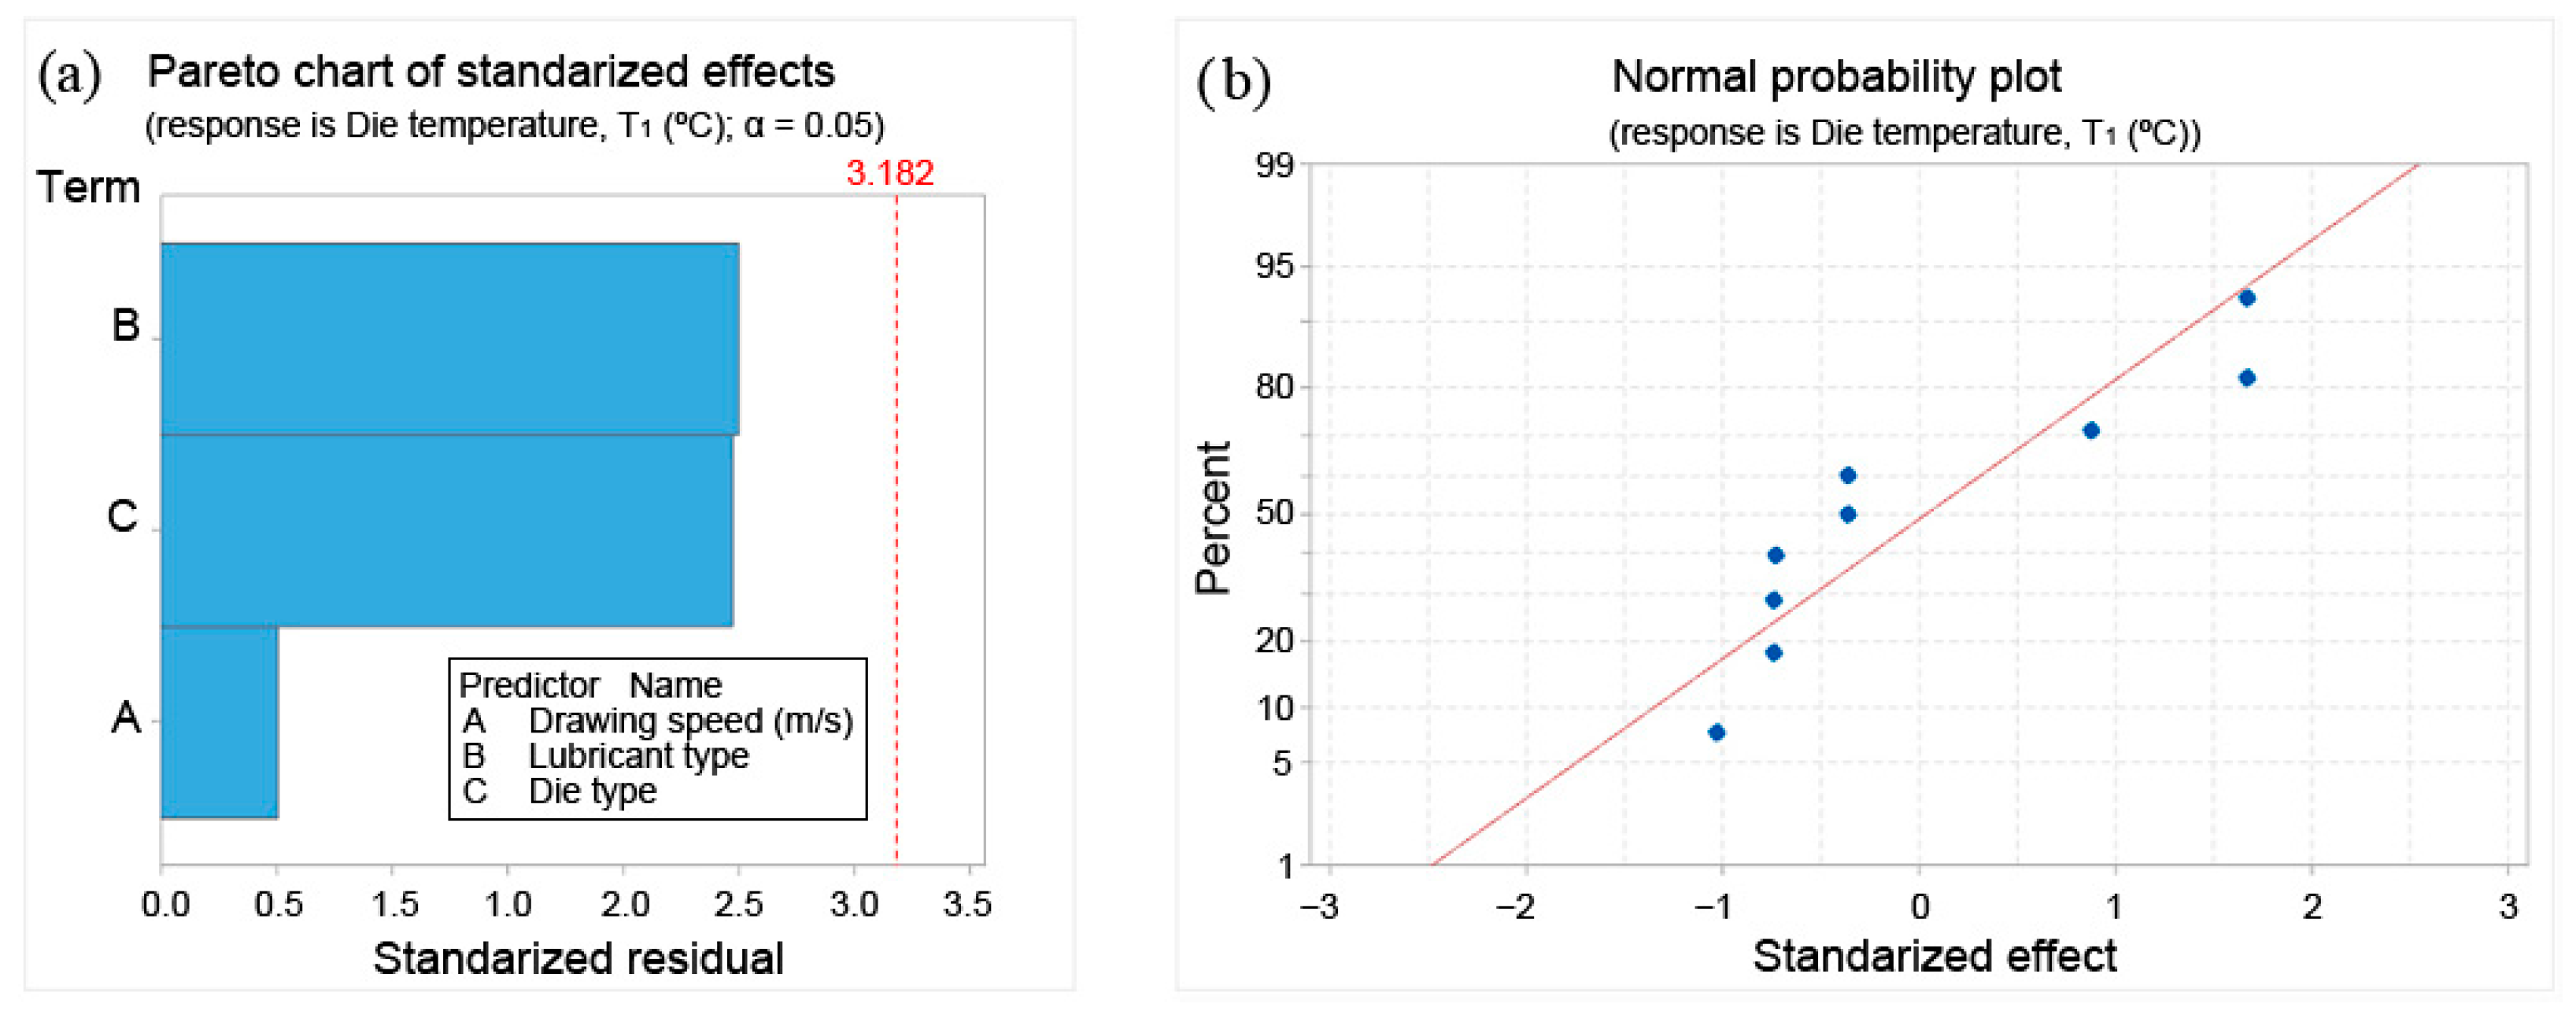
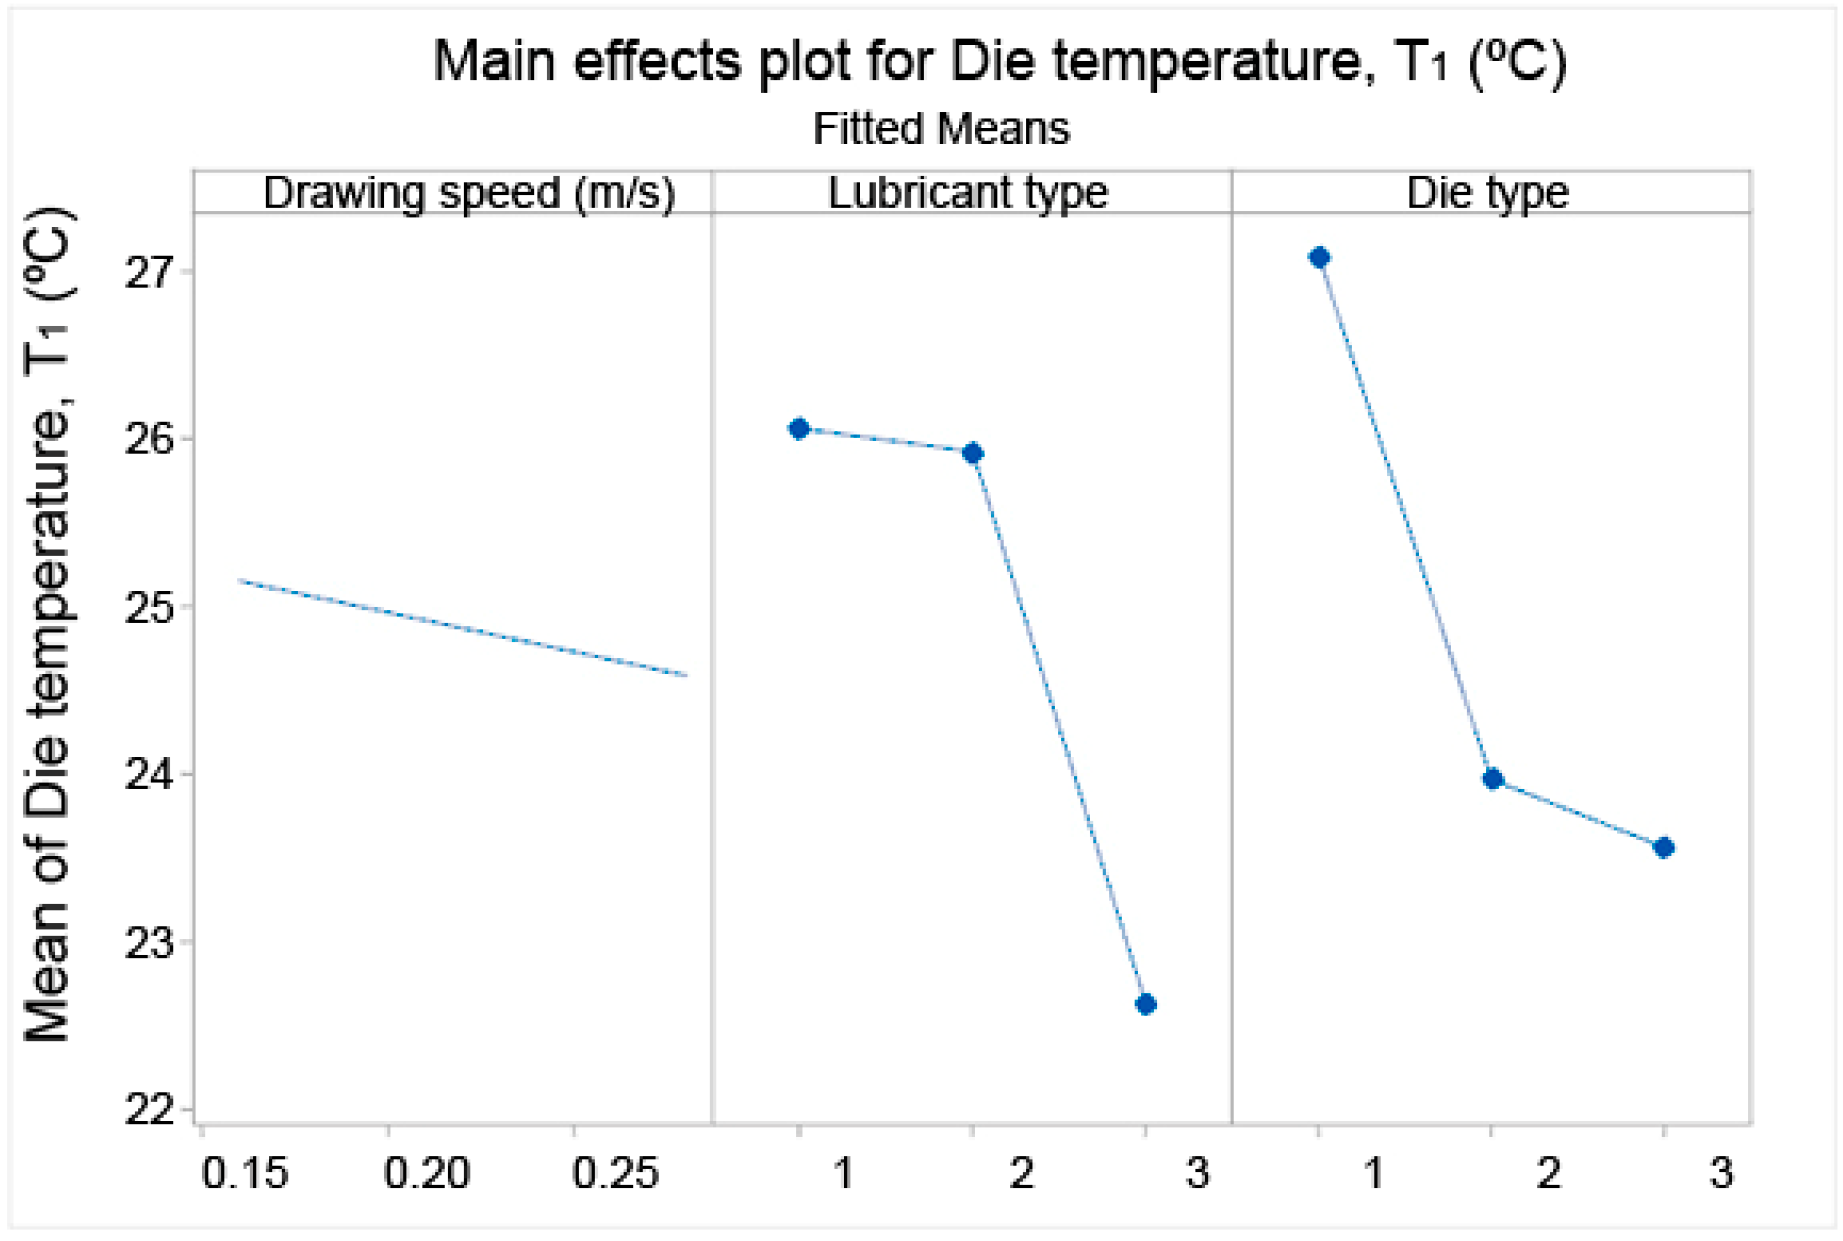
The regression model of the temperature measured by thermocouple (T1), which is in direct contact with the output face of the drawing die, is shown in Equation (13) as a function of die type, lubricant type, and drawing speed (v). Figure 19b shows the normal probability plot of standardized residuals concerning the output response (T1), and Figure 19a shows the standardized effects for each factor on it, while the effects plot in Figure 20 reflects the effect of each input factor on T2.
Lubricant type = (Multidraw AL WM, Multipress PEK, Besal 35 emulsion)
Die type = (Conventional, Pressure_19.38, Pressure_H3F)
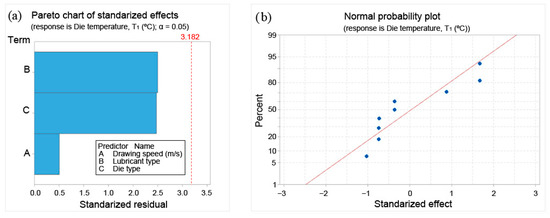
Figure 19.
(a) The influence of input variables on the die temperature (measured by thermocouple, T1 in contact with the output flat face of the drawing die), and (b) quality of the regression model.
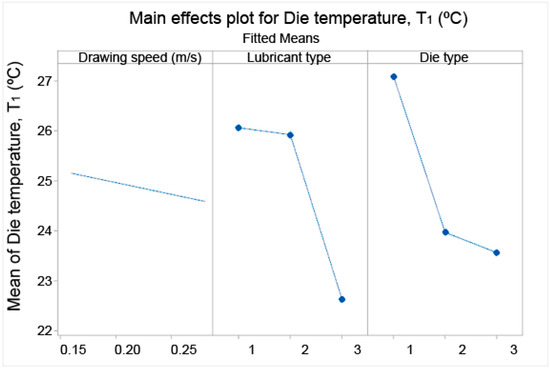
Figure 20.
Absolute effects of input variables on the die temperature (measured by thermocouple, T1 in contact with the output flat face of the drawing die). If lubricant type (1 = Multidraw AL WM, 2 = Multipress PEK, 3 = Besal 35 Emulsion) and if die type (1 = conventional die, 2 = pressure_19.38 die, 3 = pressure_H3F die).
The regression analysis achieved R2 of 89.08%, indicating a strong fit of the model. Moreover, the normal probability plot (Figure 19b) confirms this, as all standardized residuals fall within the interval [−2, 2], indicating the validity of the data. Pareto chart (Figure 19a) and main effects plot (Figure 20) have shown that both the type of lubricant and the type of die used have a significant effect on the die temperature (T1), while the effect of drawing speed is negligible. The contour plots in Figure 21 show the effect of the interactions among die type, lubricant, and drawing speed, identifying the combinations that affect wire temperature.

Figure 21.
Contour plots with the combined effects by pairs of input factors on the die temperature (measured by thermocouple, T1 in contact with the output flat face of the drawing die): (a) die type and lubricant type; (b) die type and drawing speed; and (c) lubricant type and drawing speed.
The lower-die temperatures are related to the use of pressure dies (Figure 21a), especially when working with water + Besal 35 oil emulsion. This fact is due to the cooling capacity of water (this emulsion is 90% water). The plot in Figure 21b shows evidence of lower temperatures of the drawing die, mainly when working with pressure dies and specifically at medium and lower drawing speeds (v), a fact that is again evidenced in the contour plot of Figure 21c. In general, the die temperature (T1) was higher when Multidraw AL WB lubricant was used at medium or low drawing speeds, and this temperature rose to maximum values using a conventional type of die.
In general, it must be considered that the regression models developed for drawing force, friction coefficient, and wire/die temperatures are based on the main effects of die type, lubricant type, and drawing speed, as defined by the Taguchi L9 (33) design. While these models capture the central trends and provide statistically valid predictions within the studied factor ranges, they do not explicitly incorporate interaction terms. As a result, some variability arising from synergistic or antagonistic effects between factors may not be fully represented, which is reflected in the moderate R2 values for certain responses. Nevertheless, the contour and combined-effect plots allow a qualitative assessment of potential interactions, indicating how specific combinations of dies, lubricants, and speeds influence the responses. Users should consider these limitations when extrapolating the models beyond the tested experimental conditions.
4. Conclusions
This study investigated the influence of lubricant selection, die type, and drawing speed on the tribological, thermal, and mechanical behavior of thermally treated Zn–Al15% alloy during wire drawing, using a Taguchi L9 (33) experimental design. The main goal was to identify the parameters governing drawing force, friction, and thermal stability, and to compare the performance of conventional and pressure (hydrodynamic) dies under different lubrication regimes.
- Lubricant type and die type were the main parameters controlling drawing force, friction coefficient, and temperature, while drawing speed had a negligible effect.
- Pressure (hydrodynamic) dies reduced friction, drawing force, and die temperature compared to conventional dies, with the Pressure_19.38 configuration being the most efficient.
- High-viscosity oils (Multidraw AL WM, Multipress PEK) provided better tribological and thermal performance, while the Besal 35 water–oil emulsion increased friction, force, and wire temperature.
- All tests operated in the mixed lubrication regime, with pressure dies promoting near-hydrodynamic behavior and conventional dies remaining in mixed-to-boundary conditions.
- Lower wire and die temperatures were achieved using pressure dies and viscous lubricants, with Multidraw AL WM combined with Pressure_19.38 minimizing wire temperature (T2 < 30 °C).
- Regression models confirmed lubricant type and die type as the dominant factors, with normally distributed residuals validating model reliability.
- Surface defects were primarily caused by lubricant residue or debris, with Besal 35 emulsion and Multipress PEK showing the worst performance, and conventional dies causing the most longitudinal marks, highlighting the importance of lubricant selection and process cleanliness.
This study confirms that lubricant selection and die design are the most critical factors in optimizing Zn–Al15% wire drawing, with pressure dies and high-performance lubricants (Multidraw AL WM) offering the best balance between lower drawing force, reduced friction, controlled temperatures, and strong surface finish. The results also demonstrated the usefulness of combining contact (thermocouples) and non-contact (thermal camera) temperature measurements to capture both global and localized thermal effects. Future work should focus on long-term die wear and lubricant degradation studies to evaluate industrial durability and sustainability of pressure dies and lubricant combinations. Emphasis should also be placed on surface quality optimization, including characterization techniques such as confocal microscopy, EDS (Energy Dispersive X-ray Spectroscopy), and FTIR (Fourier Transform Infrared Spectroscopy) for a quantitative evaluation of surface contamination and quality. Finally, the development and evaluation of environmentally friendly lubricants with tailored viscosity can enhance film stability while reducing environmental impact. Additionally, incorporating more process parameters, such as reduction ratio, die angle, and soap-based lubricants, into statistical models will improve predictive accuracy and provide a more complete optimization route of the ZnAl15% alloy wire drawing process. This integrated approach provides a practical guide for industrial Zn–Al wire drawing and lays the foundation for further research into low-speed hydrodynamic drawing regimes, where die type and lubricant selection are critical to performance.
Author Contributions
Conceptualization, O.R.-A.; Software, J.C.d.R. and M.O.-R.; Formal analysis, J.C.d.R., G.G.-V. and O.R.-A.; Investigation, J.C.d.R., M.O.-R. and O.R.-A.; Resources, G.G.-V.; Data curation, G.G.-V. and M.O.-R.; Writing – original draft, J.C.d.R. and M.O.-R.; Writing – review & editing, O.R.-A.; Visualization, J.C.d.R.; Project administration, G.G.-V. and O.R.-A.; Funding acquisition, G.G.-V. and O.R.-A. All authors have read and agreed to the published version of the manuscript.
Funding
This research received no external funding.
Data Availability Statement
The original contributions presented in this study are included in the article. Further inquiries can be directed at the corresponding author.
Conflicts of Interest
The authors declare no conflict of interest.
References
- Ding, Y.; Zhang, F.; Zhou, H.; Cheng, S.; Xu, K.; Wang, Z.; Xie, S.; Tian, J. Effect of Al Content on the Long-Term Corrosion Behavior of Arc-Sprayed ZnAl Alloy Coatings. Coatings 2023, 13, 1720. [Google Scholar] [CrossRef]
- Zhai, Y.; Wang, T.; Liu, M.; Zhou, N.; Li, X. Effect of Al Content on the Microstructure and Properties of Zn-Al Solder Alloys. Metals 2024, 14, 689. [Google Scholar] [CrossRef]
- Yang, J.; Xue, S.; Wu, Y.; Yu, C.N.; Sekulic, D.P. Wetting behaviour of Zn–Al filler metal on a stainless steel substrate. Sci. Technol. Weld. Join. 2018, 23, 1–6. [Google Scholar] [CrossRef]
- Brocato, C.M. The properzi method for production of primary and secondary aluminium ingots. In Aluminium Cast House Technology VIII; Whiteley, P.R., Ed.; John Wiley & Sons: Hoboken, NJ, USA, 2010. [Google Scholar]
- Nidasio, M. Zinc Wire Breakdown Operation by (Continuous Casting & Rolling) CCR Line for Pure Zn and ZnAl Alloys. Available online: https://properzi.com/metals-archive/zinc/ (accessed on 10 September 2024).
- Suliga, M. The analysis of the high speed wire drawing process of high carbon steel wires under hydrodynamic lubrication conditions. Arch. Metall. Mater. 2015, 60, 403–408. [Google Scholar] [CrossRef]
- Prisco, U.; Martinez, G.A.S.; Kabayama, L.K. Effect of die pressure on the lubricating regimes achieved in wire drawing. Prod. Eng. 2020, 14, 667–676. [Google Scholar] [CrossRef]
- Suliga, M.; Muskalski, Z.; Wiewiórowska, S. The influence of drawing speed on properties of TRIP steel wires. J. Achiev. Mater. Manuf. Eng. 2008, 26, 151–154. [Google Scholar]
- Han, T.; Zhang, S.; Zhang, C. Unlocking the secrets behind liquid superlubricity: A state-of-the-art review on phenomena and mechanisms. Friction 2022, 10, 1137–1165. [Google Scholar] [CrossRef]
- Tattersall, G.H. Hydrodynamic Lubrication in Wire Drawing. J. Mech. Eng. Sci. 1961, 3, 378–393. [Google Scholar] [CrossRef]
- Muskalski, Z.; Wiewiórowska, S. The theoretical analysis of wire drawing process for hydrodynamic friction conditions. Metall. Min. Ind. 2011, 3, 74–78. [Google Scholar]
- Suliga, M. The effect of drawing speed on force parameters in multipass drawing process of steel wires. In Proceedings of the METAL 2016 Conference Proceedings, Brno, Czech Republic, 25–27 May 2016; p. 7. [Google Scholar]
- Suliga, M.; Wartacz, R.; Hawryluk, M.; Kostrzewa, J. The Effect of Drawing in Conventional and Hydrodynamic Dies on Structure and Corrosion Resistance of Hot-Dip Galvanized Zinc Coatings on Medium-Carbon Steel Wire. Materials 2022, 15, 6728. [Google Scholar] [CrossRef]
- dos Santos, T.G.; Rosiak, A.; Alba, D.R.; Wermuth, D.P.; Riffel, M.H.; da Rocha, R.P.; Schaeffer, L. Experimental-numerical analysis to determine the efficiency of industrial lubricants in wire drawing process. Rev. Metal. 2023, 59, e234. [Google Scholar] [CrossRef]
- Knych, T.; Mamala, A.; Uliasz, P.; Spyra, M.; Lejkowsky, J. Badania nad procesem ci ą gnienia nadplastycznego stopu ZnAl15 przeznaczonego do metalizacji natryskowej—ZnAl15 alloy assigned to the thermal metal spraying application. Rudy I Met. Nieżelazne 2007, 52, 782–789. [Google Scholar]
- Strzępek, P.; Osuch, P.; Walkowicz, M.; Zasadzińska, M.; Mamala, A.; Knych, T.; Napióra, T. Impact of the heat treatment parameters on ultimate tensile strenght, microstructure and wiredrawing proces of Zn-Al15. Metalurgija 2020, 59, 489–492. [Google Scholar]
- UNE EN ISO 14919:2015; Proyección térmica. Alambres, Varillas y Cordones Para Proyección Por Soplete y Arco. Clasificación. Condiciones Técnicas de Suministro. UNE: Madrid, Spain, 2015.
- Zinacor, S.A. Material Data Sheet—ZnAl15 according to DIN EN ISO 14919. Available online: https://cdn.zinacor.com/uploads/2019/03/FT-ANG-Z850851-1.60-mm-Zinacor.pdf (accessed on 27 October 2025).
- da Costa, E.M.; da Costa, C.E.; Vecchia, F.D.; Rick, C.; Scherer, M.; dos Santos, C.A.; Dedavid, B.A. Study of the influence of copper and magnesium additions on the microstructure formation of Zn-Al hypoeutectic alloys. J. Alloys Compd. 2009, 488, 89–99. [Google Scholar] [CrossRef]
- Vassena Filiere, S. r. l. Dies and Pressure Dies. Available online: https://www.vassena.it/index.php/en/production/dies-and-pressure-dies (accessed on 11 September 2025).
- Lowrie, J.; Ngaile, G. Analytical Modeling of Hydrodynamic Lubrication in a Multiple-reduction Drawing Die. Procedia Manuf. 2016, 5, 707–723. [Google Scholar] [CrossRef][Green Version]
- Pilarczyk, J.W.; Van Houtte, P.; Aernoudt, E. Effect of hydrodynamic and roller die drawing on the texture of high carbon steel wires. Mater. Sci. Eng. A 1995, 197, 97–101. [Google Scholar] [CrossRef]
- Arduino, S. r. l. About Arduino. Available online: https://www.arduino.cc/en/about/#management-team (accessed on 15 September 2025).
- Sommer, K.; Heinz, R.; Schöffer, J. Verschleiß Metallischer Werkstoffe: Erscheinungsformen Sicher Beur; Springer Vieweg: Berlin, Germany, 2014; ISBN 3834824631. [Google Scholar]
- Martínez, G.A.S.; Rodriguez-Alabanda, O.; Prisco, U.; Tintelecan, M.; Kabayama, L.K. The influences of the variable speed and internal die geometry on the performance of two commercial soluble oils in the drawing process of pure copper fine wire. Int. J. Adv. Manuf. Technol. 2021, 118, 3749–3760. [Google Scholar] [CrossRef]
- Pürçek, G.; Savaşkan, T.; Küçükömeroğlu, T.; Murphy, S. Dry sliding friction and wear properties of zinc-based alloys. Wear 2002, 252, 894–901. [Google Scholar] [CrossRef]
- Wright, R.N. Mechanical analysis and die design. Wire J. Int. 1979, 12, 60–61. [Google Scholar]
- Wright, R.N. Wire Technology. Process Engineering and Metallurgy; Elsevier Science: Amsterdam, The Netherlands, 2011; ISBN 978-0-12-382092-1. [Google Scholar]
- Feldner, P.; Merle, B.; Göken, M. Superplastic deformation behavior of Zn-22% Al alloy investigated by nanoindentation at elevated temperatures. Mater. Des. 2018, 153, 71–79. [Google Scholar] [CrossRef]
- Song, Z.; Niu, R.; Cui, X.; Bobruk, E.V.; Murashkin, M.Y.; Enikeev, N.A.; Gu, J.; Song, M.; Bhatia, V.; Ringer, S.P.; et al. Mechanism of room-temperature superplasticity in ultrafine-grained Al–Zn alloys. Acta Mater. 2023, 246, 118671. [Google Scholar] [CrossRef]
- Dieter, G.E. Mechanical Metallurgy; McGraw-Hill Book Company (UK) Limited: Columbus, OH, USA, 1988; ISBN 0-07-084187-X. [Google Scholar]
- Gebremeskel, S.A.; Asija, N.; Chouhan, H.; Bhatnagar, N. Appraisal of Strain Rate Sensitivity of Polypropylene Nanocomposites. Procedia Eng. 2017, 173, 800–806. [Google Scholar] [CrossRef]
- UNE-EN ISO 6892-1:2020; Materiales Metálicos. Ensayo de Tracción. Parte 1: Método de Ensayo a Temperatura Ambiente. UNE: Madrid, Spain, 2020.
- Martinez, G.A.S.; Qian, W.L.; Kabayama, L.K.; Prisco, U. Effect of process parameters in copper-wire drawing. Metals 2020, 10, 105. [Google Scholar] [CrossRef]
- Silva, G.C.; Martins, N.; Santos, I.A.; Vieira, A.L. Analytical, numerical, and experimental investigation of the influence of lubrication on the drawing behavior of copper alloy. Int. J. Adv. Manuf. Technol. 2020, 107, 1773–1784. [Google Scholar] [CrossRef]
Disclaimer/Publisher’s Note: The statements, opinions and data contained in all publications are solely those of the individual author(s) and contributor(s) and not of MDPI and/or the editor(s). MDPI and/or the editor(s) disclaim responsibility for any injury to people or property resulting from any ideas, methods, instructions or products referred to in the content. |
© 2025 by the authors. Licensee MDPI, Basel, Switzerland. This article is an open access article distributed under the terms and conditions of the Creative Commons Attribution (CC BY) license (https://creativecommons.org/licenses/by/4.0/).


