Article

Oil Transport Simulation and Oil Consumption Prediction with a Physics-Based and Data-Driven Digital Twin Model for Internal Combustion Engines

Department of Mechanical Engineering, Massachusetts Institute of Technology, Cambridge, MA 02139, USA
*
Author to whom correspondence should be addressed.
Lubricants 2025, 13(10), 463; https://doi.org/10.3390/lubricants13100463
Submission received: 17 September 2025 / Revised: 14 October 2025 / Accepted: 17 October 2025 / Published: 21 October 2025

Abstract

Lubrication oil consumption (LOC) is one of the major sources of emissions from internal combustion (IC) engines; yet, analyzing and predicting it through modeling is challenging due to its multi-physics nature, which spans different time and length scales. In this work, a digital twin model is developed to simulate oil transport in the piston ring pack of IC engines and predict the resulting oil consumption with all major physical mechanisms considered. Three main contributors to LOC, namely, top ring up-scraping, oil vaporization on the liner, and reverse gas flows through the top ring gap, are included in the model. It was found that their behaviors are heavily dependent on the arrangement of the piston ring gaps. Therefore, with the ring rotation behavior still not resolved, the current model can predict the LOC range of a given engine profile. Results show that the predicted range can well encapsulate the experimentally measured LOC value.

1. Introduction

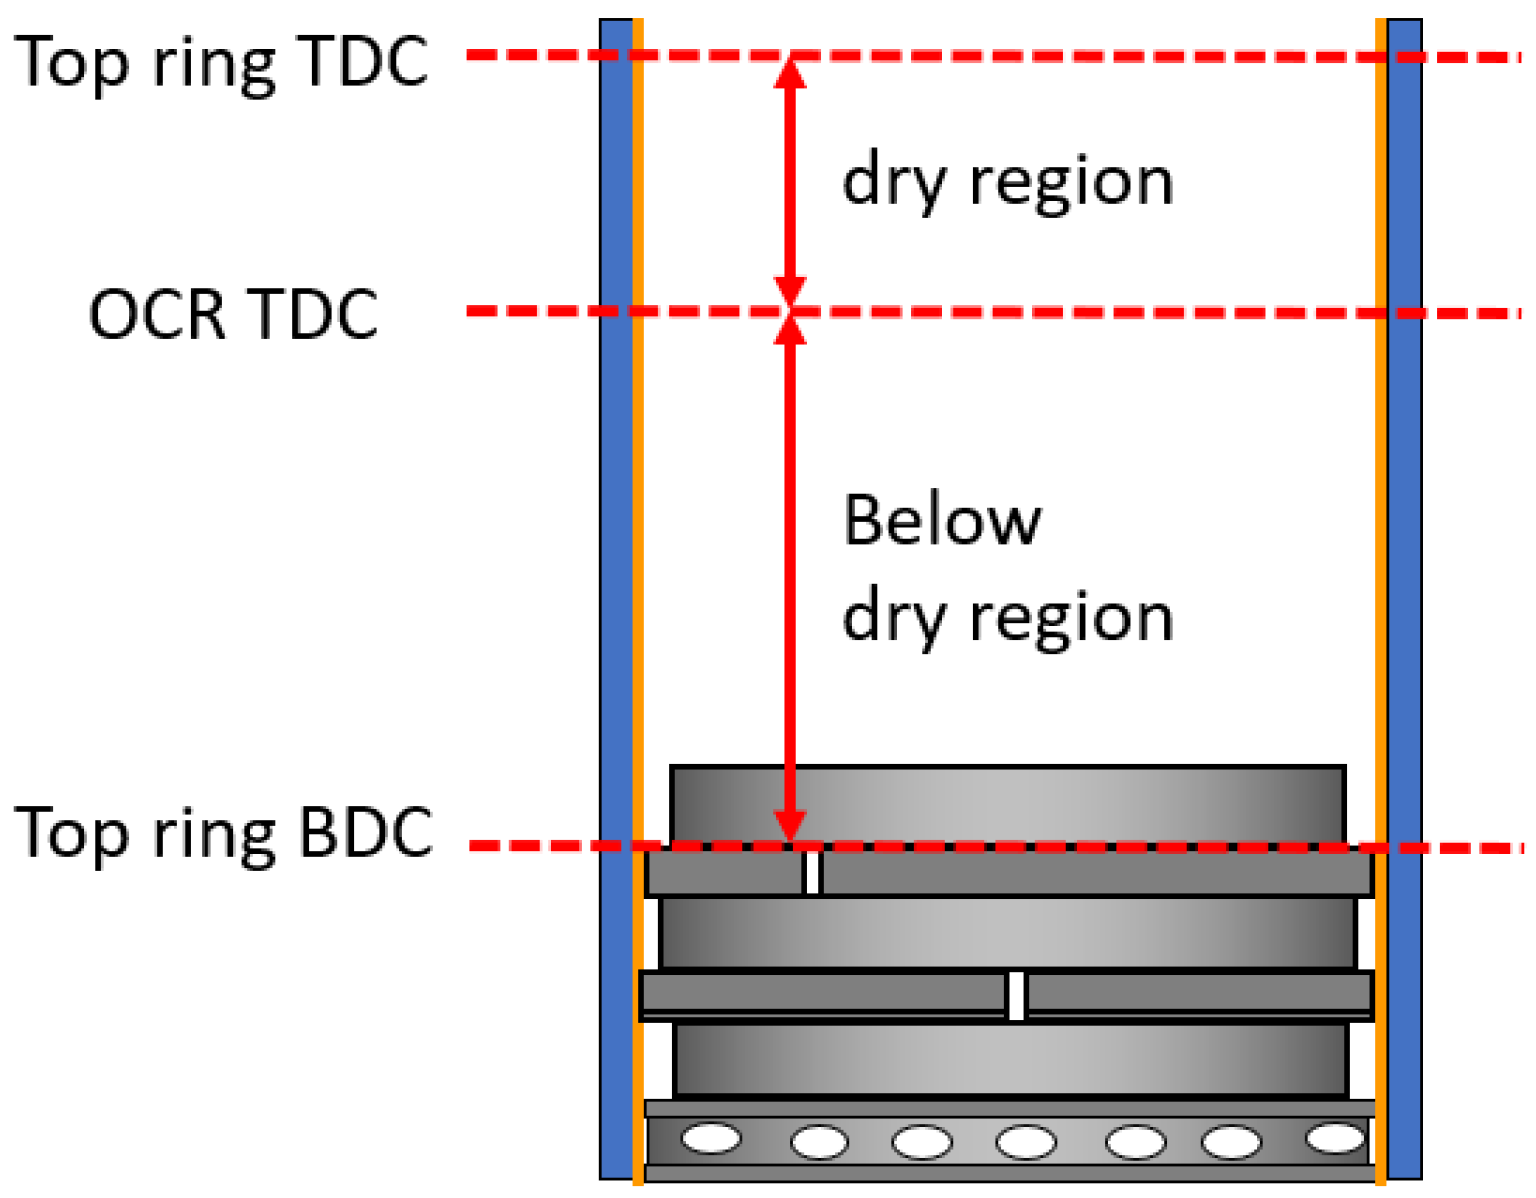
In a typical internal combustion (IC) engine, the piston ring pack consists of a piston and three piston rings: the top ring, the second ring, and the oil control ring (OCR). A schematic of the piston ring pack assembly and some common terminologies are shown in Figure 1. During engine operation, lubrication oil is supplied to the bottom of the piston. The function of the oil control ring is to limit the amount of oil that can be leaked to the upper region to prevent excessive oil consumption and facilitate the oil release from the ring pack to the crankcase. On the other hand, gas flow comes from the combustion chamber, and the role of the top ring is to seal the combustion chamber from the lower region of the piston ring pack to prevent power loss. For a long time, lubrication oil consumption (LOC) has been recognized as a significant contributor to overall engine emissions. Therefore, it is of practical interest to measure the LOC value of a certain piston ring pack design during the development process. Typical LOC measurement methods include drain and weight [1], measuring the CO2 concentration in the exhaust gas while using hydrogen as fuel [2], and tracer methods [3]. In particular, the tracer methods are more widely used due to better accuracy. However, countermeasures to LOC are challenging to obtain because the relevant physical mechanisms are not fully understood. Oil consumption can be defined as excess oil entering the combustion chamber and can be largely attributed to the oil transport process in the piston ring pack, along with additional contributions from oil vaporization and other mechanisms [4]. Further research in [5,6,7] highlighted the intricate relationship between oil transport and oil consumption, and the complexity of all the physical mechanisms in the oil transport process was emphasized. Therefore, resolving the various physical mechanisms relevant to the oil transport process in the piston ring pack is crucial for developing a better understanding of oil consumption and for predicting it through modeling for arbitrary engine profiles.
For oil to contribute to oil consumption, it must be transported from the lower region of the piston ring pack to the upper region. The oil transport process involves complex interactions between liquid oil and the gas flow in the piston ring pack, the piston ring dynamics, as well as the piston rings’ structural response to bore distortion and the changing pressure environment. A considerable amount of effort has been devoted to studying oil transport and oil consumption. On the experimental side, 2D laser-induced fluorescence (2DLIF) techniques were used to visualize the oil transport during engine operation. The works in [6] identified inertia force, piston ring scraping and pumping, as well as the shear stress from gas flow, are the major driving factors of oil transport. An improved 2DLIF system used in [8] showed that the oil control ring gap is the main oil source to the upper region of the piston ring pack. Additionally, the top ring gap is found to be a direct path for oil leakage under closed throttle conditions, resulting in high oil consumption. Both [8] and [9] observed and studied the oil entrainment to the liner by the vortex formed downstream the top ring gap. The relationship between bore distortion and oil consumption was also studied [10,11,12]. It was found that as the higher-order bore distortion increases (e.g., the bore is more distorted), there tends to be an increase in oil consumption due to the ring not being able to conform well to the bore.
At the same time, there are also various modeling works that seek to quantify and simulate the behaviors of many of the mechanisms related to oil transport and oil consumption. Using detailed piston design parameters and measured cylinder pressure, the 2D ring dynamics model developed in [13] can be used to compute the average gas pressure in each region of the ring pack and the mass flowrate of gas through each of the ring gap and simulate the dynamical behavior of the piston rings through an entire engine cycle. Since its introduction, it has been widely used in the industry as a tool to evaluate the performance of different piston ring pack designs. A 3D model was developed in [14] where oil transport, ring dynamics, and gas flow were computed simultaneously, but it is computationally expensive due to the coupling of physical mechanisms. An oil transport model developed in [15] with predefined oil supply to the upper region of the piston ring pack decouples the oil transport calculation from the gas flow computation for better computational efficiency in simulating oil transport. A CFD study performed in [16] studied the oil transport in the piston ring pack with piston ring pumping, gas-driven oil flow, and ring scraping considered. Similarly, two-phase CFD simulations conducted in [17,18] were used to study the oil distribution pattern and the effects of changing piston design parameters. Additionally, there are also numerical models dedicated to individual mechanisms, including inertia and gas-driven oil transport [19] and oil bridging [20].
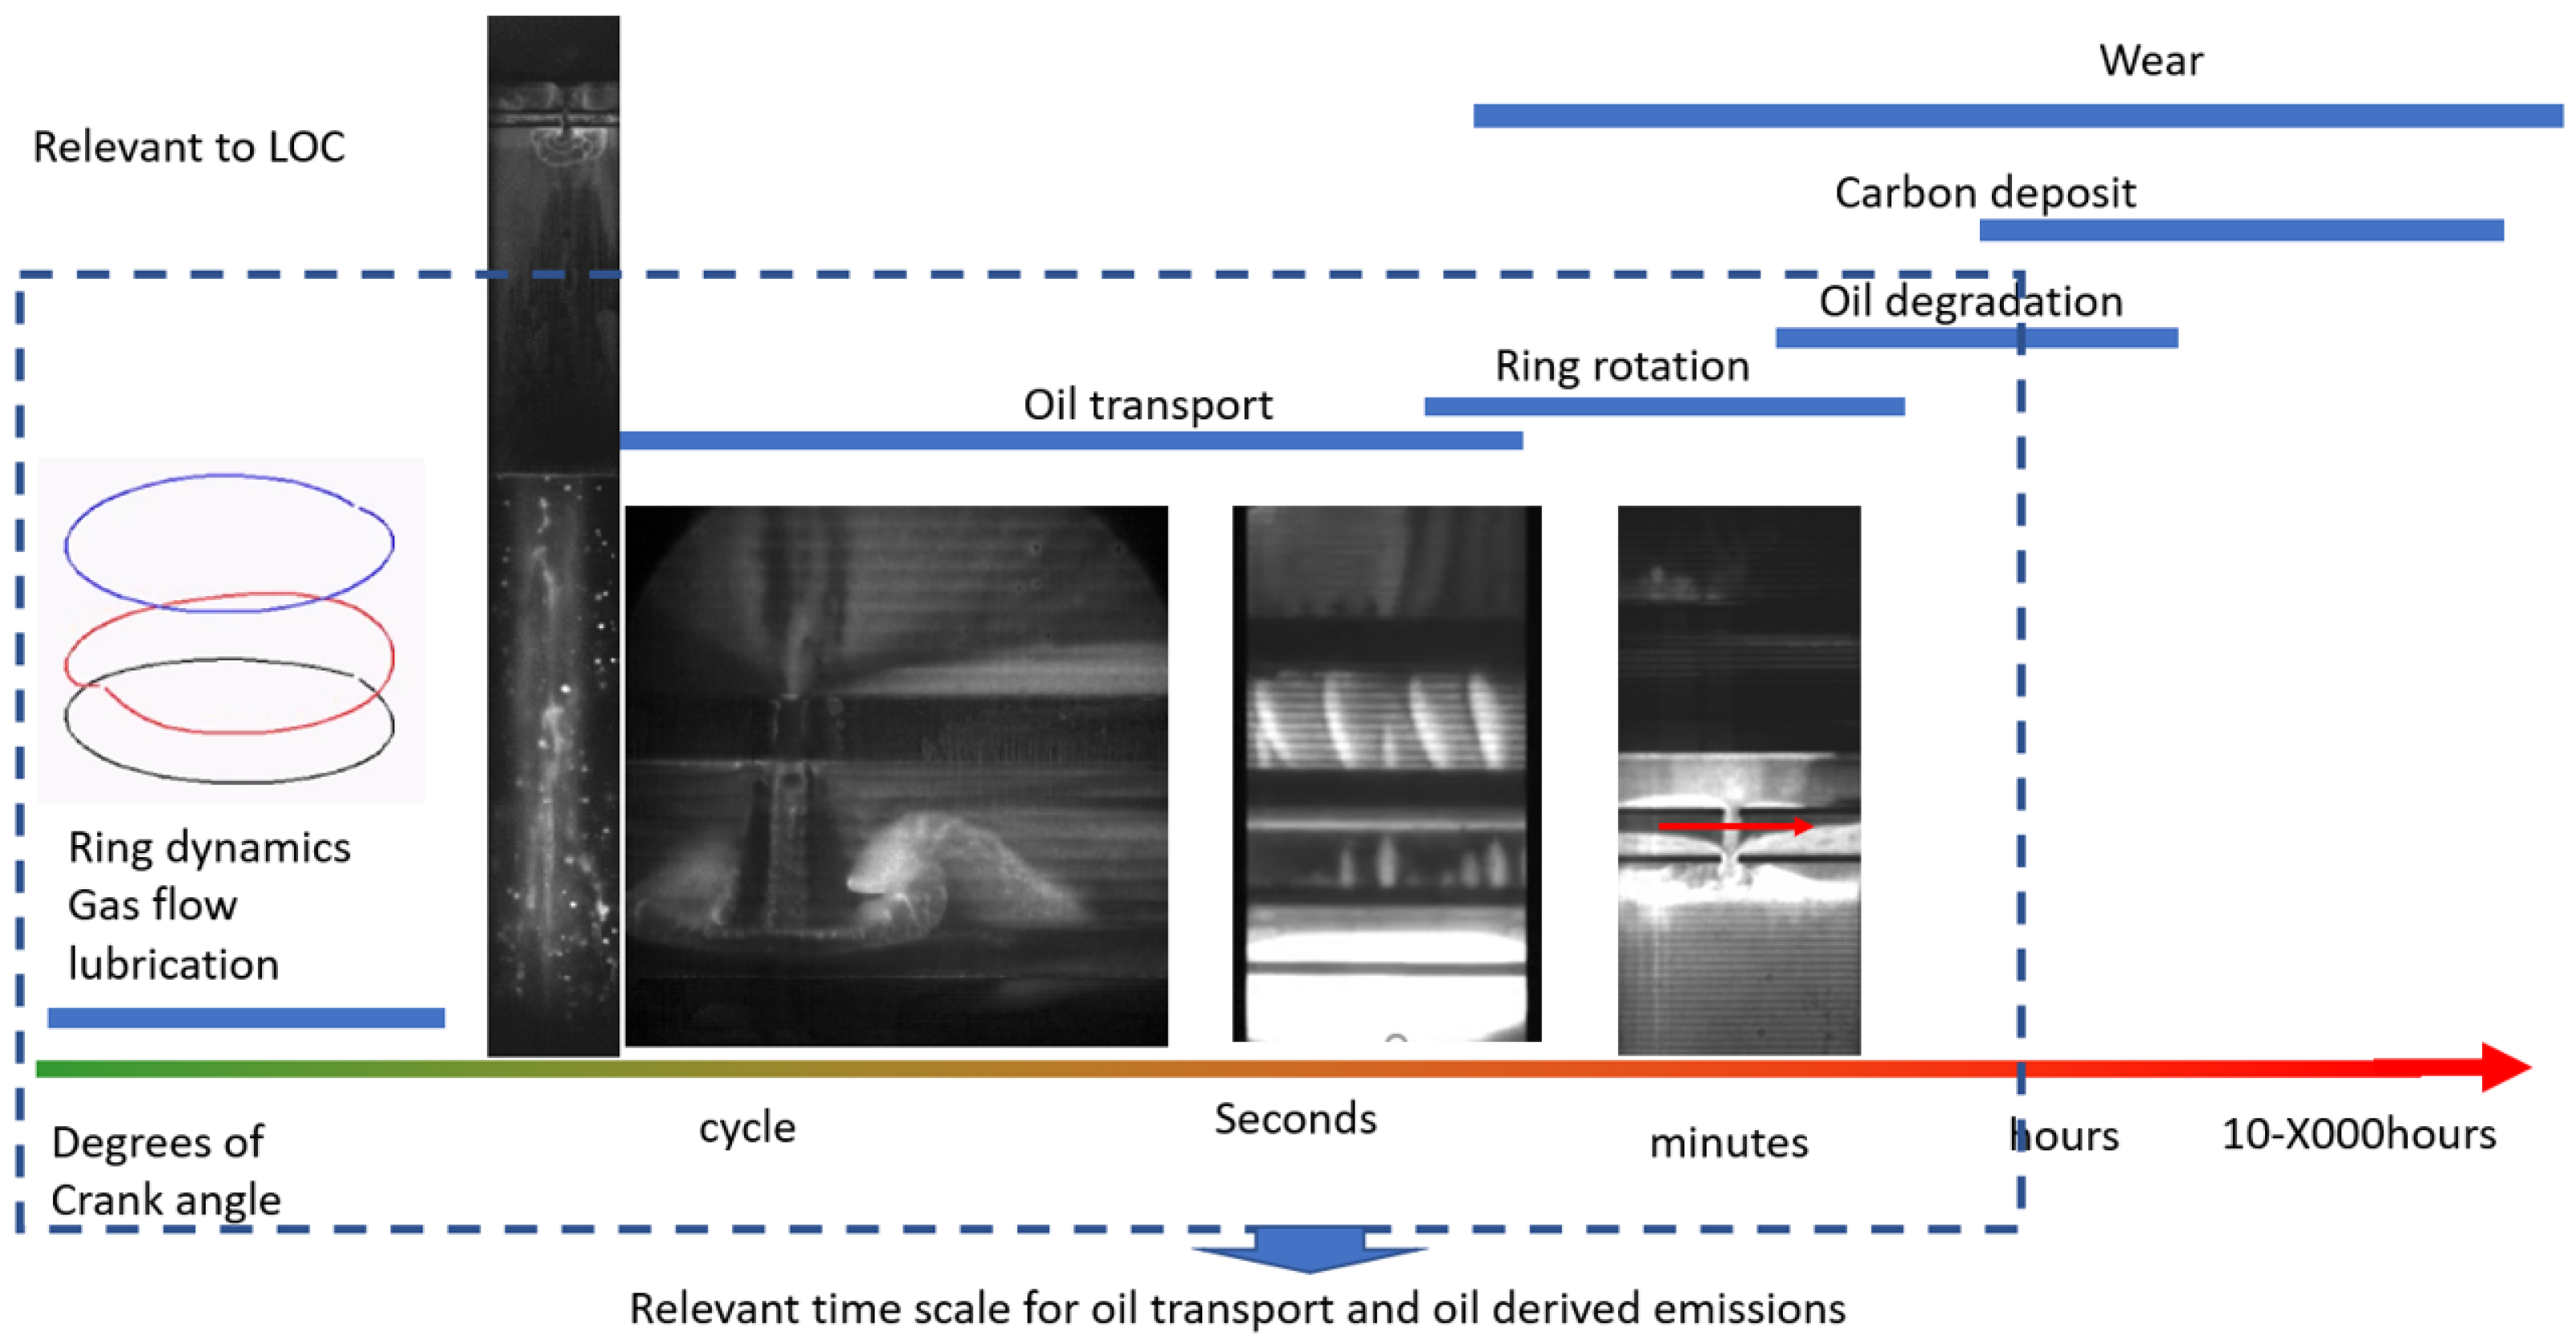
The existing works provide valuable knowledge about various oil transport mechanisms and insights into the factors that contribute to LOC. The sheer amount of previous research efforts further highlights the challenge of this topic. Engine experiments provided qualitative understandings and led to the identification of many of the mechanisms responsible for oil transport, while numerical models that build on experimental observations offer more quantitative conclusions. Nevertheless, there are clear drawbacks in the existing works. Experiments can be costly and time-consuming, and some of the more subtle physics cannot be observed or measured. On the other hand, the multi-timescale nature of the oil transport process, which is illustrated in Figure 2 and discussed in [15,21], makes modeling tasks challenging. Simply speaking, the piston ring dynamics can change from crank angle to crank angle, and such changes can alter the gas flow pattern in the piston ring pack. The oil motion driven by oil flow happens on a longer timescale. This includes faster dynamics, such as the oil–gas interaction in the vortex region around the top ring gap, and some slower dynamics, such as the bulk oil transport on the piston land. Piston ring rotation happens on the order of minutes and is the slowest dynamic relevant to oil transport. High-fidelity numerical models coupling many of the physical mechanisms are too computationally expensive for multi-cycle oil transport simulations, while low-fidelity ones that neglect certain mechanisms may provide less accurate results. For years, simulating oil transport over many cycles was a very difficult, if not impossible, task due to computational cost. An oil transport and oil consumption model with all major mechanisms considered, while having a reasonable runtime, does not exist. Yet, such a model will be extremely useful for making future engine design efforts more efficient. This is the main focus of this work, and the models developed herein are continuations from the previous works by the authors in [15].

2. Modeling Methodology

In engine design, a balance between proper lubrication and low oil consumption is desired. Figure 3 illustrates the mechanisms related to oil supply, lubrication, and LOC in the piston ring pack. In an ideal scenario (which is also called the healthy system [22]), for a ring pack equipped with the twin land oil control ring (TLOCR), the only oil supply to the upper region of the ring pack is from the oil control ring gap, which leaves an oil streak on the liner. The top two rings will then down-scrape the supplied oil onto the piston land, and oil will then be released back to the lower region by gas flow. At the same time, the severe contact areas, including the top of the liner and the top ring lower flank, need to be properly lubricated. There are two physical mechanisms responsible for lubrication functions. The first mechanism is the vortex enhanced bridging [9], where the vortex formed downstream the top ring gap can locally entrain oil from the piston to the liner. This is important in the liner region above the top dead center (TDC) of the oil control ring, called the dry region, where there is no direct oil supply from the crankcase. The second mechanism is top ring down-scraping, where the oil down-scraped by the top ring can reach both the second land and the top ring lower flank to provide protection. Then, the oil on the piston land is released through the ring gaps and groove clearance via effective ring dynamics and gas flows. In this scenario, there is only LOC from the oil evaporation from the liner. However, in reality, a piston ring pack may not be a healthy system. Three mechanisms may contribute to LOC: top ring up-scraping, vaporization of oil from the liner surface, and liquid oil transport due to reverse gas flow through the top ring gap (not through the top ring/groove clearance since this is more detrimental and needs to be avoided by design). These will be explored in greater detail in this work.
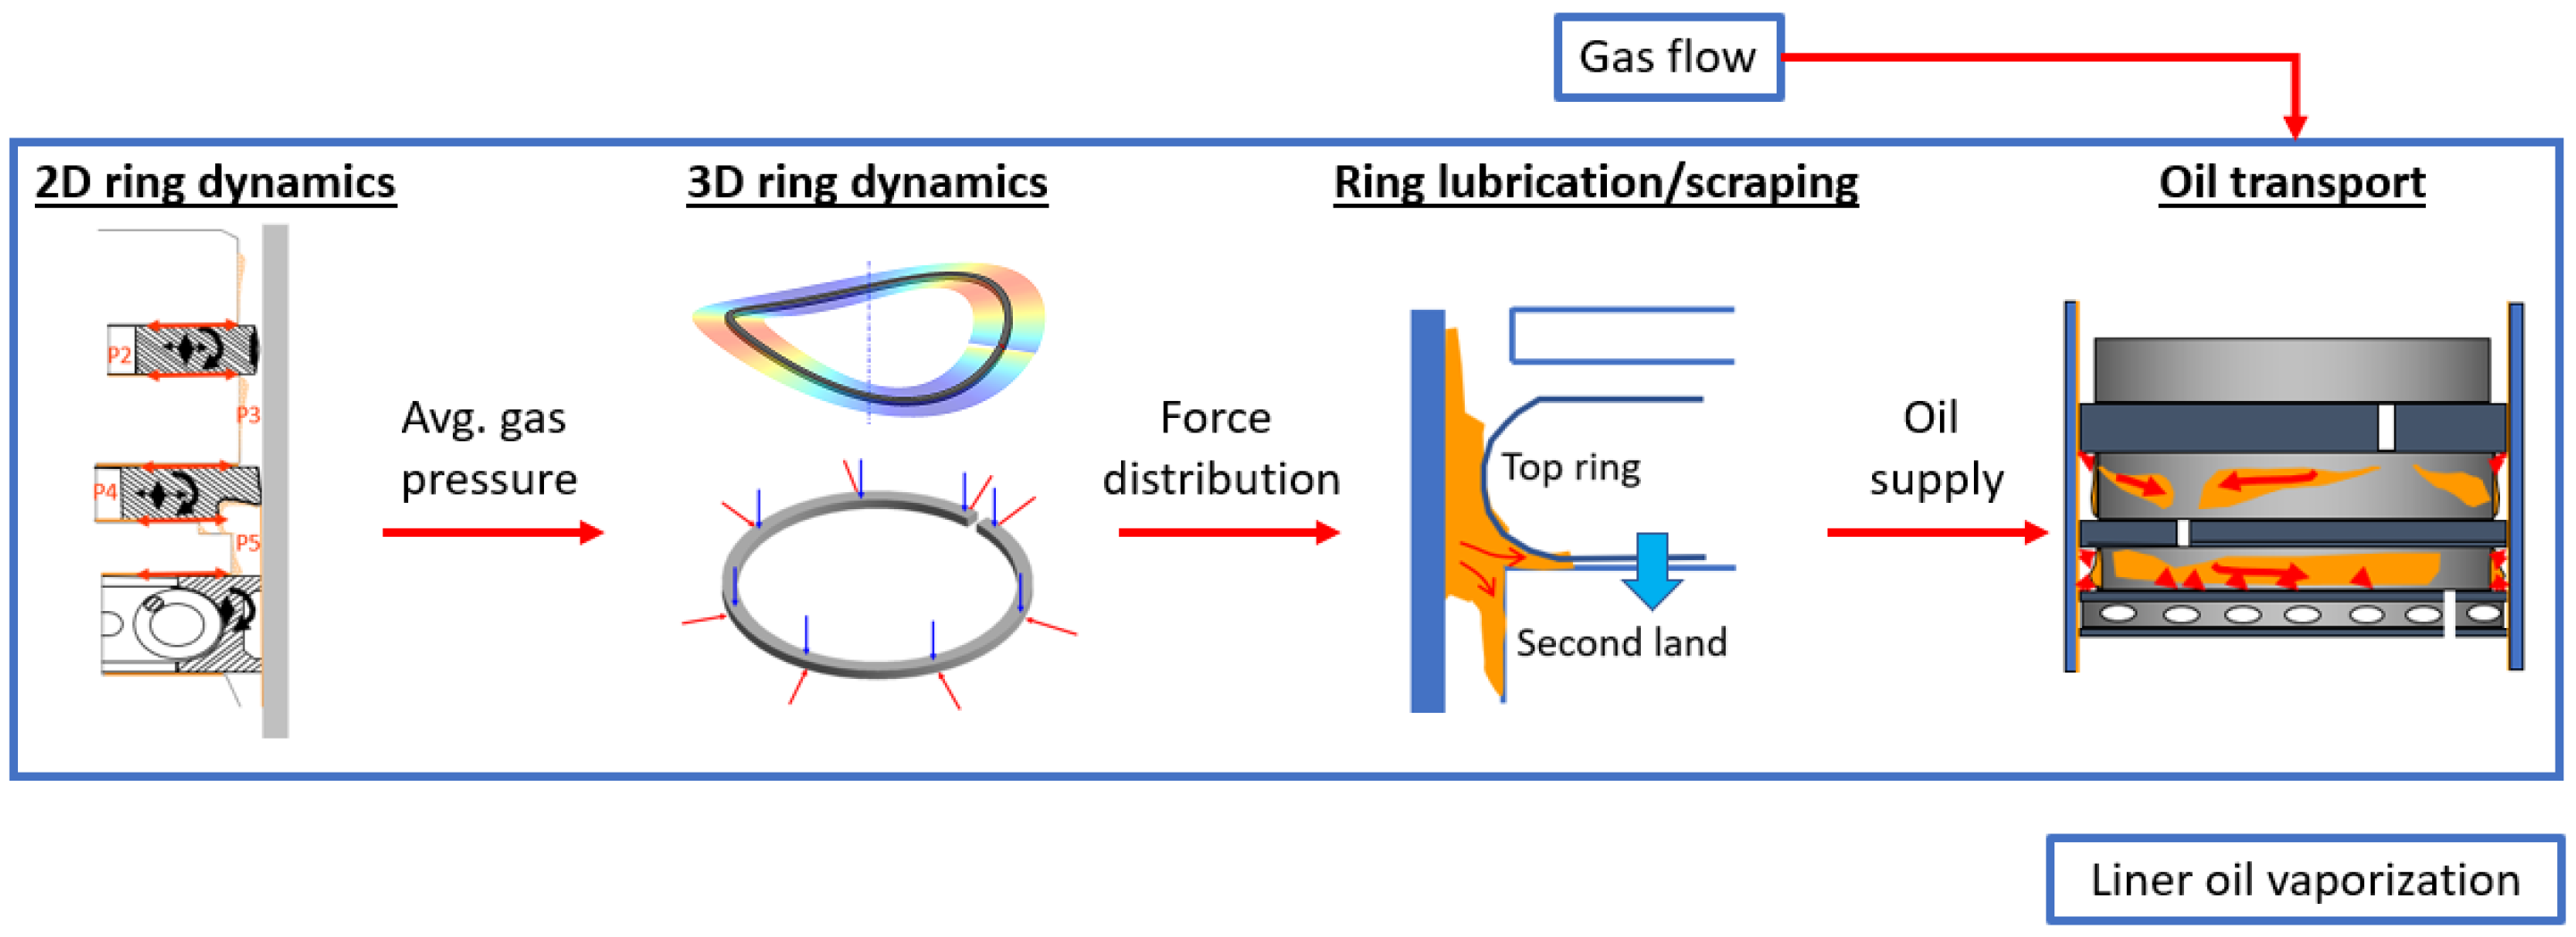
Recognizing the important roles of ring dynamics and gas flow in oil transport (and hence oil consumption), as well as the need for efficient computation, this work uses the modeling methodology shown in Figure 4. In particular, the 2D ring dynamics model [13] is run to obtain the average gas pressure in each region of the piston ring pack. Using the outputs from the 2D model, a 3D ring dynamics model further calculates the force distribution and the ring dynamics at each point along a piston ring. With the ring–liner contact force known, a ring–liner lubrication model simulates the local scraping rates (up-scraping and down-scraping) of the top two rings. The oil down-scraped by the rings is the oil supply to the piston lands. An oil transport model is then used to simulate the oil transport pattern in the piston ring pack. Since oil transport is mainly driven by gas flow, a physics-based and data-driven hybrid gas flow model is developed to resolve the flow pattern. A separate liner vaporization model is also developed to account for its contribution to the overall oil consumption.
As discussed previously, the modeling of oil transport and oil consumption is challenging due to their multi-physics nature. Simply coupling the various physics together by running complex CFD simulations with fluid-structure interactions may be too computationally expensive. Instead, in this work, the digital twin model follows a modular approach by developing separate sub-models for different mechanisms. This essentially decouples physical mechanisms while some of the necessary links between them are preserved. This is essential for simulating oil transport over many engine cycles within a reasonable computation time.

3. Model Formulation

This section offers a more detailed description of the various sub-models for different physical mechanisms.

3.1. Three-Dimensional Ring Dynamics Model

The 3D ring dynamics model follows from the works in [14,21,23]. In particular, a dual-grid curved beam finite element model is used to solve for the structural response of the piston ring. Typically, the ring’s deformation from its freeshape is on the order of 10 3 m while its interactions with the liner and the groove are on the order of 10 6 m. To resolve such a difference in length scale, a coarse mesh is used to solve for structural deformations for sufficient accuracy, while a much finer mesh is used for the contact force computation. The finite element formulation is written in the form
M ü + K u = F e x t F i n i t i a l
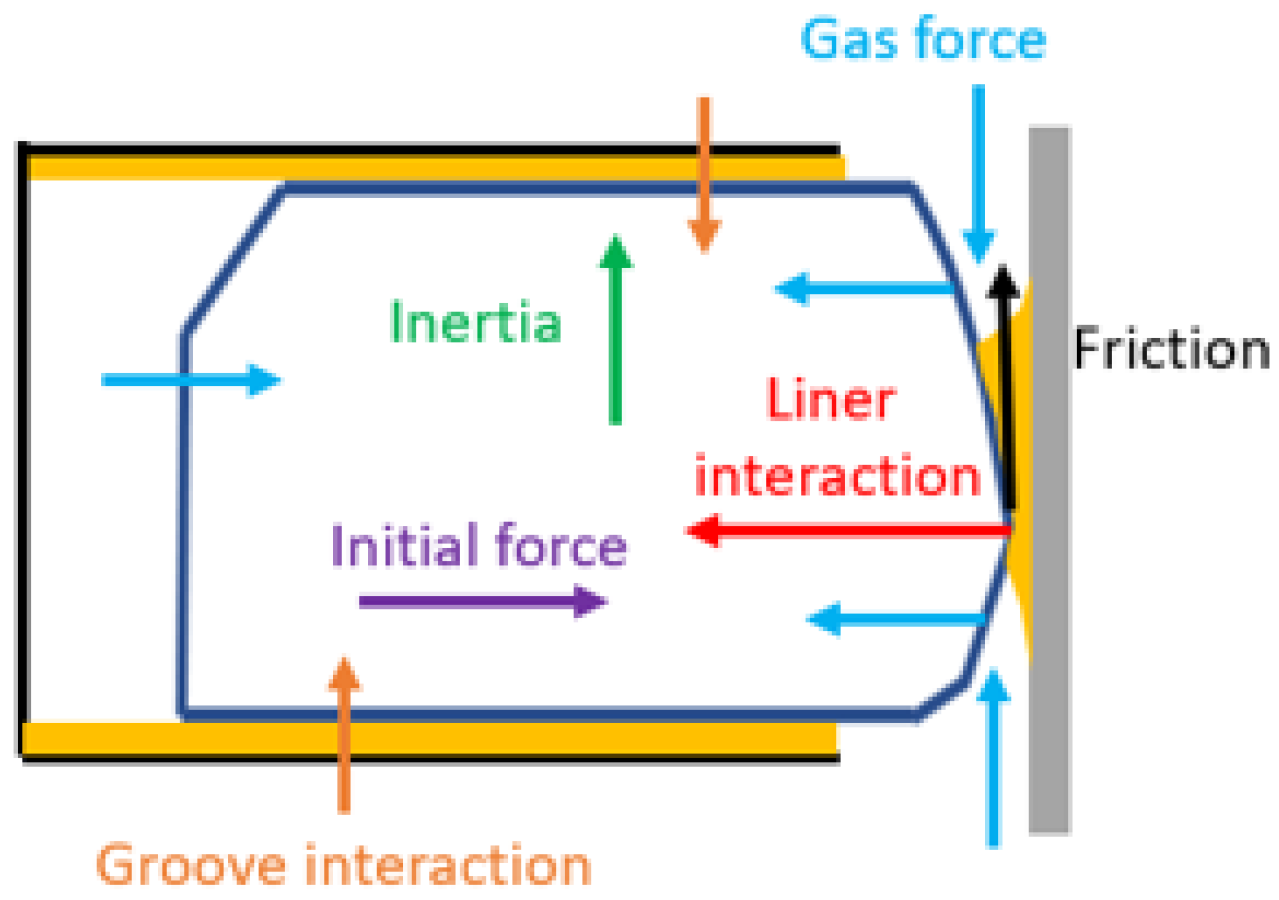
The terms M and K are the mass and stiffness matrix, and their derivations can be found in [14,21,23]. The term u is a displacement vector that contains the axial displacement, radial displacement, and the twisting motion at each of the structural grid points. The forces considered for a cross-section of the ring are shown in Figure 5. These include: forces due to ring–liner interaction (asperity contact and hydrodynamic), forces due to ring–groove interaction (asperity contact and hydrodynamic), inertia force, gas force, and initial force ( F i n i t i a l , force required to close the ring from the free shape to the circular bore). Forces except for the initial force are included in the term F e x t . Note that the gas pressure for computing the gas force is computed with the 2D ring dynamics model [13]—the decoupling of 3D ring dynamics computation from gas pressure computation is the key for achieving better computational efficiency.
In general, the ring–groove and ring–liner contact forces are functions of the ring’s displacement. For a particular time step, once a solution u is found that makes Equation (1) converge, the forces can be extracted from the solution and be used by subsequent models.

3.2. Mass-Conserved Ring–Liner Lubrication Model

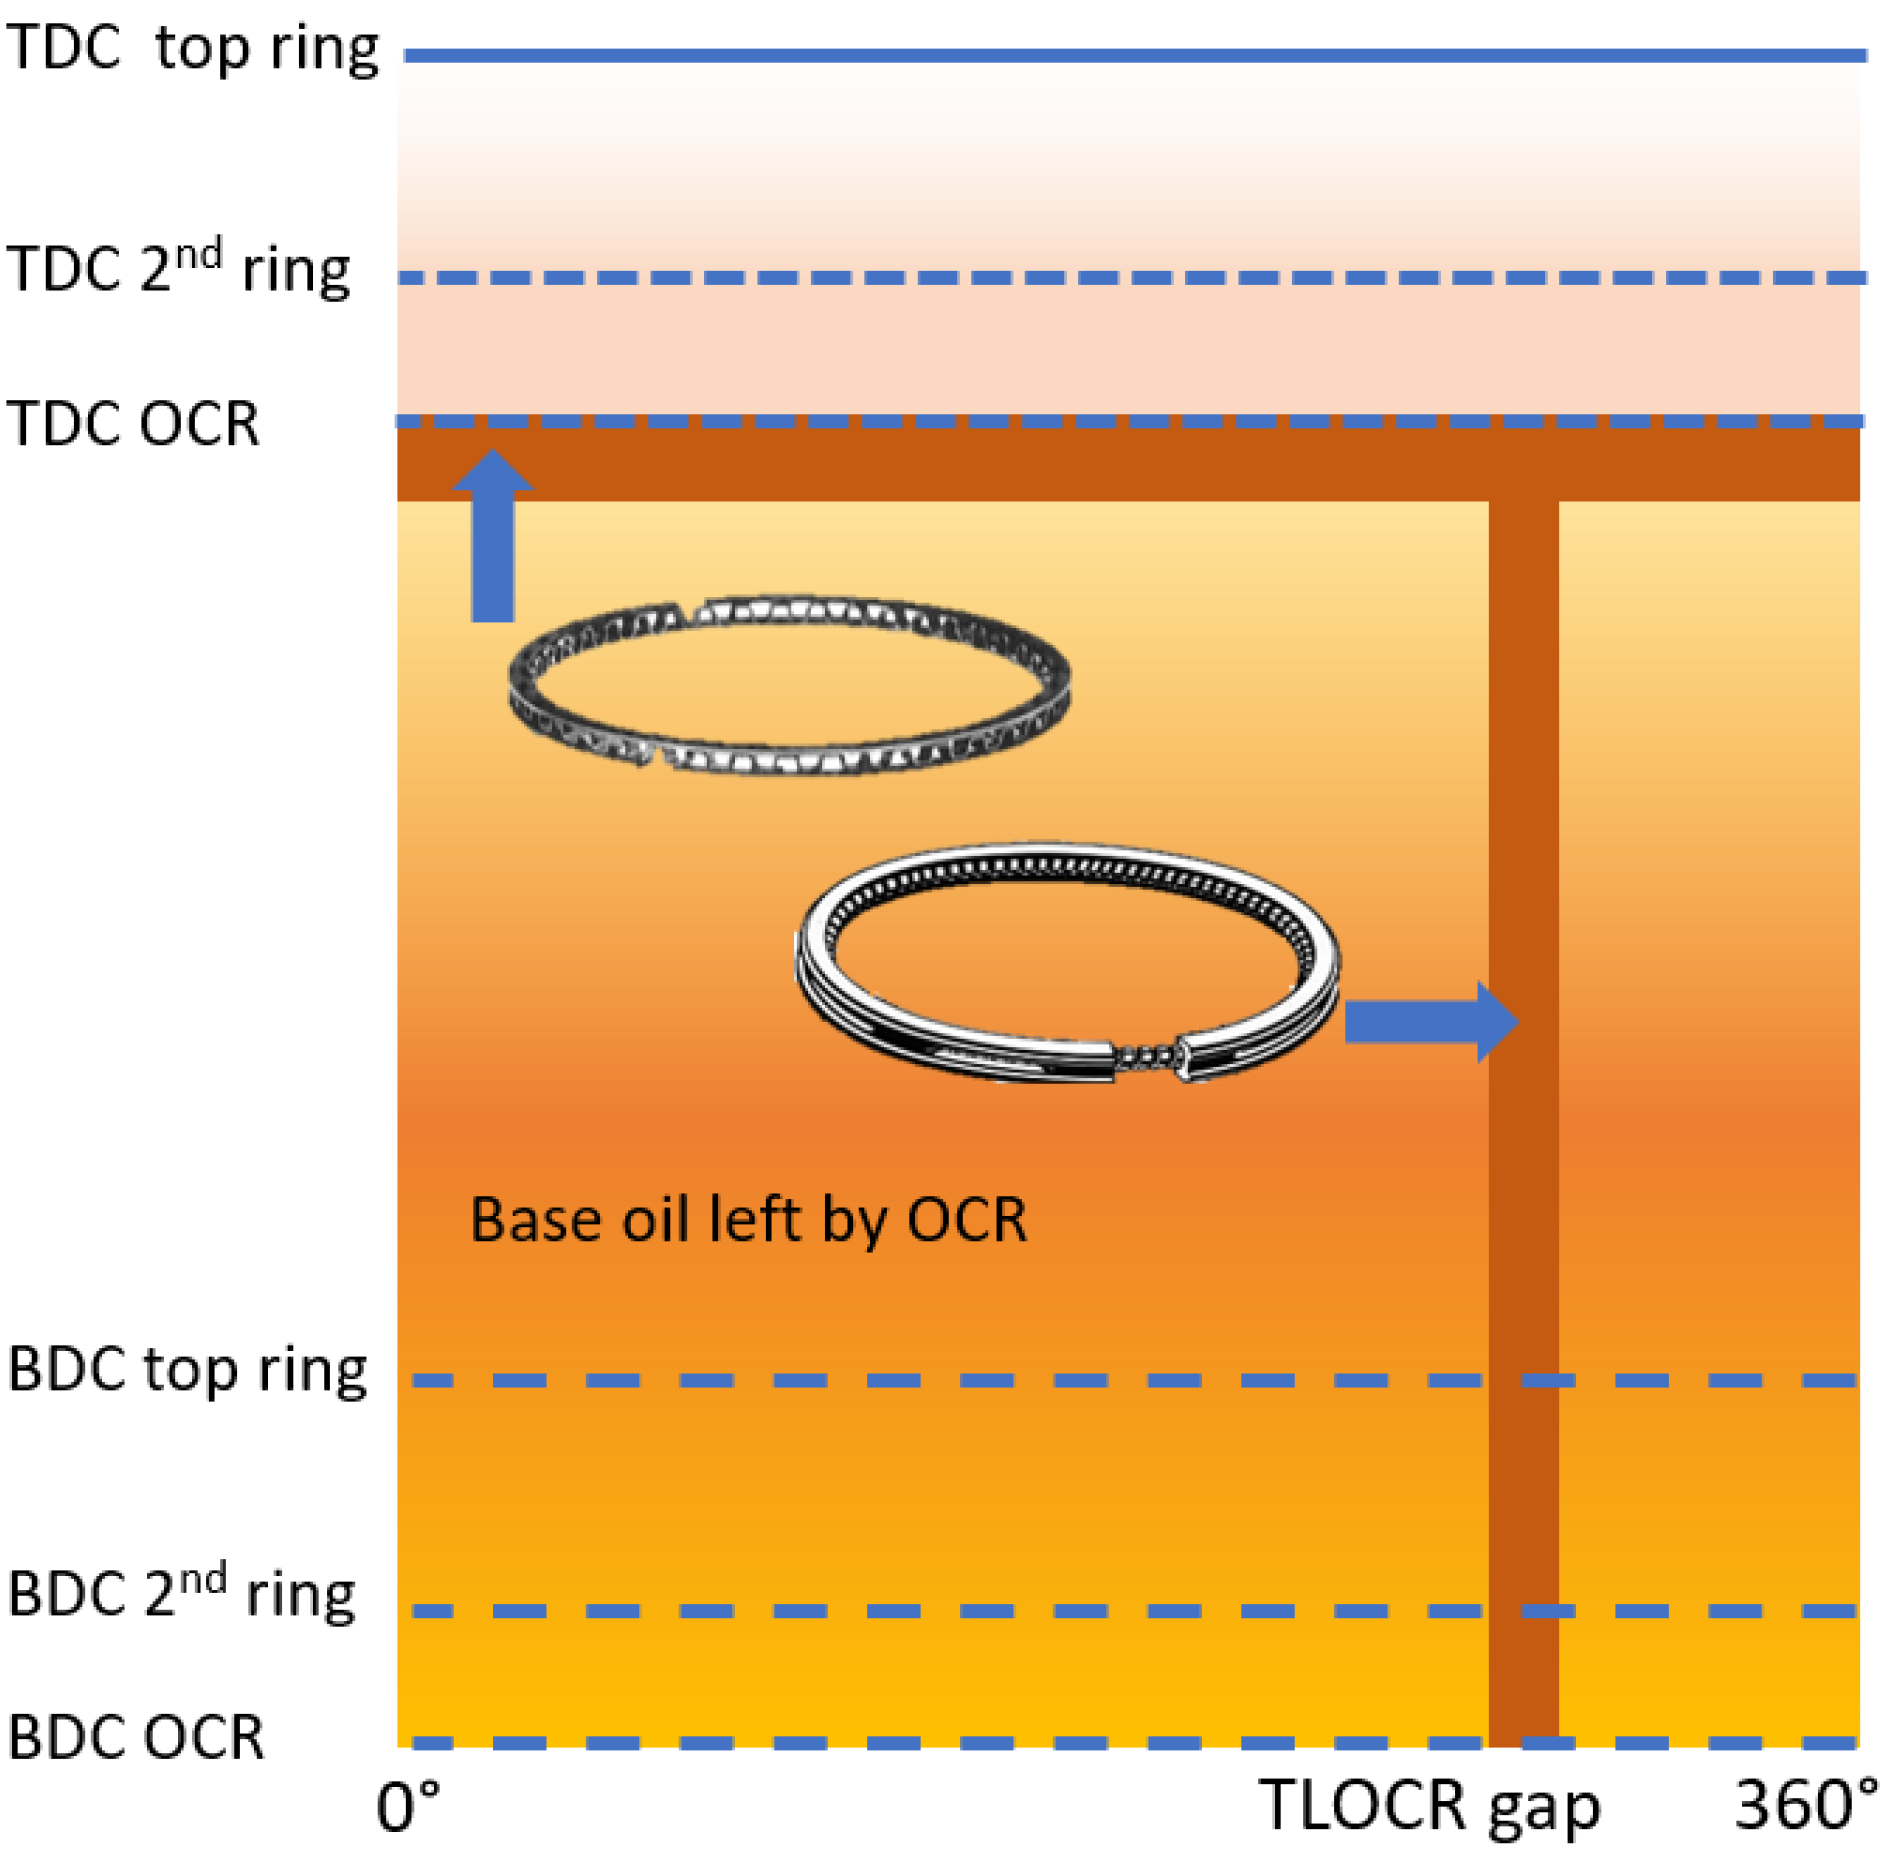
The oil supply pattern to the upper region of the piston ring pack is illustrated in Figure 6.
On the majority of the liner surface, a base oil film at the surface roughness level is left by the oil control ring. However, there can also be extra oil leakage from the oil control ring, and the exact leakage pattern depends on the type of ring being used. For the three-piece oil control ring (TPOCR), the extra oil leakage comes in the form of a uniform circumferential oil streak around the top dead center of the oil control ring [24]. On the other hand, for the twin land oil control ring (TLOCR), the extra oil leakage comes from the oil control ring gap only, and the gap leaves an axial oil streak along the liner surface [22,25]. The extra oil leakage from the oil control ring is controlled jointly by the top two rings. When the piston moves down, oil can be down-scraped from the liner by the rings and becomes the oil supply to the lower piston lands and the lower flanks of the rings. When the piston moves up, the top ring may up-scrape oil, and this will contribute to LOC (it is unlikely that the second ring will have up-scraping due to the tapered face design). The exact scraping behaviors of the top two rings depend on the local ring–liner conformability at the location with extra oil leakage from the oil control ring and are solved by the 3D ring dynamics model. The scraping rate of the top two rings and the film thickness left on the liner are determined by a simple ring–liner lubrication model.
Specifically, the model is based on correlations derived from the steady Reynolds equations of the form
x h 3 12 μ P x = x 1 2 U h
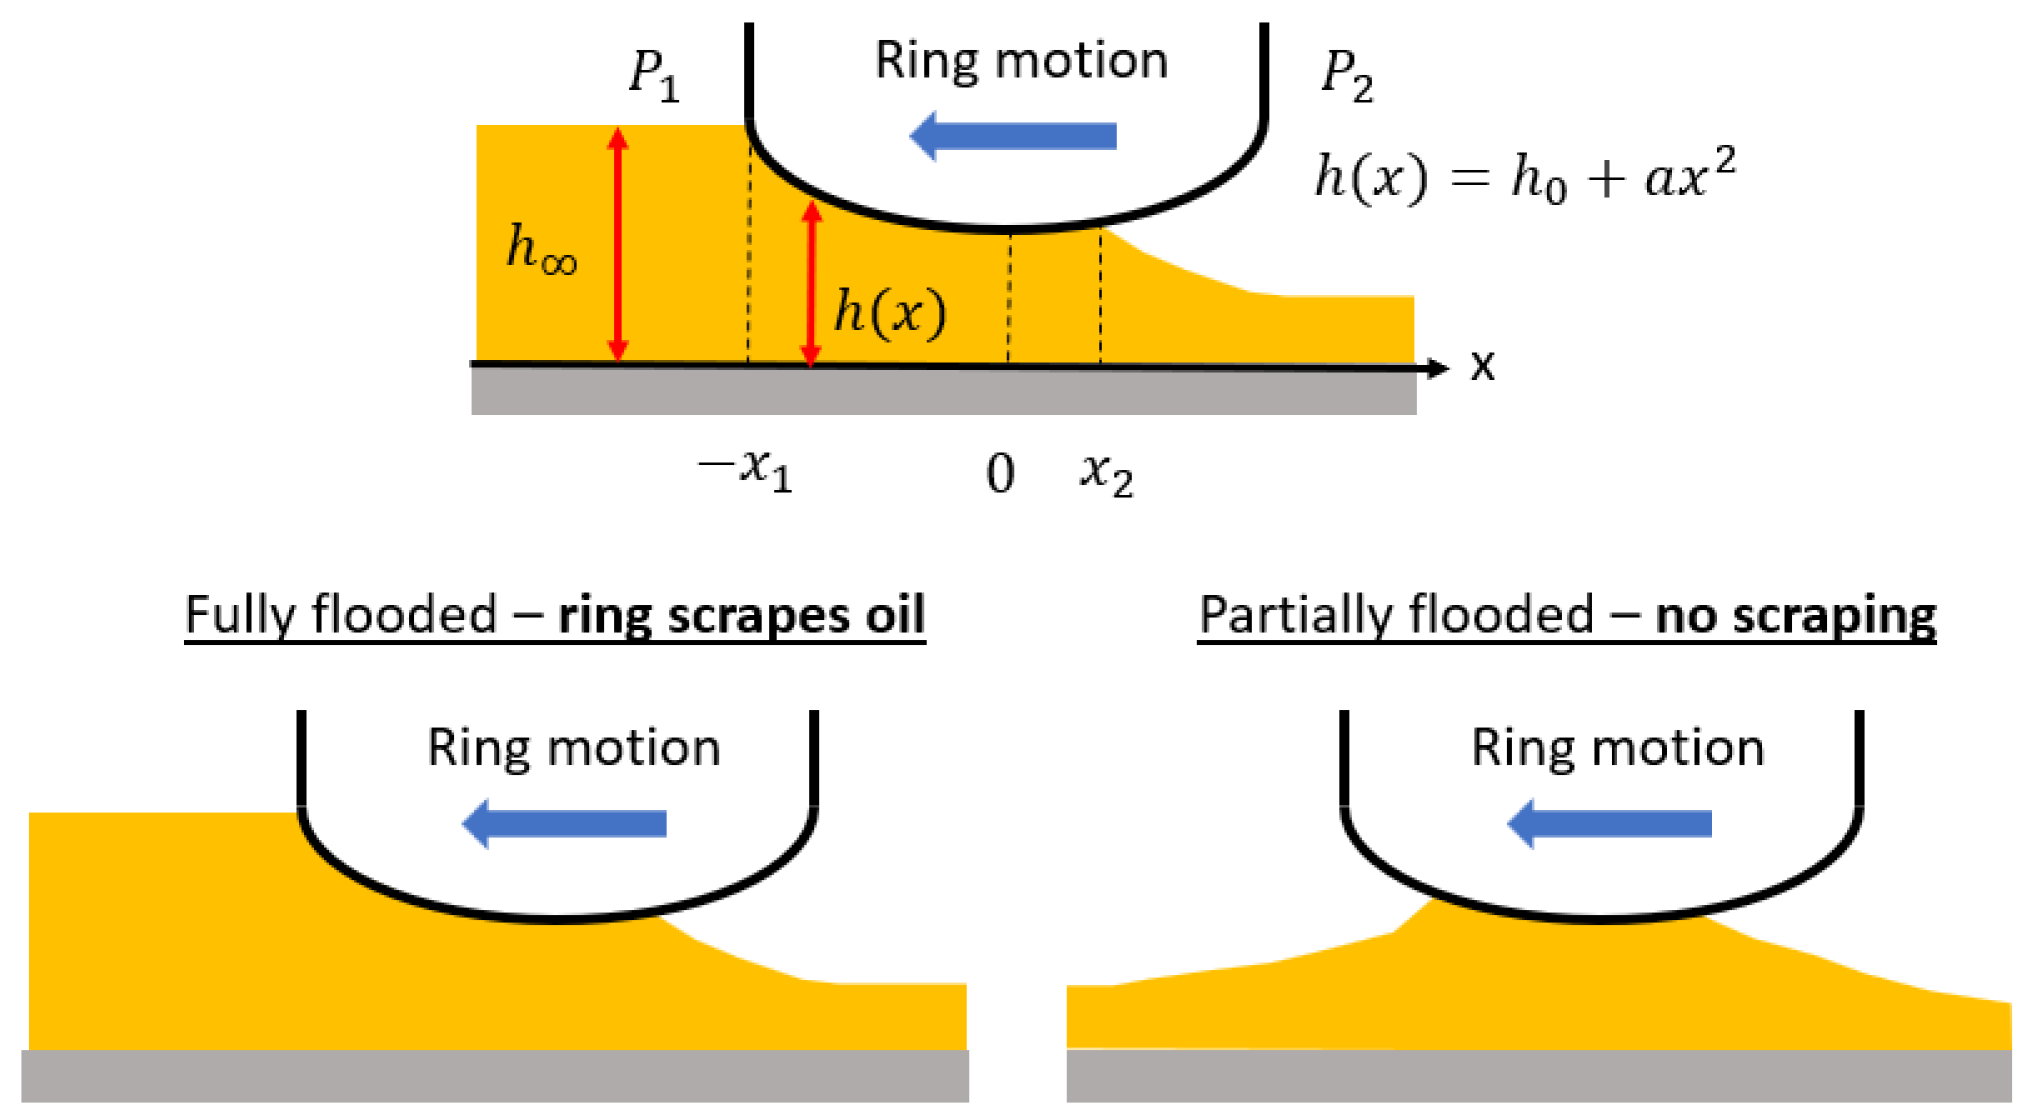
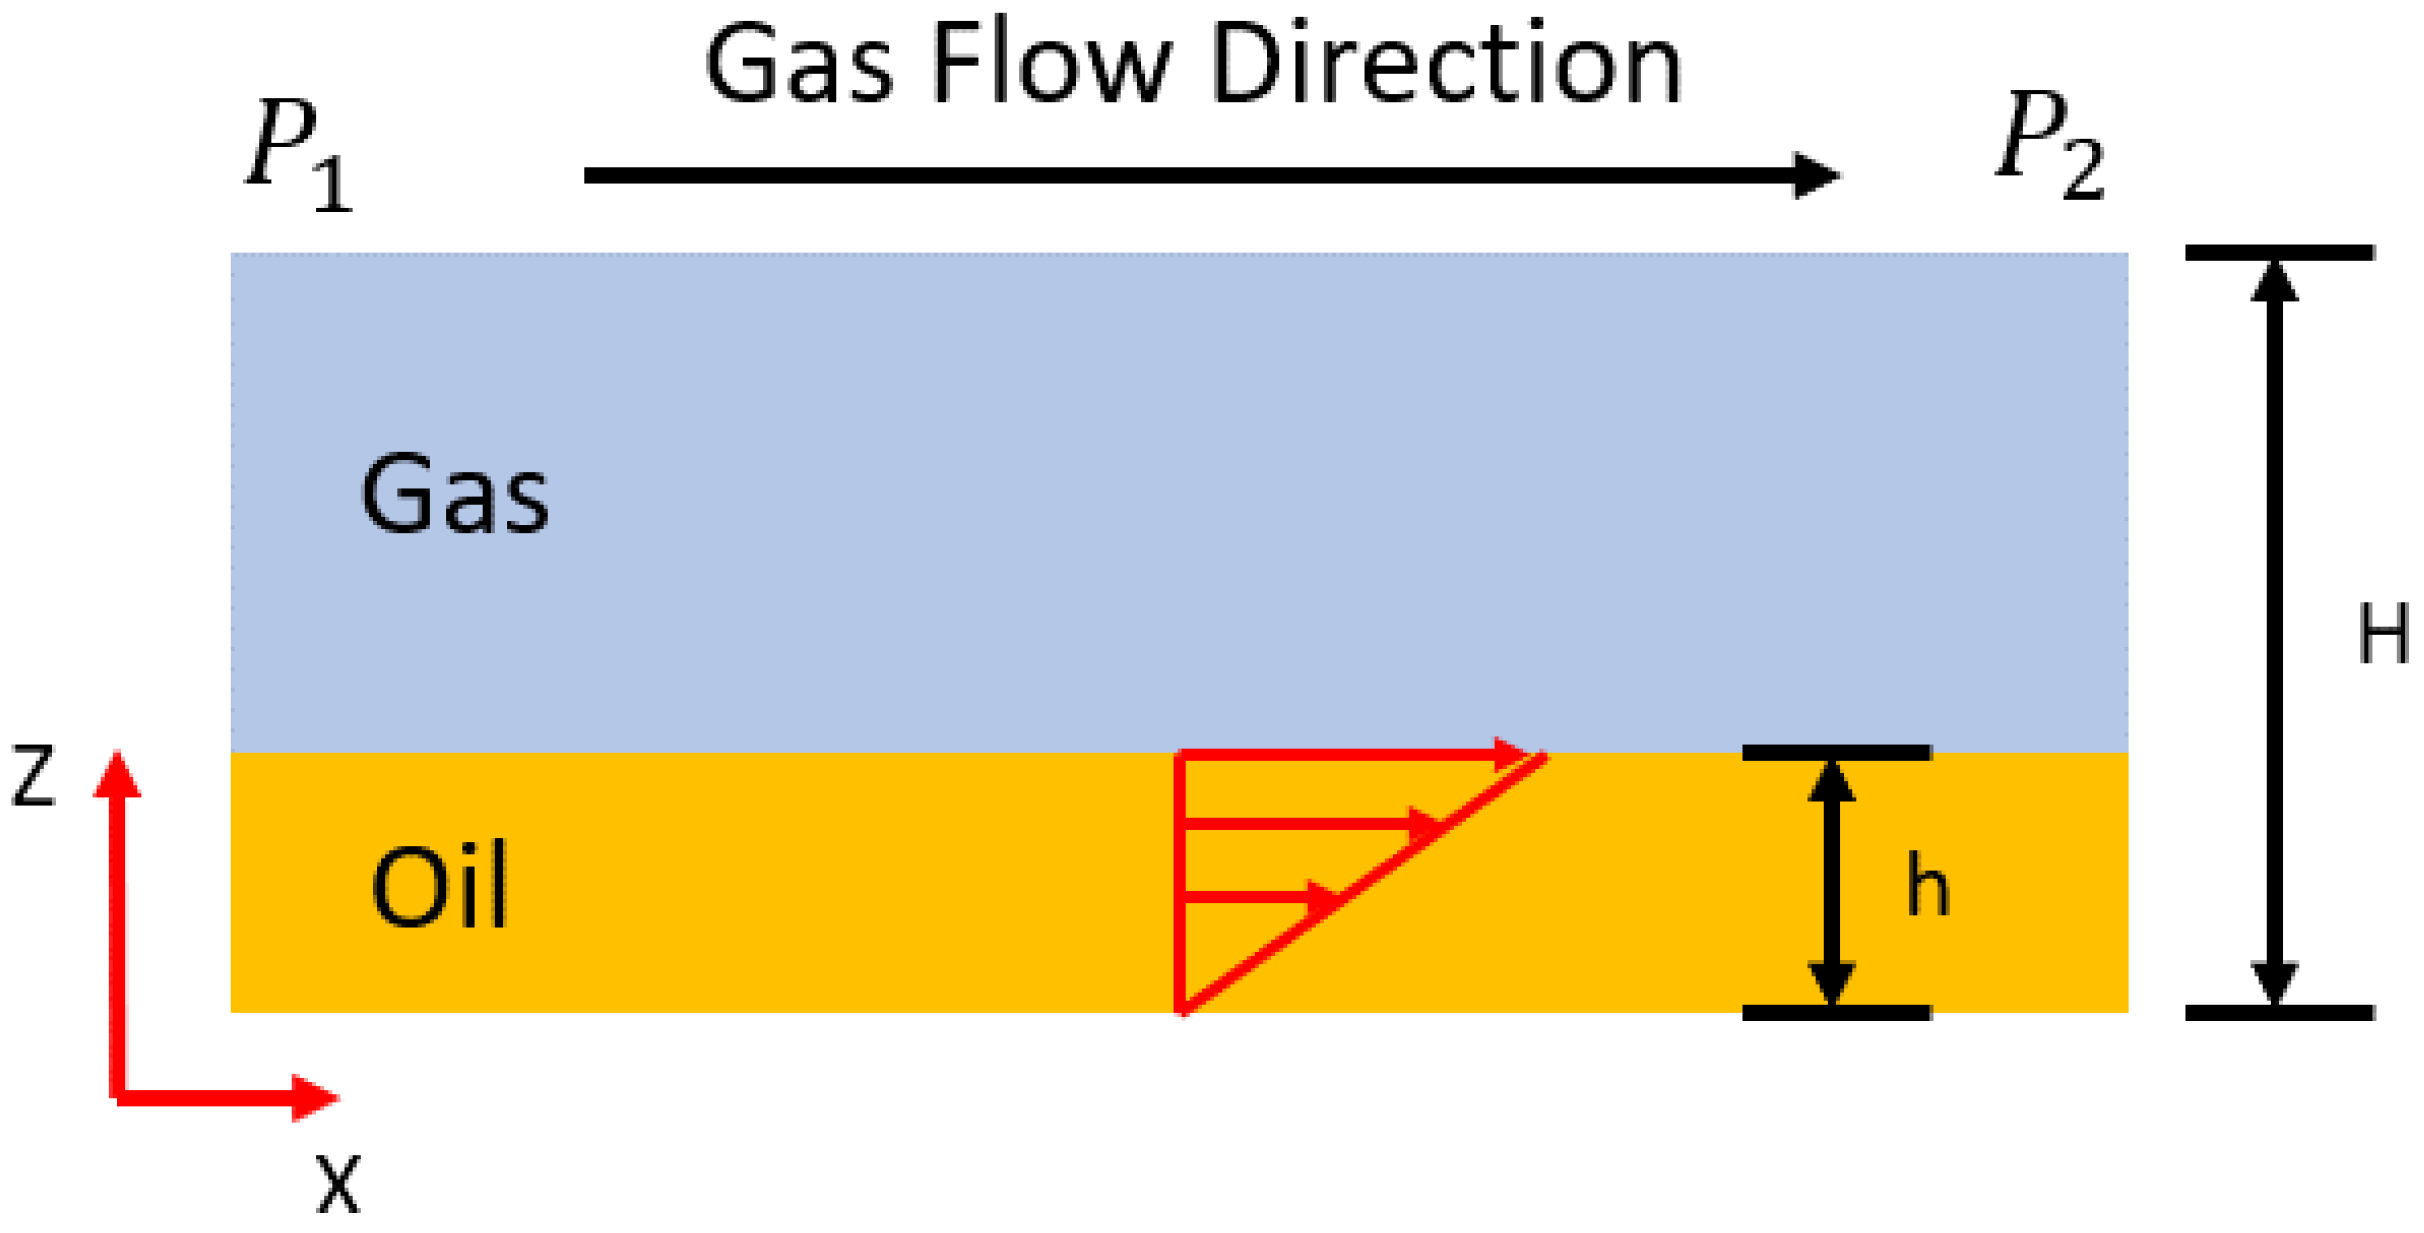
Due to the large difference between the ring axial width and the engine stroke, the unsteady term of the Reynolds equation is only important for a few degrees around the TDC and BDC. Thus, to maintain oil mass conservation, neglecting the unsteady term is a good approximation. The domain of interest is shown in Figure 7, where x 1 and x 2 are the length of the leading edge and the trailing edge of the ring’s wetting area, respectively. P 1 is the pressure at the leading edge and P 2 the pressure at the trailing edge. h is the incoming oil film thickness. a is the quadratic coefficient of the parabolic surface profile of the ring. The speed at which the ring moves is U. With the Reynolds exit condition applied at the trailing edge, and a mass balance between the inlet and the outlet, the following expressions can be derived:
1 + tan 2 ( θ 2 ) = 8 ( sin ( 2 θ 2 ) sin ( 2 θ 1 ) + 2 ( θ 2 θ 1 ) 4 P ¯ ) 12 ( θ 2 θ 1 ) + 8 ( sin ( 2 θ 2 ) sin ( 2 θ 1 ) ) + sin ( 4 θ 2 ) sin ( 4 θ 1 )
f r i n g = P 1 x 1 + P 2 x 2 + 3 μ U a h 0 1 2 ( 1 + x ¯ 2 2 ) + 1 + x ¯ 2 2 2 ( 1 + x ¯ 1 2 ) 2 1 1 + x ¯ 1 2
The ring load, f r i n g is the ring–liner asperity contact force and the hydrodynamic force computed using the 3D ring dynamics model. The following non-dimensional quantities for pressure, the leading edge location, and the trailing edge location, are used: x ¯ 1 = a h 0 ( x 1 ) , x ¯ 2 = a h 0 ( x 2 ) , θ 1 = arctan ( x ¯ 1 ) , θ 2 = arctan ( x ¯ 2 ) , P ¯ = P 2 P 1 6 μ U h 0 a h 0 . For the fully flooded case, the location of the trailing edge x 2 and the minimum film thickness h 0 can be found from the two equations above. The scraping rate of the ring can be found by subtracting the incoming flow rate from the flow rate at the leading edge. For the partially flooded case, the locations of the leading and the trailing edge, namely x 1 and x 2 , and the minimum film thickness h 0 can be found from the two equations above with one additional relation based on mass conservation
h 2 = 2 h
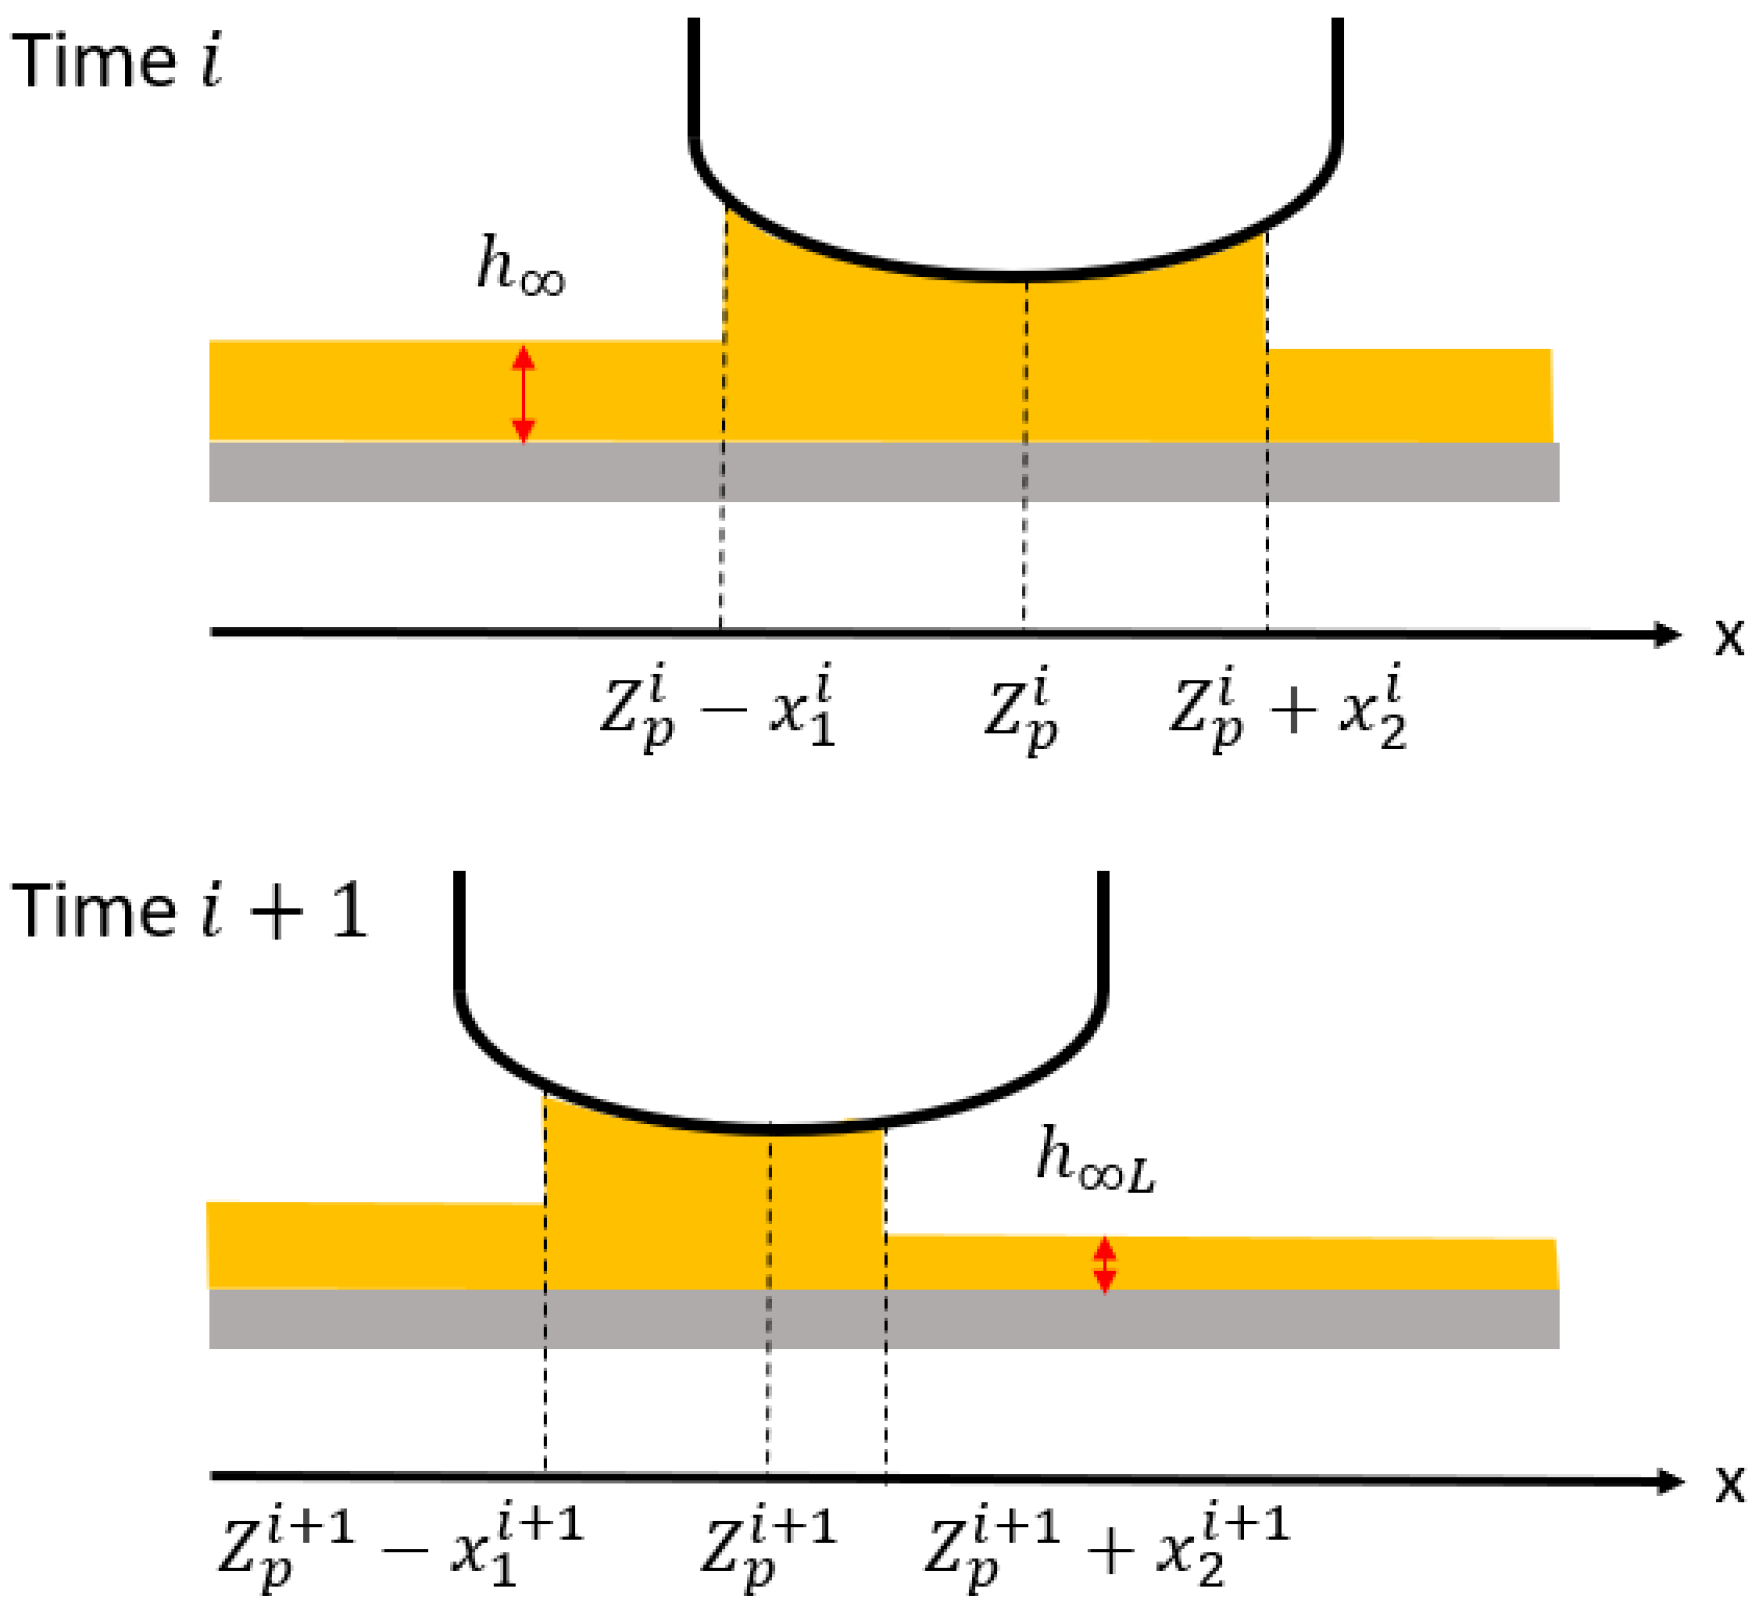
The oil film thickness left on the liner after the passage of the ring with the ring’s wetting change considered can be found via mass conservation relations, and it is illustrated in Figure 8.
A i + h ( Z p i x 1 i ) ( Z p i + 1 x 1 i + 1 ) = A i + 1 + h L ( Z p i + x 2 i ) ( Z p i + 1 + x 2 i + 1 )
A relevant study on the lubrication behaviors of a parabolic-shaped slider under isobaric boundary conditions can be found in [26].

3.3. Hybrid Gas Flow Model

A sample of 3D single-phase CFD simulation of the gas flow field on the second land during the blowby period is shown in Figure 9. In particular, the simulation domain consists of the second land and the second ring groove. A prominent feature of the flow field is the vortex pattern downstream the top ring gap where the high-pressure gas enters the flow domain. A sample observation from 2DLIF experiment on the flow field around the top ring gap is shown in Figure 3. More discussions on the vortex pattern can be found in [9]. Note that the experimental observation only captures the oil flow pattern; however, since oil flow is primarily driven by gas flow, the gas flow pattern can be inferred from the result.
A naive approach to obtain the gas flow pattern in each region of the piston ring pack at each time step when using the digital twin model is to run a full-scale 3D CFD simulation. However, this approach would be computationally expensive, as the pressure environment can change from crank angle to crank angle. In this work, following the same logic in [15], a hybrid approach is developed. From the gas flow simulation result shown in Figure 9, it is clear that the gas flow on the piston land can be divided into two types of regions: those around the ring gaps and those away from the ring gaps. For regions away from the gaps, the flow can be approximated with a pressure-driven flow model in the form
U = d p d x f z μ
where f z is the resistance coefficient. The determination of f z (by solving a Poisson’s equation on the cross-section of the flow domain) and the gas pressure gradient d p d x (by solving a system of linearized mass conservation equations) can be found in [21]. The gas flow in the ring grooves is also computed with the pressure-driven flow model.
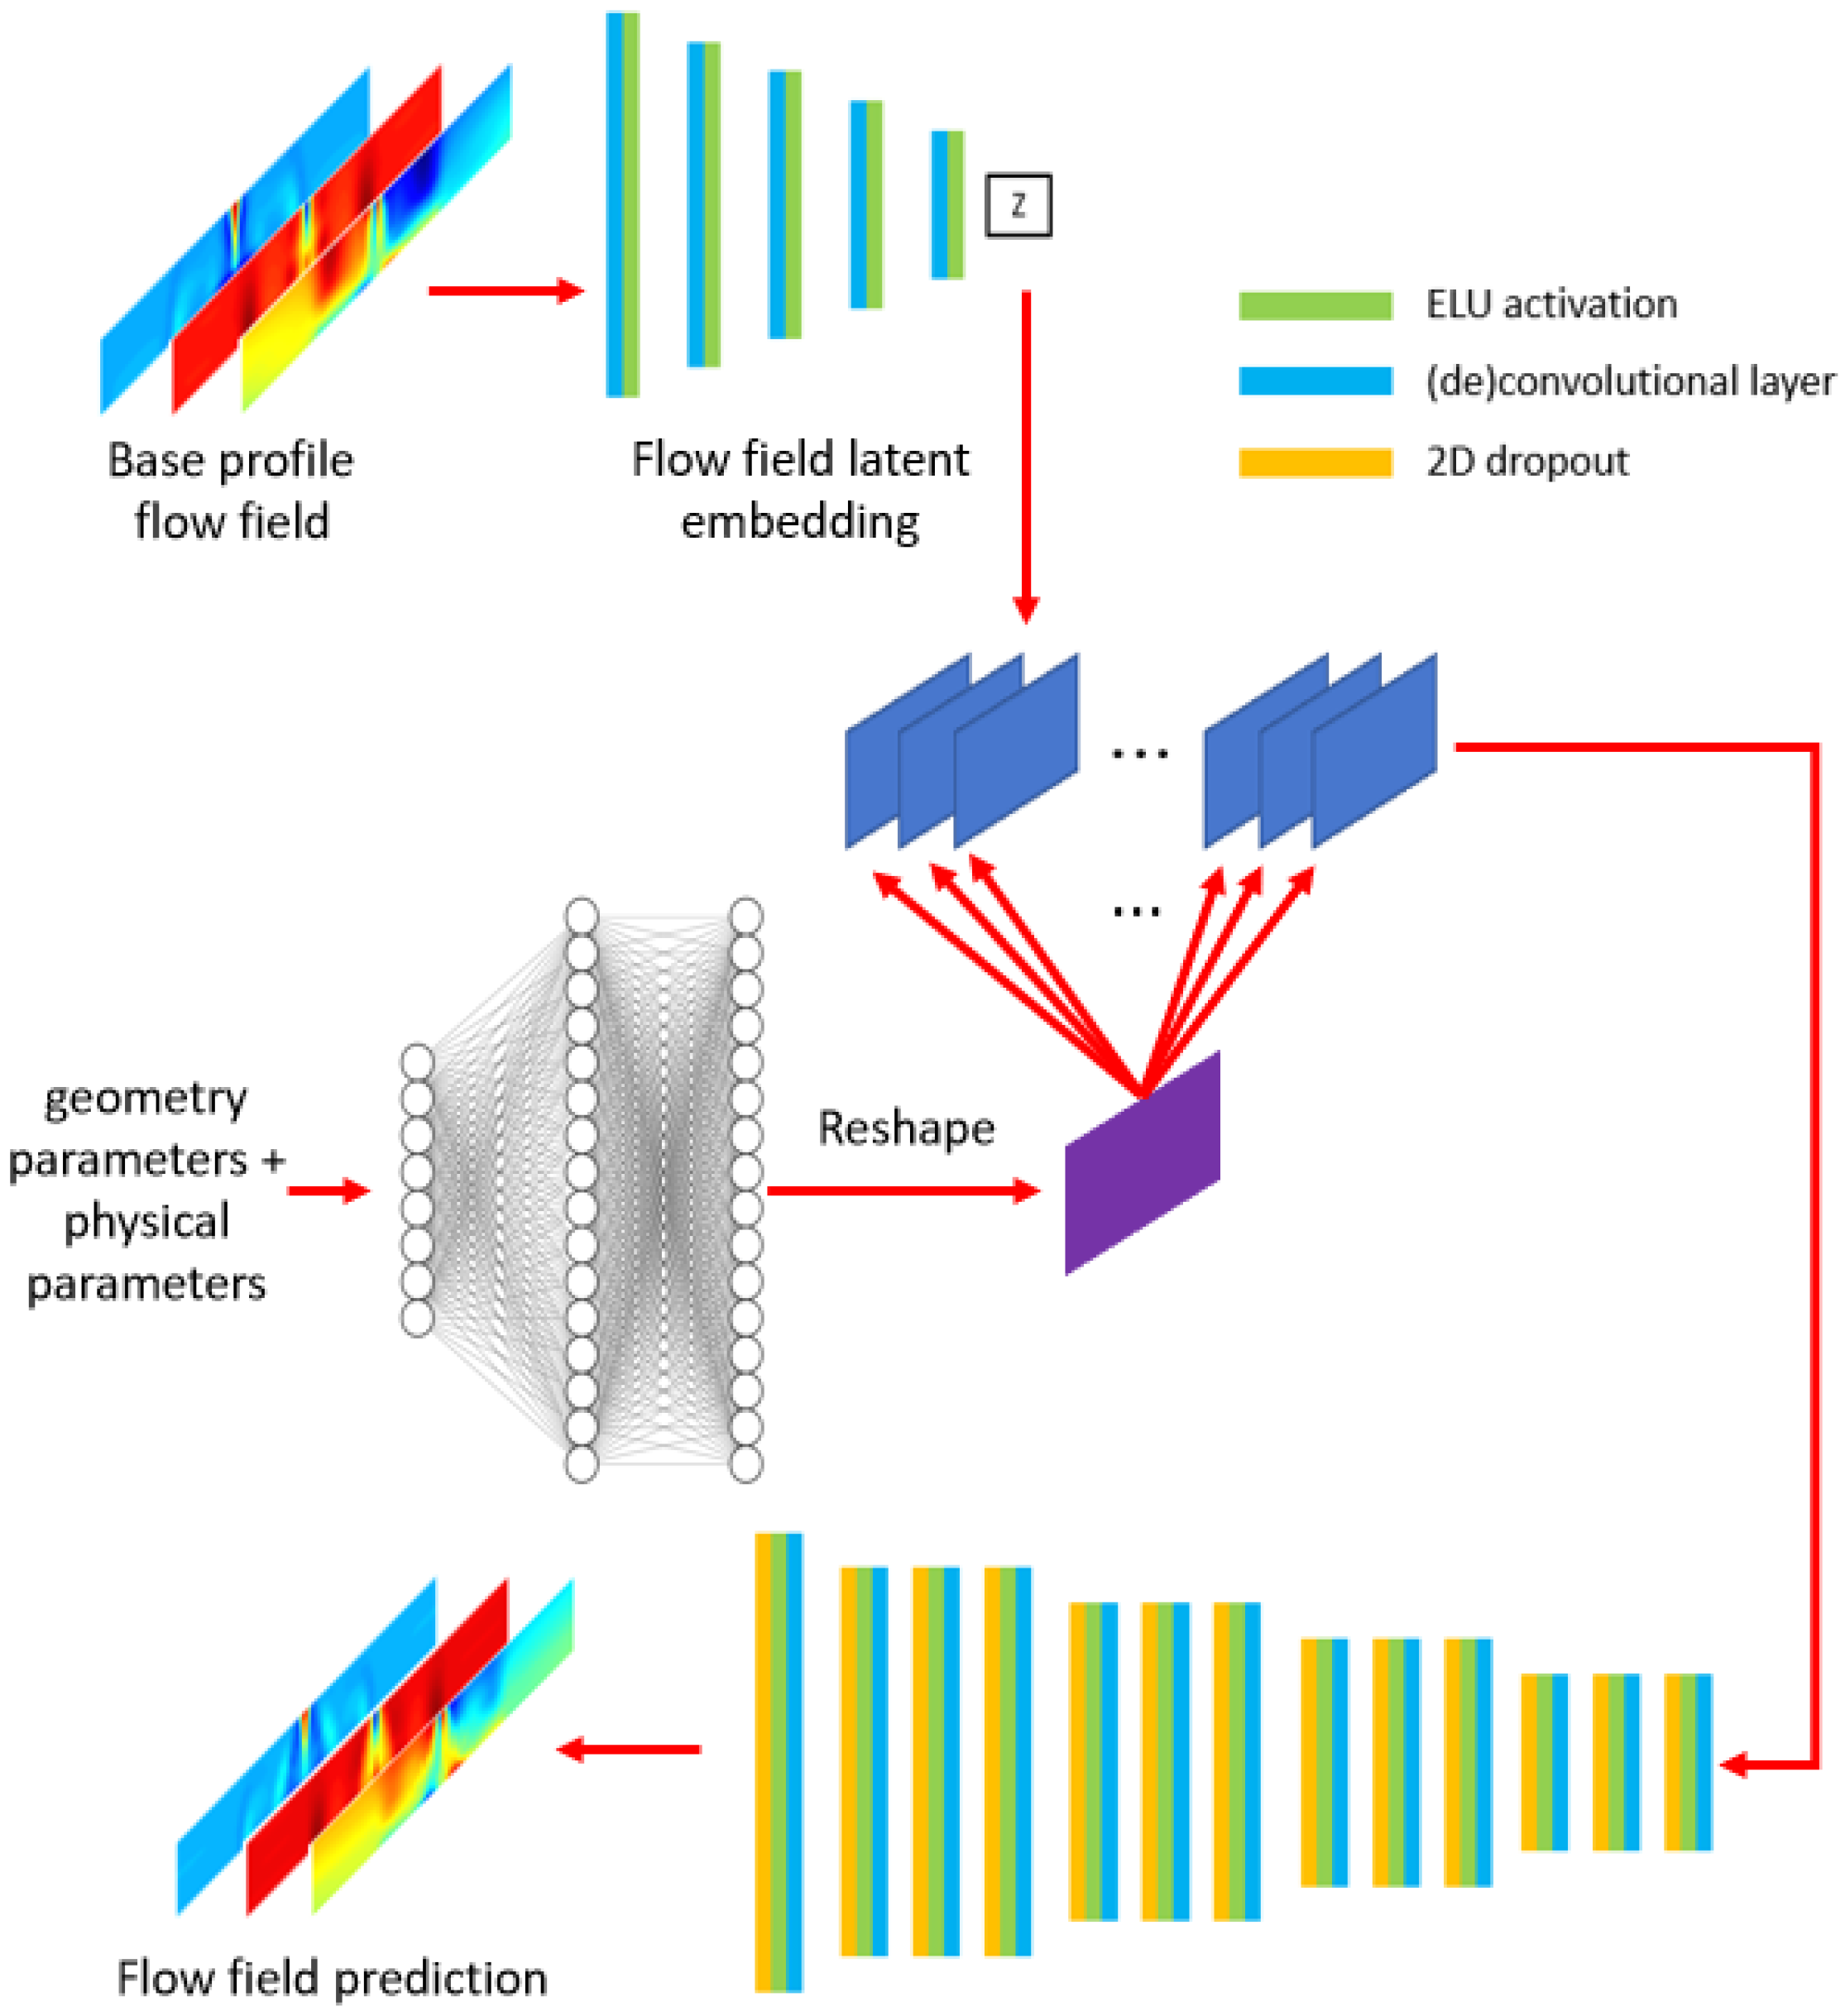
For the regions around the ring gap, the flow field is predicted with a data-driven model. In the previous work [15], a similar approach was also used. However, the model previously developed did not consider the influence of the cross-sectional shape of the flow domain, which can affect the flow pattern as studied in [21]. In this work, an improved approach is introduced. When predicting the gas flow field, the model considers both physical parameters and geometrical parameters. Specifically, the model architecture is shown in Figure 10. The model takes three types of inputs:
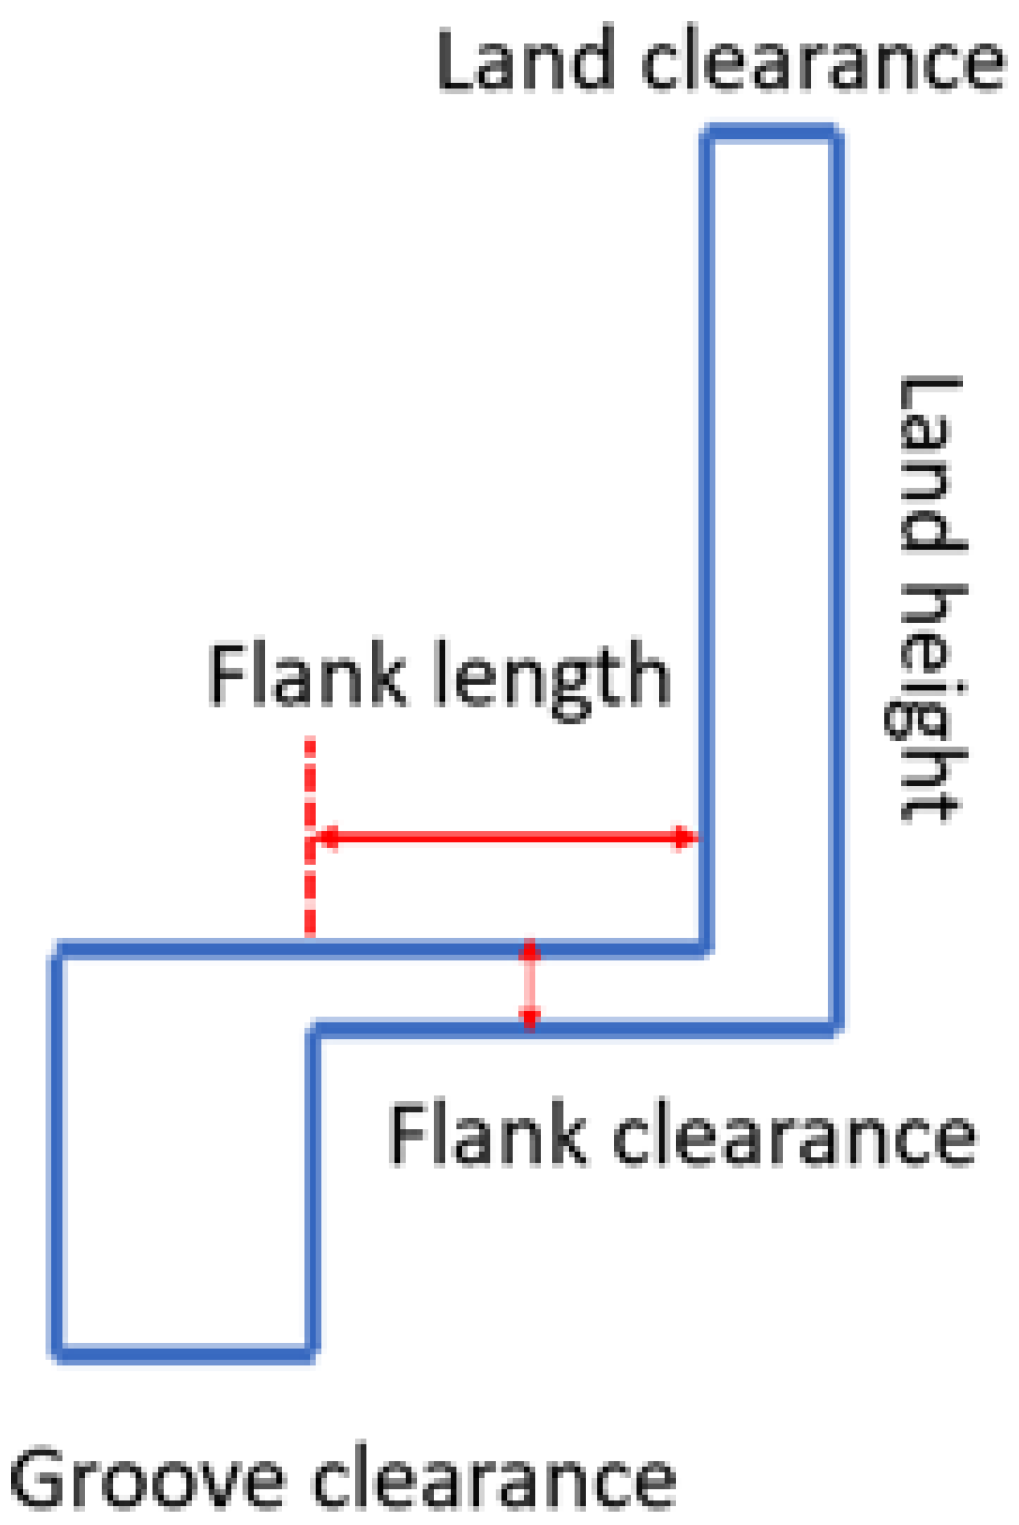
  • Geometry parameters: the parameters that define the cross-section shape of the flow domain (Figure 11), the relative position between the inlet gap and the outlet gap, and the axial position of the second ring within the groove
  • Physical parameters: pressure at the inlet gap and the outlet gap
  • Base profile flow field: from the study performed in [21], compared to physical parameters, geometrical parameters have a more profound influence on the flow pattern. In other words, changing the shape of the cross-sectional geometry while holding pressure boundary conditions constant causes much more variation in the flow pattern than changing pressure boundary conditions while holding the cross-sectional geometry constant. Additionally, the various flow patterns resulting from different cross-section geometries within the design space can roughly be categorized into a predefined number of groups. A small number of “base geometries” are first sampled from the design space. The base flow field is generated by running CFD simulations on these geometries with the same inlet-outlet pressure combination. In predicting the flow field, the base profile for a particular set of input geometry is selected based on a similarity measure between the geometry parameters and the base profiles. The base profile flow field provides a rough estimation of the actual flow field to be predicted. A more detailed description can be found in [21].
To predict the flow field, an encoder network is first used to generate a latent representation of the base profile flow field. Simultaneously, the output of a fully connected network, which takes the geometrical and physical parameters as inputs, is reshaped and then multiplied element-wise with each channel of the latent representation of the base flow field. The resulting product then goes through a decoder network to generate the actual flow field.
The loss function for training the model consists of a mean squared error (MSE) term and a structural similarity (SSIM) term [27]. The SSIM is added such that the prediction can capture some small, more subtle features in the flow field.
L = 1 N i = 1 N x i y i 2 2 + 1 SSIM ( x i , y i ) 2
where
SSIM ( x , y ) = ( 2 μ x μ y + c 1 ) ( 2 σ x y + c 2 ) ( μ x 2 + μ y 2 + c 1 ) ( σ x 2 + σ y 2 + c 2 )
The term definitions are as follows:
  • x is the predicted flow field and y the real flow field;
  • μ x and μ y are the pixel means of x and y;
  • σ x and σ y are the pixel standard deviation of x and y;
  • σ x y is the pixel covariance of x and y;
  • c 1 and c 2 are small constants for numerical stability.
The training data are CFD simulations on domains with different cross-section shapes sampled from a design space where the bounds of each geometrical parameter are defined based on designs supplied by industrial collaborators, and different inlet-output pressure combinations computed with the 2D model [13].

3.4. Liquid Oil Transport Model

For the liquid oil transport part, only the essential and dominant physics are considered, which are the shear stress from gas flow (for both the circumferential and the axial direction) and the inertia force due to piston reciprocating motion (for the axial direction only). The following derivations use x to denote the circumferential direction, y to denote the axial direction and z to denote the radial direction.
For inertia-driven oil transport, by considering the body force, the following expression [6] can be derived from the Navier-Stokes equations
0 = μ 2 V z 2 ρ a p
Note that only the viscous diffusion term is kept based on a scaling analysis [15]. By integrating Equation (10) twice, the volumetric oil flow rate due to the inertia force along the axial direction can be found as
Q o i l , i n e r t i a = 0 h V ( z ) d x = a p h 3 3 ν
For the gas-driven oil transport, the derivation follows from the methodologies in [6,28] using a Couette–Poiseuille flow model. An illustration of the model is shown in Figure 12. Along the circumferential direction, the Navier-Stokes equation can be simplified to
0 = μ 2 u z 2 P x
The oil–gas interaction relations along the axial direction follows the exact same method. With the no-slip boundary condition at z = 0 and z = H , as well as the velocity and shear stress continuity at z = h (which is the oil–gas interface), the flow velocity of gas and oil can be found as
U o i l = 1 μ o i l P x z 2 2 + μ g a s μ o i l z K
U g a s = 1 μ g a s P x z 2 H 2 2 + K ( z H )
where
K = H 2 μ g a s P x β 2 μ g a s + μ o i l ( 1 β 2 ) ( μ o i l μ g a s ) β μ o i l
β = h H
With the fact that μ g a s μ o i l , the volumetric flow rate of oil is
Q o i l = μ g a s μ o i l β 2 ( 3 + β ) ( 1 β ) 3 Q g a s
The mass conservation relation for an infinitesimally small area in a region of the piston ring pack can then be written as
γ y + θ x + h t = 0
where θ is the oil flow rate along the circumferential direction driven by gas flow, and γ is that along the axial direction driven by both gas flow and inertia force,
θ = μ g a s μ o i l β 2 ( 3 + β ) ( 1 β ) 3 Q g a s , x γ = μ g a s μ o i l β 2 ( 3 + β ) ( 1 β ) 3 Q g a s , y a p h 3 3 ν
Note that the gas flow terms Q g a s , x and Q g a s , y are found by the gas flow model introduced previously.

3.5. Liner Vaporization Model

At any instant, oil evaporates from the portion of the liner exposed to the combustion chamber. A simple oil vaporization model partially based on the previous works in [29,30] is developed to determine the oil vaporization rate. The simulation domain is shown in Figure 13.
With the Woschni correlation [31], the convective heat transfer coefficient can be found with the expression
h = 3.26 B 0.2 P g a s 0.8 T g a s 0.55 w 0.8
where B is the bore diameter, P g a s is the cylinder gas pressure, T g a s is the cylinder gas temperature, w is the mean cylinder gas velocity and can be found with the correlations derived in [31]. The convective mass transfer coefficient of species i, represented as g i , can be found with Equation (19), along with Equation (20) (the Chilton–Colburn J-factor analogy [32]) and Equation (21) (diffusion coefficient D i determined by the Wilke–Chang equation [33]).
g i = h c p , i ρ a i r c p , i D i k a i r 2 3
S h · P r 1 / 3 = N u · S c 1 / 3
D i = 0.01 · T i n t 1.75 P g a s ν i 1 / 3 + ν a i r 1 / 3 1 M i + 1 M a i r 1 / 2
The terms S h , P r , N u , S c are the Sherwood number, Prandtl number, Nusselt number, and the Schmidt number, respectively. c p , i is the heat capacity of at constant pressure of species i. ν i and ν a i r are the diffusion volumes of species i and air, respectively. M i and M a i r are the molecular weight of species i and air, respectively. T i n t is the oil–gas interface temperature (for simplicity, it is currently assumed to be the local liner temperature). ρ a i r and k a i r are the density and thermal conductivity of air, respectively. The vaporization rate of species i, m ˙ i can thus be found by
m ˙ i = g i ϵ i
ϵ i is the mass fraction of species i at the oil–gas interface and can be determined by using the Raoult’s law (Equation (23)) and the Antoine equation (Equation (24)) to determine the saturated vapor pressure of the species
ϵ i = χ i p s , i M i P g a s M a i r
p s , i = 133.3 · 10 A i B i C i + T i n t
where χ i is the mole fraction of species i, and A i , B i , and C i are the three Antoine coefficients of species i and the numbers are found in [34].
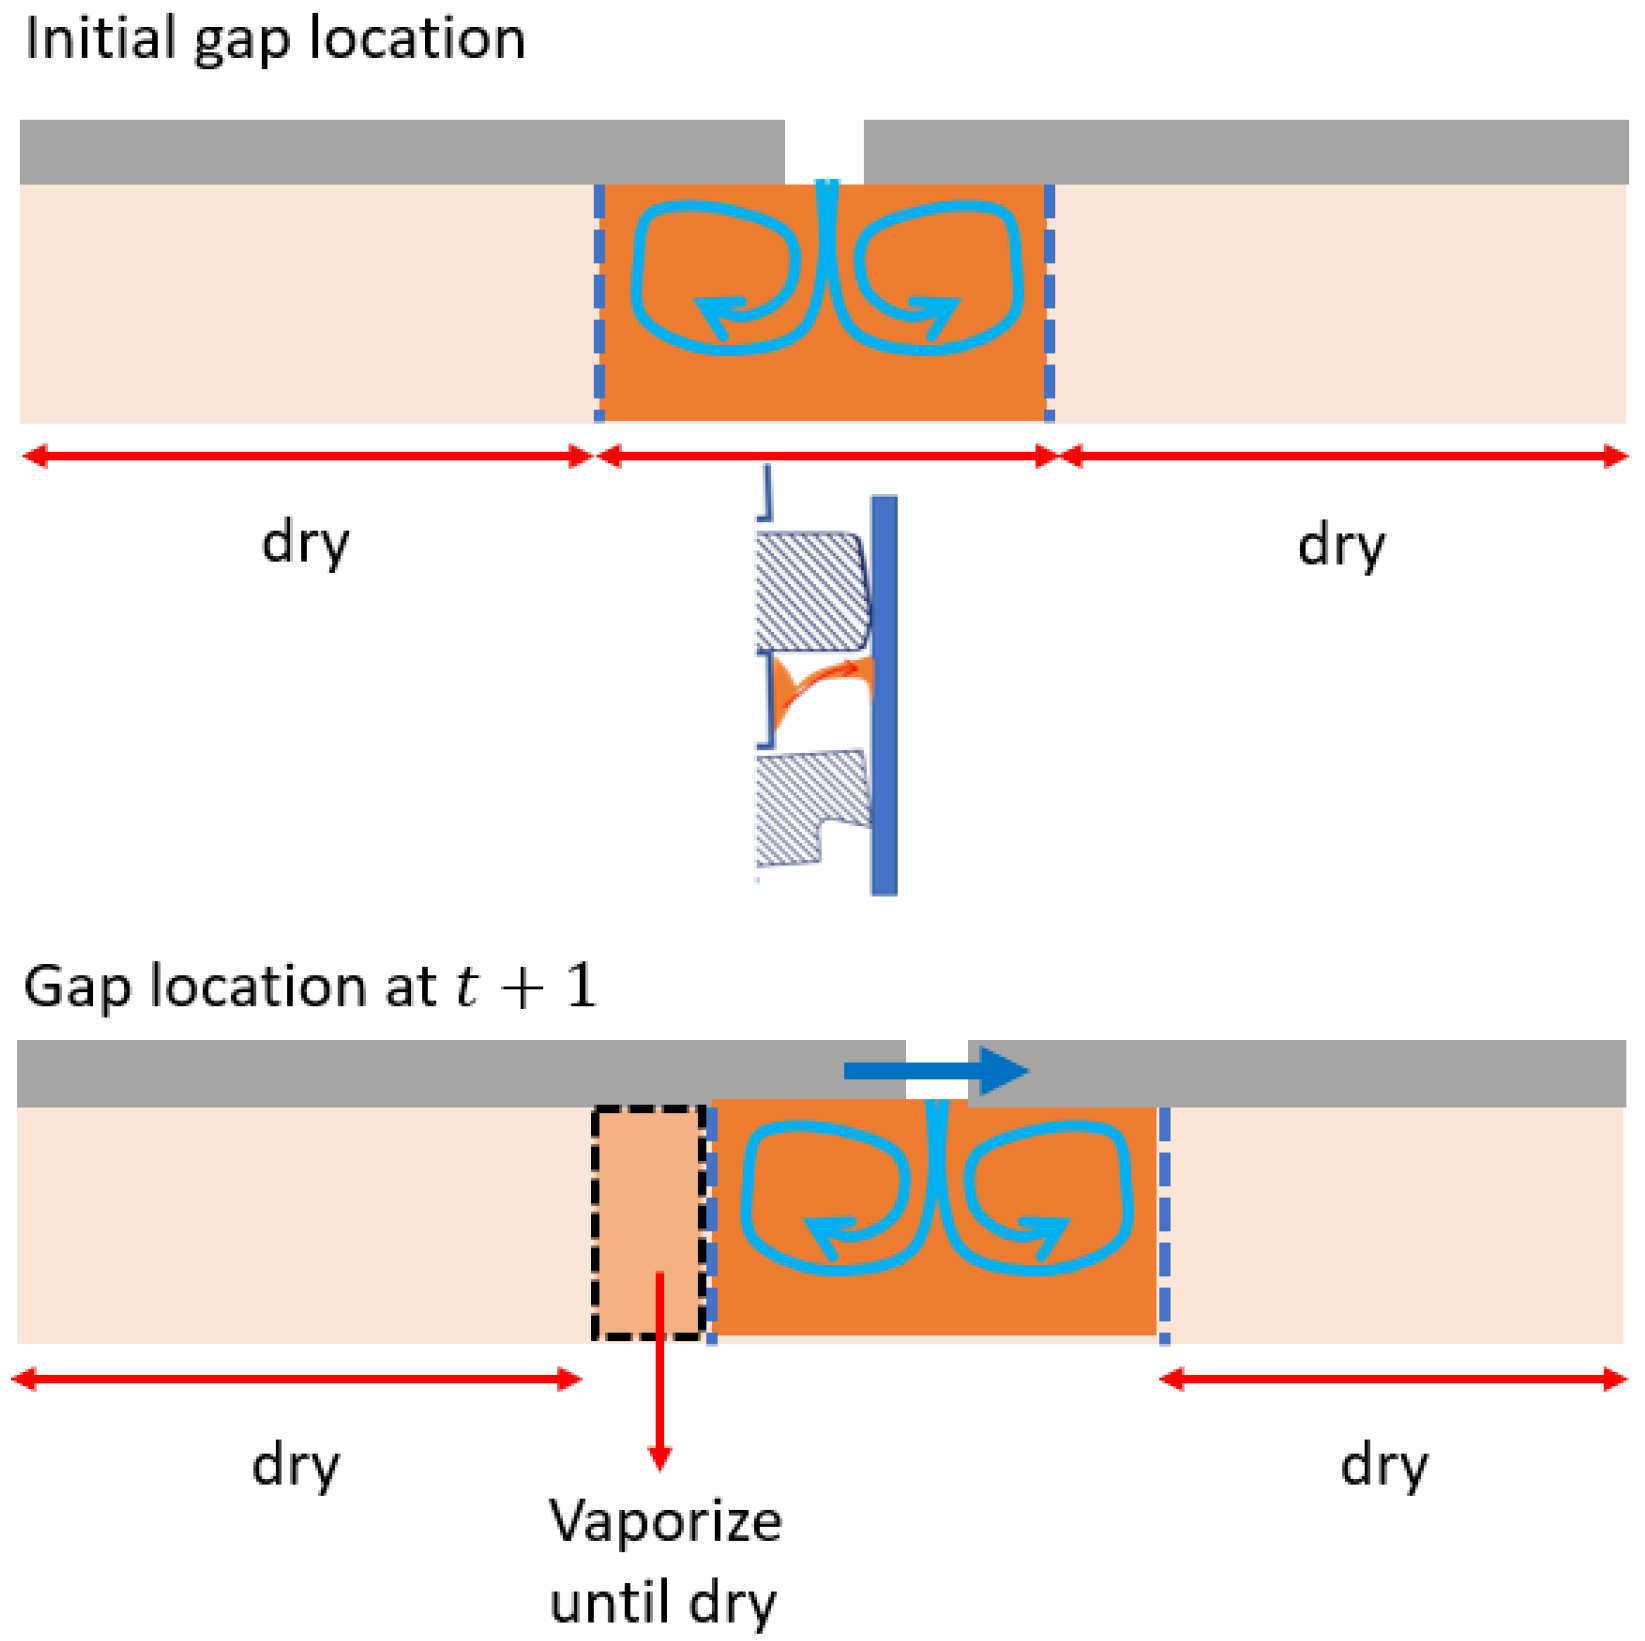
Below the dry region, oil is always refreshed by the oil control ring due to ring rotation and the extra oil leakage from the oil control ring. Therefore, the oil vaporization behavior is identical every cycle. The average oil vaporization rate within one engine cycle can be determined by counting the evaporated mass for each species from the portion of the liner exposed to the combustion chamber. On the other hand, there is no oil supply from the oil control ring in the dry region. The only oil supply to the liner is from vortex-enhanced bridging, and it is assumed that the supplied oil fully floods the top ring. Hence, the oil film thickness remaining after the top ring passes can be determined accordingly using the ring–liner lubrication model, and the vaporization rate in the vortex region can be calculated using the expressions developed above. It is important to note that due to top ring rotation, an area on the liner outside the vortex region may still have oil left if it was previously inside the vortex region. Oil continues to evaporate in this area until it becomes dry. This is illustrated in Figure 14. The total vaporization rate in the dry region is found by simply summing the vaporization rate at each circumferential location.

4. Result Discussion

In this section, results obtained from the models developed are discussed. Unless otherwise stated, the engine profile used is from a large-bore natural gas engine operating under full load conditions with an engine speed of 1600 RPM and a peak cylinder pressure of 160 bar . The piston ring pack has a twin land oil control ring, and the extra oil leakage to the liner is from the oil control ring gap as shown in Figure 6.

4.1. Ring Scraping Behavior

In general, the scraping behavior of the top two rings is dependent on the relative arrangements between the top ring gap, the second ring gap, and the oil control ring gap, as illustrated in Figure 15. The oil supply is from the oil control ring gap, and for a particular location of the oil control ring gap, if the arrangements of the top ring gap and the second ring gap are different, the scraping rate of each of the top two rings are likely to be different due to the difference in the local ring–liner conformability at the oil control ring gap location. If the circumferential locations of all three gaps are close to each other, oil can leak to the upper region more easily, which may result in a higher up-scraping and/or down-scraping rate for the top ring.
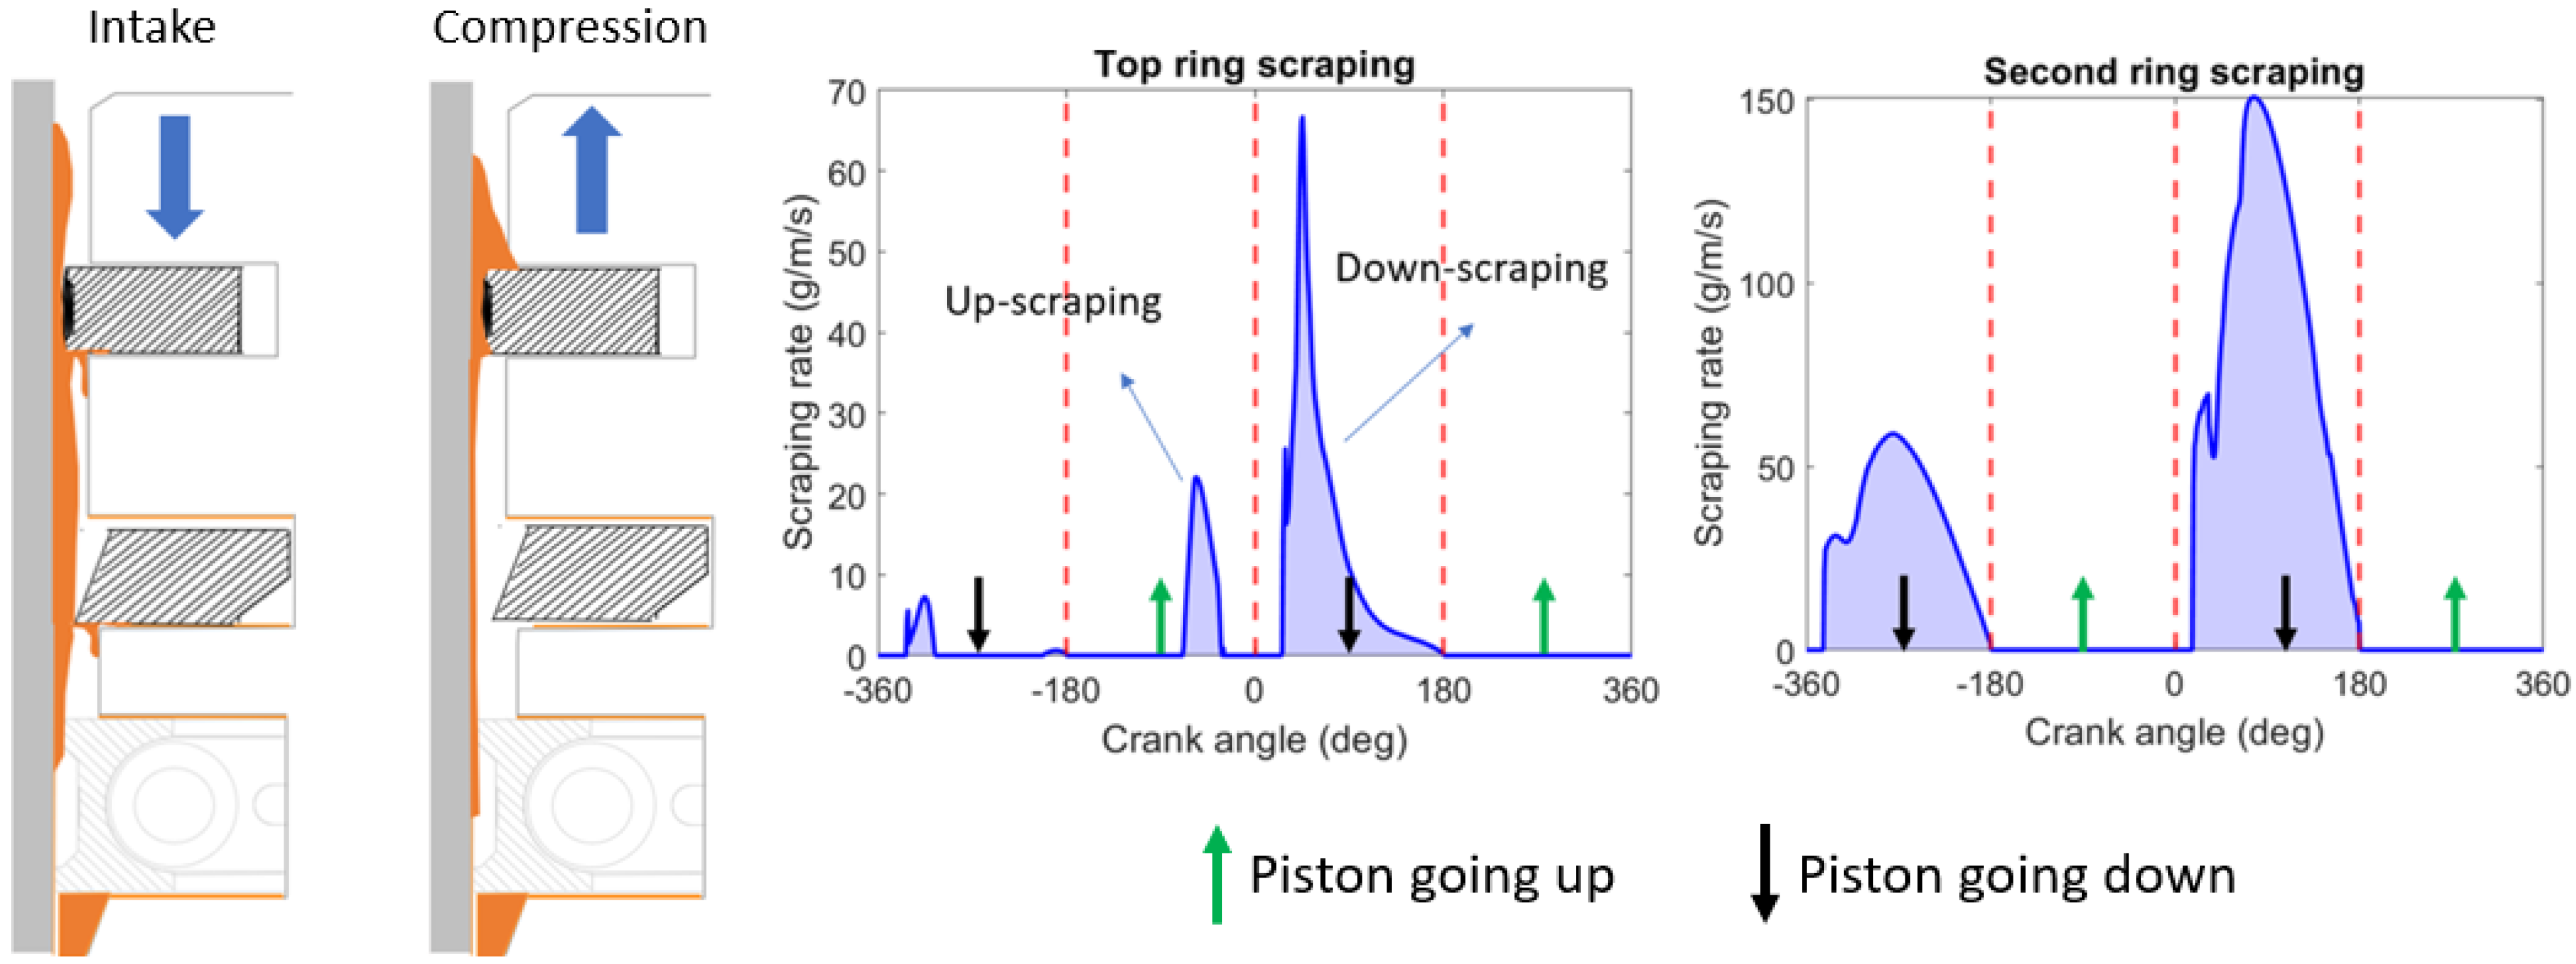
Figure 16 shows the scraping behaviors of the top two rings under one particular ring gap arrangement. It is assumed that the size of the oil control ring gap is 0.5 mm and that it leaves an oil streak of 5 μm thick onto the liner. During the intake stroke, when the piston moves down, the second ring is the first barrier to down-scrape the extra oil leakage from the oil control ring. Some oil passes the second ring, which is then down-scraped by the top ring. Some oil can still pass the top ring, and the implication of this is that during the subsequent compression stroke, when the piston moves back up, due to the increased gas pressure which pushes the top ring more towards the liner, the top ring can up-scrape the oil. Then, during the expansion stroke, high gas pressure leads to good ring–liner conformability, and both the top ring and the second ring can down-scrape the excess oil supply from the oil control ring gap.
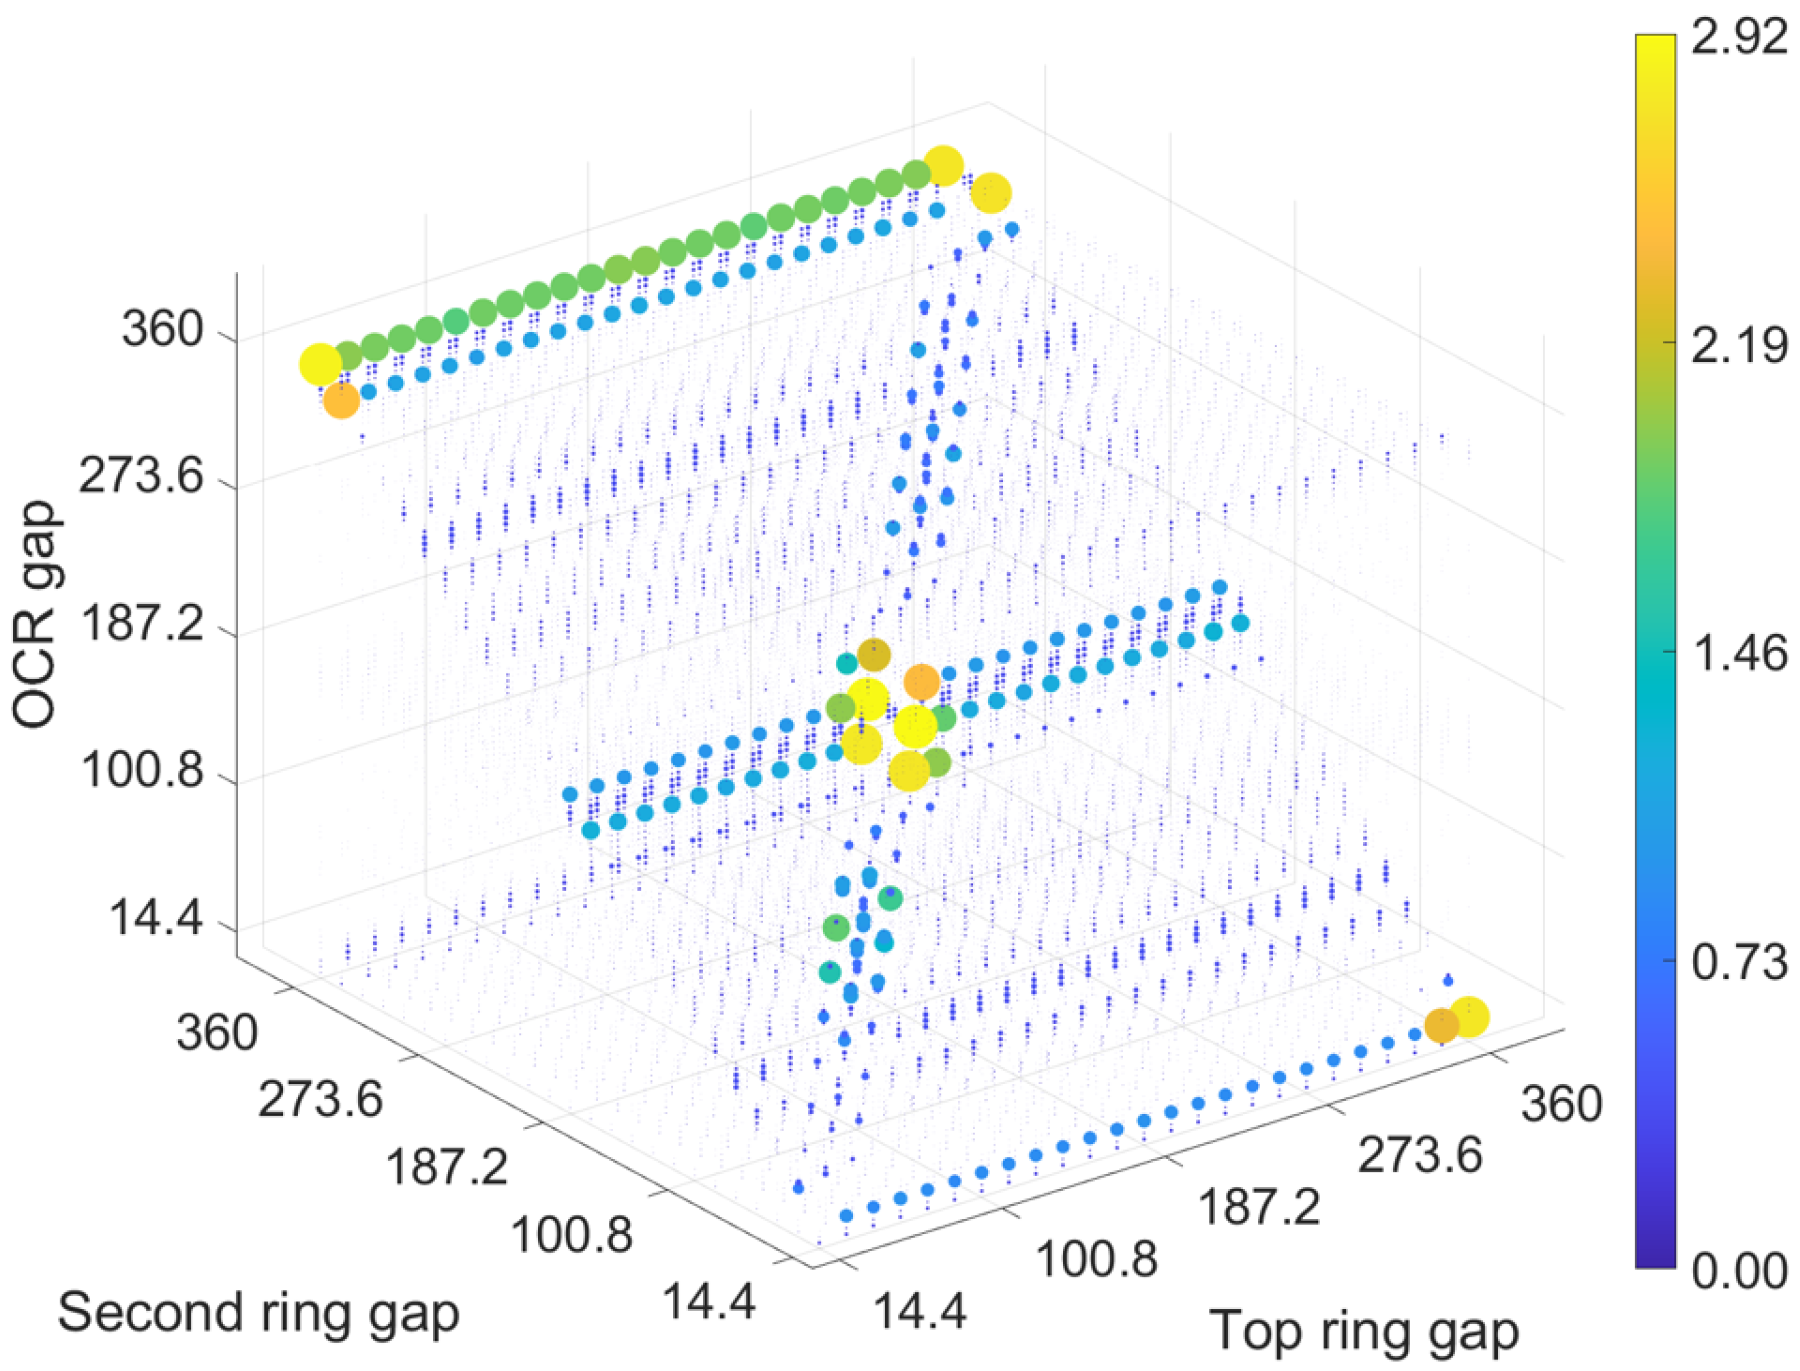
The top ring scraping behavior is of particular interest since down-scraping determines the amount of oil supply to the second land, and up-scraping directly contributes to LOC. Figure 17 shows the top ring up-scraping and down-scraping rates under all possible ring gap arrangements. In particular, each dot represents the scraping rate corresponding to one set of ring gap arrangement, and the larger the dot is, the higher the scraping rate. Color is also added to aid in result visualization. The ring’s scraping behavior can be influenced by the arrangement of the ring gaps. This is because when the ring is placed in a distorted bore, the local ring–liner conformability can differ for a particular circumferential location along the bore, depending on the gap location. Another important observation is that when the oil control ring gap aligns with the second ring gap, the top ring down-scraping rate is the highest, since all the oil supply from the oil control ring gap is scraped by the top ring in this case. Finally, when the three ring gaps are close to each other, the up-scraping rate is higher, indicating a higher contribution to the overall LOC from top ring up-scraping.

4.2. Liner Oil Vaporization

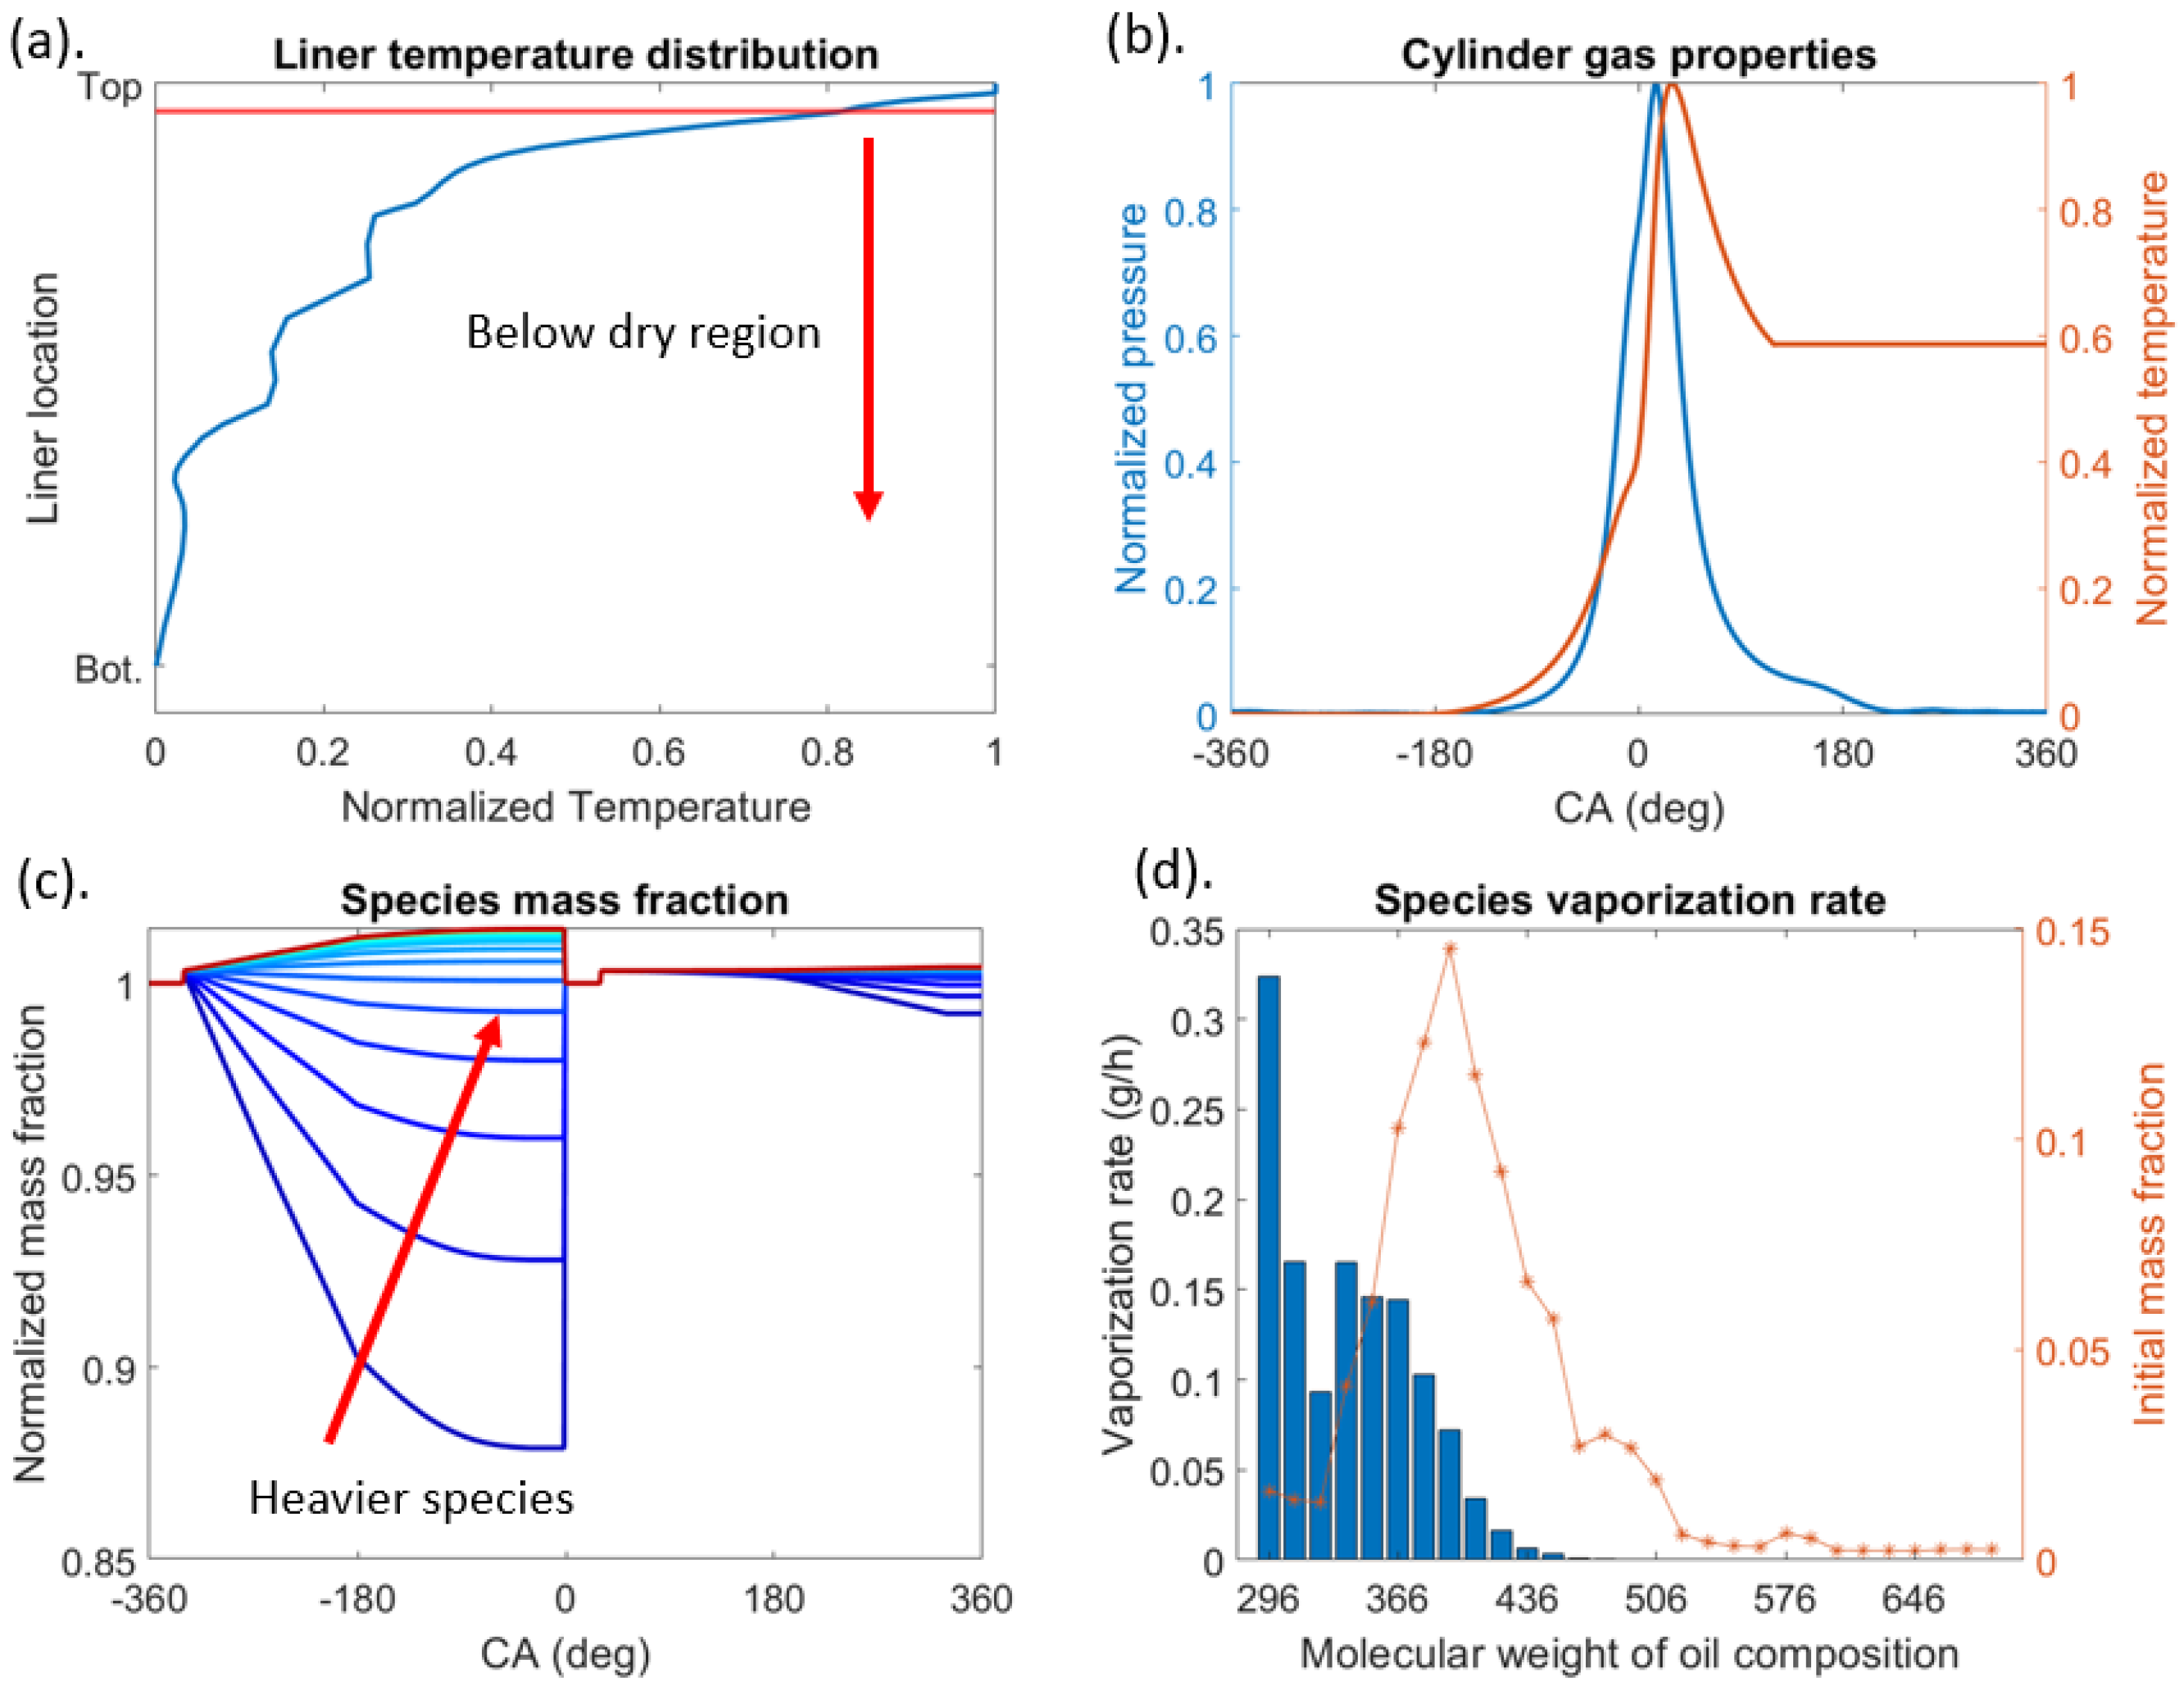
The liner oil vaporization results below the dry region are shown in Figure 18. The axial distribution of the liner temperature and the normalized cylinder gas properties across one engine cycle are shown for reference. The initial film thickness on the liner is set as 5 μm. It can be seen that the major part of oil vaporization on the liner is from the light species. During the intake stroke, the light species vaporizes quickly, leading to a drop in their mass fraction and hence a rise in the mass fraction of the heavier species. At the end of the compression stroke, the oil control ring returns to its top dead center, and thus the oil on the liner is refreshed. During the expansion stroke, because of the much higher gas pressure, the oil vaporization rate is very low. Similar observations were also found in previous studies [29]. The overall oil vaporization rate below the dry region (i.e., the contribution to LOC due to oil vaporization) can be determined by summing the cycle-averaged vaporization rates of each species in the oil, which is found to be 1.27 g/h. The oil consumption due to oil vaporization from the liner can also be regarded as the minimum oil consumption of an engine since it always exists, and unlike other contributions, such as top ring up-scraping, it is unlikely to be significantly altered by changing the ring pack design parameters.
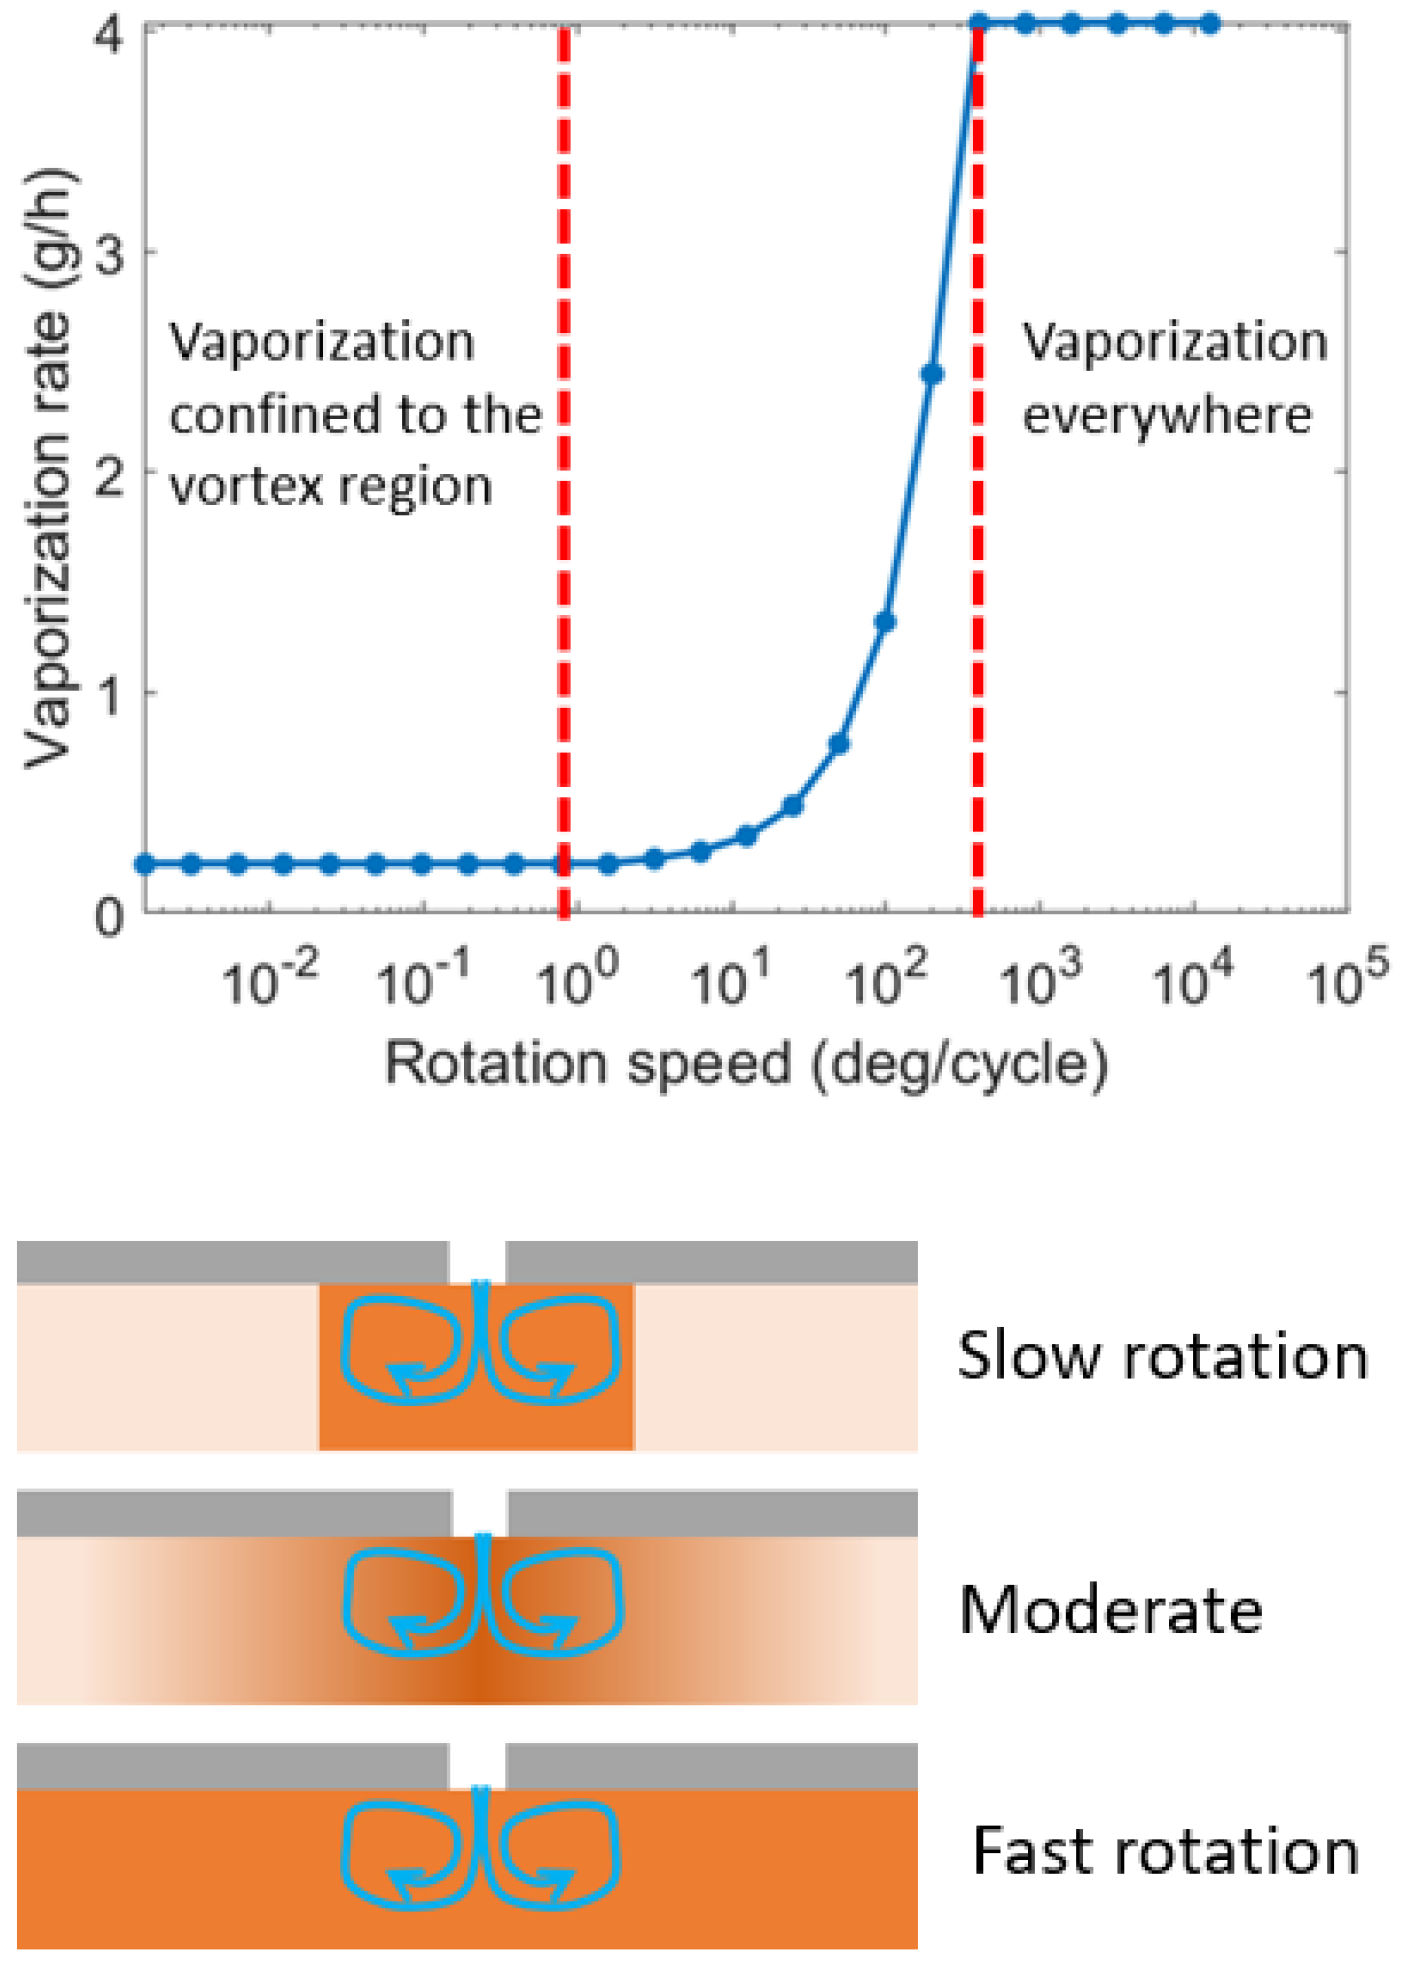
As discussed previously, the oil vaporization rate in the dry region depends on the top ring rotation speed. The vaporization rates under different top ring rotation speeds are shown in Figure 19. When the top ring rotation speed is slow, the oil vaporization is only confined to the vortex region, leading to a low vaporization rate and hence lower oil consumption. However, the side effect is that the liner surface may not be properly lubricated. On the other hand, if the top ring rotation speed is fast, oil can be spread everywhere along the circumference. Although the liner can be properly lubricated in this case, the resulting oil consumption will be higher since vaporization happens everywhere. Clearly, there is always a trade-off between proper lubrication and low oil consumption.

4.3. Oil Transport

The oil transport model is first applied to the large-bore natural gas engine profile. In this engine profile, the gas flow is always positive (i.e., gas pressure in the upper regions is always greater than the gas pressure in the lower region, such that gas is always flowing towards the crankcase). The oil supply to the second land, which is also the oil scraped down from the liner by the top ring, is deliberately placed close to the top ring gap to investigate whether gas-driven oil transport can contribute to LOC for this engine profile. The supply rate is fixed at 7.2 g/h for illustration purposes. Figure 20 shows the oil film thickness distribution on the second land at select cycles simulated by the oil transport model.
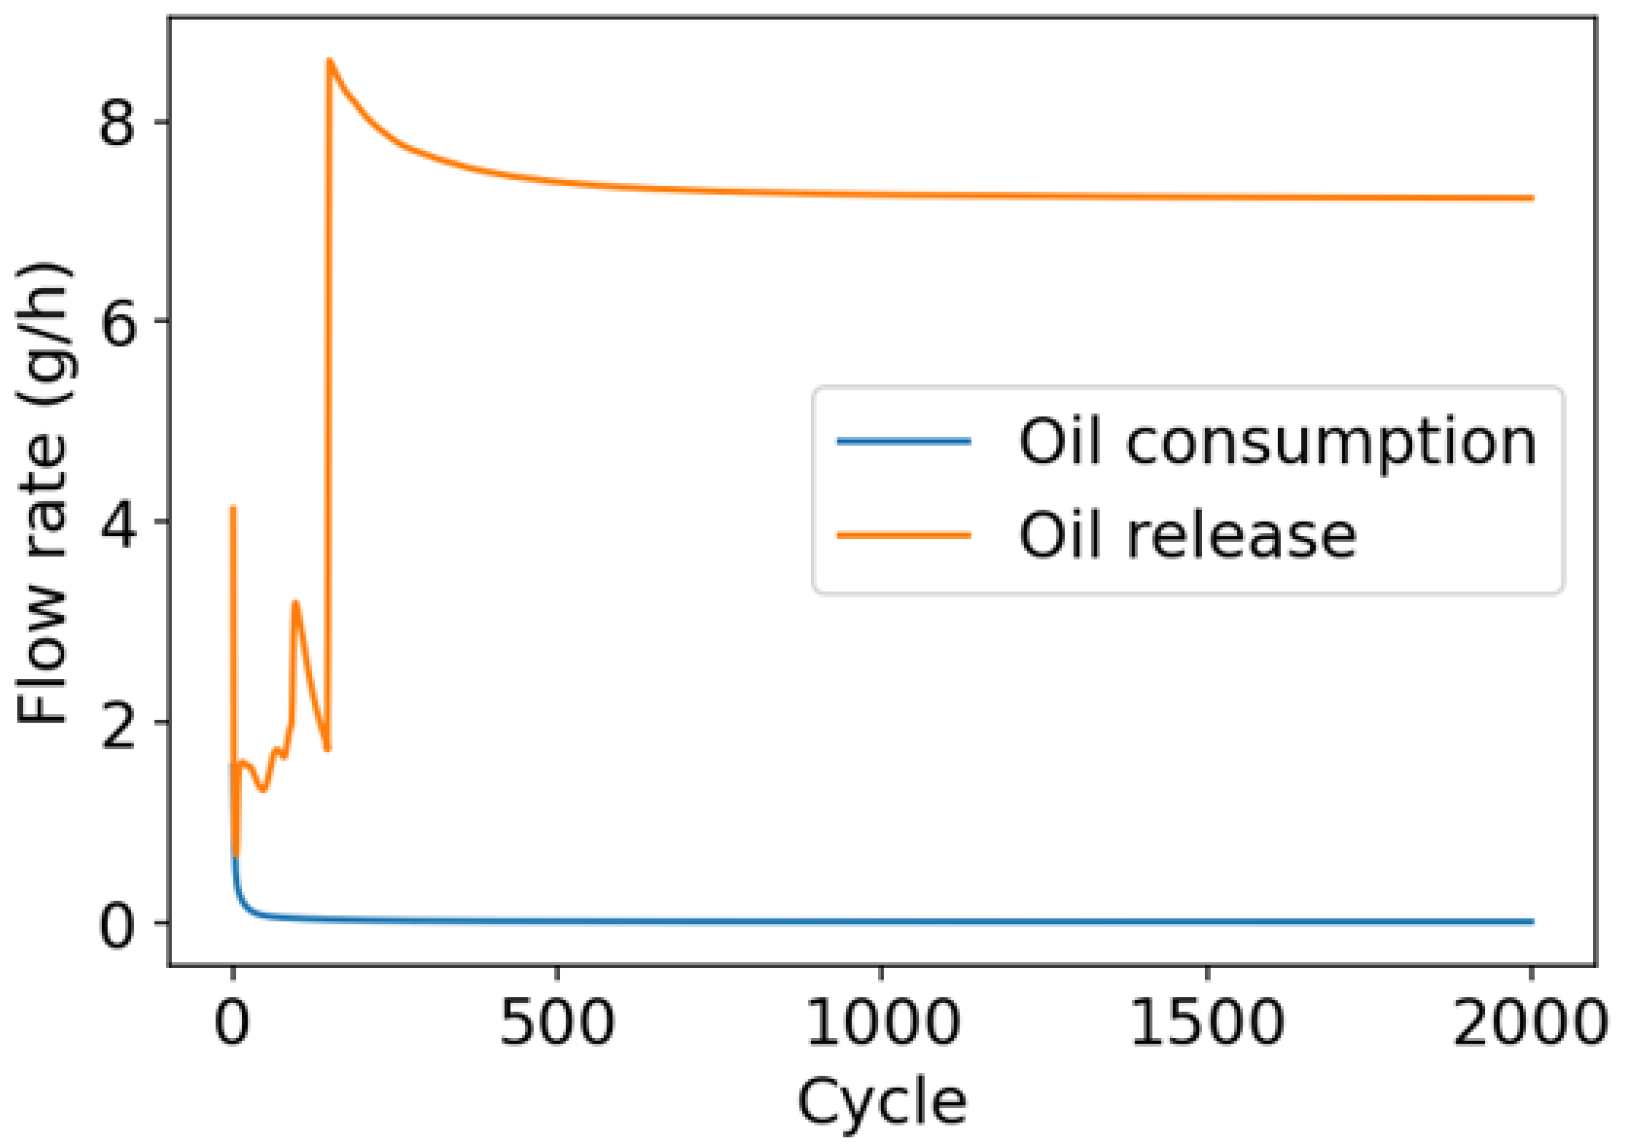
When oil is being supplied to the second land through top ring down-scraping, part of it will be trapped by the vortex around the top ring gap, resulting in an oil accumulation between the gap and the oil source location. The rest of the oil will be transported toward the second ring gap and is then released back to the lower region. The oil consumption rate due to gas-driven oil transport, along with the oil release rate from the second land, is shown in Figure 21.
For this profile, even though the oil source is close to the top ring gap, since the gas flow is always toward the lower region, the supplied oil will eventually be released back to the lower region, resulting in no oil consumption due to gas-driven oil transport.
An important concept worth discussing is the oil residence time, which is computed by dividing the oil mass in the equilibrium state in a region by the oil supply rate to that region. The residence time measures, on average, how long the newly supplied oil stays in one region. If the residence time is long, then physics on longer time scales, such as oil degradation, might become relevant. This is not considered in the current model, but the important idea is that, as shown in Figure 21, oil transport needs to be simulated for many cycles before the oil distribution pattern reaches equilibrium. This further justifies decoupling the various physical mechanisms for better computational efficiency, as in the current model.
Next, the oil transport model is applied to a heavy-duty diesel engine profile with reverse gas flow. For this engine profile, from the late expansion to the exhaust stroke, the pressure in the lower region is higher than the pressure in the upper region. An important implication of this is that during this period, gas is flowing from the lower region to the upper region. For this engine profile, several sets of simulations are performed with varying distances between the second land oil source and the top ring gap.
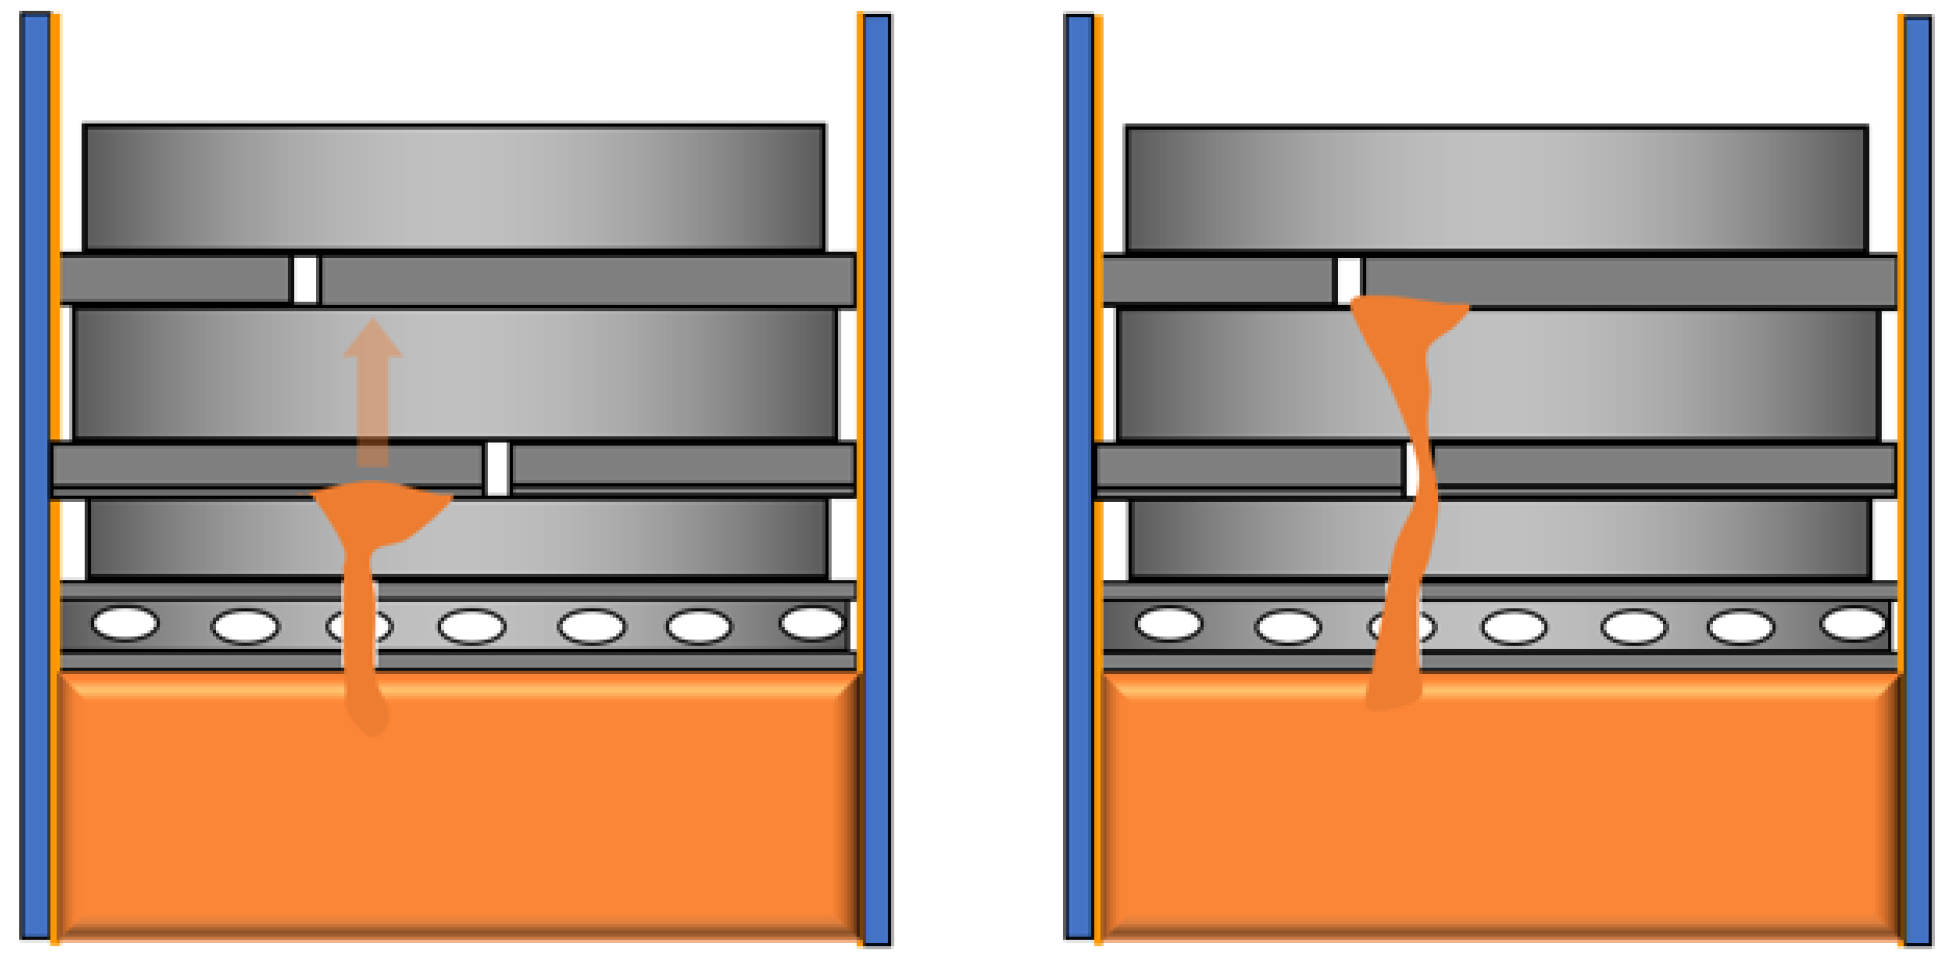
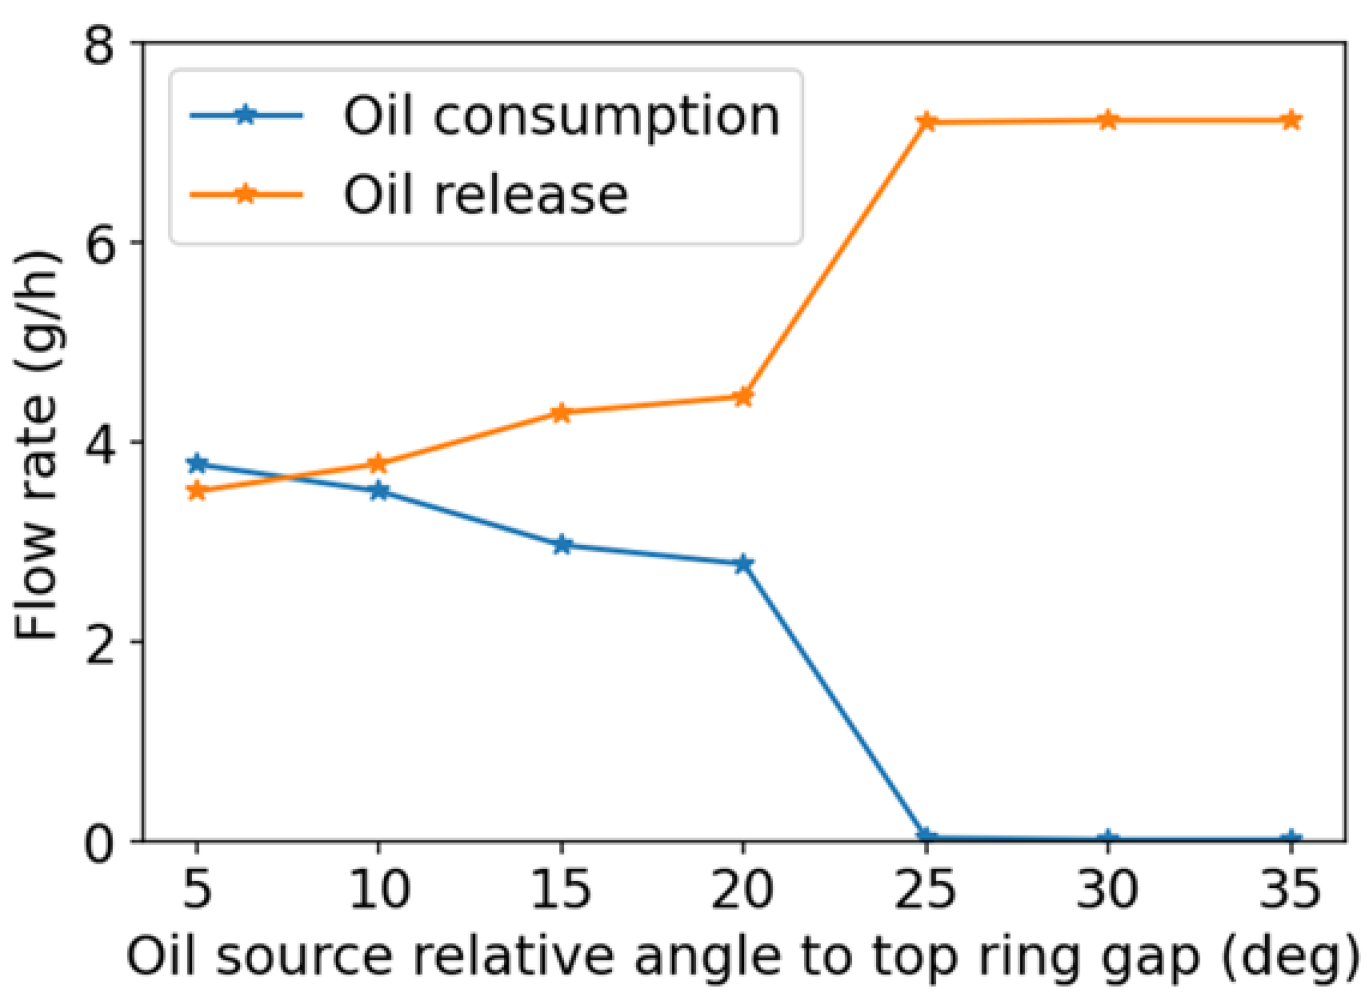
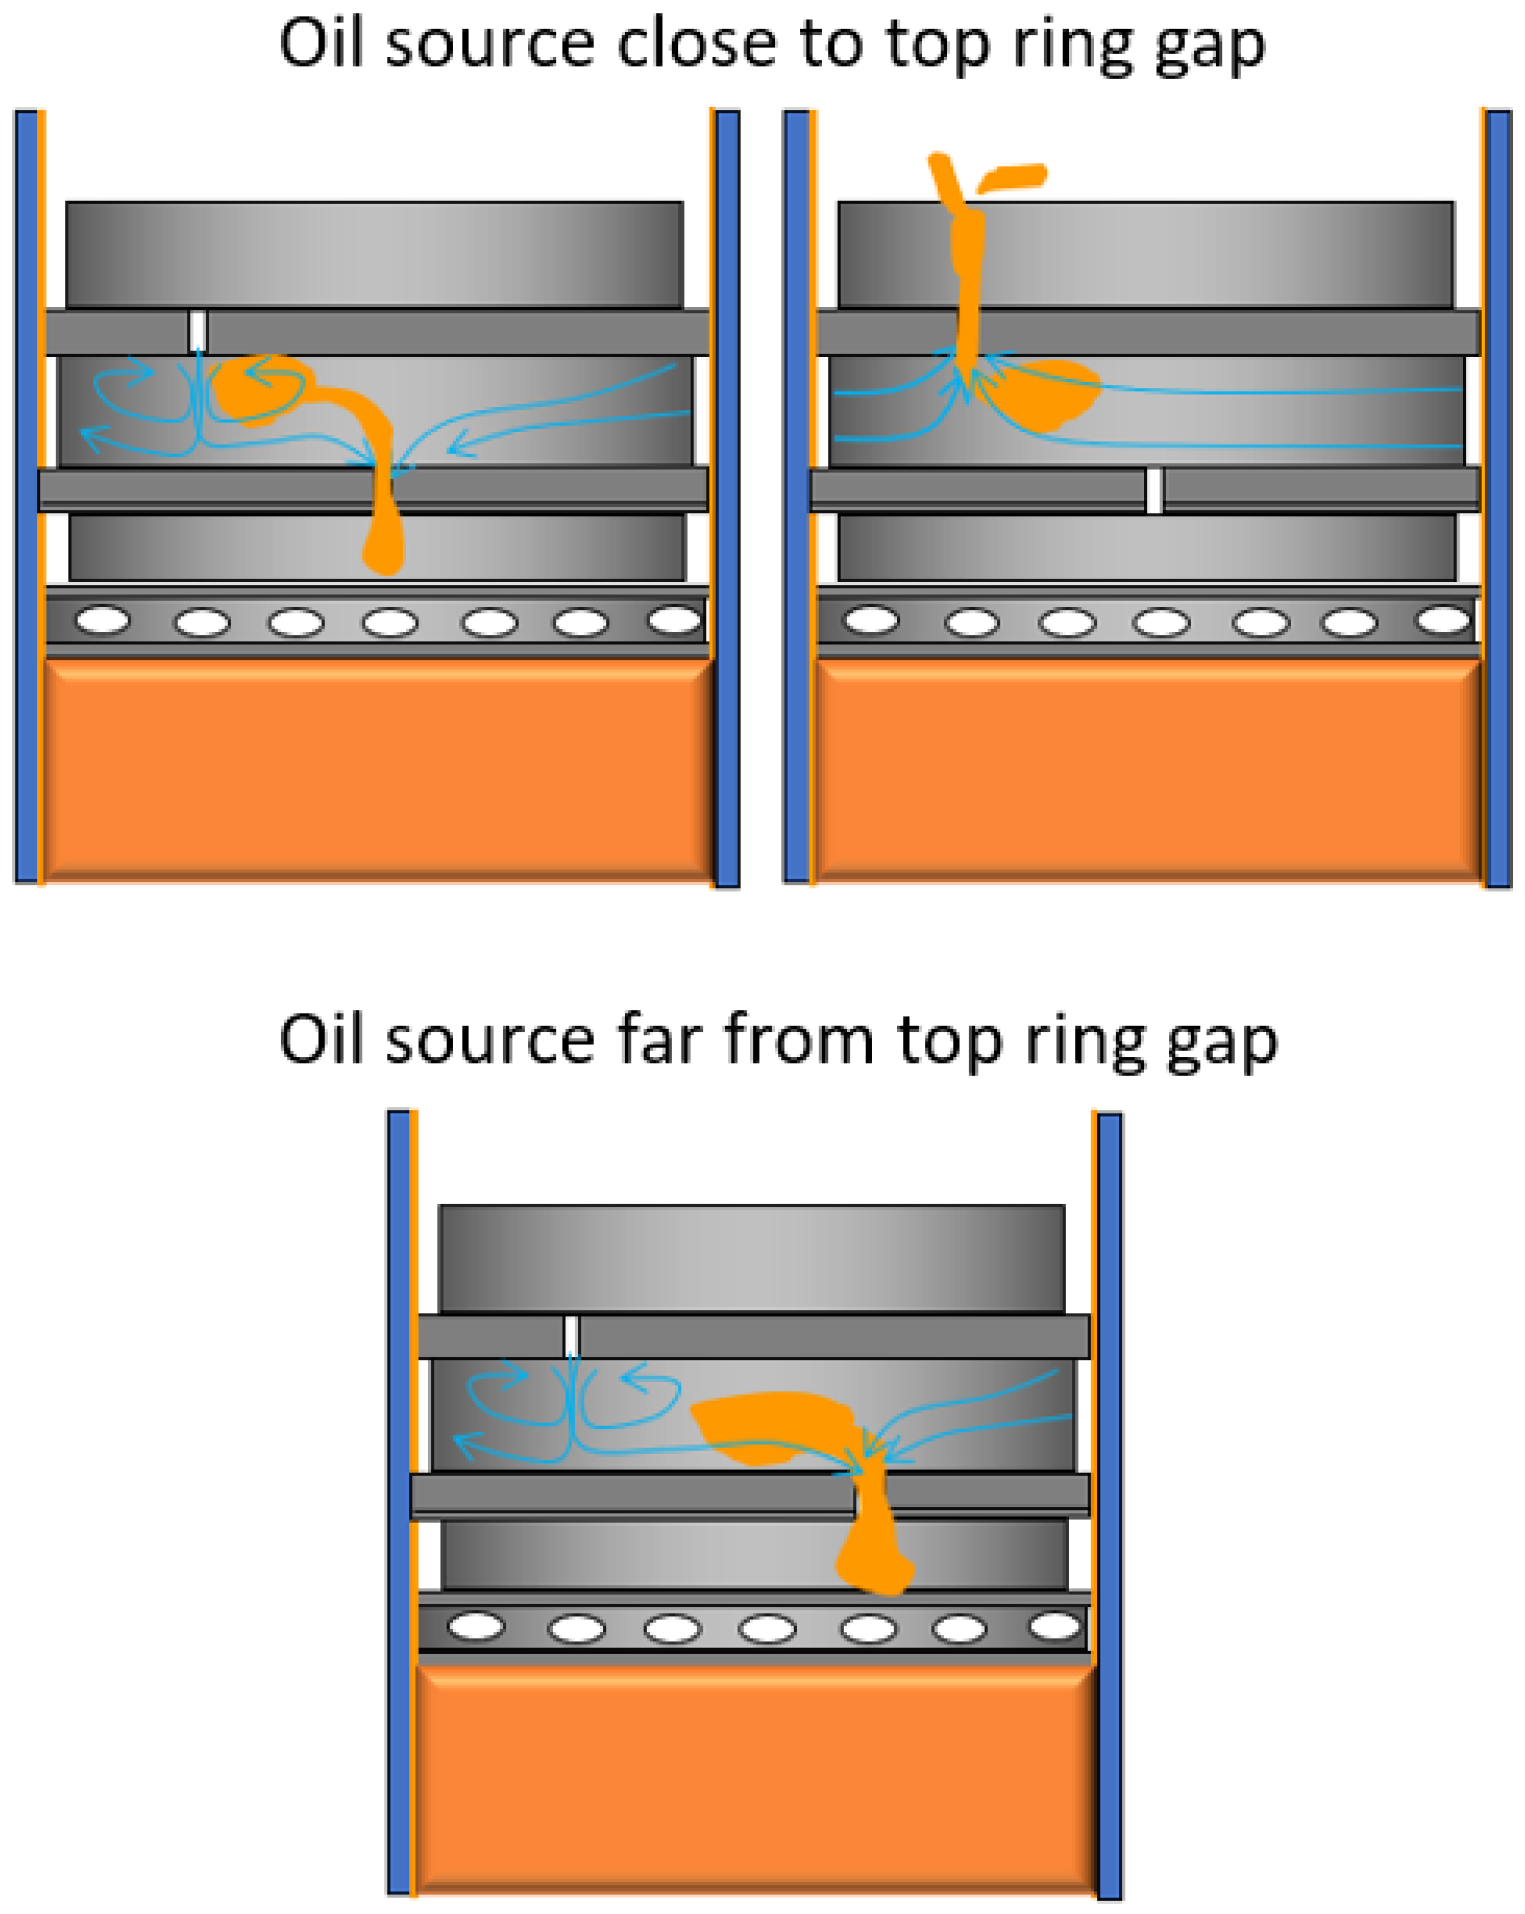
Figure 22 shows the oil consumption rate and the oil release rate for each case at the equilibrium state. It can be seen that when the oil source (i.e., oil control ring gap) is close to the top ring gap, the oil consumption rate is high. This is because the supplied oil can be trapped around the gap during the positive flow period when the vortex is present. Then this local oil accumulation can be brought past the top ring through the ring gap by reverse gas flow and becomes oil consumption. On the other hand, if the oil source is far enough from the top ring gap, there is no oil trapping by the vortex. All the supplied oil will be released back to the lower region by circumferential gas flow. This is also illustrated in Figure 23.
The results shown in this section indicate that reverse gas flow is necessary for gas-driven oil transport to contribute to oil consumption. Such a contribution, like those from the top ring up-scraping, depends on the ring gap arrangement.

4.4. Overall LOC Prediction

The major mechanisms contributing to LOC are top ring up-scraping, gas-driven oil transport through the top ring gap by reverse gas flow, and vaporization of oil from the liner surface, all of which are resolved by the digital twin model, and the results are discussed above. It is also clear from the previous discussions that the behavior of each of these mechanisms depends either on the ring gap arrangement or the ring’s rotation speed. During engine operation, the ring gap arrangement may not be static due to the rotation of the piston rings. However, since the exact ring rotation pattern cannot be resolved by the current model, for the time being, only the LOC range can be predicted for a given engine profile (i.e., for each mechanism, there are gap arrangements that will result in the lowest and the highest contribution to LOC). In this section, the LOC prediction results for the two engine profiles studied in this work, namely the large-bore natural gas engine profile and the heavy-duty diesel engine profile, are presented.
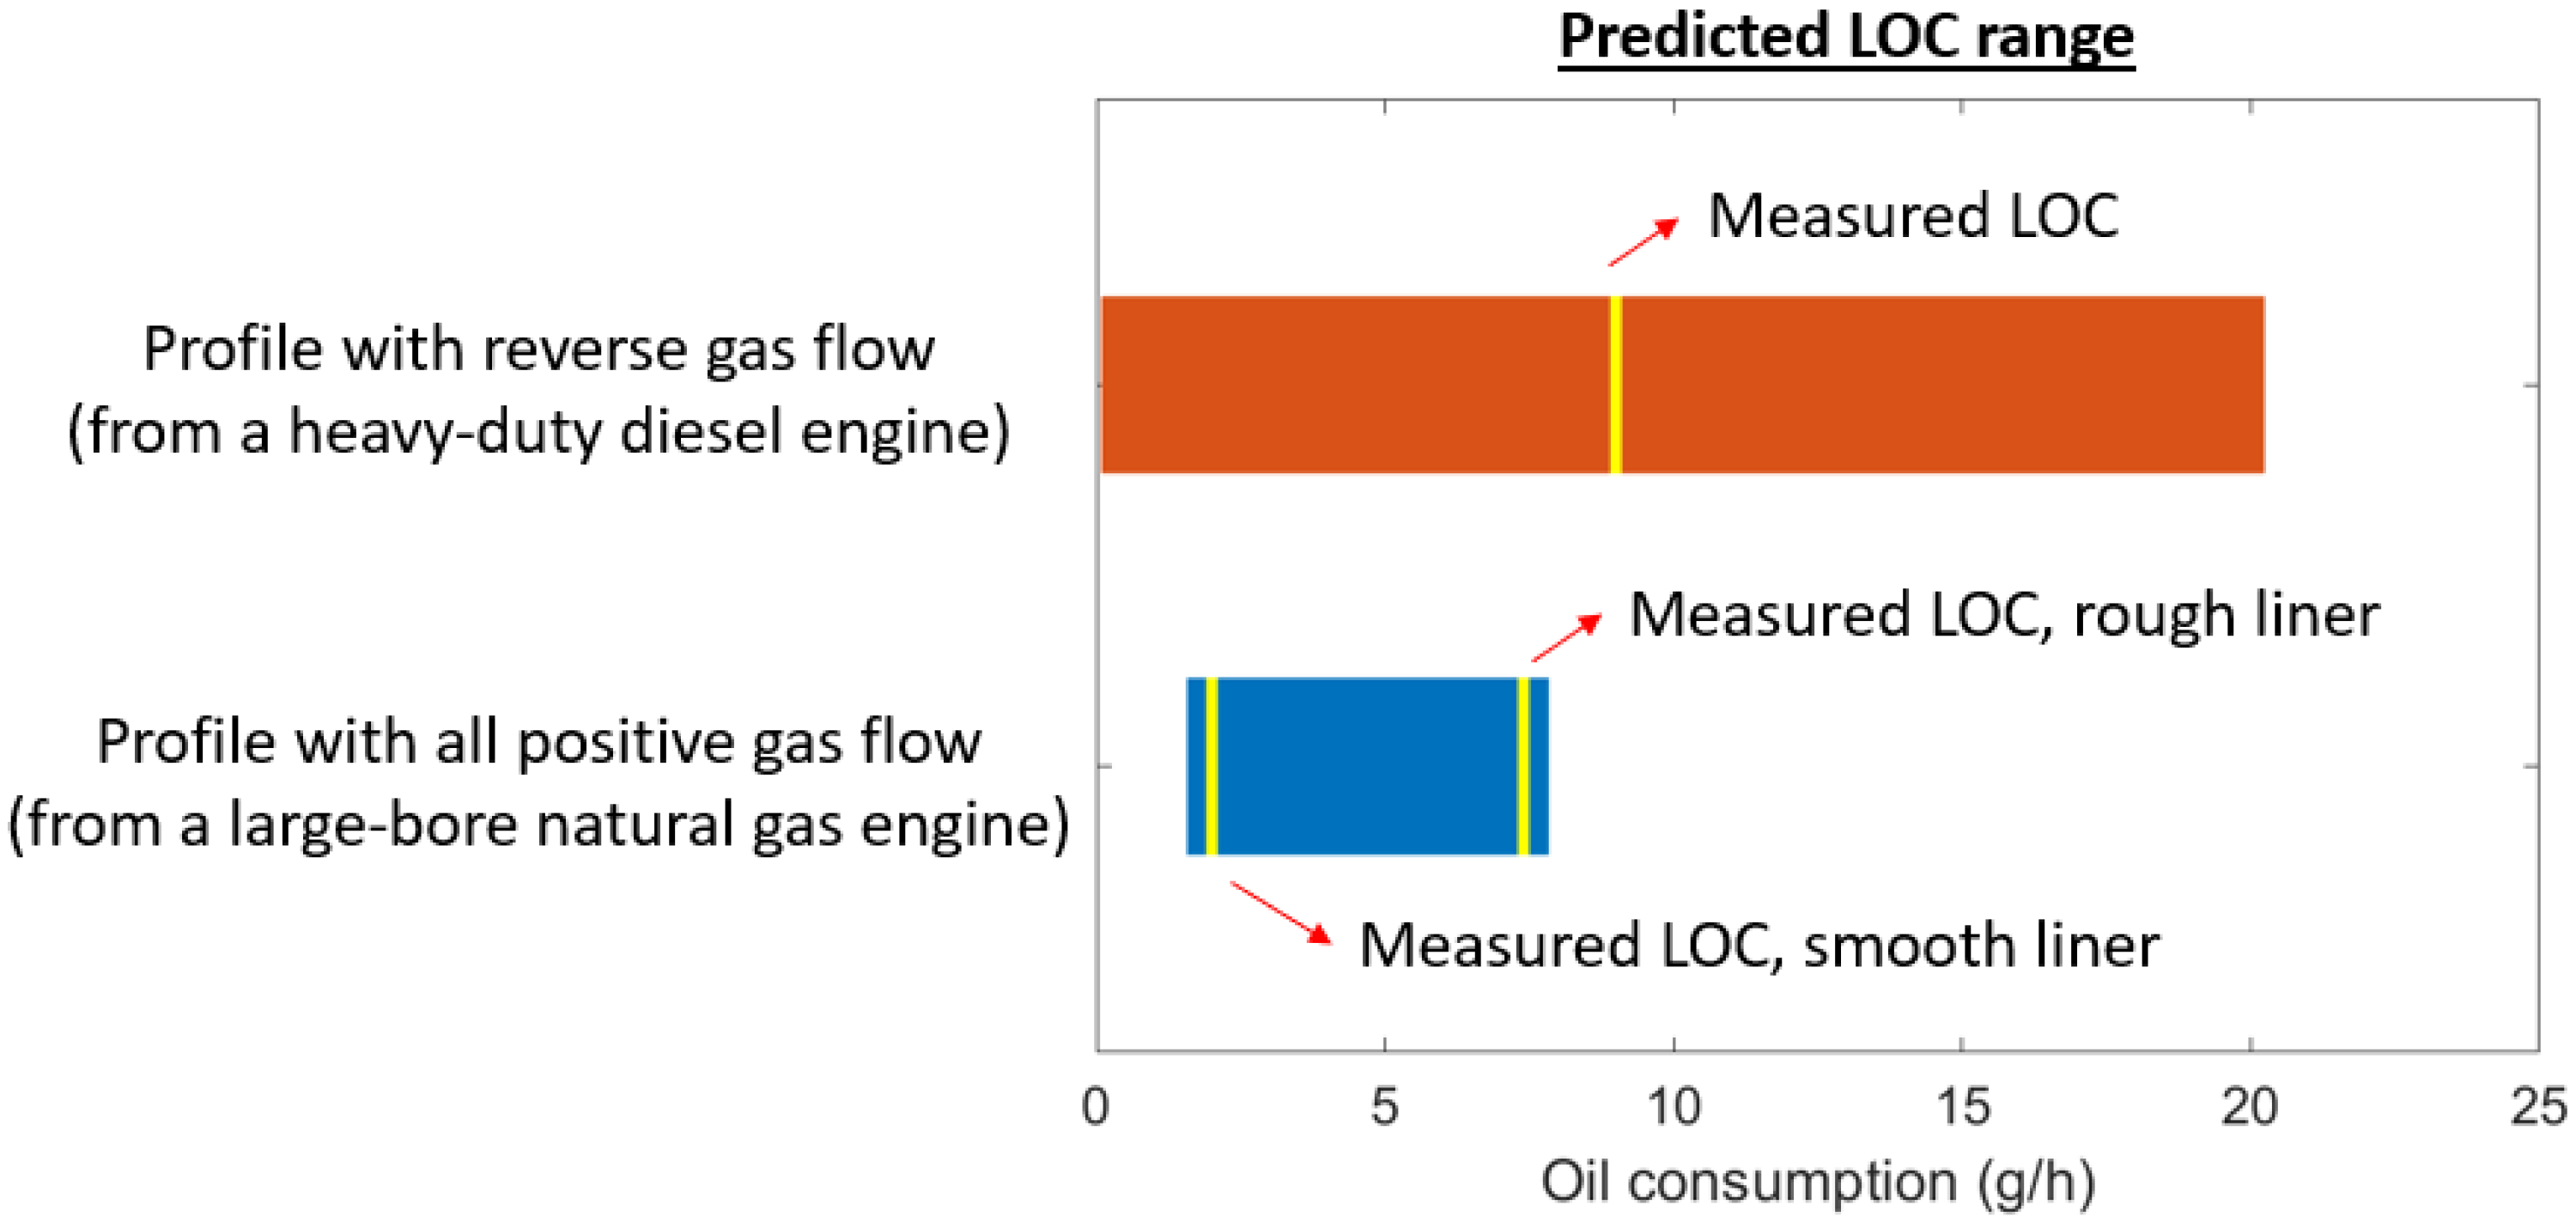
For the large-bore natural gas engine profile with all positive gas flow, due to the absence of reverse gas flow, the only sources of oil consumption are the top ring up-scraping and the oil vaporization from the liner. Table 1 shows the range of LOC contribution from each mechanism, which can be found from Figure 17, Figure 18 and Figure 19. The total LOC range for this engine profile is therefore [1.57, 7.84] g/h ([0.012, 0.06] g/kWh).
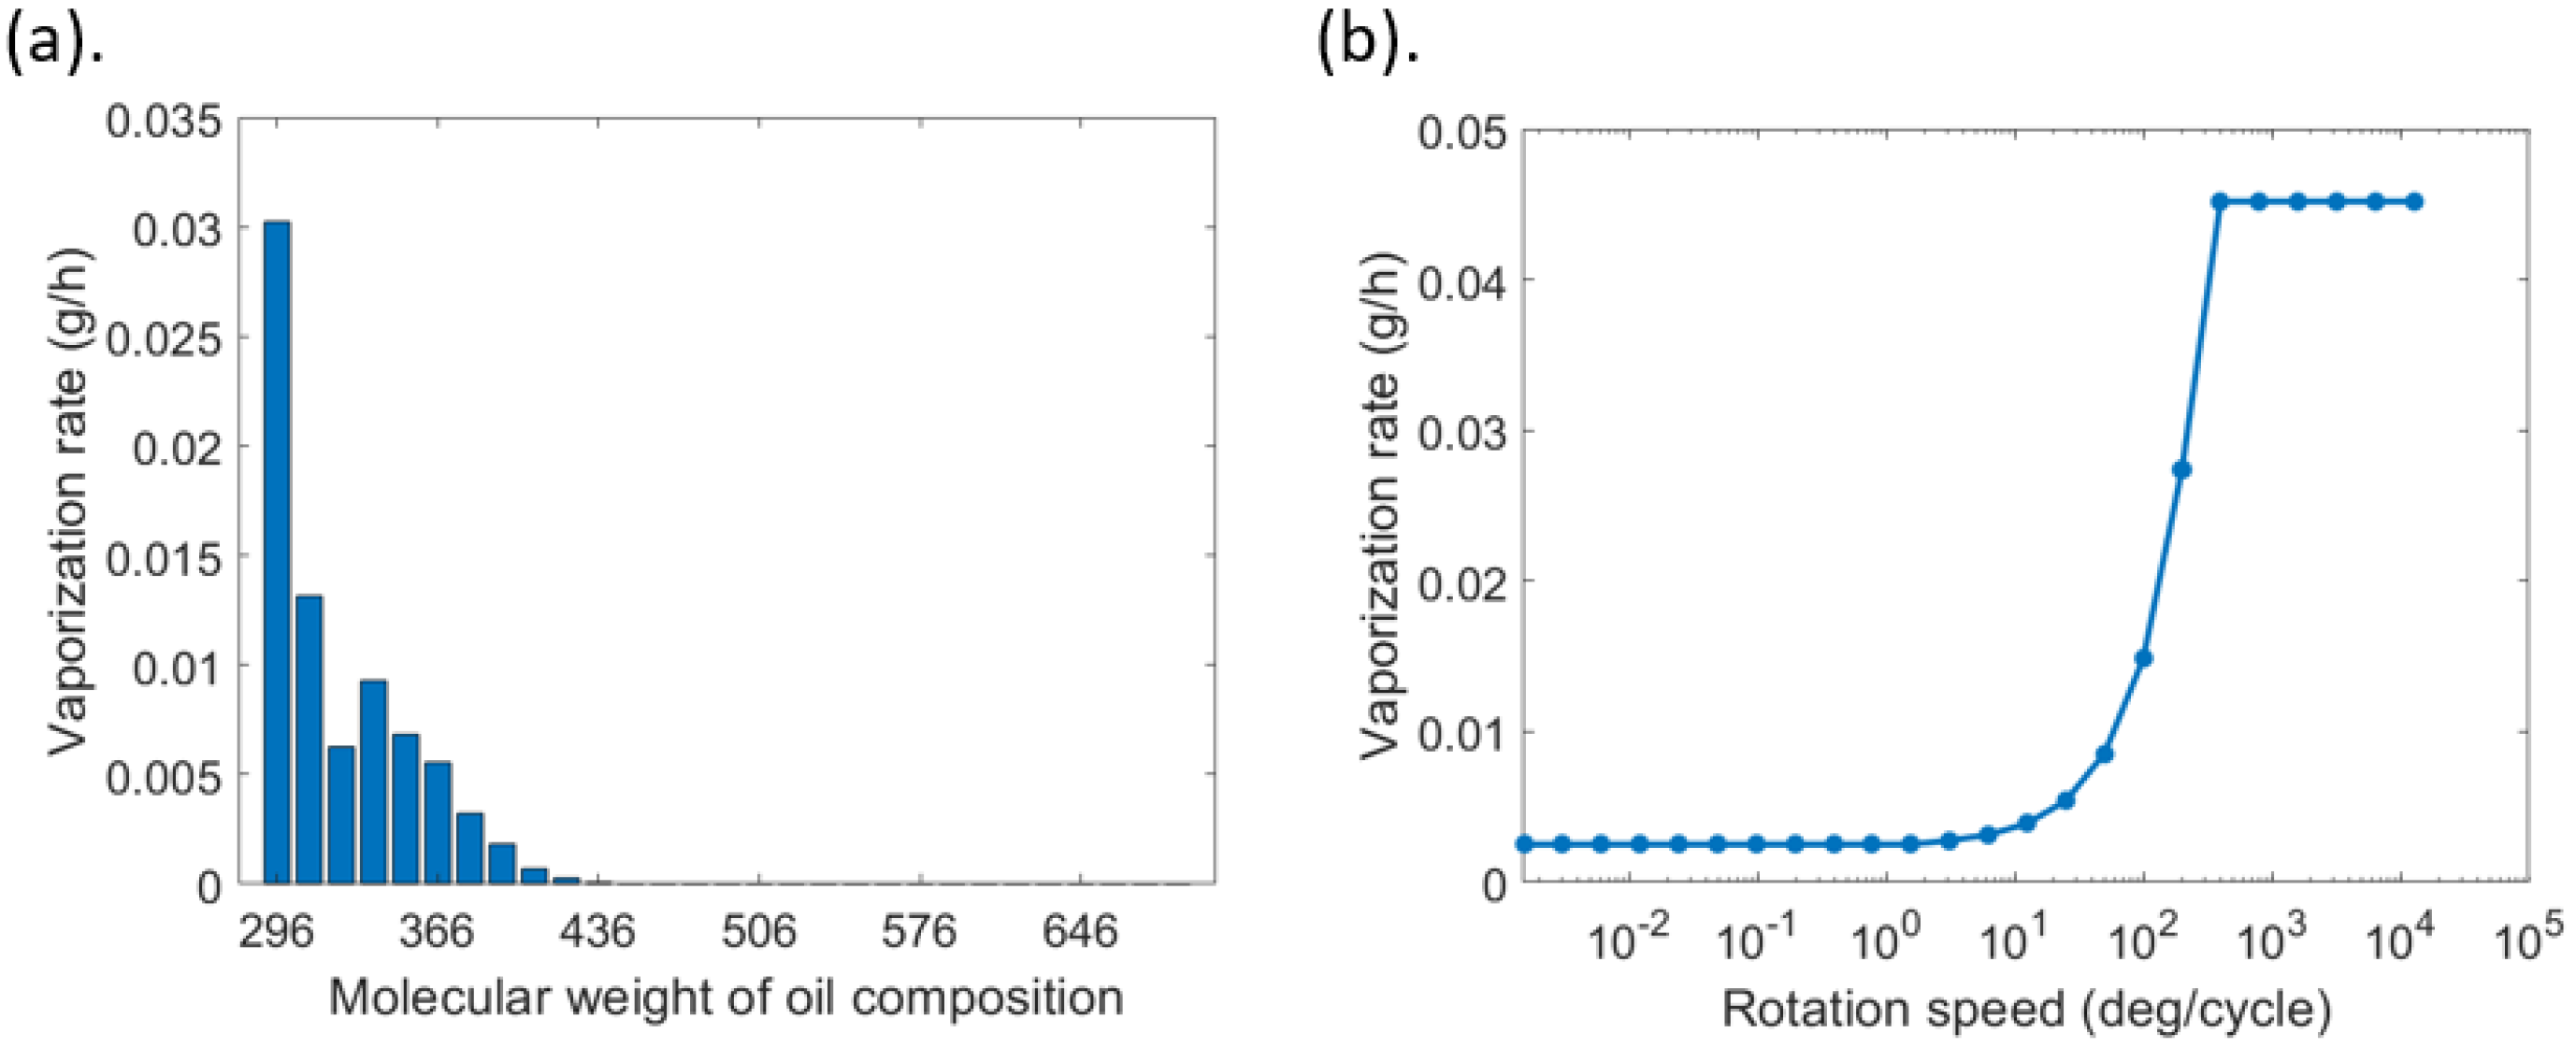
For the heavy-duty diesel engine profile with reverse gas flow, the top ring up-scraping rate and the liner vaporization rate can be determined with the same approach outlined above, and the results are shown in Figure 24 and Figure 25, respectively. Note that the same oil as in the large-bore natural gas engine profile is used. The vaporization rate for this case is much lower due to the lower liner temperature. The contribution from oil transport through the top ring gap due to reverse gas flow is no longer zero in this case, and the calculation procedure is the following:
  • For all the possible ring gap arrangements, determine the top ring down-scraping rates using the ring–liner lubrication model with the assumption that the oil control ring gap leaves a 5 μm film thickness on the liner;
  • Maintain the arrangements with a meaningful top ring down-scraping rate (>1 g/h);
  • Run the oil transport model with the computed top ring down-scraping rate and the corresponding ring gap arrangement for each case to find the oil consumption rate due to reverse gas flow through the top ring gap.
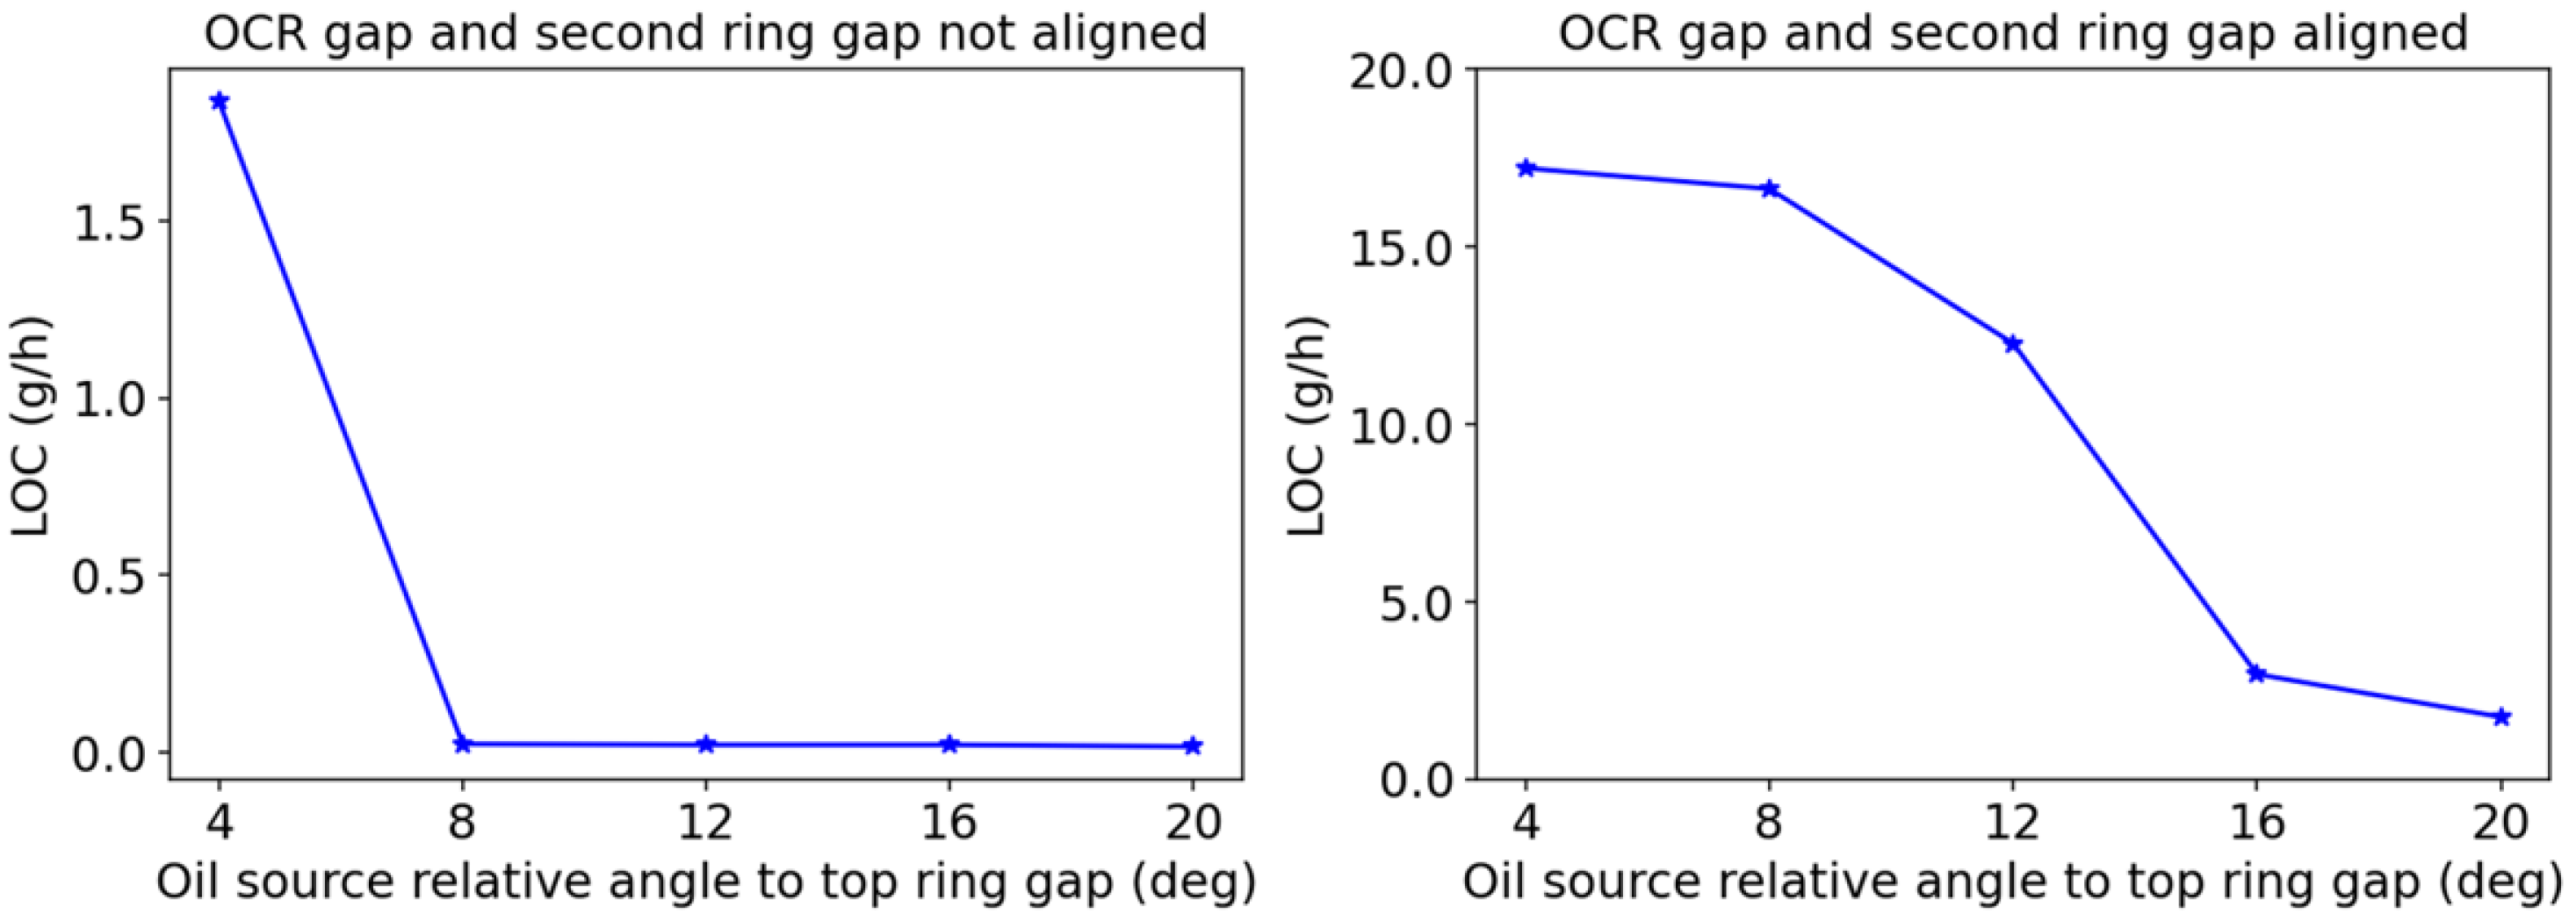
It was found that the oil control ring gap needs to be close to (less than 4 degrees circumferential angles away) or aligned with the second ring gap for the top ring to have a non-negligible down-scraping rate. This is also the oil supply rate to the second land. Additionally, to have a non-zero oil consumption rate, the circumferential position of the oil control ring gap also needs to be within the vortex region around the top ring gap, as demonstrated in Figure 22. If either one of the conditions is not satisfied, reverse gas flow will not contribute significantly to the overall LOC. For illustration, the oil consumption rates from gas-driven oil transport through the top ring gap when the lower two ring gaps are aligned and when they are 4 degrees apart are shown in Figure 26. In particular, the results are calculated for different oil control ring gap positions relative to the top ring gap. The LOC contributions from all three mechanisms are shown in Table 2. The total LOC range for this engine profile is found to be [0.085, 20.24] g/h ([0.0013, 0.302] g/kWh).
It is important to validate the simulation results by comparing them against experimental measurements. This can help determine whether the model can be applied with confidence. Figure 27 shows the predicted LOC range for the two engine profiles studied in this work, along with the experimentally-measured LOC value provided by industrial sponsors (measured with drain and weigh). It can be seen that the real LOC value falls well within the predicted range.
Overall, this section presents a method to predict the LOC range for an arbitrary engine profile with all major physical mechanisms considered. The exact LOC value depends on the exact rotation patterns of the three piston rings during engine operation, which still cannot be resolved with the current model. It might be tempting to assume that, given long enough engine run time, each ring gap arrangement appears with equal probability; in other words, the rings can rotate freely. If this is true, the exact LOC contribution from each mechanism can be approximated by taking the mean of the different values obtained with different ring gap arrangements (i.e., taking the mean of all the data points in Figure 24 to find the exact contribution to LOC from top ring up-scraping). However, doing this will result in very small contributions from both top ring up-scraping and oil transport due to reverse gas flow. This is because the majority of the ring gap arrangements will not result in significant LOC, leading to a small total LOC value. For the heavy-duty engine profile, as seen from Figure 27, the exact LOC value measured from experiment is not trivial, indicating that the ring rotation follows a certain pattern that is not completely random.

5. Conclusions and Future Work

In this work, a digital twin model is developed to simulate the oil transport and predict the LOC range in the piston ring pack of IC engines. By developing separate models for the major physical mechanisms, the model achieves good computational efficiency by decoupling the various physics while preserving the necessary links. For the first time, simulating oil transport and oil consumption over many engine cycles in a reasonable amount of time, with major physical mechanisms considered, is made possible. Three mechanisms are shown to contribute to oil consumption, namely top ring up-scraping, liner oil vaporization, and liquid oil transport through the top ring gap due to reverse gas flow. A major finding of this work is that the contribution from each mechanism depends on the ring rotation behavior.
Currently, the model does have some limitations. At this stage, only the LOC range, rather than a single LOC value, of an engine profile can be predicted. This is because the exact ring rotation behavior of an engine profile cannot be resolved by the model. A comparison with experimentally measured LOC values indicates that the predicted LOC range well encapsulates the actual value. Another limitation of the current model is that the oil transport to the second land and the crown land is limited to the top ring scraping in the oil control ring gap area. This assumption is mostly valid when the engine is under non-throttled conditions. In throttled conditions, even with a healthy system [22], the oil may be transported to the top ring along the piston, namely, passing the second ring groove. The modeling of this oil transport path is lacking from the current model.
Despite the current model limitations, the digital twin model in its current form is a useful tool to study the oil transport and oil consumption behavior of an arbitrary engine profile. Because of its modular architecture, the model allows engine designers to easily perform parametric studies on individual physical mechanisms. The model also makes it convenient to evaluate the overall oil consumption performance for different potential designs in a time-efficient manner. To further enhance the predictability of LOC, a piston ring rotation model that can resolve the exact ring rotation behavior of an engine profile must be developed and integrated into the digital twin framework. In this way, the exact LOC value (its variations and its average over a certain amount of time), instead of just its range, can be predicted. Some initial works on ring rotation can be found in [21]. In addition, including the oil transport through the piston ring grooves can improve the model’s capability to handle engine profiles in throttled conditions. Lastly, the model can also benefit from including additional, more subtle physics. For example, the work in [20] studied a phenomenon called “bridging” extensively. Simply speaking, bridging is a direct oil transport mechanism between the piston land and the liner. By including bridging correlations developed in [20], a more realistic oil transport simulation may be achieved.

Author Contributions

Constructing the models and running the simulations, X.Z.; writing the manuscript, X.Z.; supervising and revising the manuscript, T.T. All authors have read and agreed to the published version of the manuscript.

Funding

This work was sponsored by the Consortium on Lubrication in IC Engines at MIT. Current consortium members that have contributed to this work include Mahle GmbH, Weichai Power, Rolls-Royce Solutions, Volvo Trucks, Royal Dutch Shell, Scania, and Everllence.

Data Availability Statement

The datasets presented in this article are not readily available because the engine design parameters and operational parameters are proprietary properties of the industrial sponsors of this work.

Conflicts of Interest

The authors declare no conflicts of interest.

Abbreviations

The following abbreviations are used in this manuscript:
LOCLubrication oil consumption
OCROil control ring
TDCTop dead center
BDCBottom dead center
TLOCRTwin-land oil control ring
TPOCRThree-piece oil control ring
2DLIF2D laser-induced fluorescence
ICInternal combustion

References

  1. Orrin, D.S.; Coles, B.W. Effects of Engine Oil Composition on Oil Consumption. SAE Trans. 1971, 80, 475–490. [Google Scholar]
  2. Min, B.S.; Kim, J.S.; Oh, D.Y.; Choi, J.K.; Jin, J.H. Dynamic Characteristics of Oil Consumption Relationship Between the Instantaneous Oil Consumption and the Location of Piston Ring Gap. SAE Trans. 1998, 107, 918–927. [Google Scholar]
  3. Rossegger, B.; Eder, M.; Vareka, M.; Engelmayer, M.; Wimmer, A. A novel method for lubrication oil consumption measurement for wholistic tribological assessments of internal combustion engines. Tribol. Int. 2021, 162, 107141. [Google Scholar] [CrossRef]
  4. Yilmaz, E.; Tian, T.; Wong, V.W.; Heywood, J.B. The Contribution of Different Oil Consumption Sources to Total Oil Consumption in a Spark Ignition Engine. SAE Trans. 2004, 113, 1622–1638. [Google Scholar] [CrossRef]
  5. Vokac, A. An Experimental Study of the Oil Evolution in Critical Piston Ring Pack Regions and the Effects of Piston and Ring Designs in an Internal Combustion Engine Utilizing Two-Dimensional Laser Induced Fluorescence and the Impact on Maritime Economics. Master’s Thesis, Massachusetts Institute of Technology, Department of Mechanical Engineering, Cambridge, MA, USA, 2004. [Google Scholar]
  6. Thirouard, B. Characterization and Modeling of the Fundamental Aspects of Oil Transport in the Piston Ring Pack of Internal Combustion Engines. Ph.D. Thesis, Massachusetts Institute of Technology, Department of Mechanical Engineering, Cambridge, MA, USA, 2001. [Google Scholar]
  7. Jay, A.; Ballard, H.; Ocerin Meñica, O.; Larralde Yoller, A.; Barcena Ortiz de Urbina, J. Using Analysis of the Ring Pack and Piston to Optimize Oil Consumption of Current and Future Engines. In Proceedings of the Energy and Propulsion Conference and Exhibition, Greenville, SC, USA, 7–9 November 2023; SAE International: Warrendale, PA, USA, 2023. [Google Scholar] [CrossRef]
  8. Ahling, S. Elements of Lubricant Transport Critical to Piston Skirt Lubrication and to Leakage into the Piston Ring Pack in Internal Combustion Engines. Ph.D. Thesis, Massachusetts Institute of Technology, Department of Mechanical Engineering, Cambridge, MA, USA, 2021. [Google Scholar]
  9. Li, M.; Zhong, X.; Ahling, S.; Tian, T. An Investigation of Oil Supply Mechanisms to the Top of the Liner in Internal Combustion Engines. SAE Int. J. Adv. Curr. Prac. Mobil. 2023, 6, 1459–1467. [Google Scholar] [CrossRef]
  10. Hitosugi, H.; Nagoshi, K.; Komada, M.; Furuhama, S. Study on Mechanism of Lubricating Oil Consumption Caused by Cylinder Bore Deformation. SAE Trans. 1996, 105, 147–156. [Google Scholar] [CrossRef]
  11. Iijima, N.; Sakurai, T.; Takiguchi, M.; Harigaya, Y.; Yamada, T.; Yoshida, H. An Experimental Study on Relationship between Lubricating Oil Consumption and Cylinder Bore Deformation in Conventional Gasoline Engine. SAE Int. J. Engines 2009, 2, 106–113. [Google Scholar] [CrossRef]
  12. Schneider, E.W.; Blossfeld, D.H.; Lechman, D.C.; Hill, R.F.; Reising, R.F.; Brevick, J.E. Effect of Cylinder Bore Out-of-Roundness on Piston Ring Rotation and Engine Oil Consumption. SAE Trans. 1993, 102, 1048–1069. [Google Scholar] [CrossRef]
  13. Tian, T. Modeling the Performance of the Piston Ring-Pack in Internal Combustion Engines. Ph.D. Thesis, Massachusetts Institute of Technology, Department of Mechanical Engineering, Cambridge, MA, USA, 1997. [Google Scholar]
  14. Liu, Y. A Multi-scale Model Integrating Both Global Ring Pack Behavior and Local Oil Transport in Internal Combustion Engines. Ph.D. Thesis, Massachusetts Institute of Technology, Department of Mechanical Engineering, Cambridge, MA, USA, 2017. [Google Scholar]
  15. Zhong, X.; Li, M.; Tian, T. Hybrid digital twin for conditional lubricant oil transport simulation and oil consumption prediction in internal combustion engines. Proc. Inst. Mech. Eng. Part J J. Eng. Tribol. 2023, 237, 1408–1429. [Google Scholar] [CrossRef]
  16. Oliva, A.; Held, S. Numerical multiphase simulation and validation of the flow in the piston ring pack of an internal combustion engine. Tribol. Int. 2016, 101, 98–109. [Google Scholar] [CrossRef]
  17. Chowdhury, S.S.; Kharazmi, A.; Atis, C.; Schock, H. Three-Dimensional Multi-phase Physics-Based Modeling Methodology to Study Engine Cylinder-kit Assembly Tribology and Design Considerations- Part I. SAE Int. J. Adv. Curr. Pract. Mobil. 2020, 3, 561–582. [Google Scholar] [CrossRef]
  18. Chowdhury, S.S.; Schock, H.; Kharazmi, A. The Effect of Ring-Groove Geometry on Engine Cylinder-Kit Assembly Using Three-Dimensional Multiphase Physics-Based Modeling Methodology-Part II; SAE International Technical Paper; SAE International: Warrendale, PA, USA, 2021. [Google Scholar] [CrossRef]
  19. McGrogan, S. Modeling and Simulation of Oil Transport for Studying Piston Deposit Formation in IC Engines. Master’s Thesis, Massachusetts Institute of Technology, Department of Mechanical Engineering, Cambridge, MA, USA, 2007. [Google Scholar]
  20. Fang, T. Fluid Mechanics of Lubricant Transport in Non-Contact Regions in the Piston Ring Pack in Internal Combustion Engines. Ph.D. Thesis, Massachusetts Institute of Technology, Department of Mechanical Engineering, Cambridge, MA, USA, 2019. [Google Scholar]
  21. Zhong, X. Physics-Based and Machine Learning Hybrid Modeling of Oil Transport and Oil Consumption in Internal Combustion Engines—A Digital Twin. Ph.D. Thesis, Massachusetts Institute of Technology, Department of Mechanical Engineering and Center for Computational Science and Engineering, Cambridge, MA, USA, 2025. [Google Scholar]
  22. Tian, T.; Ahling, S.; Liu, Y.; Zhang, W. Developing Healthy Piston Ring Pack Systems—Oil Control and Its Limit. In Proceedings of the Second World Internal Combustion Engine Conference, Jinan, China, 21–24 April 2021. [Google Scholar]
  23. Bhouri, M.A. Curved Beam Based Model for Piston-Ring Designs in Internal Combustion Engines. Master’s Thesis, Massachusetts Institute of Technology, Department of Mechanical Engineering, Cambridge, MA, USA, 2017. [Google Scholar]
  24. Li, M.; Tian, T. Sources and Destinations of Oil Leakage through TPOCR Based on 2D-LIF Observation and Modeling Analysis. Lubricants 2023, 11, 522. [Google Scholar] [CrossRef]
  25. Koeser, P. Novel Findings on Lube Oil Ignition and Piston Cylinder Unit for Future Fuel-Efficient Industrial Gas Engines. Ph.D. Thesis, Leibniz University Hannover, Institute for Technical Combustion, Hannover, Germany, 2021. [Google Scholar]
  26. Biboulet, N.; Lubrecht, A. Geometric Starvation of a One-Dimensional Parabolic Profile. Tribol. Lett. 2016, 61, 3. [Google Scholar] [CrossRef]
  27. Wang, Z.; Bovik, A.; Sheikh, H.; Simoncelli, E. Image quality assessment: From error visibility to structural similarity. IEEE Trans. Image Process. 2004, 13, 600–612. [Google Scholar] [CrossRef] [PubMed]
  28. Senzer, E. Oil Transport Inside the Oil Control Ring Groove and Its Interaction with Surrounding Areas in Internal Combustion Engines. Ph.D. Thesis, Massachusetts Institute of Technology, Department of Mechanical Engineering, Cambridge, MA, USA, 2012. [Google Scholar]
  29. Liu, L.; Tian, T.; Yilmaz, E. Modeling Oil Evaporation From the Engine Cylinder Liner With Consideration of the Transport of Oil Species Along the Liner. In Proceedings of the World Tribology Congress III, Washington, DC, USA, 12–16 September 2005; Volume 2, pp. 579–580. [Google Scholar] [CrossRef]
  30. Zhang, Q. Fast Modeling of Multi-Phase Mixture Transport in Piston/Ring/Liner System via GAN-Augmented Progressive Modeling. Ph.D. Thesis, Massachusetts Institute of Technology, Department of Mechanical Engineering, Cambridge, MA, USA, 2020. [Google Scholar]
  31. Woschni, G. A Universally Applicable Equation for the Instantaneous Heat Transfer Coefficient in the Internal Combustion Engine. SAE Trans. 1968, 76, 3065–3083. [Google Scholar] [CrossRef]
  32. Chilton, T.H.; Colburn, A.P. Mass Transfer (Absorption) Coefficients Prediction from Data on Heat Transfer and Fluid Friction. Ind. Eng. Chem. 1934, 26, 1183–1187. [Google Scholar] [CrossRef]
  33. Wilke, C.R.; Chang, P. Correlation of diffusion coefficients in dilute solutions. AIChE J. 1955, 1, 264–270. [Google Scholar] [CrossRef]
  34. Kudchadker, A.P.; Zwolinski, B.J. Vapor Pressure and Boiling Points of Normal Alkanes, C21 to C100. J. Chem. Eng. Data 1966, 11, 253–255. [Google Scholar] [CrossRef]
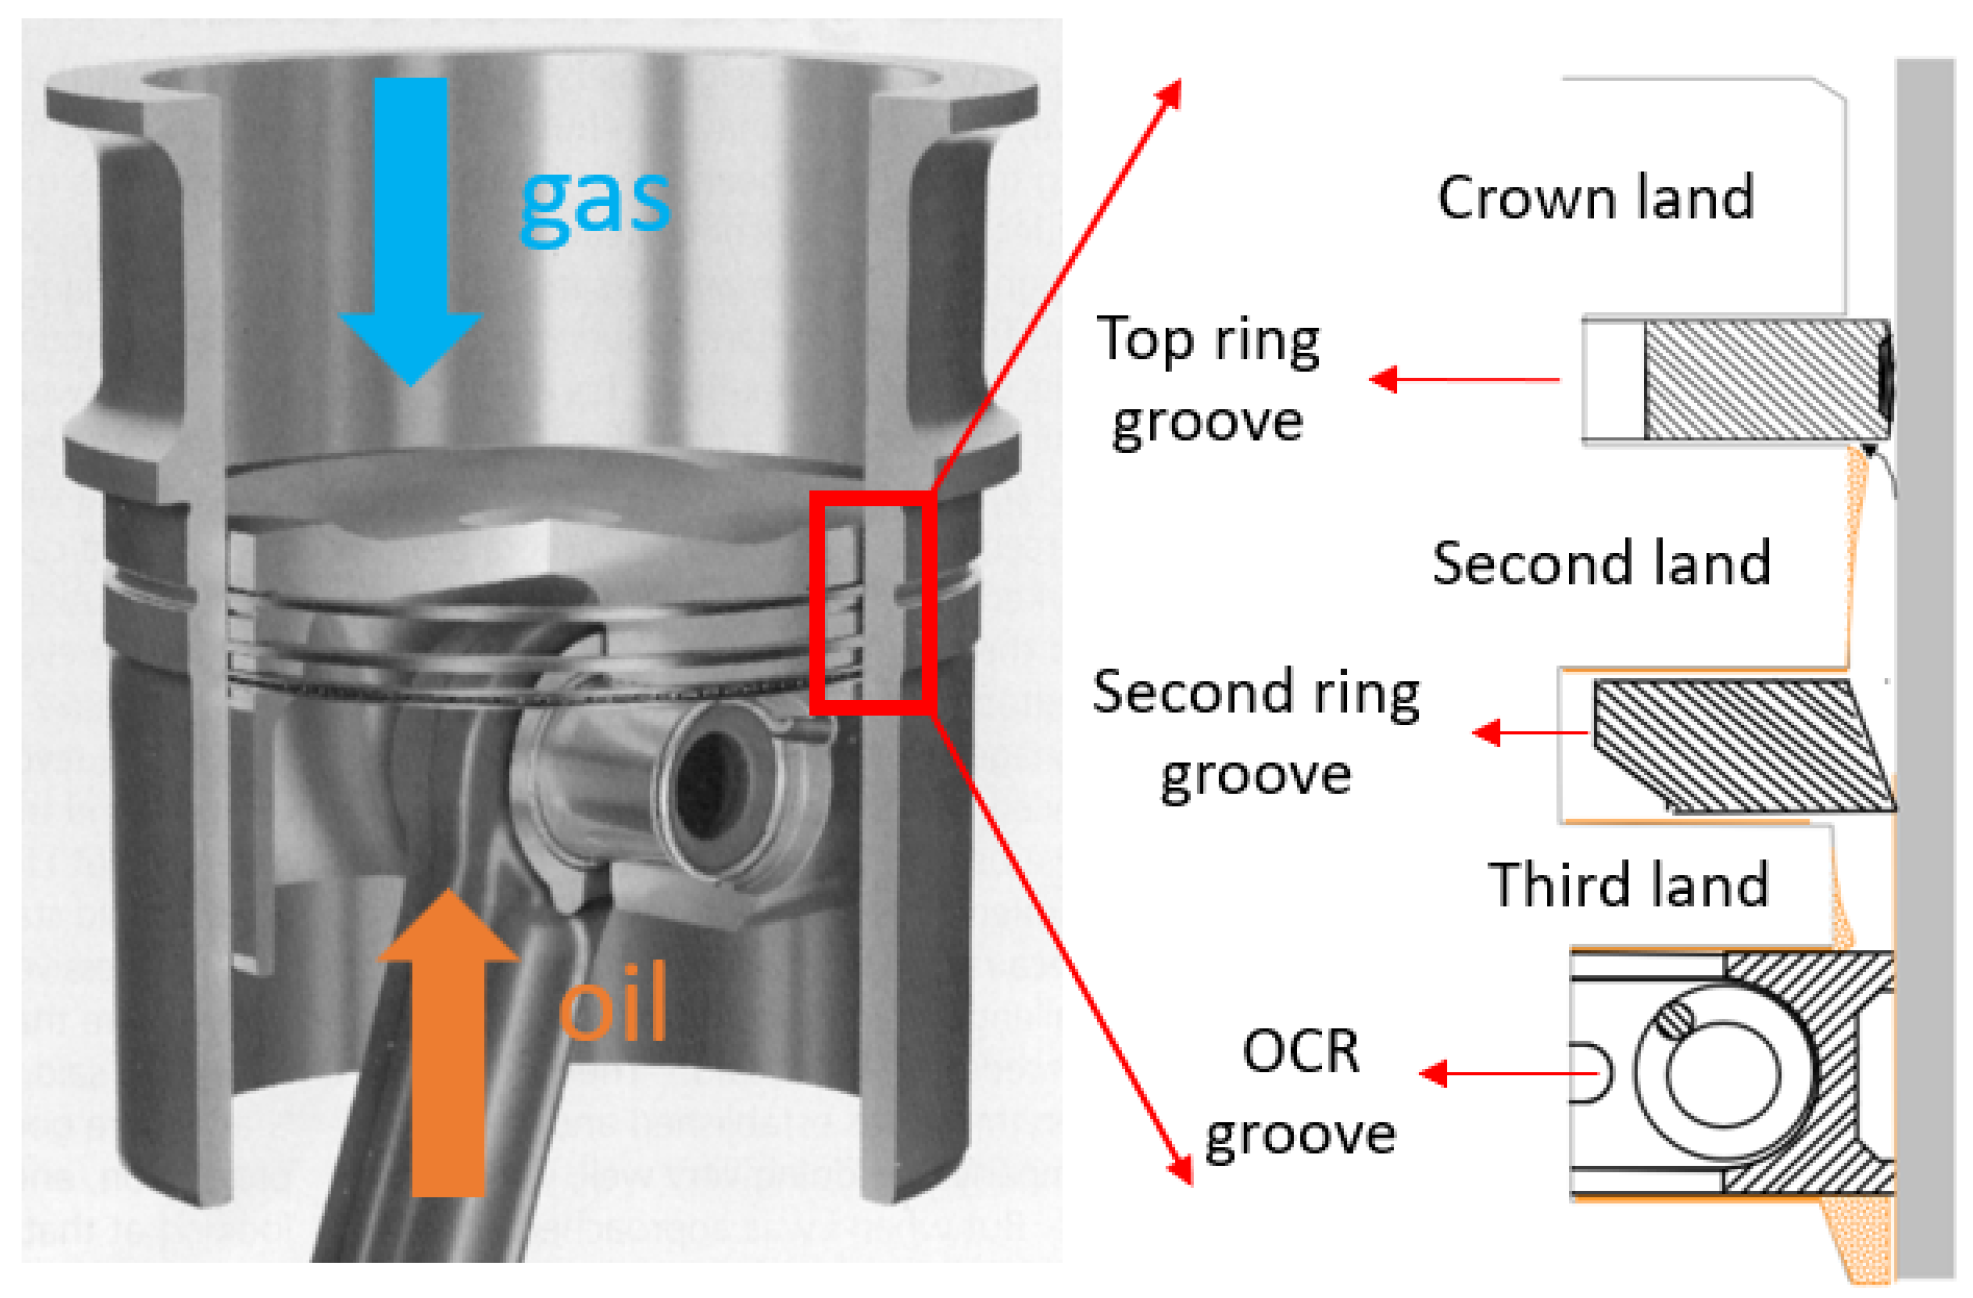
Figure 1. Schematic of the piston ring pack in an IC engine.
Lubricants 13 00463 g001
Figure 2. Multi-timescale nature of the oil transport process [15].
Lubricants 13 00463 g002
Figure 3. Mechanisms related to lubrication and LOC in the piston ring pack.
Lubricants 13 00463 g003
Figure 4. Overall model architecture.
Lubricants 13 00463 g004
Figure 5. Forces considered in the 3D ring dynamics model.
Lubricants 13 00463 g005
Figure 6. Illustration of the extra oil leakage pattern from the oil control ring.
Lubricants 13 00463 g006
Figure 7. Illustration of the domain of the ring–liner lubrication model.
Lubricants 13 00463 g007
Figure 8. Illustration of the change in the ring’s wetting and the oil film thickness left on the liner.
Lubricants 13 00463 g008
Figure 9. Sample CFD simulation of the gas flow field on the piston land.
Lubricants 13 00463 g009
Figure 10. Model architecture for flow field prediction.
Lubricants 13 00463 g010
Figure 11. Cross-section of CFD flow domain.
Lubricants 13 00463 g011
Figure 12. Illustration of the oil–gas interaction model.
Lubricants 13 00463 g012
Figure 13. Simulation domain in the vaporization model.
Lubricants 13 00463 g013
Figure 14. Vaporization in the dry region with top ring rotation considered.
Lubricants 13 00463 g014
Figure 15. Dependence of the scraping behaviors of the top two rings on the ring gap arrangements.
Lubricants 13 00463 g015
Figure 16. Sample scraping behavior of the top two rings for one particular ring gap arrangement.
Lubricants 13 00463 g016
Figure 17. Cycle-averaged top ring scraping result under different ring gap arrangements. Units: g/h.
Lubricants 13 00463 g017
Figure 18. Sample oil vaporization result below the dry region: (a) liner temperature distribution, (b) cylinder gas properties, (c) species mass fraction at the top dead center of the oil control ring, (d) species vaporization rate.
Lubricants 13 00463 g018
Figure 19. Oil vaporization rate in the dry region under different top ring rotation speed.
Lubricants 13 00463 g019
Figure 20. Oil film thickness (OFT) distribution on the second land at select cycles of the large-bore natural gas engine profile.
Lubricants 13 00463 g020
Figure 21. Sample result of the LOC due to gas-driven oil transport and oil release rate from the second land of the large-bore natural gas engine profile.
Lubricants 13 00463 g021
Figure 22. Sample result of the LOC due to gas-driven oil transport and oil release rate from the second land of the heavy-duty diesel engine profile, as a function of the distance between the second land oil source and the top ring gap.
Lubricants 13 00463 g022
Figure 23. Illustration of the oil–gas interaction around the top ring gap for an engine profile with reverse gas flow.
Lubricants 13 00463 g023
Figure 24. Top ring up-scraping result for the heavy-duty diesel engine profile under all possible ring gap arrangements.
Lubricants 13 00463 g024
Figure 25. Liner vaporization result for the heavy-duty diesel engine: (a). Vaporization rate by species below the dry region (b). Total vaporization rate in the dry region at different top ring rotation speed.
Lubricants 13 00463 g025
Figure 26. Oil consumption due to reverse gas flow in the heavy-duty diesel engine profile.
Lubricants 13 00463 g026
Figure 27. Model-predicted LOC range and experimentally measured LOC value.
Lubricants 13 00463 g027
Table 1. Oil consumption contributions from different sources for the large-bore natural gas engine profile. LOC also expressed in g/kWh for reference.
SourceRange (g/h)Range (g/kWh)
Top ring up-scraping[0, 2.57][0, 0.02]
Liner vaporization[1.57, 5.27][0.012, 0.04]
Reverse gas flowN/AN/A
Table 2. Oil consumption contributions from different sources for the heavy-duty diesel engine profile. LOC also expressed in g/kWh for reference.
SourceRange (g/h)Range (g/kWh)
Top ring up-scraping[0, 2.92][0, 0.04]
Liner vaporization[0.085, 0.125][0.0013, 0.002]
Reverse gas flow[0, 17.2][0, 0.26]
Disclaimer/Publisher’s Note: The statements, opinions and data contained in all publications are solely those of the individual author(s) and contributor(s) and not of MDPI and/or the editor(s). MDPI and/or the editor(s) disclaim responsibility for any injury to people or property resulting from any ideas, methods, instructions or products referred to in the content.