Article

Microstructure and Mechanical Properties of CuZr Thin-Film Metallic Glasses Deposited by Magnetron Sputtering

1
School of Electromechanical Engieering, Guangdong University of Technology, Guangzhou 510006, China
2
Plansee (Shanghai) High Performance Material Ltd., Shanghai 201306, China
*
Author to whom correspondence should be addressed.
Lubricants 2025, 13(10), 447; https://doi.org/10.3390/lubricants13100447
Submission received: 21 August 2025 / Revised: 1 October 2025 / Accepted: 12 October 2025 / Published: 14 October 2025

Abstract

As a novel class of thin films, thin-film metallic glasses (TFMGs) hold broad application prospects in biomedicine, electronic components, etc. In this study, CuZr TFMGs were deposited at room temperature using a medium-frequency magnetron sputtering (MFMS) technique. The effects of bias voltage on the microstructure and properties of the films were systematically investigated. The results indicate that the CuZr system exhibits excellent glass-forming ability (GFA), with films possessing a smooth surface. As bias voltage increases, cross-sectional morphology transitions from a glassy morphology to a dimple-like structure. The high bias voltage induces reduced dimple size and significantly increased density. At a bias voltage of −50 V, the hardness of CuZr film reaches a maximum of 9.6 GPa. This hardness is approximately five times and twice that of pure Cu and Zr films, respectively. Compared with Zr film, CuZr TFMGs exhibit a significantly reduced friction coefficient while maintaining a low wear rate. All CuZr films demonstrate excellent electrical conductivity and hydrophobicity, providing the basis for future potential applications.

1. Introduction

Metallic glasses (MGs), also known as amorphous alloys, are characterized by a unique atomic arrangement that features long-range disorder and short-range order [1,2]. Unlike traditional crystalline metallic materials, metallic glasses are free from typical crystalline defects such as grain boundaries, vacancies, and dislocations [3]. This distinctive structural feature endows them with a host of superior properties, including a uniform composition, low surface roughness, excellent wear resistance, strong corrosion resistance and favorable soft magnetic properties. As a result, they hold significant application potential across various fields, including electronic devices, biomedicine, and mold protection, etc. In the field of biomedical science, for example, metallic glasses can be utilized to repair bones, teeth, joints, and other anatomical parts. They not only effectively replace damaged tissues but also promote tissue regeneration through their intrinsic material properties [4]. In industrial protection, their superior corrosion resistance is expected to provide long-term anti-corrosion protection for chemical equipment, thereby significantly extending the service life of such devices [5].
Owing to the remarkable supercooled liquid phase zone, low elastic modulus, and excellent biocompatibility, bulk metallic glasses (BMGs) have become a hot topic in the field of materials science. However, their inherent brittleness at room temperature and limitations in glass-forming ability (GFA) have seriously restricted their practical applications and commercialization [6]. To address the challenges, thin-film metallic glasses (TFMGs) have emerged as a promising alternative. TFMGs not only effectively circumvent the size limitations of BMGs but also significantly enhance resistance to shear localization. By retarding shear band propagation and optimizing stress dispersion under loading, TFMGs exhibit superior ductility while retaining their original performance advantages. Among techniques for preparing metallic glass film, plasma spraying and laser cladding offer high processing efficiency. However, these techniques tend to induce thermal cracking, struggle to maintain amorphous content, and often result in films with poor thickness control. In contrast, the physical vapor deposition (PVD) technique more readily creates the external conditions required for amorphous structure formation. These include a high degree of undercooling and adequate atomic diffusivity. Through high cooling rates of up to 109 K/s, PVD not only provides sufficient undercooling to suppress nucleation and growth but also reduces atomic diffusivity, thereby effectively overcoming the limitations of GFA [7]. Additionally, the PVD technique enables fabrication over a broader compositional range and allows precise control of film thickness and microstructure. These advantages provide a more reliable route for the preparation of high quality amorphous films. Zhang et al. [8] prepared a dense Zr-Ti-Ag metallic glass film using direct current magnetron sputtering (DCMS). The film exhibited an elastic modulus closely matching that of cortical bone and excellent corrosion resistance in a physiological saline environment. However, the thin-film thickness (0.7–1.0 µm) is relatively small. These properties may limit its load-bearing capacity and service life in bioimplantation applications. Chen et al. [9] inserted a W–Ni–B TFMG between Cu and Si layers by magnetron sputtering. When employed as a diffusion barrier, this film exhibits a high glass transition temperature of 863 °C and a crystallization temperature of 903 °C. These values demonstrate outstanding thermal stability. Onyeagba et al. [10] used multi-target co-sputtering to prepare Ti-Fe-Cu, Zr-Fe-Al, and Zr-W-Cu TFMGs with polycrystalline phases (>50% amorphous) on 316L stainless steel and titanium alloys. These films exhibited excellent fracture toughness but relatively low hardness (less than 4.5 GPa). Previous studies have used the pop-in phenomenon in nanoindentation to characterize the deformation behavior of amorphous thin films. However, most focused only on deformation formation. A systematic understanding of how loading conditions influence the pop-in threshold and subsequent deformation modes is still lacking.
In addition to preparation conditions, the GFA of materials primarily depends on their chemical composition. Generally, metal elements are not prone to forming amorphous structures. This is because metallic bonding lacks directionality, which necessitates a higher degree of undercooling to suppress ordered arrangement. Among various MGs, the CuZr system has garnered extensive attention due to its excellent GFA. The significant atomic size difference between Cu and Zr leads to more disordered atomic packing after mixing. Additionally, the CuZr alloys exhibit amorphous structural characteristics, negative mixing enthalpy, and large atomic size mismatch. These features favor the formation of TFMGs systems. The microstructure of the film can be effectively regulated and toughened by Cu addition. Brognara et al. [11] prepared Zr100−xCux TFMGs with varying Cu contents. Amorphous structures were readily formed when the Cu content ranged from 30 to 85 at.%. As the Cu content increased from 26 at.% to 76 at.%, the film hardness increased from 4.6 GPa to 7.7 GPa, and the Cu-rich film remained uncracked under a strain of 2.1%. Wang et al. [12] fabricated Cu50Zr50 TFMGs with different thicknesses by DCMS. The results showed that as the film thickness increased, the growth mode transformed from a mixed island layer mode to a layer-by-layer growth. This improvement was accompanied by enhanced thermal stability and a transition from hydrophilicity to hydrophobicity behavior. However, when the film thickness reached ~996 nm, the corrosion resistance deteriorated. Corrosion resistance of CuZr-based TFMGs is related to their amorphous phase content and crystalline phase type. High amorphous content enhances corrosion resistance owing to its structural homogeneity. For example, Zhao et al. [13] reported that the corrosion current density of Zr-Cu-Ni-Al films in NaCl solution was reduced by approximately three orders of magnitude compared to uncoated samples. Additionally, Wang et al. [14] prepared amorphous/nanocrystalline TiAlCrNbZrx multi-component alloy films on 316L stainless steel surfaces using DCMS. The results indicated that increasing Zr content enhanced film crystallinity. The nanocrystals strengthened shear band regions, thereby improving the mechanical properties.
Bias voltage is considered one of the most critical process parameters in thin-film deposition. By applying bias voltage, the ion energy on the substrate can be regulated, which in turn affects the microstructure and mechanical properties of the film [15]. However, excessively high bias voltage may lead to lattice distortion in the coating. Applying a negative bias can induce re-sputtering effects, which alters the chemical composition of the thin film and reduces the deposition rate [16]. Warcholinski et al. [17] reported that as the substrate bias voltage increased, the deposition rate of Al-Cr-B-N coatings decreased. At the same time, the surface roughness increased, the friction coefficient rose, and the wear rate decreased. These changes were closely related to the re-sputtering effect. Zeng et al. [18] found that increasing the bias voltage densified the structure of CuNiTiNbCr coatings and reduced the relative content of Cu. Additionally, Zhou et al. [19] used a DC magnetron sputtering system to prepare nano-crystalline/amorphous Ti-Zr-Hf-Co-Ni-Cu high-entropy metallic glass thin films. They observed that the crystallinity of the film improved as the negative bias voltage increased. Therefore, precisely controlling the substrate bias voltage is crucial for improving the film performance.
TFMGs typically exhibit a vein-like cross-sectional morphology. However, the mechanisms underlying this morphology remain poorly understood. Furthermore, how substrate bias voltage influences the microstructure and properties of TFMGs is not yet fully understood. In this study, a series of CuZr TFMGs were deposited at room temperature using medium-frequency magnetron sputtering (MFMS). The effects of bias voltage on the microstructure and mechanical properties were systematically investigated. Additionally, the hydrophobicity and electrical conductivity of the CuZr films were characterized. These findings provide a theoretical basis for the broader application of high-performance metallic glass thin films in surface protection.

2. Materials and Methods

2.1. Film Deposition

In this study, the CuZr TFMGs were deposited on three kinds of substrates: (100) silicon wafers (20 mm × 10 mm × 0.5 mm), mirror-polished WC-15 wt.% TiC-6 wt.%; Co cemented carbide blocks (16 mm × 16 mm × 4 mm); and glass substrates (25 mm × 25 mm × 1 mm). The deposition was carried out using a self-built multi-chamber PVD system. This system comprises three chambers (P1, P2, P3), a pumping chamber (LL), and a sample transfer chamber. During the experiment, the sample holder was transferred between these chambers by a robotic arm located in the transfer chamber. In the deposition in this study, plasma cleaning chamber P2 and deposition chamber P3 were selected for the film growth process. A Cu target (99.99 wt.% purity) and a Zr target (99.2 wt.% purity) were mounted onto the MFMS cathodes in the P3 chamber. Both targets were 3-inch diameter circular targets. The target-to-substrate distance was fixed at 82 mm, and the substrates were tilted 15° with respect to the target (the specific layout of the P3 chamber is shown in Figure 1). Prior to loading, the substrates were ultrasonically cleaned in deionized water and absolute ethanol in sequence. They were then positioned on the holder in the LL chamber. Once the chamber pressure fell below 0.5 Pa, the sample holder was transferred to the P2 chamber for 2 min of glow cleaning under an Ar pressure of 1.0 Pa and a bias voltage of −900 V (with a duty cycle of 30%). This step was performed to remove residual contaminants from the substrate surfaces. Subsequently, the sample holder was moved to the P3 chamber, where 2 min metal ion etching was performed under the same argon pressure and bias voltage conditions to enhance the adhesion between the film and substrate. The CuZr films were deposited for 1 h at a chamber pressure below 5 × 10⁻⁴ Pa and a total target power of 150 W. During deposition, the argon pressure was maintained at 0.5 Pa, the sample holder was continuously rotated at 5 rpm, and the substrate bias voltage was set to 0 V, −20 V, −50 V, −100 V, or −150 V. For comparison, pure Cu and Zr films were deposited using dual Cu targets and dual Zr targets, respectively, at a bias voltage of −100 V, with other parameters kept consistent with those of the CuZr films. To ensure deposition stability, the targets underwent a 10 min pre-sputtering treatment before formal deposition to remove potential contaminants on the target surface. No substrate heating was employed throughout the entire process.

2.2. Film Characterizations

The surface and cross-sectional morphologies were observed using a field emission scanning electron microscope (SEM, SU-8200, Hitachi, Tokyo, Japan). Elemental composition on both the surface and cross-sections were quantified using an energy-dispersive X-ray spectrometer (EDS, Xflash 6-30, Bruker, Billerica, MA, USA) integrated with the SEM system. The phase constitution of the films were characterized by an X-ray diffractometer (XRD, D8-Discovery, Bruker, Billerica, MA, USA), employing monochromatic Cu Kα radiation (λ = 0.15418 nm). Diffraction spectra were recorded over a diffraction angle range of 20–80° (2θ) at a scanning rate of 0.02°/s. Three-dimensional surface morphologies were acquired using an atomic force microscope (AFM, Dimension FastScan, Bruker, Billerica, MA, USA) within a 3 µm × 3 µm area under the 8 kHz PeakForce tapping mode. The surface roughness of the thin films was evaluated based on these AFM measurements. To exclude substrate effects, roughness measurements were specifically performed on CuZr films deposited on Si wafers. In accordance with the ISO 14577-4-2007 standard [20], the mechanical properties of CuZr films on Si substrates were evaluated using a nanoindentation tester (TTX-NHT2, Anton Paar, Glaz, Australia). A Berkovich diamond indenter with a tip angle of 142.3° was employed. The hardness (H) and elastic modulus (E) values were determined based on the Oliver–Pharr method [21,22], with a 10 s hold at peak load. To minimize substrate influence, indentation depths were restricted to less than 10% of the film thickness. For each sample, two sets of tests were conducted (6 points per set, with a spacing of 20 µm between points to prevent mutual interference), and the average values were reported. Additionally, the mechanical responses of the films under different loading rates (8–100 mN/min) were further analyzed under the standard indentation mode. Critical loads were measured with a scratch tester (RST3, Anton Paar, Glaz, Australia) following the ISO 20502-2005 standard [23]. A diamond tip with a radius of 200 µm and a cone angle of 120° was used, with the load gradually increasing from 1 N to 100 N. The scratch length was 3 mm, and the testing rate was 6 mm/min. Each sample was tested three times, and the average value was recorded. All coated samples were subjected to ball-on-disk tribological tests at room temperature using a tribometer (THT1000, Anton Paar, Glaz, Australia). The counterbody was a GCr15 steel ball (Ø6 mm), under a normal load of 1 N, with a linear speed of 0.1 m/s and a sliding distance of 50 m. The wear scar regions and wear morphology of the balls were observed using a confocal laser scanning microscope (OLS4100, Olympus, Tokyo, Japan), and the wear rate of the films was estimated according to Equation (1).
W = V/(F · L)
where V is the wear volume loss in mm3, F is the applied normal load in N, and L is the sliding distance in m.
The contact angles between the thin films and deionized water were measured using a contact angle goniometer. A 1 µL droplet was dispensed onto the film surface, and the morphology of the droplets was captured by the integrated camera system. The angle between the droplet and the sample surface was then measured. To ensure accuracy and reproducibility, measurements were taken at five randomly selected locations on each sample, and the averaged value was calculated. The electrical resistance of the films was precisely measured using a four-point probe DC low-resistance tester. Each sample was measured five times to minimize errors. Sheet resistance (R) and resistivity (ρ) were calculated using Equations (2) and (3) [24].
R = Rx × F(D/S) × F(W/S) × Fsp
ρ = R × W = Rx × F(D/S) × F(W/S) × Fsp × W
where D denotes the sample diameter, S represents the average probe spacing, with a value of 1 mm in this experiment, W refers to the sample thickness, Fsp is the probe spacing correction coefficient, taking a value of 0.997 in this experiment, F(D/S) is the sample diameter correction factor, with a value of 4.171 in this experiment, F(W/S) is the sample thickness correction factor, set to 1 in this experiment, and Rx represents the resistance value measured by the low resistance tester.

3. Results and Discussion

Table 1 presents the elemental compositions of CuZr films under different bias voltages. During the deposition process, the Cu and Zr targets were powered by a medium-frequency magnetron sputtering system, and the power was distributed at a 1:1 ratio. However, due to differences in the sputtering yields of Cu and Zr, the deposition rates for the two elements varied, which resulted in the observed composition range. Within the bias voltage range of 0 to −100 V, the Cu and Zr content on the surface of the CuZr films showed no significant variation. However, when the bias voltage was further increased to −150 V, the Cu content exhibited a decreasing trend. This behavior is attributed to the increased ion bombardment energy associated with higher substrate bias, which preferentially re-sputters lighter elements such as Cu [25]. Increasing negative bias voltage enhances ion bombardment energy, which tends to induce re-sputtering of light elements and ultimately reduces proportion in the film. Additionally, 4.77–6.08 at. % oxygen was detected in the films. This is attributed to residual-gas contamination during deposition and post-deposition air exposure.
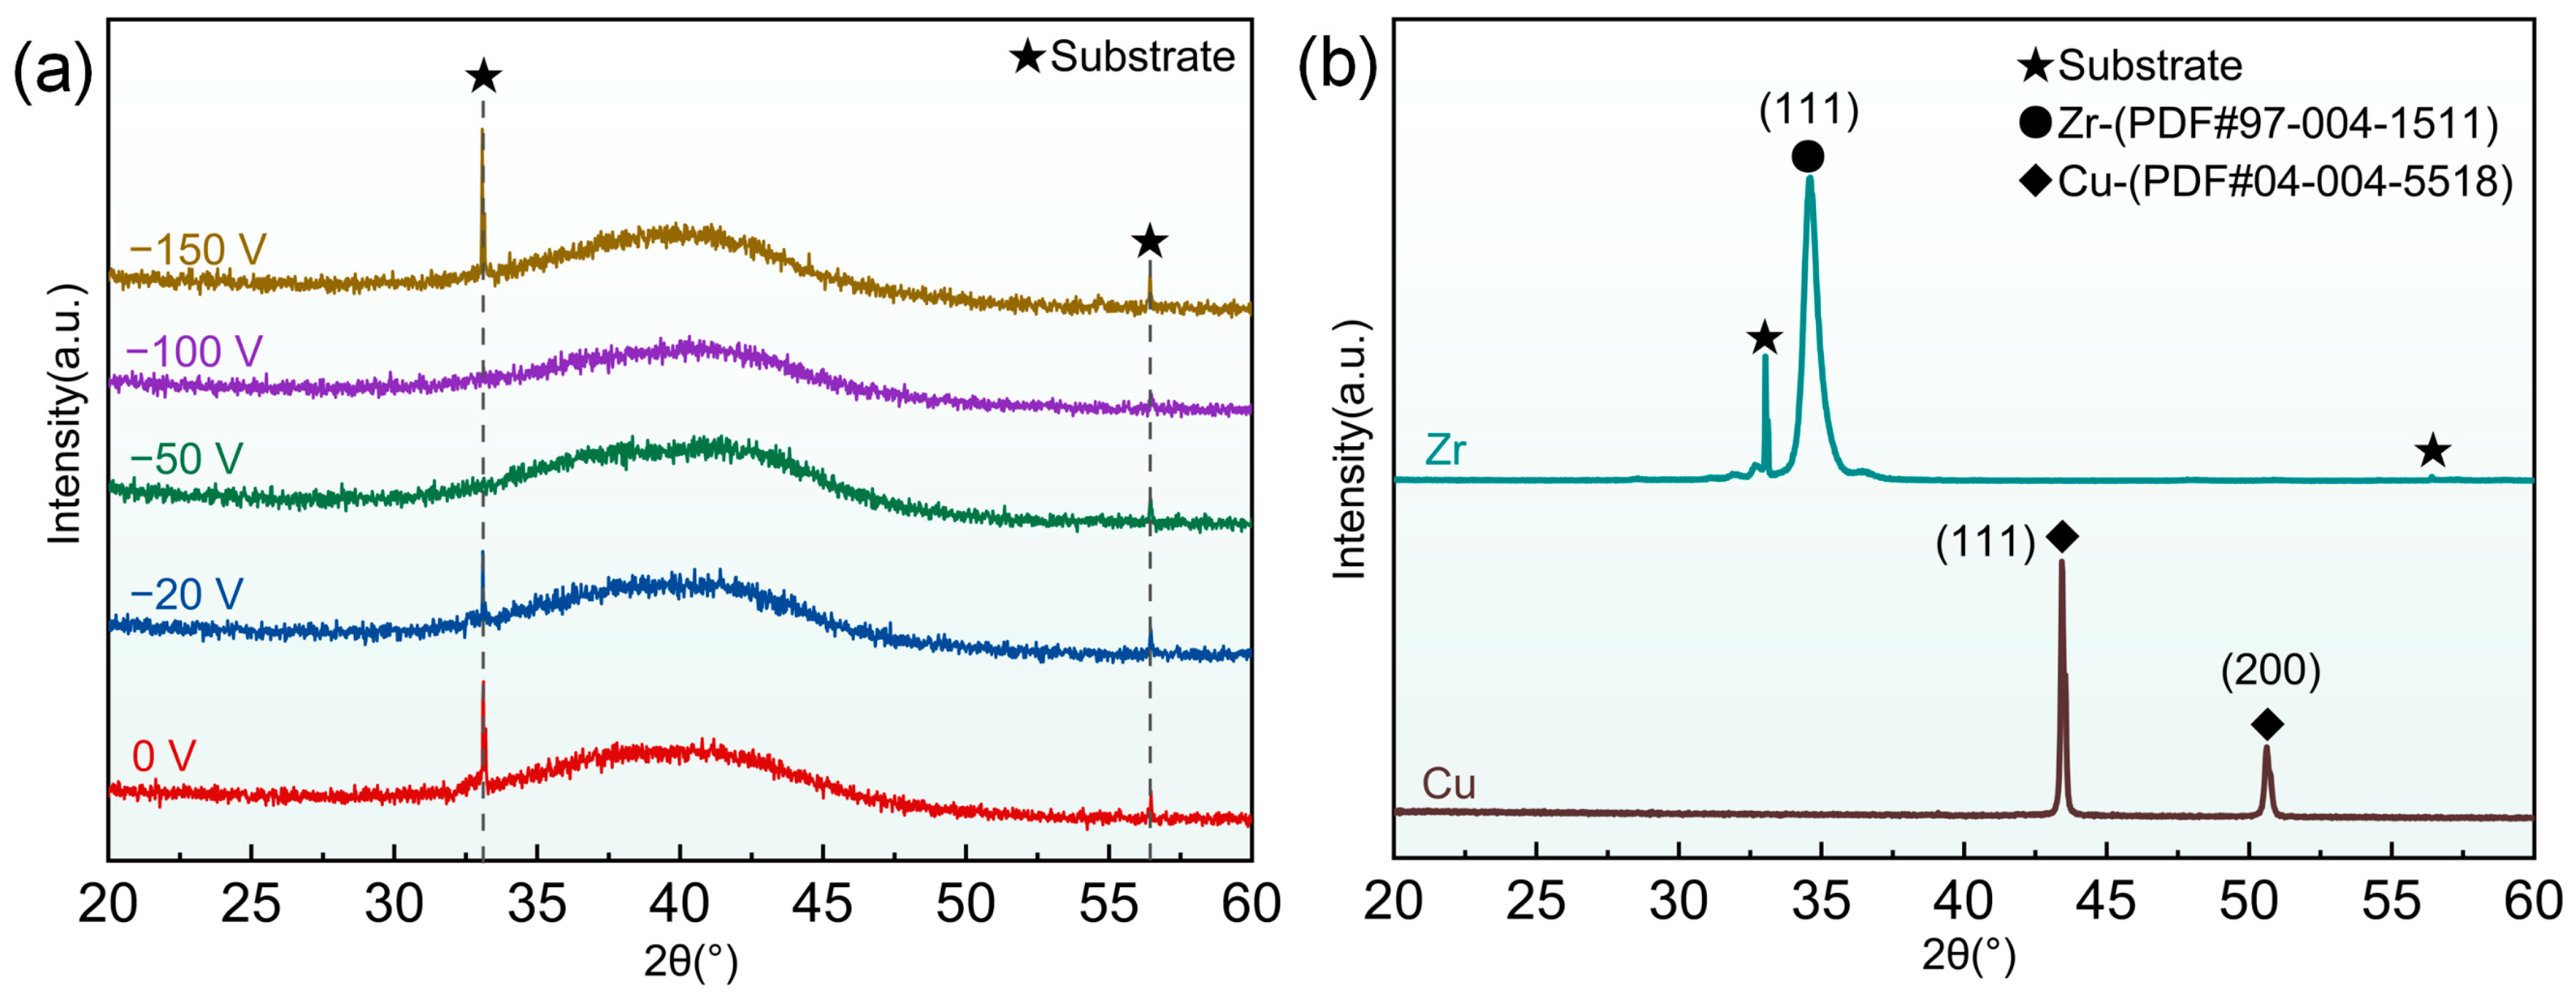
Figure 2 presents the XRD patterns of CuZr, Cu, and Zr films. Apart from peaks of the Si substrate, Cu and Zr films exhibit sharp (111) diffraction peaks at 2θ = 43.4° and 34.6°, respectively (Figure 2b), indicating complete crystallinity. By contrast, the CuZr films display typical broadened hump-like peaks at 2θ = 35–45° (Figure 2a). As the substrate bias voltage increases, neither the position nor the full width at half maximum (FWHM) of these broad peaks changes significantly, suggesting that the bias voltage has a limited effect on the amorphous phase content of the films. The presence of such broad peaks is a typical characteristic of TFMGs, clearly indicating that the films exhibit an amorphous structure, which agrees with Zeman et al. [26].
Figure 3 shows the surface morphologies of the CuZr, Cu, and Zr films. The surfaces of Cu and Zr films exhibit a granular cluster structure. On the Cu film surface, microscopic particles with a size of approximately 500 nm were observed (the area indicated by the blue line in Figure 3b). Microcracks were present at the interfaces between larger particles (marked by yellow dashed lines). In contrast, all CuZr films exhibited smooth, dense surfaces free of any grain boundaries, particles, or microcracks (Figure 3a).
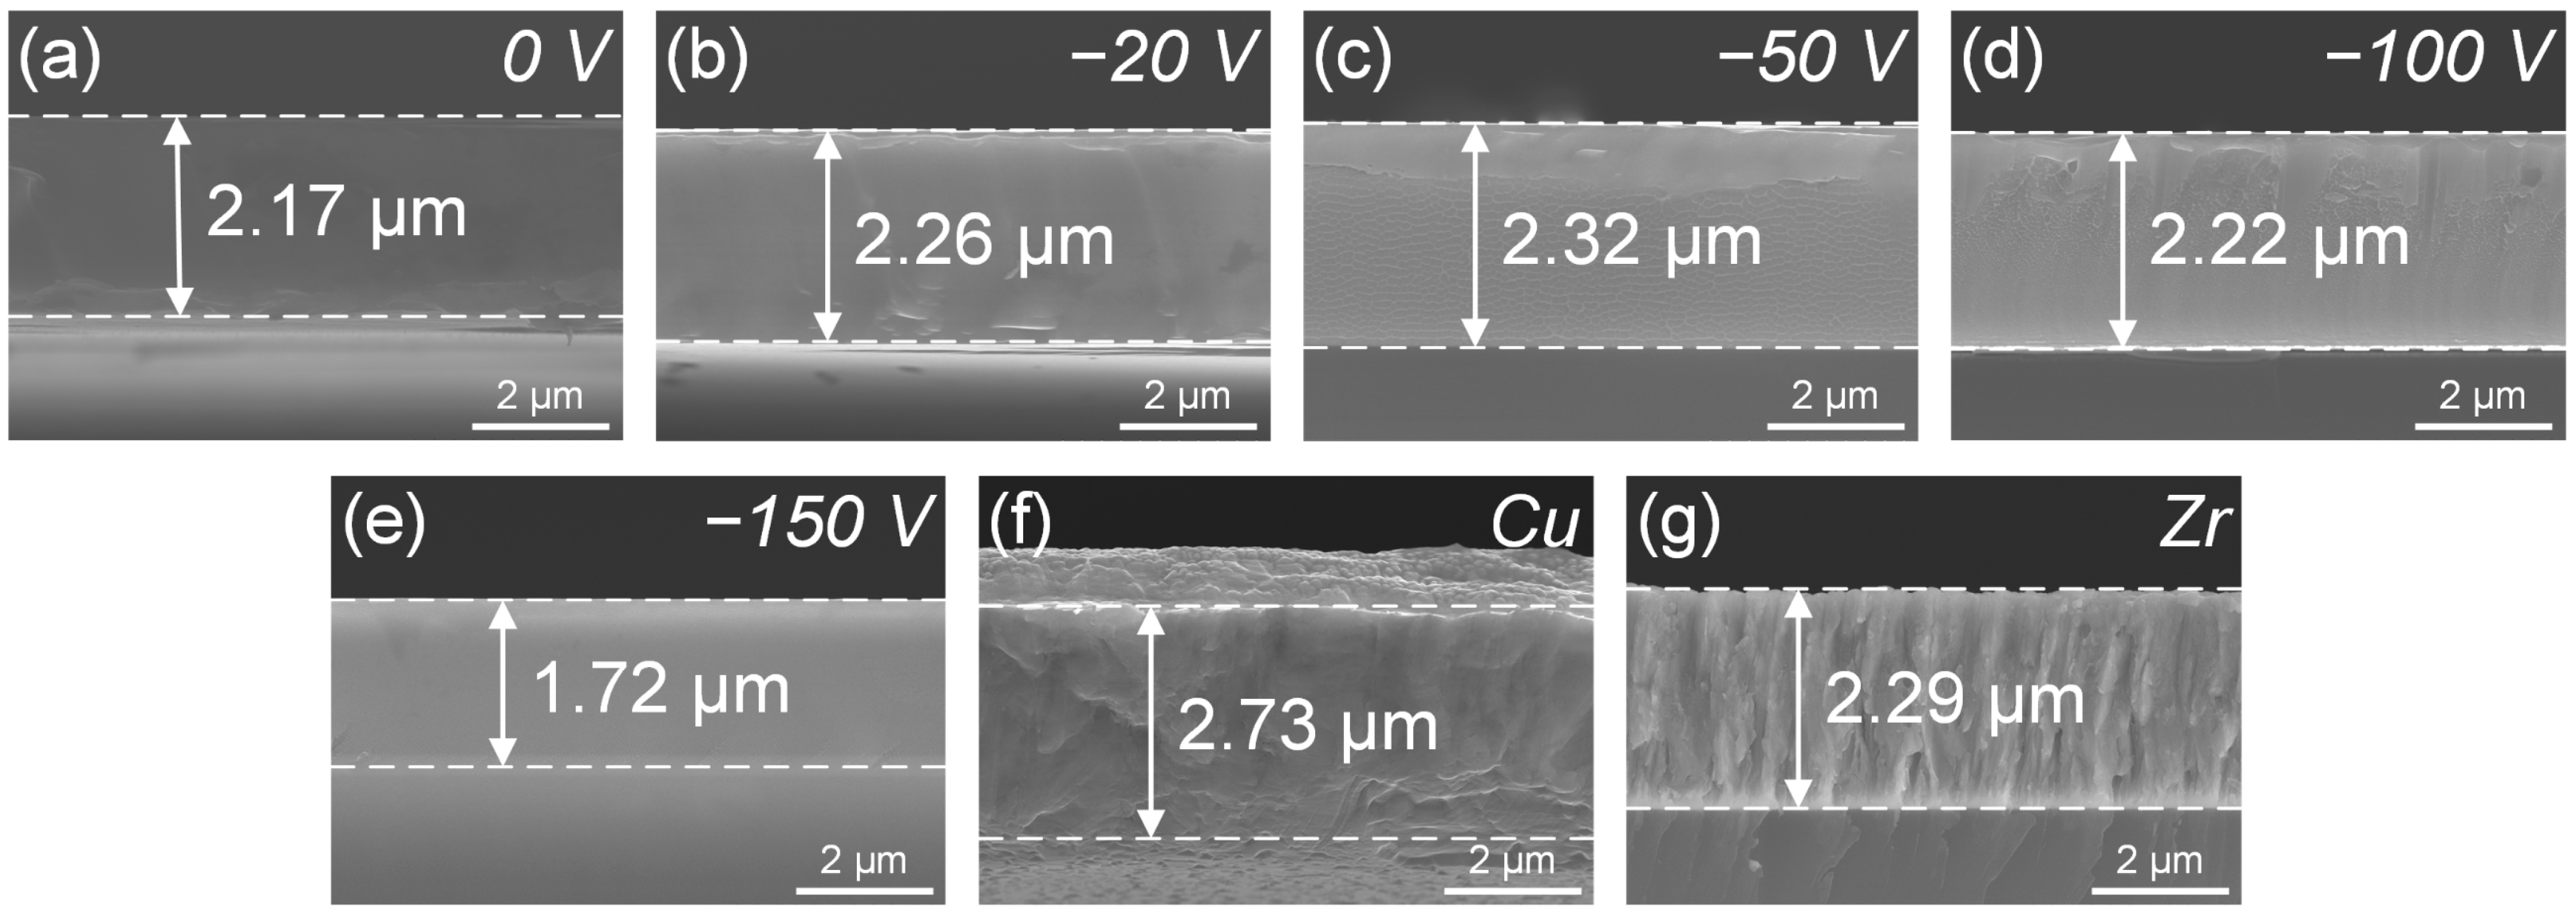
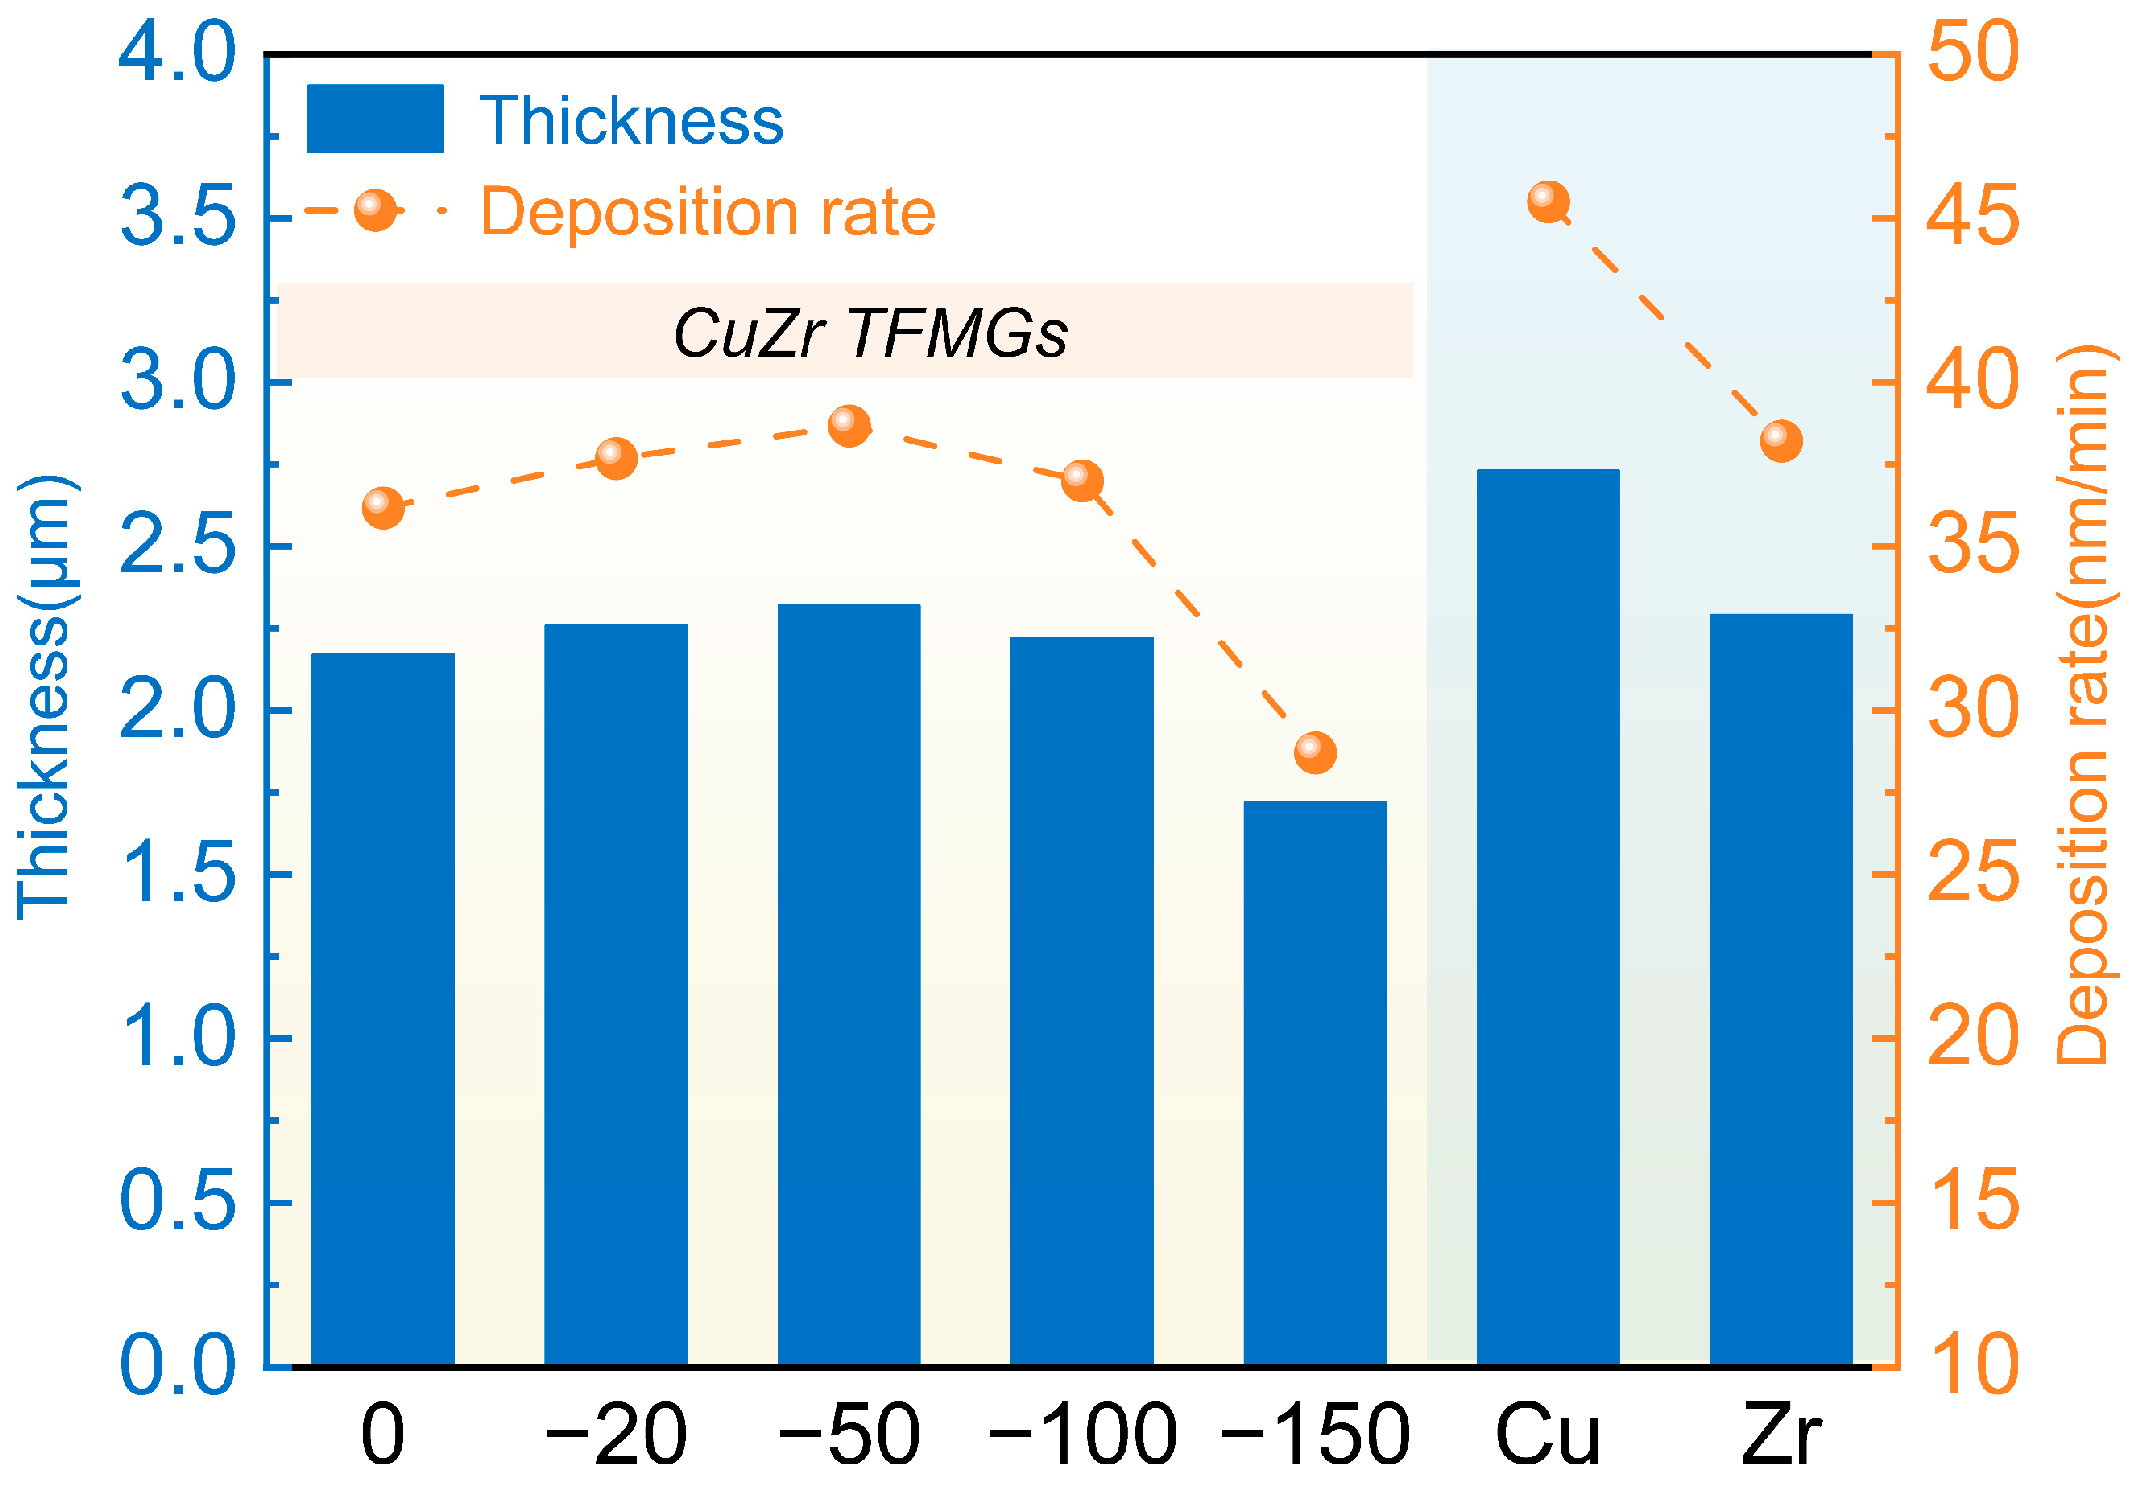
Figure 4 presents the fracture cross-sectional morphologies of the CuZr, Cu, and Zr films. Specifically, Cu and Zr films exhibit a columnar crystal growth mode typical of metals, whereas all CuZr films display glassy or vein-like fracture structures. Figure 5 displays the film deposition rates, which first increase and then decrease as the bias voltage increases. When the substrate bias voltage increased from 0 V to −50 V, the deposition rate increased. This trend is attributed to the enhanced ion bombardment. The bias voltage provides sufficient kinetic energy to previously under-energetic ions to reach the substrate. Meanwhile, the higher bias voltage enhanced ionization and plasma density, attracting more ions to the substrate [27,28]. However, as the bias voltage increased further, the re-sputtering phenomenon intensified, leading to a significant reduction in the deposition rate of CuZr thin films (from 38.67 nm/min to 28.70 nm/min).
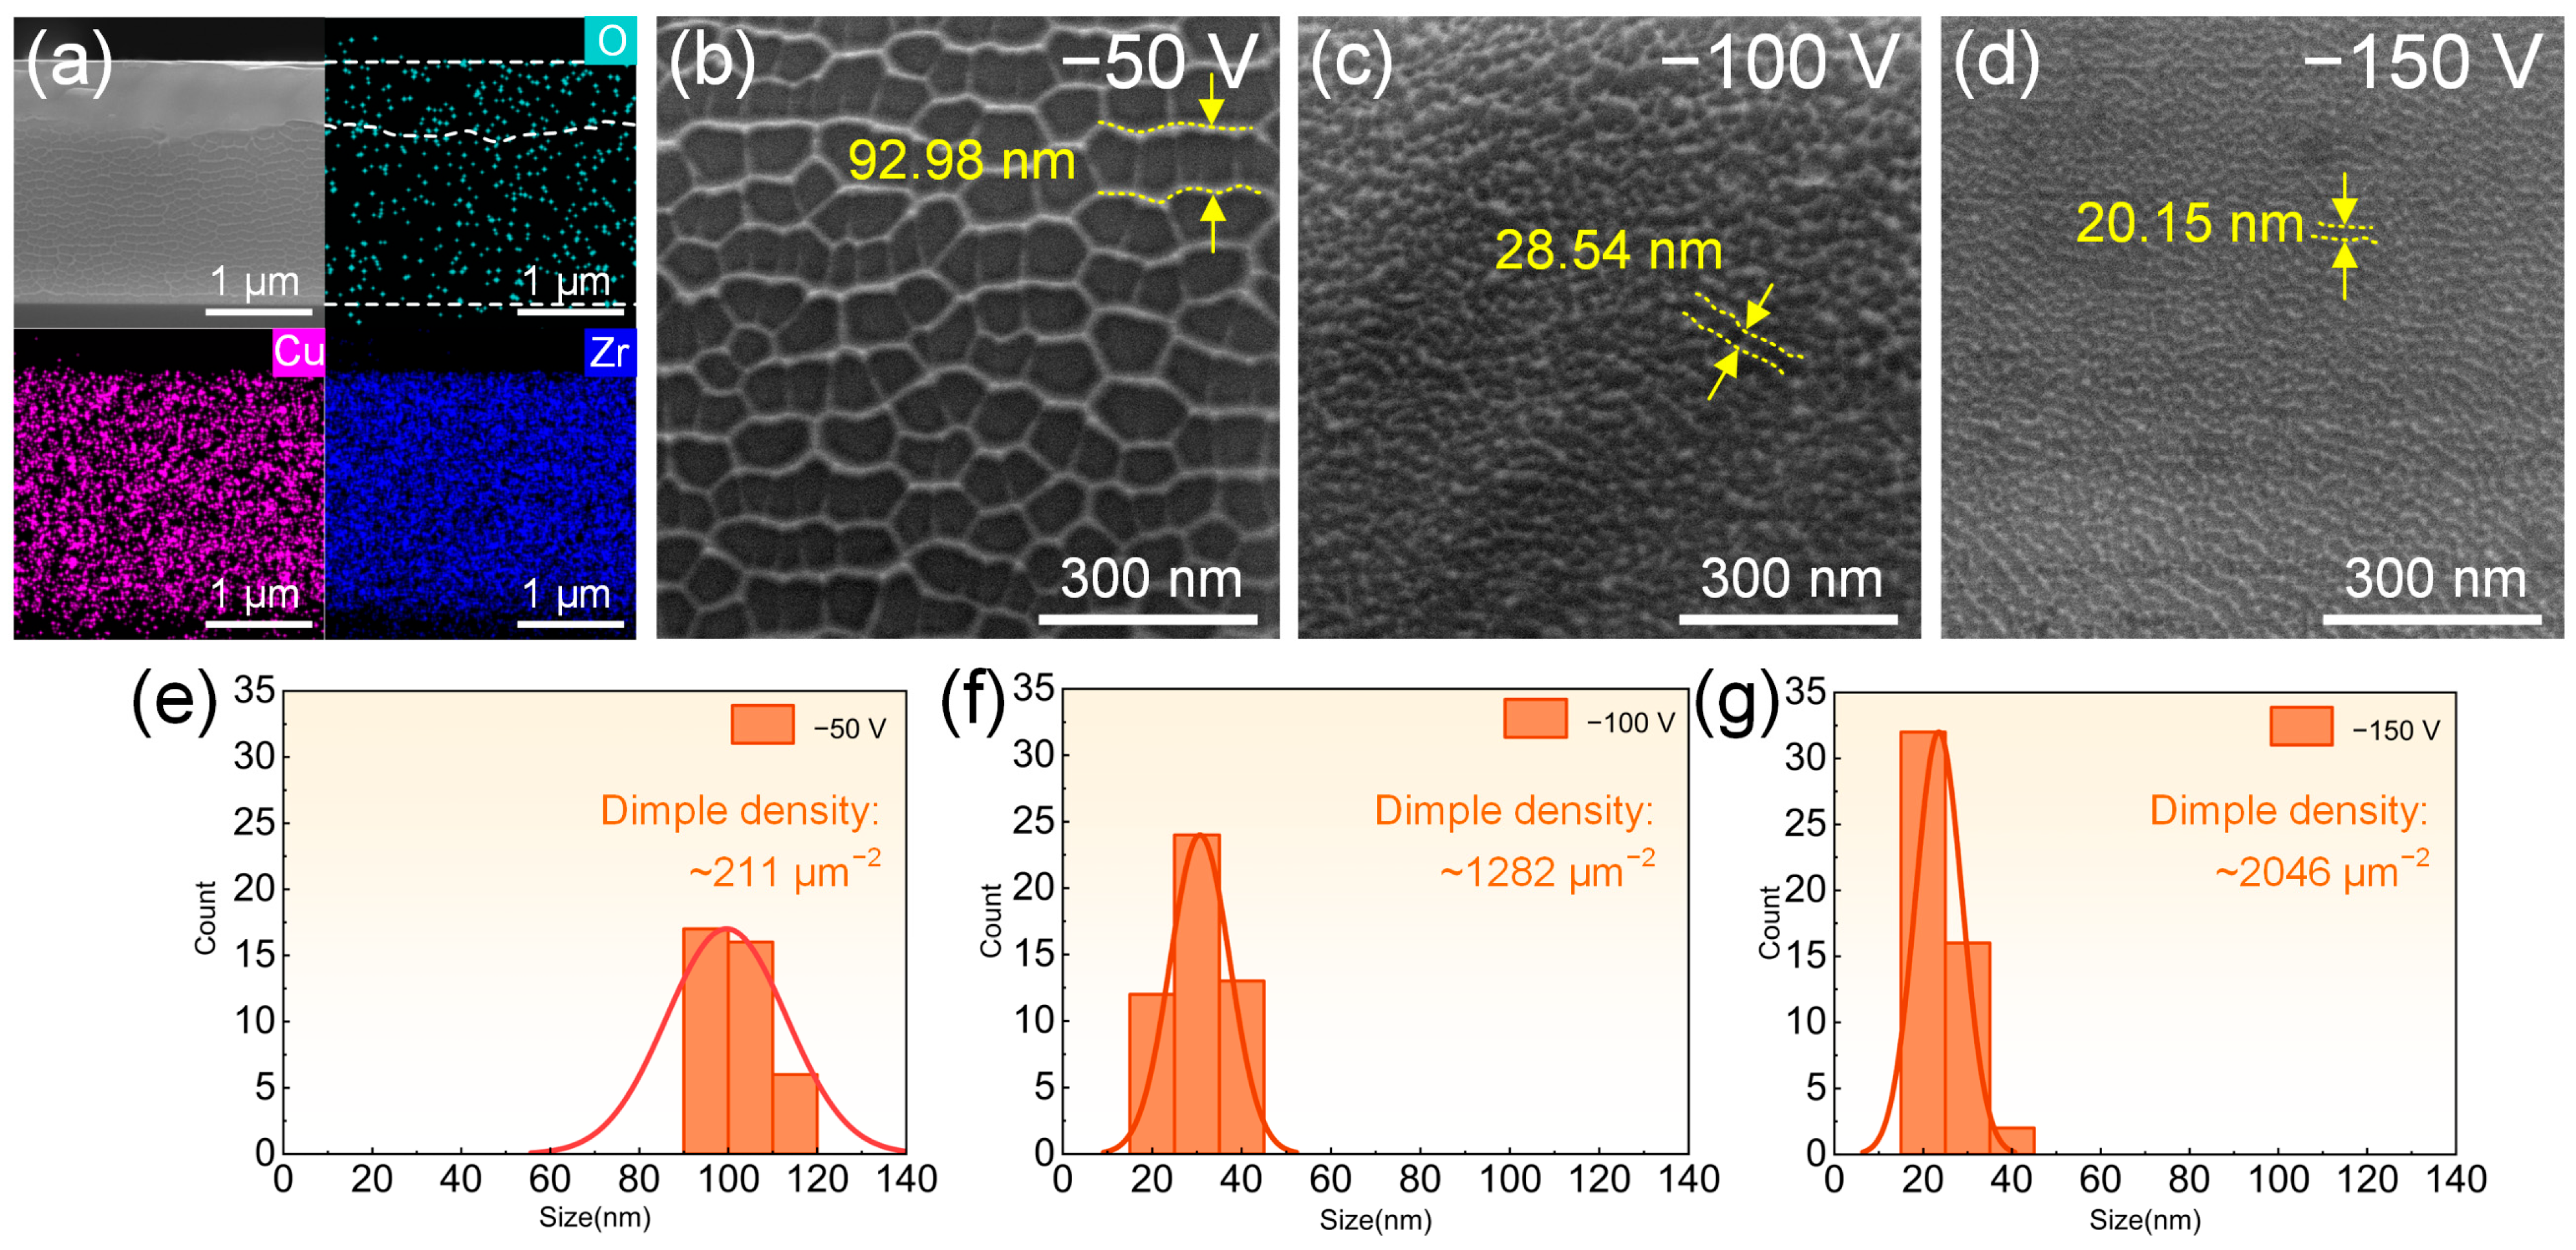
With increasing bias voltage, the cross-sectional morphologies transition from a glassy appearance to vein-like patterns. This typical characteristic of amorphous films is primarily associated with the formation of shear bands and energy dissipation mechanisms during the fracture. During fracture, the formation of shear bands leads to significant energy dissipation in local regions. The resulting temperature rise can trigger local melting and subsequent solidification, which produces vein-like patterns. This phenomenon has also been observed in ZrNi [29] and AuCuPdAgSi [30] films. By contrast, the cross-sectional fracture morphologies of CuZr thin films under 0 V and −20 V bias voltages exhibited a featureless glassy appearance (Figure 4a,b). Oxides generally melt at much higher temperatures than pure metals. Thus, oxygen-rich regions suppress local melting. The melting/solidification process and subsequent formation of vein-like structures occur only when the melting point of the local material is lower than the temperature reached during fracture and shear propagation. When a gradient distribution of oxygen content exists along the film growth direction, the two morphologies coexist. For example, in the CuZr thin film deposited at −50 V bias voltage, vein-like patterns cover approximately 75% of the film thickness, whereas the near surface region remains glassy (Figure 6a). Cross-sectional elemental mapping confirms that the glassy region has a higher oxygen content. Higher-magnification images of the fracture surfaces of CuZr films deposited at −50, −100, and −150 V revealed nanometer-scale dimples (Figure 6b–d). As the bias voltage increased, the dimple size decreased from approximately 100 nm to 20 nm (the typical dimensions of the regions were highlighted in yellow in the figure). These dimples are characteristic of ductile fracture. To quantify the fracture surface features, the dimple density was estimated by calculating the number of dimples in the cross-sectional area. For the CuZr thin film under a −50 V bias voltage, the dimple density was approximately 211 µm−2. However, under a −150 V bias voltage, the dimple density significantly increased to around 2046 µm−2. This suggests that higher bias voltage promotes a reduction in the dimple size while significantly increasing density. This phenomenon is closely related to the synergistic effects of atomic migration, free volume distribution, and stress. Higher bias voltages increased Ar+ bombardment energy. This process promoted dynamic annealing, which reduced free volume and homogenized the structure. Consequently, shear bands were suppressed, and deformation was confined to finer transformation zones, yielding smaller dimples [31]. Meanwhile, high-energy ion bombardment compressed large-size free volume clusters into nanoscale small-sized units, leading to distributed shear deformation [19]. In addition, high bias voltages introduced greater residual compressive stress at the film/substrate interface. This suppressed shear band propagation and promoted energy dissipation on finer scales, yielding smaller dimples [32].
Figure 7 presents the three-dimensional morphologies of CuZr, Cu, and Zr films using AFM. Consistent with the results from SEM, the surfaces of Cu and Zr films exhibit compact granular structures. In contrast, CuZr films show no distinct microscale particles; only small scale undulations were present. Figure 8 shows that the surface roughness of the CuZr films remained below 1 nm. When the bias voltage was −100 V, the film roughness was as low as 0.23 nm. Increased ion bombardment enhanced surface atomic migration and removed weakly bound atoms, producing a dense, smooth film. This observation agrees with previous reports by Fan et al. [33] and Azar et al. [34]. At −150 V, the CuZr film roughness rose to 0.47 nm. Excessive ion bombardment preferentially sputtered surface atoms, creating surface undulations and increasing roughness. Additionally, the Cu and Zr films exhibited relatively higher roughness values of 8.74 nm and 16.95 nm, respectively, which represent typical roughness levels of films prepared by magnetron sputtering [35].
Figure 9 shows the standardized nanoindentation test results of CuZr, Cu, and Zr films and the Cu/Zr ratio of CuZr films. As the bias voltage increased from 0 V to −100 V, the film hardness first increased and then decreased, whereas the elastic modulus showed the opposite trend. This phenomenon is because the increase in bias voltage enhances ion energy and atomic mobility and promotes a denser amorphous structure with fewer defects, thereby improving mechanical properties [16,36]. When the bias voltage was −50 V, the CuZr film achieved a maximum hardness of 9.64 GPa and a corresponding elastic modulus of 139.36 GPa. This hardness is approximately five times and twice that of Cu and Zr. It is worth noting that as the bias voltage increased from −20 V to −100 V, the elastic modulus increased from 135.53 GPa to 142.82 GPa. This increase is linked to the enhancement of ion bombardment energy [37]. When the bias voltage was further increased to −150 V, the ion bombardment effect intensified, causing Cu to be more easily re-sputtered. Consequently, the Cu/Zr ratio decreased, and the elastic modulus was reduced accordingly. Also, we observed the slightly fluctuating H, E, and H/E values. The H and H/E values of the CuZr films are higher than those of both the Cu and the Zr films, while the E values of the CuZr films are lower than those of the elementary films. The inherent mechanism needs further investigations. Previous studies have shown that high H/E and H3/E2 values correlate with excellent wear resistance and plastic deformation resistance in films [38]. The H/E and H3/E2 of CuZr films follow a variation trend consistent with the film hardness. H/E ranges from 0.05 to 0.07, which is comparable to the H/E ratios of Zr-based TFMGs reported in previous works [39]. In contrast, Cu and Zr films exhibited H/E values of only 0.01 and 0.03, respectively, which are significantly lower than those of CuZr films. Notably, the CuZr film deposited at −50 V exhibited the highest H3/E2 (0.05 GPa), indicating the greatest deformation resistance. This enables external loads to be distributed over a wider elastic strain range, enhancing wear resistance and suppressing microcrack propagation.
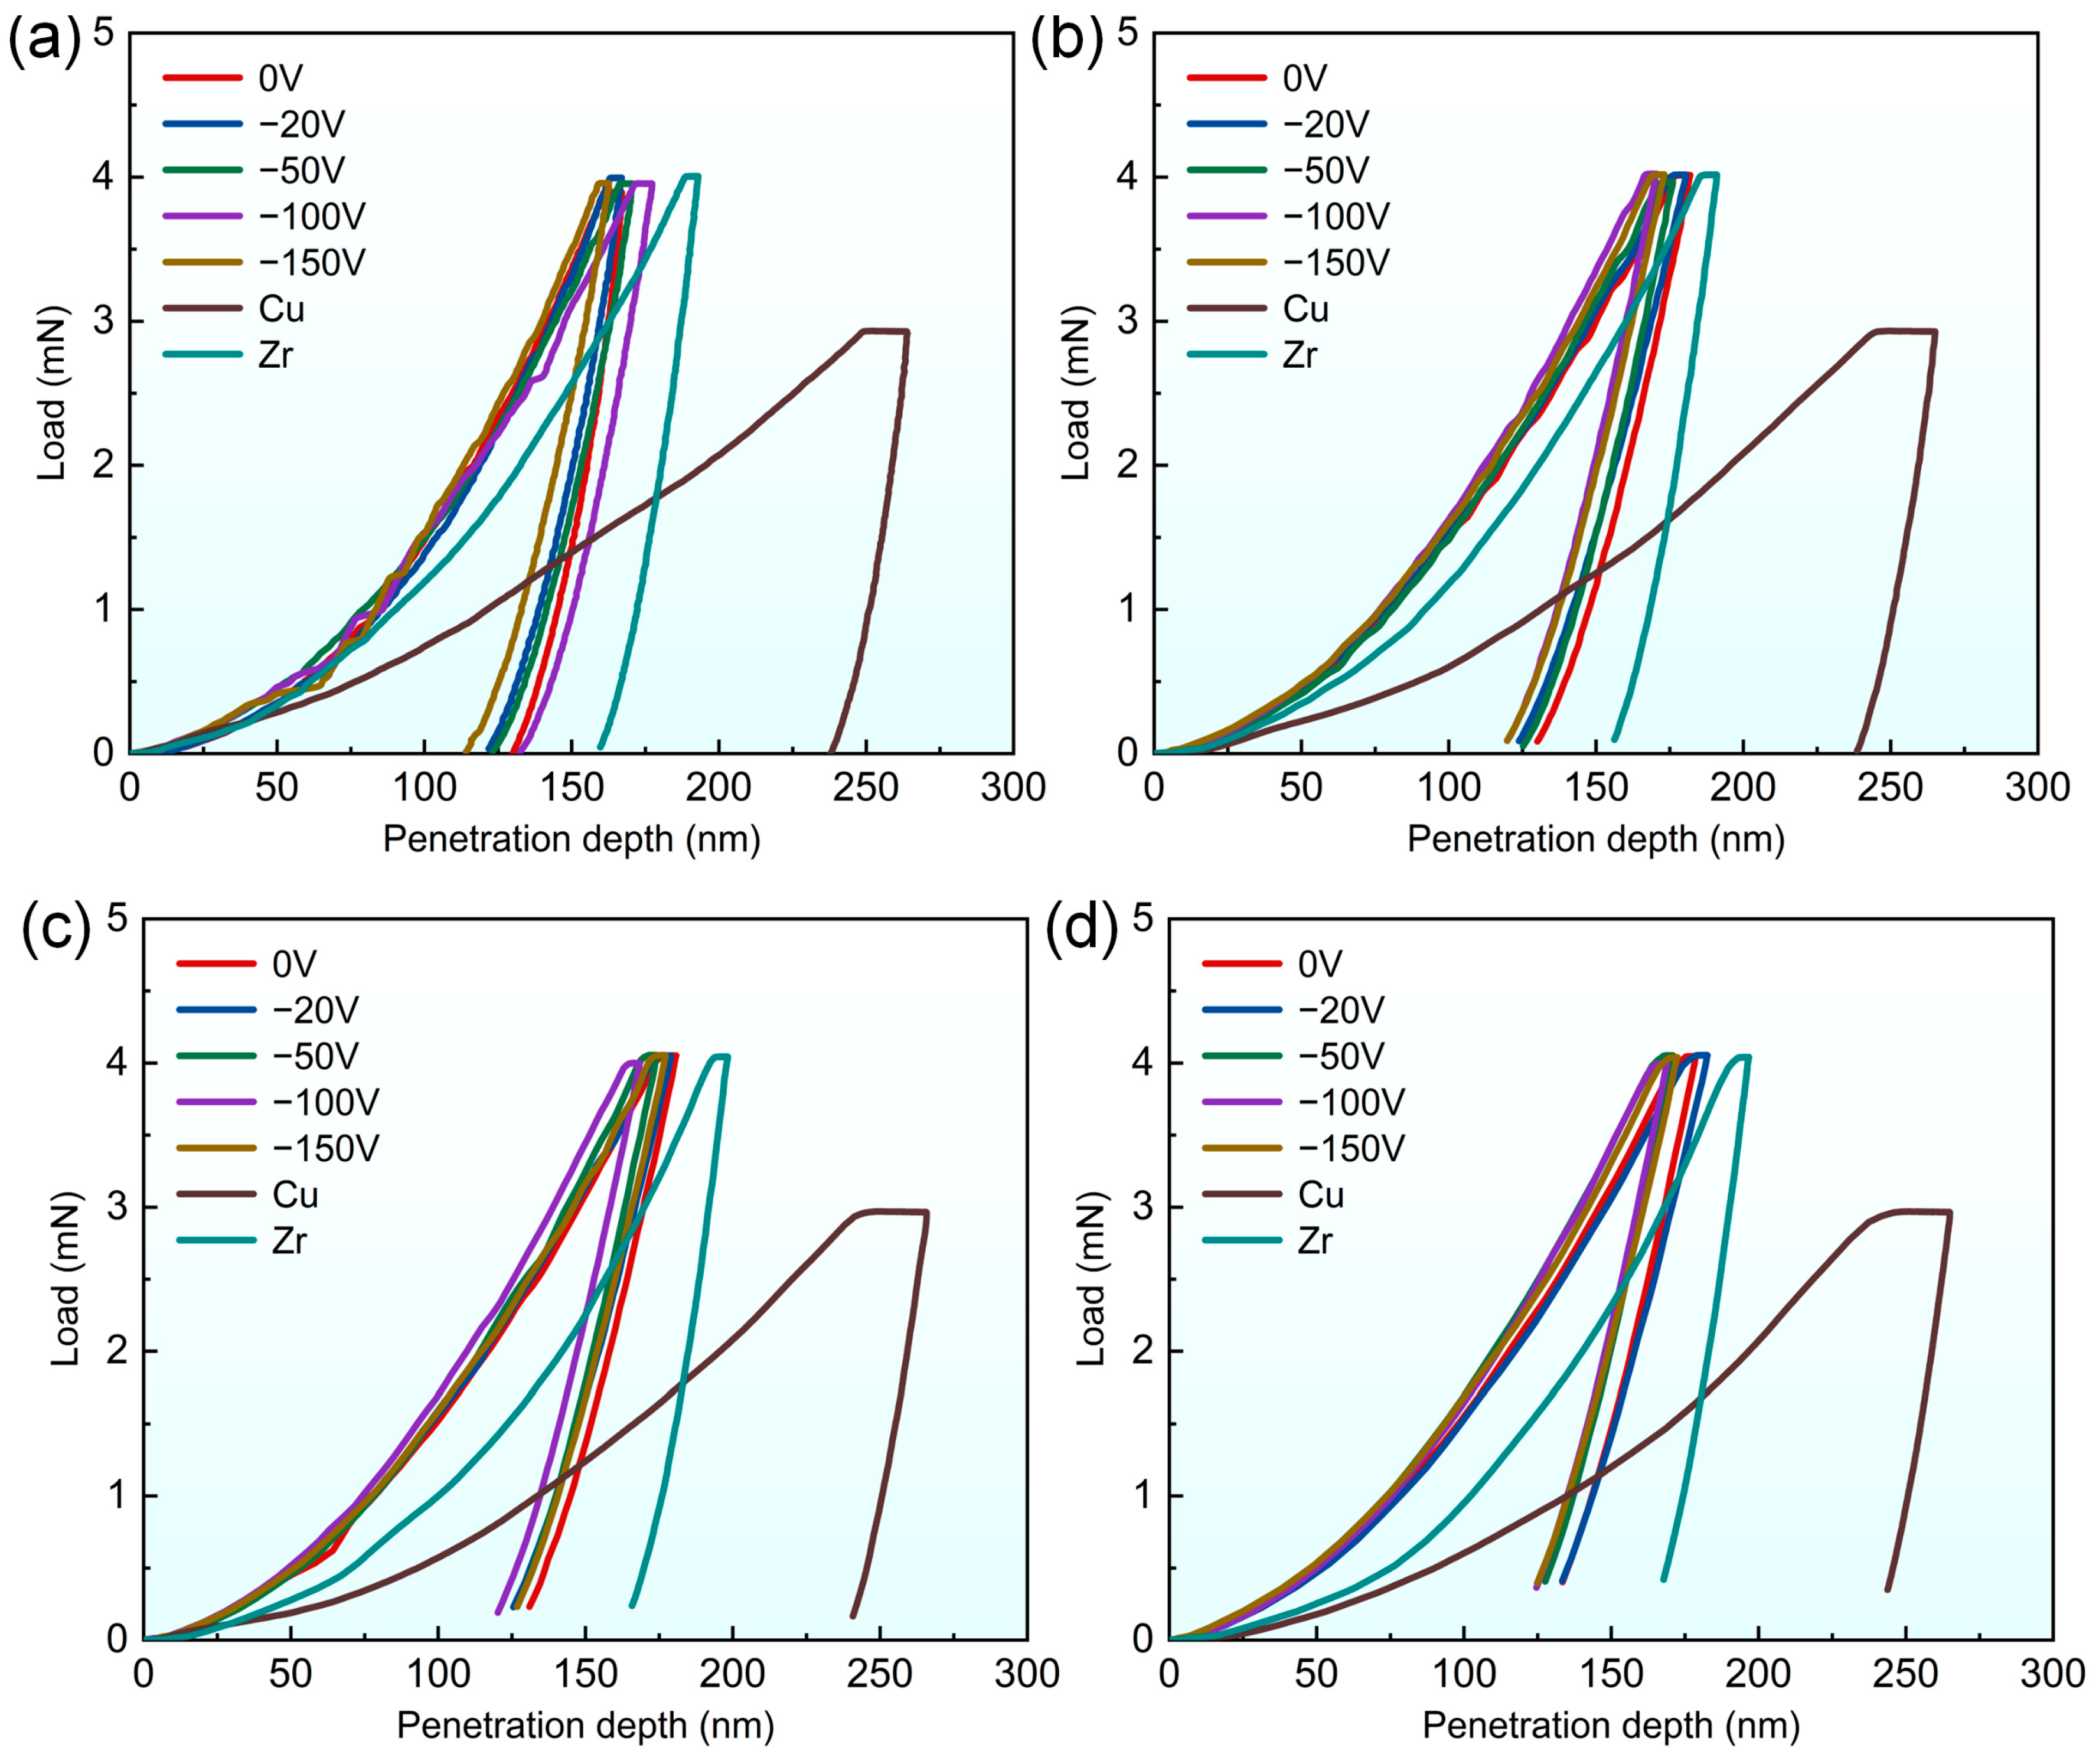
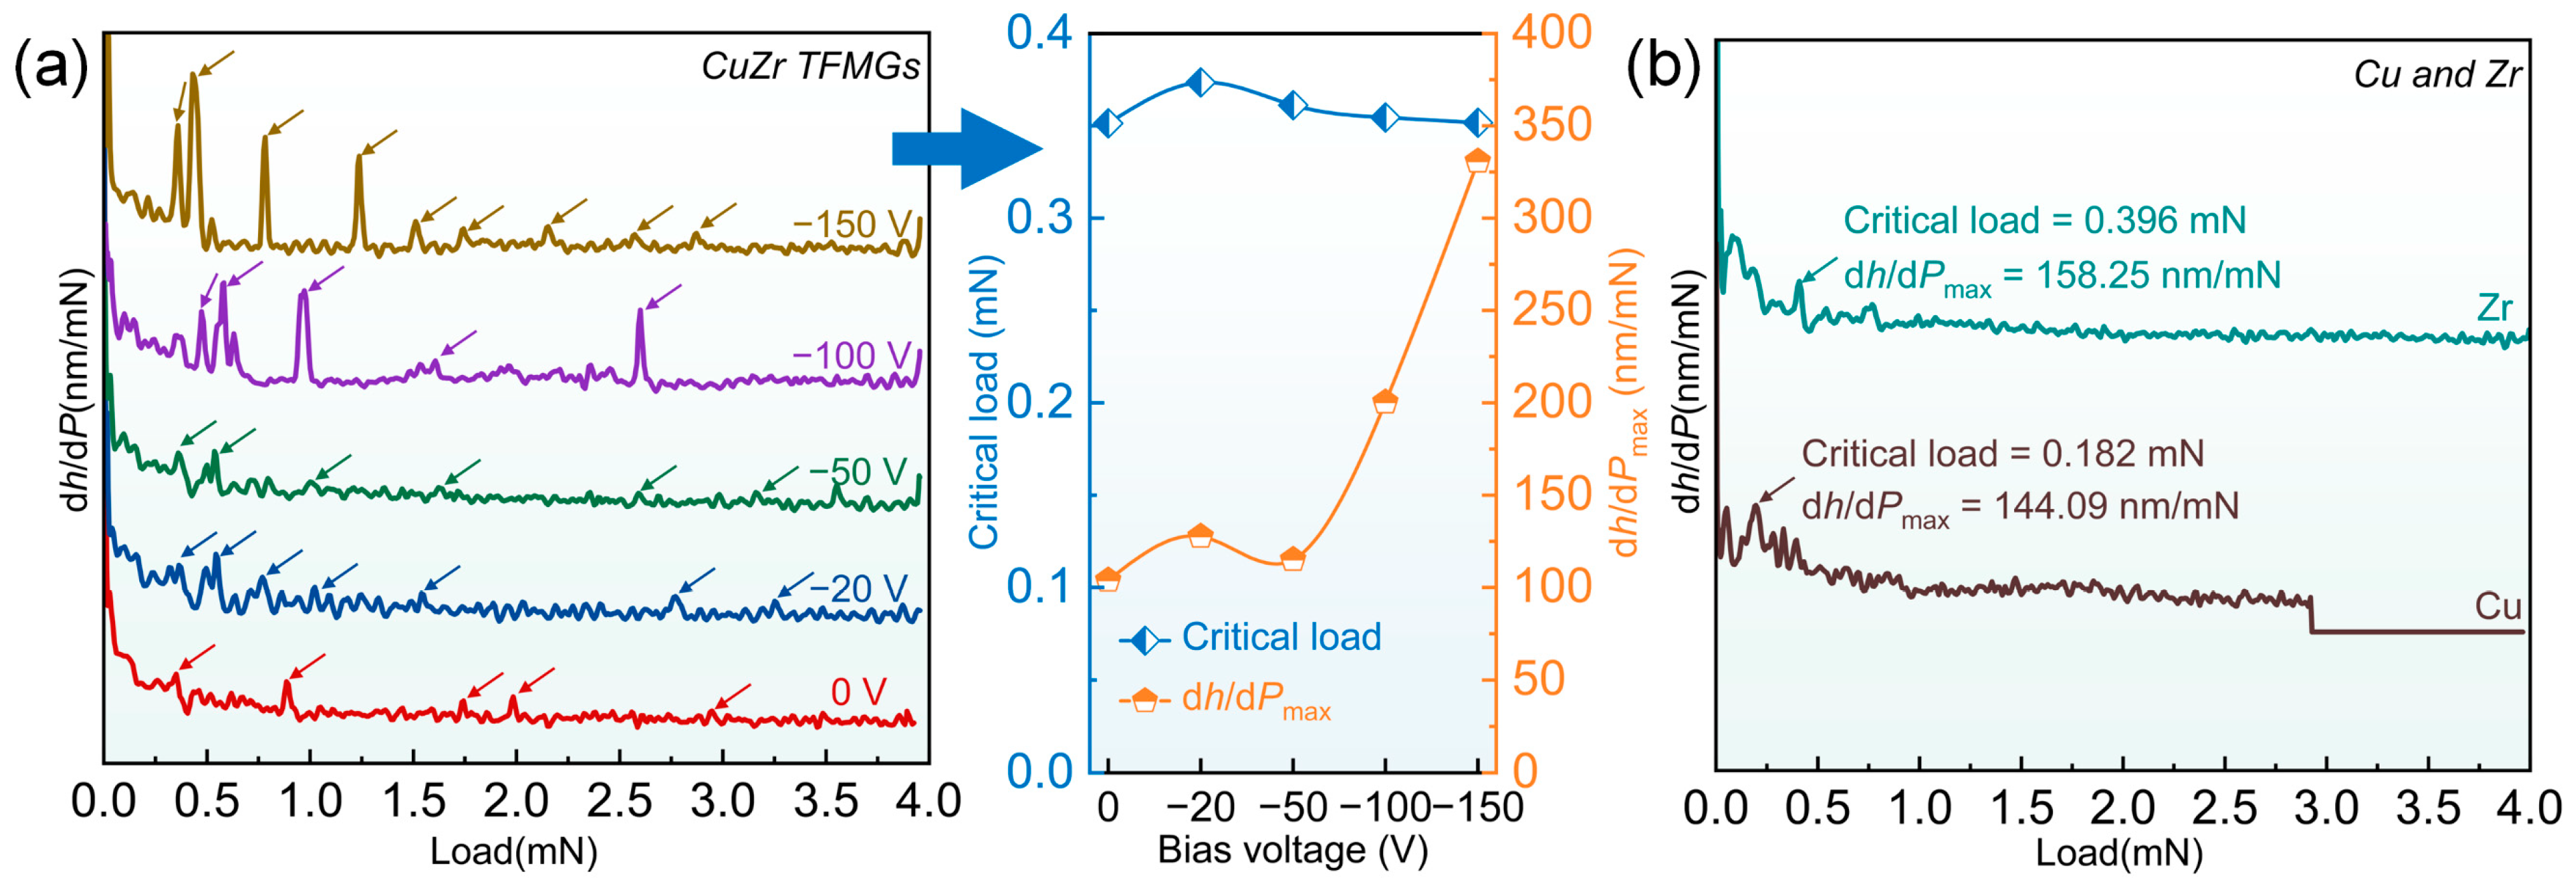
To further investigate the deformation and serrated flow behavior of films, standard nanoindentation tests were performed at loading rates of 8–100 mN/min and compared with pure Cu and Zr. The corresponding load–displacement (Ph) curves are shown in Figure 10. The overall morphology and maximum indentation depth of the same film remained similar at different loading rates, indicating that hardness was essentially independent of loading rate. The Ph curves of Cu and Zr films remained smooth at all loading rates, whereas the serrated flow of CuZr TFMGs exhibited pronounced sensitivity to loading rate changes. At a low loading rate of 8 mN/min, all curves of CuZr TFMGs showed pronounced pop-in events, characterized by sudden increases in displacement under constant load, manifested as serrated flow. Each pop-in event corresponded to the formation of an individual shear band, a phenomenon that is typically subtle and difficult to detect. Panjan [40] and Malzbender [41], respectively, obtained more precise identification of pop-in phenomena by plotting dh/dPP curves and ∂P/∂h2h2 curves. Figure 11 presents the dh/dPP curves, the critical load for the initiation of a first pop-in and the maximum of dh/dP of CuZr, Cu, and Zr films at a loading rate of 8 mN/min. The peak signals in the figure correspond to pop-in events in the Ph curves. There were only faint peaks in the dh/dP–P curves of Cu and Zr films at the beginning of the loading process, and no significant peaks were observed afterwards. For CuZr TFMGs, at the same loading rate, both the intensity and number of peaks increased with increasing bias voltage. For bias voltages of 0 V and −20 V, the peak intensity in the curves was weak, corresponding to small pop-in sizes during loading of the CuZr films, where the film cross-section exhibited a uniform glassy structure. At a −20 V bias voltage, the critical load for the initiation of the first pop-in of the CuZr film appeared later, corresponding to the critical shear stress at the onset of shear band formation. As the bias voltage increased, this value decreased, indicating that a higher negative bias voltage reduces the initial yield strength of the CuZr thin film. Notably, the dh/dPP curve for the CuZr film prepared at −50 V bias showed no obvious peaks, which also suggests a decreasing trend in the maximum dh/dP. As the bias voltage increases from −50 V to −150 V, the maximum dh/dP increases from 115.05 nm/mN to 330.76 nm/mN. This indicates that the pop-in phenomenon becomes more pronounced, reflecting a larger displacement jump during the pop-in event. This signified enhanced brittleness and reduced toughness, consistent with the smaller dimple size observed in cross-section morphologies (Figure 6). From the perspective of deformation mechanisms, at low loading rates (8 mN/min), metallic glasses can accommodate deformation through localized atomic rearrangement induced by the activation of individual shear bands, resulting in large plastic deformation and obvious pop-in phenomena. When the loading rate was increased to 50 mN/min, no significant serration was observed in CuZr films except those prepared under 0 V bias, indicating that applying a bias voltage can enhance the resistance of CuZr films to serrated flow. When the loading rate exceeded the critical value (100 mN/min), individual localized shear bands could not rapidly adapt to the applied strain, necessitating the activation of more independent shear bands. This suppressed serrated flow and resulted in smoother curves [42,43,44].
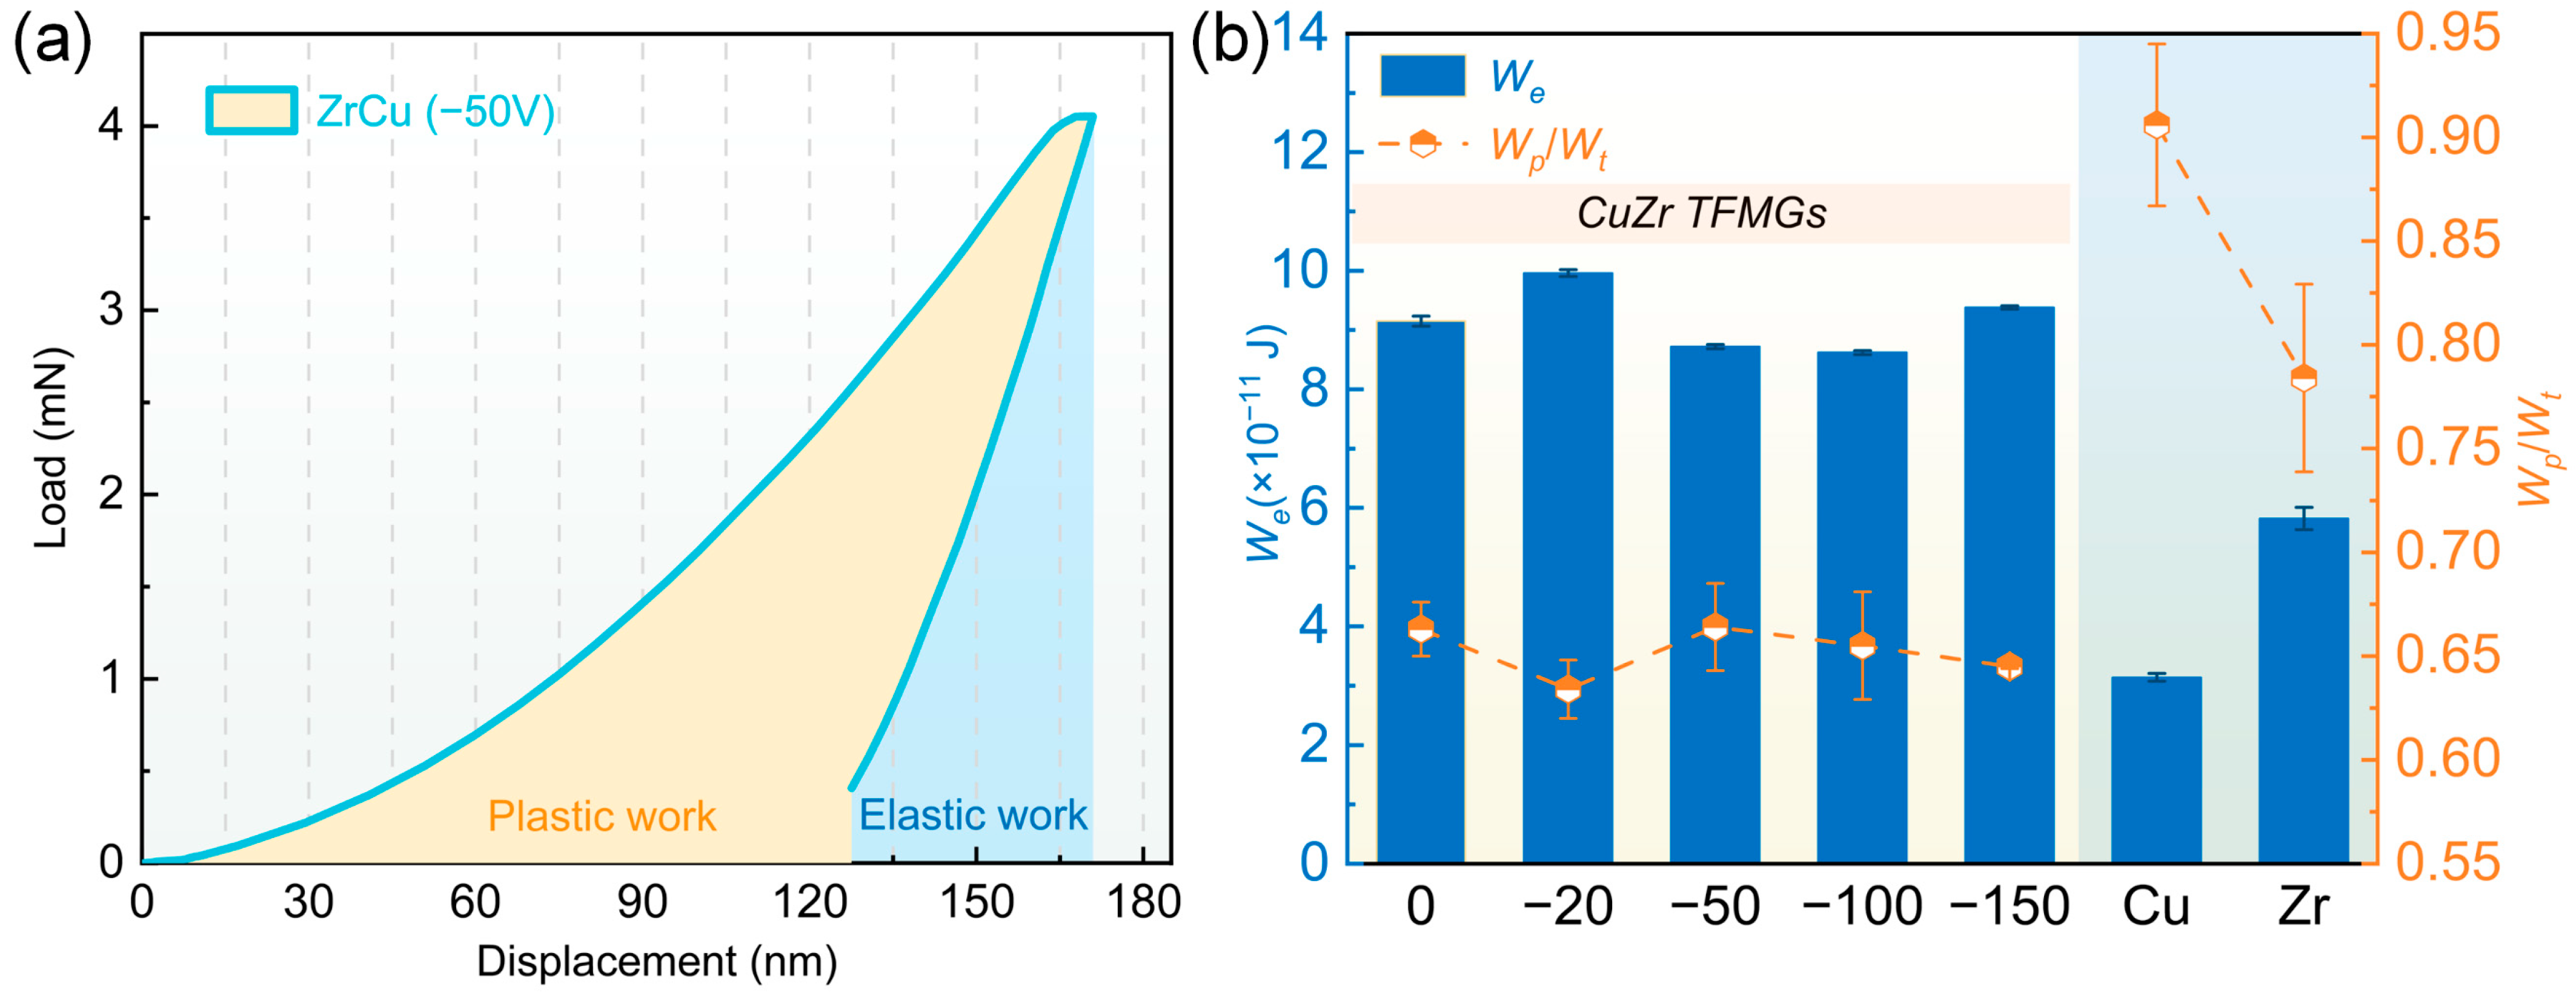
To further evaluate the toughness of the films, the elastic work (We), plastic work (Wp), and the ratio of plastic work to total work (Wp/Wt) during the loading process were calculated. Herein, plastic work corresponds to the area between the loading and unloading curves and represents the energy dissipated during microcrack initiation and propagation. Elastic work, defined as the area under the unloading curve, denotes the energy released during the unloading process (Figure 12a). The CuZr film was deposited at a bias voltage of −50 V, and the yellow and blue areas denote Wp and We, respectively. The plastic energy dissipation rate of the films can be expressed as Wp/Wt, where a higher ratio indicates better ductility of the films [45]. To avoid errors introduced by pop-in behavior, the load-displacement curves at a loading rate of 100 mN/min were investigated. Figure 12b presents the We and Wp/Wt values of the CuZr, Cu, and Zr films. It is well known that Cu possesses excellent ductility, which endows Cu films with the highest Wp/Wt values (0.906). In contrast to the pure metal films, CuZr TFMGs exhibit a pronounced tendency toward brittleness. As the applied bias voltage increased from 0 V to −150 V, the Wp/Wt ratio of the CuZr film remained between 0.634 and 0.664 under the same loading rate. Without applied bias voltage, the Wp/Wt ratio of the CuZr film reached 0.663. The ratio was the lowest at −20 V bias voltage, indicating a higher proportion of elastic deformation and relatively prominent material brittleness. At −50 V bias voltage, the Wp/Wt ratio of the CuZr film reached a maximum of 0.664, corresponding to the optimal toughness. At higher voltages, Wp/Wt decreased, reducing toughness and increasing brittleness, consistent with the smaller dimples observed in Figure 6.
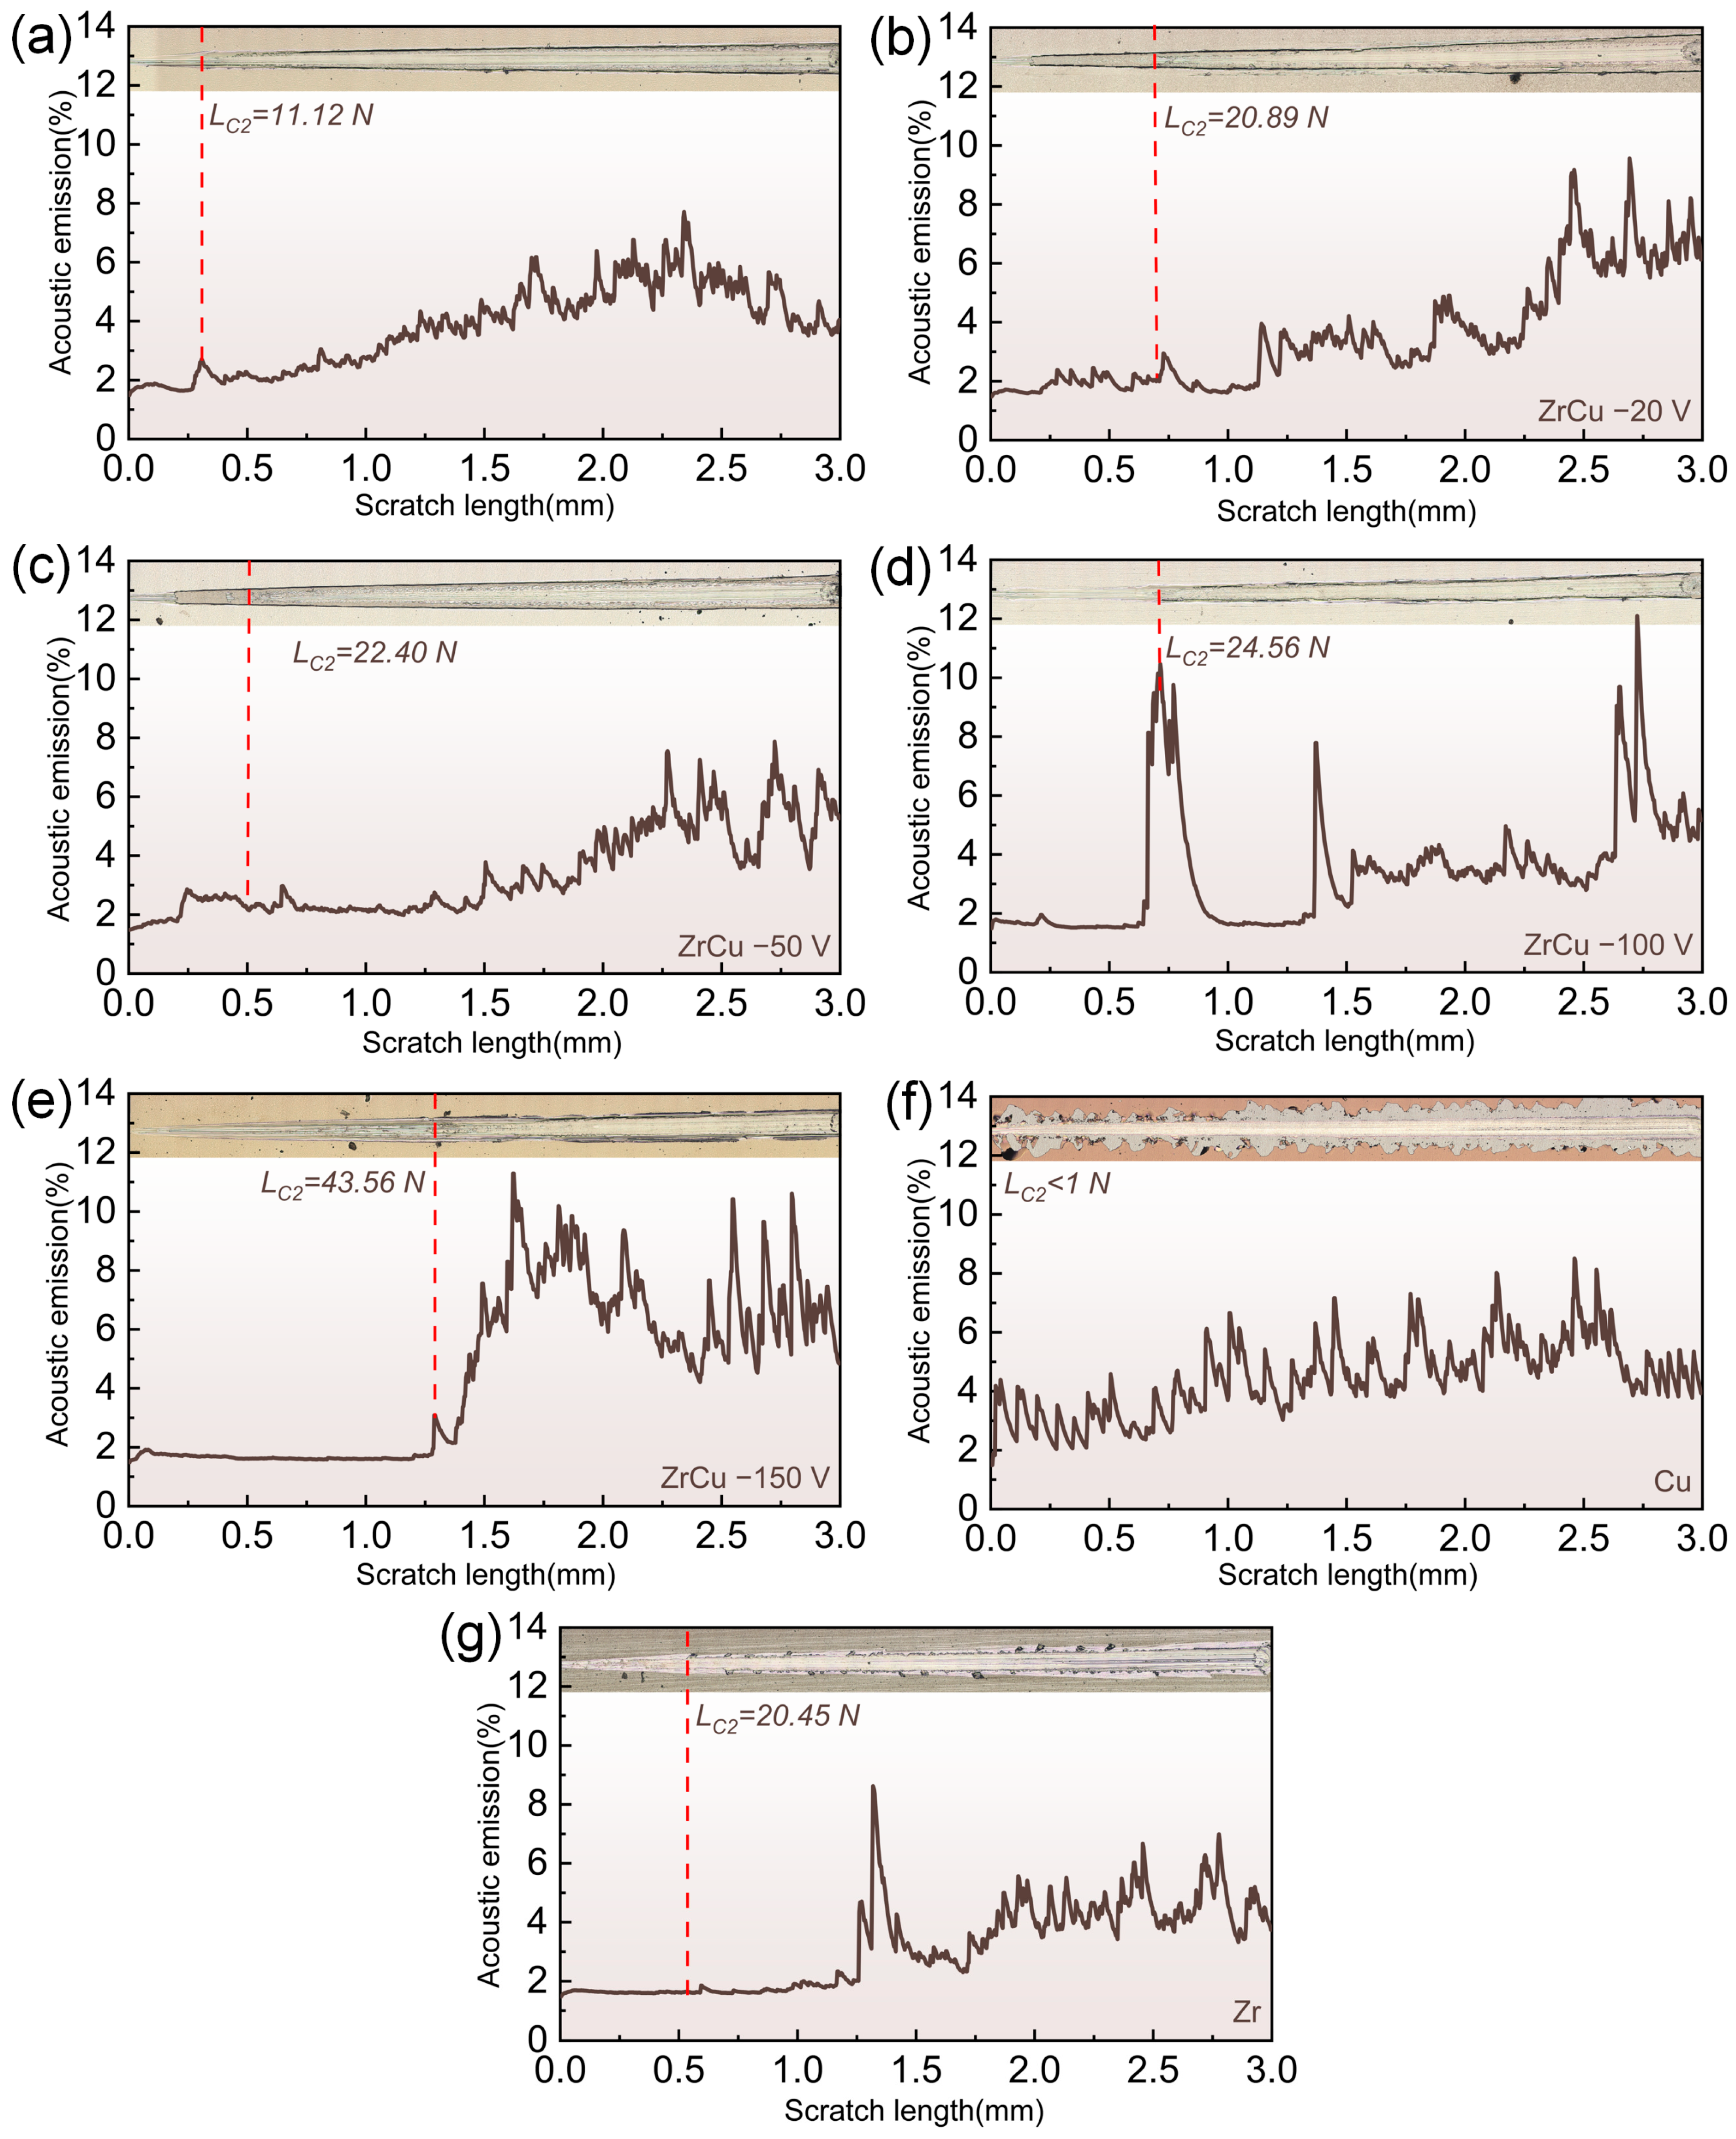
To further investigate the adhesion strength of the films, scratch tests were conducted on CuZr, Cu, and Zr films deposited on cemented carbide substrates. The dependence of scratch morphologies and acoustic emission (AE%) on scratch length is shown in Figure 13. The scratch test process of the films can generally be divided into three stages: the microcrack initiation stage (Lc1, where microcracks start to appear on the film surface), the local delamination stage (Lc2, where partial delamination and spalling of the film occur), and the complete delamination stage (Lc3, where the substrate is fully exposed). The second stage is typically defined as the indicator of film failure, with its critical load Lc2 used to characterize adhesion strength [46]. Lc2 values are marked in the figure and identified by abrupt changes in AE signals and scratch morphology. Without substrate bias, the CuZr film exhibited the poorest adhesion. As the substrate bias increased from 0 V to −150 V, the critical load of the CuZr film increased from 11.12 N to 43.56 N, and no spalling was detected in the scratch tracks. Higher bias voltages intensified ion bombardment and increased ion energy, thereby improving adhesion strength between the substrate and film [19]. Additionally, the increased bias voltage reduces film thickness due to the re-sputtering effect and lower internal stress, thereby inhibiting crack propagation and further enhancing adhesion. Cu film generated wedge-shaped cracks at the initial stage of the scratching, followed by rapid large-area film spalling and chaotic AE signals. In contrast, when the critical load of the Zr film reached 20.45 N, recovery spallation occurred at the track edge, leading to failure.
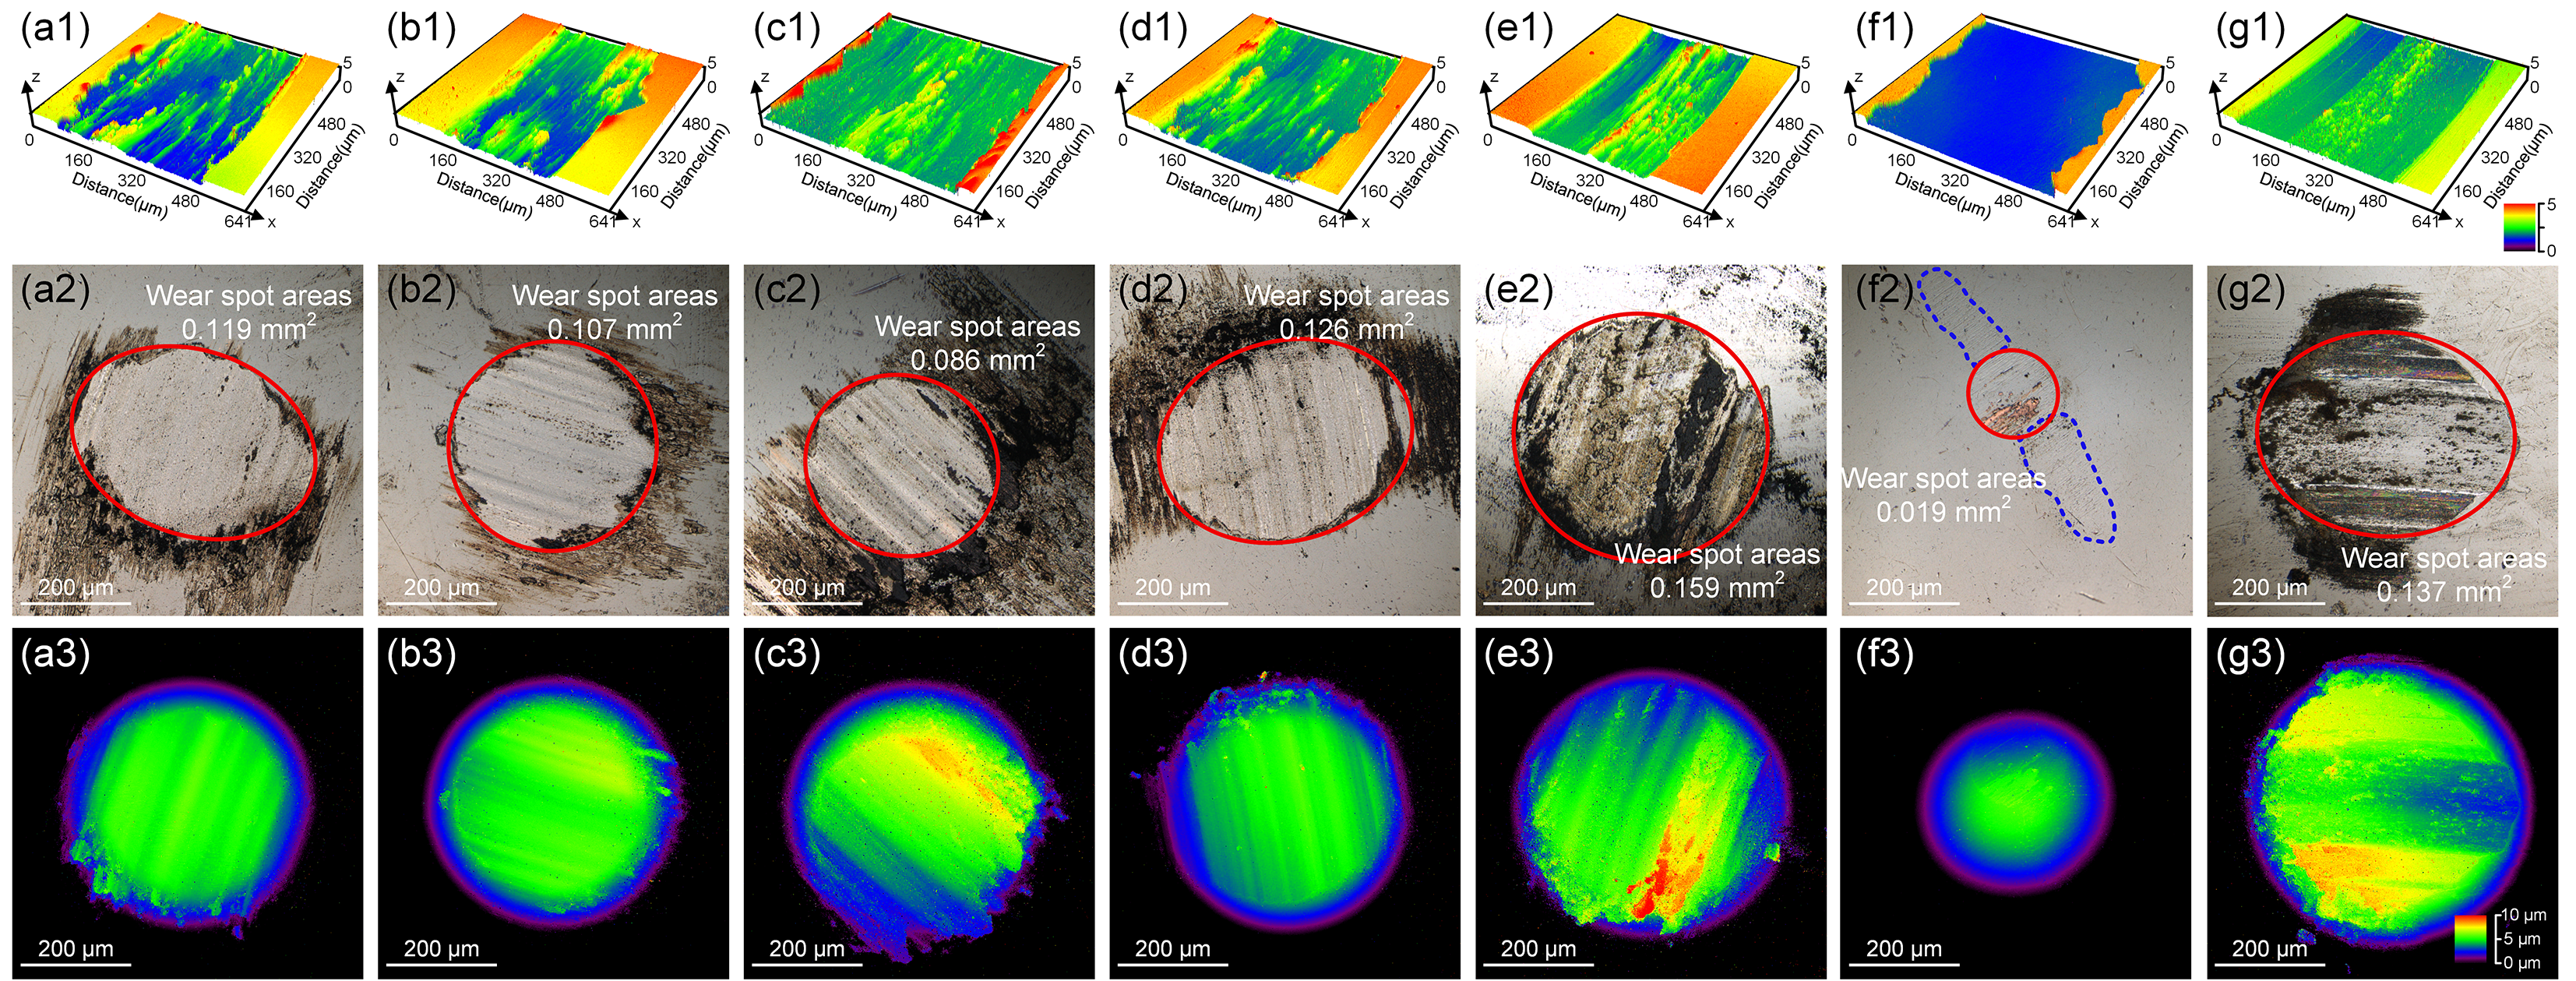
Figure 14 shows the friction coefficients and wear rates of CuZr, Cu, and Zr films. The friction coefficient is defined as the ratio of tangential friction force to normal load, which is used to quantify interfacial frictional behavior. The wear rate characterizes the volume loss of materials during friction [47,48]. Figure 15 shows the wear scar regions of the coatings and the wear scar morphologies of the GCr15 counterpart balls. Both Cu and Zr films exhibited a rapid increase in friction coefficient at the initial stage of the test, followed by stabilization. Due to the excellent lubricity of Cu, its average friction coefficient was as low as 0.46. However, owing to its low hardness and poor load-bearing capacity, it was completely worn through to the substrate under the same working conditions (Figure 15f1), rendering the wear rate data invalid. Although the corresponding GCr15 ball had the smallest wear scar area, a large amount of Cu adhered to the central region (marked by blue dashed lines), and obvious scratches were also visible on both sides of the ball surface. Combined with the large-area spallation of the Cu film at the initial stage in the scratch test (Figure 13), it can be inferred that the Cu film adhered to the counterpart ball surface at the initial friction stage. This indicates that the Cu film cannot provide effective wear protection under these friction conditions. The average friction coefficient of the Zr film was as high as 0.81, with a wear rate of 2.53 × 10⁻⁴ mm3/(N·m). The wear scar area of the Zr film exhibits a typical plow groove morphology, and the corresponding wear edge of the counterpart ball presents an irregular shape, with adhesion on both sides and depression in the middle.
The friction coefficients of CuZr films prepared under different bias voltages initially exhibited intense fluctuations. After the running-in stage, they stabilized at approximately 0.4. Subsequently, the coefficients increased slowly due to continuous wear. The average friction coefficients ranged from 0.54 to 0.57, which was 29.63–33.33% lower than that of the pure Zr film. This difference stems from the atomic disordered arrangement structure of CuZr films. Due to the lack of traditional crystal defects such as grain boundaries and dislocations, the surface exhibited local plastic deformation in the initial friction stage. This deformation arises from contact stress concentration and fluctuations caused by the existing oxide layer. However, the uniform distribution of internal atoms reduced the friction coefficient curve to ~0.4 after the initial running-in stage [44,49]. Plow grooves can be observed in the wear area of the CuZr films counterpart balls, indicating the presence of abrasive wear during friction. This is caused by the plowing and plastic extrusion deformation of the friction surface material. External hard particles or hard protrusions on the counterpart balls surface during friction, subsequently leading to wear failure. The average friction coefficient of CuZr films generally shows a trend of first decreasing, then increasing, and then decreasing again, which is opposite to the change trend of the H/E ratio and consistent with Archard theory [50]. Notably, the CuZr film prepared at −50 V had the highest H/E ratio. The counterpart ball paired with the −50 V CuZr film had the smallest wear area. However, due to the accumulation of a large amount of wear debris on both sides along the sliding direction, the wear scar widened. This results in a relatively high wear rate. Its surface also had the highest oxygen content, which caused intense initial friction fluctuations. In contrast, the surface of the counterpart ball paired with the −150 V CuZr film had an obvious transfer film, with the lowest wear rate. In conclusion, CuZr amorphous coatings significantly reduce the friction coefficient while maintaining a low wear rate, and their comprehensive performance is superior to that of pure Cu and Zr films.
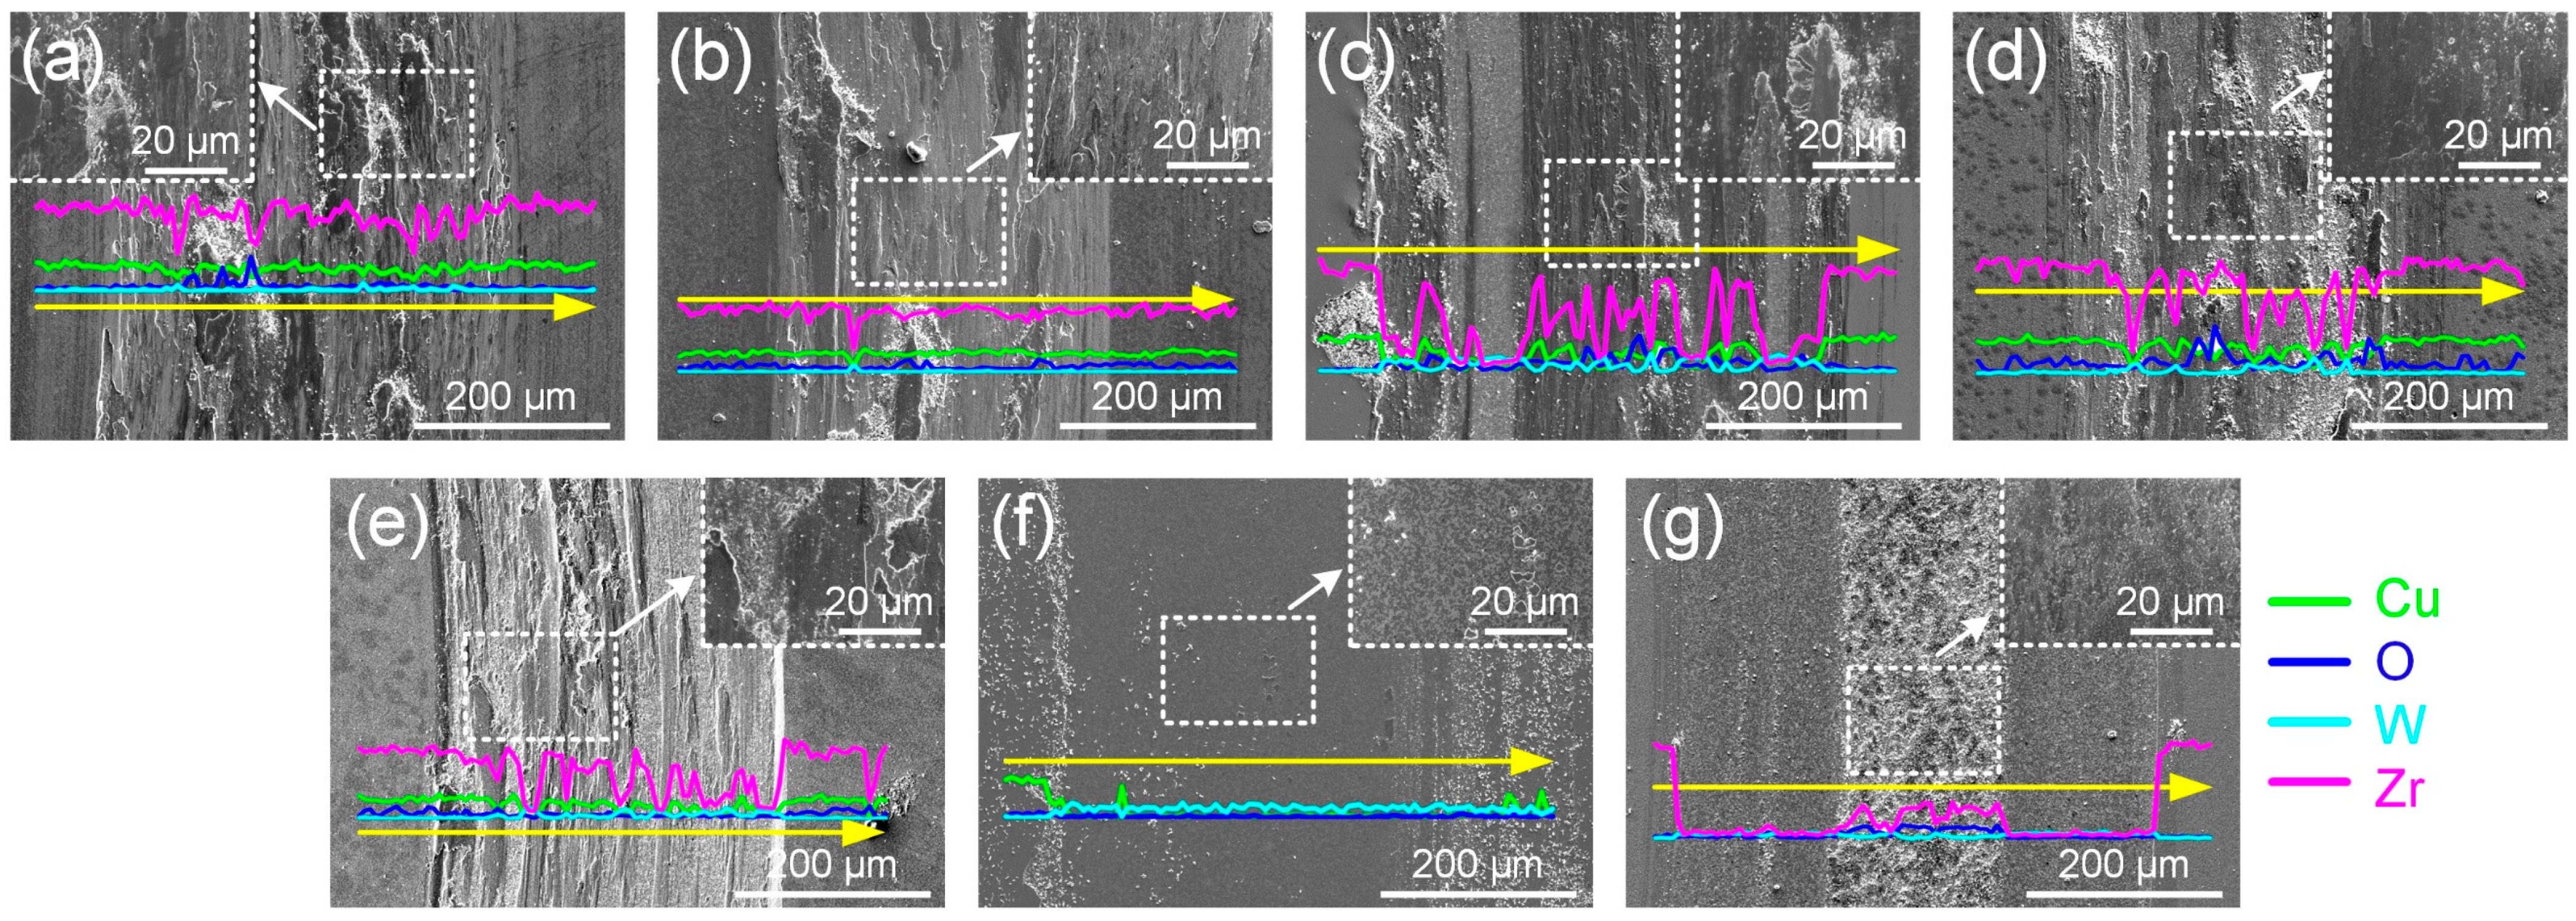
Figure 16 shows the SEM surface morphologies and EDS analysis of the wear tracks of CuZr, Cu, and Zr films after friction testing. Consistent with the morphologies in Figure 15a1–g1, the pure Cu film exhibits large-scale spalling in the wear track due to its low hardness and poor load bearing capacity. The elemental line scan results indicate that the cemented carbide substrate is completely exposed. In contrast, the Zr film experiences significant abrasive wear, leading to coating spallation on both sides. This is consistent with the irregular plowing morphology observed on the surface of the wear ball. For the CuZr film, the magnified observation of the wear tracks reveals numerous small adhered fragments, indicating the presence of adhesive wear [51]. The oxygen content in the adhered region is elevated, which may be associated with oxidation reactions [52]. At a −20 V bias, the Zr element is distributed most uniformly, and the coating shows the least wear, resulting in the lowest wear rate. At −50 V bias, the Zr distribution changes significantly, and the coating experiences more wear. At −100 V bias, dark regions appear on the surface of the CuZr thin film. Based on the changes in oxygen content, these regions are attributed to oxidation reactions.
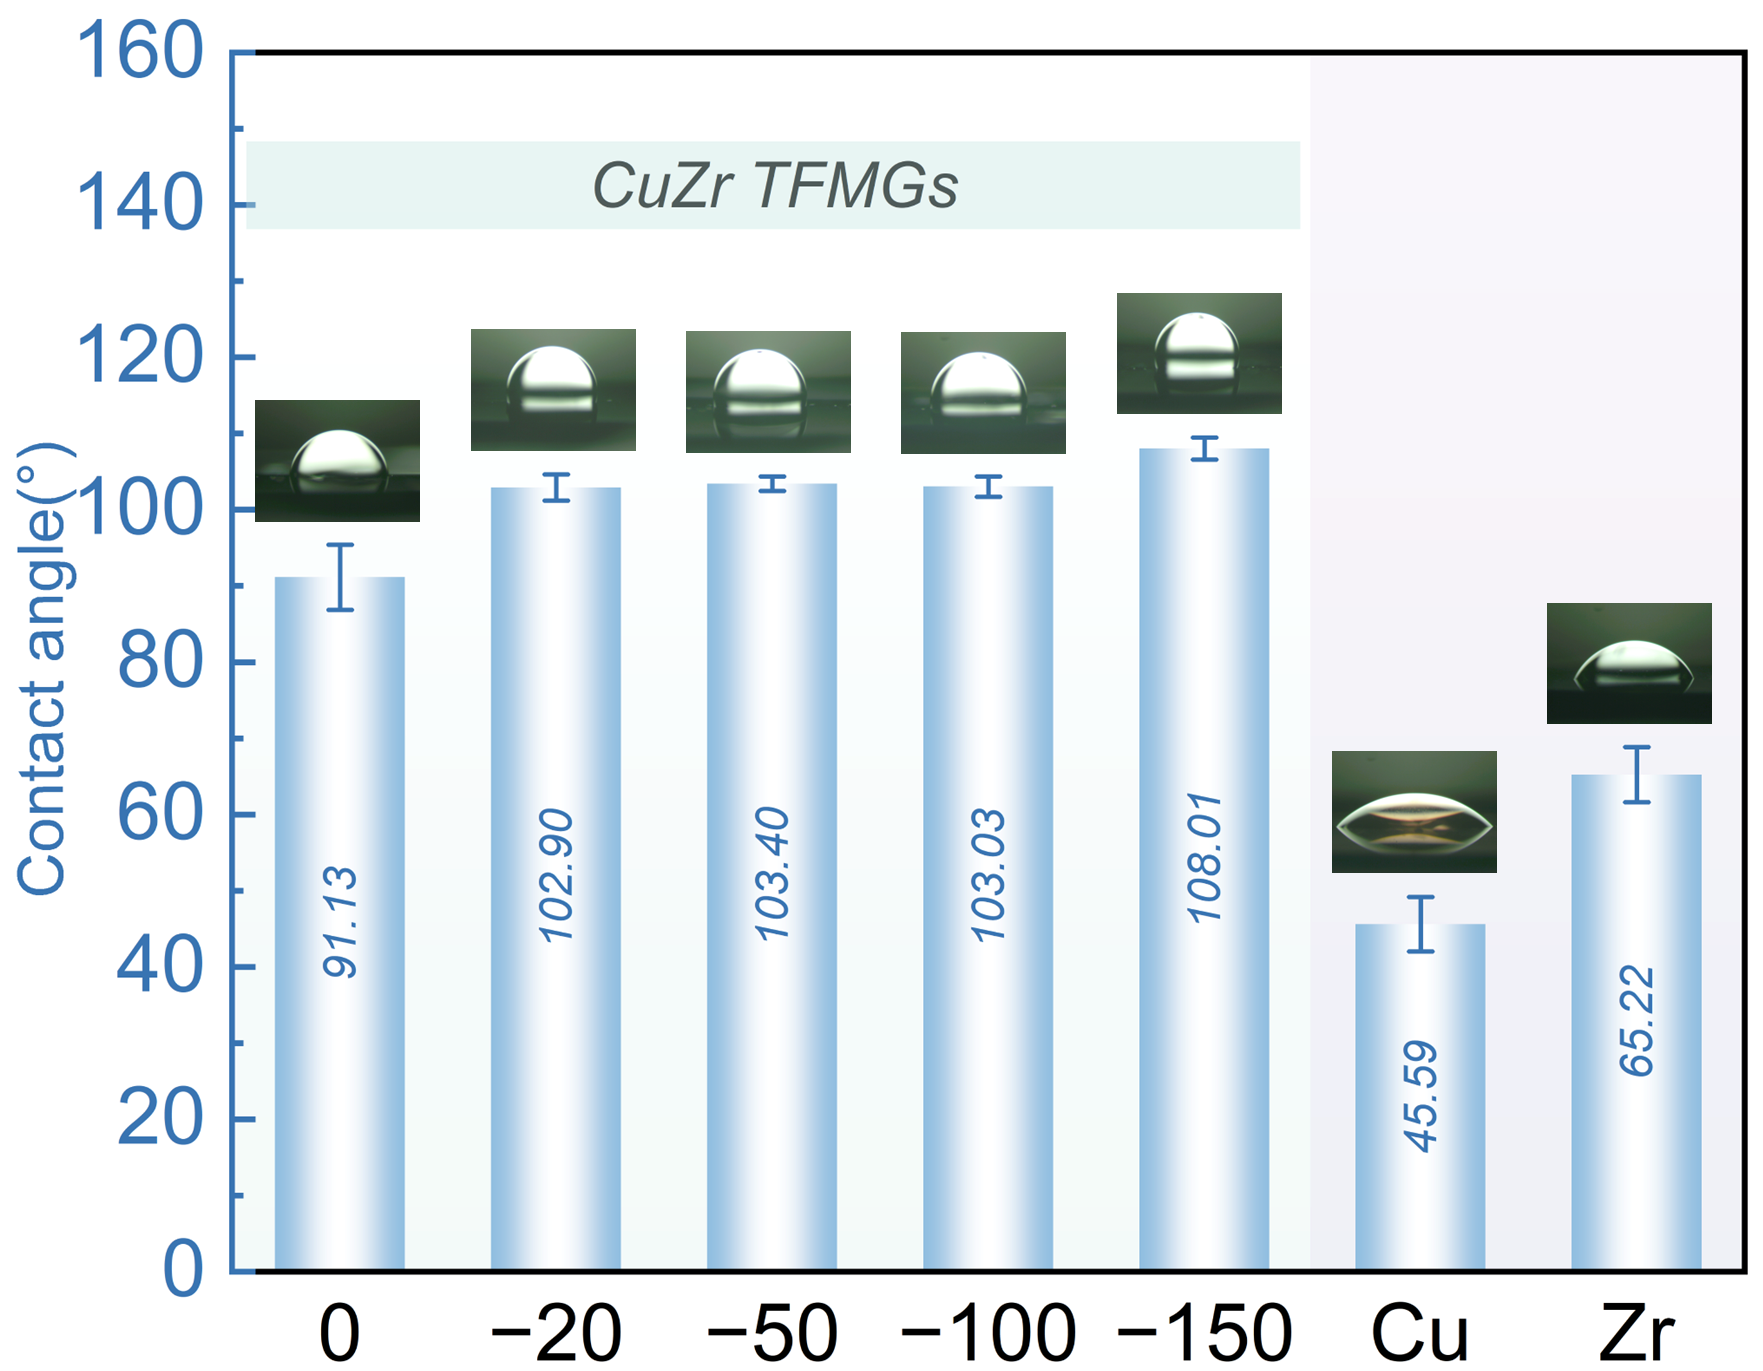
Figure 17 shows the contact angles and droplet morphologies of CuZr, Cu, and Zr films with deionized water. The results show that the contact angle of CuZr TFMGs with water all exceed 90°. As the bias voltage increases, the contact angle rises from 91.13° to 108.01°, a value significantly higher than those of Cu (contact angle = 45.59°) and Zr (contact angle = 65.22°) films. This pronounced hydrophobicity of CuZr TFMGs stems from the inherent amorphous structure of TFMGs, which yields exceptional surface smoothness [12,53,54]. Additionally, Table 1 indicates that the CuZr film surface contains 4.77–6.08 at.% oxygen. This oxygen is likely to exist in the form of surface oxides. Defects on the oxide surface, such as oxygen vacancies or hydroxyl groups, may adsorb hydrocarbons from the air. This adsorption significantly reduces the surface energy. The formation of oxides may also be accompanied by the release or transformation of lattice oxygen. This process reduces the ability of polar groups to form hydrogen bonds with water molecules. Consequently, the number of hydrophilic groups decreases, leading to a hydrophobic surface with an increased contact angle [55,56]. The contact angle increased monotonically with increasing bias voltage. This is due to the critical role of atomic mobility in surface energy during CuZr deposition. Higher bias voltage enhances bombardment energy, promoting atomic migration and rearrangement. This elevates atomic mobility, enabling the film surface to more readily reach a low-energy stable state, thereby reducing surface energy. According to Young’s equation (Equation (4) [57]), which describes the equilibrium relationship among solid–gas, liquid–solid, and liquid–gas interfacial tensions, lower surface energy corresponds to a larger contact angle. Therefore, CuZr TFMGs exhibit more pronounced hydrophobic characteristics as the bias voltage increases.
γsg = γlgcosθ + γsl
where γsg, γsl, and γlg denote the interfacial energies of the solid–gas, liquid–solid, and liquid–gas interfaces, respectively; θ is the contact angle between the film and the liquid.
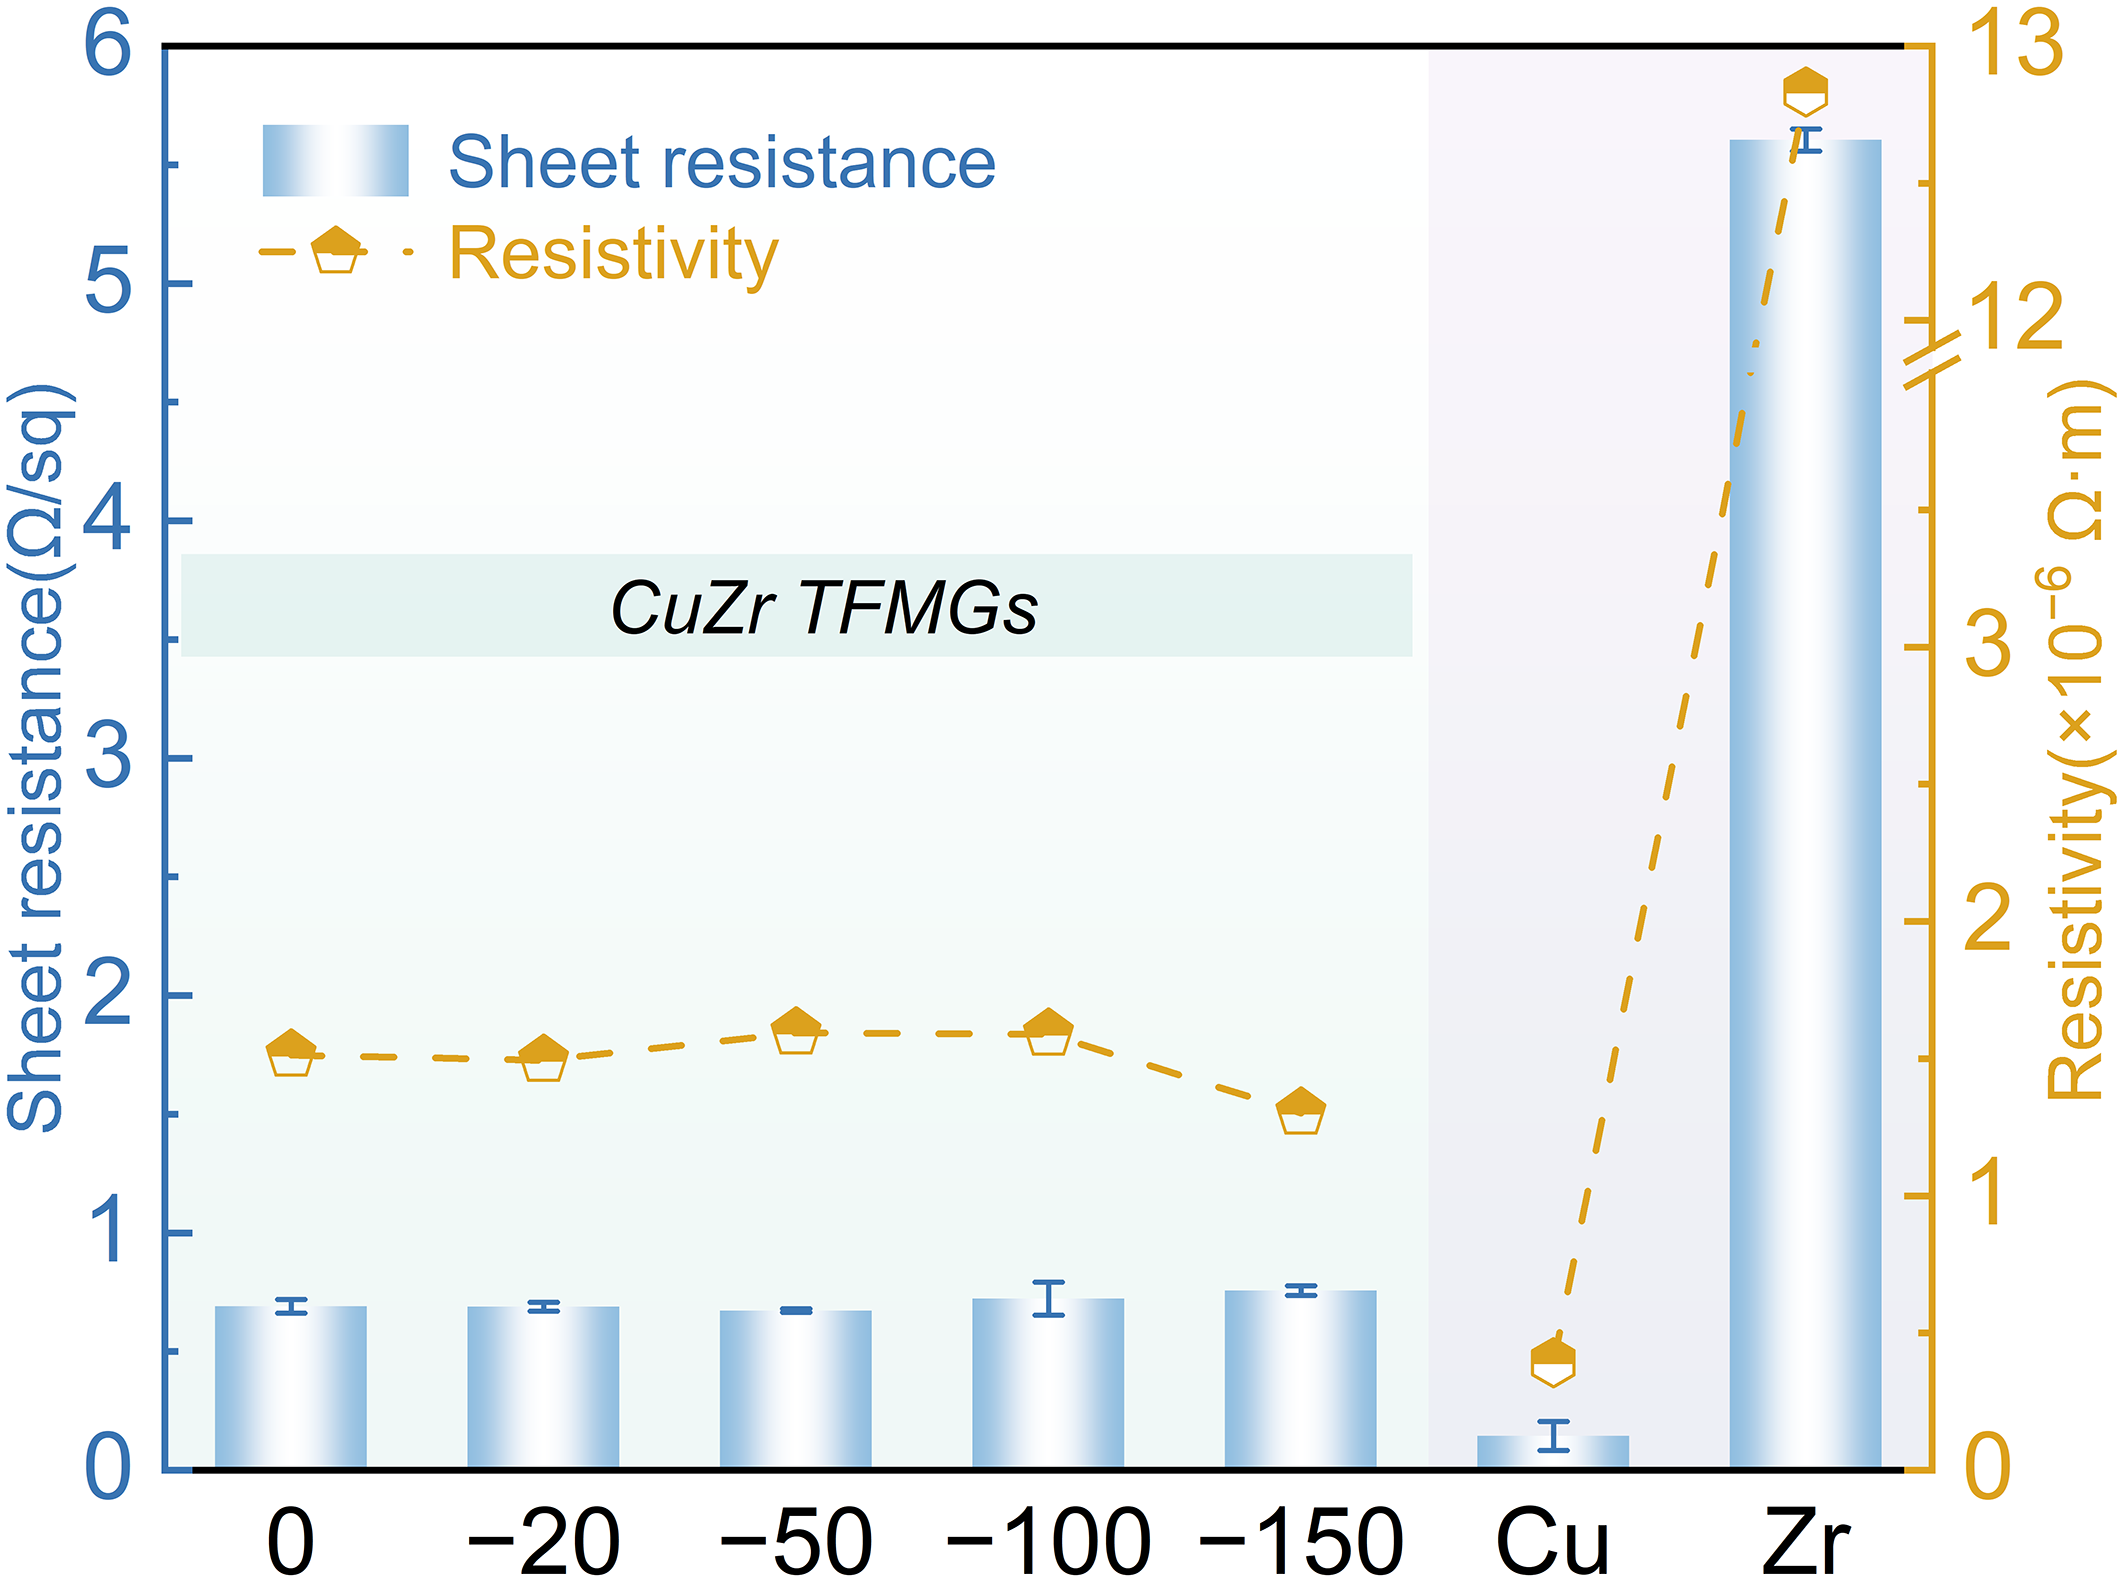
Figure 18 shows the sheet resistance and resistivity of the CuZr, Cu, and Zr films. The results indicate that the Zr film exhibits relatively high sheet resistance and resistivity (1.28 × 10⁻⁵ Ω·m). This value significantly exceeds that of bulk Zr metal (~4.2 × 10⁻⁷ Ω·m). This suggests that the electrical conductivity of Zr films prepared by PVD is weaker than that of bulk Zr metal. This discrepancy is attributed to the presence of crystalline defects such as vacancies and grain boundaries in the PVD-Zr films. These defects act as scattering centers for electron conduction, leading to increased resistivity. The resistivity of thin film generally consists of three components, as shown in Equation (5) [58,59]. In addition to bulk resistivity, contributions also come from surface scattering and grain boundary scattering. According to the Fuchs–Sondheimer (F-S) model [60] of electron surface scattering, when the film thickness dλ (λ denotes the electron mean free path), electron scattering at the surface and substrate interface can be neglected. In this case, resistivity is primarily contributed by the Mayadas–Shatzkes (M-S) model [61] of electron grain boundary scattering. For bulk metals, grain sizes far exceed the mean free path, so grain boundaries have little effect on resistivity. However, in thin films, when the grain boundary spacing is comparable to the electron mean free path, the effect of grain boundary scattering cannot be ignored. The Cu film demonstrates the lowest resistivity (3.92 × 10⁻⁷ Ω·m), which is closely related to its inherently excellent electrical conductivity. At room temperature, the resistivity of bulk Cu metal is approximately 1.7 × 10⁻⁸ Ω·m. The resistivity of Cu film shows a relatively small discrepancy compared to that of bulk Cu. The electron mean free path of Cu at room temperature is approximately 40 nm [62], while the film thickness is about 70 times. Thus, the contribution of surface scattering to resistivity can be ignored. Combining the surface and cross-sectional morphologies of the film, the Cu film has larger grain sizes and a significantly reduced number of grain boundaries. These characteristics weaken the contribution of grain boundary scattering to resistivity, ultimately making the resistivity closer to that of bulk Cu.
ρ = ρ o + ρ o λ   3 ( 1 p ) 4 d + ρ o λ   3 R 2 D ( 1 R )
where ρ is the resistivity of the film, ρo is the bulk resistivity of the material, p is the surface scattering specularity, d is the film thickness, R is the grain boundary reflection, and D is the size of the grain boundary.
For CuZr films, the resistivity (1.30 × 10⁻⁶ Ω·m~1.59 × 10⁻⁶ Ω·m) lies between those of Zr and Cu films, decreasing by an order of magnitude compared to Zr film. This is attributed to the absence of defects such as grain boundaries in amorphous films, which eliminates the effect of grain boundary scattering. Additionally, the resistivity of CuZr films is primarily dependent on the Cu content, which enhances the electrical conductivity. Within the bias voltage range of 0 V to −100 V, as the bias voltage increases, the resistivity of CuZr films remains virtually constant. However, when the bias voltage was further increased to −150 V, a slight decrease in resistivity was observed. This phenomenon can be attributed to the increased density of the films at high bias voltage. Notably, the sheet resistance of CuZr films also showed no significant difference. In contrast, a marginal increase was observed at −150 V bias voltage. According to Equation (3), this increase may be due to fluctuations in film thickness caused by re-sputtering, leading to an increase in sheet resistance.

4. Conclusions and Perspectives

In summary, CuZr TFMGs were deposited at room temperature using the MFMS technique. The effects of bias voltage on the microstructure, mechanical, tribological properties, electrical conductivity, and hydrophobicity of the films were investigated and compared with those of pure Cu and Zr films. The conclusions are as follows:
(1)
The CuZr films exhibited an amorphous structure with nanoscale smoothness. The cross-sectional morphology of the CuZr films transitioned from a glassy morphology to a vein-like structure as the bias voltage increased, whereas the Cu and Zr films displayed columnar crystal structures. This is closely related to the oxygen content.
(2)
Nanoindentation tests revealed that the hardness of the CuZr films peaked at −50 V, with a maximum hardness of 9.64 GPa and a H/E ratio of 0.07. As the loading rate increased, the pop-in phenomenon gradually disappeared. The deformation mode during indentation transitioned from inhomogeneous shear band deformation to homogeneous deformation. The critical load of CuZr films increased from 11.12 N to 43.56 N with increasing bias voltage during scratch tests.
(3)
The Zr film exhibited an average friction coefficient as high as 0.81. In contrast, the CuZr films, while maintaining a low wear rate, showed a reduced average friction coefficient of 0.54−0.57, corresponding to a decrease of 29.63−33.33% compared with the Zr film.
(4)
The CuZr TFMGs exhibited a low sheet resistance ranging from 0.67 to 0.76 Ω, and a maximum contact angle of 108°, whereas the contact angles of Cu and Zr films were 46° and 65°, respectively.
(5)
The subsequent study will focus on investigating the thermal stability and oxidation resistance of CuZr TFMGs under high-temperature and high-humidity conditions. Comparisons with commercial coatings will be conducted to assess wear resistance, corrosion resistance, and other properties. This will help clarify the practical application potential of the films, thereby strengthening the theoretical basis as protective coatings.

Author Contributions

R.Z.—original draft, writing; K.Y.—Visualization, Methodology; Z.G.—Review and editing, Investigation; H.W.—Conceptualization, Investigation; Q.W.—Review and editing, Funding acquisition, Conceptualization. All authors have read and agreed to the published version of the manuscript.

Funding

This work was financially supported by the National Natural Science Foundation of China (52401083, 52375173) and the Guangdong Basic and Applied Basic Research Foundation (2023B151520033).

Data Availability Statement

The data used to support the findings of this study are available from the corresponding author upon request.

Conflicts of Interest

Author Zecui Gao was employed by Plansee (Shanghai) High Performance Material Ltd. The remaining authors declare that the research was conducted in the absence of any commercial or financial relationships that could be construed as a potential conflict of interest.

References

  1. Nayak, S.K.; Kumar, A.; Laha, T. Fe-based metallic glass coatings by thermal spraying: A focused review on corrosion properties and related degradation mechanisms. Int. Mater. Rev. 2023, 68, 404–485. [Google Scholar] [CrossRef]
  2. Jiang, H.; Shang, T.; Xian, H.; Sun, B.; Zhang, Q.; Yu, Q.; Bai, H.; Gu, L.; Wang, W. Structures and functional properties of amorphous alloys. Small Struct. 2020, 2, 2000057. [Google Scholar] [CrossRef]
  3. Yuan, J.; Song, P.; Li, X.; Zhang, Z.; Jing, Z.; Man, C.; Jin, G.; Wang, X.; Liang, X. Multiphase coupling corrosion mechanism of the AlNiZrYCo high-entropy metallic glass coating prepared by plasma spraying. Corros. Sci. 2024, 235, 112217. [Google Scholar] [CrossRef]
  4. Parau, A.C.; Juravlea, G.A.; Raczkowska, J.; Vitelaru, C.; Dinu, M.; Awsiuk, K.; Vranceanu, D.M.; Ungureanu, E.; Cotrut, C.M.; Vladescu, A. Comparison of 316L and Ti6Al4V biomaterial coated by ZrCu-based thin films metallic glasses: Structure, morphology, wettability, protein adsorption, corrosion resistance, biomineralization. Appl. Surf. Sci. 2023, 612, 155800. [Google Scholar] [CrossRef]
  5. Sathish, M.; Radhika, N.; Saleh, B. Current status, challenges, and future prospects of thin film coating techniques and coating structures. J. Bio-Tribo-Corros. 2023, 9, 35. [Google Scholar] [CrossRef]
  6. Szczepański, Ł.; Bambach, M.; Jensch, F.; Ambroziak, A.; Kurzynowski, T. Structural investigations of Fe-Zr-Si-Cu metallic glass with low glass-forming ability produced in laser powder bed fusion technology. Mater. Des. 2021, 210, 110112. [Google Scholar] [CrossRef]
  7. Comby-Dassonneville, S.; Roiban, L.; Borroto, A.; Malchère, A.; Cardinal, S.; Douillard, T.; Langlois, C.; Pierson, J.F.; Pelletier, J.M.; Steyer, P. Better understand the crystallization dynamics of ZrCu TFMGs: Benefits of combining global and local in situ approaches. J. Alloys Compd. 2024, 987, 174233. [Google Scholar] [CrossRef]
  8. Zhang, E.; Wang, Y.; Liang, D.; Wei, X.; Zhou, Y.; Chen, Q.; Zhou, Q.; Huang, B.; Shen, J. Superior corrosion-resistant Zr-Ti-Ag thin film metallic glasses as potential biomaterials. Appl. Surf. Sci. 2024, 670, 160712. [Google Scholar] [CrossRef]
  9. Chen, P.; You, J.; Hsueh, C. Tungsten-based thin film metallic glass as diffusion barrier between copper and silicon. Vacuum 2025, 233, 113975. [Google Scholar] [CrossRef]
  10. Onyeagba, C.R.; Valashani, M.; Wang, H.; Brown, C.; Yarlagadda, P.; Tesfamichael, T. Nanomechanical surface properties of co-sputtered thin film polymorphic metallic glasses based on Ti-Fe-Cu, Zr-Fe-Al, and Zr-W-Cu. Surf. Interfaces 2023, 40, 103090. [Google Scholar] [CrossRef]
  11. Brognara, A.; Best, J.P.; Djemia, P.; Faurie, D.; Dehm, G.; Ghidelli, M. Effect of composition and nanostructure on the mechanical properties and thermal stability of Zr100-xCux thin film metallic glasses. Mater. Des. 2022, 219, 110752. [Google Scholar] [CrossRef]
  12. Wang, W.; Gao, Y.; Song, Y.; Huang, M.; Lv, J.; Zhang, G.; Liu, L.; Zhao, Y.; Zhao, X.; Sun, Q. Optimizing the structure-property relationship of sputtered CuZr metallic glasses via film thickness. J. Alloys Compd. 2025, 1014, 178857. [Google Scholar] [CrossRef]
  13. Zhao, L.; Hu, L.; Lin, B.; Wang, Y.; Tang, J.; Qi, L.; Liu, X. Significant improvement of corrosion resistance in laser cladded Zr-based metallic glass matrix composite coatings by laser remelting. Corros. Sci. 2024, 238, 112360. [Google Scholar] [CrossRef]
  14. Wang, Q.; Lian, X.; Cui, H.; Li, H.; Song, X.; Jiang, D.; Zhang, Y.; Zhu, Y.; Zhao, X.; Pang, Y. Design of amorphous-nanocrystalline films of TiAlCrNbZrx multi-component alloy: The effect of Zr on the corrosion resistance and mechanical properties. Vacuum 2023, 216, 112450. [Google Scholar] [CrossRef]
  15. Behrangi, S.; Souček, P.; Buršíková, V.; Fekete, M.; Vašina, P. Influence of bias voltage on the microstructure and mechanical properties of TiZrN coatings prepared by reactive magnetron sputtering in industrial conditions. Surf. Coat. Technol. 2025, 511, 132240. [Google Scholar] [CrossRef]
  16. Mirzaei, S.; Alishahi, M.; Souček, P.; Buršíková, V.; Zábranský, L.; Gröner, L.; Burmeister, F.; Blug, B.; Daum, P.; Mikšová, R.; et al. Effect of substrate bias voltage on the composition, microstructure and mechanical properties of W-B-C coatings. Appl. Surf. Sci. 2020, 528, 146966. [Google Scholar] [CrossRef]
  17. Warcholinski, B.; Gilewicz, A.; Myslinski, P.; Dobruchowska, E.; Murzynski, D.; Kochmanski, P.; Rokosz, K.; Raaen, S. Effect of nitrogen pressure and substrate bias voltage on the properties of Al–Cr–B–N coatings deposited using cathodic arc evaporation. Tribol. Int. 2021, 154, 106744. [Google Scholar] [CrossRef]
  18. Zeng, X.K.; Li, Y.T.; Zhang, X.D.; Liu, M.; Ye, J.Z.; Qiu, X.L.; Jiang, X.; Leng, Y.X. Effect of bias voltage on the structure and properties of CuNiTiNbCr dual-phase high entropy alloy films. J. Alloys Compd. 2023, 931, 167371. [Google Scholar] [CrossRef]
  19. Zhou, G.; Tang, H.; Zhang, R.; Zhang, X.; Qian, M. High strain rate sensitivity and nanoscratch properties of the nano-sized crystalline/amorphous Ti-Zr-Hf-Co-Ni-Cu high-entropy metallic glass thin film fabricated by magnetron sputtering. Intermetallics 2025, 184, 108857. [Google Scholar] [CrossRef]
  20. ISO 14577-4-2007; Metallic Materials—Instrumented Indentation Test for Hardness and Materials Parameters—Part 4: Test Method for Metallic and Non-Metallic Coatings. International Organization for Standardization: Geneva, Switzerland, 2007.
  21. Oliver, W.C.; Pharr, G.M. An improved technique for determining hardness and elastic modulus using load and displacement sensing indentation experiments. J. Mater. Res. 1992, 7, 1564–1583. [Google Scholar] [CrossRef]
  22. Maier-Kiener, V.; Korte-Kerzel, S. Advanced nanoindentation testing: Beyond the Oliver–Pharr method. MRS Bull. 2025, 50, 689–694. [Google Scholar] [CrossRef]
  23. ISO 20502-2005; Fine Ceramics (Advanced Ceramics, Advanced Technical Ceramics)—Determination of Adhesion of Ceramic Coatings by Scratch Testing. International Organization for Standardization: Geneva, Switzerland, 2005.
  24. Naftaly, M.; Das, S.; Gallop, J.; Pan, K.; Alkhalil, F.; Kariyapperuma, D.; Constant, S.; Ramsdale, C.; Hao, L. Sheet resistance measurements of conductive thin films: A comparison of techniques. Electronics 2021, 10, 960. [Google Scholar] [CrossRef]
  25. Bönninghoff, N.; Diyatmika, W.; Chu, J.P.; Mraz, S.; Schneider, J.M.; Lin, C.L.; Eriksson, F.; Greczynski, G. ZrCuAlNi thin film metallic glass grown by high power impulse and direct current magnetron sputtering. Surf. Coat. Technol. 2021, 412, 127029. [Google Scholar] [CrossRef]
  26. Zeman, P.; Haviar, S.; Houška, J.; Thakur, D.; Bondarev, A.; Červená, M.; Medlín, R.; Čerstvý, R. Self-formation of dual-phase nanocomposite Zr–Cu–N coatings based on nanocrystalline ZrN and glassy ZrCu. Mater. Des. 2024, 245, 113278. [Google Scholar] [CrossRef]
  27. Togni, A.; Montagner, F.; Miorin, E.; Mortalo, C.; Zin, V.; Bolelli, G.; Lusvarghi, L.; Frabboni, S.; Gazzadi, G.C.; Armelao, L.; et al. Synthesis of AlxCoCrFeNi HEA thin films by high power impulse magnetron sputtering: Effect of substrate bias voltage. Surf. Coat. Technol. 2025, 496, 131644. [Google Scholar] [CrossRef]
  28. Kim, S.E.; Lee, Y.H.; Kim, D.H.; Kim, H.G. Dependence of Arc Ion plating process on properties of CrAl coating for ATF cladding: Effect of bias voltage and targets. J. Nucl. Mater. 2023, 584, 154593. [Google Scholar] [CrossRef]
  29. Ghidelli, M.; Volland, A.; Blandin, J.J.; Pardoen, T.; Raskin, J.P.; Mompiou, F.; Djemia, P.; Gravier, S. Exploring the mechanical size effects in Zr65Ni35 thin film metallic glasses. J. Alloys Compd. 2014, 615, S90–S92. [Google Scholar] [CrossRef]
  30. Denis, P.; Liu, S.Y.; Fecht, H.J. Growth mode transition in Au-based thin film metallic glasses. Thin Solid Films 2018, 665, 29–35. [Google Scholar] [CrossRef]
  31. Ataie, S.A.; Qashqay, S.M.; Zamani-Meymian, M.R.; Ferreira, F. Effect of substrate bias voltage on microstructure and mechanical properties of Cr-Nb-Ti-Zr-NO ceramic thin films produced by reactive sputtering. Coatings 2023, 13, 1141. [Google Scholar] [CrossRef]
  32. Johlin, E.; Tabet, N.; Castro-Galnares, S.; Abdallah, A.; Bertoni, M.I.; Asafa, T.; Grossman, J.C.; Said, S.; Buonassisi, T. Structural origins of intrinsic stress in amorphous silicon thin films. Phys. Rev. B 2012, 85, 075202. [Google Scholar] [CrossRef]
  33. Fan, Q.; Wang, Y.; Guo, M.; Wu, Z.; Cao, F.; Liu, Y.; Wang, T. Influence of bias voltage variation on the microstructure and comprehensive properties of CrAlSiN coatings. J. Mater. Res. Technol. 2025, 35, 6605–6614. [Google Scholar] [CrossRef]
  34. Taghavi Pourian Azar, G.; Er, D.; Ürgen, M. The role of superimposing pulse bias voltage on DC bias on the macroparticle attachment and structure of TiAlN coatings produced with CA-PVD. Surf. Coat. Technol. 2018, 350, 1050–1057. [Google Scholar] [CrossRef]
  35. Das, C.R.; Rangwala, M.; Ghosh, A. Influence of substrate bias voltage on microstructure and mechanical characteristics of TiAlSiN coating deposited by High Power Impulse Magnetron Sputtering (HiPIMS). Surf. Coat. Technol. 2023, 458, 129351. [Google Scholar] [CrossRef]
  36. Apreutesei, M.; Steyer, P.; Joly-Pottuz, L.; Billard, A.; Qiao, J.; Cardinal, S.; Sanchette, F.; Pelletier, J.M.; Esnouf, C. Microstructural, thermal and mechanical behavior of co-sputtered binary Zr–Cu thin film metallic glasses. Thin Solid Films 2014, 561, 53–59. [Google Scholar] [CrossRef]
  37. Sun, L.; Li, H.; Wei, N.; Li, J.; Huang, J.; Kong, J.; Wu, Q.; Shi, Y.; Xiong, D. Effects of bias voltage on the structure, mechanical properties and tribological properties of TaBx films at elevated temperatures. Int. J. Refract. Met. Hard Mater. 2024, 118, 106471. [Google Scholar] [CrossRef]
  38. Chen, X.; Du, Y.; Chung, Y.-W. Commentary on using H/E and H3/E2 as proxies for fracture toughness of hard coatings. Thin Solid Films 2019, 688, 137265. [Google Scholar] [CrossRef]
  39. Deng, Y.L.; Lee, J.W.; Lou, B.S.; Duh, J.G.; Chu, J.P.; Jang, J.S.C. The fabrication and property evaluation of Zr–Ti–B–Si thin film metallic glass materials. Surf. Coat. Technol. 2014, 259, 115–122. [Google Scholar] [CrossRef]
  40. Panjan, P.; Miletić, A.; Drnovšek, A.; Terek, P.; Čekada, M.; Kovačević, L.; Panjan, M. Cracking resistance of selected PVD hard coatings. Coatings 2024, 14, 1452. [Google Scholar] [CrossRef]
  41. Malzbender, J.; de With, G. The use of the indentation loading curve to detect fracture of coatings. Surf. Coat. Technol. 2001, 137, 72–76. [Google Scholar] [CrossRef]
  42. Zhao, M.S.Z.; Long, Z.L.; Peng, L. Nanoindentation studies of strain rate sensitivity in bulk metallic glasses. J. Non-Cryst. Solids 2021, 565, 120852. [Google Scholar] [CrossRef]
  43. Behboud, A.B.; Motallebzadeh, A.; Özerinç, S. Nanoheterogeneous ZrTa metallic glass thin films with high strength and toughness. J. Alloys Compd. 2022, 901, 163578. [Google Scholar] [CrossRef]
  44. Wang, H.; Chen, W.; Liang, Z.; Zhang, Y.; Qin, B. Microstructure and mechanical properties of nano dual-phase TiCuNi metallic glass films achieved by modulating magnetron sputtering temperature. Vacuum 2023, 214, 112223. [Google Scholar] [CrossRef]
  45. Wu, Z.; Huan, J.; Geng, D.; Ye, R.; Wang, Q. Investigation on plastic deformation of arc-evaporated AlCrSiN and AlCrSiON nanocomposite films by indentation. Surf. Coat. Technol. 2022, 441, 128570. [Google Scholar] [CrossRef]
  46. Fan, Q.; Guo, M.; Wu, Z.; Hao, X.; Cao, F.; Liu, Y.; Wang, T. Effects of bias voltage on the microstructure and properties of AlCrN/AlTiN nanoscale multilayer coatings. Vacuum 2023, 215, 112327. [Google Scholar] [CrossRef]
  47. Kushwaha, A.K.; Misra, M.; Menezes, P.L. Mechanical and Tribological Performance of Additively Manufactured Nanocrystalline Aluminum via Cryomilling and Cold Spray. Lubricants 2025, 13, 386. [Google Scholar] [CrossRef]
  48. Marimuthu, K.P.; Han, J.; Jeong, U.; Lee, K.; Lee, H. Study on tribological characteristics of Zr-based BMG via nanoscratch techniques. Wear 2021, 486–487, 204067. [Google Scholar] [CrossRef]
  49. Zhou, Q.; Han, W.; Luo, D.; Du, Y.; Xie, J.; Wang, X.Z.; Zou, Q.; Zhao, X.; Wang, H.; Beake, B.D. Mechanical and tribological properties of Zr–Cu–Ni–Al bulk metallic glasses with dual-phase structure. Wear 2021, 474–475, 203880. [Google Scholar] [CrossRef]
  50. Castro, J.D.; Ans, M.; Cavaleiro, D.; Carvalho, S. Tribological and mechanical properties of ZrxNy films obtained by HiPIMS in DOMS mode. Tribol. Int. 2023, 189, 108960. [Google Scholar] [CrossRef]
  51. Geng, D.; Li, H.; Chen, Z.; Xu, Y.X.; Wang, Q. Microstructure, oxidation behavior and tribological properties of AlCrN/Cu coatings deposited by a hybrid PVD technique. J. Mater. Sci. Technol. 2022, 100, 150–160. [Google Scholar] [CrossRef]
  52. Mei, H.; Wang, R.; Ding, J.C.; Zhao, J.; Wang, T.; Deng, J.; Li, K.; Gong, W.; Wang, Q. Effect of Cu addition on the tribological properties and oxidation behavior of nanomultilayered AlTiN/Cu coatings. J. Mater. Res. Technol. 2024, 28, 719–729. [Google Scholar] [CrossRef]
  53. Yiu, P.; Bönninghoff, N.; Chu, J.P. Evaluation of Cr-based thin film metallic glass as a potential replacement of PVD chromium coating on plastic mold surface. Surf. Coat. Technol. 2022, 442, 128274. [Google Scholar] [CrossRef]
  54. Yiu, P.; Diyatmika, W.; Bönninghoff, N.; Lu, Y.C.; Lai, B.Z.; Chu, J.P. Thin film metallic glasses: Properties, applications and future. J. Appl. Phys. 2020, 127, 030901. [Google Scholar] [CrossRef]
  55. Wang, J.; Liu, J.; Neate, N.; Bai, M.; Xu, F.; Hussain, T.; Scotchford, C.; Hou, X. Investigation on time-dependent wetting behavior of Ni-Cu-P ternary coating. J. Alloys Compd. 2018, 765, 221–228. [Google Scholar] [CrossRef]
  56. Zhang, C.; Pei, K.; Sheng, T.; Zhang, M.; Zhao, Z.; Huang, W.; Li, Y.; Ai, S.; Guo, Z. Metal Oxides Engineering: Toward Sustainable Superhydrophobic Surfaces. Adv. Funct. Mater. 2025, e12239. [Google Scholar] [CrossRef]
  57. Ge, P.; Wang, S.; Zhang, J.; Yang, B. Micro-/nanostructures meet anisotropic wetting: From preparation methods to applications. Mater. Horiz. 2020, 7, 2566–2595. [Google Scholar] [CrossRef]
  58. Chawla, J.S.; Gstrein, F.; O’Brien, K.P.; Clarke, J.S.; Gall, D. Electron scattering at surfaces and grain boundaries in Cu thin films and wires. Phys. Rev. B 2011, 84, 235423. [Google Scholar] [CrossRef]
  59. Gall, D. The search for the most conductive metal for narrow interconnect lines. J. Appl. Phys. 2020, 127, 050901. [Google Scholar] [CrossRef]
  60. Zaccone, A. Thickness-dependent conductivity of nanometric semiconductor thin films. Phys. Rev. Mater. 2025, 9, 046001. [Google Scholar] [CrossRef]
  61. Bakonyi, I. Accounting for the resistivity contribution of grain boundaries in metals: Critical analysis of reported experimental and theoretical data for Ni and Cu. Eur. Phys. J. Plus 2021, 136, 410. [Google Scholar] [CrossRef]
  62. Graham, R.L.; Alers, G.B.; Mountsier, T.; Shamma, N.; Dhuey, S.; Cabrini, S.; Geiss, R.H.; Read, D.T.; Peddeti, S. Resistivity dominated by surface scattering in sub-50 nm Cu wires. Appl. Phys. Lett. 2010, 96, 042116. [Google Scholar] [CrossRef]
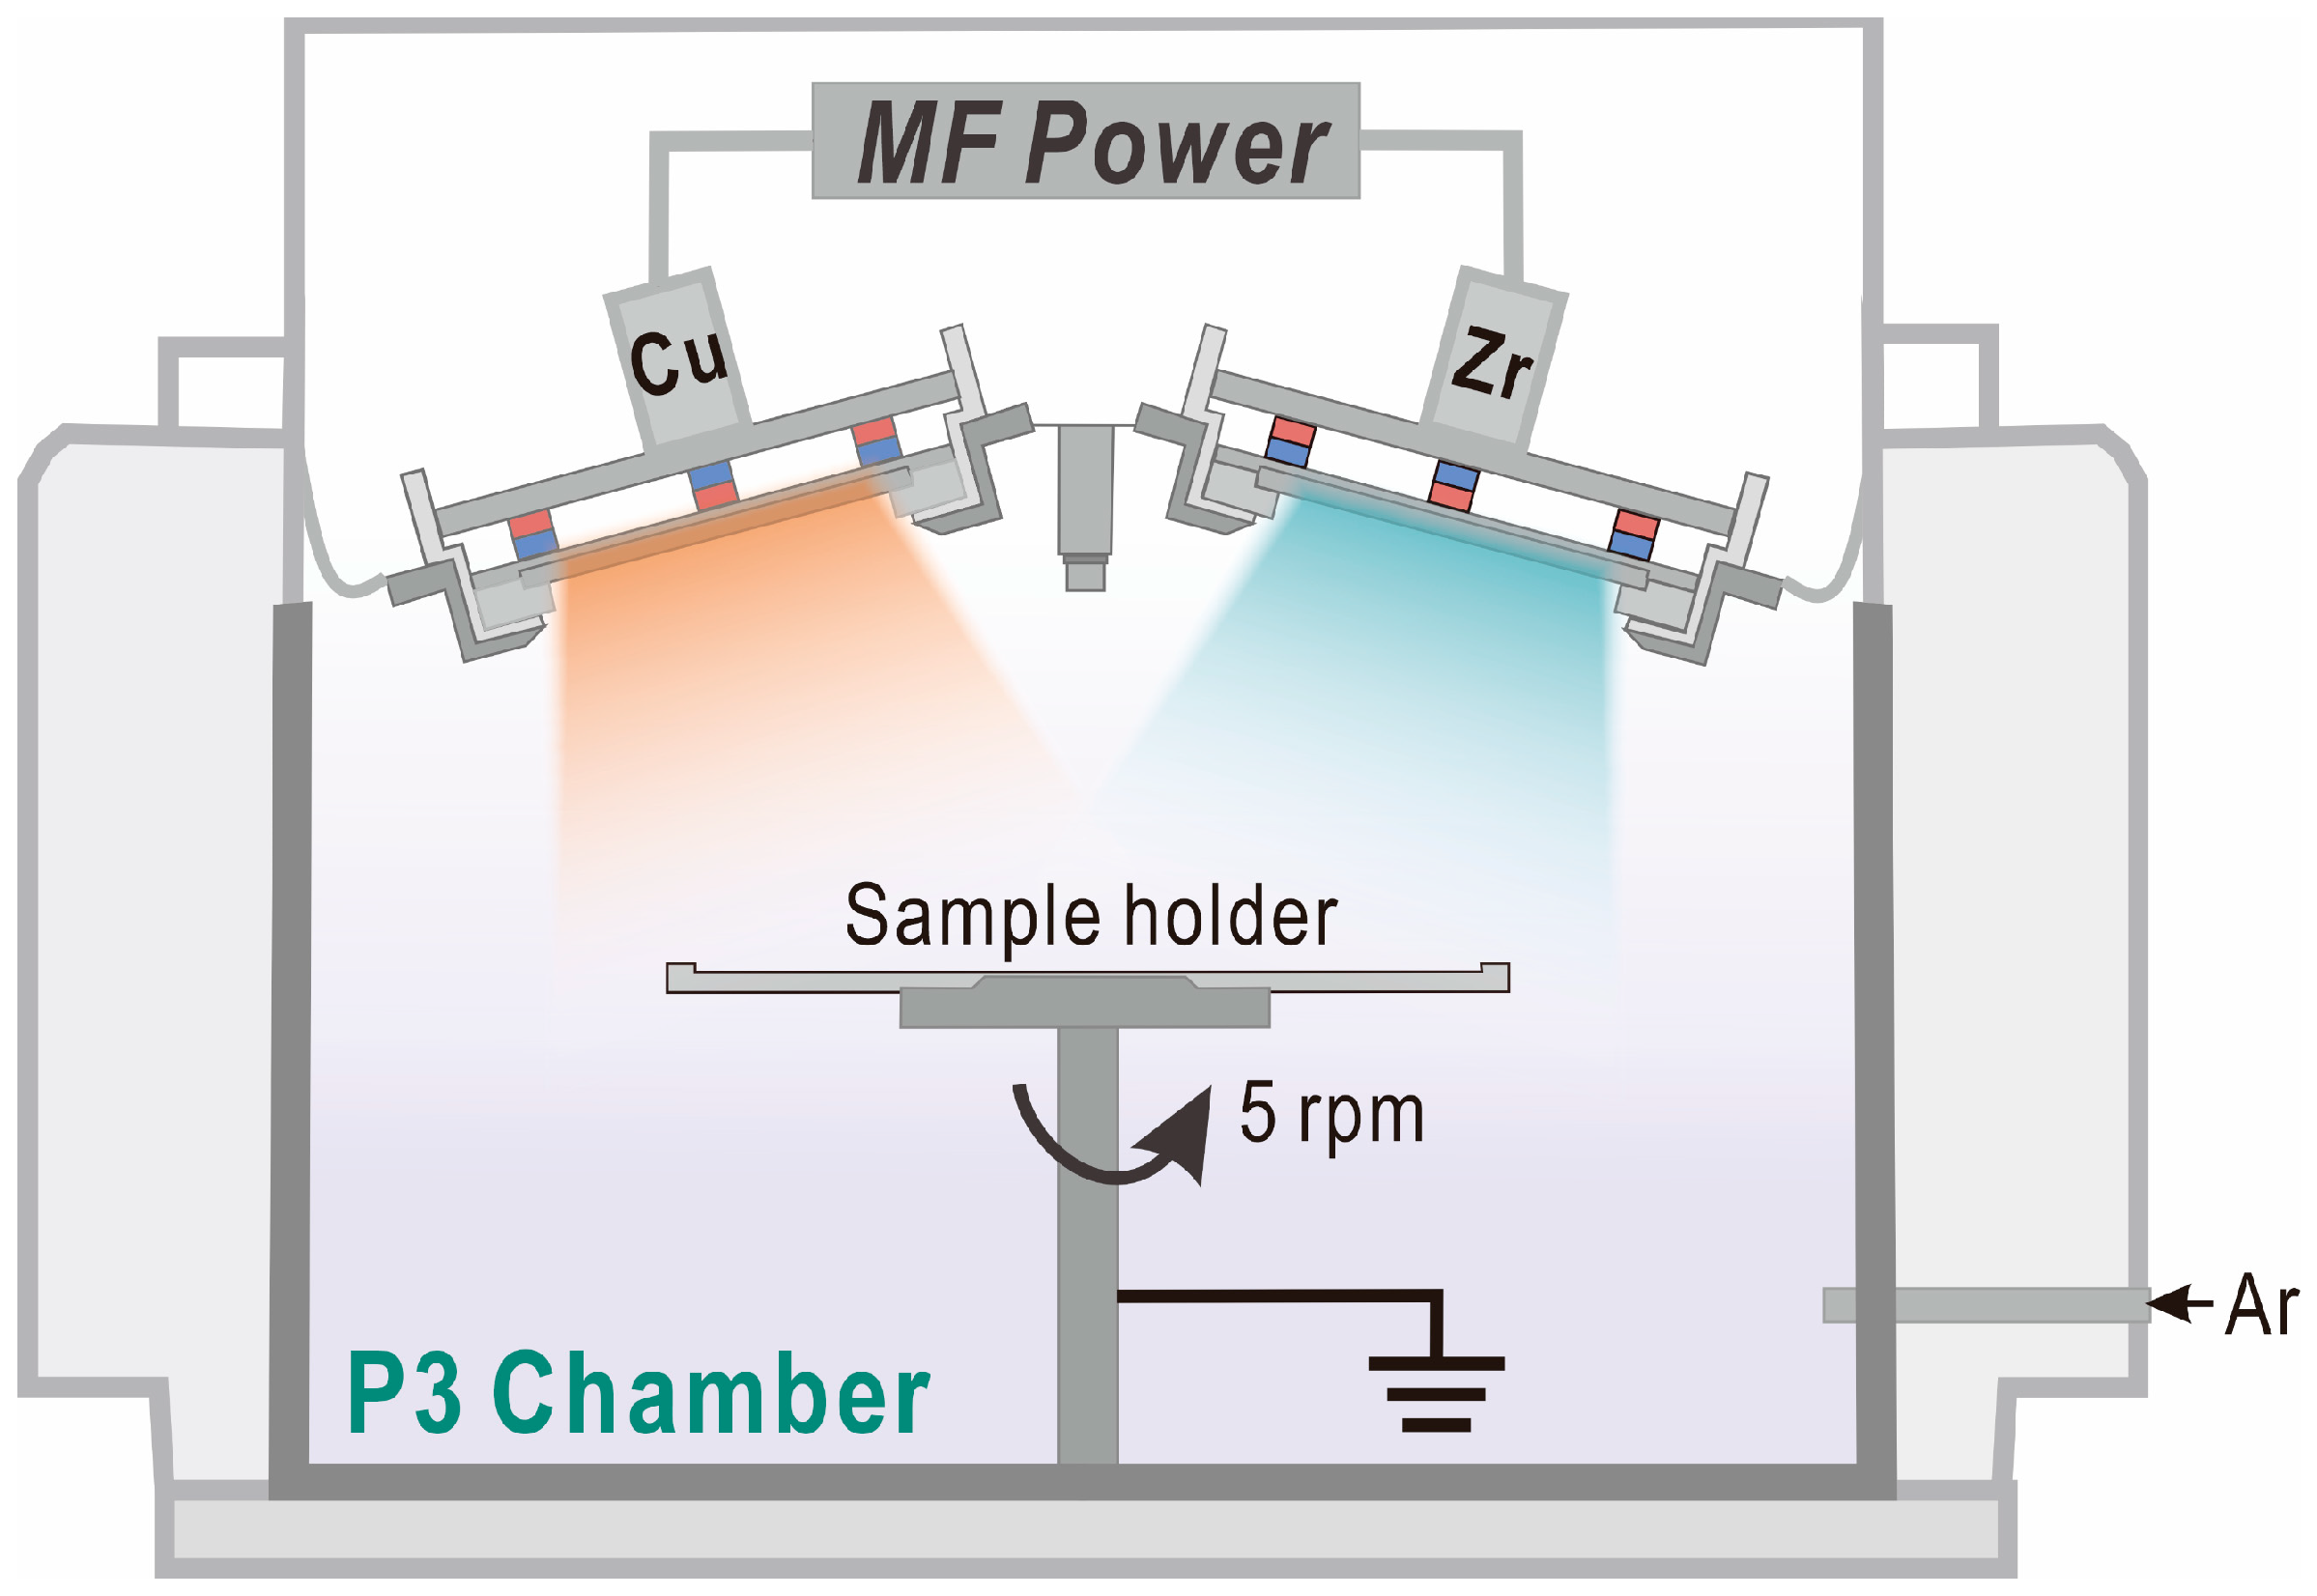
Figure 1. Schematic diagram of the used PVD equipment and target configuration.
Lubricants 13 00447 g001
Figure 2. XRD diffractograms of (a) CuZr films; (b) Cu and Zr films.
Lubricants 13 00447 g002
Figure 3. Surface morphologies of (a) CuZr; (b) Cu; (c) Zr films.
Lubricants 13 00447 g003
Figure 4. Cross-sectional morphologies of (ae) CuZr films deposited at bias voltages of 0 V, −20 V, −50 V, −100 V, and −150 V; (f) Cu film; (g) Zr film.
Lubricants 13 00447 g004
Figure 5. Thickness and deposition rate of CuZr films at different bias voltages, Cu, and Zr films.
Lubricants 13 00447 g005
Figure 6. (a) Cross-section morphology and element mapping (O, Cu, Zr) of CuZr film deposited at −50 V bias voltage; (bd) magnified cross-sectional microstructures of CuZr films at −50 V, −100 V, and −150 V bias voltage; (eg) histograms of dimple size distribution for CuZr films at −50 V, −100 V, and −150 V.
Lubricants 13 00447 g006
Figure 7. Three-dimensional surface morphologies of (ae) CuZr films at 0 V, −20 V, −50 V, −100 V, and −150 V bias voltage; (f) Cu film; (g) Zr film.
Lubricants 13 00447 g007
Figure 8. Roughness of CuZr films at different bias voltages, Cu, and Zr films.
Lubricants 13 00447 g008
Figure 9. (a) Hardness, elastic modulus, and Cu/Zr ratio of CuZr, Cu, and Zr films; (b) H/E and H3/E2 ratio of CuZr, Cu, and Zr films.
Lubricants 13 00447 g009
Figure 10. Nanoindentation P–h curves with different loading rate values from (a) 8 mN/min; (b) 20 mN/min; (c) 50 mN/min; (d) 100 mN/min.
Lubricants 13 00447 g010
Figure 11. The dh/dPP curves, the critical load for the initiation of a first pop-in and the maximum of dh/dP at a loading rate of 8 mN/min of (a) CuZr films at different bias voltages; (b) Cu and Zr films.(The arrow indicates the pop-in event.)
Lubricants 13 00447 g011
Figure 12. (a) Ph curves of CuZr film at a loading rate of 100 mN/min; (b) We and Wp/Wt values of the nanoindentation tests for the CuZr films.
Lubricants 13 00447 g012
Figure 13. Scratch morphologies and acoustic emission on scratch length of (a) CuZr film at 0 V; (b) CuZr film at −20 V; (c) CuZr film at −50 V; (d) CuZr film at −100 V; (e) CuZr film at −150 V; (f) Cu film; (g) Zr film.
Lubricants 13 00447 g013
Figure 14. (a) Coefficients of friction curves; (b) average coefficients of friction and wear rate of CuZr, Cu, and Zr films.
Lubricants 13 00447 g014
Figure 15. Wear marks and counterpart balls rubbing of (a1a3) CuZr film at 0 V; (b1b3) CuZr film at −20 V; (c1c3) CuZr film at −50 V; (d1d3) CuZr film at −100 V; (e1e3) CuZr film at −150 V; (f1f3) Cu film; (g1g3) Zr film.
Lubricants 13 00447 g015
Figure 16. SEM surface morphologies of wear track with EDS analyses for (ae) CuZr films at 0 V, −20 V, −50 V, −100 V, and −150 V bias voltage; (f) Cu film; (g) Zr film.
Lubricants 13 00447 g016
Figure 17. Contact angles and droplet morphologies of CuZr films at different bias voltages; Cu and Zr films.
Lubricants 13 00447 g017
Figure 18. Sheet resistance and resistivity of CuZr films at different bias voltages; Cu and Zr films.
Lubricants 13 00447 g018
Table 1. Elemental compositions of CuZr films under different bias voltages.
Bias VoltageElemental Composition, at.%
CuZrO
0 V60.29 ± 0.2534.43 ± 0.155.28 ± 0.09
−20 V60.62 ± 0.4234.61 ± 0.034.77 ± 0.01
−50 V60.20 ± 0.3834.27 ± 0.165.53 ± 0.06
−100 V59.58 ± 0.4134.34 ± 0.156.08 ± 0.14
−150 V58.98 ± 0.3235.30 ± 0.175.72 ± 0.15
Disclaimer/Publisher’s Note: The statements, opinions and data contained in all publications are solely those of the individual author(s) and contributor(s) and not of MDPI and/or the editor(s). MDPI and/or the editor(s) disclaim responsibility for any injury to people or property resulting from any ideas, methods, instructions or products referred to in the content.