Article

A Real-Time Dynamic Temperature Prediction Method for Double-Steel Plates in Wet Clutches

Key Laboratory of Advanced Manufacturing Technology for Automobile Parts, Ministry of Education, Chongqing University of Technology, Chongqing 400054, China
*
Author to whom correspondence should be addressed.
Lubricants 2025, 13(10), 425; https://doi.org/10.3390/lubricants13100425
Submission received: 21 August 2025 / Revised: 12 September 2025 / Accepted: 20 September 2025 / Published: 23 September 2025

Abstract

Wet clutches are extensively employed in automotive transmission systems due to their benefits of smooth shift and stable operation. However, existing methodologies have not yet thoroughly analyzed the real-time dynamic temperature distribution of wet clutches, and the heating and heat transfer mechanisms during the sliding friction process of friction pairs remain underexplored. To address these gaps, this study proposes a real-time dynamic temperature prediction model for wet clutches and investigates the heat generation and transfer mechanisms in the friction pair sliding process. Specifically, the heat production and exchange dynamics of the wet clutch friction pair are systematically analyzed, followed by an examination of the real-time temperature variation of the separator plate under both high-slip and low-slip speed conditions. In the numerical simulations, the predicted temperature values from the proposed model demonstrate excellent agreement with experimental measurements, with dynamic peak temperature discrepancies remaining within ±2 °C. Furthermore, the validated temperature evolution laws are corroborated by experimental results obtained from a dedicated wet clutch performance test rig, thereby providing comprehensive empirical verification of the proposed real-time dynamic temperature prediction framework for wet clutch separator plates. In summary, the model can accurately capture the temperature variation characteristics of wet clutches under different operating conditions, providing a reliable basis for real-time thermal management of transmission systems. It holds significant practical value for optimizing cooling system design, extending clutch service life, and ensuring shifting quality in vehicles.

1. Introduction

Owing to its significant advantages in torque transmission capacity, gear-shifting smoothness, and operational stability assurance, the wet clutch has emerged as a pivotal research focus within automotive engineering development [1,2]. Materials serve as the lifeline of transmission components. Their selection directly dictates the overall system’s performance, reliability, service life, and cost, making it a non-negotiable core aspect of both design and maintenance. Incorrect material choices can lead to premature failure, reduced performance, or even safety incidents, whereas the right materials ensure stable, efficient, and long-term operation of the transmission system under specific working conditions [3]. The wet clutch evidently consumes power during the starting and shifting processes of an automobile [4,5]. In the sliding friction process, a substantial amount of mechanical energy is converted into heat energy, thereby increasing the temperature of the friction pair [6,7]. Consequently, clutch wear arises, resulting in degradation of the transmission torque capacity and a decline in shift quality. Given these challenges, the formulation of a real-time dynamic thermal model for wet clutch systems is crucial for enhancing vehicle performance amid increased operational demands.
Current research on real-time dynamic temperature prediction for dual steel plates in wet clutches focuses on multi-physics coupling models integrating thermal-fluid-solid-mechanical interactions, enhanced by data-driven algorithms and experimental validation to improve prediction accuracy under varying operational conditions [8,9,10]. For example, Li A et al. [11] proposed an adaptive feedforward control method for the dynamic friction coefficient of a wet clutch. By constructing a multi-factor coupled observation model of oil temperature, friction plate temperature, and wear, integrating a real-time torque observer and compensation algorithm, the precise control accuracy of torque under transmission sliding friction conditions was achieved. Zhang L et al. [12] developed a hybrid predictive framework integrating a conventional wet clutch drag torque model with a particle swarm optimization-backpropagation neural network, enhancing model precision through empirical test data calibration. Results demonstrated that the hybrid architecture exhibited a prediction error of 14.45%, demonstrating a marked enhancement in accuracy over conventional drag torque models. Zhou W et al. [13] proposed a semi-Y labyrinth seal to reduce leakage and enhance the stability of centrifugal pumps. Huang Z et al. [14] calculated the heat flux density and heat source distribution coefficient of the friction pair based on the principles of heat generation and heat transfer. The methods for calculating convective heat transfer were derived for rectangular oil grooves, concentric circular grooves, as well as for the annular and contact surfaces of the friction pair. Pointner Gabriel L et al. [15] developed a computationally efficient data-driven model for predicting wet clutch drag torque losses, achieving high-precision predictions while incorporating seven critical operational parameters. This framework significantly reduces computational overhead compared to conventional methods while maintaining prediction fidelity, as validated through rigorous numerical simulations and experimental benchmarking. The above method improves the dynamic torque control accuracy, thermal field prediction ability, and computational efficiency of wet clutches through adaptive control, neural network optimization, fluid-solid coupling heat transfer modeling, and efficient data-driven methods. However, existing methodologies have not conducted in-depth analyses of real-time dynamic temperature distributions in wet clutches, and the heating and heat transfer mechanisms during the sliding friction process of frictional interfaces remain insufficiently explored.
To address the aforementioned challenges, this study proposes a real-time dynamic temperature prediction model for wet clutches and investigates the thermal dissipation mechanisms during the sliding process of friction pairs. The primary contributions are summarized as follows:
  • The dynamic mechanisms of heat generation and heat dissipation in the friction pairs of wet clutches were elucidated, with particular focus on the real-time temperature evolution of separators under both high-slip-rate and low-slip-rate operating conditions.
  • A novel real-time dynamic temperature prediction model for wet clutches was established, enabling analysis of the spatiotemporal temperature variation patterns of the friction pairs.
The remaining sections of this research are organized as follows: Section 1 introduces the background and research contributions. Section 2 systematically examines the dynamic heat generation mechanisms of wet clutches. Section 3 analyzes the thermal dissipation characteristics of the system. Section 4 validates the proposed model using a wet clutch test rig and investigates parameter influences on temperature behavior. Finally, Section 6 summarizes the conclusions of this study.

2. Wet Clutch Dynamic Heat Generation Mechanism

The following are assumed in the thermal analysis of the wet clutch. (1) The physical parameters of the wet clutch are isotropic; (2) the wear and thermal deformation of the clutch are not considered; (3) the pressure distribution on the friction surface of the clutch is uniform; and (4) thermal radiation is ignored [16,17]. The core degrees of freedom of the main components of the clutch are two. The first one is axial movement. In this movement, the driven plate can slide axially along the splines of the transmission input shaft, and this constitutes a translational degree of freedom. The second one is circumferential rotation. In this rotation, the driven plate can rotate around the axis together with the engine flywheel and the pressure plate, and this constitutes a rotational degree of freedom. The wet clutch system exhibits three distinct operational states: engaged, sliding, and disengaged. In the disengaged state, there is no physical contact between the clutch components, including the piston pressure plate, separator plates, and friction plates [18,19,20]. This absence of contact precludes the generation of a clamping force and results in the inability to transmit engine torque. During the sliding state, the piston activates to apply pressure, inducing a relative slip velocity between the separator and friction plates. This slip velocity decreases progressively under the damping effect of frictional forces until equilibrium is achieved. In the engaged state, the relative slip velocity between the separator and friction plates reduces to zero, indicating steady-state engagement [2,21,22]. At this stage, a sustained clamping force exists between the components, enabling efficient torque transmission by fully utilizing the frictional engagement mechanism. The torque transmitted by the wet clutch can be expressed as follows, differing across operational states
T c = 0 μ F N R m s g n ω e ω c   T e Disengaged Sliding Engaged
where T c ( N m ) is the torque transmitted by the wet clutch, μ is the friction coefficient, F (N) is the clutch pressing force, N is the number of friction surfaces, R m (m) is the effective friction radius, ω e (rad/s) is the engine speed, ω c (rad/s) is the speed of the clutch driven part, and T e ( N m ) is the output torque of the engine.
The geometric dimensions of the wet clutch friction pairs are shown in Table 1. The shape of the driving and driven friction pair of the wet clutch is a circular ring, as shown in Figure 1.
Consider a ring with a width d R at radius position R. The area of the ring is as follows.
d A = 2 π R d R
In the state of sliding friction, the friction torque transmitted by the ring is as follows.
d T c = μ σ R d A = 2 π μ σ R 2 d R
where σ (N) is the average positive pressure on the friction surface.
The torque T c ( N m ) transmitted by the entire friction pair is obtained as follows:
T c = N R 1 R 2 2 π μ σ R 2 d R = 2 3 N π μ σ R 2 3 R 1 3
The positive pressure F (N) of the wet clutch is calculated as follows:
F = π R 2 2 R 1 2 σ
Combining the foregoing equations yields the following.
T c = μ F N 2 R 2 3 R 1 3 3 R 2 2 R 1 2
The effective friction radius is
R m = 2 R 2 3 R 1 3 3 R 2 2 R 1 2
where R 1 (m) and R 2 (m) are the inner and outer diameters of the friction lining, respectively.
The slip friction power Q (W) produced during the slip friction process of the wet clutch is obtained as follows.
Q = 0 t T c ω e ω c d t
Therefore, the heat flux generated between the friction pair is as follows.
q = d Q d A d t
The physical parameters of each part of the friction pair differ. Hence, the total heat flux density q ( J / ( m 2 s ) ) generated by the relative sliding friction between the separator and friction plates during the engagement process of the wet clutch is distributed to the separator and friction plates through the heat flux distribution coefficient ( β ) [11]:
β = q s q f = λ s ρ s c s λ f ρ f c f 0.5
q s = β 1 + β q
q f = 1 1 + β q
where q s ( J / ( m 2 s ) ) and q f ( J / ( m 2 s ) ) are the heat flux densities assigned to the separator and friction plates, respectively; λ s ( W m 1 K 1 ) and λ f ( W m 1 K 1 ) are the thermal conductivities of the separator and friction plates, respectively; ρ s ( k g m 3 ) and ρ f ( k g m 3 ) are the densities of the separator and friction plates, respectively; c s ( J k g 1 K 1 ) and c f ( J k g 1 K 1 ) are the specific heat capacities of the separator and friction plates, respectively.
The engagement process of a wet clutch relies on the dynamic balance between the oil film and the solid contact between the separator plate and the friction plate. The oil film thickness directly determines the heat generation mode, while the Reynolds equation serves as the theoretical basis for calculating the oil film thickness. The Reynolds equation describes the law of pressure distribution within the oil film. For the sliding process of the wet clutch (laminar flow state, neglecting inertial terms), its simplified form is as follows
d d r ( r h e f f 3 d p d r ) = 6 μ u r d h e f f d r
where μ(Pa∙s) is the dynamic viscosity of the lubricant, p (Pa) is the oil film pressure, Δu (m/s) is the relative sliding speed of the friction pair, heff (5.36 × 10⁻⁵ m) is the oil film thickness. r is the radial coordinate. This equation reflects the coupling relationship between oil film pressure, viscosity, and slip velocity, laying a foundation for correcting heat generation in the subsequent sections.
This research is based on a 7-speed wet dual-clutch transmission developed by a company. The physical parameters of the wet clutch friction pair used in this model refer to this transmission. The physical parameters of the wet clutch friction pair are summarized in Table 2.

3. Heat Dissipation Mechanism of Wet Clutch

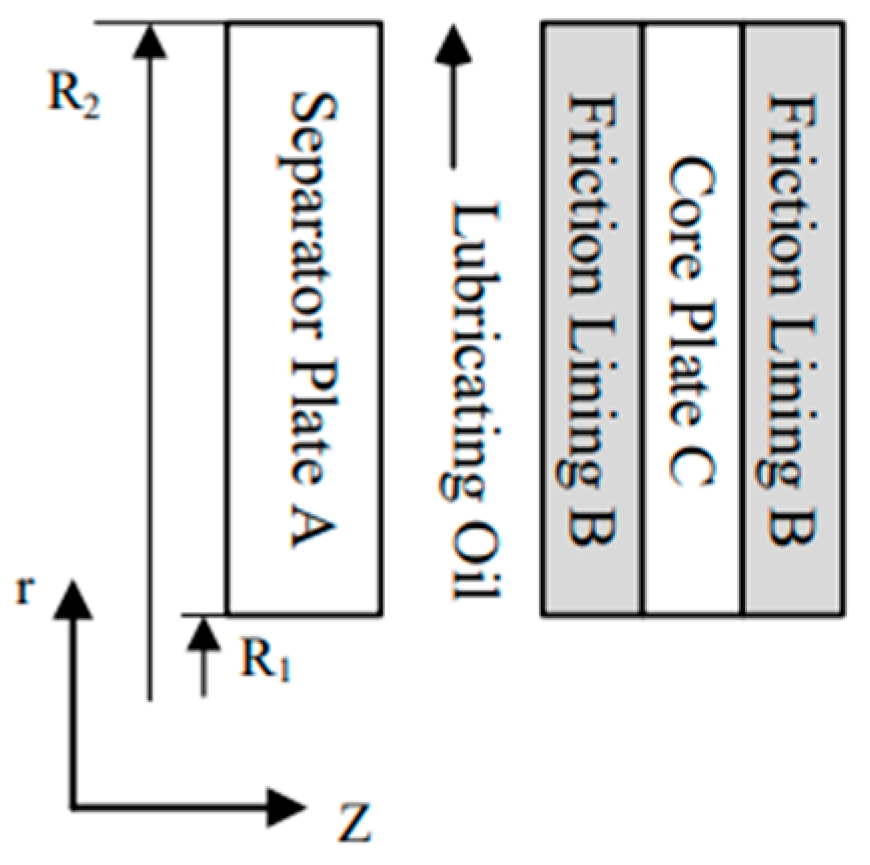
In the wet clutch, the separator and friction plates are alternately distributed to form multiple friction pairs. The sliding friction between the friction pair generates considerable amounts of heat energy. The separator and friction plates first absorb heat through the frictional contact with the working surface. Then, the heat is transferred to the separator and friction plates through heat conduction [23,24]. Subsequently, the cooling lubricating oil is dissipated throughout the friction pair through convective heat transfer. The temperature field of the separator plate element is symmetrical about the mid-plane. The mid-plane is regarded as the adiabatic plane, and half of the separator plate is selected for analysis. The simplified model is shown in Figure 2.
The separator plate near the piston is subjected to uniform pressure, and the temperature field of the friction plate along the circumferential direction is virtually the same [25,26]. Considering the radial section of the separator plate of the friction pair as the research object, the two-dimensional heat conduction equation of the coordinate system is established as follows.
T = T ( x , y , z , t )
where x, y, z are the rectangular coordinates of the friction pair, t is the engagement time.
T t λ ρ c 1 r r r T r + 2 T Z 2 = 0
where λ is the thermal conductivity, W/(m·K) and ρ is the density, kg/m3 and c is the specific heat capacity, J/(kg·K) and r is the radius of the friction pair.
For the cooling and lubrication of the wet clutch, consider the separator plate. The lubricating oil flows through the inner, outer, and friction working surfaces of the separator plate. As the oil flows, the heat transferred by convection is
d Q h s d t = h s A s T s s T i n
where T s s (°C) is the temperature of the friction working surface of the separator plate; T i n (°C) is the lubricating oil temperature; and A s (m2) is the flow area of the friction working surface. If the friction plate has radial grooves, A s = N g a r 2 r 1 , where N g and a are the number of grooves and width of the oil groove, respectively; otherwise, A s = π r 2 2 r 1 2 , r (m) is the radius at any position of the friction surface.
The heat transferred through convection when the lubricating oil flows through the inner and outer ring surfaces of the separator plate are
d Q h i d t = h i A i T s i T i n
d Q h o d t = h o A o T s o T i n
where T s i (°C) and T s o (°C) are the inner and outer surface temperatures of the separator plate, respectively; A i (m2) and A o (m2) are the areas of the inner ring surface and the outer ring surface of the separator plate, respectively.
The inner and outer ring surfaces of the separator plate are in contact with the cooling lubricating oil during the working process of the wet clutch and are in a rotating state. The convective heat transfer of the inner and outer surfaces of the separator plate can be equivalent to the forced convection across cylinders. According to the classic textbook “Heat Transfer”, the convective heat transfer coefficients of the inner and outer ring surfaces of the separator plate are
h i = λ C u i d i ν n P r 1 3 / d i n
h o = λ C u o d o ν n P r 1 3 / d i n
where λ is the thermal conductivity coefficient of the lubricating oil; C and r are constants, i.e., C = 0.193 and n = 0.618 according to literature [13]; u is the linear velocity of the lubricating oil on the cross-section of the separator plate; ν (m/s) is the kinematic viscosity of the lubricating oil; P r is the Prandtl constant; and d i n is the lubricating oil particle diameter.
The flow of cooling lubricating oil is divided into two categories: laminar flow and turbulent flow.
The Reynolds number is the key parameter for determining the flow state, calculated as follows.
Re = ρ v d / μ
where ρ is the fluid density, v is the flow velocity, dd is the characteristic length, and μ is the dynamic viscosity. Flow is typically laminar when Re < 2000. In the context of the partition plate friction scenario, the characteristic length for the cooling lubricant flow is extremely small, and the lubricant has a relatively high viscosity. Assuming a flow velocity of 0.1 m/s, a gap width of 0.1 mm, a density of 850 kg/m3, and a dynamic viscosity of 0.0289 Pa·s, the calculated Reynolds number is as follows. Re = 850 × 0.1 × 0.0001/0.0289 = 0.29. This value is well below the critical threshold, confirming that the flow is laminar.
The cooling lubricating oil at the friction surface of the separator plate is in a laminar state, which is equivalent to the fluid sweeping across the flat surface. The convective heat transfer coefficient of the friction surface of the separator plate is calculated formula [13].
h s = 0.332 λ r Re 1 2 Pr 1 3
The physical parameters of the lubricating oil are summarized in Table 3.
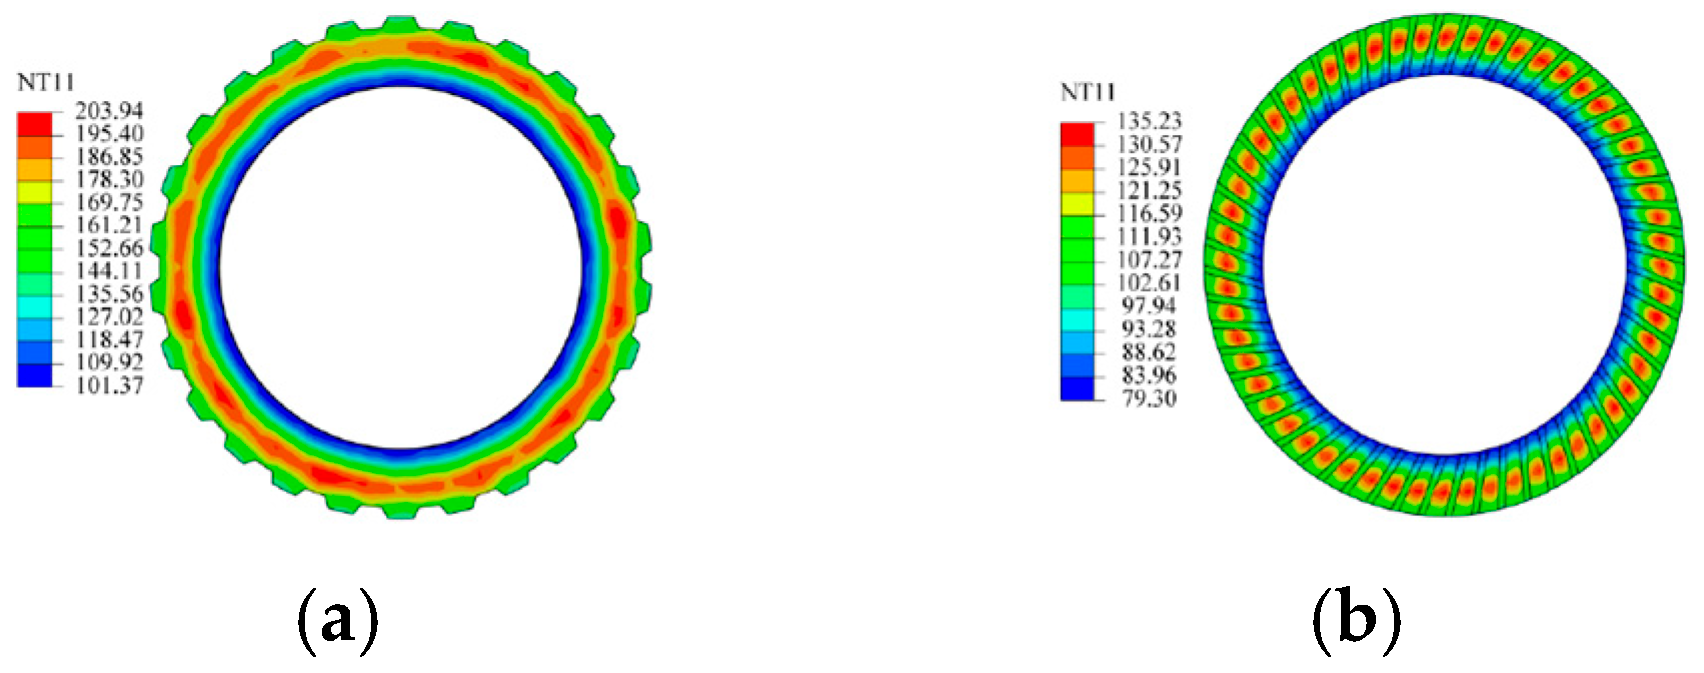
The temperature distribution contour map of the wet clutch at the end of the engagement process is shown in Figure 3. It can be observed that the maximum temperature of the counter steel plate is 203.9 °C, while the temperature of the friction lining is 135.2 °C. The initial conditions are the initial temperature because the friction pair is immersed in the cooling lubricating oil, and the initial temperature of the separator plate and the friction plate is the same as the initial temperature of the cooling lubricating oil at 40 °C. The boundary conditions when the separator plate slides are expressed as follows.
T Z   = 0                                                                                                       Z A = d q s + λ s T Z     h s T s T i n   = 0         Z A = 0 λ s T r     h i T s T i n   = 0                               r A   = R 1 λ s T r     h o T s T i n   = 0                               r A = R 2

4. The Proposed Real-Time Dynamic Temperature Prediction Model

The basic accuracy requirements of the real-time dynamic temperature prediction model for the wet clutch separator plate must be satisfied, and the real-time performance of the temperature prediction must be ensured. To accomplish this, the heat generation and heat dissipation mechanisms in the sliding friction process of the wet clutch friction pair are analyzed. Moreover, a simplified real-time dynamic temperature prediction model suitable for the entire vehicle is established to improve the calculation efficiency of the transmission control unit. This model predicts the temperature of the separator plate and oil outlet based on input signals (e.g., clutch input and output speeds, lubricant flow, oil inlet temperature, and torque transmitted by the clutch). The simplified model is as follows
T separator R i = 0 t T c R i ω e ω c d t k 1 R i q l Δ T 1 k 2 R i
T o i l = 0 t T c ω e ω c d t k 3 q l Δ T 2 k 4
where T separator R i (°C) is the temperatures of the separator plate at radius R; T o i l (°C) is the temperatures of oil at the oil outlet; T c R i ( N m ) is the transmitted torque at radius R; Δ T 1 is the temperature difference between the separator plate and oil inlet; Δ T 2 is the temperature difference between the oil outlet and inlet; q l is the lubricant flow; k 1 R i is the power coefficient of the temperature rise of the separator plate at a radius of R, k 1 R i = c s m s ; k 2 R i is the cooling power coefficient of the separator plate at a radius of R, k 2 R i = h s A s (The convective heat transfer of the inner ring surface and the outer ring surface of the separator plate are ignored, and this temperature model only considers the influence of the convective heat transfer on the friction surface); k 3 is the power coefficients of the temperature rise of the lubricating oil, k 3 = c l m l ; k 4 is the cooling power coefficients of the lubricating oil, k 4 = α h s A s ( α is a constant related to the cooling flow and the physical performance parameters of the lubricating oil, 0 < α < 1 ).
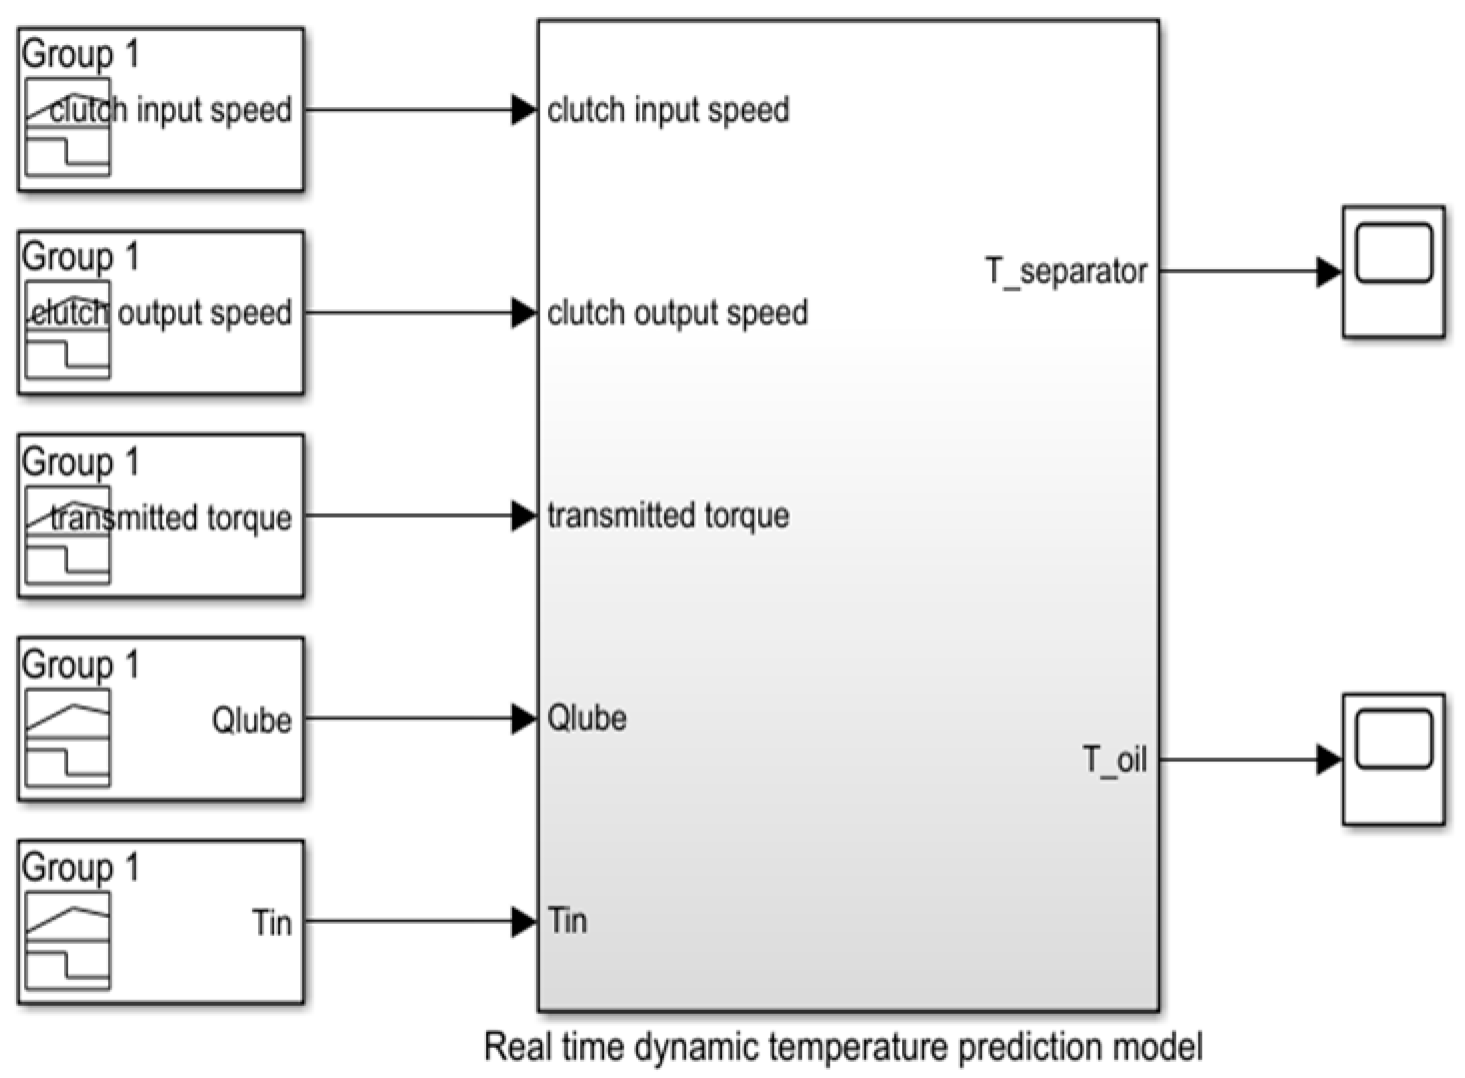
MATLAB R2023a–Simulink is used to build the simulation model according to the simplified real-time dynamic temperature prediction model. Using automatic code generation, the Simulink model can be directly compiled and converted into embedded code for real-time control. The real-time dynamic temperature prediction model for the wet clutch separator plate is shown in Figure 4.
The model consists of three parts: parameter input, system, and output. The parameter input part includes the clutch input and output speeds, lubricant flow, oil inlet temperature, and torque transmitted by the clutch. The calculation part includes the real-time dynamic temperature calculation module of the wet clutch separator plate. The output part is used to output the temperature of the separator plate and the oil outlet.

5. Test Verification

5.1. Comprehensive Performance Test of Wet Clutch

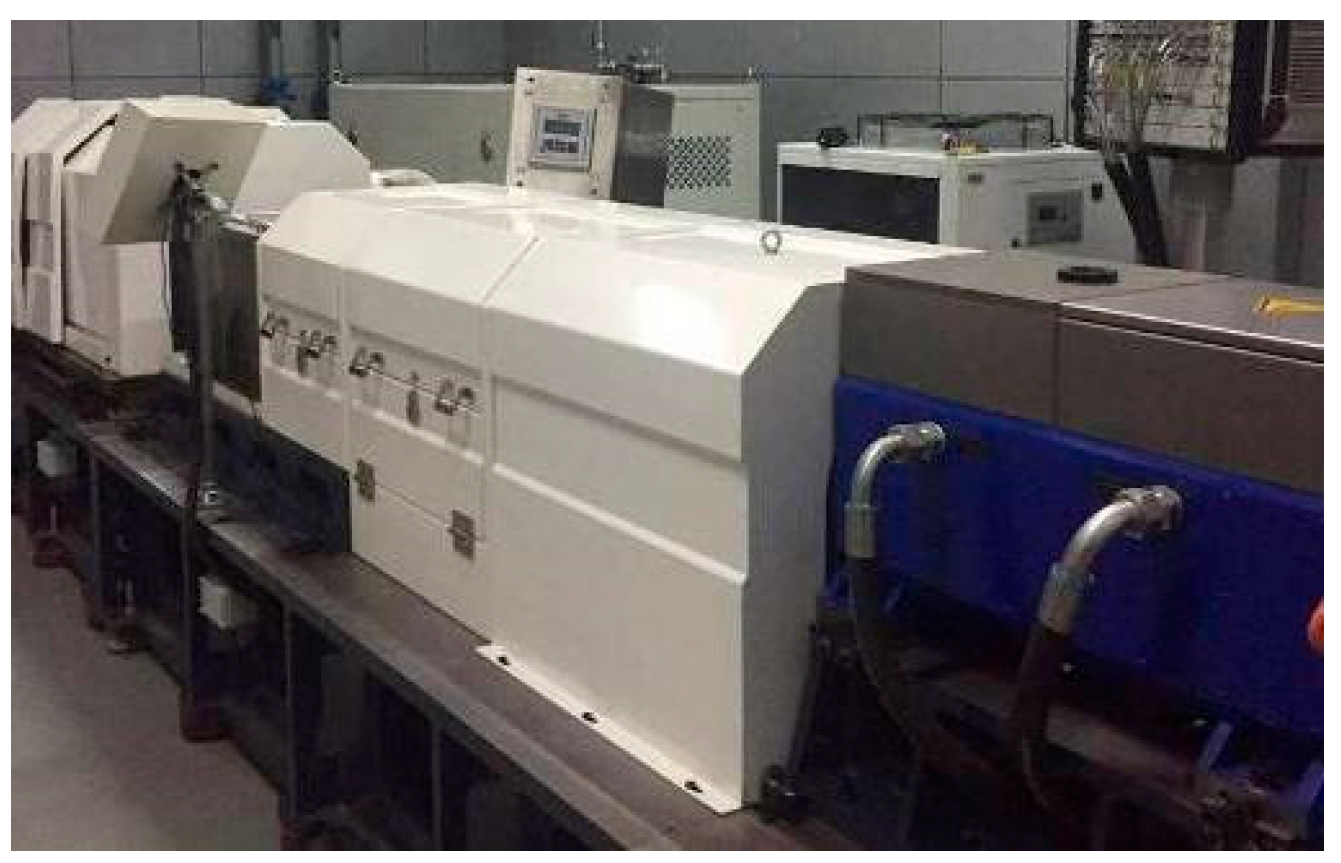
To verify the accuracy of the real-time dynamic temperature prediction model for the wet clutch separator plate, a comprehensive performance test rig was used for experimental verification. The test rig is composed of five parts: driving, loading, mechanical, control systems, and measurement. Figure 5 and Figure 6 illustrate the working principle and physical layout of the test bench, respectively.
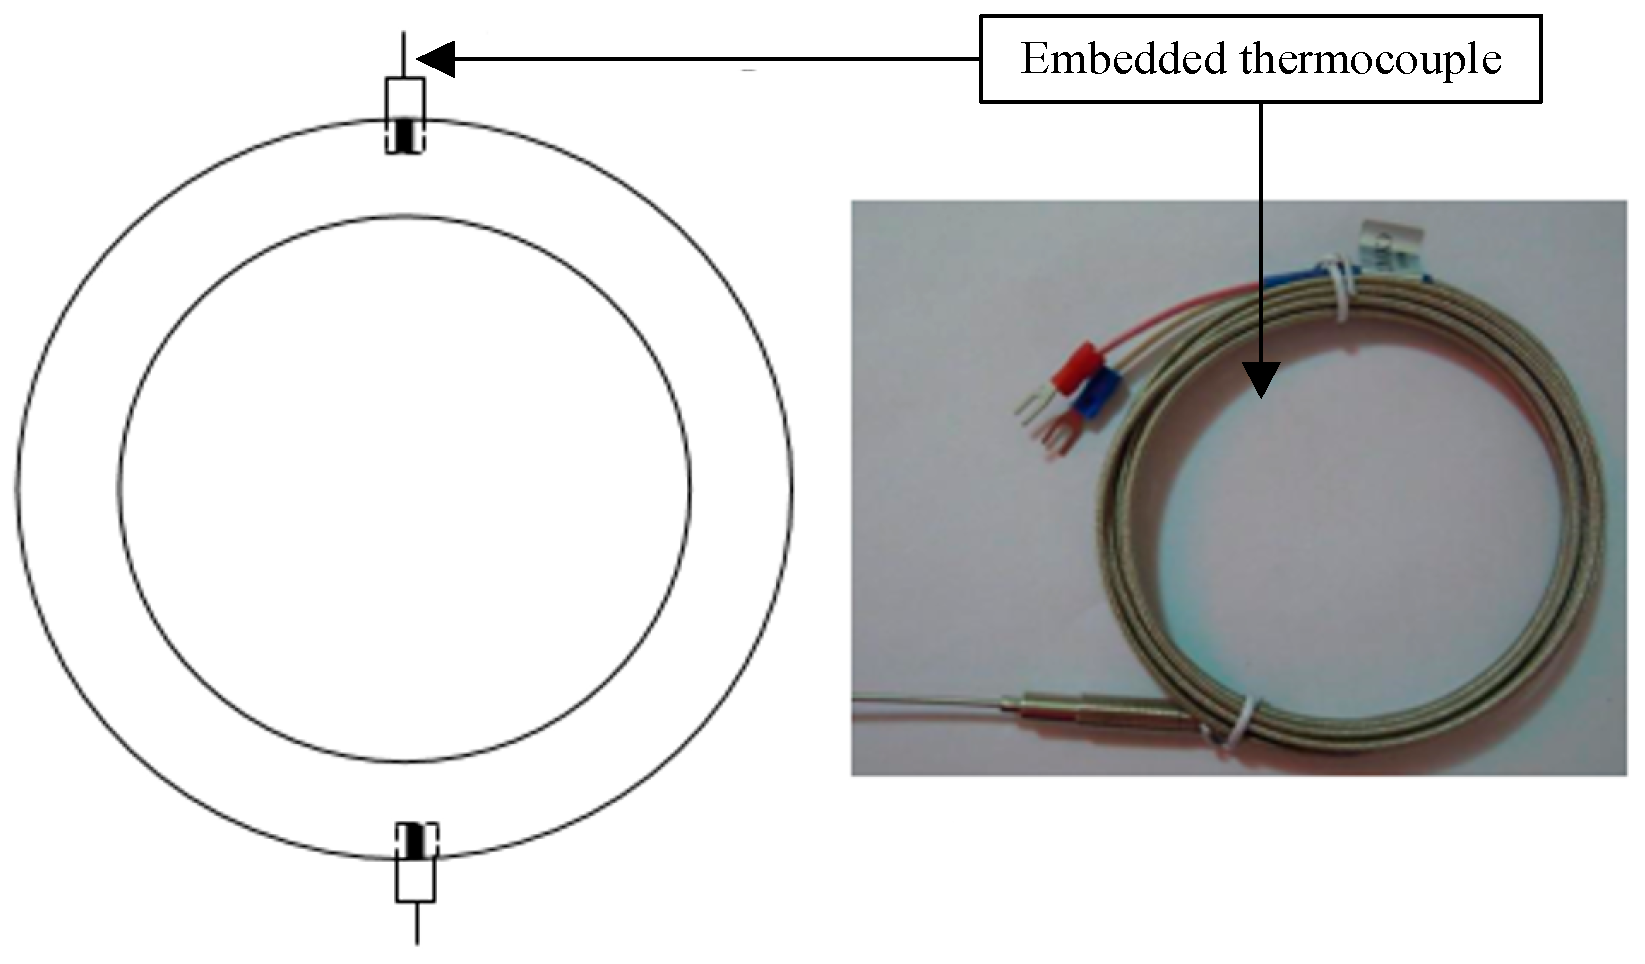
Both the driving and loading systems are composed of a frequency conversion motor and a frequency converter. The two frequency conversion motors have a rated power of 235 kW, a rated torque of ±500 N·m, a maximum speed of 12,000 rpm, and a control accuracy of 1 rpm. The mechanical system is composed of iron plates, bases, and brackets, which provide support and serve as installation bases for the tested wet clutch. The sensor system includes speed, torque, and temperature sensors. The temperature of the separator plate increases first and then decreases in the radial direction, and the high-temperature zones are concentrated between the middle diameter and the outer diameter of the separator plate. To measure the maximum temperature zones of the separator plate while avoiding the large difference in the circumferential temperature distribution due to the uneven force of the separator plate. Therefore, two K-type thermo-couples are embedded in the area of the middle diameter and the outer diameter of the separator plate along the symmetrical direction, as shown in Figure 7. Detailed Sensor Parameters are shown in Table 4.
The measurement and control system consists of an industrial control computer, a frequency conversion controller, an acquisition and communication card, and measurement and control software. The speed of the frequency conversion motor of the driving and loading systems is adjusted to a selected value. The wet clutch friction pair is controlled by an industrial control computer to regulate the hydraulic components of sliding friction. The acquisition card records the temperature of the separator plate in real time with a sampling frequency of 100 Hz.
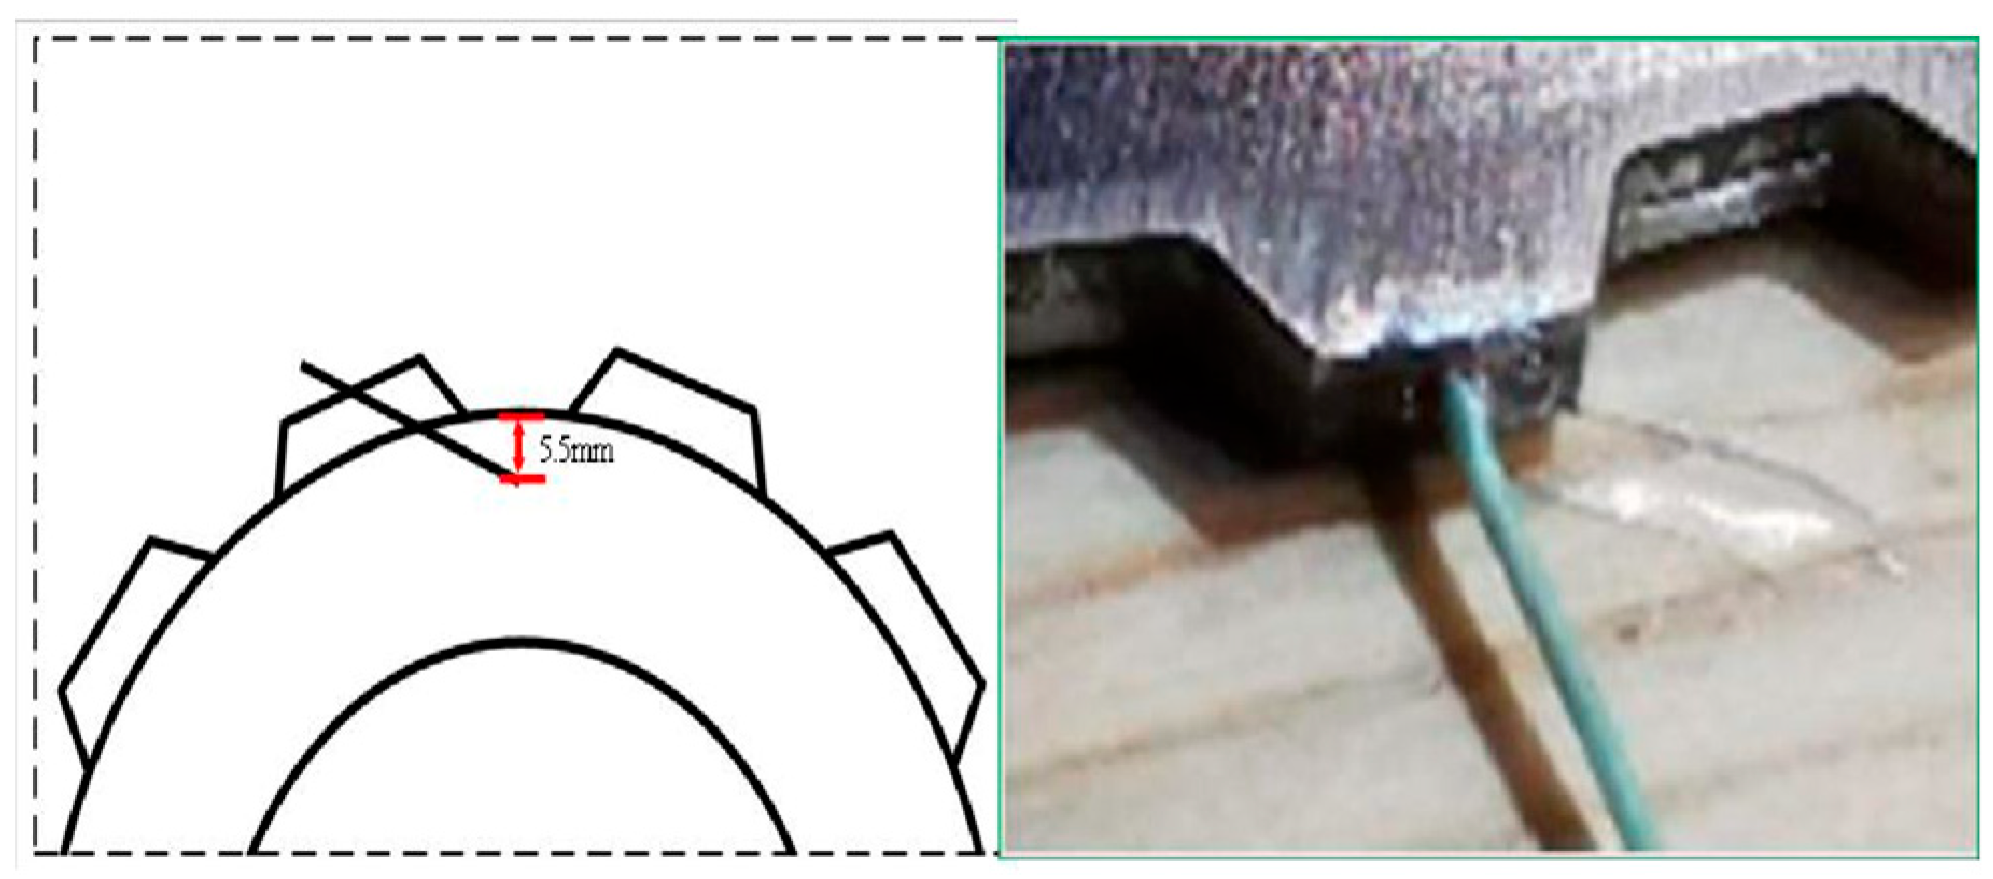
The wet clutch tested in this experiment consists of 4 separator plates and 3 friction plates with radial grooves. The temperature data of the separator plate were measured during the test. To facilitate non-interfering placement, radial holes were drilled in the external teeth of the separator plate. Thermocouples were inserted through the clutch housing to the locations where the highest temperatures occur. The highest temperature on the separator plate was observed at the outer diameter region, specifically between two external teeth and 5.5 mm from the outer edge. Therefore, inclined holes with a diameter of 0.8 mm were drilled using electrical discharge machining at the center of the external teeth. The installation position of the thermocouples is shown in Figure 8.
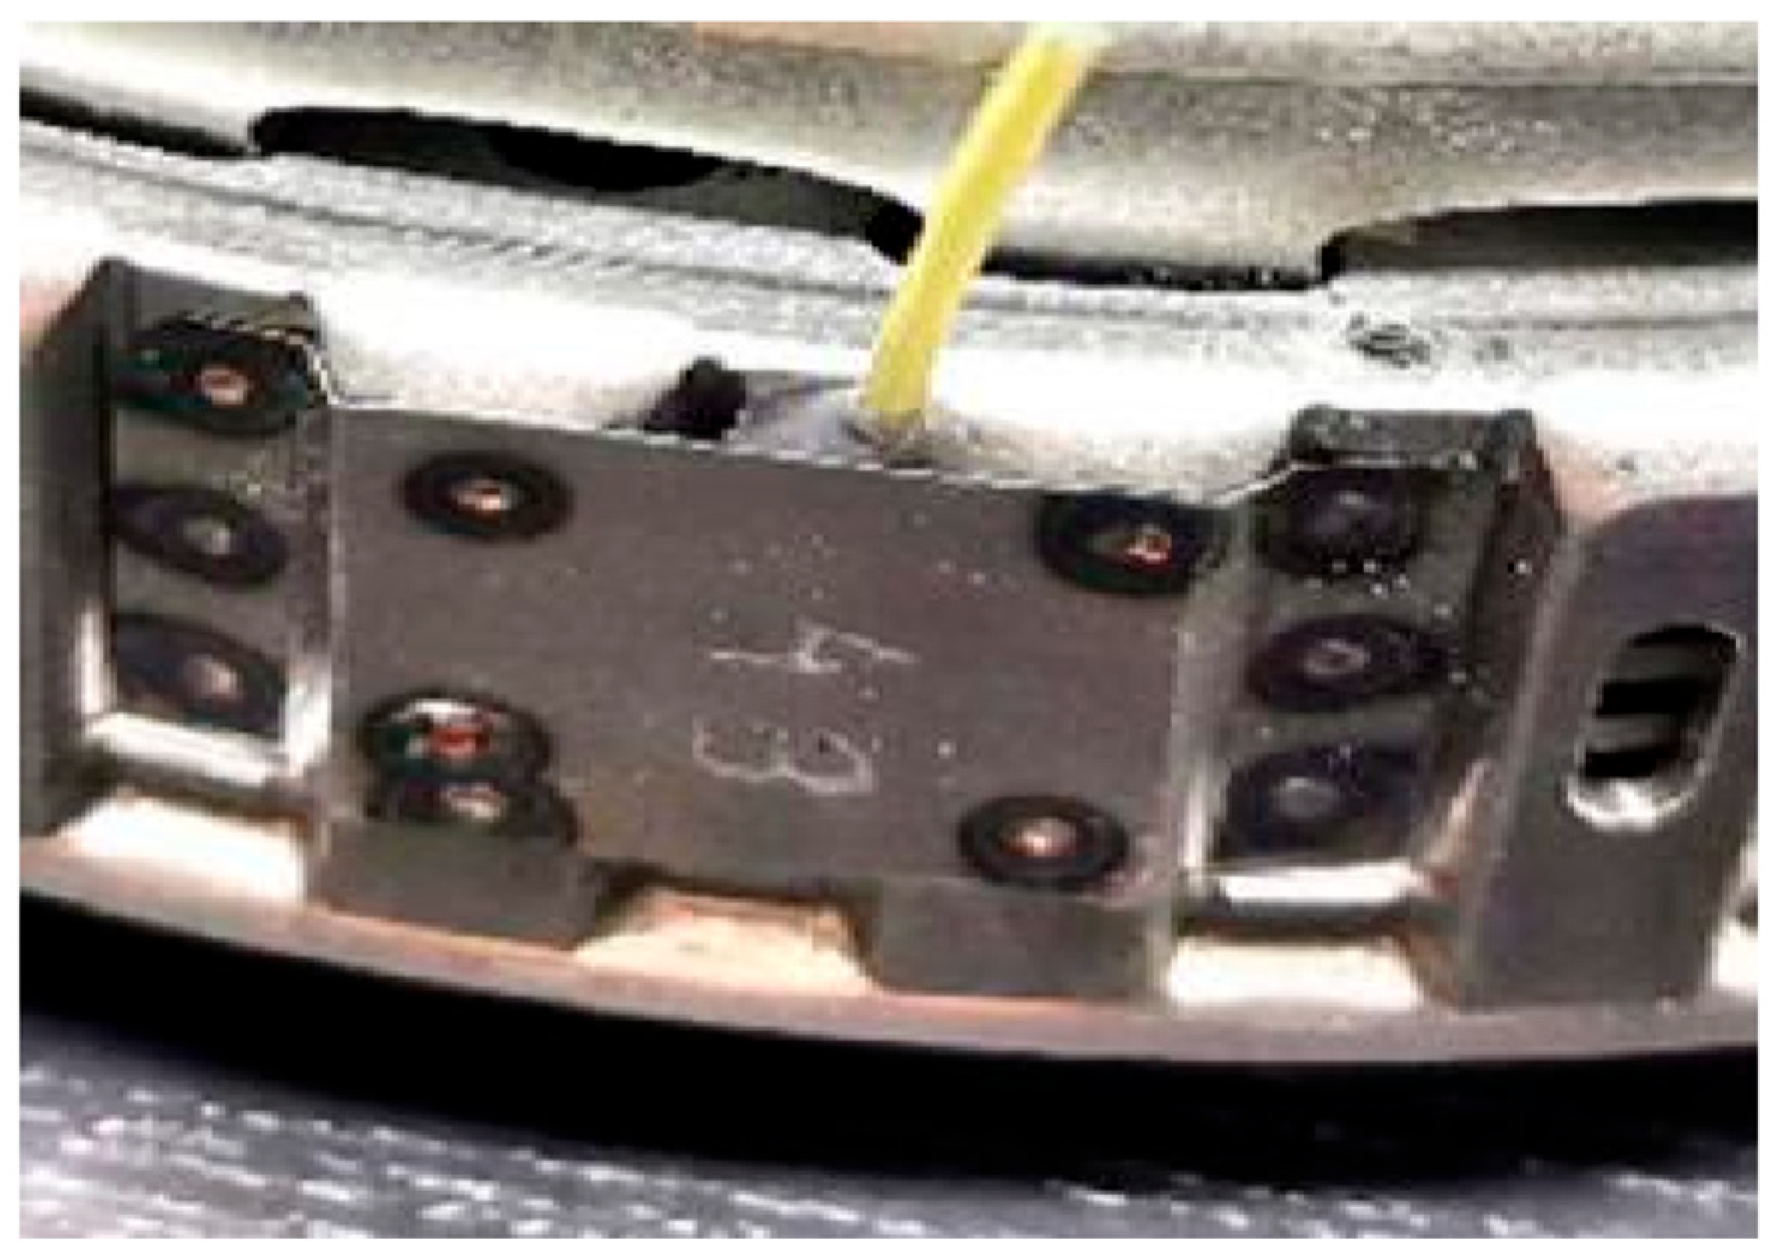
The separator plate with installed thermocouples was assembled according to its pre-disassembly sequence. To prevent the thermocouples from being dislodged by excessive centrifugal force during rotation, the thermocouple wires were sealed with plastic tubes, secured to the housing’s oil outlet using AB adhesive, and finally enclosed by riveting a thin steel plate onto the housing. The physical diagram of the assembled structure is shown in Figure 9.

5.2. Model Verification

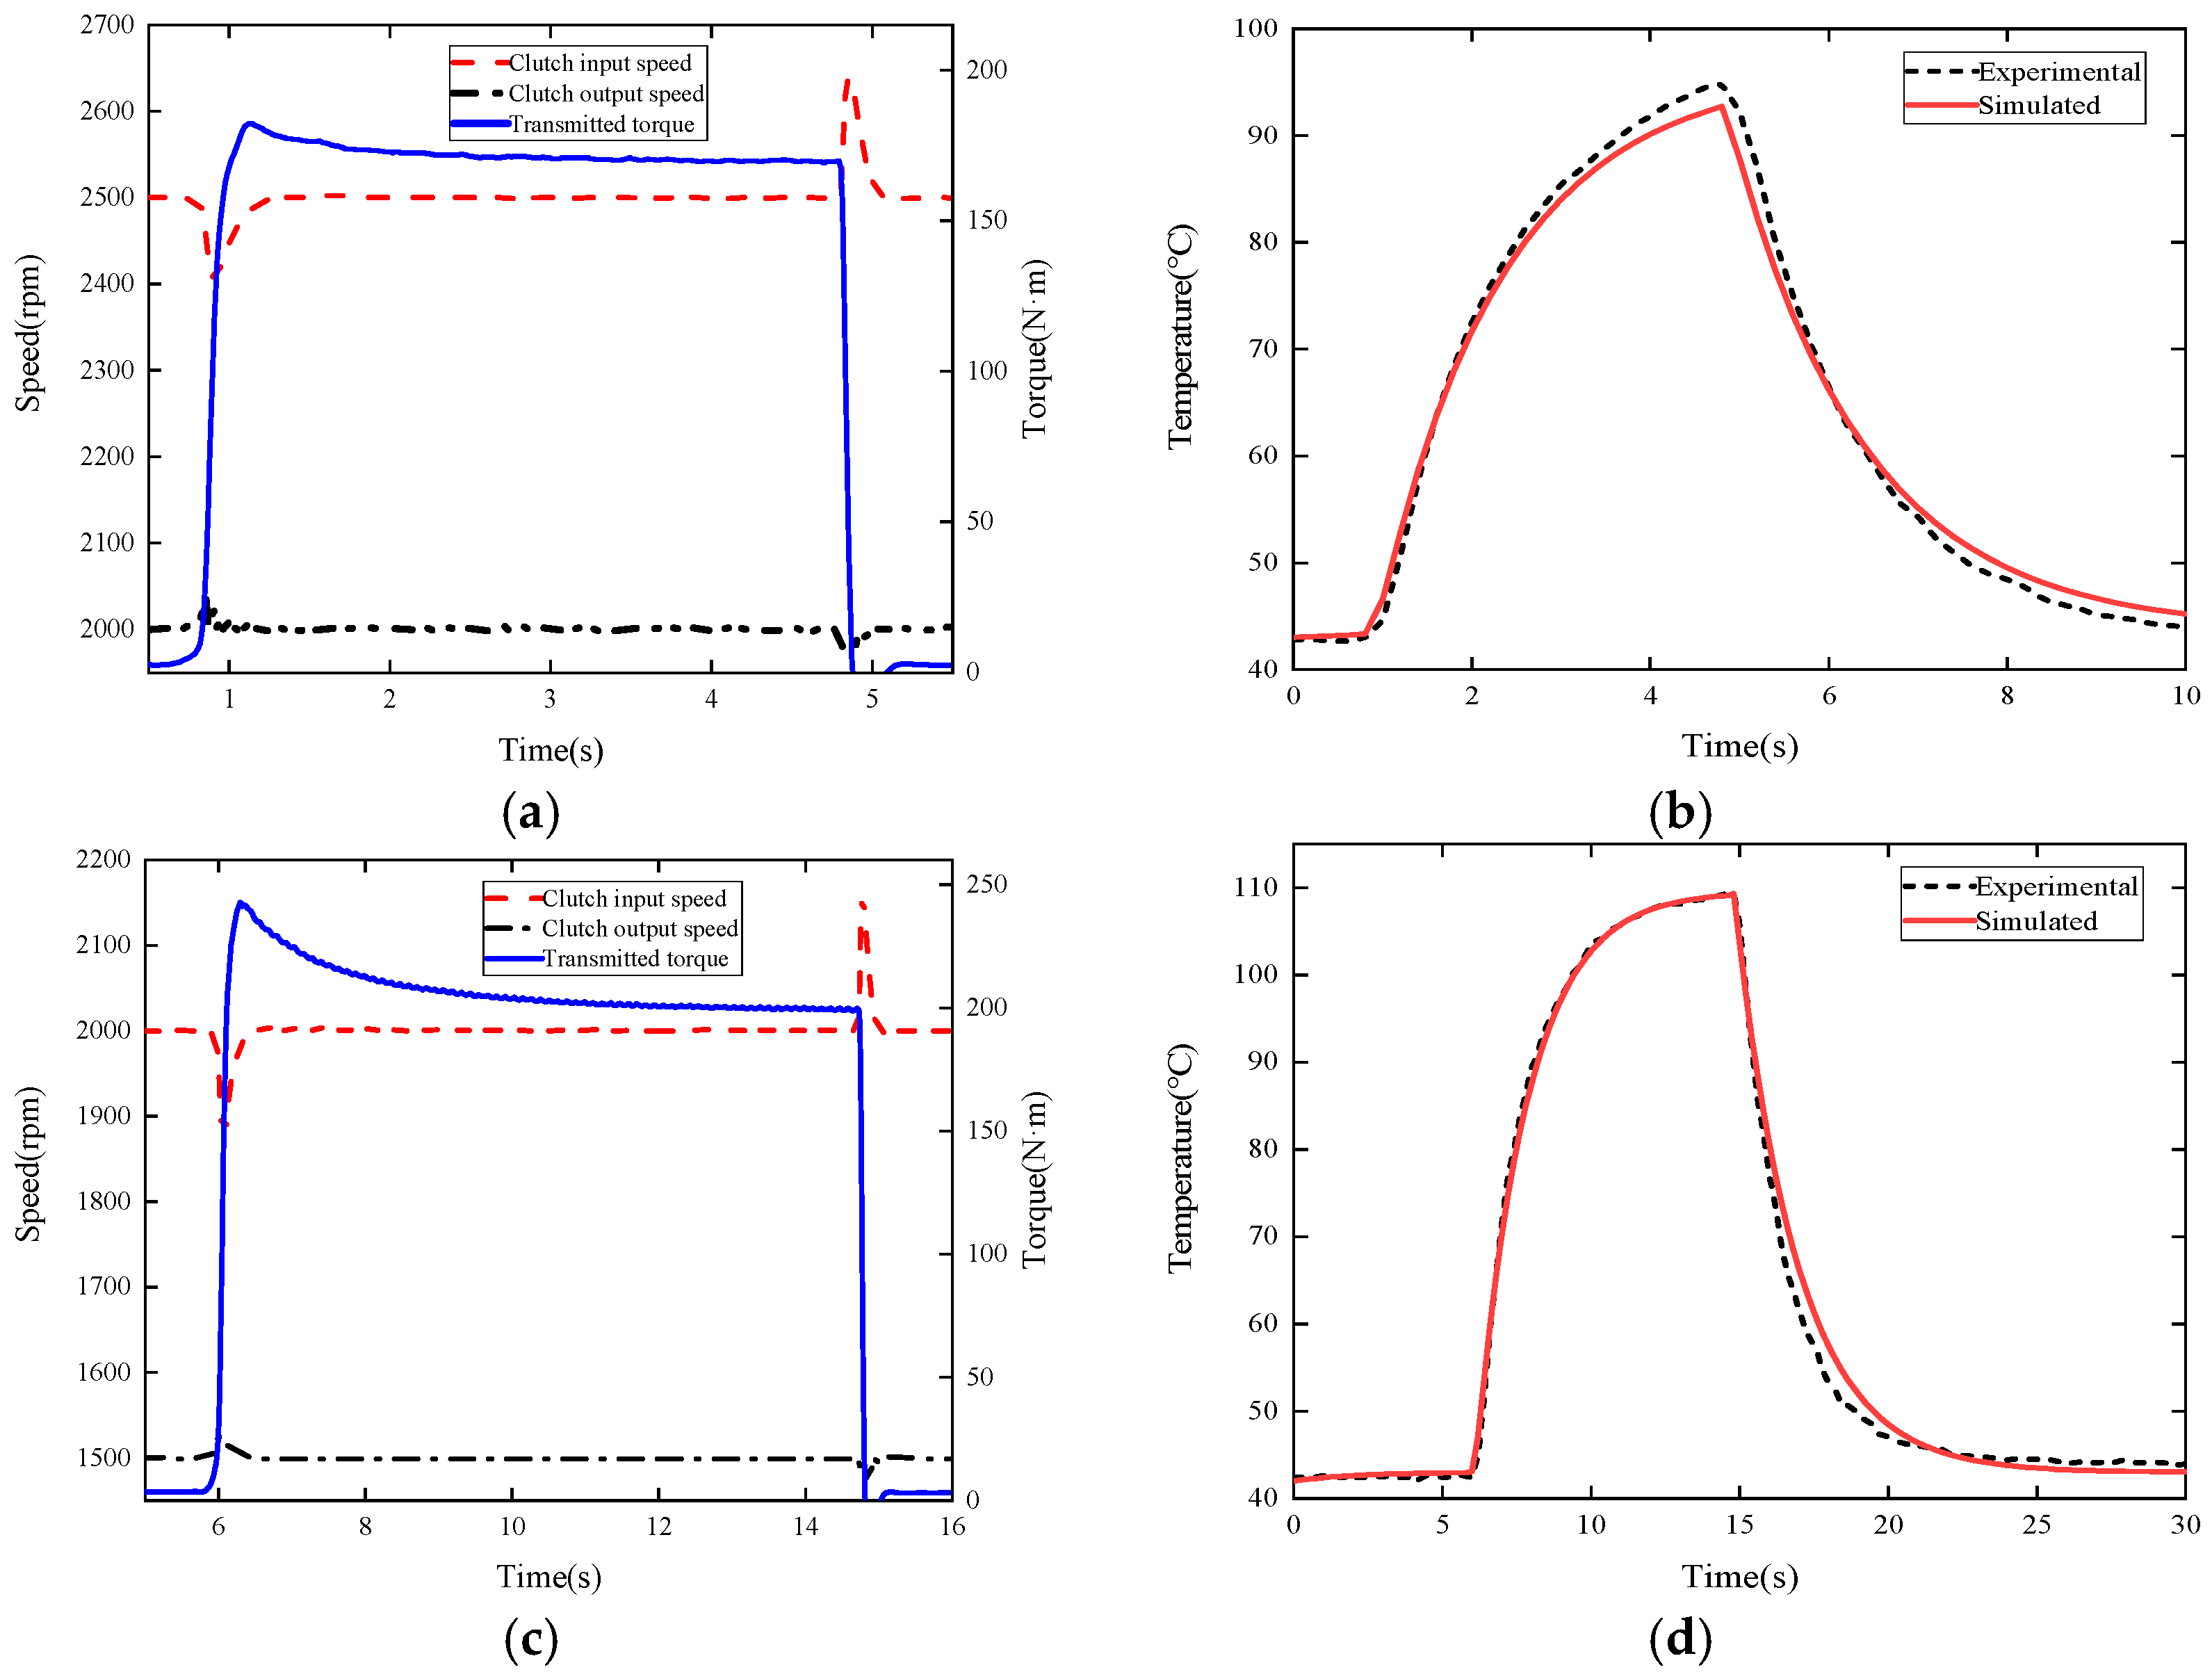
The object of the performance test is the wet DCT, which comprises inner and outer clutches that control the even-numbered and odd-numbered gears, respectively. When the vehicle starts and the gear shifts, the friction pair slip speeds differ, and the temperature change law of the wet clutch separator plate also varies. Therefore, the slip conditions of the inner and outer clutch friction pair are tested. Two working conditions are also tested: high-slip and low-slip speeds. The lubricating oil flow rates under the low-slip and high-slip speed conditions are set to 9 and 25 L/min, respectively. The corresponding clutch input and output speeds, the transmitted torque under high-slip and low-slip speed conditions of the inner and outer clutches, the temperature values of the separator plate, and the predicted temperature results of the model obtained from the test are shown in Figure 10.
Based on Figure 10a,b, the input and output speeds of the inner clutch are 2500 and 2000 rpm, respectively. In the inner clutch, the friction pair starts to slip at 0.7 s. The maximum torque transmitted is 182 N·m, and the slip time is approximately 3.7 s. The peak temperature of the separator plate predicted by the model is 92 °C, and the peak temperature measured by the rig is 94 °C; the peak temperature error is 2%. Moreover, Figure 10c,d show that the input and output speeds of the outer clutch are 2000 and 1500 rpm, respectively. In the outer clutch, the friction pair starts to slip at 5.8 s. The maximum torque transmitted is 242 N·m, and the slip time is approximately 8.6 s. The peak temperature of the separator plate predicted by the model is 110 °C, which is consistent with the temperature measured by the rig.
Figure 10e,f show that the input and output speeds of the inner clutch are 2500 and 500 rpm, respectively. In the inner clutch, the friction pair starts to slip at 0.5 s. The maximum torque transmitted is 336 N·m, and the slip time is approximately 3.3 s. The peak temperature of the separator plate predicted by the model is 221 °C, which is consistent with the temperature measured by the rig. In Figure 10g,h, the input and output speeds of the outer clutch are 2000 rpm and 0, respectively. In the outer clutch, the friction pair starts to slip at 2.9 s, the maximum torque transmitted is 387 N·m, and the slip time is approximately 3.4 s. The peak temperature of the separator plate predicted by the model is 226 °C, and the peak temperature measured by the rig is 224 °C; the peak temperature error does not exceed 1%.
As can be seen from the graph, under low slip conditions, the peak temperature of the inner clutch separator plate is 94 °C, reached at 5 s, while the peak temperature of the outer clutch separator plate is 110 °C, reached at 15 s. Under high slip conditions, the peak temperature of the inner clutch separator plate is 221 °C, reached at 4 s, and the peak temperature of the outer clutch separator plate is 224 °C, also reached at 4 s. Moreover, as can be seen from the torque transfer curve of the clutch in Figure 10, the pressure of the wet clutch increases sharply during the engagement process, then stabilizes, and finally drops rapidly until it reaches zero.
Under low-slip speed test conditions, the real-time dynamic temperature prediction model for the wet clutch separator plate can accurately predict the peak temperature of the inner and outer clutches. Further, the model agrees well with the test results during the heating and cooling processes. Under high-slip speed test conditions, the temperature prediction model can also accurately predict the peak temperatures of the inner and outer clutches. The heating process model conforms well with the test results. However, in the temperature reduction process, there is rapid cooling exhibited in the temperature prediction model. The reason is that during the test, after the friction pair has slipped, the cooling lubricating oil absorbs heat, which causes the temperature of the cooling lubricating oil to increase, which in turn causes the cooling efficiency of the cooling lubricating oil to decrease, especially when the high-slip speed generates a large amount of heat. The real-time dynamic temperature prediction model for wet clutch separator plates only assumes that the cooling lubricant is at a constant value during the working process. In the separation stage, the temperature drop rate of the separator plate obtained by simulation will be faster than the temperature drop rate measured by the test.
However, a slightly higher maximum temperature was predicted for the dual steel plates compared to the experimental results. This discrepancy is primarily attributed to the temperature measurement methodology employed during the bench test. Holes were drilled on the outer teeth of the dual steel plates using electrical discharge machining, and a K-type armored thermocouple was inserted to monitor the temperature. Since the thermocouple was positioned within the plate material rather than at the contact surface where the highest temperatures typically occur, the experimentally recorded values were somewhat lower than the predicted maximum surface temperature. In practical terms, this conservative overestimation of the maximum temperature in the predictive model can be considered advantageous for clutch operation. It enables the control system to implement cooling strategies proactively, such as increasing the cooling flow rate through adjustment of the solenoid valve current or moderately reducing the engagement pressure. Consequently, the risk of clutch failure due to excessive temperatures is effectively mitigated.
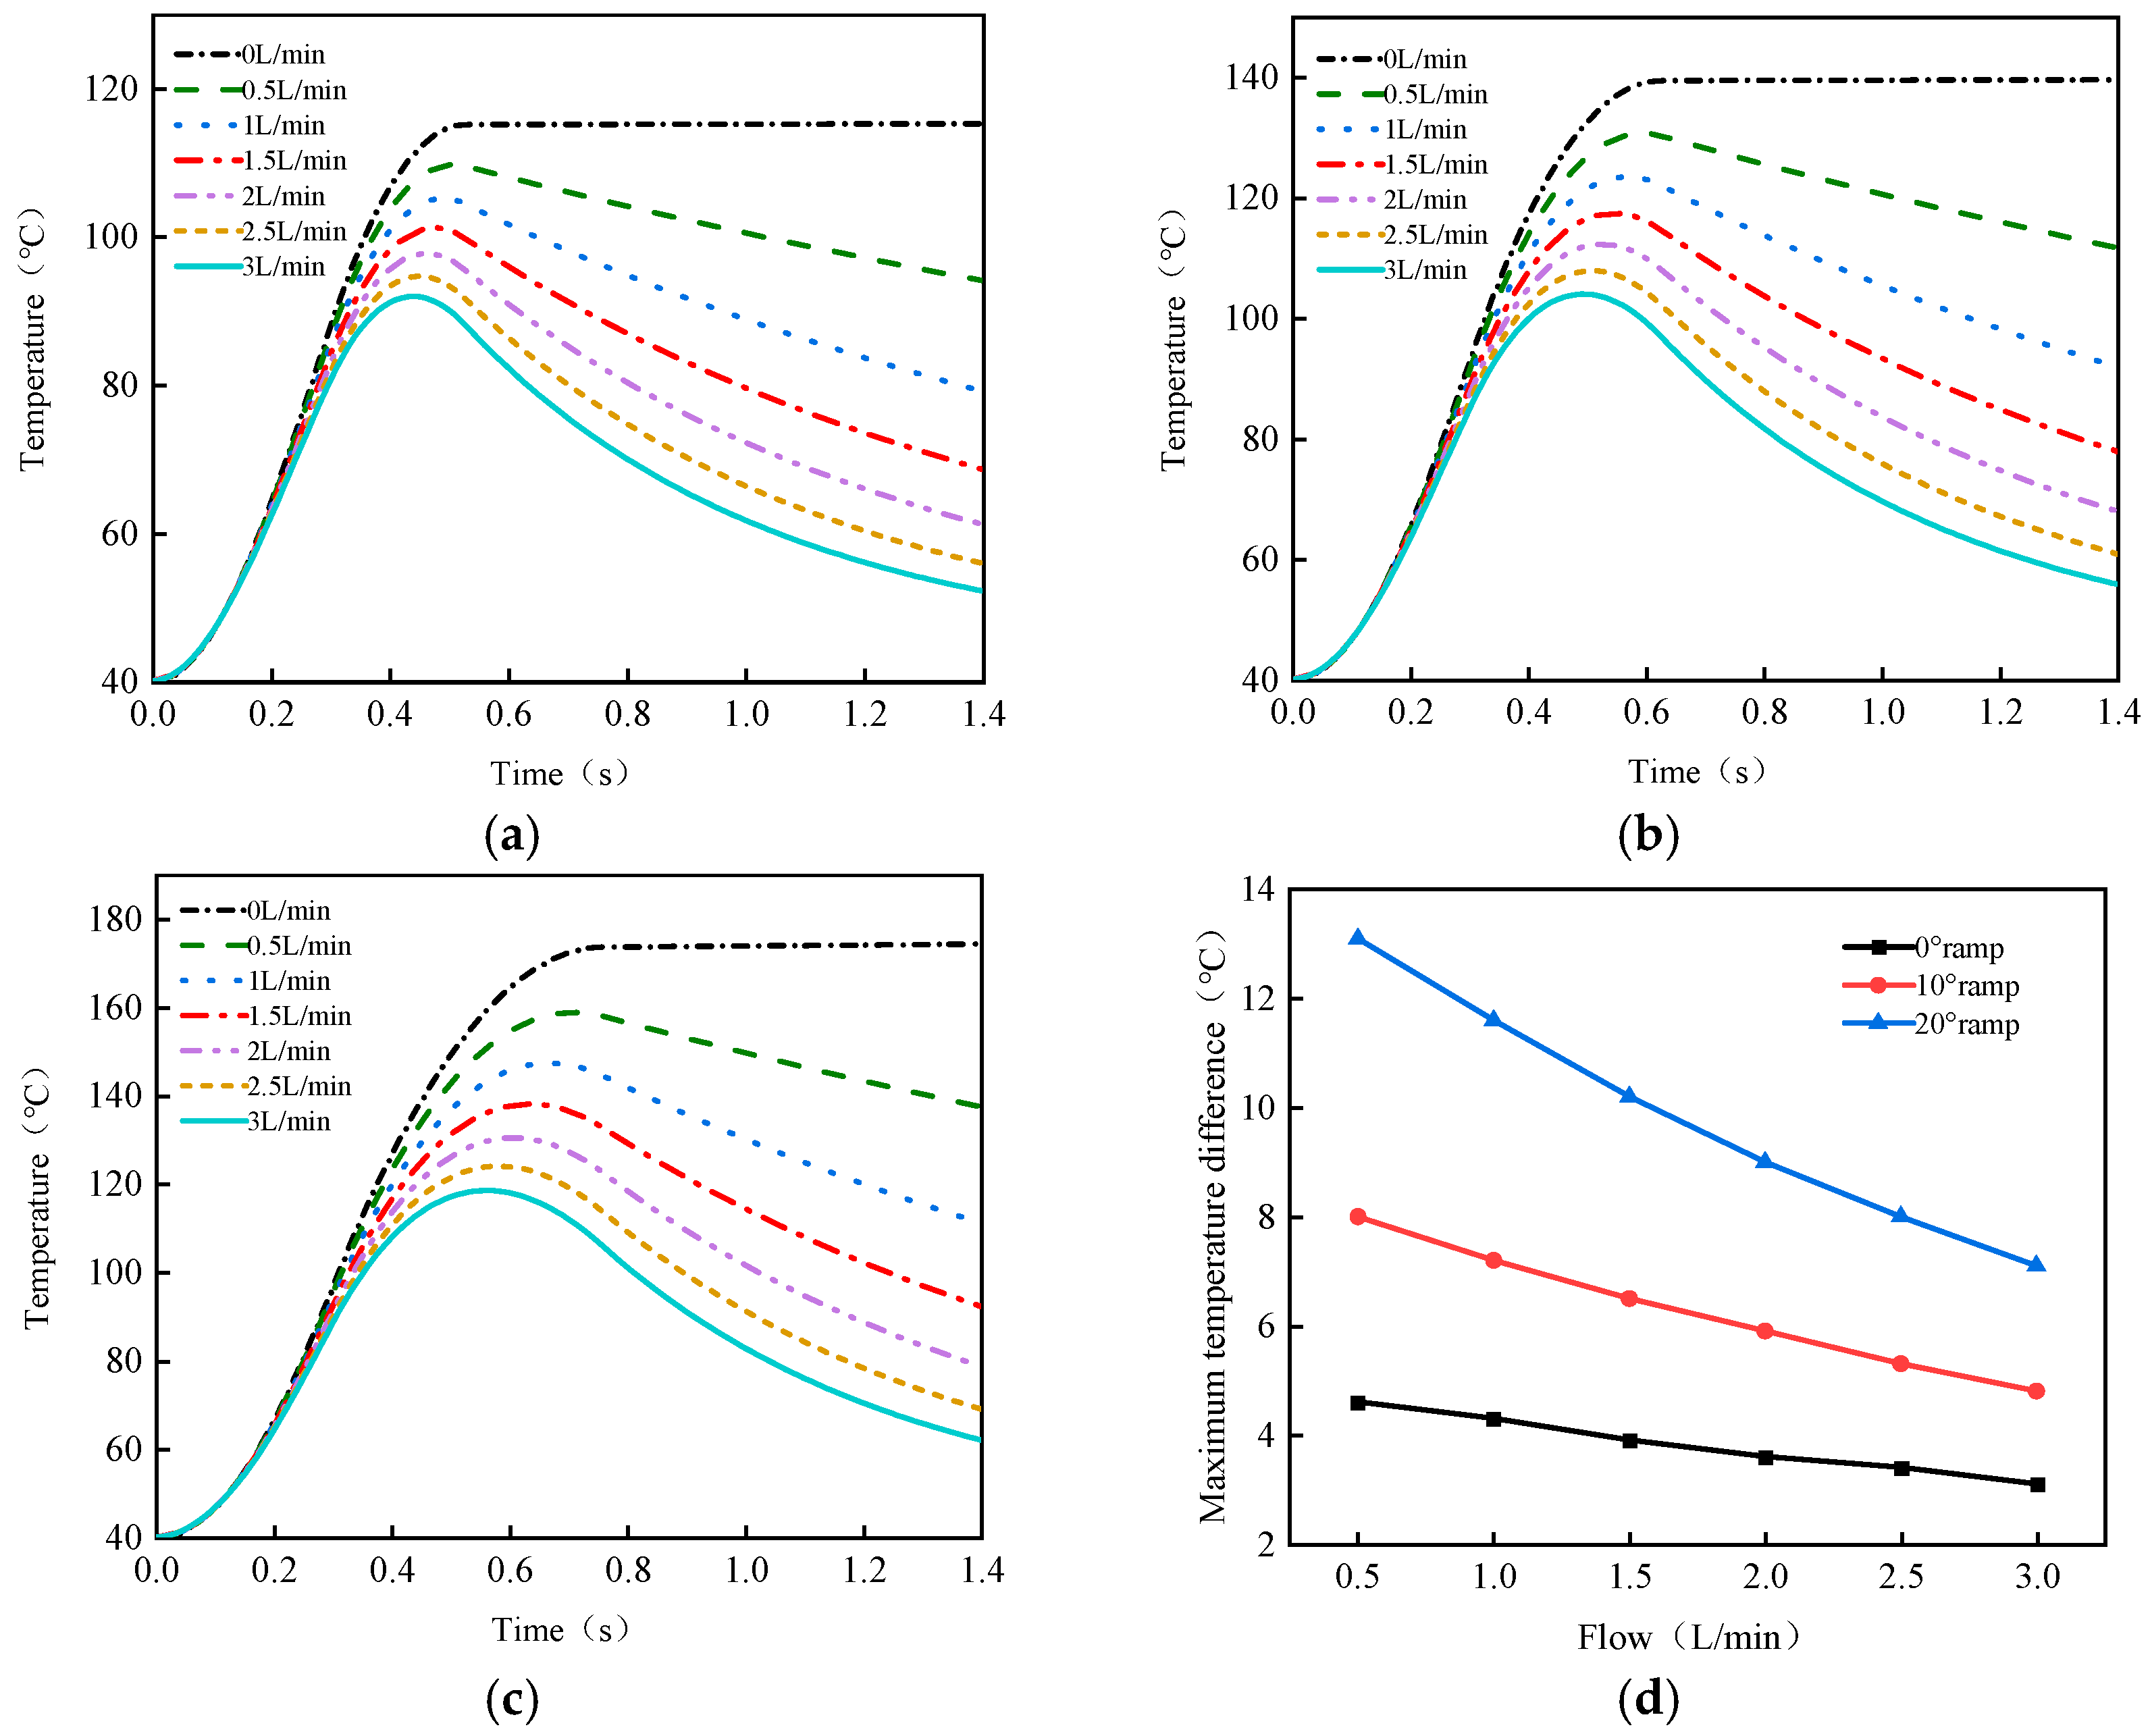
When the wet clutch works, the cooling lubricating oil flow rate is too low, which cannot play a good cooling effect, which will make the clutch temperature too high; if the cooling lubricating oil flow rate is too high, it will increase the belt discharge torque, and then affect the performance of the transmission. Therefore, the temperature change of the steel plate under different cooling lubricating oil flow rates is obtained by using the real-time dynamic temperature model, as shown in Figure 11. The thermal characteristics of steel plates during wet clutch engagement under varying cooling lubricant flow rates were analyzed experimentally. Under a no-flow condition (0 L/min), the peak temperatures reached 114 °C, 138.6 °C, and 171.9 °C, respectively, for three distinct engagement ramp profiles. Quantitative analysis revealed a characteristic temperature evolution pattern: during the initial engagement phase (0–1 s), the heating rates of the steel plates were comparable across all flow rate conditions, as the thermal dissipation from the oil film formation had not yet attained equilibrium. However, notable differences emerged during the steady engagement phase (2–4 s), where higher flow rates significantly suppressed temperature peaks. Notably, in the high-energy 20° ramp condition—where initial transient heating was most pronounced—increasing the lubricant flow rate resulted in a steeper temperature rise mitigation gradient due to enhanced heat extraction.
Conversely, the impact of increased flow rates diminished during the latter cooling phase. As illustrated in Figure 11d, beyond the critical 1.5 L/min threshold, further flow rate increments to 3 L/min produced minimal improvements in temperature differential reduction and post-peak cooling efficiency. This saturation effect was most evident in the 0° ramp scenario, where the inter-plate maximum temperature differential converged asymptotically across flow rates beyond 1.5 L/min, indicating a transition to dominant conduction-based heat transfer.
The findings underscore the existence of an optimal flow rate regime for wet clutch thermal management. While elevated cooling flow rates improve peak temperature suppression ratios, excessive flow does not confer proportional thermal benefits in the post-engagement phase. Optimal selection of cooling lubricant flow rate thus represents a critical design parameter for balancing interfacial thermal management and transmission efficiency, as it dictates the trade-off between transient thermal shock mitigation and static heat dissipation capacity.
This work establishes quantitative benchmarks for clutch cooling system design, suggesting that flow rate optimization is more impactful when targeting extreme thermal load scenarios (e.g., 20° ramps) rather than low-energy engagements. Properly engineered cooling strategies hold potential to simultaneously enhance durability and power transmission performance through precise thermomechanical control.

6. Conclusions

In this work, the heat generation and exchange mechanisms of the wet clutch friction pair were analyzed. The temperature model was simplified, and the power coefficient of the temperature rise was introduced. Moreover, the cooling power coefficient was introduced, and a real-time dynamic temperature prediction model for the wet clutch separator plate was formulated. The model was verified through rig tests.
The results indicate that when the temperature prediction model is applied to the inner and outer clutches under either high or low slip speed test conditions, the simulation results for the separator plates align with the temperatures measured experimentally, with the dynamic peak temperature error remaining within 2 °C. Additionally, the real-time temperature model was used to analyze the temperature changes of the steel plates under different cooling lubricant oil flow rates. The findings emphasize that there exists an optimal flow rate state for the thermal management of wet clutches. Although increasing the cooling flow rate can improve the peak temperature suppression rate, during the post-engagement phase, excessively high flow rates do not provide proportional thermal benefits.
The model predicts the temperature of the clutch separator plate and provides real-time temperature data to the controller. By adjusting the control strategy, when the heat generated is high, the solenoid valve current is reduced, the cooling oil flow is increased, and the engagement pressure is reduced to protect the clutch. When the heat generation is low, the cooling flow can be appropriately reduced to ensure excellent shifting quality to improve vehicle performance.
During the research process, certain shortcomings were identified due to inherent limitations in our capabilities. Future studies may focus on several aspects to facilitate improvement and refinement. Firstly, machine learning surrogate models could be employed, where high-fidelity computational fluid dynamics data or experimental data are used to train neural networks. This approach would enable the construction of ultra-fast temperature predictors capable of being integrated into real-time control systems, thereby overcoming the bottlenecks associated with computational efficiency and accuracy in traditional methods. Secondly, health management could be integrated with temperature prediction by incorporating time series models, such as Long Short-Term Memory networks. Such integration would allow for the prediction of future temperature trends in clutches and provide early warnings of abnormal heating, thus offering core support for the implementation of predictive health management.

Author Contributions

Conceptualization, Z.Z. and Y.L.; methodology, X.Y.; software, Z.Z. and X.Y.; validation, Z.Z., Y.L., and X.Y.; formal analysis, Y.L.; investigation, Y.L.; resources, Z.Z.; data curation, Z.Z.; writing—original draft preparation, X.Y.; writing—review and editing, Z.Z., Y.L., and X.Y.; visualization, X.Y.; supervision, Y.L.; project administration, Y.L.; funding acquisition, Y.L. All authors have read and agreed to the published version of the manuscript.

Funding

This research was funded by the National Natural Science Foundation of China (Grant No. 52172355), Chongqing Talent Program Contract System Project (Grant No. cstc2021ycjh-bgzxm0261), Chongqing Natural Science Foundation General Project (Grant No. CSTB2024NSCQ-MSX0101), and Chongqing Education Commission Science and Technology Research Project (Grant No. KJQN202401166). The APC (Article Processing Charge) was funded by the National Natural Science Foundation of China (Grant No. 52172355).

Data Availability Statement

The data that support the findings of this study are not publicly available due to restrictions. Researchers interested in accessing the data may contact the corresponding author for further details, subject to institutional and ethical review approvals.

Conflicts of Interest

The authors declare no conflict of interest.

Nomenclature

SymbolNameUnit
T c A clutch transmits torque  N m
T e Engine output torque  N m
μ Coefficient of friction--
F Clutch clamping forceN
NNumber of friction surfaces--
R m Effective friction radiusm
ω e Clutch drive end rotational speedrad/s
ω c Speed of the clutch-driven endrad/s
σ Average normal pressure on the friction surfacePa
R 1 Inner diameter of the friction platem
R 2 Friction plate outer diameterm
R m Effective friction radiusm
QSliding friction powerW
β Heat flow distribution coefficient--
q s Heat flux density of the paired steel sheets  J / ( m 2 s )
q f Heat flux density of the friction plate  J / ( m 2 s )
λ s Thermal conductivity of the dual steel sheet  W m 1 K 1
λ f Thermal conductivity of the friction material  W m 1 K 1
ρ s The density of the dual steel sheet  kg m 3
ρ f The density of the friction plate  kg m 3
c s Specific heat capacity of the dual steel sheet  J kg 1 K 1
c f Specific heat capacity of the friction disc  J kg 1 K 1
T s s The temperature of the friction working surface of the baffle°C
T i n Lubricating oil temperature°C
A s Friction working surface flow area  m 2

References

  1. Pointner-Gabriel, L.; Flamm, S.; Menzel, M.; Voelkel, K.; Stahl, K. Experimental investigation of drag loss and plate separation behavior of wet clutches under external forces. Results Eng. 2024, 24, 102918. [Google Scholar] [CrossRef]
  2. Shin, S.; Choi, S.B. Control-oriented modeling of wet clutch friction considering thermal dynamics. Mechatronics 2024, 99, 103146. [Google Scholar] [CrossRef]
  3. Skulić, A.; Milojević, S.; Marić, D.; Ivanović, L.; Krstić, B.; Radojković, M.; Stojanović, B. The Impact of Lubricant Viscosity and Materials on Power Losses and Efficiency of Worm Gearbox. Teh. Vjesn.-Teh. Gaz. 2022, 29, 1853–1860. [Google Scholar] [CrossRef]
  4. Wang, Q.; Zhang, X.; Wang, D.; Cui, H.; Zhang, S.; Wang, J. Numerical simulation and experimental investigation on the thermal-fluid-solid multi-physical field coupling characteristics of wet friction pairs considering cavitation effect. Appl. Therm. Eng. 2025, 260, 124955. [Google Scholar] [CrossRef]
  5. Wu, J.; Yang, C.; Zhang, H.; Wang, L. The Cross-Scale Interactive Simulation and Artificial Neural Network Failure Prediction of Temperature Field on Wet Friction Interface. IEEE Trans. Instrum. Meas. 2025, 74, 2518012. [Google Scholar] [CrossRef]
  6. Zhang, L.; Zhang, Y.; Wei, C.; Yan, Y. Optimization Design of Oil Groove Shape on the Surface of Friction Plate in High-Speed Wet Clutch Aimed at Minimizing Drag Torque. J. Tribol. 2024, 146, 034601. [Google Scholar] [CrossRef]
  7. Yang, X.; Bao, H.; Zhang, C.; Tan, W.; Zhu, R. Influence of Groove Type on Friction Coefficient of Wet Friction Clutch Pair. Int. J. Automot. Technol. 2024, 25, 119–129. [Google Scholar] [CrossRef]
  8. Li, J.; Jin, W.; Zhang, Z.; Lv, X.; Zhang, T. Analysis on effects of material parameters on thermoelastic instability of separate plate in wet clutch. J. Tribol. 2024, 146, 034103. [Google Scholar] [CrossRef]
  9. Ma, B.; Chen, X.; Zheng, C.; Yu, L.; Zhao, Q.; Lu, W. Study on Spline Stress of Separator Plates in a Wet Multi-Plate Clutch. Materials 2024, 17, 3039. [Google Scholar] [CrossRef]
  10. Wu, B. Friction Coefficient of Wet Clutches as a Function of Service Mileage. Lubricants 2024, 12, 147. [Google Scholar] [CrossRef]
  11. Li, A.; Qin, D.; Guo, Z. Adaptive torque control of wet dual clutch based on dynamic friction coefficient estimation. Mechatronics 2024, 100, 103175. [Google Scholar] [CrossRef]
  12. Zhang, L.; Zhou, H.; Zhang, P.; Wei, C.; Ma, N.; Yan, Y. Research on high-speed drag torque characteristics of wet clutches based on mechanism and data-driven approach. Nonlinear Dyn. 2024, 113, 6235–6252. [Google Scholar] [CrossRef]
  13. Zhou, W.; Su, H.; Liu, H.; Zhang, Y.; Qiu, N.; Gao, B. Leakage and Rotordynamic Performance of a Semi-Y Labyrinth Seal Structure for Centrifugal Pump Based on Multifrequency Whirl Method. ASME J. Eng. Gas Turbines Power 2025, 147, 101022. [Google Scholar] [CrossRef]
  14. Huang, Z.; Bao, H.; Xiao, Y.; Wei, Y. Transient thermal characteristic analysis and experimental validation of aviation wet friction clutch. J. Mech. Sci. Technol. 2025, 39, 2269–2283. [Google Scholar] [CrossRef]
  15. Pointner-Gabriel, L.; Flamm, S.; Schneider, T.; Stahl, K. A methodology for image-based measurement of plate movement in disengaged wet clutches. Sci. Rep. 2024, 14, 7631. [Google Scholar] [CrossRef]
  16. Feng, Y.; Zheng, C.; Yu, L.; Zhang, D.; Zhang, Y.; Zhou, R. A bivariate inverse Gaussian degradation process induced by a common random effect with RUL prediction for wet clutches. Measurement 2025, 251, 117284. [Google Scholar] [CrossRef]
  17. Bălășoiu, G.; Munteniță, C.; Amortila, V.T.; Titire, L. Optimisation of Clutch Disc Friction Material Using a Multi-Layer Perceptron Artificial Neural Network. Polymers 2024, 16, 3588. [Google Scholar] [CrossRef]
  18. Wang, B.; Wang, J.; Chen, L.; Ning, K.; Li, H. Effect of different sliding conditions on interface tribological behavior of friction torque limiter. Tribol. Int. 2025, 205, 110551. [Google Scholar] [CrossRef]
  19. Dong, Y.; Ma, B.; Xiong, C.; Zhao, Q.; Chen, H.; Zhang, Y.; Xie, G. Tribological and Wear Properties of Cu-Based Composite Reinforced by Core–Shell Structure in Multi-disk Clutch. Tribol. Lett. 2024, 72, 66. [Google Scholar] [CrossRef]
  20. Byeon, S.-J.; Kim, S.-J.; Park, J.-K.; Park, Y.-J.; Lee, J.-W. Parameter study for establishing a synchronizer control strategy in tractor dual-clutch transmission. Agriculture 2024, 14, 218. [Google Scholar] [CrossRef]
  21. Zhao, Y.; Chen, H.; Pan, W.; Cai, W.; Zhou, Y.; Zhai, B.; Ni, X. Nonlinear dynamic separation characteristics of friction pair and experimental analysis. Sci. Rep. 2024, 14, 8751. [Google Scholar] [CrossRef]
  22. Wu, B.; Qin, D.; Hu, J.; Wang, X.; Wang, Y.; Lv, H. Analysis of influencing factors and changing laws on friction behavior of wet clutch. Tribol. Int. 2021, 162, 107125. [Google Scholar] [CrossRef]
  23. Shan, L.; Wei, L.; Qiang, Y.; Cui, Y.; Zhan, P. Dynamic performance prediction and experimental analysis of wet clutch actuator considering thermal flow characteristics. Flow Meas. Instrum. 2024, 97, 102592. [Google Scholar] [CrossRef]
  24. Li, A.; Qin, D.; Guo, Z.; Xia, Y.; Lv, C. Wet clutch pressure hysteresis compensation control under variable oil temperatures for electro-hydraulic actuators. Control Eng. Pract. 2023, 141, 105723. [Google Scholar] [CrossRef]
  25. Rogkas, N.; Vasilopoulos, L.; Spitas, V. A hybrid transient/quasi-static model for wet clutch engagement. Int. J. Mech. Sci. 2023, 256, 108507. [Google Scholar] [CrossRef]
  26. Zhang, Z.; Mu, Z.; Yu, X. Mechanistic Study of Groove Parameters on the Thermoelastic Instability of Wet Clutch. Lubricants 2025, 13, 150. [Google Scholar] [CrossRef]
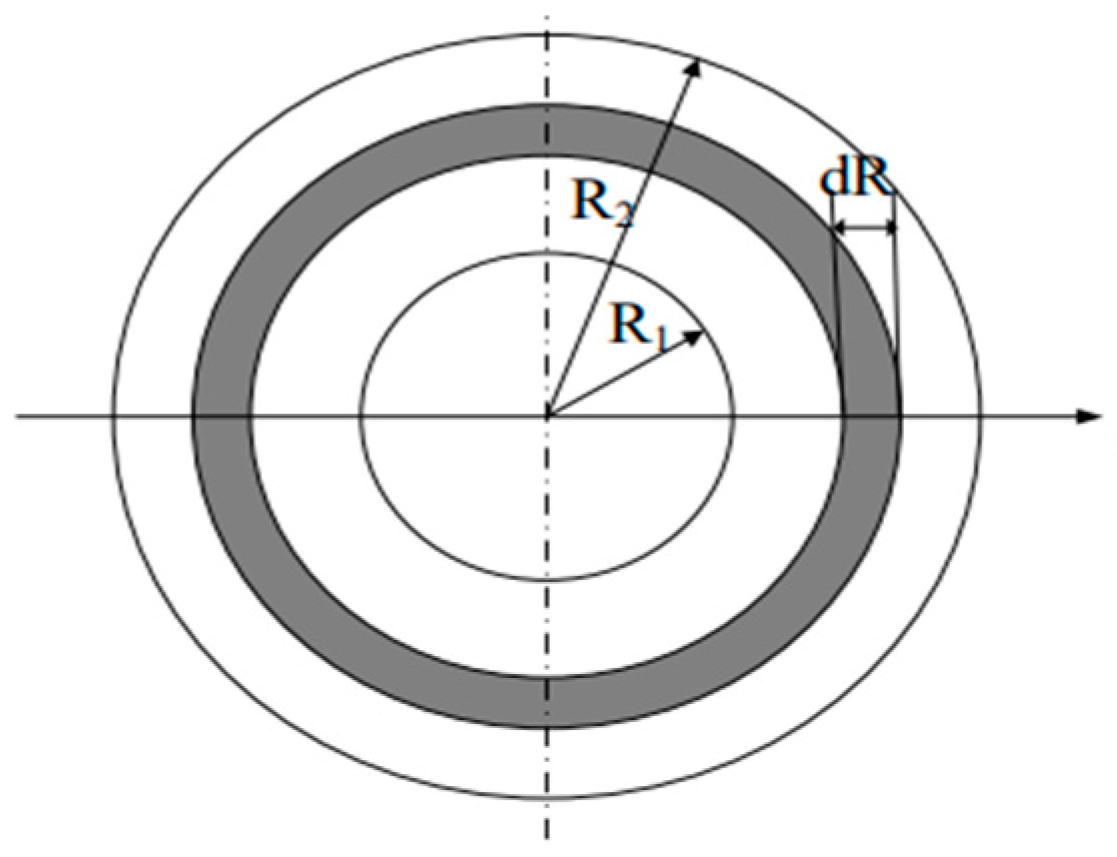
Figure 1. Clutch friction surface.
Lubricants 13 00425 g001
Figure 2. The schematics of the separator and the friction plate.
Lubricants 13 00425 g002
Figure 3. Temperature distribution pattern of the clutch structure. (a) Counter Steel Plate. (b) Friction Lining.
Lubricants 13 00425 g003
Figure 4. Dynamic Temperature Prediction for Wet Clutch Plates.
Lubricants 13 00425 g004
Figure 5. Principles of wet clutch test rig.
Lubricants 13 00425 g005
Figure 6. Comprehensive performance test rig of wet clutch.
Lubricants 13 00425 g006
Figure 7. Embedding position of thermocouple.
Lubricants 13 00425 g007
Figure 8. Thermocouple installation position.
Lubricants 13 00425 g008
Figure 9. Fully assembled wet clutch.
Lubricants 13 00425 g009
Figure 10. Comparison of test conditions of inner and outer clutches and temperature results of the separator plate. (a) Low-slip speed test conditions of the inner clutch. (b) Separator plate temperature during low-slip testing. (c) Low-slip speed test conditions of the outer clutch. (d) Separator plate temperature during low-slip testing. (e) High-slip speed test conditions of the inner clutch. (f) Separator plate temperature during high-slip testing. (g) High-slip speed test conditions of the outer clutch. (h) Separator plate temperature during high-slip testing.
Lubricants 13 00425 g010aLubricants 13 00425 g010b
Figure 11. Temperature result of the steel plate. (a) 0° ramp. (b) 10° ramp. (c) 20° ramp. (d) The maximum temperature difference of the steel plate.
Lubricants 13 00425 g011
Table 1. Geometric Dimensions of the Wet Clutch Friction Pair.
Geometric ParameterCounter Steel PlateFriction Core PlateFriction Lining
Inner Diameter/m0.1060.1060.106
Outer Diameter/m0.1380.1380.138
Tooth Height/m0.0030.002--
Number of Teeth/pc2632--
Thickness/m0.00180.00080.0005
Groove Width/m  0.002
Groove Depth/m  0.0005
Number of Grooves/pc  56
Table 2. Physical parameters of the wet clutch.
ParametersSeparator PlateFriction Plate
Thermal Conductivity (W·(m·°C)−1)4454
Elastic Modulus (Pa)2.1 × 10112.26 × 1010
Poisson’s Ratio0.30.3
Thermal Expansion Coefficient5.72 × 10−51.27 × 10⁻⁵
Density (kg·m−3)7800833
Specific heat capacity (J·(kg·°C)−1)4601740
Table 3. Physical parameters of cooling lubricating oil (40 °C).
ParametersValues
Density (kg·m−3)788.8
Thermal Conductivity (W·(m·°C)−1)0.1322
Specific Heat Capacity (J·(kg·°C)−1)2328.6
Dynamic Viscosity (Pa·s)0.028891
Prandtl Constant367.5
Table 4. Detailed Sensor Parameters.
Sensor TypeMeasurement RangeAccuracy
Torque Sensor±500 N·m±0.1%F.S.
Speed Sensor0~12,000 rpm1 rpm
Pressure Sensor0~50 bar±0.1%F.S.
Temperature Sensor−40~1000 °C1 °C
Disclaimer/Publisher’s Note: The statements, opinions and data contained in all publications are solely those of the individual author(s) and contributor(s) and not of MDPI and/or the editor(s). MDPI and/or the editor(s) disclaim responsibility for any injury to people or property resulting from any ideas, methods, instructions or products referred to in the content.