1. Introduction
The organic Rankine cycle (ORC) system, with organic substances as the working fluid, exhibits outstanding compactness and compatibility with various heat sources, making it an ideal solution for waste heat recovery and small-scale reactors [
1,
2]. Gas bearings lubricated by organic working fluid offer advantages such as low friction loss, system simplicity, and high adaptability, becoming a critical component in ORC applications. Among various types of gas bearings, the aerodynamic journal bearing is the most classical design, characterized by its simple structure. In the study of bearings, static characteristics, such as load and attitude angle, are critical performance indicators in theoretical design. Load determines whether the bearing can adequately support the rotor, and the attitude angle reflects the stability. Parameters such as the average gas film thickness, eccentricity ratio, rotational speed, and environmental pressure significantly affect static characteristics, making their investigation essential for the design and manufacturing of gas bearings. The classical Reynolds equation, proposed by Reynolds [
3], established the foundation of fluid lubrication theory and remains the cornerstone for analyzing gas bearing performance. Li [
4] proposed a new iterative method for solving the Reynolds equation based on the finite difference method (FDM), and applied it to the analysis of high-speed gas-lubricated journal bearings. The method demonstrated excellent convergence properties. Wang [
5] further explored the relationship between static characteristics and misalignment angle by solving the Reynolds equation. Peng [
6] derived an extended Reynolds equation considering the inertial force of the compressible gas film and solved it using the Streamline Upwind Petrov–Galerkin Finite Element Method (SUPG FEM). The results showed that manufacturing errors have a significant impact on the static characteristics of bearings.
The classical Reynolds lubrication equation provides a relatively simple approach for fast calculation of the static characteristics. However, it relies on numerous assumptions, making it challenging to accurately describe the actual operating conditions of gas bearings. When the gas film space approaches the molecular mean free path, a rarefied gas effect occurs on the surfaces of the bearing. Under these conditions, the velocity slip boundary becomes significant and the traditional continuum hypothesis is no longer applicable. In 1959, Burgdorfer [
7] introduced the first-order velocity slip model to modify the Reynolds equation for bearings. Based on gas kinetic theory, Wu [
8] further refined this model by adjusting the length scale to the gas molecule mean free path in a Taylor series expansion of the mean velocity field, deriving new first-order and second-order slip models. Currently, velocity slip models are widely applied in the study of gas bearings and are effective in static and dynamic characteristic prediction [
9,
10,
11].
In addition to the rarefied gas effect, surface roughness also plays a critical role in the design process of bearings. Machining processes and operational wear inevitably introduce surface irregularities and lead to deviations from the intended roughness values. This phenomenon in turn impacts the static characteristics of bearings. Kim [
12] experimentally investigated the influence of surface roughness on the lifetime of PTFE coatings on Inconel-X750—a material common in gas foil bearings (GFBs)—through tribological reciprocating tests. Li [
13] simulated wear distribution using a stochastic process and employed the view of probability to describe variations in the characteristics of bearings. The findings revealed that surface roughness in the primary load-bearing area and axial ends had the most significant influence on overall bearing characteristics. Chu [
14] developed a numerical correction model to analyze the manufacturing error effect of pad thickness differences on the static characteristics of GFTBs. Shi [
15] investigated the influence of tilt angle, tilt center position, and surface waviness on bearing performance.
In summary, most existing research has focused on conventional working fluid, such as air, helium, and carbon dioxide [
16,
17,
18]. Studies on specialized working fluid, such as organic gases, are relatively limited. Wu [
19,
20] explored the application of self-lubricated organic working fluid bearings in an organic Rankine cycle radial inflow turbogenerator. During operation, the gas of R245fa first flows into the aerostatic radial bearing to form a gas film before entering the turbine blades. Rosset [
21] experimentally investigated a small-scale organic Rankine cycle turbogenerator supported by gas bearings with R245fa as the working fluid. The experiment results demonstrated the high-speed and low-loss potential of gas bearings for small-scale expanders. Compared to traditional working fluid, organic working fluid exhibits distinct physical properties, such as high molecular mass and low viscosity, which directly influence the operating state of the gas inside the bearing. These unique properties may lead to performance variations under microscale effects. Consequently, it is of significant importance to carry out an influence factor study on the static characteristics of organic working fluid bearings considering microscale effects.
During actual production and operation, factors such as bearing surface wear, machining errors, and fluctuations of condition parameters exhibit significant randomness and variability. These random uncertainties can influence the static characteristics of bearings to some extent. To analyze these effects, uncertainty quantification is introduced to bearing fields. This method evaluates the propagation of uncertainties from inputs to outputs and quantifies the contributions of uncertain parameters to output variability. It has been in wide use in the performance analysis of turbomachinery and localized systems [
22,
23,
24,
25,
26], providing valuable guidance for the design and manufacturing of industrial equipment and systems. Lou [
27] applied a variance-based global sensitivity analysis method to investigate the uncertainty quantification of five-pad journal bearing. Using the Fourier Amplitude Sensitivity Test (FAST), Lou analyzed and evaluated the first-order sensitivity indicators of static characteristics influenced by five normally distributed parameters, like the pivot radius and pad angular extent. Wu [
28] quantitatively evaluated the effects of uncertain factors employing sparse polynomial chaos expansion, including supply pressure, bearing length, and eccentricity ratio on mass flow rate and load in porous hydrostatic gas bearings. Overall, there have been relatively few investigations into the uncertainty quantification of gas bearings. Existing research has predominantly focused on the effect of structural parameters or environment factors of specific bearings, and have not accounted for microscale effects.
Based on the above research and analyses, in order to serve the organic Rankine cycle that may be applied in waste heat recovery and small nuclear reactors, it is necessary to conduct research on organic working fluid bearings. For their design, this paper investigates the static characteristics of organic working fluid aerodynamic journal bearings under microscale effects. In order to guide the parameter fluctuations of the bearings during their actual production and operation process, uncertainty quantification is conducted to measure these variations. The innovative contributions are as follows: (1) Static characteristic analysis of organic working fluid aerodynamic journal bearings is conducted to investigate the influence of structural and operating parameters. (2) The rarefied gas effect and surface roughness effect are innovatively incorporated into static characteristic analysis. (3) Considering parameter fluctuations and manufacturing errors, the effects of parameter uncertainty on the static characteristics are analyzed from multiple perspectives with the Morris method, Sobol method, and kernel density estimation (KDE) method.
The rest of this paper is organized as follows:
Section 2 shows the numerical methods, including the numerical calculation model of aerodynamic journal bearings, the modification of the Reynolds lubrication equation considering microscale effects, and the application of the Morris, Sobol, and KDE methods. In
Section 3, investigations are conducted to study the effects of steady-state variations in average gas film thickness, eccentricity ratio, rotational speed, and environmental pressure on the static characteristics of bearings. Three uncertainty analysis methods are employed in
Section 4 to evaluate the impact of uncertainty fluctuations in these parameters on the static characteristics.
Section 5 summarizes the key conclusions of this study. This work provides valuable technical support for the investigation of static characteristics and the practical operational control of organic working fluid aerodynamic journal bearings.
3. The Influence of Parameters on Static Characteristics Under the Microscale Effect
3.1. Influence of Microscale Effect
To investigate the influence of parameters on the static characteristics of journal bearings, the basic working condition for the aerodynamic journal bearing in
Figure 1 is defined as follows: environmental pressure of 0.5 MPa, average gas film thickness of 10 μm, environment temperature of 403.15 K, and rotational speed of 20,000 rpm. The bearing has a diameter of 60 mm, a length of 60 mm, and an eccentricity ratio of 0.5. Three classic organic working fluids, R245fa, R141b, and cyclopentane, were selected. They have significantly different molecular weights and viscosities, which were obtained from the REFPROP v10 library [
36]. This ensured that these fluids remained in the gas state under all operating conditions to analyze the influence of fluid physical properties on the static characteristics of the bearing.
Assuming a Ra of 0.6 μm, and since Δ
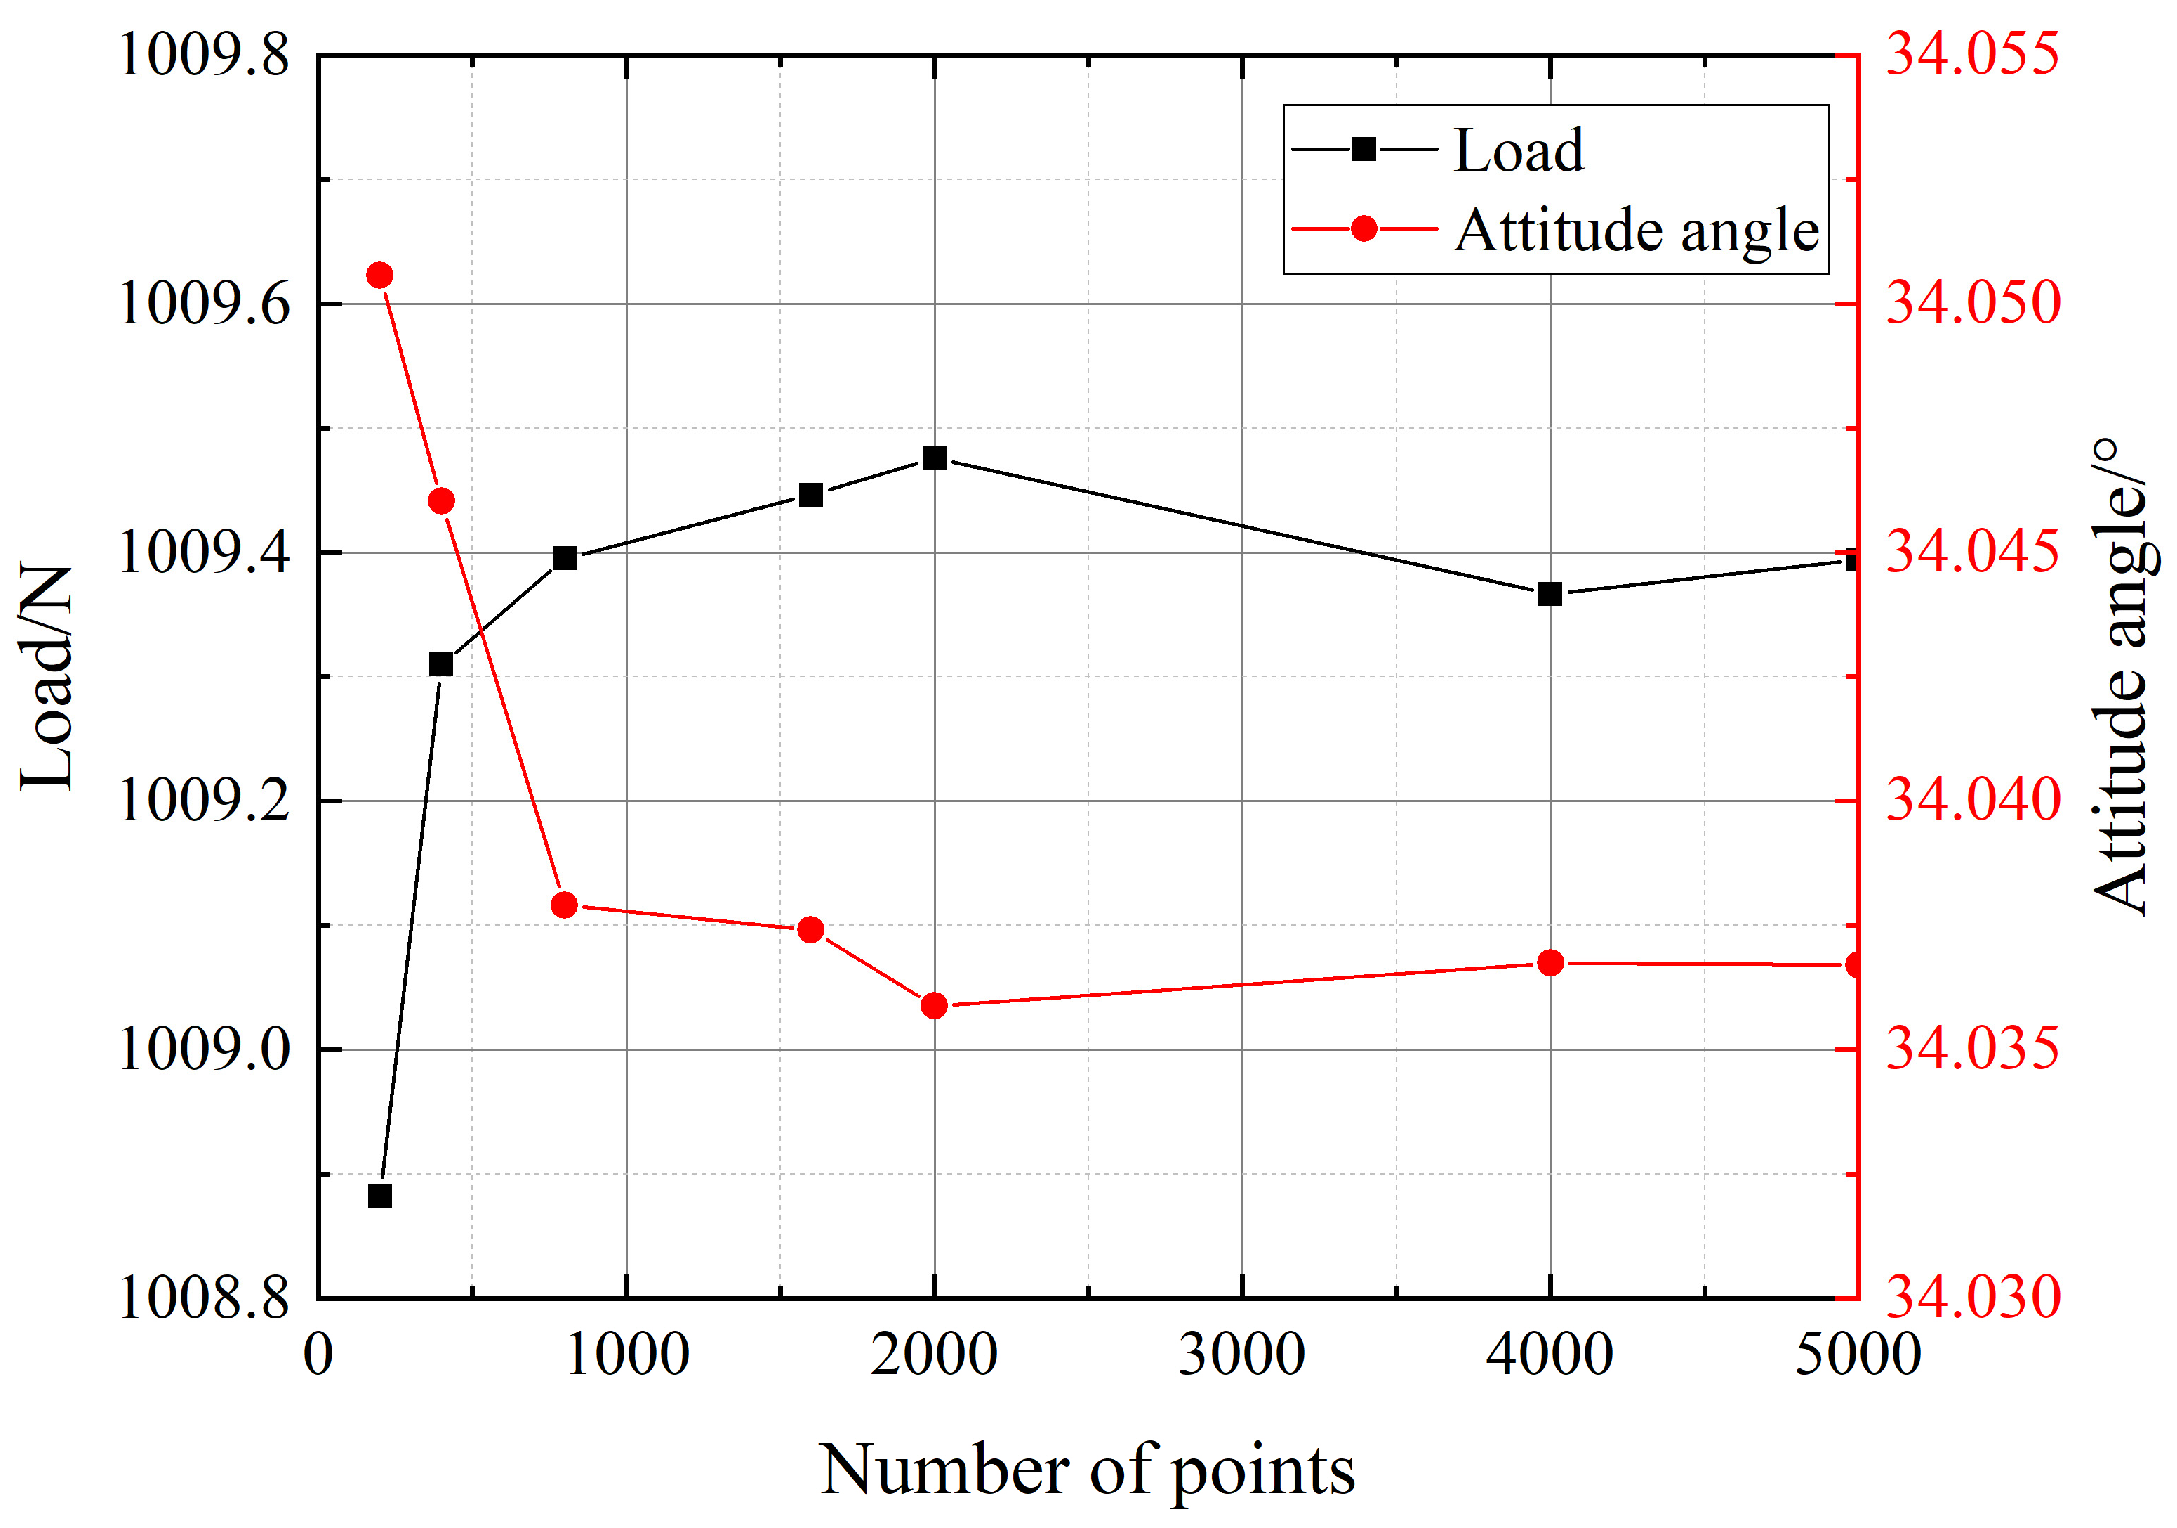
hi was randomly generated for each calculation, batch calculations were performed to obtain the average value of static characteristics under roughness effect, ensuring the representativeness of the results. Sampling was carried out by gradually increasing the number of calculation points. The variations in bearing load and attitude angle with R245fa as the working fluid under basic working conditions are shown in
Figure 4. The results indicate that as the number of samples increased, the fluctuations in the calculation results weakened fast and gradually stabilized. When the number of calculation points exceeded 2000, the fluctuations were less than 0.02%. Considering the calculation accuracy and efficiency, 2000 points were selected.
Figure 5 shows the bearing pressure distributions along the central axis (
y =
L/2) and the location with the smallest gas film thickness (
x = π
R) under the influence of the rarefied gas effect and surface roughness, with R245fa as the working fluid. Circumferentially, the bearing pressure distribution is inversely proportional to the gas film thickness, and local high pressure occurs at the position with smaller film thickness. Owing to the rotational effect, the positions of maximum pressure and minimum film thickness do not coincide. Along the axial direction, the pressure increases gradually from approximately 0.5 MPa at both ends to over 0.9 MPa at the center.
Regarding the impact of the microscale effect, in the circumferential and axial directions, the pressure deviation caused by the rarefied gas effect reaches 0.21% and 0.16%, respectively, which indicates that the rarefied gas effect is weak enough to be ignored. Compared with traditional inorganic working fluids, like air, organic working fluids have the physical properties of higher molecular weight and shorter molecular free path, which is attributed to the small Knudsen number. In contrast, wall roughness has an obvious positive influence on the pressure distribution. Although the mean value of wall roughness is zero, its spatial variation enhances the gradient of the gas film thickness between adjacent nodes, thereby increasing the local film pressure.
3.2. Influence of Gas Film Thickness
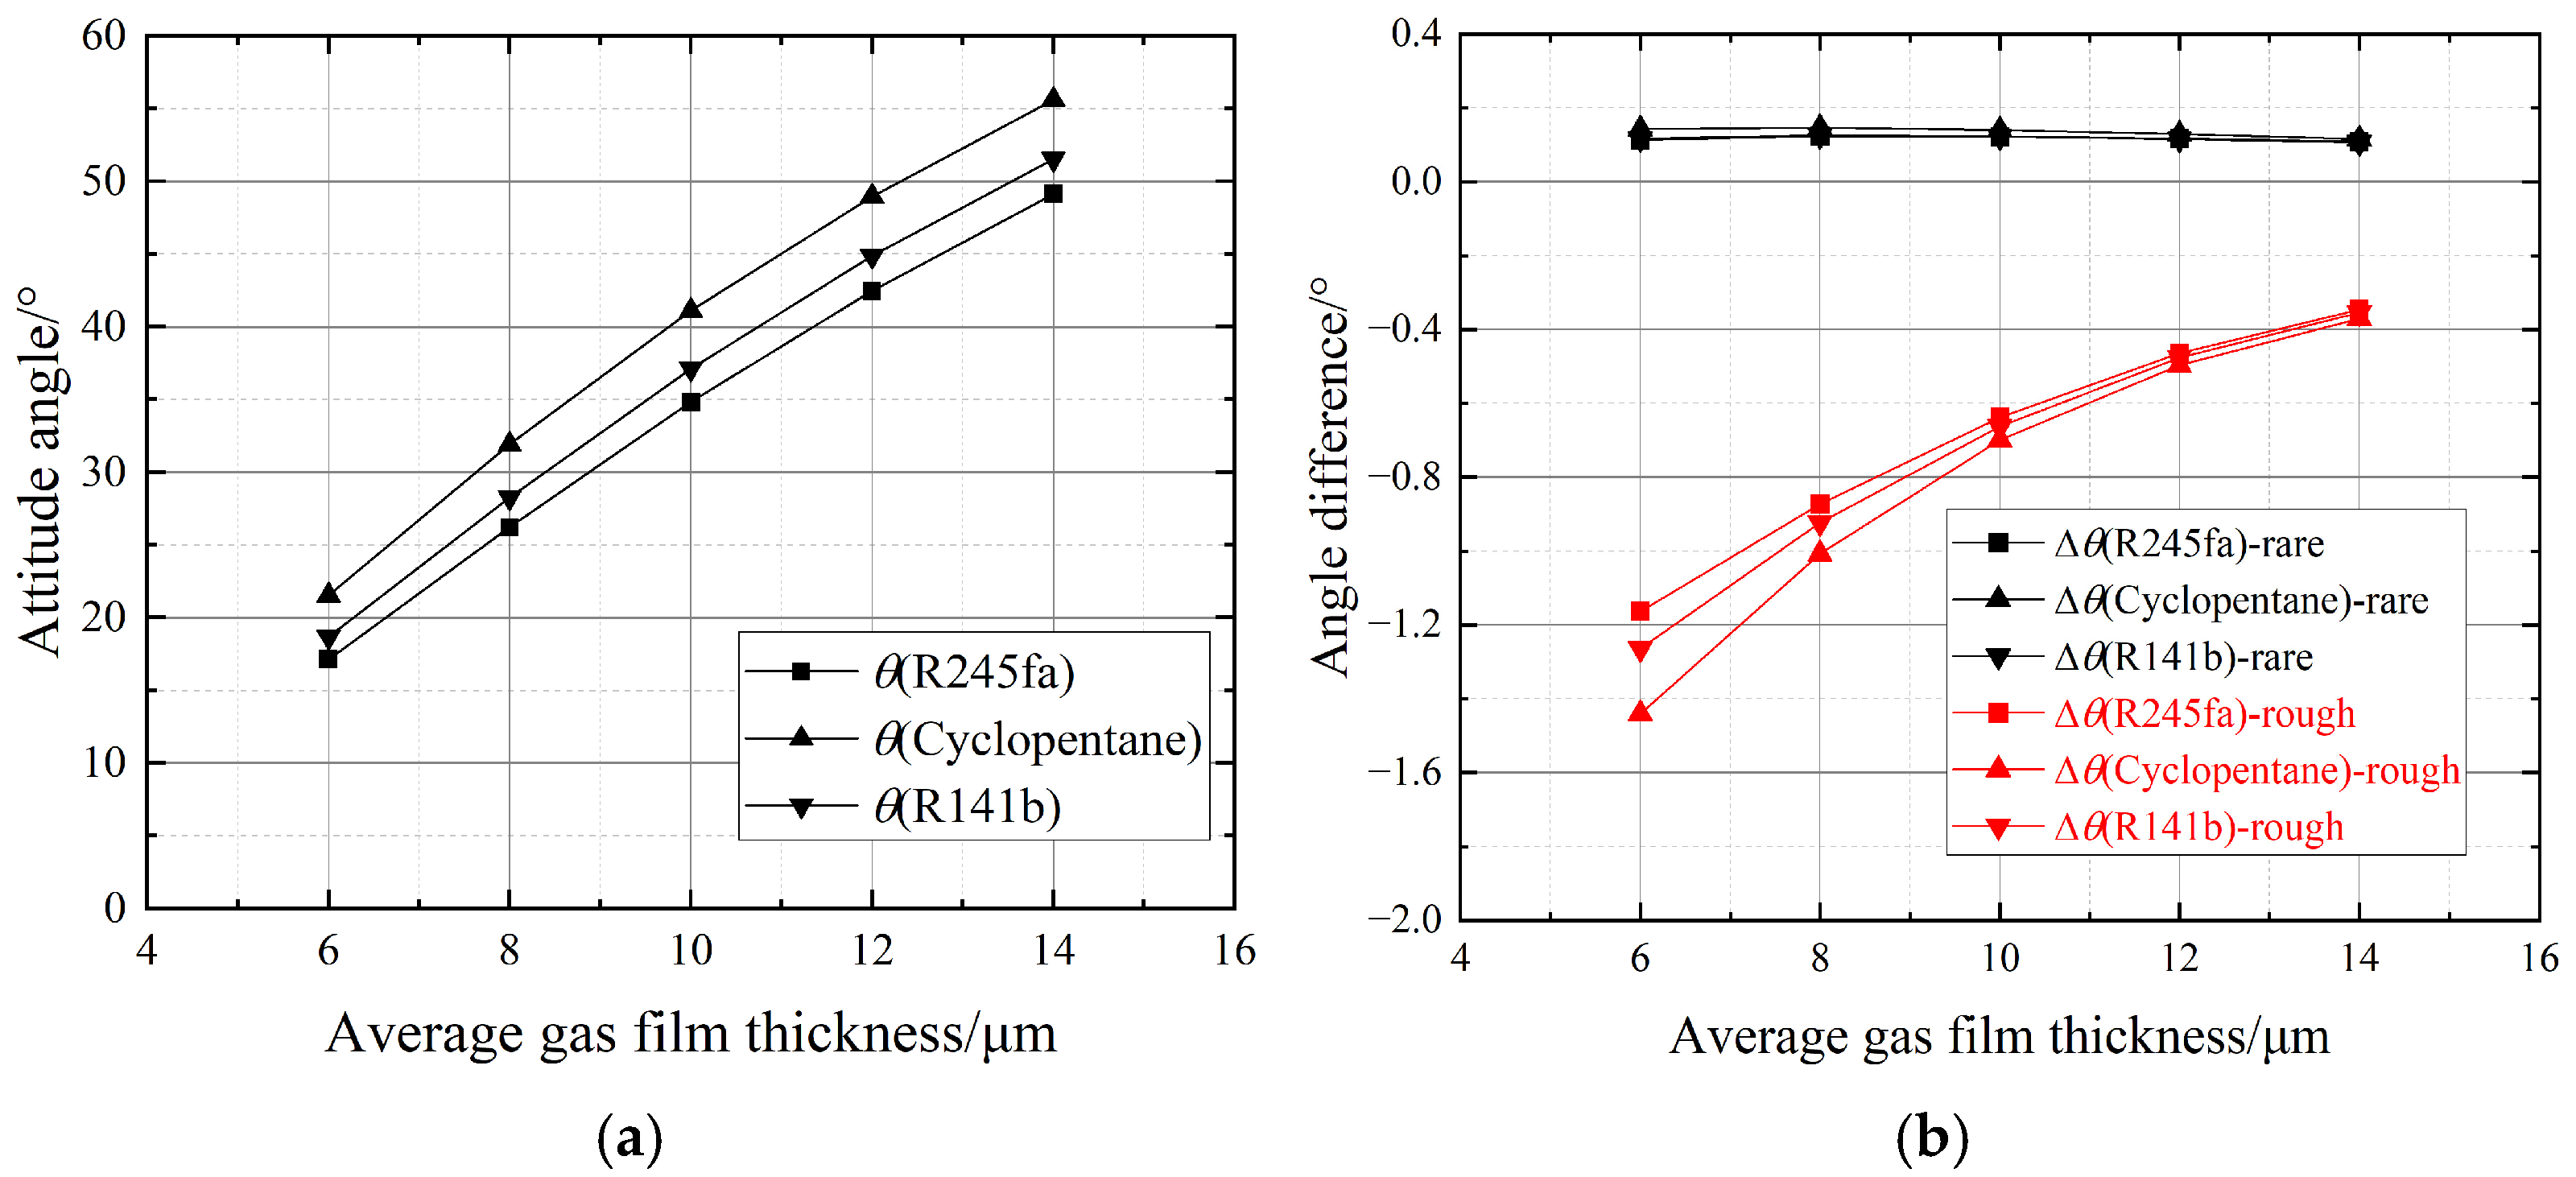
In this phase of the study, the gas film thickness varied between 6 μm, 8 μm, 10 μm, 12 μm, and 14 μm to study the static characteristics of the bearing.
Figure 6 and
Figure 7 illustrate the variations in load and attitude angle under different gas film thicknesses. Specifically,
Figure 6a and
Figure 7a present the variations in static characteristics under ideal gas conditions, while
Figure 6b and
Figure 7b highlight the influence of microscale effects. Additionally, the pressure distributions along the central axis and at the location of minimum gas film thickness were obtained, as shown in
Figure 8.
The growth of the average gas film thickness leads to significantly lower load, while the attitude angle exhibits an opposite trend with a diminishing amplitude. For example, with R245fa as working fluid, an increase in the average gas film thickness from 8 μm to 10 μm results in a reduction in bearing load by approximately 250 N and an increase in the attitude angle by 8.5°. The reason is that the increase in gas film thickness weakens the high pressure in the bearing, while the low pressure remains relatively unchanged. Consequently, the pressure difference decreases circumferentially, leading to a loss in the bearing load. The attitude angle, which measures the ratio of tangential force to radial force at the location of minimum gas film thickness, increases as the average gas film thickness grows. This is because the decrease in gas film pressure reduces the radial support force notably, while the tangential force, primarily influenced by viscous friction, drops slightly. As shown in
Figure 8a, an increase in gas film thickness reduces the peak pressure and shifts the peak angle away from the location of minimum gas film thickness, causing an enhancement in the deflection angle. For different working fluids under identical working conditions, R245fa demonstrates the highest load and the smallest attitude angle. This is likely due to its higher viscosity and molecular weight, which enhances the hydrodynamic effect.
The roughness effect exhibits a diminishing amplitude as the average gas film thickness increases. At each node, the roughness effect can be observed to alter the gas film thickness. The roughness disturbance follows a normal distribution, which means that the gas film thickness increases or decreases with the same probability. However, with the decrease in film thickness, the variation in bearing load increases more obviously. This asymmetry behavior ultimately leads to an overall increase in load. The rarefied gas effect diminishes as the gas film thickness increases, which is attributed to the reduction in the Knudsen number Kn = λ/h as h increases. Specifically, the variation in load is less than 0.3% under the weak influence of the rarefied gas effect.
3.3. Influence of Eccentricity Ratio
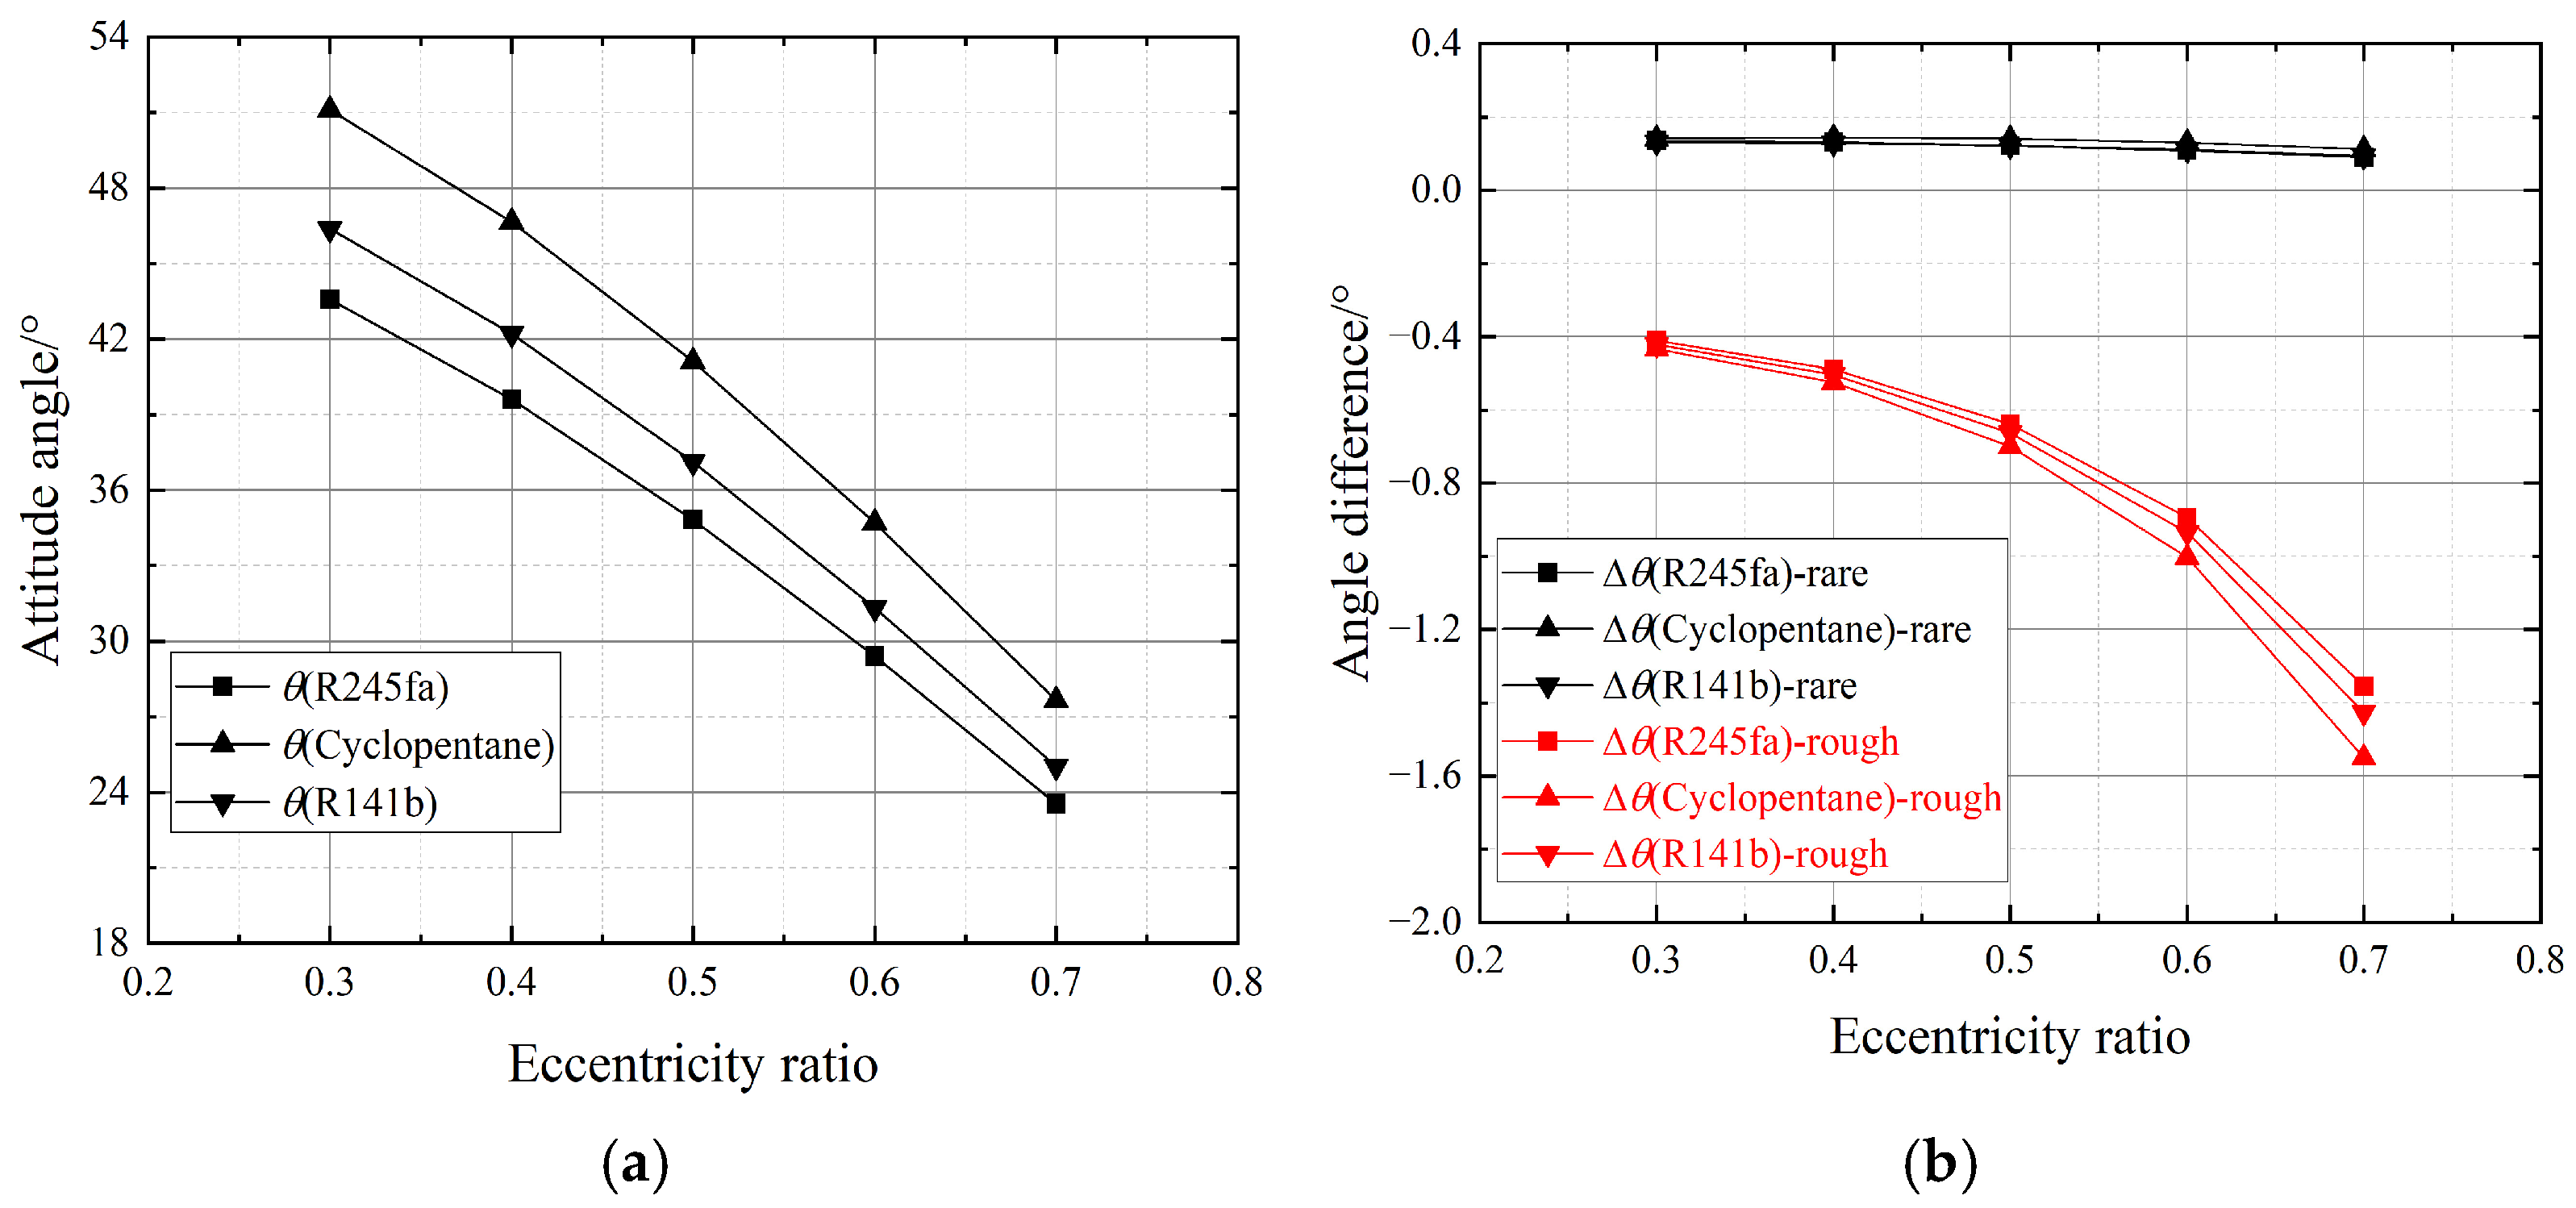
In this step of the study, the eccentricity ratio varied with values of 0.3, 0.4, 0.5, 0.6, and 0.7.
Figure 9 and
Figure 10 illustrate the variations in load and attitude angle under different eccentricity ratios.
Figure 9a and
Figure 10a show the static characteristics under ideal gas conditions, while
Figure 9b and
Figure 10b highlight the effects of roughness and rarefied gas. The pressure distributions along the central axis of the bearing and at the location of minimum gas film thickness are shown in
Figure 11. Overall, the effects of eccentricity ratio changes on load and attitude angle, as well as the influence of special effects, show an opposite trend compared to the variation in average gas film thickness. The load increases significantly with the eccentricity ratio, while the attitude angle decreases. The increase amplitude exhibits a positive correlation with eccentricity. For example, the load rises by approximately 200 N and 400 N when the eccentricity ratio increases from 0.3 to 0.4 and from 0.6 to 0.7, respectively. This is mainly due to the influence of eccentricity on the circumferential distribution of the gas film. A larger eccentricity ratio leads to a more uneven gas film distribution and causes a sharp pressure increase in thin film regions, consequently generating a higher load.
From the perspective of pressure distribution, as shown in
Figure 11a, the peak position angle of the pressure distribution increases gradually due to growing eccentricity ratio. However, there is a stagnation point in the circumferential pressure distribution where the pressure is minimally affected by the variation in eccentricity ratio. This is because the eccentricity ratio primarily influences the steady-state gas film thickness. At the stagnation point, the gas film thickness remains relatively unchanged, resulting in minimal pressure variation. The same trend observed for decreasing gas film thickness—where both wall roughness and rarefied gas effects become more significant—also occurs with an increase in the eccentricity ratio. A larger eccentricity ratio remarkably enhances the circumferential non-uniformity of gas film distribution.
3.4. Influence of Rotational Speed
To study the effect of rotational speed on the static characteristics of the bearing, the rotational speed was varied at 10,000 rpm, 15,000 rpm, 20,000 rpm, 25,000 rpm, and 30,000 rpm.
Figure 12 and
Figure 13 illustrate the variations in bearing load and attitude angle under different rotational speeds.
Figure 12a and
Figure 13a show the static characteristics under ideal gas conditions, while
Figure 12b and
Figure 13b highlight the effects of roughness and rarefied gas. The pressure distributions along the central axis of the bearing and at the location of minimum gas film thickness are shown in
Figure 14.
The bearing load capacity increases with the rotational speed. From the working principle of the bearing, higher rotational speeds enhance the hydrodynamic effect in the bearing, leading to higher gas pressure and bearing load. Meanwhile, variations in the viscous friction are relatively small, resulting in a reduction in attitude angle. The change rates of the load and attitude angle decrease with a higher rotational speed. For example, when the rotational speed rises from 10,000 rpm to 15,000 rpm and from 25,000 rpm to 30,000 rpm, the load rises by approximately 200 N and 100 N, respectively. In addition, the peak angle of the pressure distribution shifts upward and the changing amplitude of the pressure diminishes with the increase in rotational speed.
The roughness effect on the load increases with the rotational speed while decreasing for the attitude angle. This is because the roughness effect primarily influences the gas film thickness and has weak dependence on rotational speed. In contrast, the impact of the rarefied gas effect on the deflection angle decreases significantly with increasing rotational speed. As described by Equation (7), the rarefied gas effect only influences the Poiseuille flow term and the Couette flow term is not related. With the increase in rotational speed, the Couette flow trend becomes dominant while the Poiseuille flow trend diminishes, thereby weakening the influence of the rarefied gas effect.
3.5. Influence of Environmental Pressure
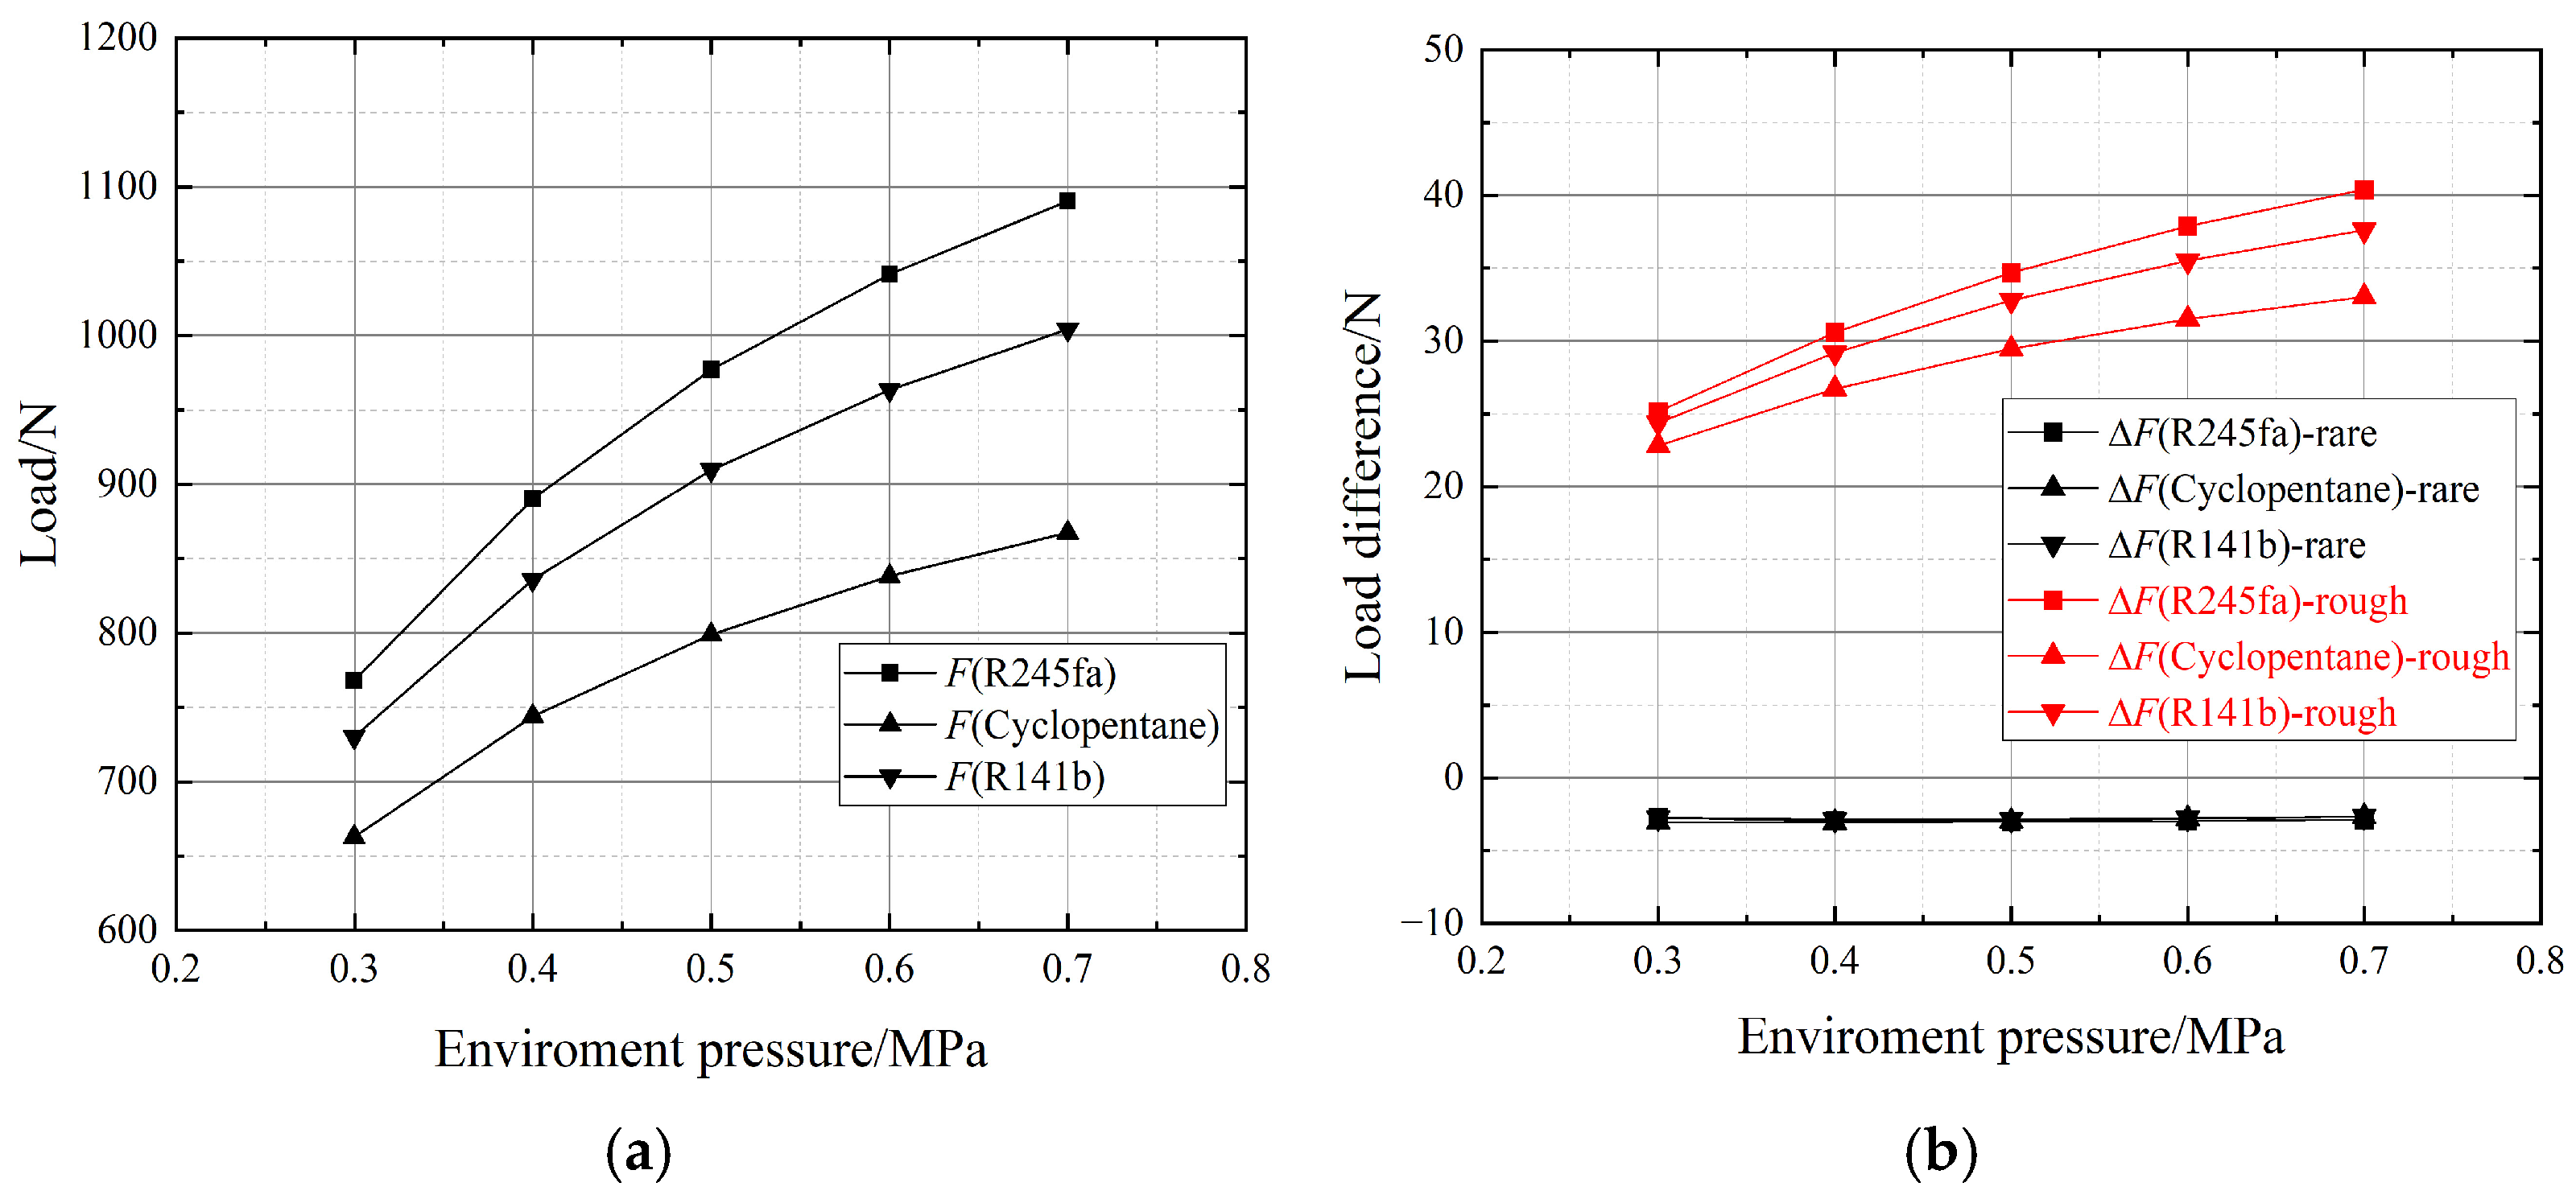
The environmental pressure was varied at 0.3 MPa, 0.4 MPa, 0.5 MPa, 0.6 MPa, and 0.7 MPa in this phase.
Figure 15 and
Figure 16 illustrate the variations in load and attitude angle under different environmental pressures.
Figure 15a and
Figure 16a show the static characteristics under ideal gas conditions, while
Figure 15b and
Figure 16b highlight the effects of roughness and rarefied gas. Both the load and attitude angle increased due to the growth in environmental pressure. This phenomenon occurs because higher environmental pressure directly increases the gas film pressure, resulting in an increased load. An enhanced rotation effect leads to an increase in attitude angle. The changing amplitudes decrease as the environmental pressure rises. For instance, with R141b as the working fluid, when the environmental pressure increases from 0.3 MPa to 0.4 MPa and from 0.6 MPa to 0.7 MPa, the load increases by approximately 100 N and 40 N, respectively. The stronger improvement in the Poiseuille flow trend compared to the Couette flow trend weakens the hydrodynamic effect and limits the increase in bearing pressure. This demonstrates the importance of selecting an appropriate environmental pressure: insufficient environmental pressure can result in difficulty in meeting the required load, while excessively high environmental pressure increases the equipment load without providing substantial improvements in load.
Figure 17 illustrates the pressure distribution along the central axis of the bearing and the minimum film thickness. As the environmental pressure increases, the peak position angle of the pressure distribution gradually decreases, and the influence of the rarefied gas effect on static characteristics diminishes. Higher environmental pressure increases the gas film pressure and results in greater molecular density, a shorter molecular free path, and an even lower Knudsen number, thereby weakening the rarefied gas effect. The roughness effect on the load increases with the environmental pressure while decreasing for the attitude angle. Since the gas film thickness remains unchanged, the roughness effect varies proportionally with the environmental pressure.
4. Uncertainty Quantification Analysis
Based on the results in
Section 3, variations in average gas film thickness, eccentricity ratio, rotational speed, and environmental pressure significantly affect the static characteristics of bearings. During practical operation, parameters notably fluctuate rather than remaining constant, which influences the static characteristics to some extent. This section employs uncertainty quantification analysis methods to investigate the impact of parameter uncertainties on the static characteristics of bearings. The Morris method defines a physical quantity named
EE to measure the impact, which is similar to the partial derivative. The Sobol method measures the influence of each parameter on the variance of the results. KDE directly simulates the probability distribution of the results. These three methods are employed to assess changes in the uncertainty of the static characteristics of the bearings, each providing a distinct perspective and thereby offering complementary insights.
For the aerodynamic journal bearing, R141b, which demonstrated a relatively average performance in
Section 3, was selected as the working fluid. The basic working conditions were set identical to those in
Section 3. Considering the weak influence of the rarefied gas effect, ideal gas conditions were adopted to balance computational speed and accuracy. However, the roughness effect cannot be ignored, and it was modeled as a normal distribution with a mean value of 0 and standard deviation of 0.6 μm. To simulate the unstable operational environment of the bearing, it was assumed that the environmental pressure, average gas film thickness, eccentricity ratio, and rotational speed also followed normal distributions. The mean values of these parameters correspond to the basic working conditions, while the standard deviations were set at 1% of the respective basic operating values.
4.1. Uncertainty Quantification Results with Morris Method
The Morris method emphasizes the influence of each parameter on the indicator of interest with a relatively small number of calculations. Initially, sampling was performed with a gradual increase in the calculation point number.
Figure 18 shows the variation in the mean MOAT value for pressure when the load is taken as the indictor of interest. This indicates that as the sampling number increases, the fluctuation decreases and gradually stabilizes. To balance the accuracy and computational efficiency, the number of calculation points was set to 1500.
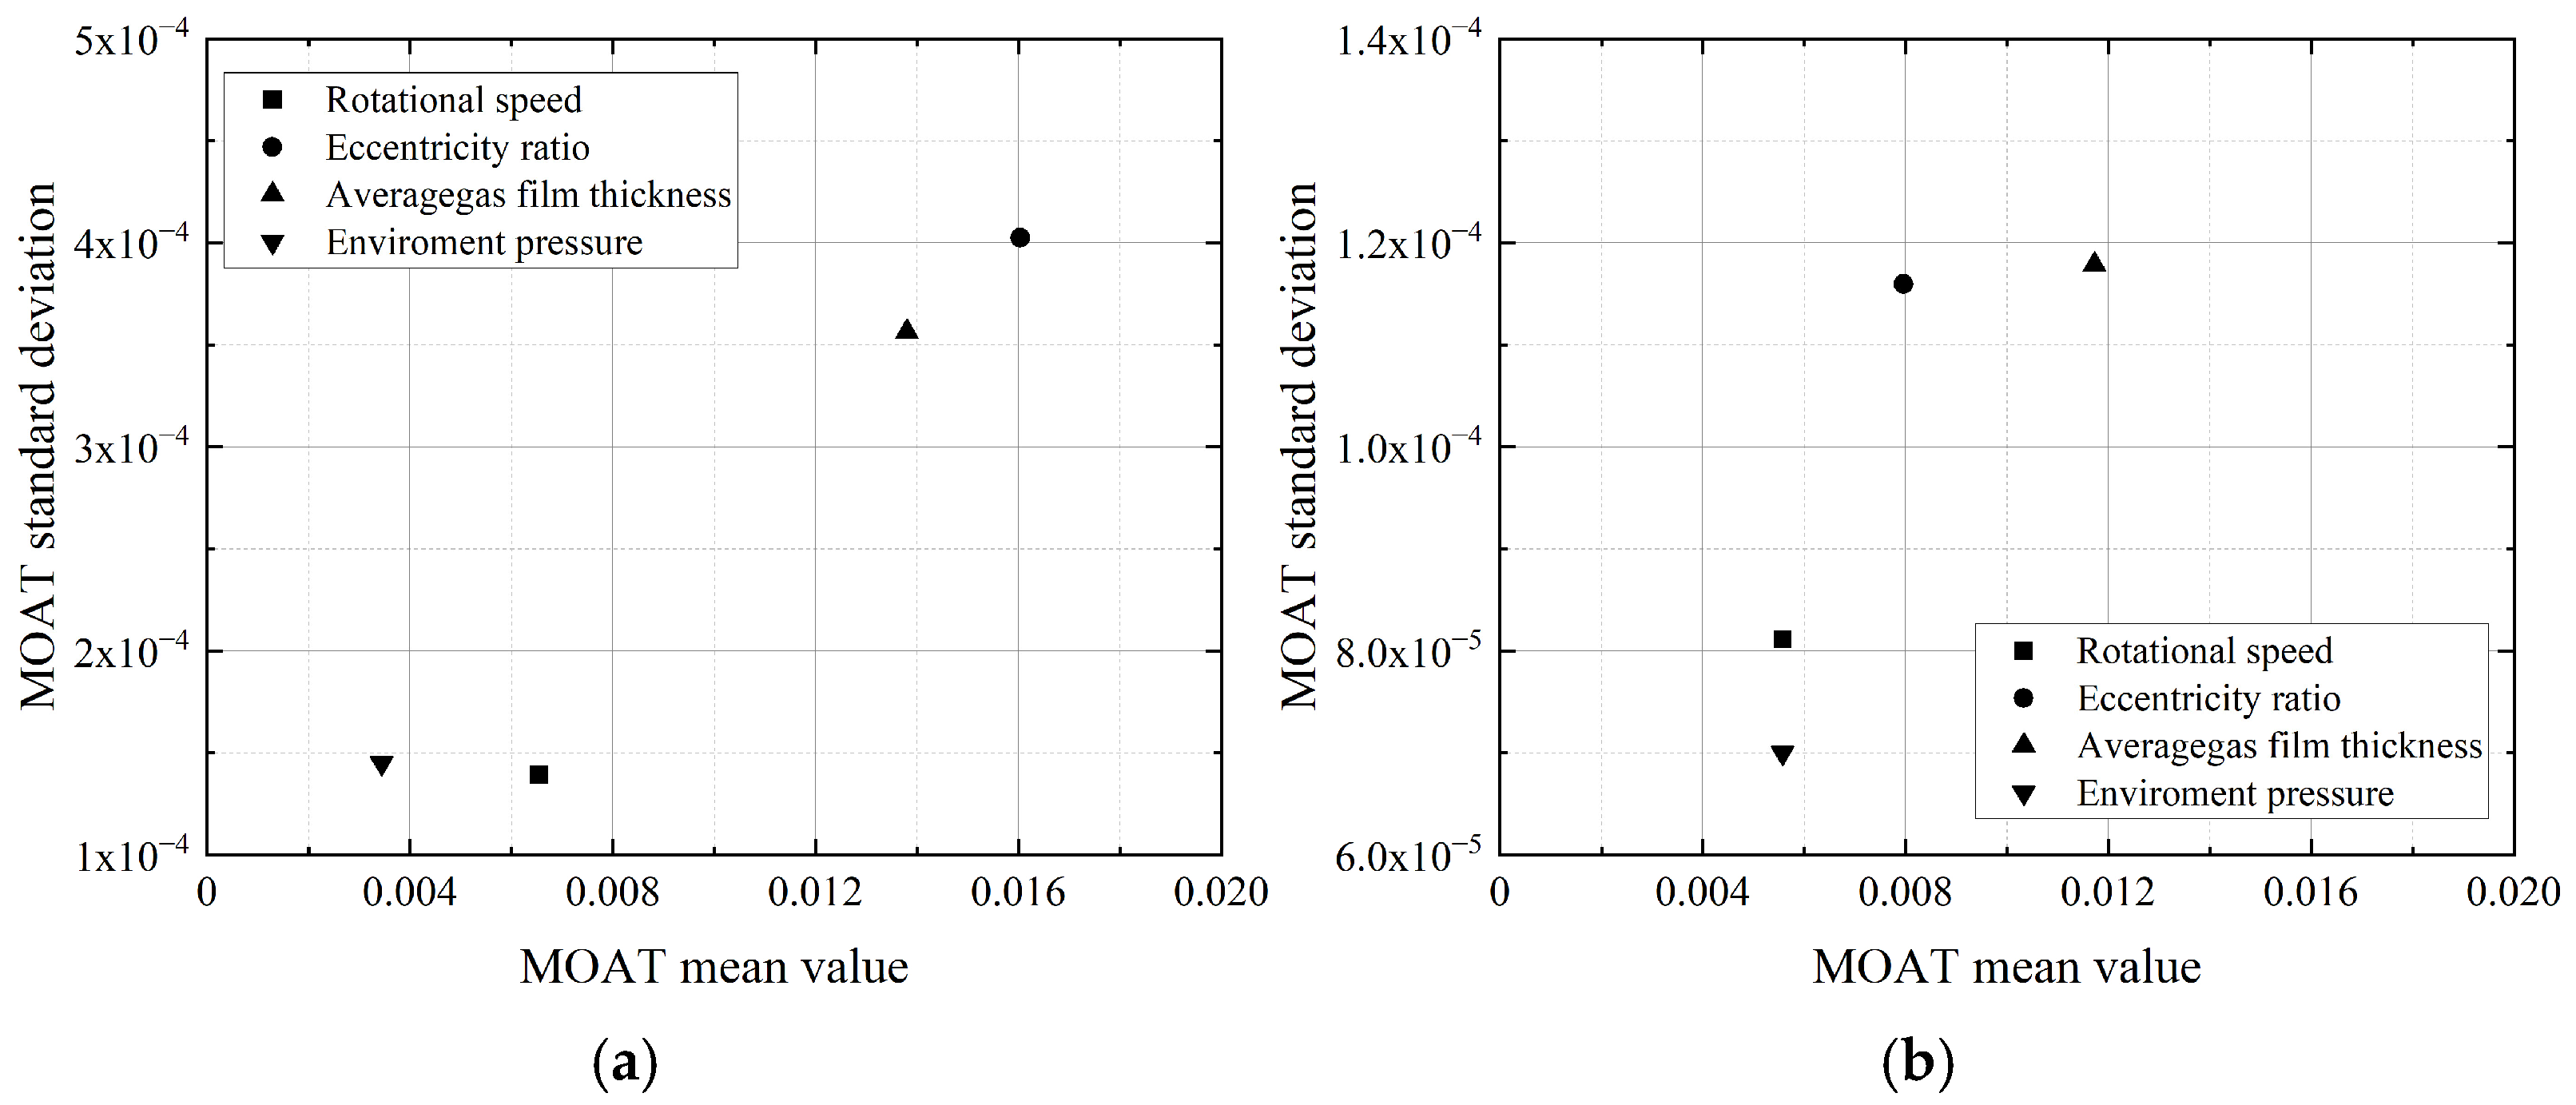
Figure 19 illustrates the mean value and standard deviation for the load and attitude angle with respect to the four design parameters with the Morris method. For load, the eccentricity ratio contributes the greatest mean value and standard deviation, slightly exceeding those of the average gas film thickness. In comparison, the MOAT values of rotational speed and environmental pressure are significantly lower, and environmental pressure has the weakest influence. This is because the uncertainty fluctuations in the average gas film thickness and average gas film thickness directly affect the gas film thickness at various positions in the aerodynamic journal bearing, thereby leading to pressure variations. Although an increase in rotational speed enhances viscous flow within the gas film, the small magnitude of uncertainty results in a limited impact. The growth of environmental pressure leads to a direct increase in pressure in the gas film, but considering the increase in environmental pressure itself, the pressure difference inside and outside the bearing changes little.
For attitude angle, the MOAT mean is highest for average gas film thickness, followed by the eccentricity ratio. The MOAT standard deviations of these two parameters are also close. The MOAT mean value of rotational speed is comparable to that of environmental pressure, while the MOAT standard deviation is greater. Since the attitude angle characterizes the ratio of tangential force to radial force in the bearing, the uncertainty in gas film thickness has the strongest influence on the attitude angle, followed by the eccentricity ratio. The effects of rotational speed and environmental pressure are relatively weaker.
4.2. Uncertainty Quantification Results with Sobol Method
The Sobol method quantifies the influence of uncertainty by calculating the contribution ratio of each parameter to the variance. Sampling was conducted with an increasing calculation point number. The variation in the total Sobol index (
ST) for each factor, when the load is taken as the indicator of interest, is shown in
Figure 20. To balance computational accuracy and efficiency, 4000 points were selected for subsequent analysis.
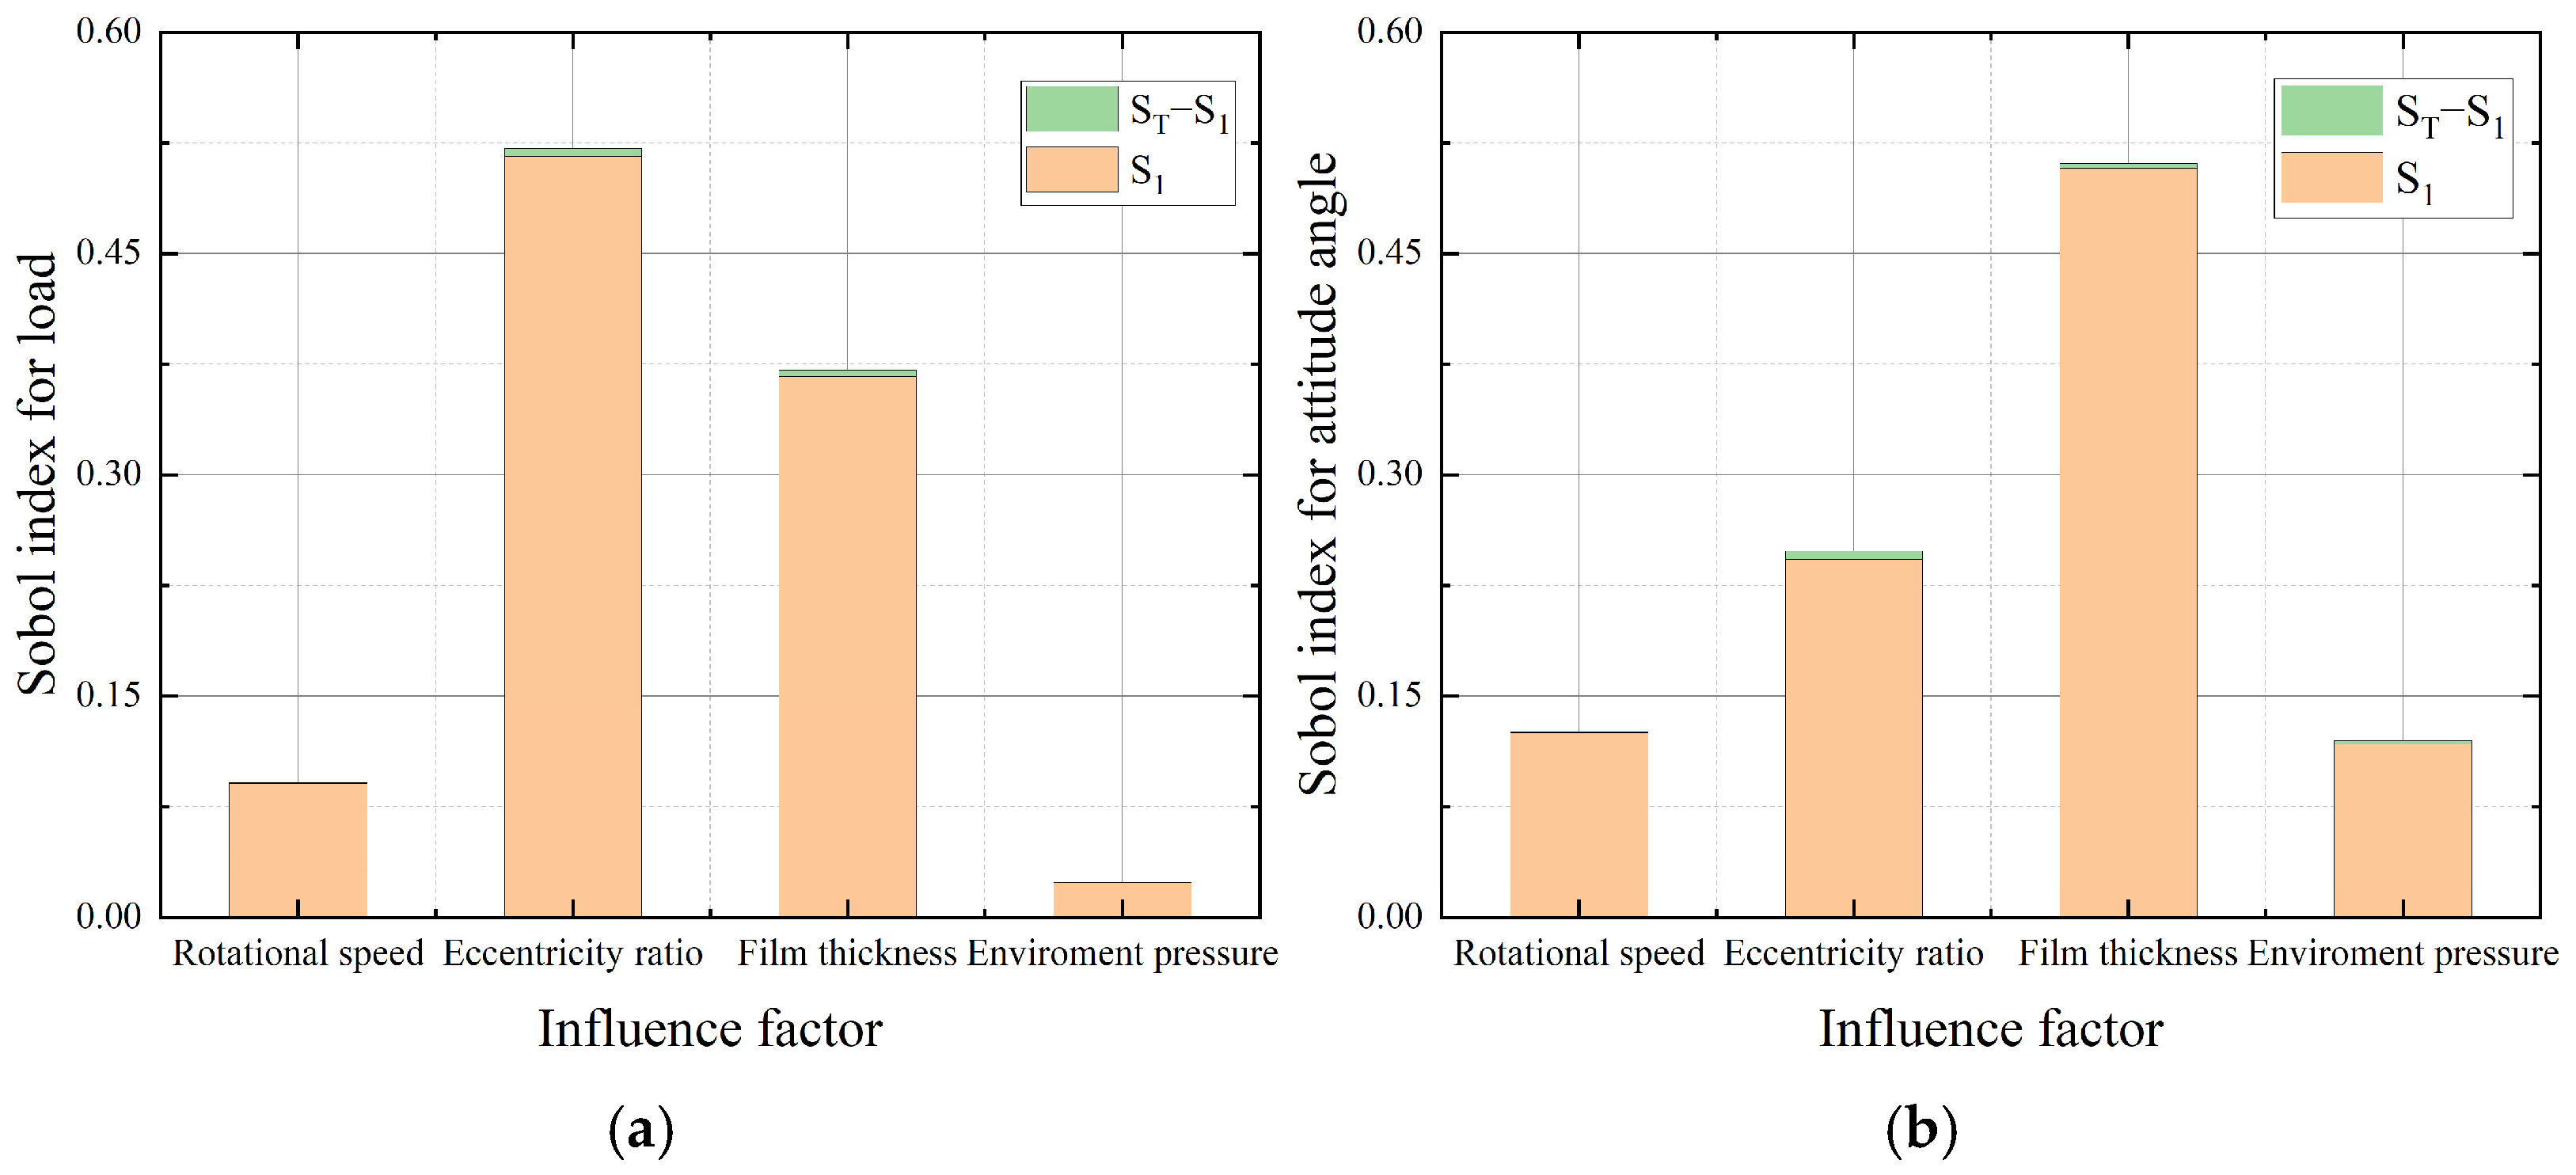
Figure 21 presents the first-order Sobol indicator (S
1) and the total Sobol indicator (S
T) for the four design parameters. The difference between S
T and S
1 denotes the combined influence of a certain factor and its interaction with other factors. For load, the total Sobol indicators for eccentricity ratio and average film thickness are the greatest, indicating that uncertainties in these parameters significantly contribute to the variations in load. Additionally, the eccentricity ratio exhibits strong interactions with other parameters, whereas the rotational speed and environmental pressure show almost no interactions. This suggests that the variance in load is predominantly driven by the variation in the eccentricity ratio, the uncertainty in average gas film thickness, and their interactions.
For the attitude angle, the order of the total Sobol indicators is as follows: average gas film thickness > eccentricity ratio > rotational speed > environmental pressure, which is consistent with the conclusions from the Morris method. The eccentricity ratio, average gas film thickness, and environmental pressure exhibit interactions with other parameters, and the eccentricity ratio exhibits the strongest interactions. This is because the eccentricity ratio affects the distribution of the gas film thickness throughout the bearing, subsequently influencing the pressure of the bearing. In comparison, the rotational speed has a significantly weaker interaction. The rotational speed only affects the right side of Equation (3), which is the Couette flow term. Its interaction with the other parameters is relatively weak. The results indicate strong interactions between multiple parameters and the eccentricity ratio, while the influence of rotational speed is relatively independent.
4.3. Uncertainty Quantification Results with KDE Method
In this section, the KDE method is employed to analyze the distribution of bearing static characteristics considering parameter uncertainty. The mean value, standard deviation, and confidence intervals (95% and 99%) for load and attitude angle are obtained, which provides a visual representation of how the selected parameters influence the static characteristics.
To determine an appropriate number of calculation points, the mean value and standard deviation of load were calculated with incremental point numbers. As shown in
Figure 22, 12,000 points were selected. The mean value, standard deviation, and confidence intervals for load and attitude angle were statistically obtained, as presented in
Table 2. Compared to steady-state conditions, the mean values of load and attitude angle under fluctuating conditions were reduced. The standard deviation of the load is 20.9 N, which accounts for 2.22% of the steady value. The difference in load between the maximum and minimum value exceeds 100 N. For the attitude angle, the standard deviation is 0.584°, reaching up to 1.61% of the steady-state value, while the difference between the maximum and minimum attitude angle is 3°. These results suggest that the parameter fluctuations should not be overlooked in actual operations.
The probability density distributions of load and attitude angle obtained with the KDE method are presented in
Figure 23. The overall distributions resemble normal distributions but exhibit slight deviations. The peak probability density for load is 939.2 N, which is less than the average value, indicating a greater possibility of load reduction. Conversely, the peak probability density for the attitude angle is 36.096°, larger than the average value, which suggests a higher potential of attitude angle increase. These results imply that it is more likely for the load to decrease while the attitude angle tends to increase under uncertain conditions. In practical applications, care must be taken to address potential insufficient load caused by parameter uncertainty, as well as bearing instability caused by an excessive attitude angle.
5. Conclusions
This study investigated the static characteristics and parameter uncertainty of organic working fluid journal bearings using FDM-based simulations incorporating rarefied gas and surface roughness effects. The effects of key parameters, including average gas film thickness, eccentricity ratio, rotational speed, and environmental pressure, were analyzed quantitatively, and uncertainty propagation was evaluated using the Morris, Sobol, and KDE methods. The main findings are as follows:
Under fixed conditions for other parameters, a decrease in average gas film thickness, or an increase in eccentricity ratio or rotational speed, enhances the load while reducing the attitude angle. Conversely, an increase in environmental pressure raises both the load and the attitude angle. Among the selected organic working fluids, R245fa demonstrated the best static performance with the highest load and the smallest attitude angle, followed by R141b; cyclopentane demonstrated the worst performance.
Pressure deviations due to the rarefied gas effect are minimal, reaching only 0.21% in the circumferential direction and 0.16% axially. These negligible values indicate that this effect can be disregarded. However, the bearing surface roughness significantly increases the load and decreases the attitude angle, which cannot be ignored.
The Morris method revealed that the eccentricity ratio has the greatest influence on load, followed by average gas film thickness. Rotational speed and environmental pressure have smaller effects. For the attitude angle, average gas film thickness exerts the most significant influence, followed by the eccentricity ratio.
Variance analysis with the Sobol method confirmed the order of parameter influence, which is consistent with the results of the Morris method. For load, interactions between average gas film thickness and eccentricity ratio are significant. For the attitude angle, interactions among all factors exist except rotational speed, while the eccentricity ratio exhibits the strongest coupling effects.
KDE analysis provided the probability density distribution of the static characteristics of bearings. The average load of 940.6 N is slightly lower than the steady-state value of 942.4 N, while the average attitude angle of 36.08° is slightly higher than the steady-state value of 35.96°. The probability density distribution of static characteristics is approximately normal. The peak probability density of the load is slightly lower than the steady-state values, while the attitude angle shows the opposite trend. In practical applications, attention must be paid to potential load shortages caused by parameter uncertainties, whereas bearing instability caused by excessive attitude angles is negligible.


