Article

The Improvement of CrN Coatings Wear Resistance by Adjusting the Cycle Number of Electrochemical

1
College of Mechanical and Electrical Engineering, Nanjing University of Aeronautics and Astronautics, Nanjing 210016, China
2
Hong Kong Branch of National Precious Metals Material Engineering Research Center (NPMM), City University of Hong Kong, Hong Kong, China
*
Author to whom correspondence should be addressed.
Lubricants 2024, 12(8), 295; https://doi.org/10.3390/lubricants12080295
Submission received: 1 August 2024 / Revised: 17 August 2024 / Accepted: 18 August 2024 / Published: 20 August 2024
(This article belongs to the Special Issue Friction and Wear Properties of Composite Coatings in Air and Water)

Abstract

:
To further improve the sealing effect of electrochemical polarization (EP) on the CrN coatings, the EP treatment at different cycle numbers was conducted. The microstructure, mechanical, and tribological properties of CrN coatings were investigated. Findings indicated an elevation in oxygen content from 6.32% to 12.35% with increasing cycle number from 10 to 60 times, yet the crystal structure of CrN (111) and CrN (200) persisted. The X-ray photoelectron spectrum (XPS) and transmission electron microscope (TEM) revealed that a minimal quantity of oxides was produced. This led to a decrease in the coatings porosity from 16.79% to 5.83%. For this reason, the hardness of CrN coatings increased with a maximum degree of 18.3%, whilst the wear rate decreased with a maximum degree of 37.5% at the cycle number of 20 times.

1. Introduction

Coating is an important method of surface protection for parts and is commonly used to reduce corrosion and wear on part surfaces [1,2,3,4,5]. For example, Hu et al. [6] deposited a layer of LC-WC60-1 coating on the surface of tunnel boring machine tool ring by laser fusion cladding, and its volume loss was reduced from 78.98 mm3 to 11.24 mm3 after tribological tests. Cassar et al. [7] deposited TiN and CrAlN coatings on Ti-6Al-4V titanium alloy after plasma nitriding process, and the wear volume was reduced from 0.25 mm3 to 0.03 mm3. Kang et al. [8] applied a Ta-C coating on a WC-Co alloy substrate, and its hardness was increased from 25 GPa to 55 GPa at most, and the coefficient of friction was reduced from 0.55 to less than 0.22. Zhang et al. [9] applied a PDMS coating on a flexible spline material (40Cr), and its coefficient of friction was reduced from 0.129 to 0.023, and the depth of the wear marks was also substantially reduced. However, the coating produces many pores and defects during the preparation process due to incomplete particle buildup, lattice phase transition, solidification shrinkage, and residual stress [10,11,12], as shown in Figure 1. Many researchers have proposed that the defects can be solved by atomic layer deposition (ALD), sealant treatment, heat treatment, and deep-cooling treatment [13,14,15,16], but due to some limitations of these methods, such as that ALD’s deposition rate is low [17] and sealant is sensitive to temperature [18,19], etc., it is necessary to find a new solution for pore sealing.
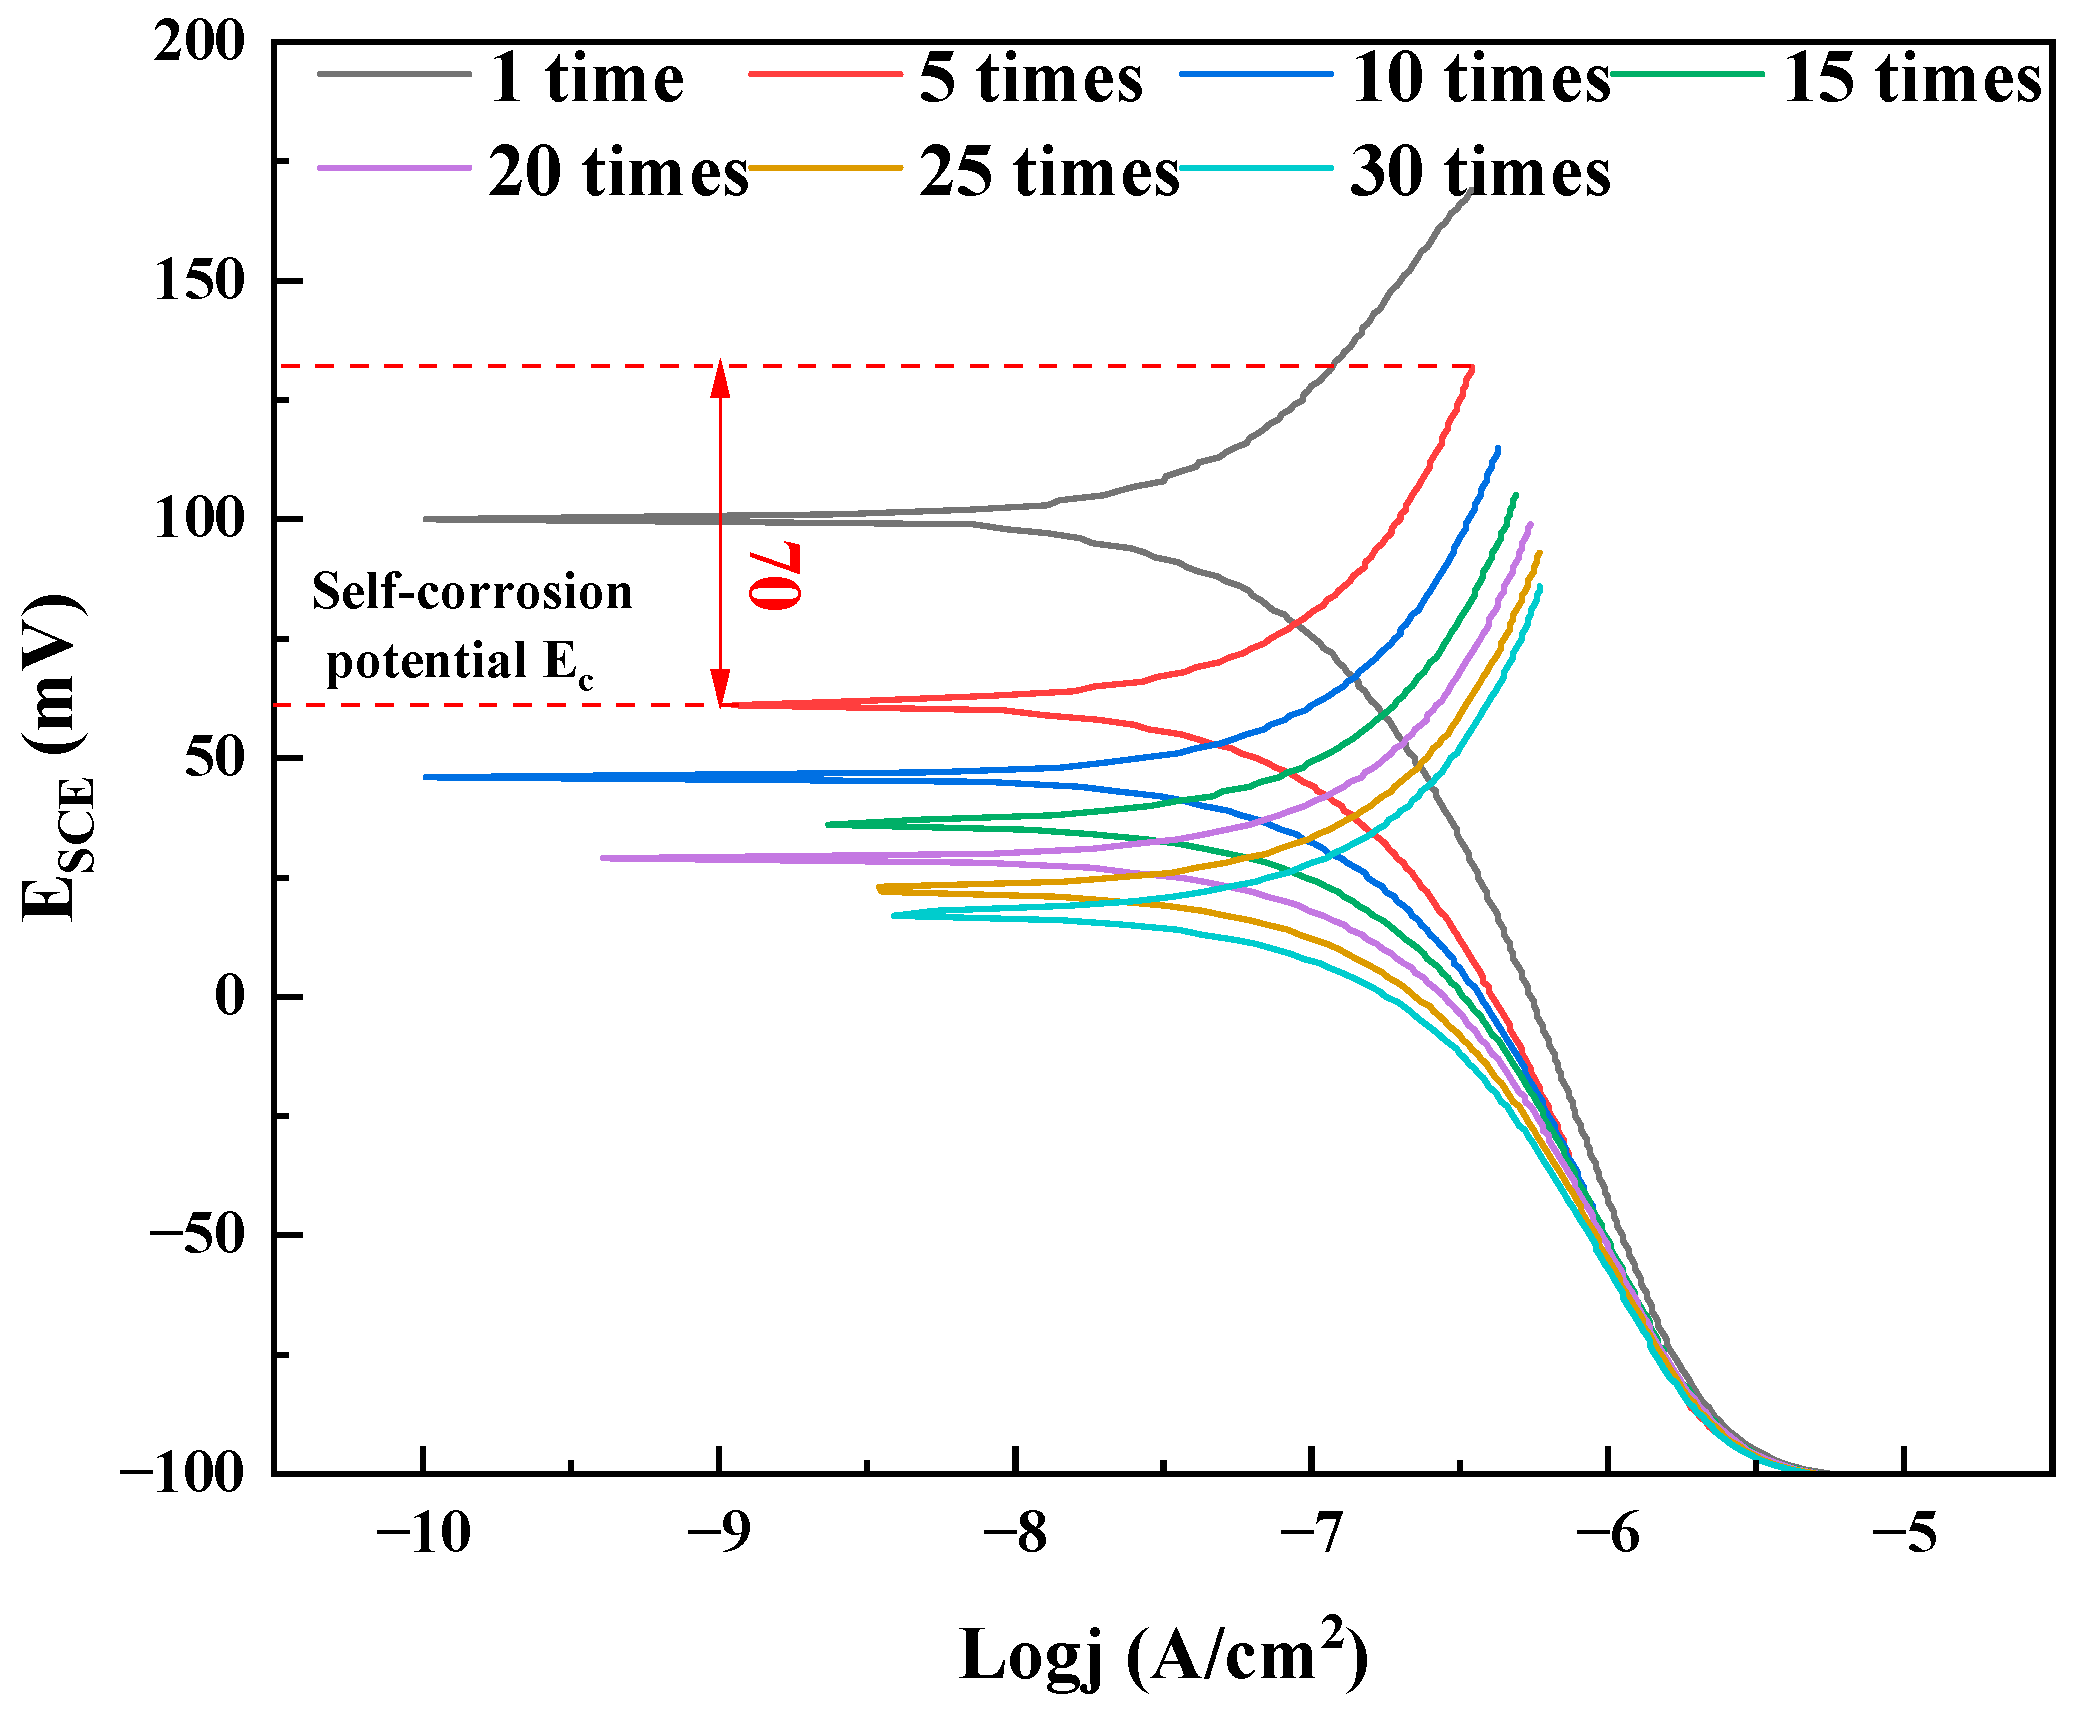
In our previous study [20], electrochemical polarization as a common technique for evaluating the corrosion resistance of materials was chosen to seal pore defects in coatings. This method typically scans from negative potential towards positive potential and therefore obtains the Tafel curve, which contains five distinct zones sequentially: the linear polarization zone, the transition zone, the Tafel polarization zone, the passivation zone, and the damage zone. Our recent study [20] revealed that the EP process could be controlled within the transition region by adjusting the overpotential in the low range of 40 mV to 190 mV. It was found that properly generated chromium oxides could seal the coating defects and thus reduce the porosity. The porosity of CrN coating was reduced from 16.79% to 12.28% at an overpotential of 190 mV. Due to the reduction in the porosity of the coating, the hardness of the CrN coating increased to a maximum value of 12.07 ± 0.9 GPa at an overpotential of 130 mV (the hardness of the untreated CrN coating was 10.03 ± 0.8 GPa). In addition, due to the increase in the hardness of the CrN coating and the change in the wear mechanism, the CrN coatings treated by EP at the overpotential of 70 mV presented the enhanced wear resistance by a degree of 29.9%. The generation of chromium oxides is not only closely related to overpotential but also to cycle number. However, the cycle number of EP treatment in the study [20] was only 10 times. With increasing cycle number, more water molecules would penetrate deep into coating defects. It is expected that the sealing effect of EP treatment could be improved by increasing the cycle number shown in Figure 1. As the number of cycles increases, the thickness of the oxide generated on the surface of the layer increases significantly, and its sealing depth gradually increases. Ultimately, this led to the realization of a better sealing effect.
Thus, based on the optimal overpotential of 70 mV from our recent study, the EP treatments at different cycle numbers were applied to the CrN coatings in this research. Subsequently, the microstructure, mechanical, and tribological properties of the CrN coatings were investigated with the aim of determining the optimal cycle number. Additionally, the sealing mechanism on coating defects and enhancement mechanism on tribological properties were elucidated.

2. Experimental Methods

2.1. Deposition of CrN Coatings

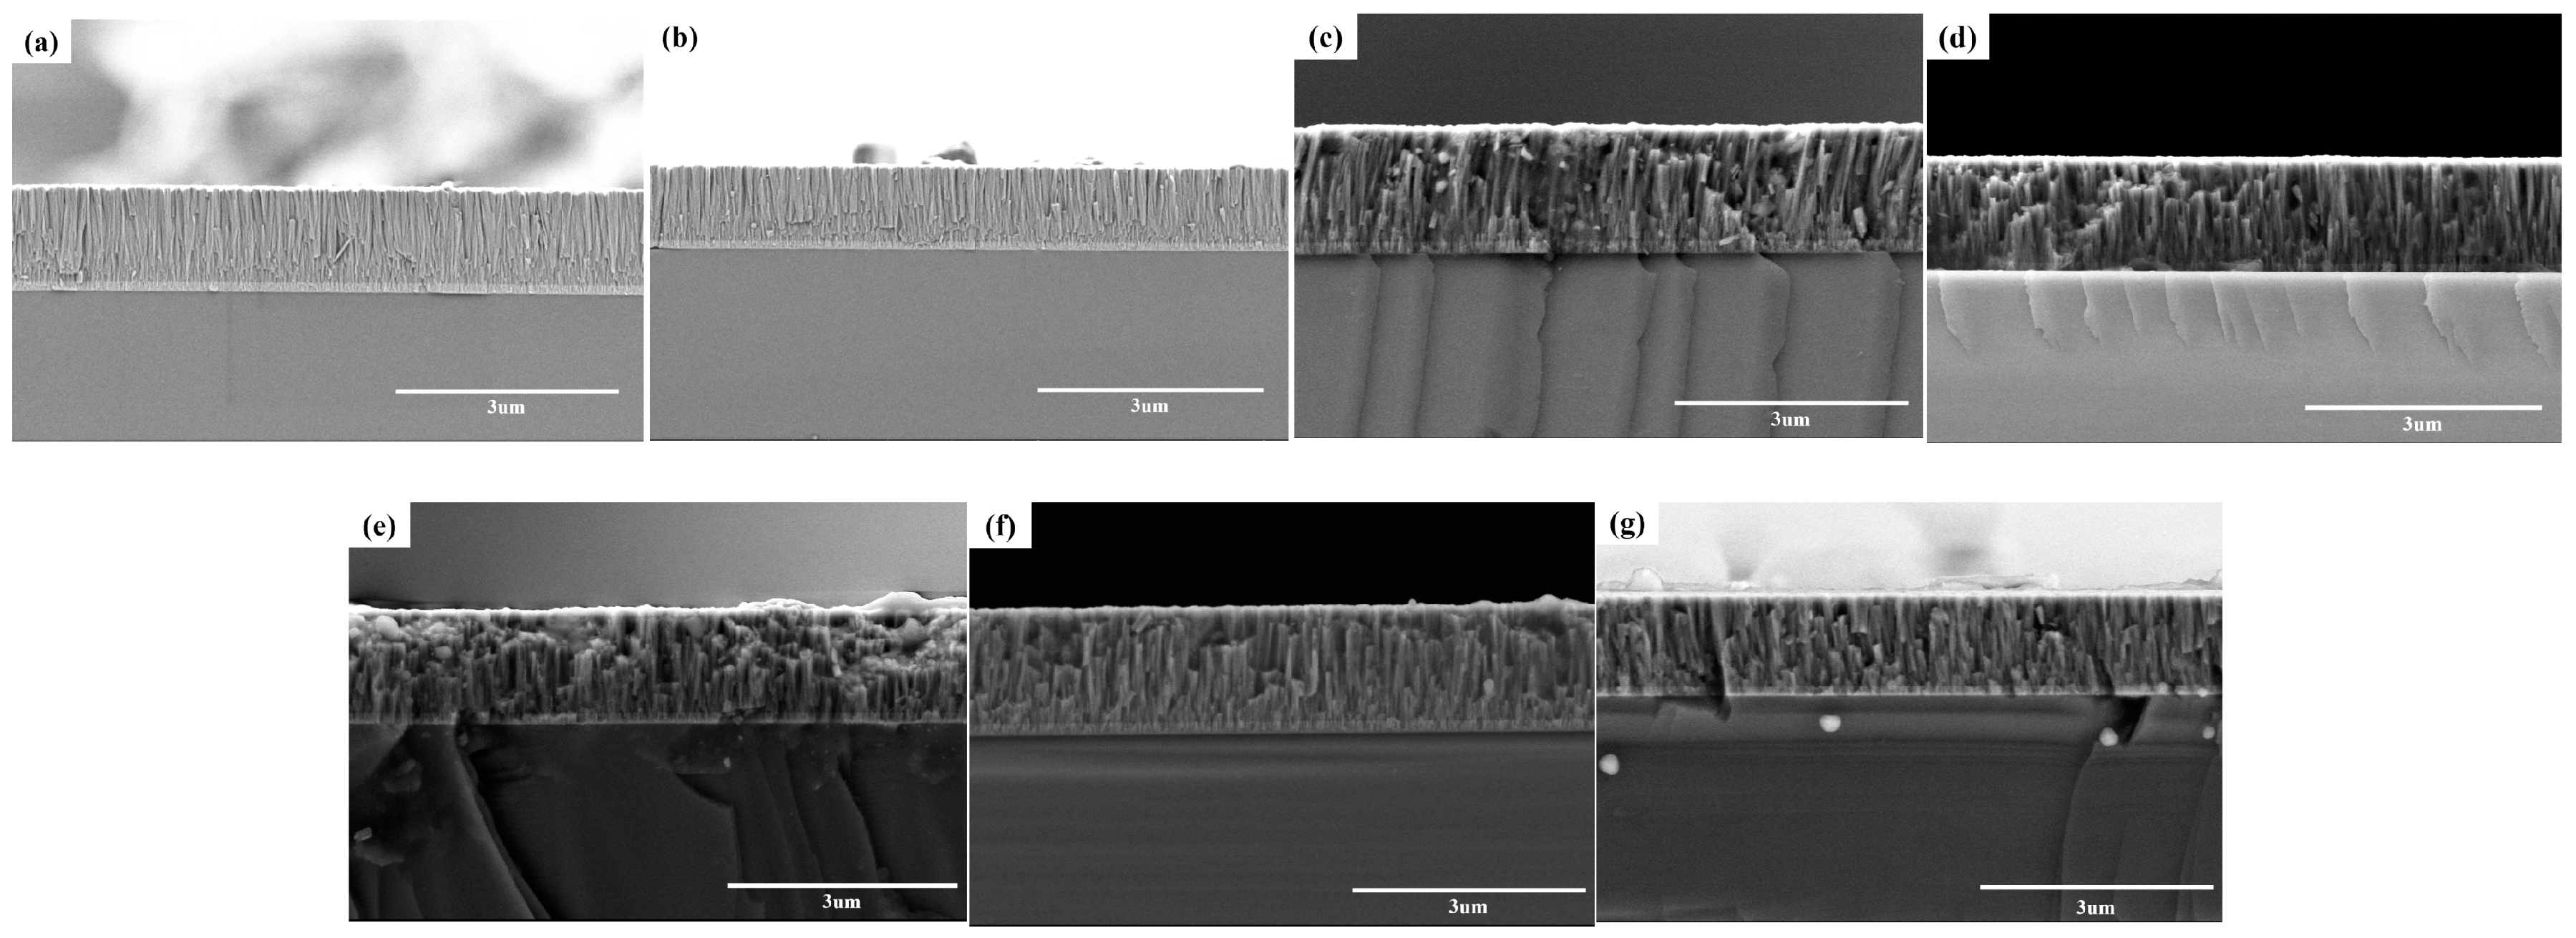
The titanium alloy TC4 disc with a hardness of 5.43 GPa was used as substrate. The surface roughness of the TC4 substrate was about 50 nm after being polished with 400 grit, 600 grit, 1000 grit, 1500 grit, and 2000 grit sandpaper and polished with a polishing machine equipped with Cr2O3 powder. To further clean the residual contaminant on the surface an ultrasonic clean in anhydrous ethanol lasted for 15 min. Afterwards, the CrN coatings were deposited onto TC4 substrates by using a DC magnetron sputtering system (SVAC-Filmlab-S500) equipped with a circular Cr target (Φ80 mm × 6 mm). To remove water vapor, the chamber was heated to 100 °C during the vacuuming process. The basic pressure of the chamber was evacuated to be 5.0 × 10⁻⁴ Pa by mechanical and molecular pumps. Prior to deposition of CrN coatings, an ion bombardment was applied on the TC4 substrate by using a Kaufmann ion source for 10 min. During deposition, the power of the Cr target was set to 320 W first to deposit a Cr transition layer for bonding strength enhancement [21]. Afterwards, the power of the Cr target was adjusted to 390 W for CrN coating deposition while the substrate was heated to 200 °C for enhancing bonding strength [22]. The gases in the chamber were a nitrogen/argon mixture at 0.55 Pa pressure. The deposition process of CrN coatings lasted for 120 min. The cross-sectional morphology of the coating at the end of deposition is shown in Figure 2, and the thickness of the coating was about 1.3–1.5 μm.

2.2. Electrochemical Polarization Treatment of CrN Coatings

The CrN coatings left with an exposed surface area of 3 cm2 were used for EP treatment. The CrN coatings were immersed in tap water for 5 min first, and then the EP treatment was applied on CrN coatings by using an electrochemical workstation (CHI660E, CH Instrument Ins, Shanghai, China). During EP treatment, a three-electrode configuration was used, in which the working electrode, reference electrode, and auxiliary electrode were CrN coating, saturated Ag/AgCl, and a platinum wire, respectively. According to our previous study, the overpotential for each sample was set at 70 mV, and the scan rate was set to 20 mV/min. The different cycle numbers of 10, 20, 30, 40, 50, and 60 times were carried out on the CrN coatings. Figure 3 shows the schematic diagram of EP treatment at different cycle numbers. The CrN coatings treated at different cycle numbers were referred to as CrN10, CrN20, CrN30, CrN40, CrN50, and CrN60, respectively, and the original CrN coatings were referred to as CrN0.

2.3. Structural and Mechanical Characterization

The surface morphologies and chemical compositions of the CrN coatings were observed and measured by using a field emission scanning electron microscope (FE-SEM, ZEISS SIGMA 500 microscope, German) equipped with an Energy dispersive spectroscopy (EDS). In order to study the microstructure of the coatings in more depth and to characterize the composition of the phases, thin foils were prepared by the focused ion beam method and analyzed by transmission electron microscope (TEM). The cross-sectional morphology and selected area electron diffraction (SAED) of the coating were observed and analyzed using a high-resolution transmission electron microscope (HRTEM, TECNAIG2S-TWINF20, United States).
The loading-unloading curves of CrN coatings were obtained using a dynamic ultra-micro hardness tester (DUH-211S, SHIMADZU, Japan), where the diamond indenter was a triangular pyramid indenter (115°). According to the calculation method proposed by Oliver and Pharr [23], the hardness (H) and elastic modulus (E) of the CrN coatings were calculated based on the obtained loading-unloading curves. The first step was to obtain the load at maximum displacement (Pmax), the maximum indentation depth (hmax), and the slope of the unloading curve (S) from the indentation curve. Afterwards, the contact depth (hc) was calculated according to Equation (1).
h c = h max ε P max S
In Equation (1), Ɛ was the correction constant, and then the contact area A was calculated from Equation (2).
A = f h c
Finally, the hardness (H) was calculated from Equation (3).
H = P max A
As for the modulus of elasticity, the parsimonious modulus of elasticity Er was first calculated from Equation (4).
S = β 2 π E r A
Afterwards, the modulus of elasticity (E) was calculated according to Equation (5), where v and vi were the Poisson’s ratios of the material and indenter, respectively, while Ei was the modulus of elasticity of the indenter.
1 E r = 1 v 2 E + 1 v i 2 E i
Based on the suggestion of loading depth in previous studies [24,25], a loading depth of 200 nm (13.3% of the coating thickness) was chosen so as to attenuate the contribution of TC4 substrate to the hardness results. Each indentation experiment was conducted 30 times to reduce data scatter.

2.4. Tribological Characterization

The SiC spheres with a diameter of 8 mm, a hardness of 27.5 GPa, and a surface roughness of 88.5 nm were chosen as wear components. By using a ball-and-disk friction testing apparatus, the friction behavior of CrN coatings sliding against SiC spheres was conducted at room temperature (16 ± 1 °C, RH50 ± 5%). In order to better compare and analyze the results with our previous study [20], the experimental conditions were chosen to be consistent with the previous ones. The experiment involved applying a constant load of 1 N to the CrN coating, with the SiC spheres moving over the coating for a distance of 1000 m at a sliding speed of 0.2 m/s. The choice of experimental conditions was based on practical operating conditions such as the wear of titanium stabilizer discs in aero-engines, which receive a maximum contact stress of about 449 MPa during friction [26]. In comparison, when we chose 1N as well as SiC balls as experimental conditions, the contact stress was about 395 MPa, which is closer to the value reported in reference [26]. Each sample was still subjected to three friction experiments to ensure the accuracy of the experimental results. Based on our previous experience, the temperature at the contact interface of the CrN/SiC tribopair at the sliding distance of 500 m was measured using a handheld thermographic camera (HM-TPH21Pro-3AQF, HIKMICRO, China). With an emissivity of 0.89 and a measurement distance of 0.15 m, imaging was set to picture-in-picture mode.
After friction tests, the 3D morphologies and 2D contours of wear tracks on CrN coatings were characterized by using a white light interferometer (WLI 1000, RECT, USA). Based on the four images of 2D contours of wear tracks, the average void area A of wear tracks could be obtained. In contrast, the diameter d of abrasion marks on the SiC spheres was measured by using an optical microscope. By considering the loading load F, the total sliding distance L, the sphere’s radius R, and the preset radius r of the wear track on the coating. The wear rates of the SiC spheres (b) and the CrN coating (c) could be determined using the following specific equations [27].
ω b = π d 4 64 R F L
ω c = 2 π r A F L
To further investigate the wear mechanism of CrN coatings, the wear track morphologies and elemental compositions were observed and examined using a field emission scanning electron microscope (FE-SEM, ZEISS SIGMA 500 microscope, German) with an Energy dispersive spectroscopy (EDS).

2.5. Simulation of Electrochemical Polarization Process

The electrochemical polarization process of the CrN coating was simulated using COMSOL6.0 software. The CrN coating serves as the anode and is positioned on the right side of the diagram, while the cathode is situated on the left side, featuring several pores dispersed across the surface of the coating. The entire system was immersed in tap water, as shown in Figure 4.
In the course of the simulation, the secondary current distribution was specified for the current distribution type. Deformation geometry was employed to describe the variations in coating surface thickness. The equilibrium potential of the cathode was established at −400 mV, while that of the anode was set at −470 mV. The electrolyte conductivity was defined as 0.05 S/m, and the number of electrons involved in the electrode reaction was determined to be 3.

3. Results

3.1. Microstructure

The chemical concentrations of CrN coatings measured by EDS spot scans are listed in Table 1. It is obvious that the oxygen content increases gradually with cycle number. To be specific, the oxygen content of CrN0 coating is 6.32%, while that of CrN10 increases to 7.00%. When the cycle number reaches 20 and 30 times, the oxygen content of CrN20 and CrN30 coatings increased suddenly to 11.92% and 11.43%. With increasing cycle number to 40, 50, and 60 times, the oxygen content increased slightly to the range of 12.35–12.64% for CrN40, CrN50, and CrN60 coatings. It is indicated that some oxides have been formed on the CrN coatings after EP treatment.
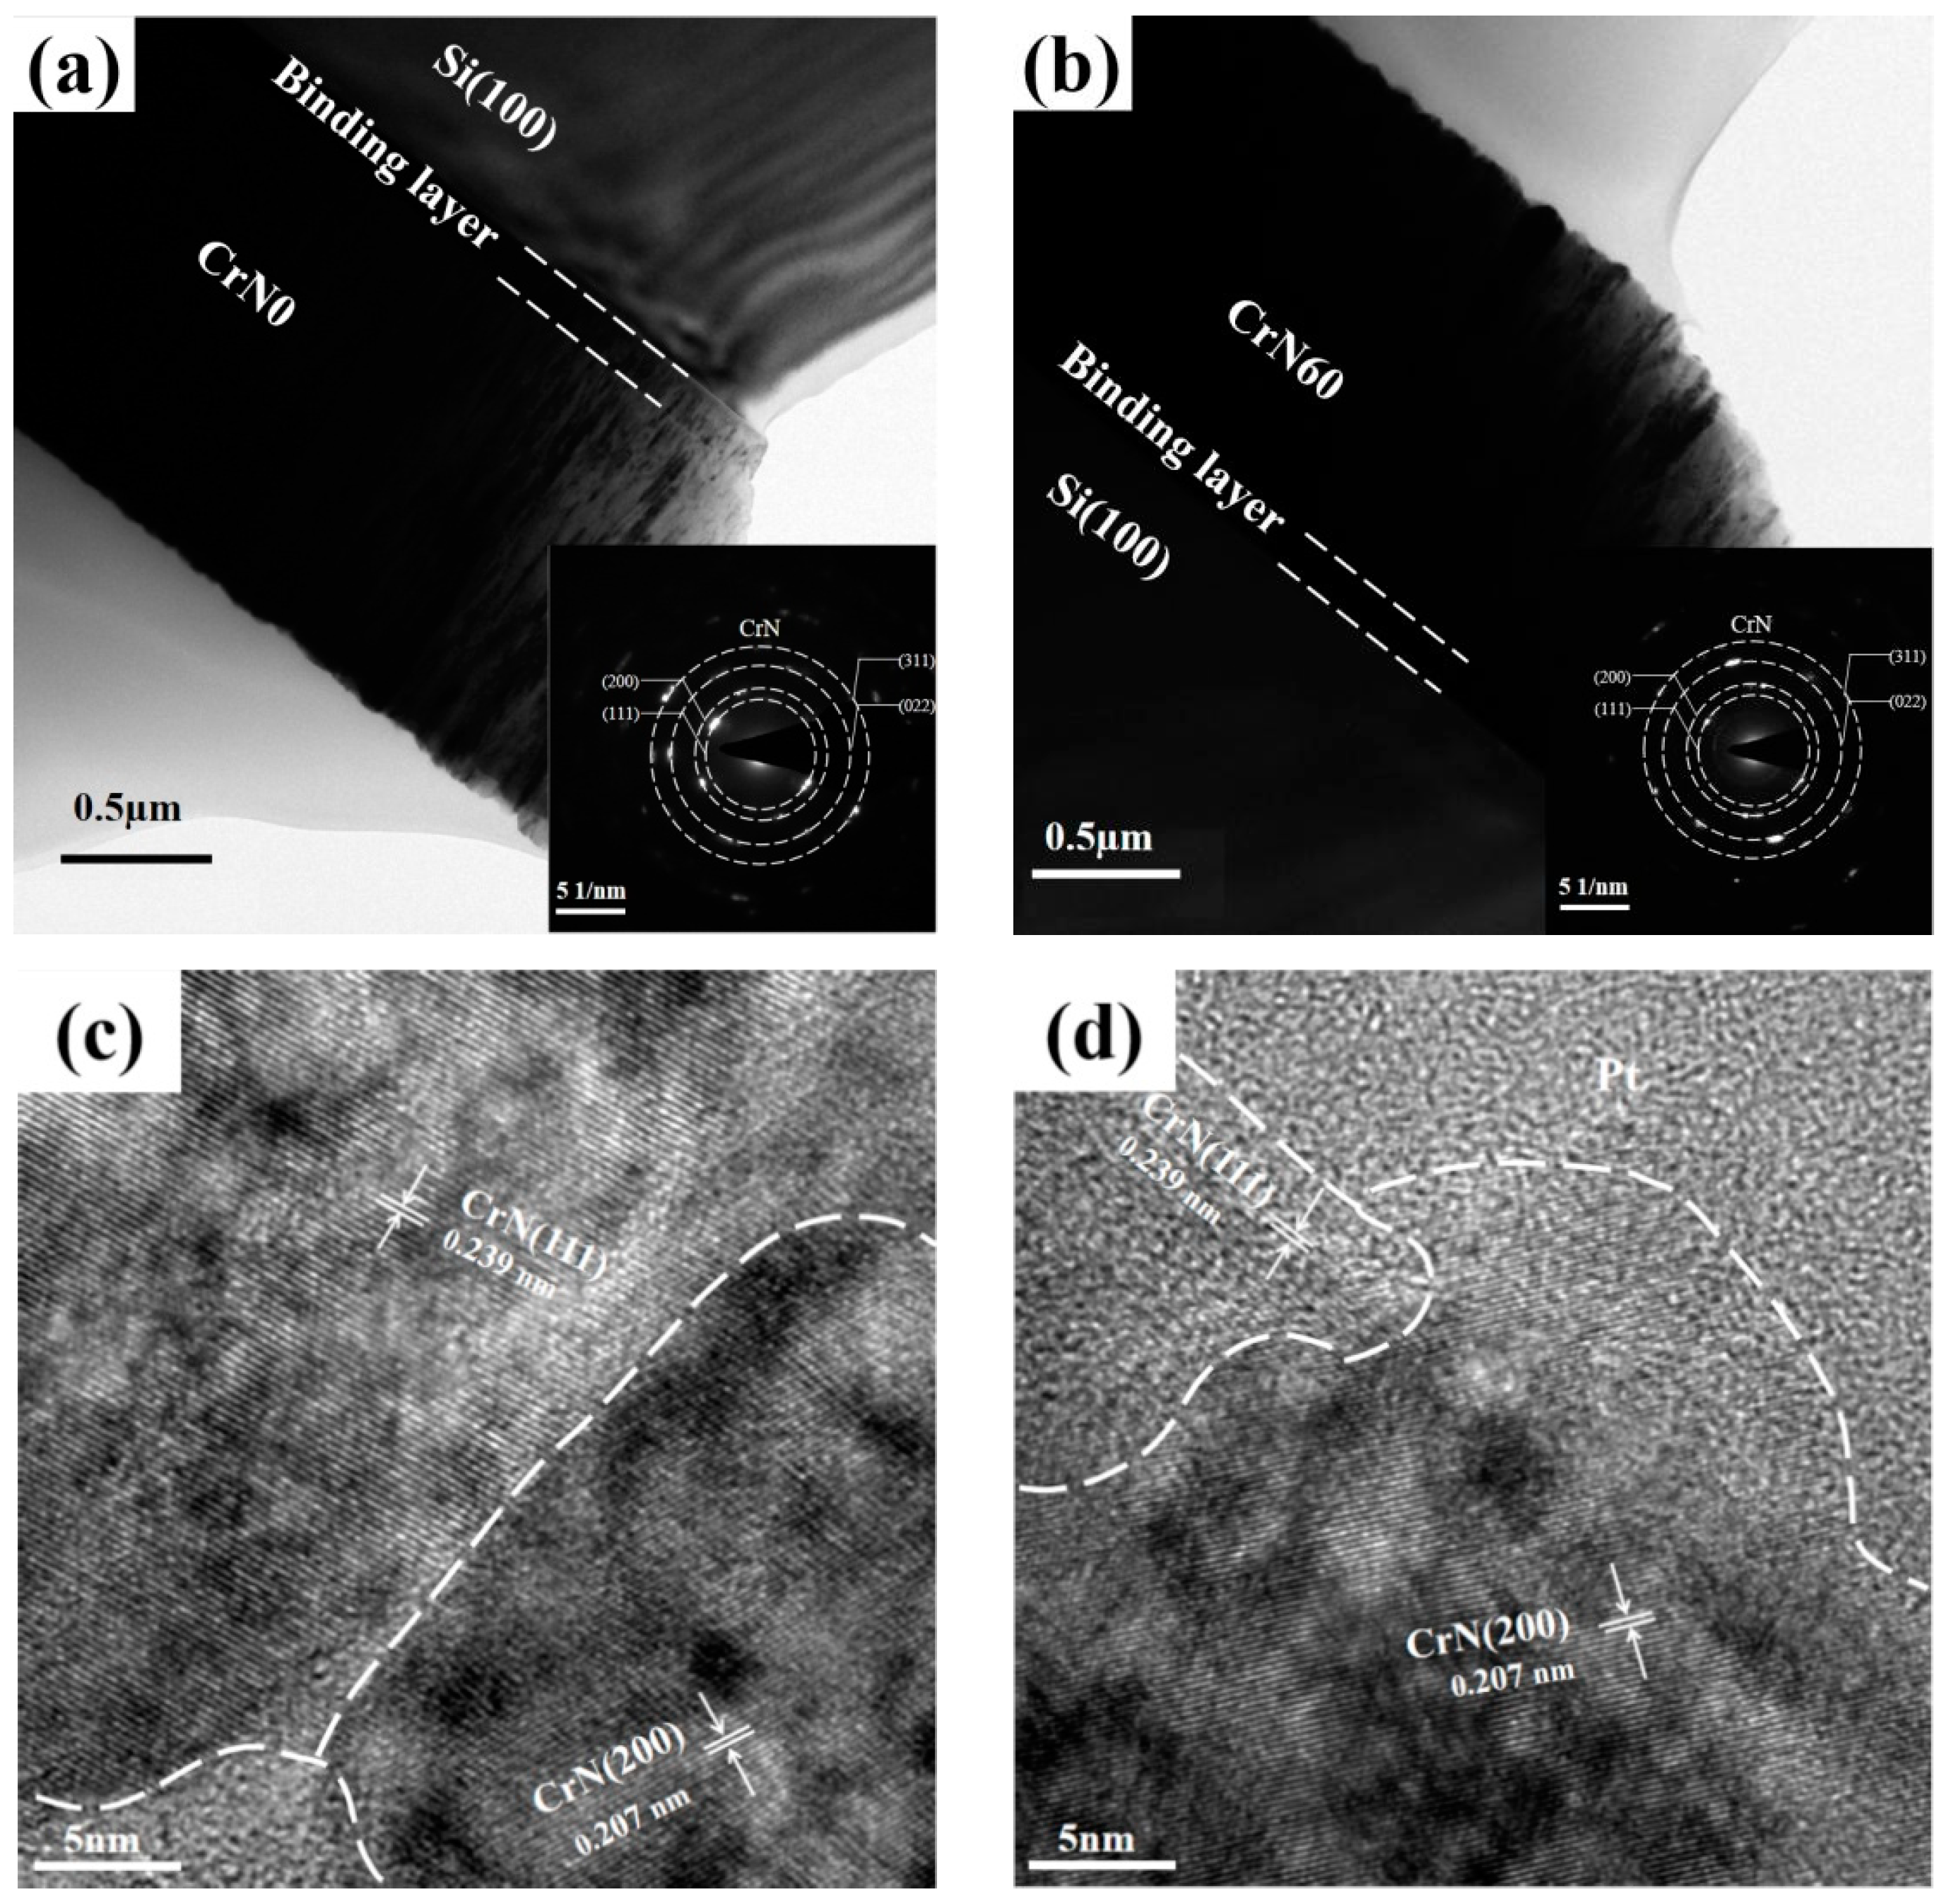
The cross-sectional morphology and selected area electron diffraction (SAED) results of CrN0 and CrN60 coatings are illustrated in Figure 5. Four diffraction rings with radii of 0.240 nm, 0.207 nm, 0.147 nm, and 0.125 nm, corresponding to the four crystalline orientations of CrN(111), CrN(200), CrN(022), and CrN(311), respectively, are shown in the SAED image. Moreover, the HRTEM image in Figure 5c,d shows the typical paralleled stripes of crystal planes. It is clear that CrN(111) and CrN(200) with the plane distances of 0.240 nm and 0.207 nm could be observed.
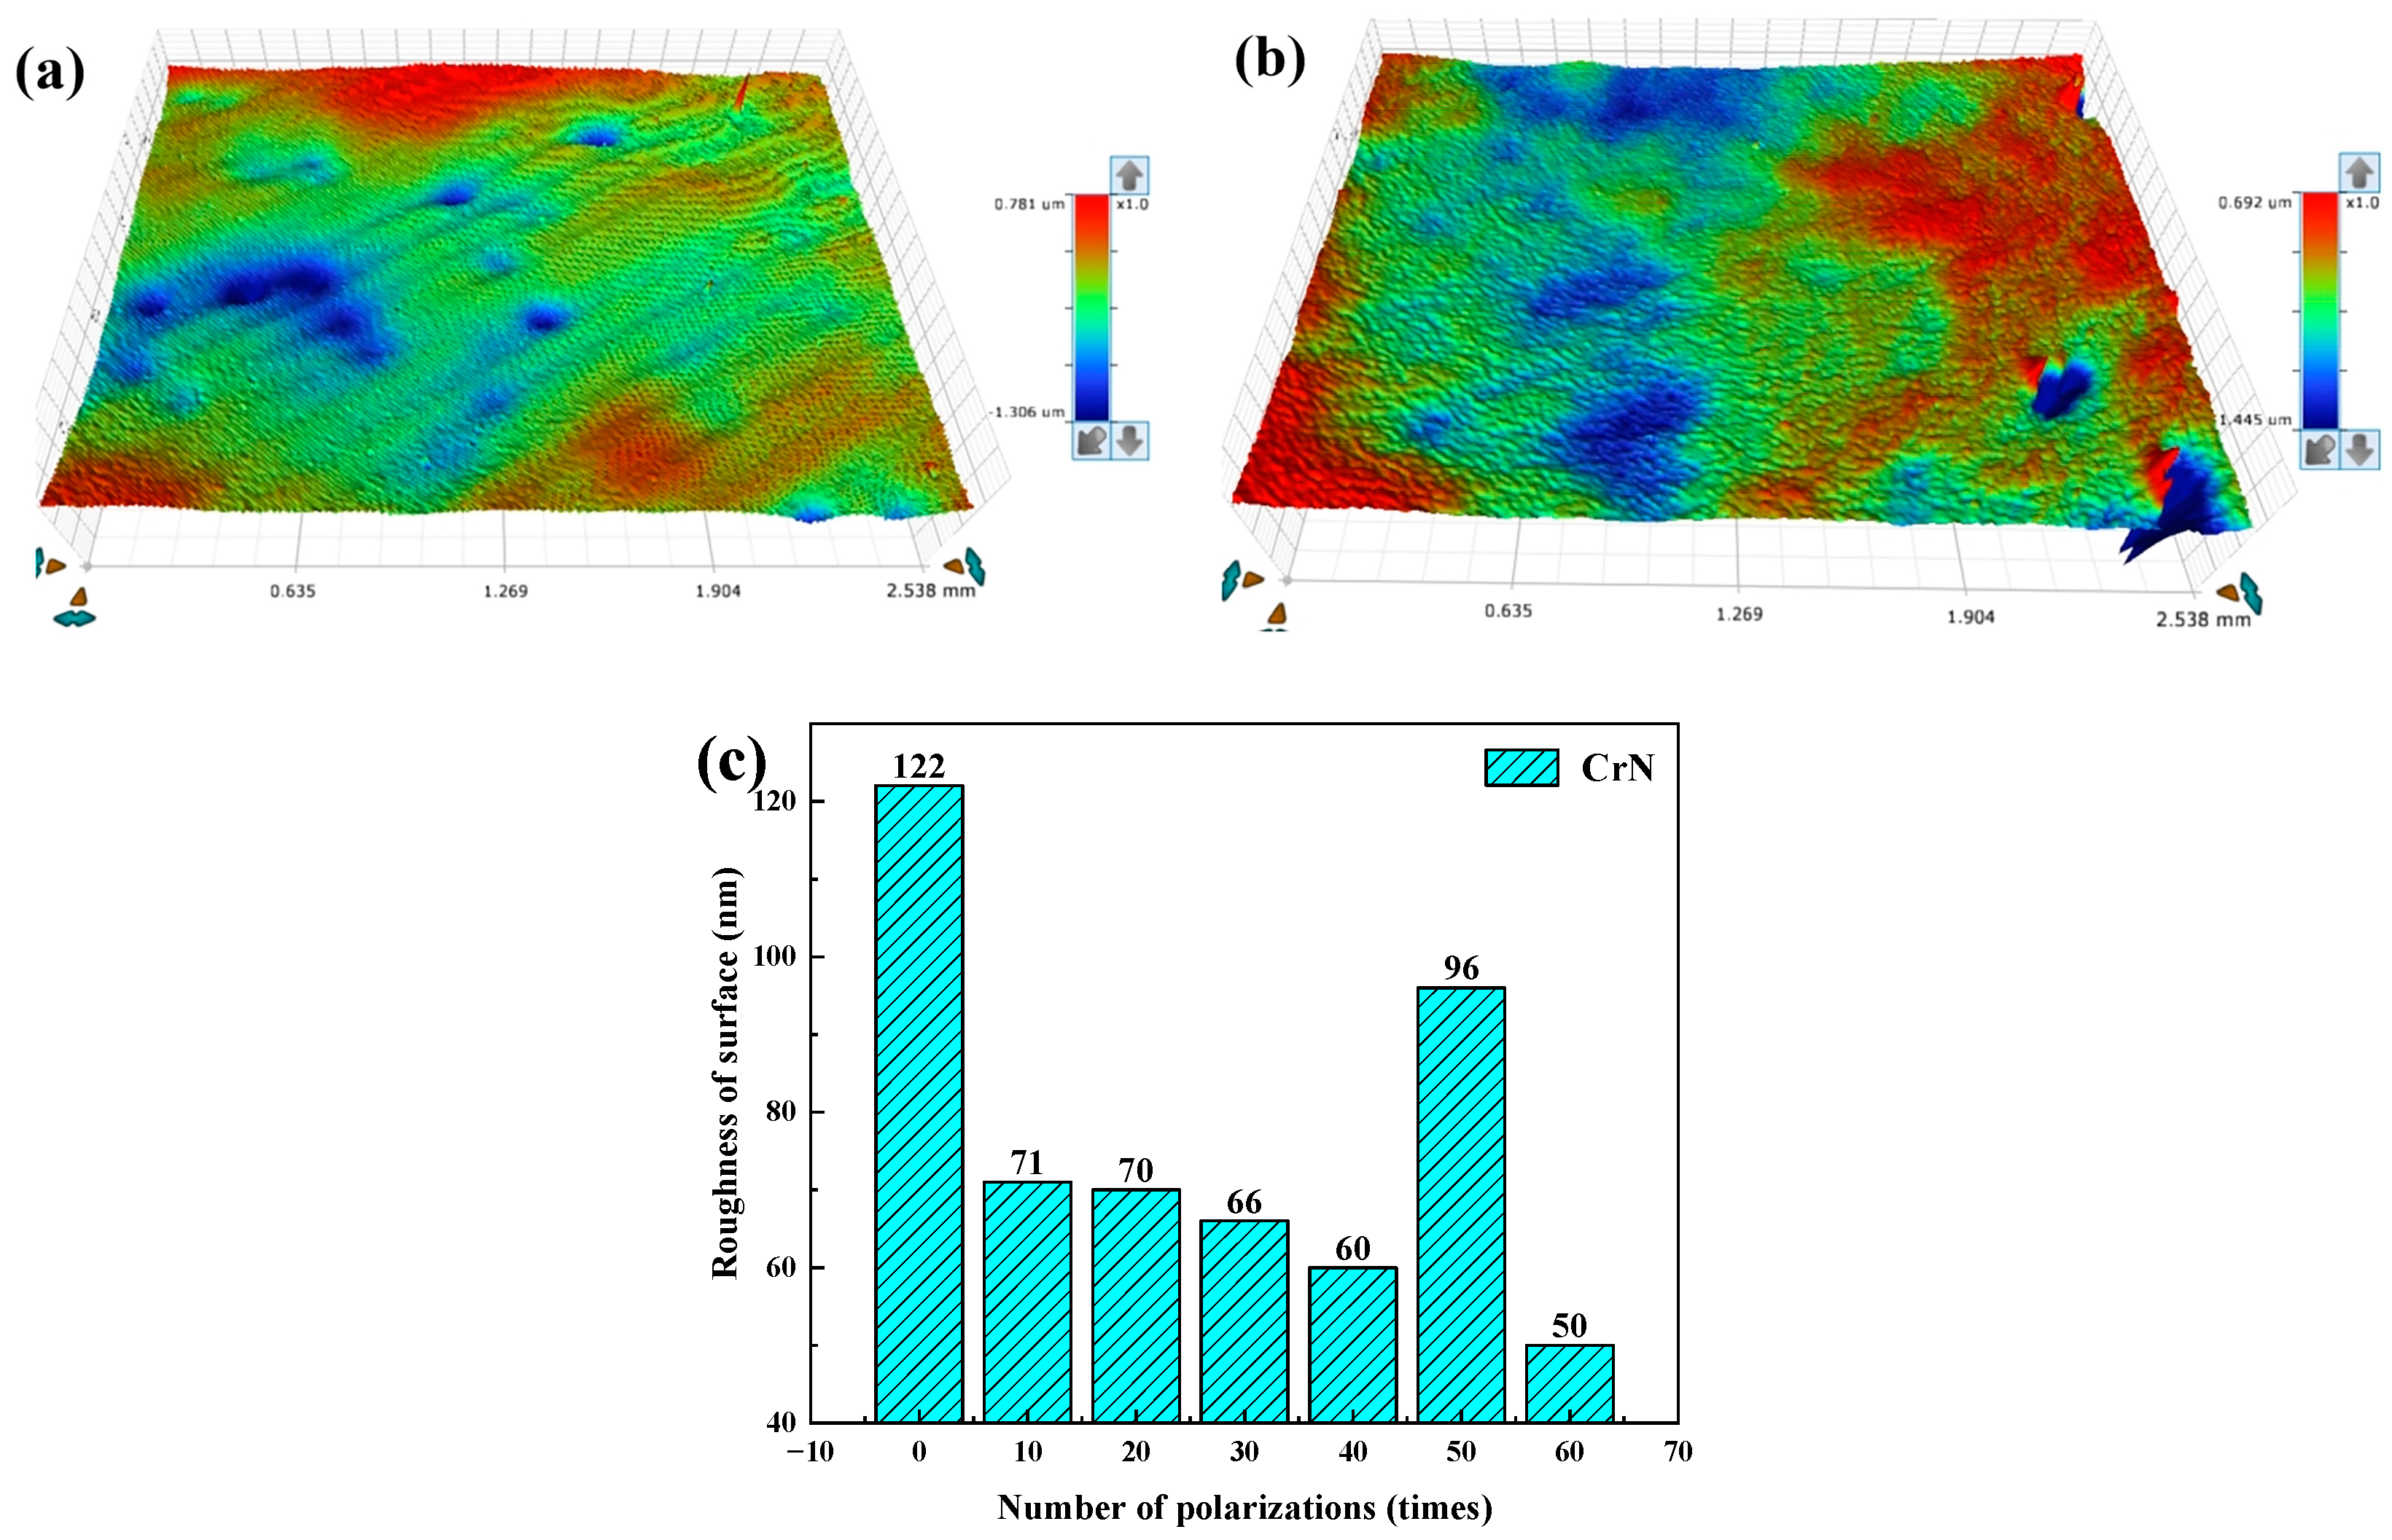
Figure 6 shows the surface morphologies of the CrN coatings before and after EP treatment. While the surface roughness Ra of the CrN coating was measured by a white light interferometer. The surface roughness of CrN coatings before and after EP treatment is shown in Figure 7c. The surface morphology of the CrN0 coatings is more angular, with the highest Ra of 122 nm. After EP treatment, the surface morphology of CrN coatings becomes blunt, i.e., smooth morphology, especially for the CrN60 coating shown in Figure 6g. As a result, the Ra of the CrN10 coating decreases to 71 nm and reaches the minimum value of 50 nm for the CrN60 coating with the increase of cycle number.

3.2. Mechanical Properties

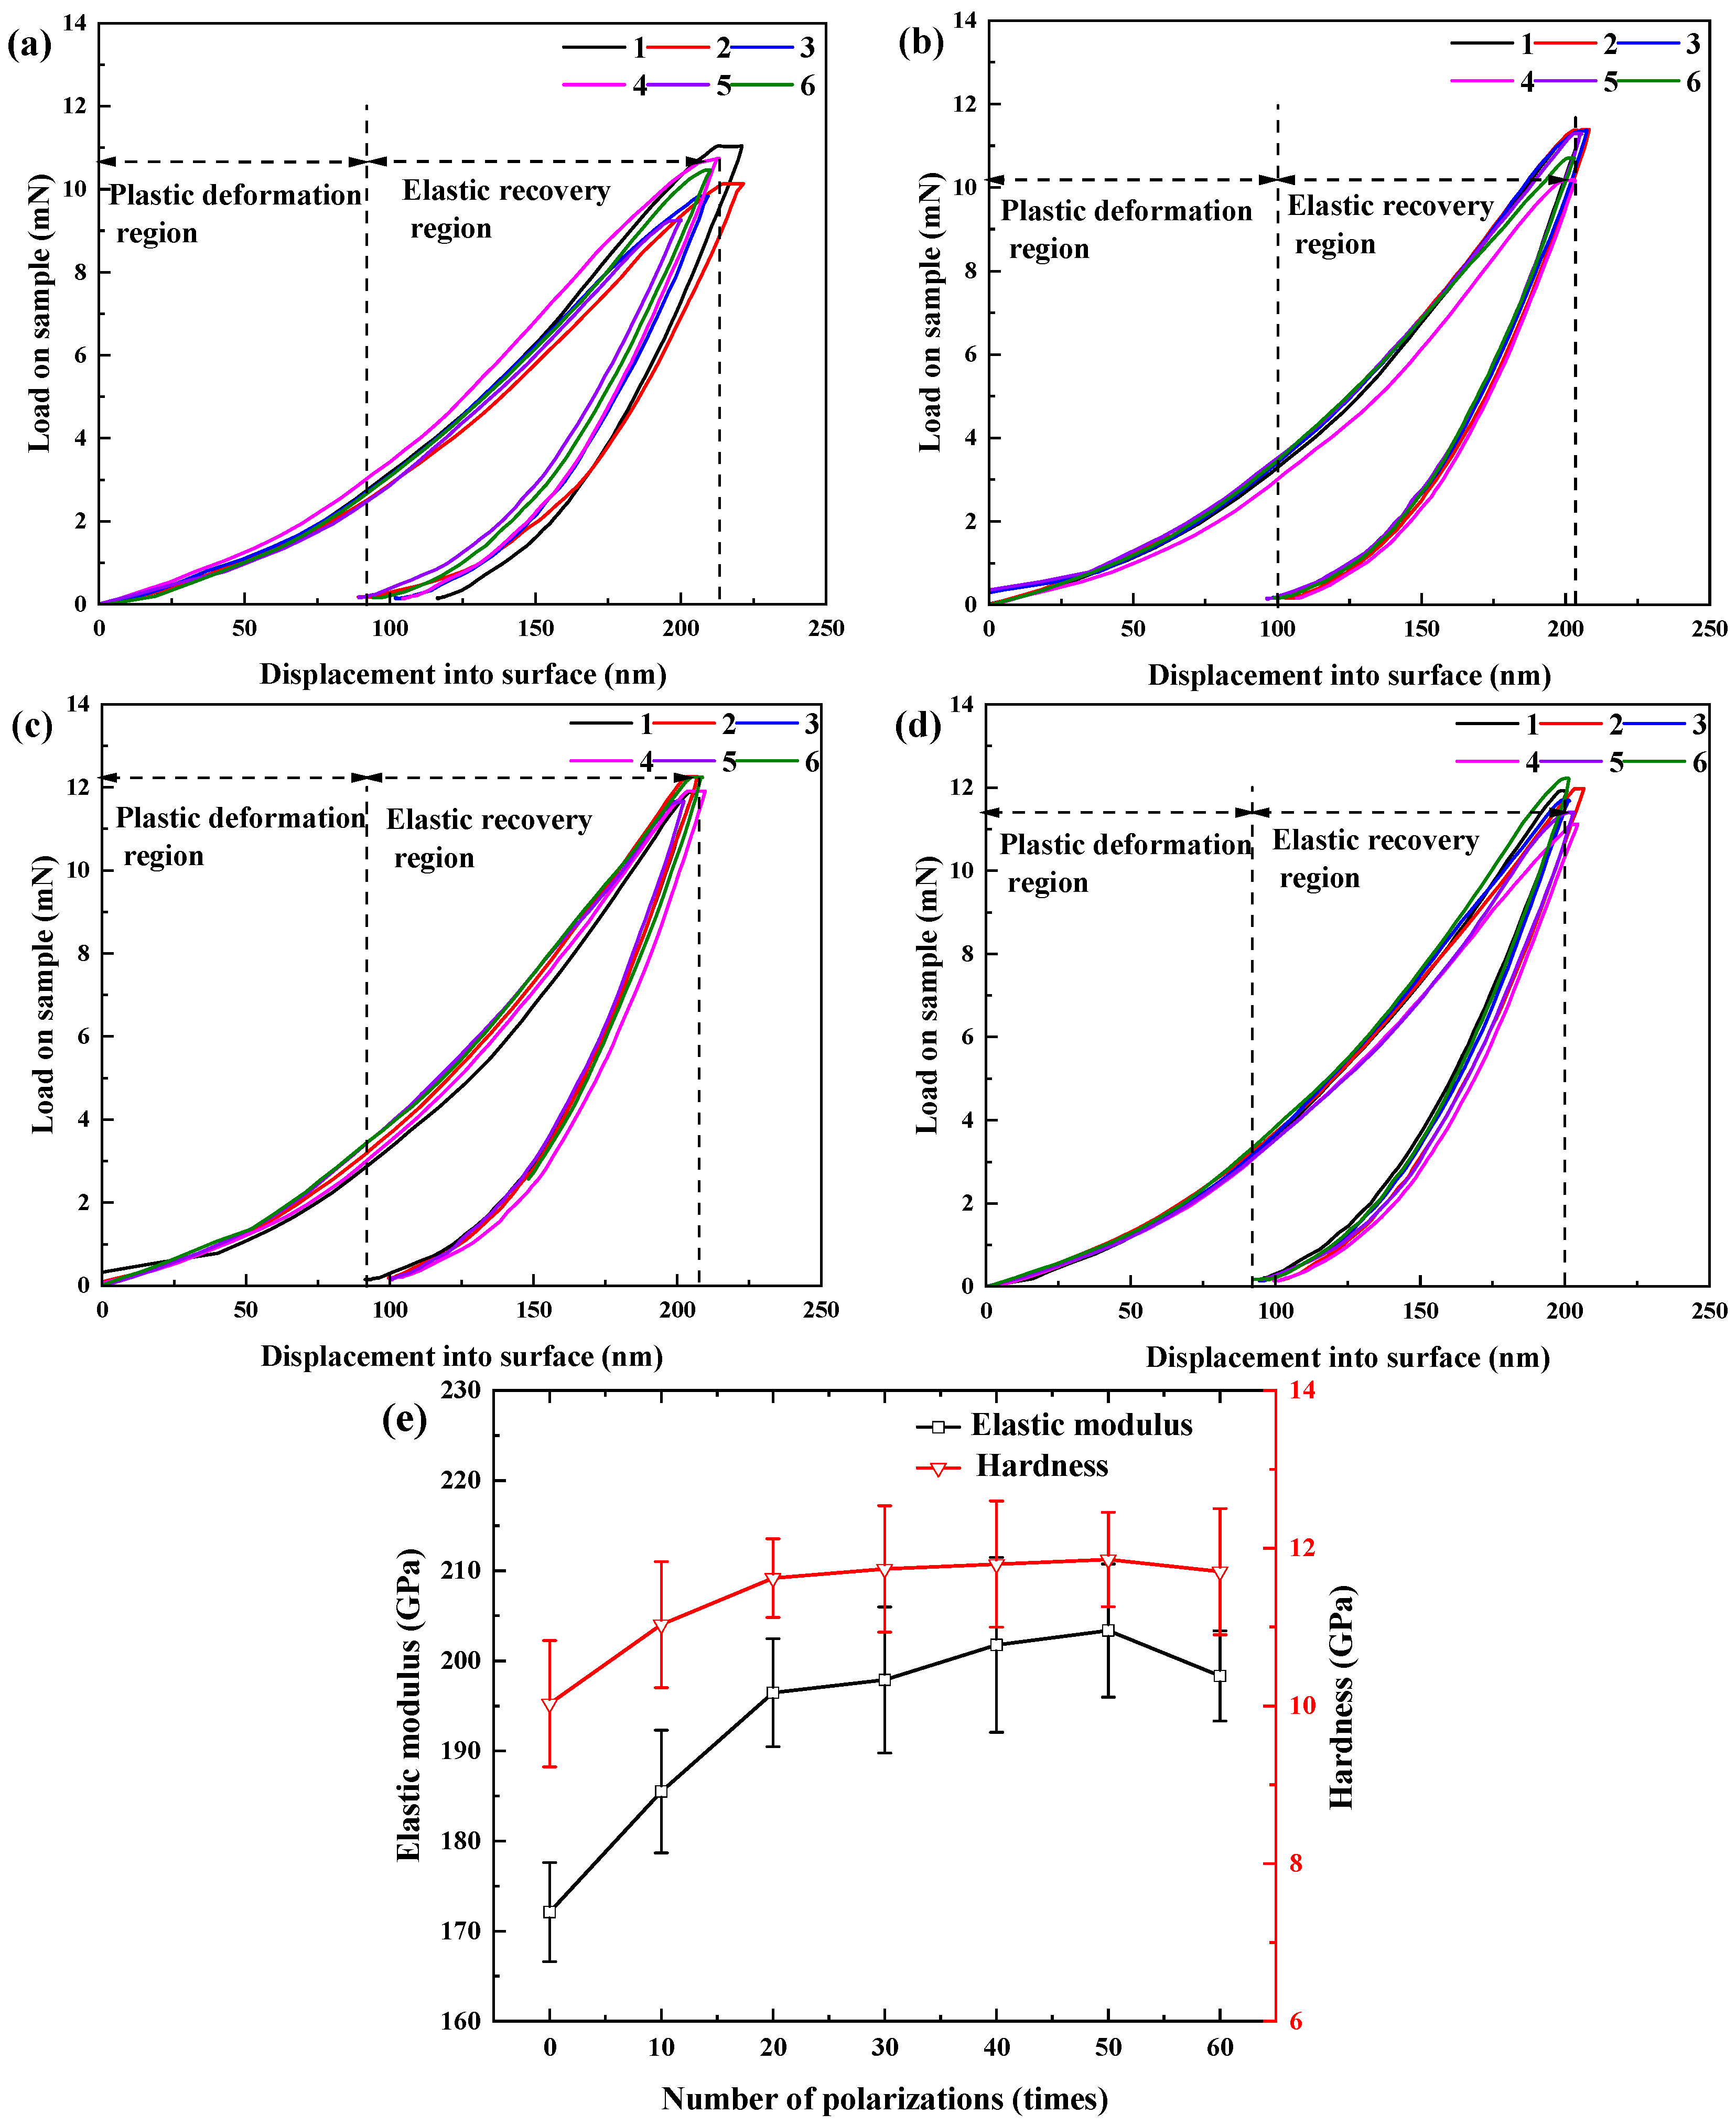
Figure 8a–d shows the six load-unloading curves of CrN coatings treated with different cycle numbers. It is clear that the six load-unloading curves of the CrN0 coating in Figure 8a are distinguished from each other. In contrast, after EP treatment, the six load-unloading curves of the CrN20, CrN40, and CrN60 coatings gradually become concentrated, which indicates the improved compactness.
Based on the load-unloading curves, the hardness and elastic modulus of the CrN coatings after EP treatments were calculated based on the Oliver and Pharr approach and are illustrated in Figure 8e. It can be seen that the hardness of the CrN0 coating is 10.03 ± 0.8 GPa, whereas the hardness of the CrN10 coating rises to 11.03 ± 0.5 GPa. With the cycle number continuing to increase to 50 times, the hardness increases gradually to the maximum value of 11.86 ± 0.6 GPa. Nevertheless, the hardness of the CrN60 coating falls slightly to 11.70 ± 0.8 GPa after 60 cycles. Regarding the elastic modulus, the initial elastic modulus of the CrN coating was 172.11 ± 5.5 GPa. After EP treatment, the elastic modulus of the CrN coating first increased and then decreased with the increase of the cycle number. It reaches a maximum value of 203.37 ± 7.4 GPa at 50 times and then slowly decreases to 198.32 ± 5.0 GPa at 60 times.

3.3. Tribological Properties

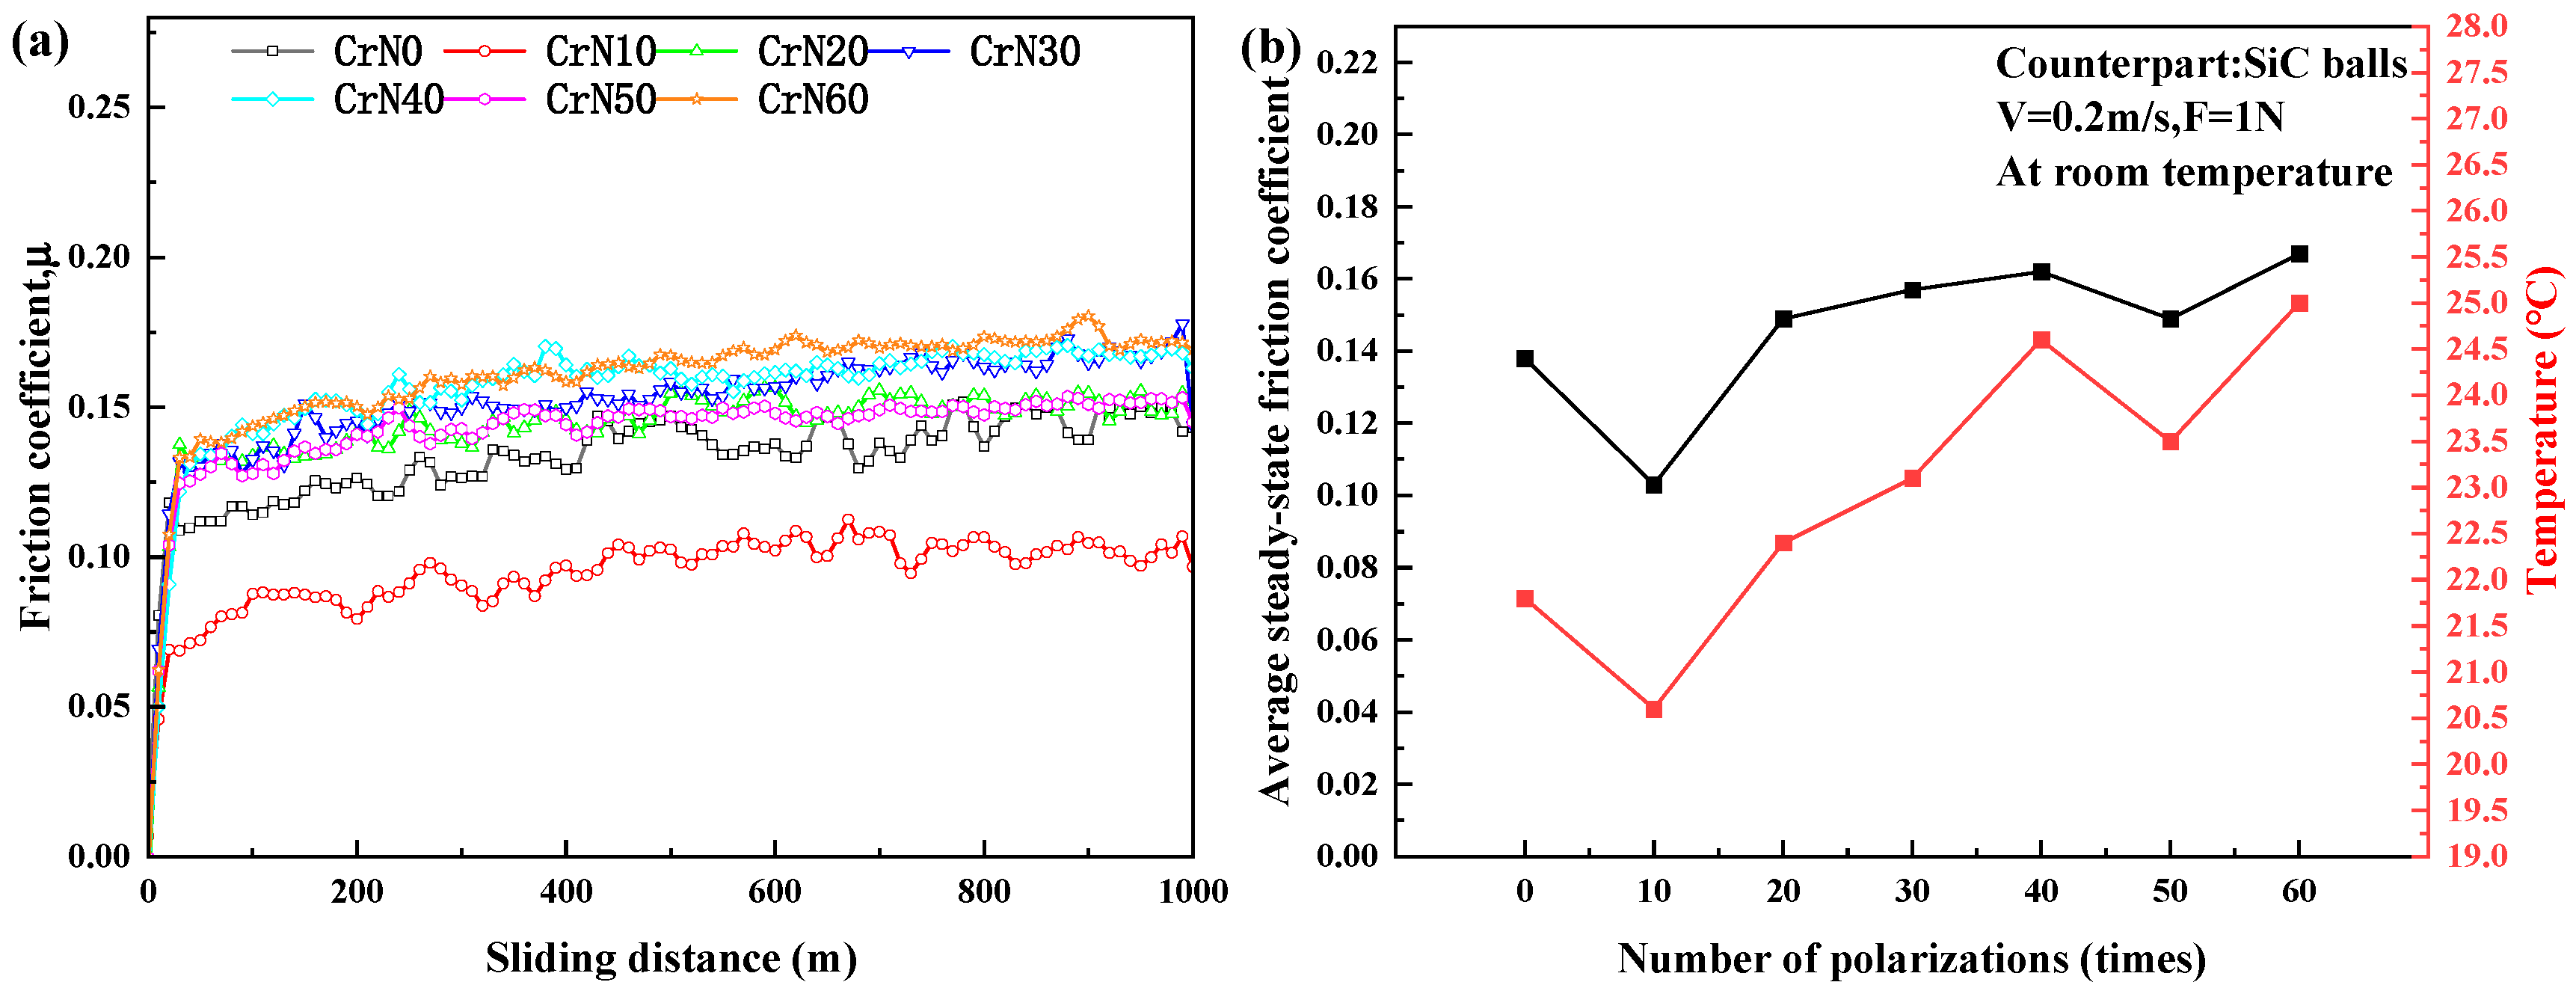
Figure 9a represents the variation of the friction coefficient of CrN/SiC tribopair in air as a function of sliding distance. During the friction experiments, the friction coefficients of the CrN/SiC tribopair all increase quickly in the first 50 m of sliding distance due to the enlarged contact interface. Afterwards, the friction coefficients of the CrN/SiC tribopair transition into the slow-growth status at the sliding distance from 50 m to 500 m. At the end, the friction coefficients of the CrN/SiC tribopair are stabilized after the sliding distance of 500 m. Therefore, the friction coefficients of CrN/SiC tribopair at the sliding distance from 500 m to 1000 m were chosen to calculate the average values. These average values are used as the mean steady-state friction coefficients of CrN/SiC tribopair, which are shown in Figure 9b. On the whole, the mean steady-state friction coefficients of CrN/SiC tribopair are in the range of 0.104–0.168, which are relatively low. This could be attributed to the low applied load (F = 1 N) and sliding velocity (v = 0.2 m/s) as well as the small surface roughness (50 nm–122 nm) of the CrN coating. As shown in Figure 9b, the mean steady-state friction coefficient shows a decreasing and then increasing trend with the increase of cycle number. The friction coefficient of the CrN0 coating is 0.139 but decreased to 0.104 for the CrN10 coating after 10 times of EP treatment. Afterwards, as the cycle number increases, the friction coefficient of CrN coatings gradually increases and reaches the maximum value of 0.167 for CrN60 coating after 60 times of EP treatment.
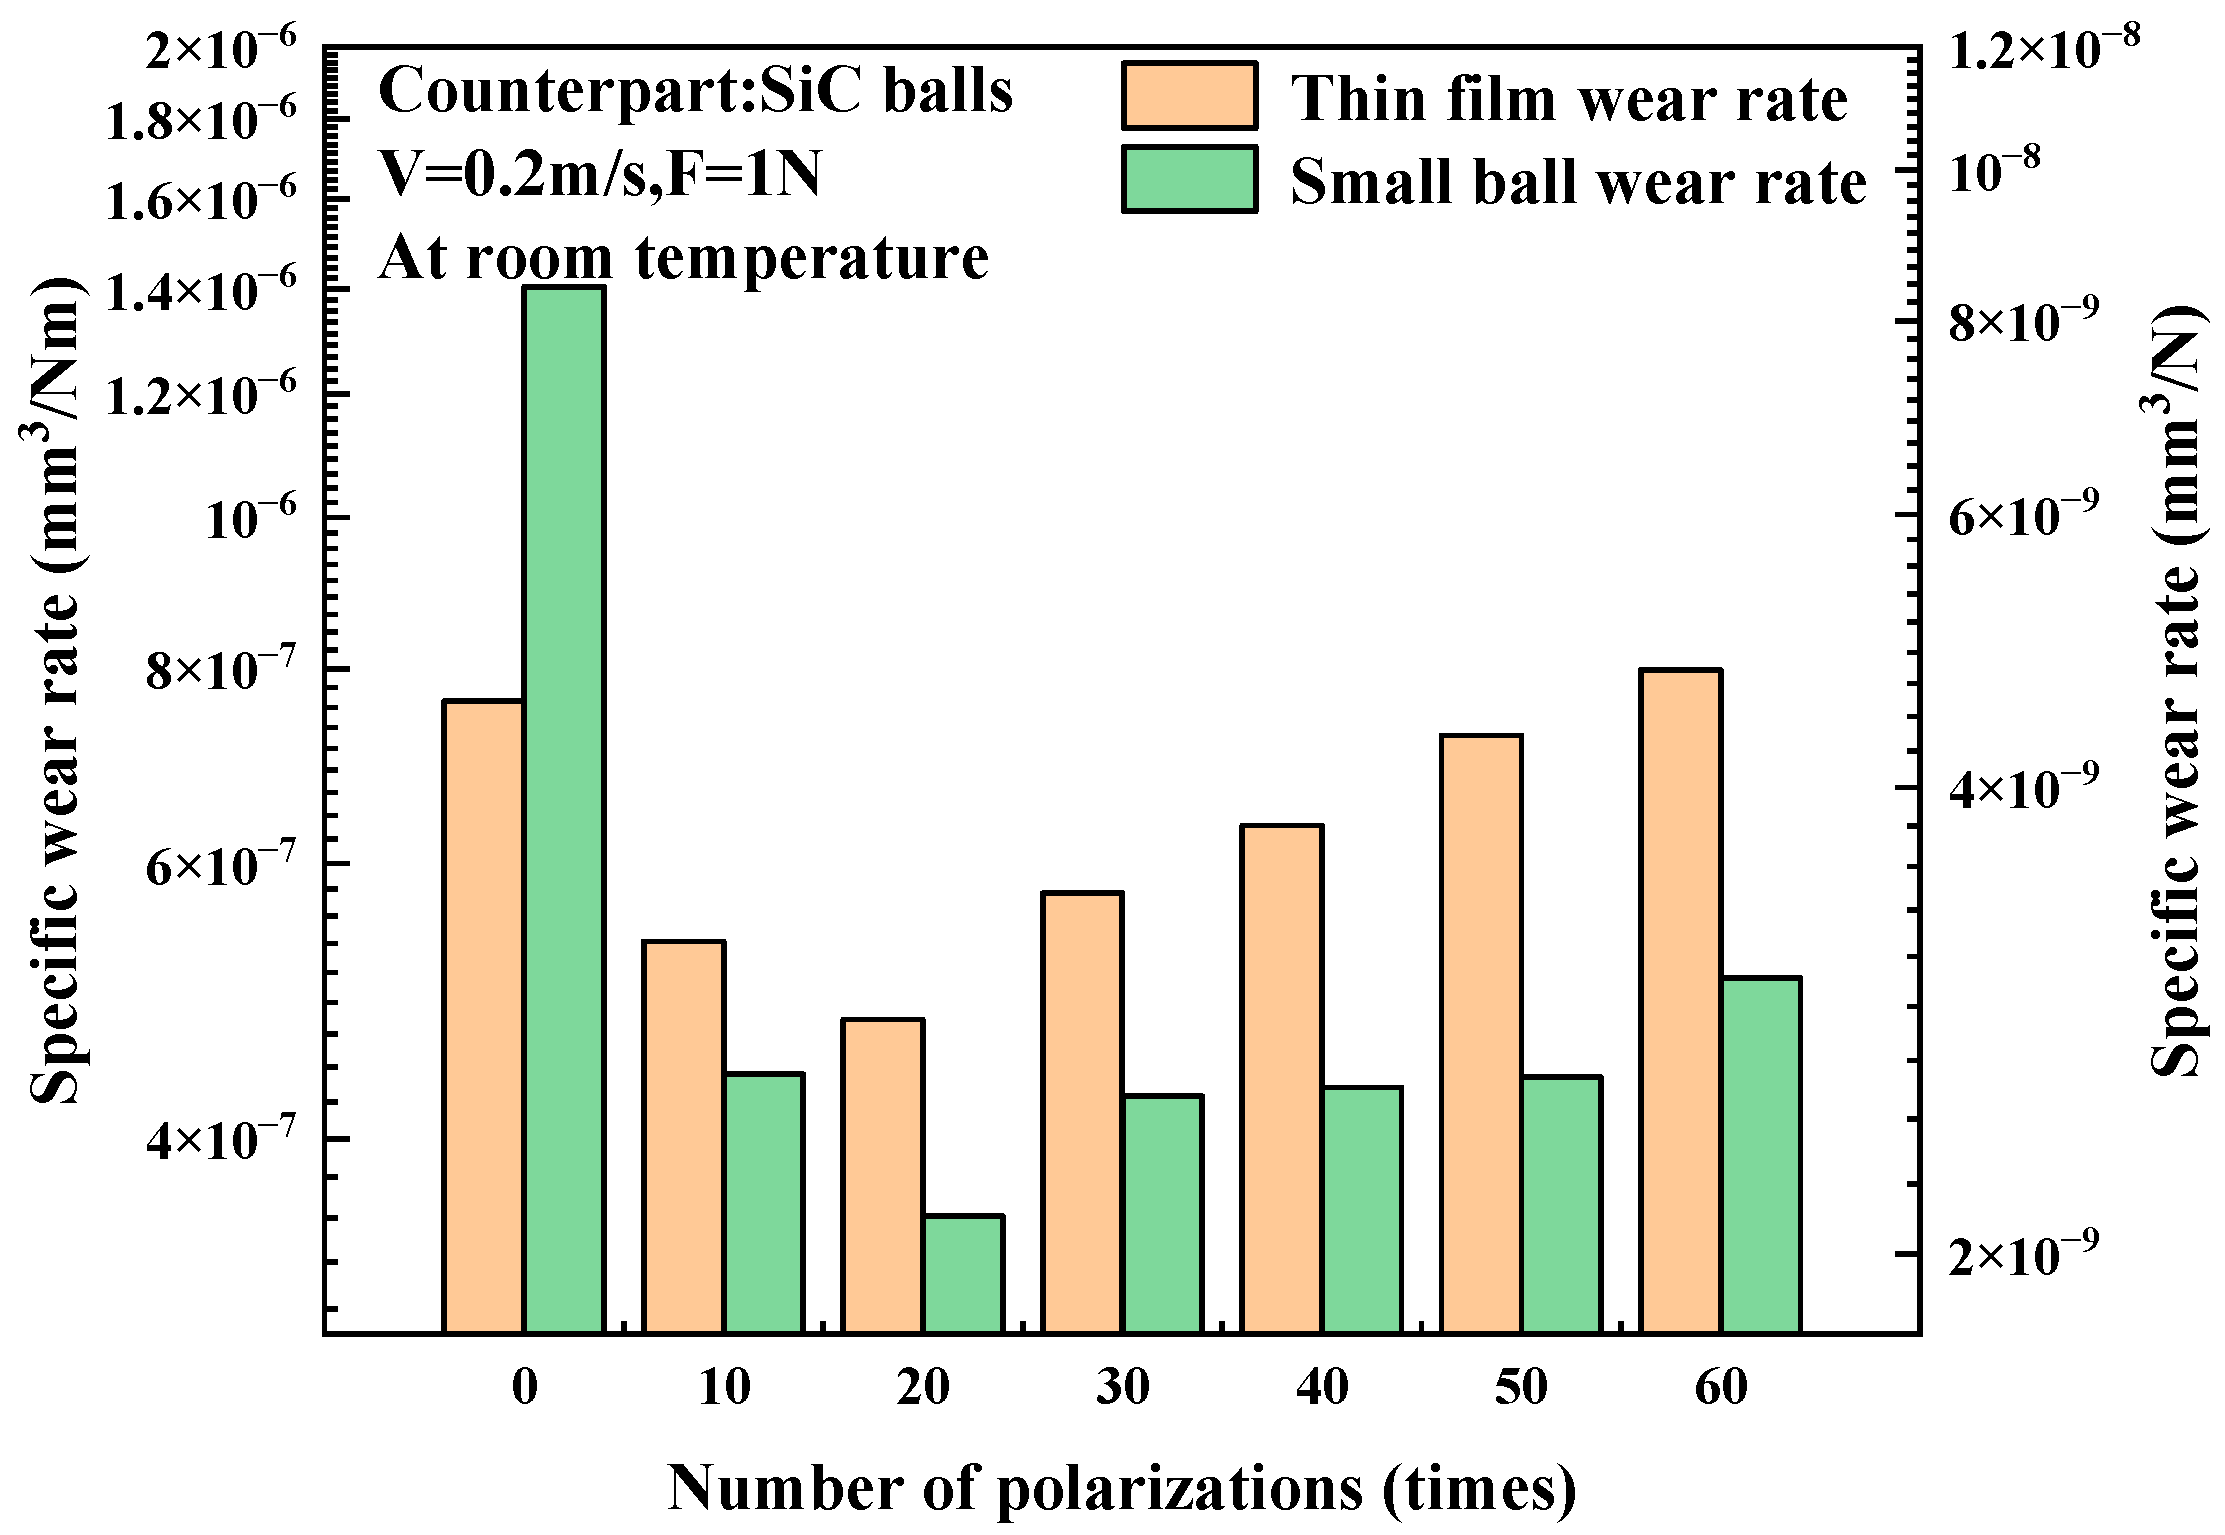
The wear rates of the CrN coatings and SiC spheres are illustrated in Figure 10. It is obvious that the wear rates of the CrN coatings are much higher than those of the SiC spheres. It is because the hardness of the CrN coating (10.03–11.86 GPa) is much smaller than that of the SiC spheres (27.5 GPa), and therefore the softer coating will be subjected to more abrasion during friction. Regarding the wear rates of the CrN coatings, the CrN0 coating presents a high wear rate of 7.626 × 10⁻⁷ mm3/Nm due to its low hardness of 10.03 GPa. After EP treatment, the wear rate of CrN coating becomes lower and shows a decreasing and then increasing trend with the increase of cycle number. To be specific, the wear rates of the CrN10 and CrN20 coatings decreased gradually to a minimum value of 4.766 × 10⁻⁷ mm3/Nm. Then, the wear rate of the CrN coating increased gradually to 7.248 × 10⁻⁷ mm3/Nm for the CrN50 coating. At last, the wear rate of CrN60 coating reaches the maximum value of 7.983 × 10⁻⁷ mm3/Nm, which is even higher than that of CrN0 coating.

4. Discussion

4.1. Microstructure

According to EDS results listed in Table 1, the increase of the oxygen content demonstrates the generation of oxides during EP treatment [28,29]. However, only the diffraction rings of CrN(111), CrN(200), CrN(022), and CrN(311) were found in the SAED results. It indicates that only a small amount of oxides was generated after EP treatment and cannot be detected by SAED [30]. Namely, the major microstructure of CrN coating, i.e., the mixture of CrN phases, remains even after EP treatment.
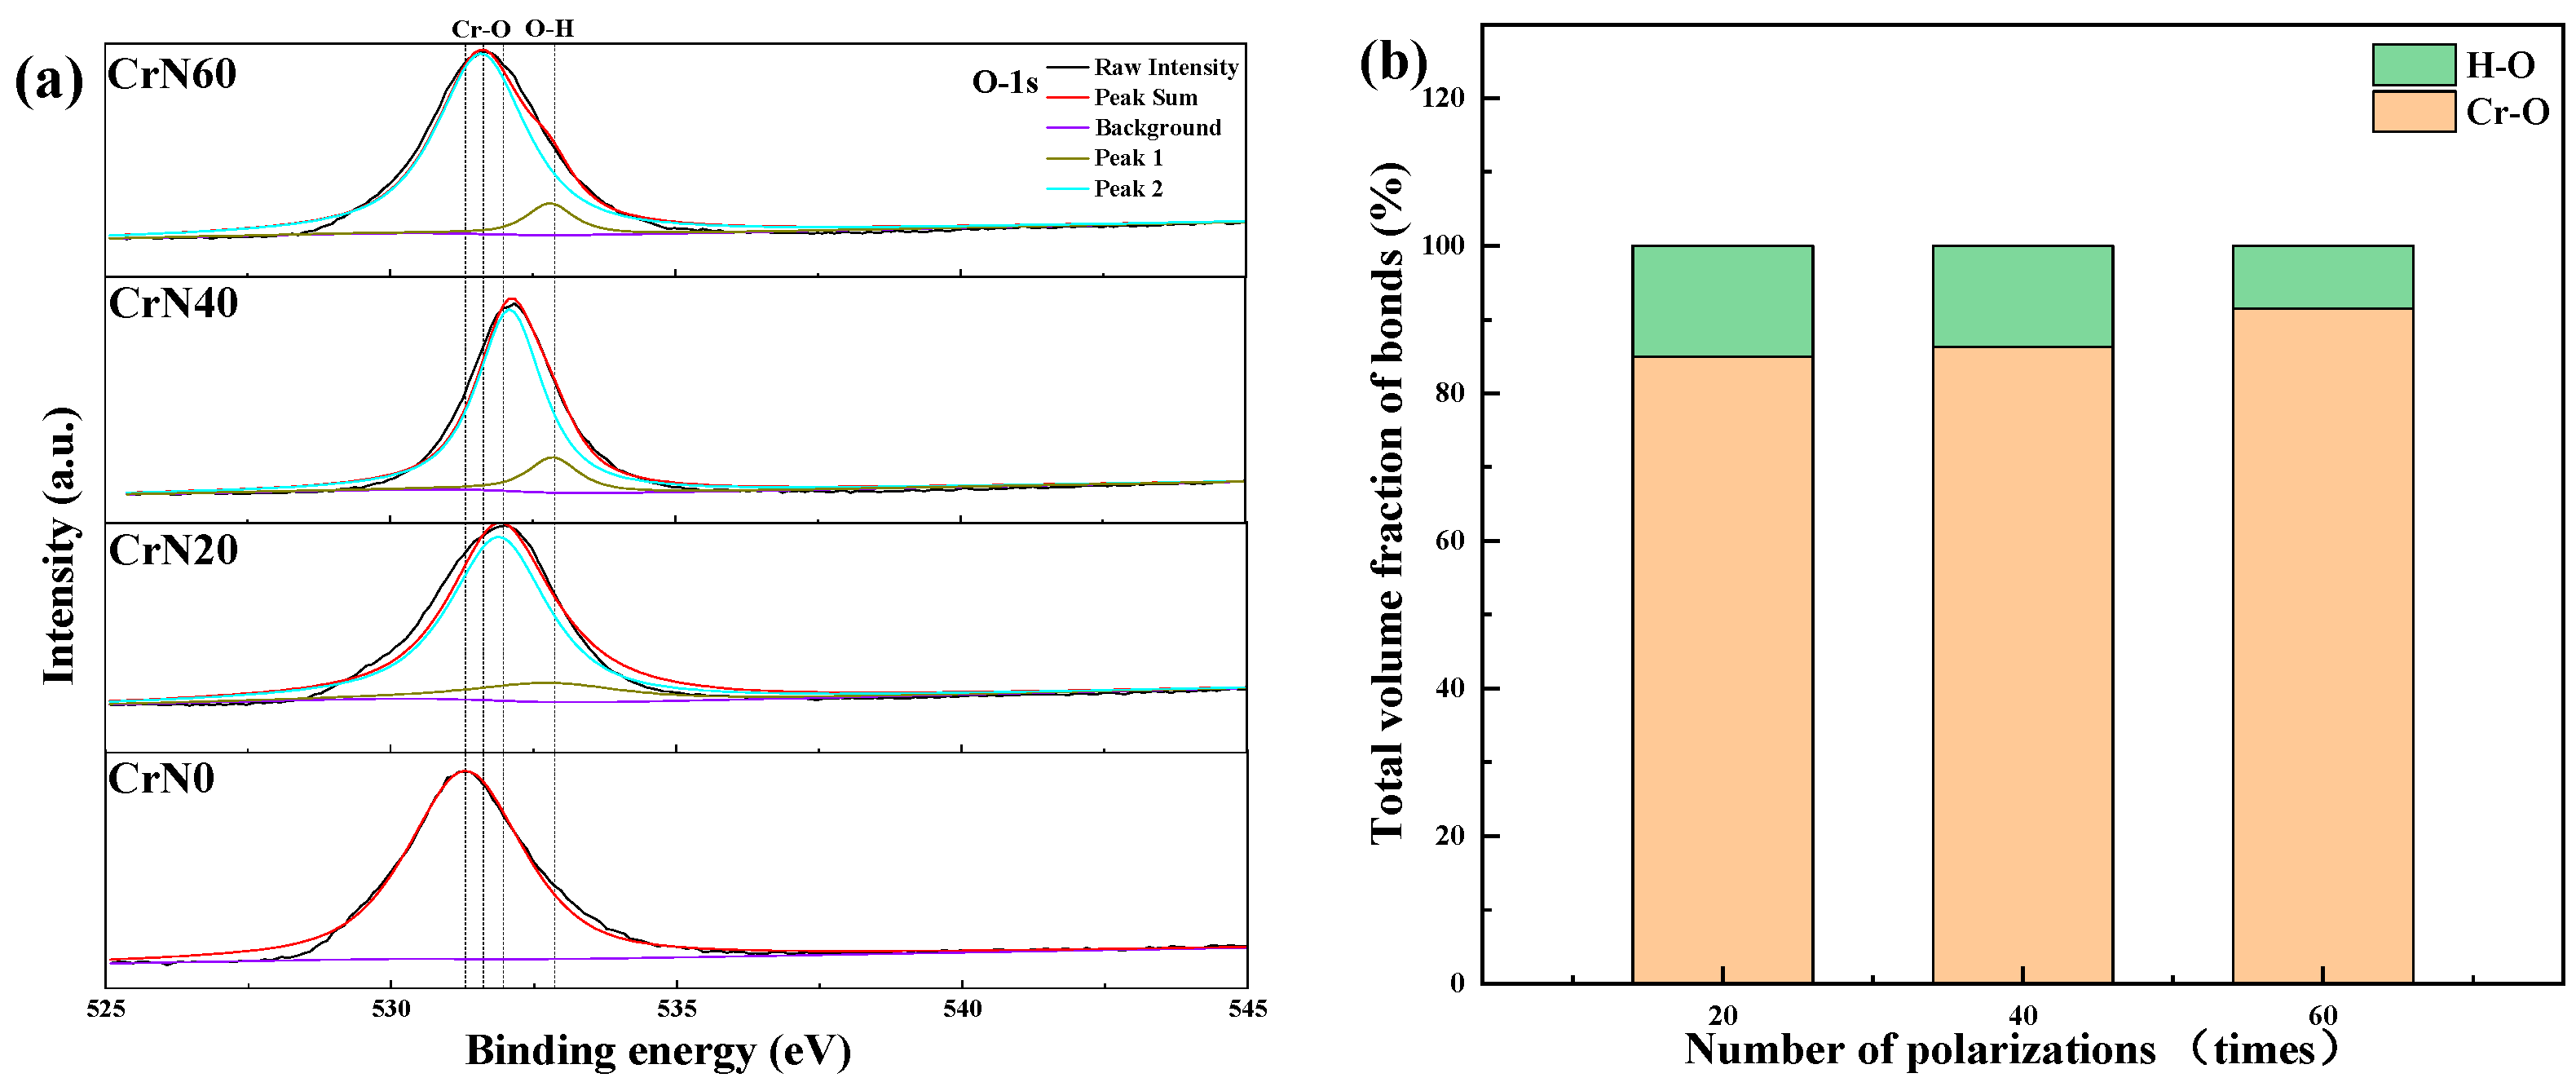
Since the crystal of oxides was not observed in SAED, the type of chemical bonding of the CrN coating was analyzed by XPS in order to further determine the kinds of oxides. The XPS results for CrN, CrN20, CrN40, and CrN60 coatings are shown in Figure 11a. It can be observed that the O 1s core-level spectrum of the CrN0 coating exhibits a convoluted peak corresponding to the Cr-O bond located at 531.3 eV. In contrast, the O 1s core-level spectra of CrN20, CrN40, and CrN60 coatings exhibit a convoluted peak corresponding to the Cr-O bond located at the range of 531.5–531.9 eV. This peak has been identified as being associated with the chromium oxide compound, as indicated by the X-ray Photoelectron Spectroscopy Database [29]. Moreover, there is a second peak corresponding to the H-O bond located at the range of 532.8–532.9 eV. According to the individual area of each bond, the volume percentages of Cr-O bonds are shown in Figure 11b. The percentage of Cr-O bonds in the CrN coatings increases from 85.0% to 91.5% as the cycle number increases from 20 to 60 times. It is indicated that the more chromium oxides are generated on the CrN coating surface with an increasing cycle number.
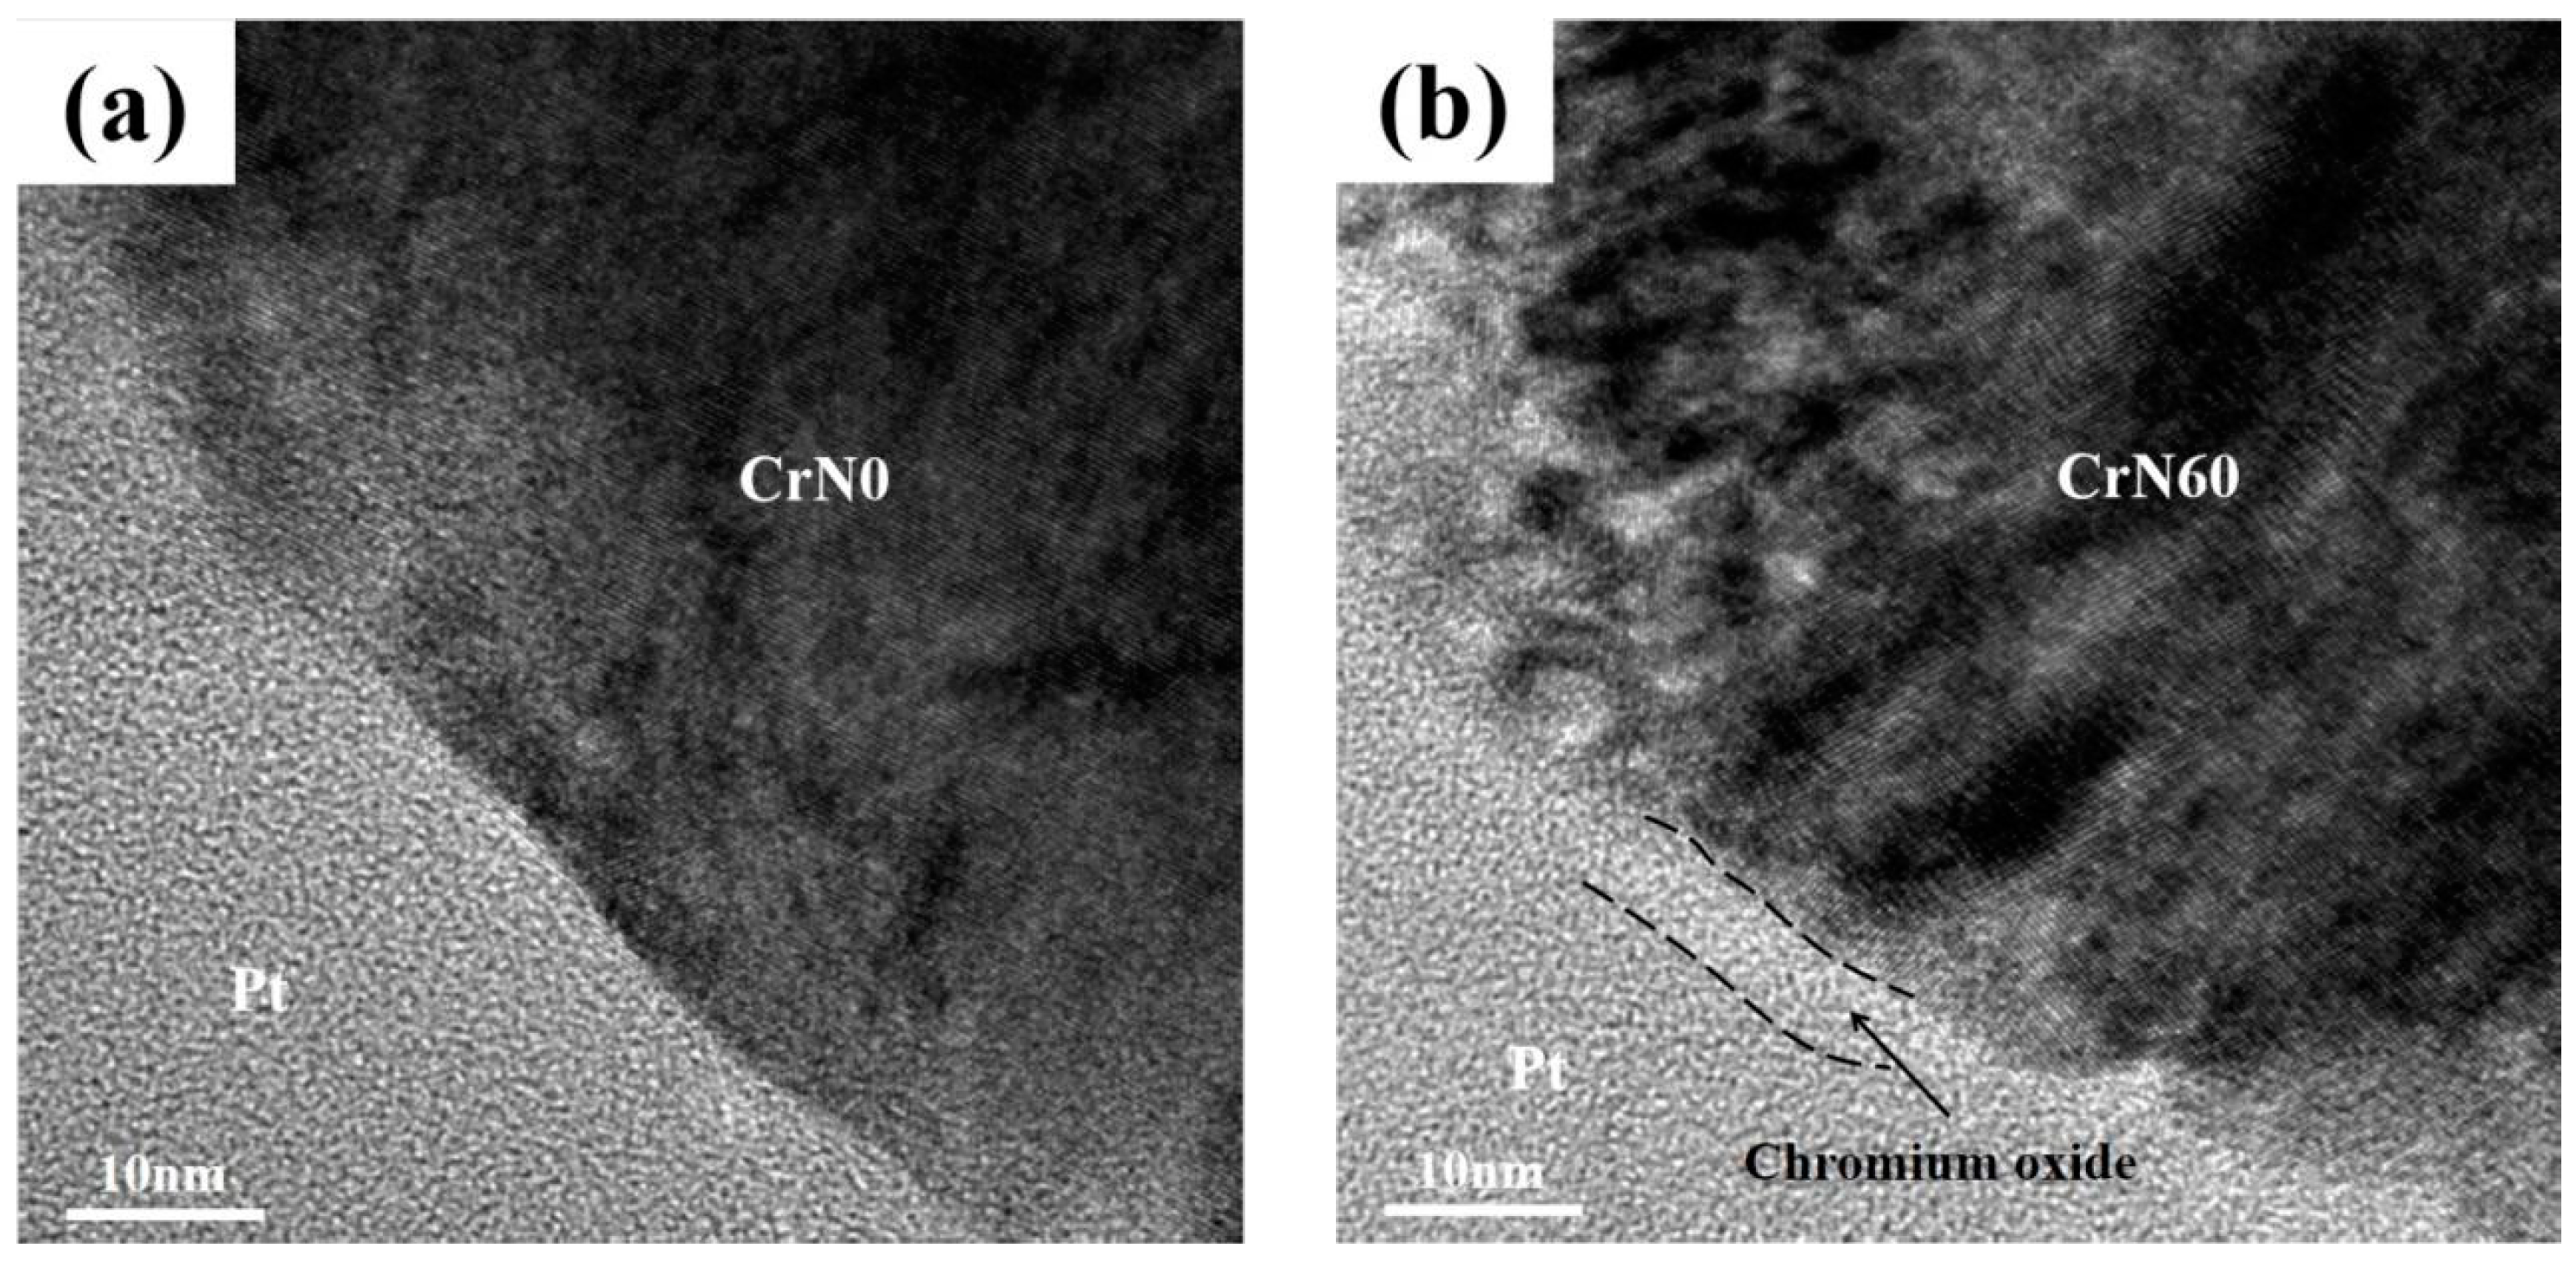
Figure 12 shows cross-sectional HRTEM photographs of the CrN0 and CrN60 coatings. In Figure 12a, the boundary between Pt and CrN0 coatings is clear. In contrast, a brighter layer, probably a layer of chromium-containing oxide, is observed on the surface of the CrN60 coating shown in Figure 12b. However, the crystalline surface of chromium oxide was not observed in SAED, which may be due to the amorphous structure. The thickness of the oxide layer on the surface of the coating in transmission electron microscopy can be roughly calculated by electrochemical simulations. At a cycle number of 60 times, the simulation outcomes are illustrated in Figure 4b, and the oxide layer thickness on the coating surface was approximately 8.6 nm, which is similar to the thickness of oxides observed in Figure 12b. The thickness of the CrN60 oxide layer was higher than that generated in the previous study [20] with an overpotential of 190 mV (5.6 nm). Therefore, a thicker oxide layer can be generated by increasing the number of polarizations to achieve a better sealing effect.
As stated above, the surface roughness Ra keeps decreasing with the cycle number increasing. It could be attributed to the improved porosity by defects sealing. In order to verify this deduction, the porosity of the CrN coating surface was calculated using ImageJ2 software. Figure 13a–c shows the calculation process of porosity. After importing the scanning electron microscope photos into the software and using the image recognition and machine learning functions of the software, the pores of the coatings were automatically identified and marked with different colors. In order to minimize the calculation error affected by the quality of the second electron image, four images at different positions of each coating were chosen to calculate the porosity, and averaged them. As shown in Figure 13d, the porosity of the CrN0 coating is 16.79%. After EP treatment, the porosities of CrN coatings become lower. This demonstrates that the generated oxides could seal the coating defect and therefore lower the surface roughness of CrN coatings after EP treatment. In addition, the sealing effect is more significant with the increase in the cycle number. The porosity keeps decreasing and presents a decreasing trend from 14.75% to 5.85% as the cycle number increases. More oxides are generated at 60 times of EP treatment, leading to the minimum surface roughness Ra of 50 nm as a result.

4.2. Mechanical Properties

By combining the variation trend of hardness in Figure 8e with the variation trend of porosity in Figure 13d, it is believed that the increase in hardness of the CrN coatings after EP treatment is due to the densification of the coating by defects sealing [17,31,32]. When the coatings defects are sealed by the generated oxides, the compactness of coatings is improved. As a consequence, the deformation ability is enhanced so as to obtain the high hardness of 11.03–11.86 GPa compared to 10.03 GPa for CrN0 coating. It is worth noting that after 60 cycles of EP treatment, CrN60 coating presents a slightly lower hardness of 11.70 GPa compared to 11.86 GPa for CrN50 coating. It has been reported that the excess chromium oxide could soften the coatings [32]. For this reason, the more generation of chromium oxide after a cycle number of 60 times contributes to this slight decrease in hardness.
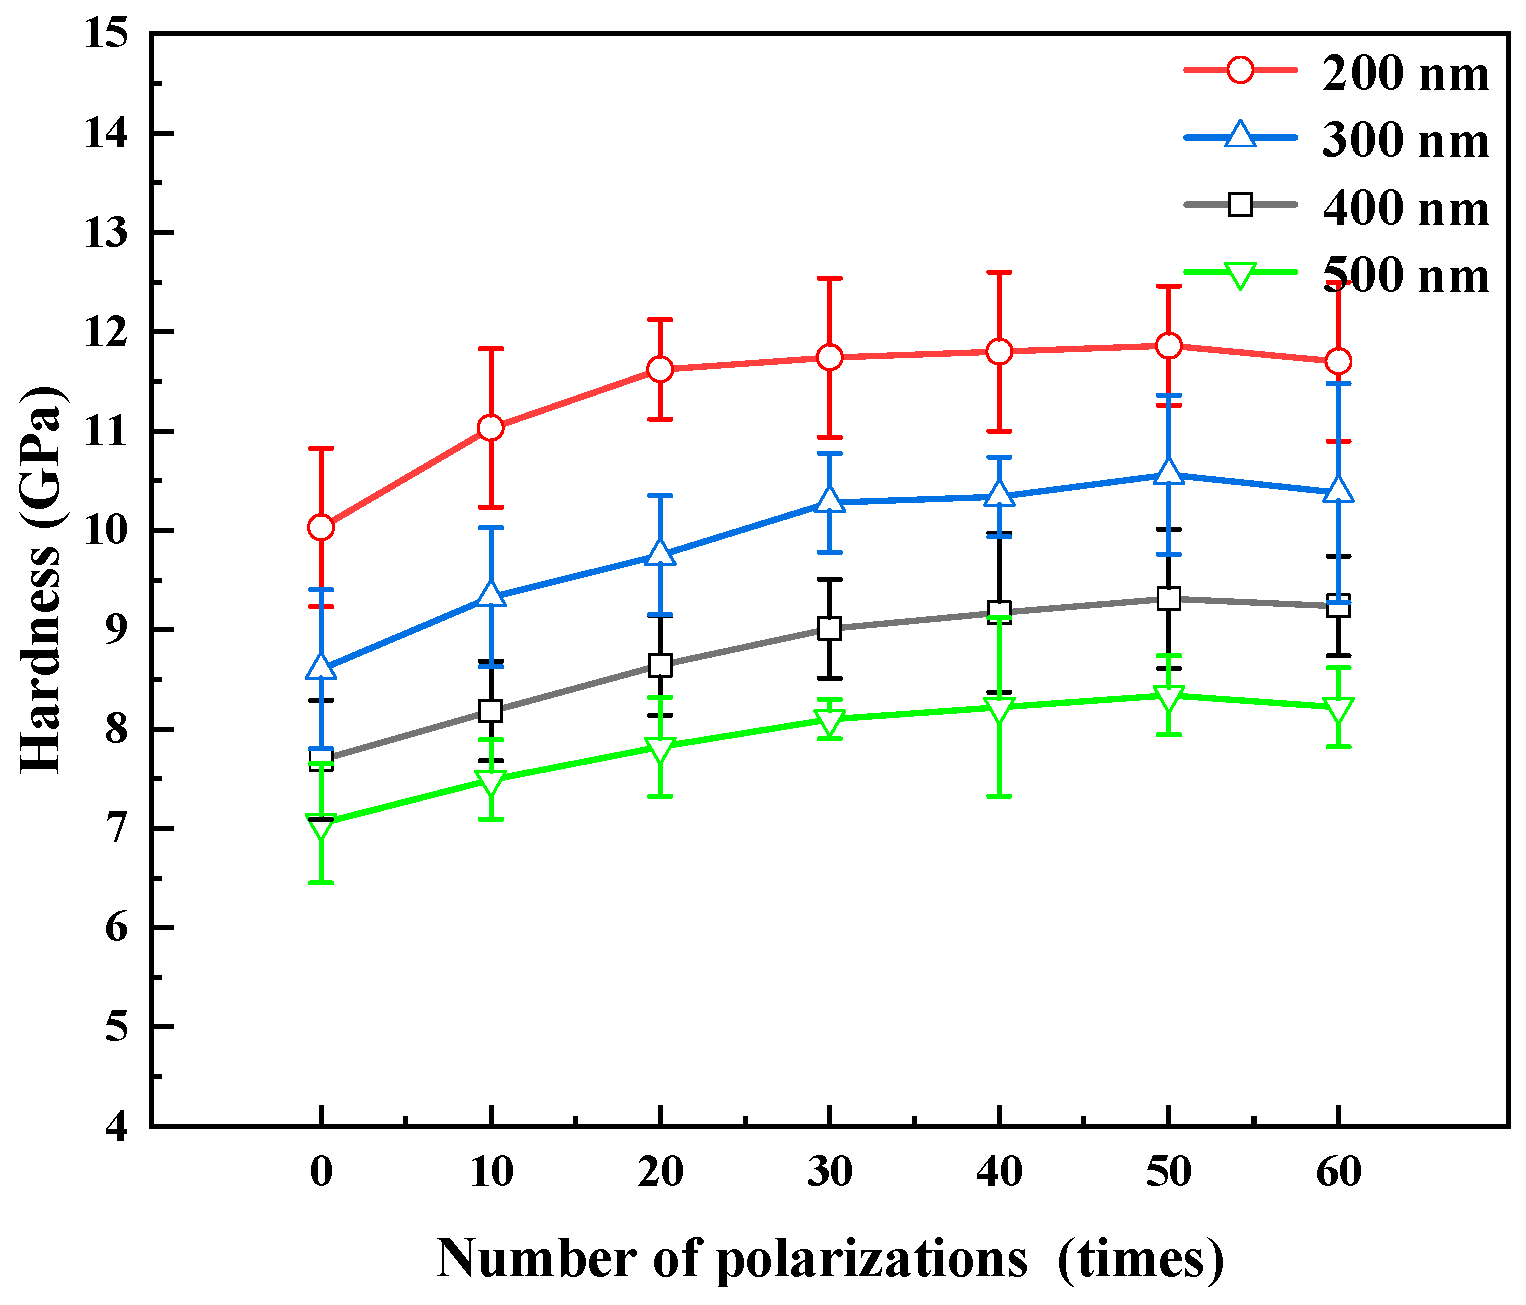
According to the TEM image in Figure 12 and the calculated thickness of oxides by COMSOL simulation in Figure 4b, the generated oxides only seal the defects near the surface rather than the whole coating. To verify this claim and determine the sealing depth, the hardness of the CrN coating was further measured at different loading depths, as shown in Figure 14.
As stated in Section 2.3, the measured result of coating hardness is more significantly affected by the substrate as the loading depth exceeds 15% of the coating thickness. Since the thickness of the CrN coating in this study is about 1.5 µm, the loading depth in the range of 300 nm to 500 nm exceeds 15% of the coating thickness. Therefore, with the increase in loading depth, the hardness of CrN coatings keeps decreasing as the contribution of TC4 (5.43 GPa) to the hardness results becomes significant. It is worth noting that at each loading depth, the hardness of CrN coatings after EP treatment is always higher than that of CrN0 coating. In general, the hardness of CrN coatings rises gradually to the maximum value at 50 times of EP treatment and then slightly decreases at 60 times of EP treatment. However, the increasing rate of hardness at different loading depths is different. As shown in Table 2, the increasing rate is in the range of 10.0% to 18.3% at the loading depth of 200 nm. When the loading depth is 300 nm, the increasing rate is in the range of 8.4% to 22.7%. When the loading depth is 400 nm and 500 nm, the increasing rates are in the range of 6.3% to 21.0% and 6.3% to 18.4%, respectively. This indicates that the generated oxides only seal the defects near the coating surface, but this sealing effect could affect the hardness results at deep loading depth.
More importantly, when the loading depth exceeds 200 nm, the difference in hardness increasing rate is from 0.6% to 2.5% among CrN30 and CrN60 coating, but the difference in hardness increasing rate is from 4.0% to 6.2% between CrN20 and CrN30 coating, as listed in Table 3. If the sealing depth is proportional to the number of cycles, the rates of increase in hardness at 300–500 nm for CrN30 to CrN40, CrN40 to CrN50, and CrN50 to CrN60 might be similar to the rates of increase in hardness between CrN20 to CrN30 coating. However, it is a fact that the difference in their hardness growth rates is only 2.5% at the maximum (much lower than the 4.0–6.2% for CrN20 to CrN30). Therefore, this indicates that even if the number of polarizations is increased to 60, the sealing depth is still only 300 nm.

4.3. Tribological Properties

According to the studies [33,34], the coating with high hardness are less prone to deformation during friction and have a smaller contact area, which contributes to their low friction coefficient. Thus, owing to higher hardness, the CrN10 coating presents the lower friction coefficient of 0.104 than 0.139 of the CrN0 coating. However, even with higher hardness, the friction coefficients of the CrN20–CrN60 coating increase to the range of 0.147 to 0.168, which are higher than that of CrN0 coating. Based on the polarizability approach reported in literature [35], chromium oxides would present a friction coefficient of 0.4. Thus, the increment in friction coefficient is attributed to the more generation of chromium oxides on the coating surface with increasing cycle number. The increase in the oxygen content on the CrN coating surface in Table 1 certainly proves this. It is worth noting that the oxygen content of CrN0 coating increases slightly from 6.32 at% to 7.00 at% of CrN10 coating. The increment of hardness rather than chromium oxides dominates the friction coefficient. In contrast, the oxygen content increases quickly to the range of 11.43 to 12.64 at% for CrN20–CrN60 coating. The effect of more generation of chromium oxides is stronger than the effect of hardness increment, thus leading to a high friction coefficient.
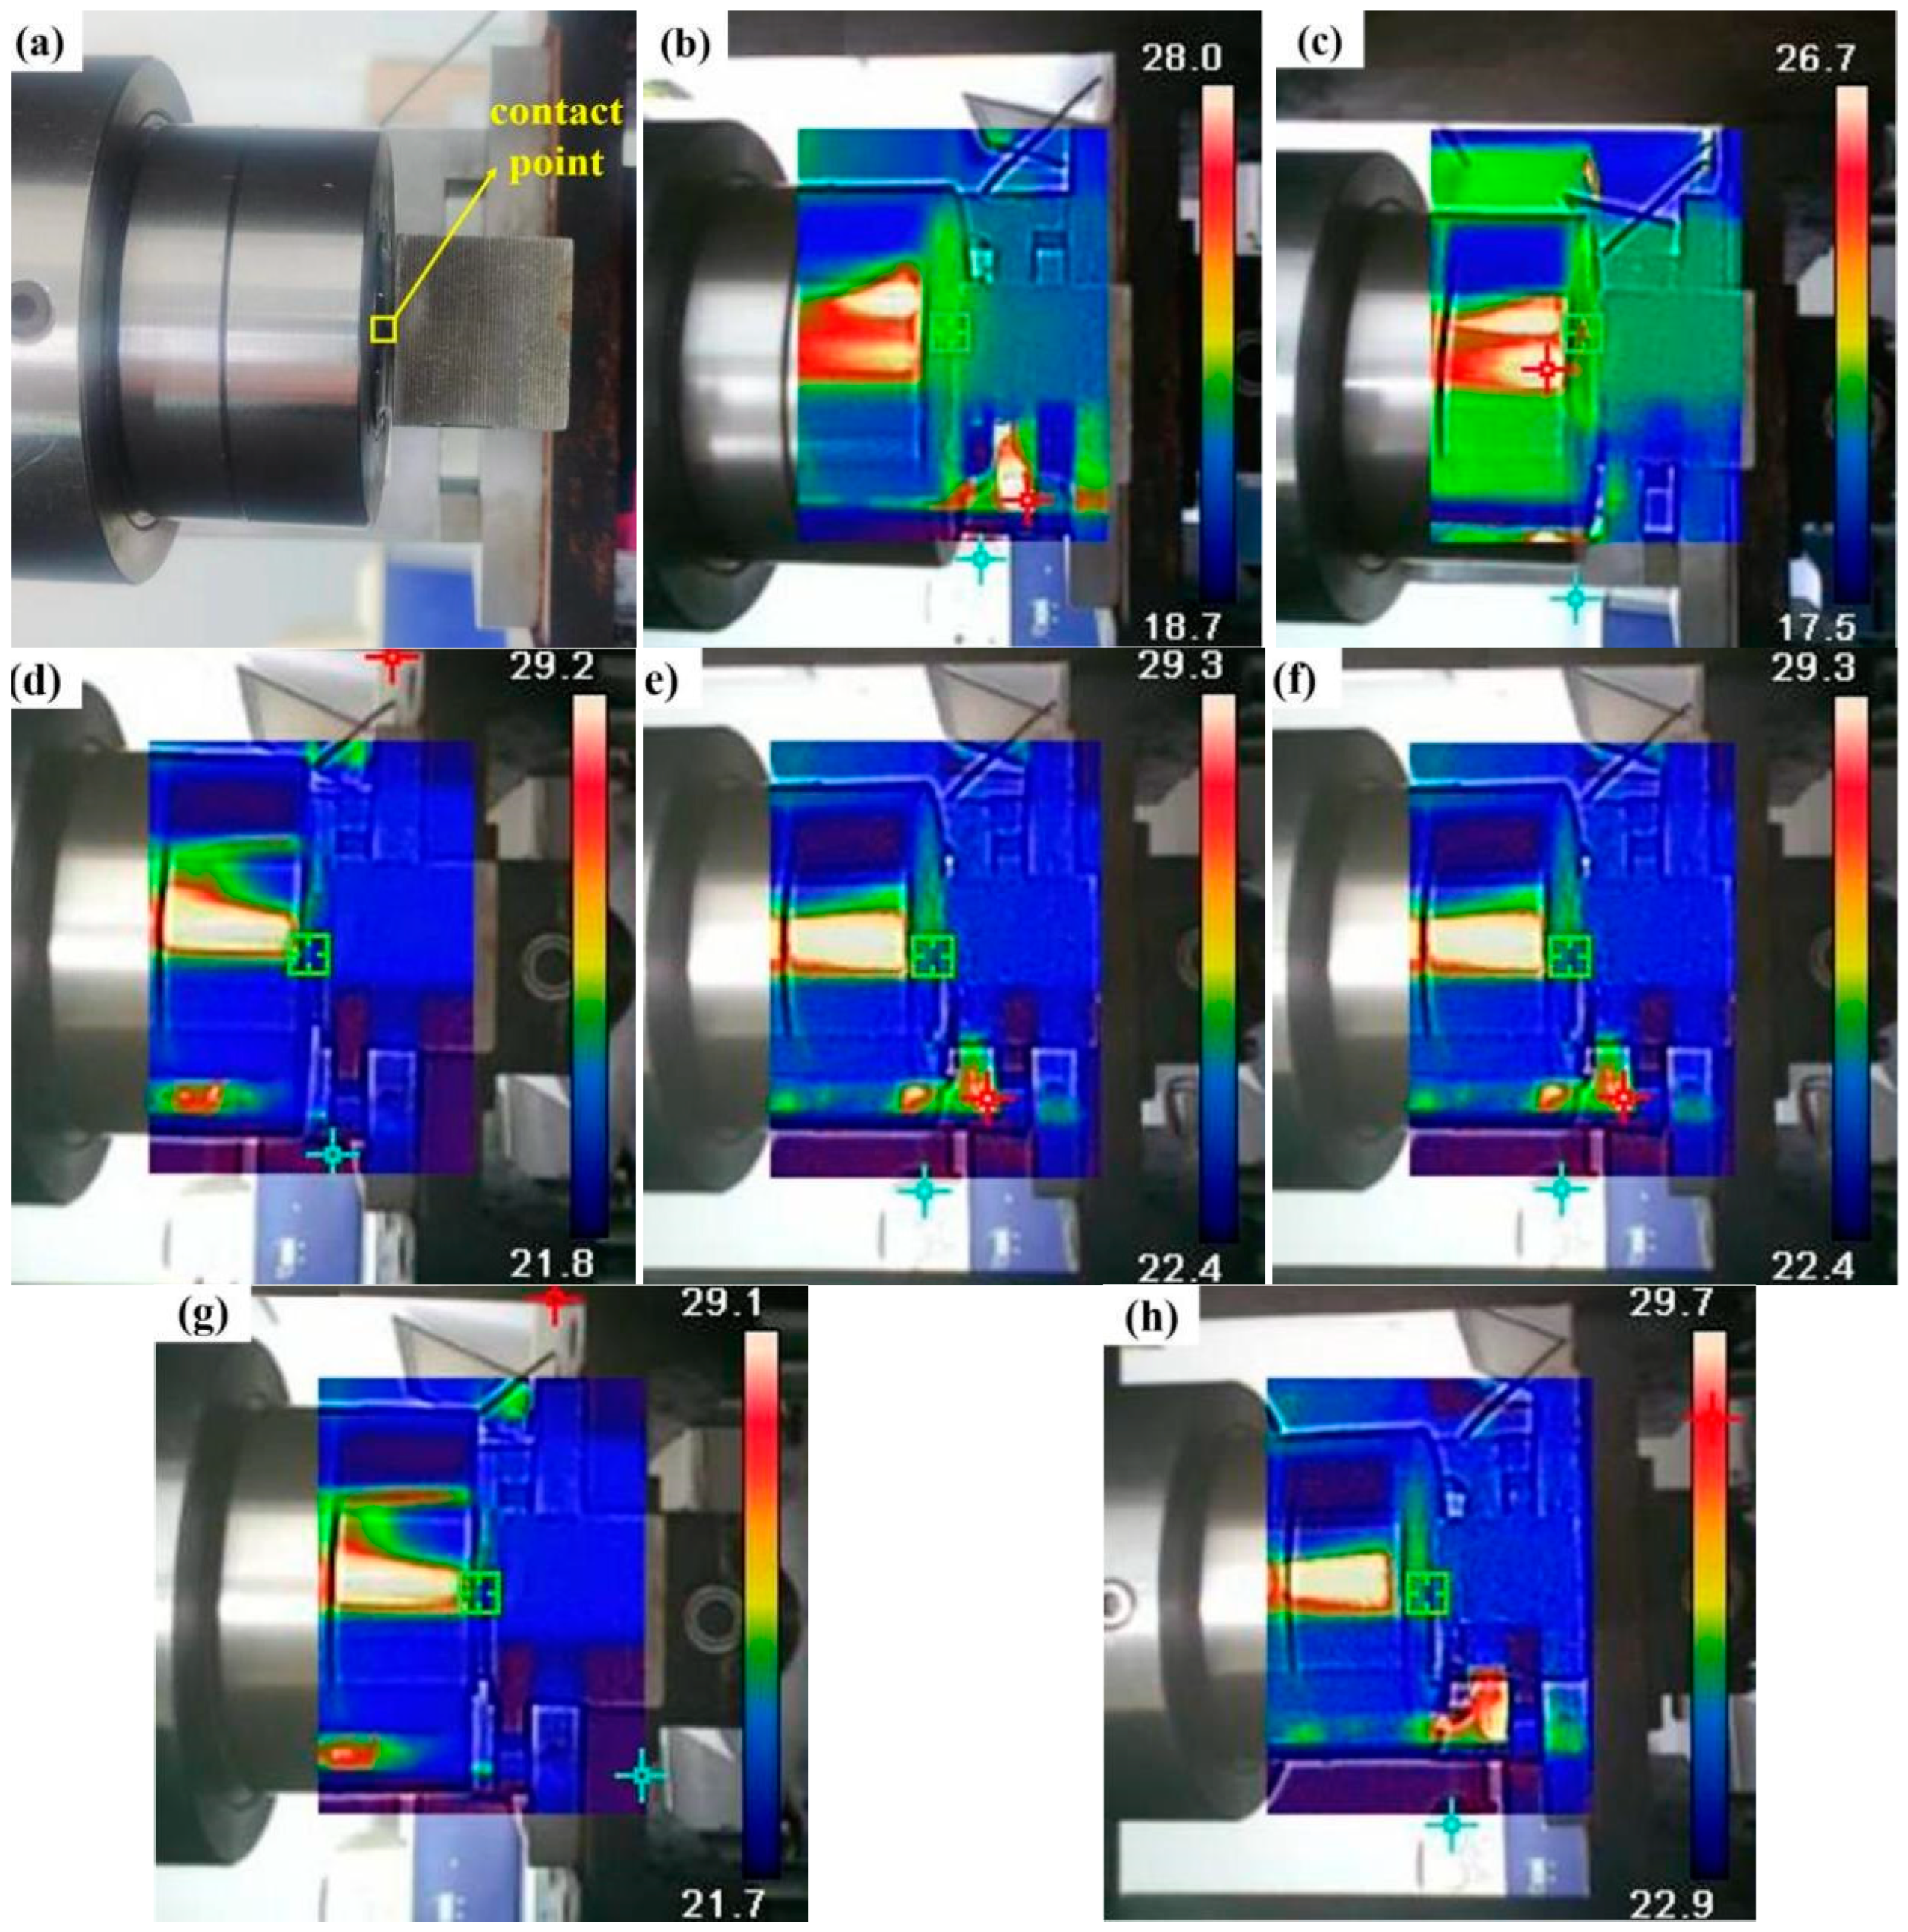
In general, a high friction coefficient would result in a large friction force. This increase in friction force would generate more frictional heat, which led to an increase in the temperature at the friction interface. The infrared temperatures of the CrN/SiC tribopairs at the sliding distance of 500 m were measured and are shown in Figure 15.
By extracting the temperature data, the temperature and the mean steady-state friction coefficient follow the same variation trend as shown in Figure 9b. To be specific, the temperatures of CrN0 and CrN10 coating are 20.1 and 20.8 °C, while those of CrN20-CrN50 coating increase to the range of 23.7–25.0 °C. More frictional heat caused the oxidation reaction of CrN coating to be more intense, and more chromium oxides would be produced. The oxygen contents of the wear tracks of CrN coating are listed in Table 3. The oxygen content of CrN10 coating is 13.1 at%, but the oxygen content of CrN20-CrN50 coating increases to the range of 15.4 at% to 24.9 at% with the increasing cycle number. Therefore, the CrN coating treated with more times of EP generate more chromium oxides, which act as abrasive particles in the friction process, leading to a high friction coefficient [36].
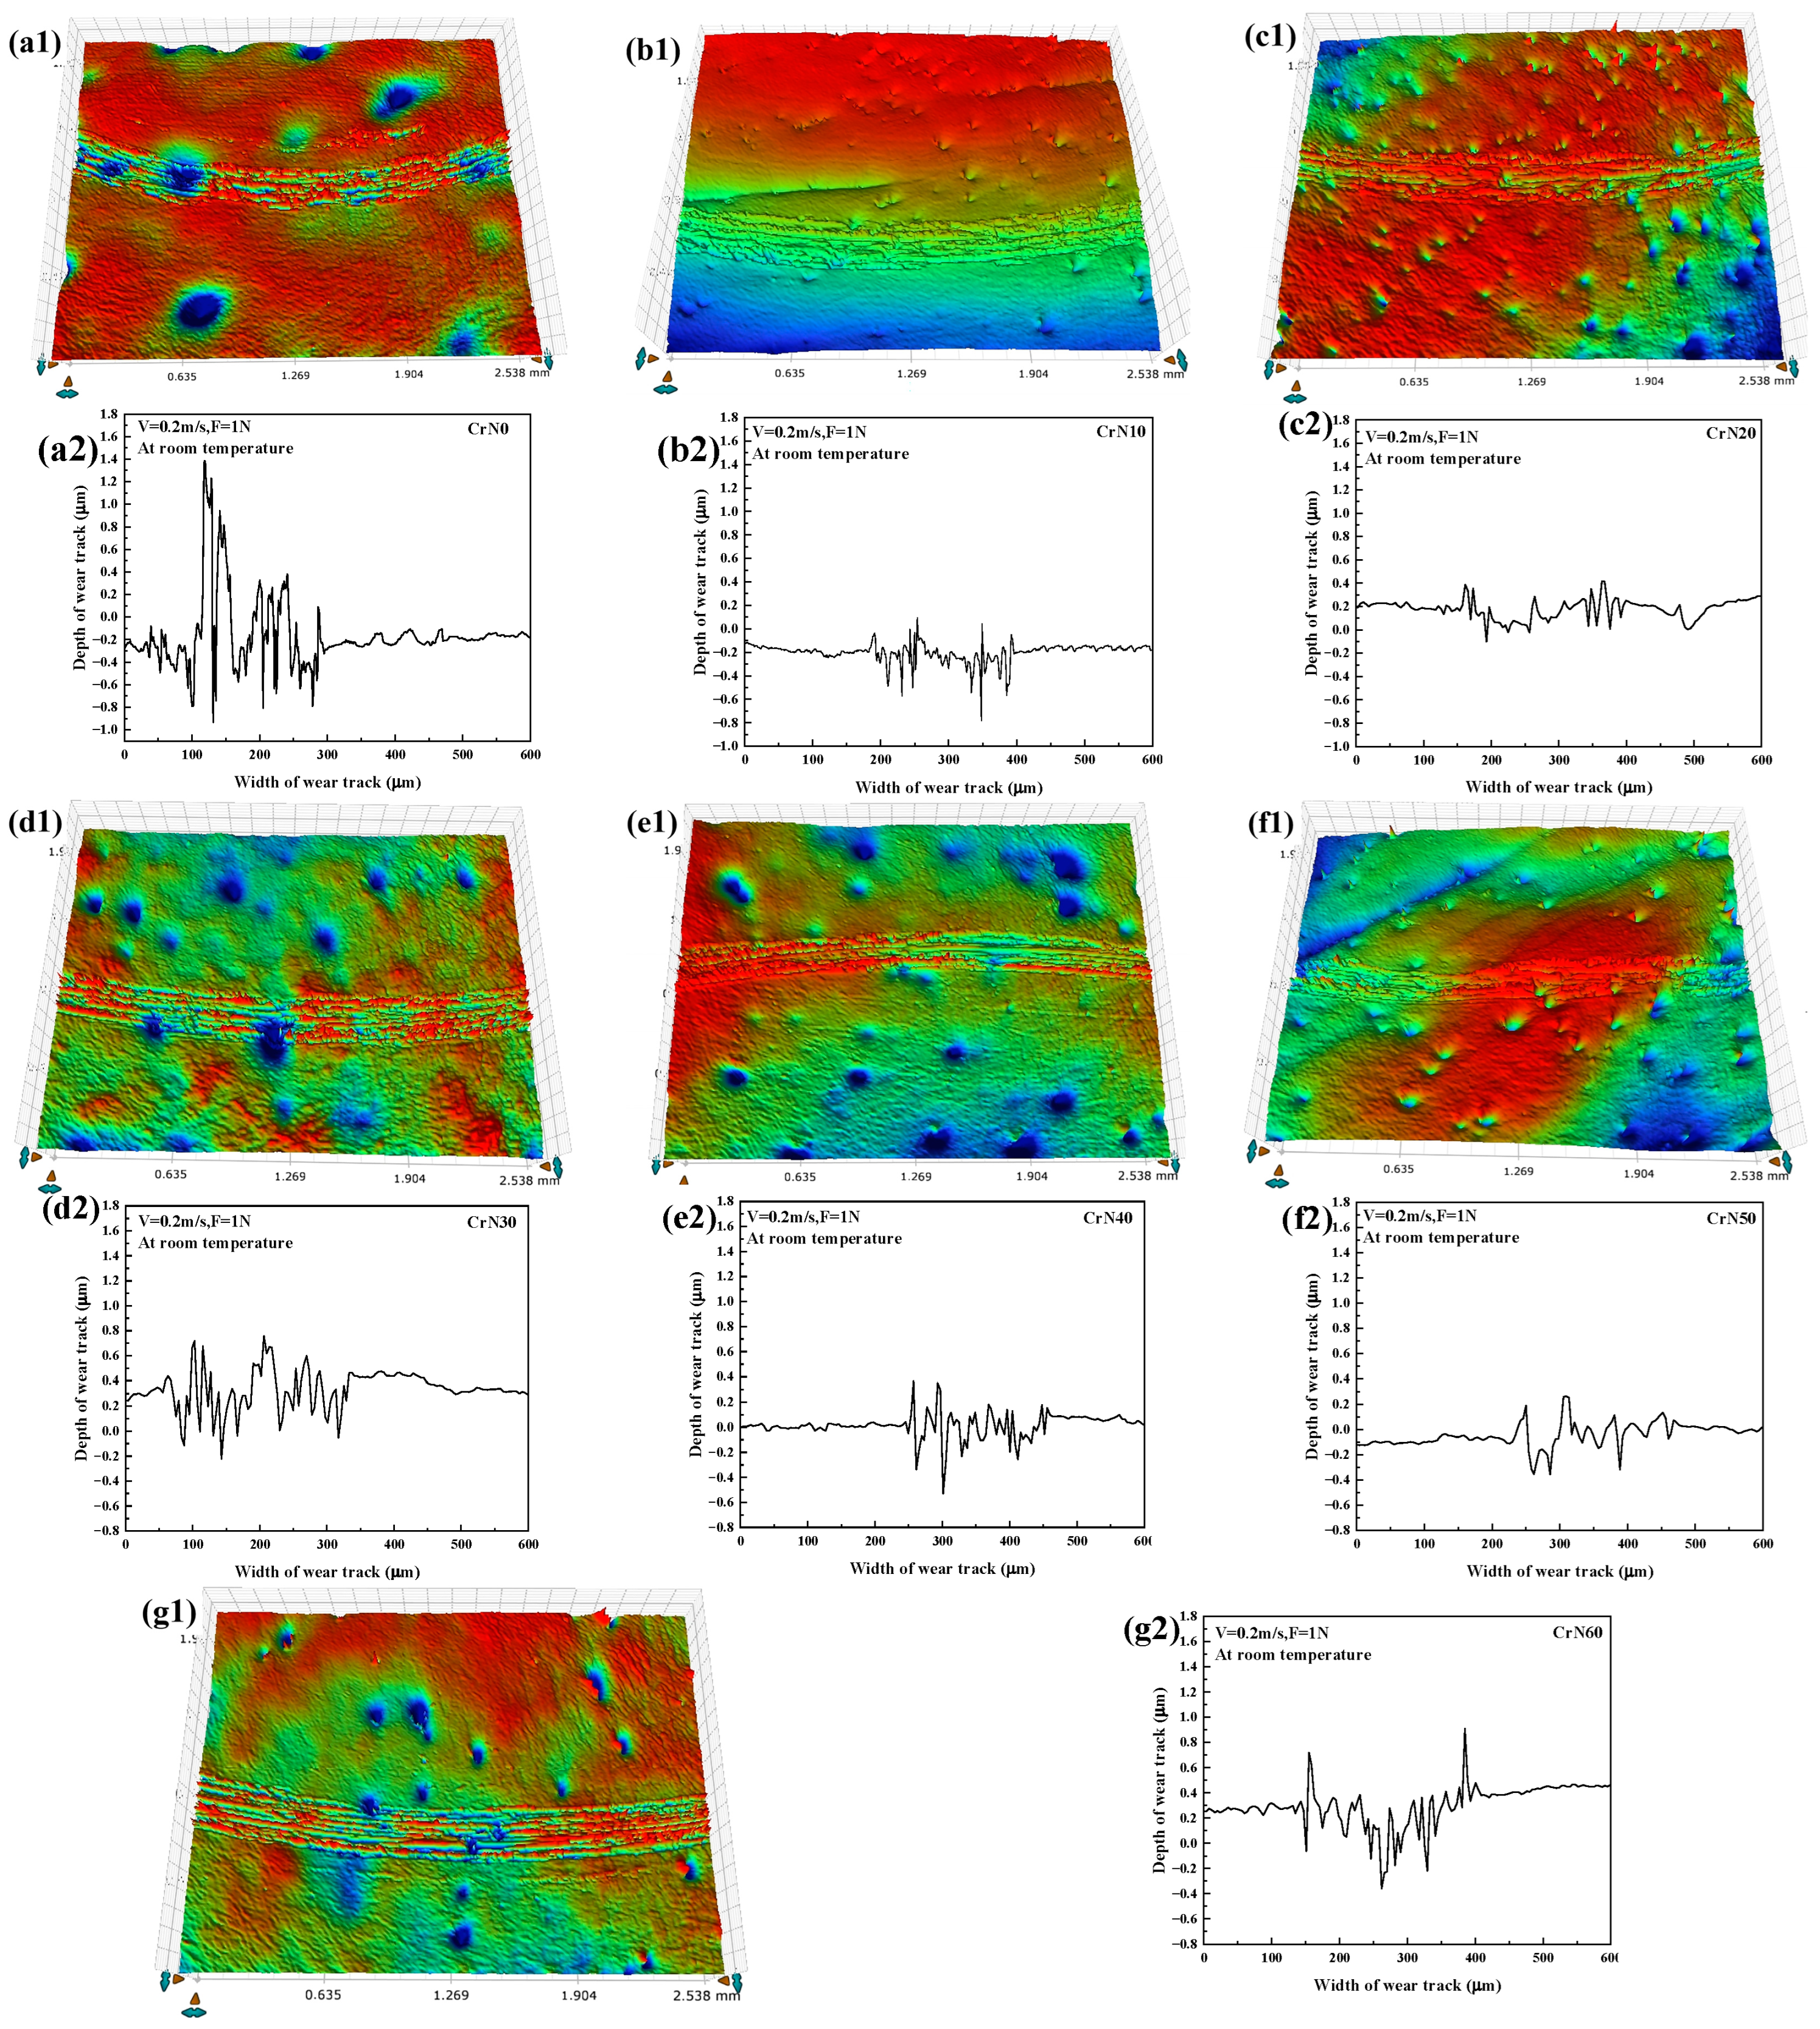
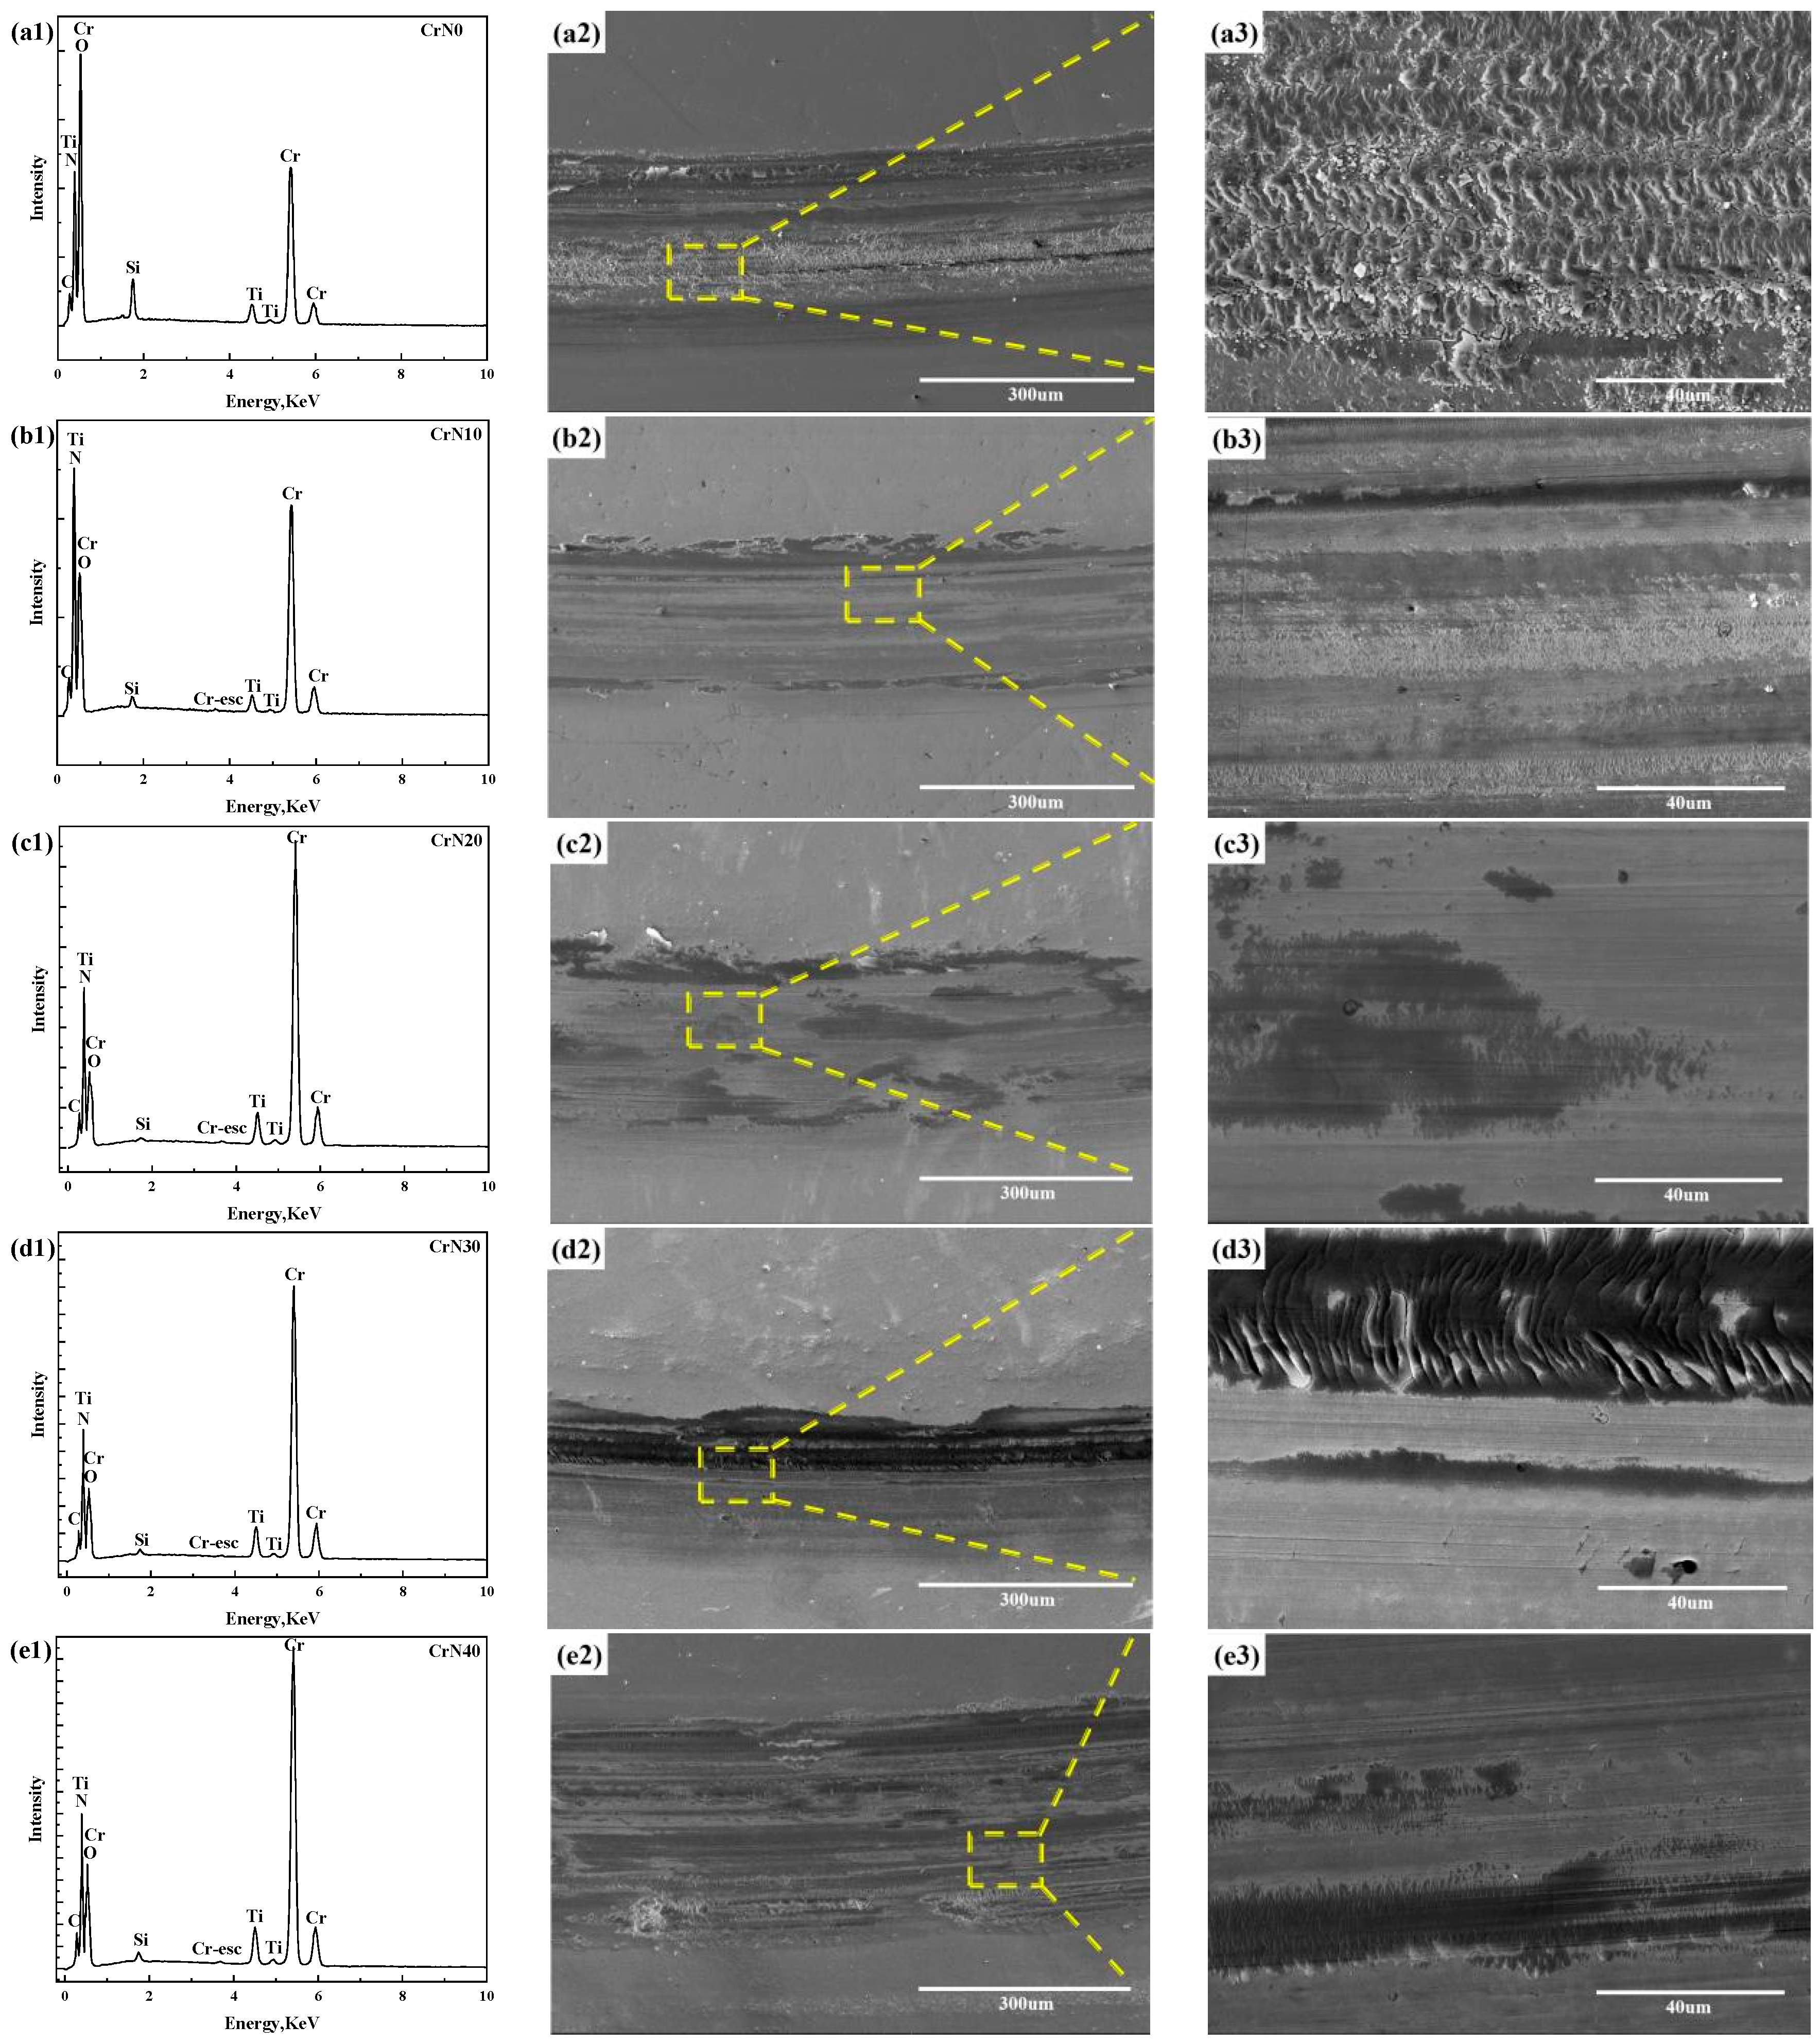
After the wear test, the 3D morphologies and the corresponding contours of wear tracks are shown in Figure 16. The width of wear tracks on all CrN coating is around 200 μm, but the depth of wear tracks on CrN20 coating is the shallowest. Based on the void area A extracted from the contours of wear tracks, the wear rates of the coating were calculated according to Equation (2). Regarding wear resistance, the Archard wear model has mentioned that the wear resistance of material is directly proportional to its hardness. In this study, the CrN50 coating has the highest hardness, and therefore it should present the lowest wear rate. However, the wear mechanism of CrN coating is not only abrasive wear but also oxidation wear. Thus, the wear rate is not determined by hardness alone. Adhesive wear can be seen in Figure 17(b2–c2), but adhesive wear is accompanied by oxidative wear and is not considered its main wear mechanism. Therefore, adhesive wear is not specifically mentioned in the wear mechanism. As can be seen in Table 3, the oxygen contents on the wear tracks of the CrN coating are in the range of 13.1–36.7 at%, which are higher than those of the CrN coating (6.32–12.64 at%). This represents the occurrence of the oxidization process during the friction experiment [37,38]. Therefore, a mixture of abrasive and oxidation wear is the wear mechanism of CrN coating.
Regarding the CrN10 coating, the increasing hardness contributed to a low friction coefficient of 0.103, which resulted in a small friction force. Meanwhile, the small friction force would generate a small amount of frictional heat, which slowed down the oxidation process of Cr2N. As listed in Table 3, the lowest oxygen content (13.1 at%) of CrN10 means fewer chromium oxides. For these above two reasons, the wear tracks of CrN10 are smooth as shown in Figure 17(b2–b3). This implies that the wear mechanism of the CrN10 coating is probably dominant abrasive wear and weak oxidative wear. However, the friction coefficients of the CrN40, CrN50, and CrN60 coating increased to the range of 0.149 to 0.167. The increase in friction coefficients led to a larger friction force, which ultimately led to more intense wear and more wear debris. In the meantime, a large amount of frictional heat is generated when the coating has a large friction force, which makes the temperature of the friction interface higher, as shown in Figure 9b. This would accelerate the oxidation process of Cr2N to generate more chromium oxides during the friction process, and therefore the high oxygen contents (21.1–24.9 at%) of the wear tracks listed in Table 3 were detected. Because of this, the wear tracks on CrN40, CrN50, and CrN60 coating are rougher, and the furrows on them are more pronounced, as shown in Figure 17(e2,e3), Figure 17(f2,f3), and Figure 17(g2,g3). This implies that the wear mechanism for CrN40, CrN50, and CrN60 coating is believed to be abrasive wear and intense oxidative wear.
According to the friction coefficient shown in Figure 9b and the oxygen content listed in Table 3, the CrN20 coating confronts more oxidative wear than that of the CrN10 coating. Namely, the wear rate of CrN20 coating should be higher than that of CrN10 coating. Nevertheless, it can be seen from Figure 10 that the wear rate of CrN20 coating is lower than that of CrN10 coating. On one hand, the hardness of the CrN20 coating had increased substantially when the cycle number increased from 10 times to 20 times. On the other hand, the increase in cycle number also led to a rise in the immersion time of coating in water, which in turn increased the sealing depth of the coating. The CrN20 coating still had high hardness and low porosity at deeper depths, which contributed to the fact that the wear tracks of the CrN20 coating were even shallower than those of the CrN10 coating, as could be seen in Figure 16(b2,c2). According to the oxygen content listed in Table 3, it is indicated that the oxidized wear of CrN20 was not as drastic compared to CrN30-CrN60 coating. The above combined effects gave CrN20 coating the best wear resistance performance. In summary, the hardness of the CrN coating reaches its maximum at 50 times with increasing number of cycles of EP treatment, while the tribological properties of the CrN coating are best at 20 times. The optimum number of cycles for coating hardness and abrasion resistance is different. However, for practical applications, the tribological properties of CrN coating are more critical, so 20 times of EP treatment at the overpotential of 70 mV is more appropriate.

5. Conclusions

In order to further improve the sealing effect of EP treatment and determine the optimal cycle number, the effect of cycle number of EP treatment on the improvement of mechanical and tribological properties of CrN coating was investigated. The main conclusions were as follows:
1. After EP treatment, the porosity of the CrN coating decreased continuously from 16.79% to 5.85% with the increase in cycle number from 10 times to 60 times.
2. Due to the decrease in porosity, the hardness of the CrN coating increased and reached a maximum value of 11.86 ± 0.6 GPa with an increasing rate of 18.3% at 50 times the cycle number.
3. As cycle number increased, the wear rate of the CrN coating decreased first and then increased. The CrN20 coating presented the minimum wear rate of 4.766 × 10⁻⁷ mm3/Nm due to the combination of high hardness and improved sealing depth.
4. Owing to more oxidation wear by more friction heat, even with a high hardness, the CrN30, CrN40, CrN50, and CrN60 coating yet showed an increasing wear rate with cycle number.

Author Contributions

Conceptualization, Q.W.; methodology, Q.W. and X.W.; software, F.Z., J.K. and Z.Z.; validation, Q.W. and X.W.; formal analysis, Q.W. and X.W.; investigation, Q.W. and X.W.; resources, Q.W., F.Z., J.K. and Z.Z.; data curation, X.W.; writing—original draft preparation, X.W.; writing—review and editing, Q.W., F.Z., J.K. and Z.Z.; visualization, Q.W. and X.W.; supervision, Q.W., F.Z., J.K. and Z.Z.; project administration, Q.W.; funding acquisition, X.W. All authors have read and agreed to the published version of the manuscript.

Funding

This research was funded by the Postgraduate Research and Practice Innovation Program of Jiangsu Province, Grant No. SJCX23_0104.

Data Availability Statement

The data presented in this study are available on request from the corresponding author. The data are not publicly available due to privacy or ethical restrictions.

Conflicts of Interest

The authors declare no conflicts of interest.

References

  1. Zhao, F.; Hu, H.; Yu, J.; Lai, J.; He, H.; Zhang, Y.; Qi, H.; Wang, D. Mechanical and Tribological Properties of Ni-B and Ni-B-W Coatings Prepared by Electroless Plating. Lubricants 2023, 11, 42. [Google Scholar] [CrossRef]
  2. Muntean, R.; Li, J.L.; Vălean, P.C.; Kazamer, N.; Uțu, I.D.; Mărginean, G.; Șerban, V.A. Effect of Feedstock Powder Intrinsic Characteristics on the Tribological Behavior of Inductively Remelted NiCrBSi Flame-Sprayed Coatings. Lubricants 2023, 11, 363. [Google Scholar] [CrossRef]
  3. Renner, P.; Raut, A.; Hong, L. High-Performance Ni-SiC Coatings Fabricated by Flash Heating. Lubricants 2022, 10, 42. [Google Scholar] [CrossRef]
  4. Hao, L.; Chen, Y.; Li, G.; Zhang, M.; Wu, Y.; Liu, R.; Chen, G. Study on the Friction Characteristics and Fatigue Life of Manganese Phosphate Coating Bearings. Lubricants 2023, 11, 99. [Google Scholar] [CrossRef]
  5. Wang, Q.Z.; Zhou, F. Progress in Tribological Properties of Nano-Composite Hard Coatings under Water Lubrication. Lubricants 2017, 5, 5. [Google Scholar] [CrossRef]
  6. Zhang, D.Y.; He, G.Q.; Dong, G.N.; Zhang, H.; Meng, H. Wear Resistance of Blades in Planetary Concrete Mixers. Tribological Properties of Tin-based Babbitt Bearing Alloy with Polyurethane Coating under Dry and Starved Lubrication Conditions. Tribol. INT 2015, 90, 22–31. [Google Scholar] [CrossRef]
  7. Cassar, G.; Wilson, J.C.A.-B.; Banfield, S.; Housden, J.; Matthews, A.; Leyland, A. A Study of the Reciprocating-sliding Wear Performance of Plasma Surface Treated Titanium Alloy. Wear 2010, 269, 60–70. [Google Scholar] [CrossRef]
  8. Kang, S.; Ha, S.; Kim, K.; Lee, Y.; Jang, Y.-J.; Kim, J.; Lee, K.; Kim, H.J. Dry Wear Behavior of Identical Tetrahedral Amorphous Carbon Nanofilms on Sintered Composites and Metal Substrate with Varying Load Bearing Capacities. J. Mater. Res. Technol. 2023, 26, 6027–6040. [Google Scholar] [CrossRef]
  9. Zhang, C.X.; Xu, C.X.; Liu, Z.F.; Liu, M.M.; Zhu, H.Y.; Zhang, K.C. Formation of Robust Polydimethylsiloxane Coatings on the Flexspline Material and Mechanism of the Tribological Property Improvement. Langmuir 2022, 38, 10749–10759. [Google Scholar] [CrossRef]
  10. Deng, W.; Zhao, X.; An, Y.; Hao, E.; Li, S.; Zhou, H.; Chen, J. Improvement of Tribological Properties of As-sprayed 8YSZ Coatings by In-situ Synthesis C/MoS2 Composite Lubricant. Tribol. Int. 2018, 128, 260–270. [Google Scholar] [CrossRef]
  11. Tian, C.L.; Cai, H.C.; Xue, Y.J.; Pei, L.; Yu, Y.J. Effect of Argon Flow Rate on Tribological Properties of Rare Earth Ce Doped MoS2 Based Composite Coatings by Magnetron Sputtering. Lubricants 2023, 11, 432. [Google Scholar] [CrossRef]
  12. Yang, J.J.; Jia, J.H.; Li, X.; Cheng, L.; Feng, X.C. Synergistic Lubrication of Ag and Ag2MoO4 Nanoparticles Anchored in Plasma-sprayed YSZ Coatings: Remarkably-durable Lubricating Performance at 800 °C. Tribol. Int. 2021, 153, 106670. [Google Scholar] [CrossRef]
  13. Kong, J.-Z.; Xu, P.; Cao, Y.-Q.; Li, A.-D.; Wang, Q.-Z.; Zhou, F. Improved Corrosion Protection of CrN Hard Coating on Steel Sealed with TiOxNy-TiN Composite Layers. Surf. Coat. Technol. 2020, 381, 125108. [Google Scholar] [CrossRef]
  14. Feng, Y.; Liu, M.; Jia, L.; Bai, Y.; Ma, G.; Zhou, X.; Wang, H.; Wang, H. Study on the Corrosion Resistance of Supersonic Plasma Spraying Al2O3 Thin Layer and SiO2 Sealer Alternately Deposited Coating. Coatings 2024, 14, 78. [Google Scholar] [CrossRef]
  15. Zhang, Y.; Wang, Z.H.; Shi, Y.; Shao, Y.F.; Gu, C.Y. Combined Effect of Heat Treatment and Sealing on the Corrosion Resistance of Reactive Plasma Sprayed TiNx/TiOy Coatings. Ceram. Int. 2019, 45, 24545–24553. [Google Scholar] [CrossRef]
  16. Govande, A.R.; Sunil, B.R.; Dumpala, R. Wear and Corrosion Behaviour of the Cryogenically Treated Tungsten Carbide Coatings. Surf. Eng. 2023, 39, 326–338. [Google Scholar] [CrossRef]
  17. Daubert, J.S.; Wang, R.; Ovental, J.; Barton, H.F.; Rajagopalan, R.; Augustyn, V.; Parsons, G.N. Intrinsic Limitations of Atomic Layer Deposition for Pseudocapacitive Metal Oxides in Porous Electrochemical Capacitor Electrodes. J. Mater. Chem. 2017, 25, 13086–13097. [Google Scholar] [CrossRef]
  18. Wang, K.L.; Zhang, W.; Wei, Z.Y.; Ying, G.B.; Sheng, H. Enhanced Corrosion Resistance of Subsonic Plasma Sprayed Nanostructured Al2O3-13TiO2 Coating by Ultrasound-assisted Sealing. Ceram. Int. 2023, 49, 13852–13859. [Google Scholar] [CrossRef]
  19. Wang, G.Y.; Zhou, Z.H.; Zhang, X.; Zhang, K.C.; Wu, L.T.; Yang, G.H. Synthesis of Novel Waterborne Silicone Modified Acrylic Sealant and its Corrosion Resistance in Fe-based Amorphous Coatings. Prog. Org. Coat. 2022, 170, 106950. [Google Scholar] [CrossRef]
  20. Wang, X.; Wang, Q.Z.; Zhou, F.; Kongg, J.Z.; Zhou, Z.F. The Improved Mechanical and Tribological Properties of CrN Coatings Sealed Via Electrochemical Polarization Treatment. Tribol. Int. 2024, 198, 109892. [Google Scholar] [CrossRef]
  21. Wang, Q.; Zhou, F.; Ding, X.; Zhou, Z.; Wang, C.; Zhang, W.; Li, L.K.-Y.; Lee, S.-T. Structure and Water-lubricated Tribological Properties of Cr/a-C Coatings with Different Cr Contents. Tribol. Int. 2013, 67, 104–115. [Google Scholar] [CrossRef]
  22. Cova, L.F.; Broitman, E.; Jimenez, O.; Martínez, M.F. Tribological Behavior of WC/WCN/CNx Coatings Deposited by High Power Impulse Magnetron Sputtering. J. Vac. Sci. Technol. 2023, 41, 033105. [Google Scholar] [CrossRef]
  23. Oliver, W.; Pharr, G. An Improved Technique for Determining Hardness and Elasticmodulus Using Load and Displacement Sensing Indentation Experiments. J. Mater. Res. 1992, 7, 1564–1583. [Google Scholar] [CrossRef]
  24. Fukumasua, N.K.; Bernardes, C.F.; Ramirez, M.A.; Trava-Airoldi, V.J.; Souza, R.M.; Machado, I.F. Local Transformation of Amorphous Hydrogenated Carbon Coating Induced by High Contact Pressure. Tribol. Int. 2018, 124, 200–208. [Google Scholar] [CrossRef]
  25. Bartolom’e, L.; Oblak, E.; Kalin, M. Mechanical Behaviour and Constitutive Models of ZDDP Tribofilms on DLC Coatings Using Nano-indentation Data and Finite Element Modelling. Tribol. Int. 2016, 95, 19–26. [Google Scholar] [CrossRef]
  26. Xu, S.; Zhou, Y.W.; Li, J.L.; Zhang, K.C.; Li, Z.W.; Wang, D.; Yuan, X. High Temperature Oxidation and Mechanical Properties of CrN Coatings on Titanium Alloy Surface. J. Univ. Sci. Technol. Liaoning 2023, 46, 187–195. [Google Scholar] [CrossRef]
  27. Wang, Q.; Zhou, F.; Wang, X.; Chen, K.; Wang, M.; Qian, T.; Li, Y. Comparison of Tribological Properties of CrN, TiCN and TiAlN Coatings Sliding Against SiC Balls in Water. Appl. Surf. Sci. 2011, 257, 7813–7820. [Google Scholar] [CrossRef]
  28. Momeni, M.M.; Mirhosseini, M.; Chavoshi, M. Fabrication of Ta2O5 Nanostructure Films Via Electrochemical Anodization of Tantalum. Surf. Eng. 2017, 33, 83–89. [Google Scholar] [CrossRef]
  29. Zhu, Y.H.; Liu, H.; Zhang, D.Y.; Wang, J.Z.; Yan, F.Y. Effect of Polarization Potentials on Tribocorrosion Behavior of Monel 400 Alloy in Seawater Environment. Tribol. Int. 2022, 168, 107445. [Google Scholar] [CrossRef]
  30. Ma, H.R.; Bennewitz, R. Nanoscale Friction and Growth of Surface Oxides on a Metallic Glass under Electrochemical Polarization. Tribol. Int. 2021, 158, 106925. [Google Scholar] [CrossRef]
  31. Nguyen, V.T.; Le Thu, Q.; Nguyen, T.A.; Ly, Q.C.; Thi, L.P.; Thi, H.P.; Thi, T.D. Mai. Arc Thermal Spray NiCr20 Alloy Coating: Fabrication, Sealant, Heat Treatment, Wear, and Corrosion Resistances. Int. J. Electrochem. 2019, 2019, 8796958. [Google Scholar] [CrossRef]
  32. Zhou, T.; Gao, X.; Chen, H.; Zhang, R.-Q.; Shang, L.; Zhang, G.; Cai, Z.-B. The High-temperature Oxidation and Mechanical Properties of the Cr/Zr and CrN/Zr Coating. Surf. Topogr.-Metrol. 2022, 10, 035028. [Google Scholar] [CrossRef]
  33. Lin, T.T.; Mishra, B.; Moore, J.J.; Sproul, W.D. Microstructure, Mechanical and Tribological Properties of CrAlN Films Deposited by Pulsed-closed Field Unbalanced Magnetron Sputtering (P-CFUBMS)1−xx. Surf. Coat. Technol. 2006, 201, 4329–4334. [Google Scholar] [CrossRef]
  34. Wang, Q.; Zhou, F.; Zhou, Z.; Yang, Y.; Yan, C.; Wang, C.; Zhang, W.; Li, L.K.-Y.; Bello, I.; Lee, S.-T. Influence of Carbon Content on the Microstructure and Tribological Properties of TiN(C) Coatings in Water Lubrication. Surf. Coat. Technol. 2012, 206, 3777–3787. [Google Scholar] [CrossRef]
  35. Chen, Y.; Wang, S.; Hao, Y.; Pu, J.; Jiang, X.; Huang, L.-F.; Wang, L. Friction and Wear Behavior of CrN Coating on 316L Stainless Steel in Liquid Sodium at Elevated Temperature. Tribol. Int. 2020, 143, 106079. [Google Scholar] [CrossRef]
  36. Wang, Q.; Zhou, F.; Ding, X.; Zhou, Z.; Wang, C.; Zhang, W.; Li, L.K.-Y.; Lee, S.-T. Microstructure and Water-lubricated Friction and Wear Properties of CrN(C) Coatings with Different Carbon Contents. Appl. Surf. Sci. 2013, 268, 579–587. [Google Scholar] [CrossRef]
  37. Zhang, M.D.; Zhou, F.; Fang, H.T.; Wang, Q.Z.; Kong, J.Z. Structure and Tribological Properties of CrTiAlCN Coatings with Various Carbon Contents. J. Mater. Eng. Perform. 2019, 28, 1509–1521. [Google Scholar] [CrossRef]
  38. Wang, D.; Lin, S.-S.; Lu, J.-D.; Huang, S.-Q.; Yin, Z.-F.; Yang, H.-Z.; Bian, P.-Y.; Zhang, Y.-L.; Dai, M.-J.; Zhou, K.-S. Research on High Temperature Wear Resistance Mechanism of CrN/CrAlN Multilayer Coatings. Tribol. Int. 2023, 180, 108184. [Google Scholar] [CrossRef]
Figure 1. Schematic diagram of defect sealing after increasing cycle numbers.
Lubricants 12 00295 g001
Figure 2. The SEM images of cross-sectional morphologies of (a) CrN0 (b) CrN10 (c) CrN20 (d) CrN30 (e) CrN40 (f) CrN50 (g) CrN60 coatings.
Lubricants 12 00295 g002
Figure 3. The schematic diagram of electrochemical polarization treatment at different cycle numbers.
Lubricants 12 00295 g003
Figure 4. COMSOL simulation of electrochemical polarization process (a) original model and (b) post-polarization model.
Lubricants 12 00295 g004
Figure 5. Cross-sectional morphologies, selected area electron diffractograms, and HRTEM photographs of (a,c) CrN0 coating and (b,d) CrN60 coating.
Lubricants 12 00295 g005
Figure 6. The SEM images of surface morphologies of (a) CrN0 (b) CrN10 (c) CrN20 (d) CrN30 (e). rN40 (f) CrN50 (g) CrN60 coatings.
Lubricants 12 00295 g006
Figure 7. (a) 3D morphology pictures of CrN0 and (b) CrN60, and (c) variation of coating surface roughness with the number of cycles.
Lubricants 12 00295 g007
Figure 8. The load-unloading curves of (a) CrN0 (b) CrN20 (c) CrN40 (d) CrN60 and (e) the variation of hardness and elastic modulus at the loading depth of 200 nm as a function with the cycle number.
Lubricants 12 00295 g008
Figure 9. (a) The friction behavior and (b) average steady-state friction coefficients of CrN coatings treated at different cycle numbers.
Lubricants 12 00295 g009
Figure 10. The variation of wear rates of CrN coatings and SiC balls as a function of cycle number.
Lubricants 12 00295 g010
Figure 11. (a) The O 1s core-level XPS spectra and (b) bond distribution ratios of CrN coatings at different cycle numbers.
Lubricants 12 00295 g011
Figure 12. HRTER images of top surface of (a) CrN0 and (b) CrN60 coatings.
Lubricants 12 00295 g012
Figure 13. (ac) Schematic representation of the calculation process of CrN coating porosity and (d) the calculation results of porosity.
Lubricants 12 00295 g013
Figure 14. The variation of hardness as a function of cycle numbers at different loading depths.
Lubricants 12 00295 g014
Figure 15. (a) The construction of the ball-on-disc tribometer and the infrared images of temperature for (b) CrN0 (c) CrN10 (d) CrN20 (e) CrN30 (f) CrN40 (g) CrN50 (h) CrN60 coating.
Lubricants 12 00295 g015
Figure 16. The 3D morphologies and contours of wear tracks for (a1,a2) CrN0 (b1,b2) CrN10 (c1,c2) CrN20 (d1,d2) CrN30 (e1,e2) CrN40 (f1,f2) CrN50 (g1,g2) CrN60 coating.
Lubricants 12 00295 g016
Figure 17. The SEM images and EDS analyses of wear tracks on (a1a3) CrN0 (b1b3) CrN10 (c1c3) CrN20 (d1d3) CrN30 (e1e3) CrN40 (f1f3) CrN50 (g1g3) CrN60 coating.
Lubricants 12 00295 g017aLubricants 12 00295 g017b
Table 1. Chemical compositions of the CrN coatings before and after EP treatment.
CoatingsCrN0CrN10CrN20CrN30CrN40CrN50CrN60
N (at.%)45.3444.4939.3341.8140.6941.0738.82
O (at.%)6.327.0011.9211.4312.4112.6412.35
Cr (at.%)48.3448.5148.7546.7646.9046.2948.83
Table 2. The increasing rate of hardness for CrN coating after EP treatment at different loading depths.
Loading DepthCrN0CrN10CrN20CrN30CrN40CrN50CrN60
200 nmreference10.0%15.9%17.1%17.7%18.3%16.7%
300 nmreference8.4%13.3%19.5%20.2%22.7%20.6%
400 nmreference6.3%12.3%17.1%19.2%21.0%20.1%
500 nmreference6.3%11.0%15.0%16.7%18.4%16.7%
Difference of increasing rateBetween CrN20–CrN30
4.0–6.2%
Between CrN30–CrN60
0.6–2.5%
Table 3. Chemical compositions of the wear tracks on CrN coating before and after EP treatment.
CoatingC (at.%)N (at.%)O (at.%)Ti (at.%)Cr (at.%)Si (at.%)
CrN08.219.336.72.430.52.9
CrN1010.531.913.12.041.21.3
CrN2013.031.015.42.837.40.4
CrN3012.130.416.73.137.20.5
CrN4012.227.421.13.135.40.8
CrN5011.425.724.32.435.11.2
CrN6011.024.624.92.335.71.5
Disclaimer/Publisher’s Note: The statements, opinions and data contained in all publications are solely those of the individual author(s) and contributor(s) and not of MDPI and/or the editor(s). MDPI and/or the editor(s) disclaim responsibility for any injury to people or property resulting from any ideas, methods, instructions or products referred to in the content.