Article

Sheet Forming via Limiting Dome Height (LDH) Test: Influence of the Application of Lubricants, Location and Sheet Thickness on the Micro-Mechanical Properties of X8CrMnNi19-6-3

Faculty of Technology, Tomas Bata University in Zlin, Vavreckova 5669, 760 01 Zlin, Czech Republic
*
Author to whom correspondence should be addressed.
Lubricants 2024, 12(7), 260; https://doi.org/10.3390/lubricants12070260
Submission received: 18 June 2024 / Revised: 10 July 2024 / Accepted: 16 July 2024 / Published: 21 July 2024
(This article belongs to the Special Issue Tribology in Manufacturing Engineering)

Abstract

:
This work is concerned with forming, specifically deep drawing, and its influence on the micro-mechanical properties of sheet metal. In practice, there are several applications in which fractions can occur due to weak spots in the deep-drawn sheet metal, especially after long-term use. The deep drawing process was carried out on BUP–600 machines using the LHD (Limiting Dome Height) method, which uses a forming tool with a diameter of 100 mm and bead groove. Sheet metals X8CrMnNi19-6-3 (1.4376) with thicknesses of 1, 1.5, and 3 mm were selected for this process. To study the effect of a lubricant on the formability of the sheet metal, deep drawing without and with a lubricant was compared. An FEM analysis was conducted to identify critical points in the deep drawing process, and the results were later compared with real results. The analysis was conducted using the AutoForm program. The micro-mechanical properties of these points were subsequently examined. The specified points on the formed part showed significant differences in their micro-mechanical properties, suggesting a higher strength but also less resistance to fractures. The difference in micro-mechanical properties (indentation and Vickers hardness) in points that were not deep-drawn and points located in critical areas was up to 86%. Significant changes in behavior were found in the indentation modulus and plastic/elastic deformation work as well. This study demonstrates the significant effect of the use of a lubricant in achieving the deep drawing of the sheet metal. The application of a lubricant resulted in a 33% increase in drawing range compared to drawing without lubrication. This study has a significant influence on the deep drawing of sheet metals in practice, showing the fundamental influence of the lubricant on the drawing process and also showing the problem of critical points that need to be eliminated.

Graphical Abstract

1. Introduction

The drawing of sheet metals is a process which uses a forming tool to shape planar sheet metal through the material flow between the surface of the forming tool and the die. In deep drawing, the blank can be formed into a cylindrical, conical, or rectangular shape. It is possible to produce final products with this technology with a minimal number of operations and minimal waste [1].
The deep drawing of sheet metals can be used to manufacture low-weight parts with high strength. It can be used to produce complex parts, which cannot be produced by other available technologies. Deep drawing technology can be used in a few different ways. The first possibility is deep drawing without a reduction in thickness; the second choice is deep drawing with a reduction in thickness (commonly, the walls and bottom have different thicknesses). Furthermore, deep drawing can be divided according to the number of operations, into one forming operation and two forming operations, where the latter is commonly chosen when more complex formed parts are involved [2,3].
The deep drawing of metal sheets is one of the most widespread technologies, not only for the manufacturing of multiple parts, but also for the simple testing of metal sheets. Typical examples of manufactured products include pots, pans, sinks, drink tin cans, and automobile or airplane panels. Deep drawing technology uses single-action and double-action press machines, hydraulic press machines, special devices, and other technologies [2,3].
Metal sheet properties can be tested by deep drawing tests, for example, Erichsen, Nakajima, LDH, and others. A basic parameter describing the formability of sheet metals is shown by the FLD diagram, which contains the measured deformation values of material. In order to assess the marginal formability of sheet metal parts, the FLC (forming limit curve) can be used. This curve represents the transition from safe values to failure values. The FLC represents the approximately real deformation of the material (assumed linear trajectory of deformation). The evaluation of the maximum degree of deformation linearity can be obtained through the application of a deterministic grid with precise dimensions on a nondeformed blank of sheet metal. The sheet metal is then deformed according to Nakajima (LDH) or Marciniak. Following this step, transverse deformation values can be determined from the deep-drawn part (parts with local faults have to be excluded). Maximum deformation (without any damage to original part) can be determined by interpolation. The obtained maximum of the interpolated curve is designated the marginal formability. The limit of formability can be determined simultaneously for more deformation trajectories, with a different ratio for the primary and secondary deformations. Deformation trajectories go from uniaxial to biaxial tensile stress and back. Values for various states are presented as a graph and used to create the forming limit curve. This curve describes the real deformation of the primary and secondary deformation on the surface of the sheet metal. Secondary deformation ε2 is represented by axis X, while axis Y represents primary deformation ε1 [4,5,6,7].
The LDH test is used for planar metal sheets with a thickness ranging from 0.3 mm to 4 mm. The test is carried out according to ČSN EN 12004–2. A forming tool with a diameter of 100 mm, length of stem ranging from 25 to 50 mm, and rounding radius of 20 to 30 mm is generally used for this test. The samples can be prepared by milling or electro-erosive machining [4,8].
The LDH test uses the half-spherical forming tool. This method starts with a non-linear deformation trajectory. The non-linearity is acceptable, as this is the reason the FLCs can be evaluated. The test is valid if it contains a break in distance no greater than 15% of the total diameter of the forming tool. Any sample not fulfilling these conditions is excluded. The test uses lubrication that cannot be changed during the evaluation of one FLC. Oil, PE, PTFE foils, and soft strips of PVC can be used as the lubricant [4,9,10].
The indentation hardness of the sheet metal being formed is a crucial factor in understanding the mechanical properties and behavior of the various materials used in this process. Indentation hardness tests are commonly utilized in the metal industry and related research due to their ease of use, cost-effectiveness, and reliability in evaluating material properties [11]. These tests offer valuable insights into the fundamental properties of developed or new materials, assisting in the optimization of the sheet metal forming processes.
Studies on metallic glasses have demonstrated that structural strain hardening can occur at low temperatures, emphasizing the significance of comprehending the deformation behavior of these materials [12]. Nanoindentation techniques can explore the elastic limit of metallic glasses, providing a means to assess their mechanical response under different conditions.
Regarding spot welding, the hardness profile of resistance spot welds can vary depending on factors such as the electrical resistivity of the sheet metal. Sheets with a higher electrical resistivity or thickness tend to display higher bulk electrical resistivity, influencing the volume of the melted zone and subsequently impacting the hardness profile of the welds [13]. Understanding these variations is essential for ensuring the quality and integrity of spot welds in the automotive industry and other fields of application.
Additionally, the stress level of plastically pre-hardened metal sheets can be determined using the spherical instrumented indentation technique, offering insights into the work-hardening behavior of both the bulk material and the superficial layers [14]. By combining tensile tests with indentation techniques, researchers can establish comprehensive work-hardening laws for different regions of the metal sheets, aiding in the optimization of forming processes.
Furthermore, the dynamic indentation behavior of metallic materials remains an area that requires further understanding, particularly concerning ultrahigh-strain-rate plastic deformation under adiabatic conditions [15]. Investigating the dynamic hardness response of metals can offer insights into their behavior under rapid loading conditions, which is relevant in sheet metal forming processes where materials undergo varying levels of strain and deformation.
Moreover, Mohammed et al. [16] conducted a numerical study on the effect of anisotropy on the deformation behavior of aluminum bilayer sheets, revealing that anisotropic properties significantly affect stiffness and dimensional accuracy. Anisotropy plays a crucial role in determining the hardness and formability of sheet metal, underscoring the importance of material orientation in sheet metal forming processes.
The problem of deep drawing of sheet metals has already been examined by numerous research papers [17,18,19,20,21,22,23,24,25,26,27,28,29,30,31,32,33] which focus on the possibilities of deep drawing. On the other hand, no currently available work investigates the influence of deep drawing on the mechanical properties of sheet metals at specific points.
In conclusion, the indentation hardness of sheet metal forming materials plays a pivotal role in determining their mechanical properties, deformation behavior, and overall performance during manufacturing processes. By utilizing advanced techniques such as nanoindentation, instrumented indentation, and dynamic hardness testing, researchers can gain a comprehensive understanding of how different materials respond to indentation, aiding in the development of more efficient and reliable sheet metal forming processes.
The goal of this work is the evaluation of the influence of deep drawing (method LDH) of sheet metals of various thicknesses on micro-mechanical properties. In this work, prespecified points in deep-drawn sheet metal were measured and the resulting micro-mechanical properties were evaluated for their effect on the creation of ruptures.

2. Materials and Methods

The main goal of this work is to research the influence of deep drawing of sheet metals on micro-mechanical properties. First, samples were prepared to evaluate the micro-mechanical properties. The preparation of the sample consisted of parts being cut into required segments, which were then pressed into resin and sanded to enable measurement. Samples were created with varying thicknesses, 3 mm, 1.5 mm, and 1 mm. These samples had specific designated points, which were then measured for micro-mechanical properties.

2.1. Sample Material

Considering the nature of the deep drawing process, the intermediate product was sheet metal. The material requires high strength, ductility, and low weight. Stainless steel is often used for its resistance against corrosion. Another considered parameter is the ability of a material to absorb deformation energy, which is often used for individual parts in car bodies.
Considering the requirements of manufactured parts, corrosion-resistant steel was chosen for deep drawing. Sheet metal selection was carried out according to the ČSN EN 10088 [34] standard. Austenitic steel designated ČSN EN 1.4376 (X8CrMnNi19-6-3) manufactured by Zapp Precision Metals GmbH (Unna, Germany) was chosen. Sheet metal thicknesses were 1, 1.5, and 3 mm. Samples were prepared with the following dimensions: width 150 mm, length 600 mm. The dimensions were approximately the same for all sheet metal thicknesses. The chemical composition of steel X8CrMnNi19-6-3 can be seen in Table 1.

2.2. Deep Drawing Simulation

The simulation was performed in AutoForm R8, developed by AutoForm (Zurich, Switzerland). This program enables simulation of the entire deep drawing process together with shape cutting and following shaping. Considering the simplicity of the part’s shape, the process setting was carried out for the deep drawing process only, without the cutting process. Results of the simulation compare the formability of specific material according to the FLD diagram (evaluation of safe zone and state of fracture), the safety of drawing, the magnitude of sheet metal thinning, and magnitude of waviness.
The simulation was performed with corrosion-resistant steel ČSN EN 1.4376 (X8CrMnNi 19-6-3) chosen from AutoForm material options. Its properties were the following: Young’s modulus 210 GPa, Poisson’s ratio 0.3, and yield strength 792.8 MPa. The model was hatched by adaptive network. Figure 1 shows the material card (hardening curve–Figure 1a, yield surface–Figure 1b, Forming Limit Curve–Figure 1c).
Figure 1a also shows the hardening curve, which was gained by the Swift/Hockett-Sherby method. AutoForm requires true stress as a function of true plastic deformation measured in the direction of rolling. In this image, the values of the uniform elongation (Ag), yield stress (σ0), tensile strength (Rm), and strain hardening exponent (n) are highlighted.
Figure 1b shows the yield surface defined by BBC criteria with consideration of material anisotropy. The figure demonstrates the main values of this model. rm is the average ratio of plastic deformation in the 0°, 45°, and 90° directions of the sheet rolling; rb is the ratio of plastic deformation for dual-axis yielding, which is defined as the ratio of deformation ε2 and ε1; σb0 is the ratio between the beginning of yield and yield strength for uniform dual-axis yielding; σps00 is the ratio between planar deformation stress in the 0° direction of rolling and yield strength; σps900 is the ratio between planar deformation stress in the 90° direction of rolling and yield strength; and σshear0 is the ratio between shear stress and yield strength.
Figure 1c shows the Formability Limit Curve (FLC). The curve demonstrates the maximum value of the main deformation stresses ε1 and ε2 measured at the initial creation of fracture in the material.
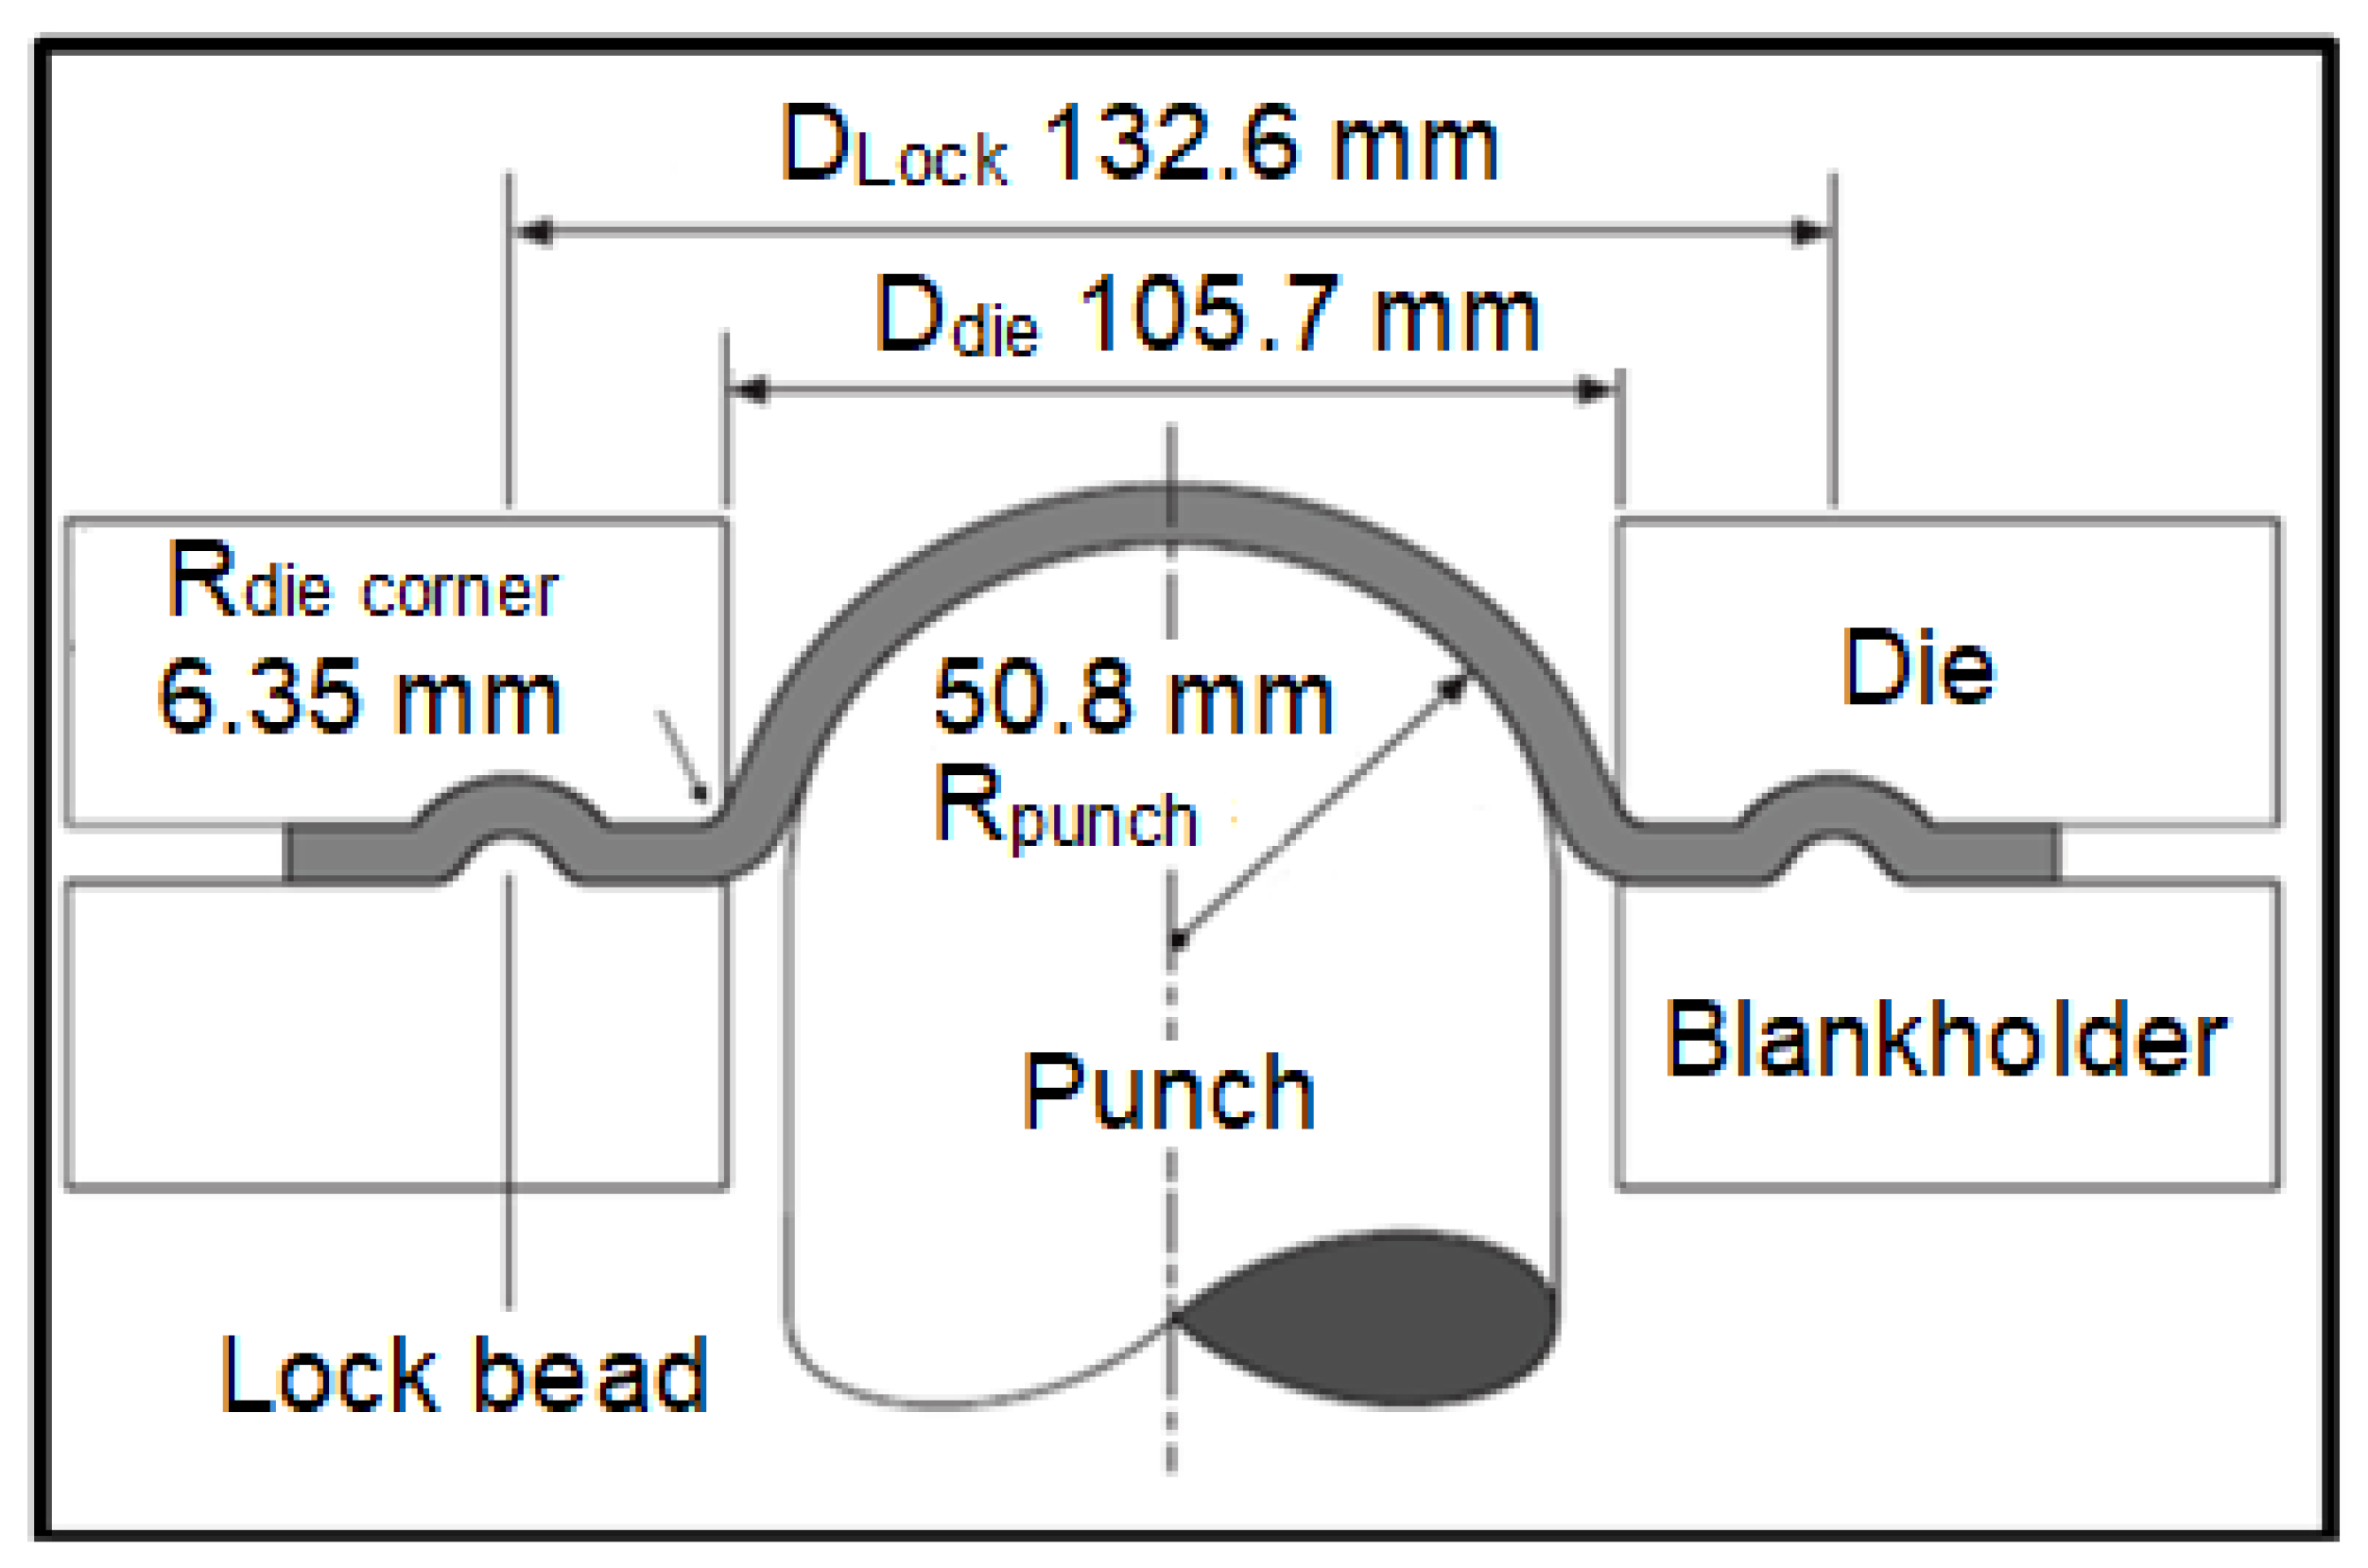
The drawing process was performed according to the Limiting Dome Height (LDH) method. This method utilizes a spherical forming tool with a 100 mm diameter. The ability to run a successful simulation is predated by 3D modelling of the tip of the forming tool, which must have precise dimensions as in the real drawing process. The dimensions of the test setup can be seen in Figure 2. The lubricant used for the deep drawing process was chosen from the software database, and its friction coefficient was 0.07.
For all variants, the simulation in AutoForm was set according to a real test of formability carried out on BUP 600. The test of formability was ended by the initiation of bursting in the sample at a certain depth of drawing. The simulation was set according to these conditions, in order to be as representative of the real case as possible.

2.3. Deep Drawing of Sheet Metals

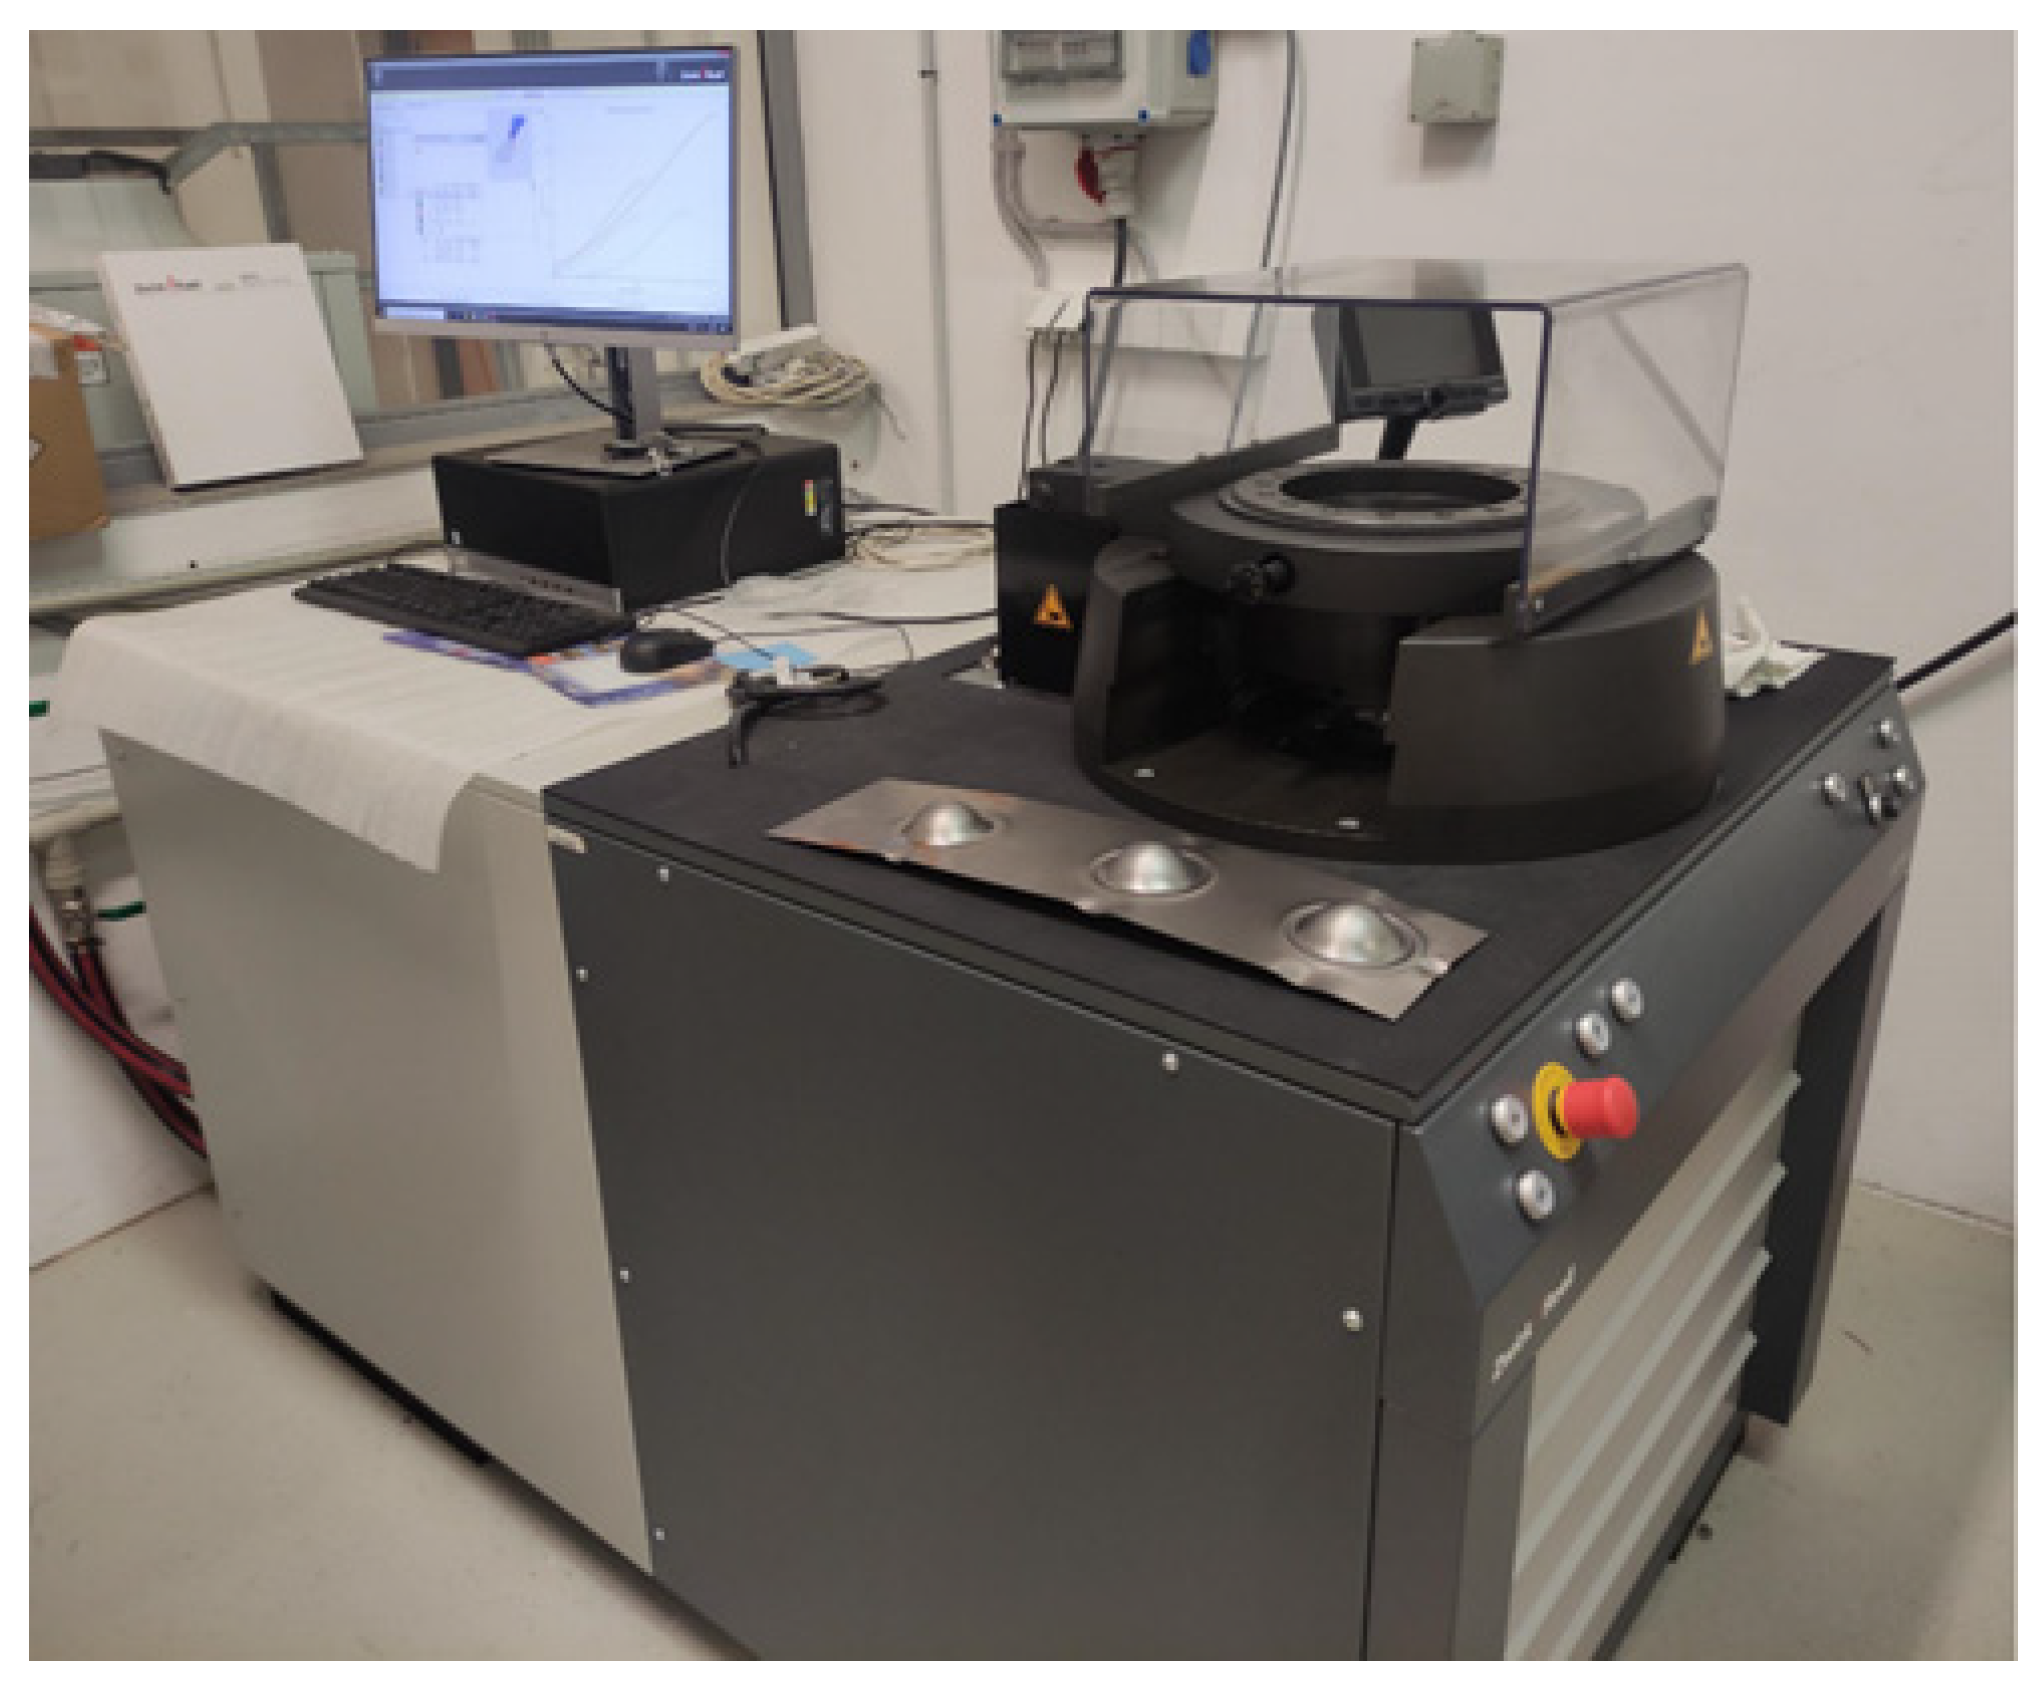
Experiments with deep drawing were conducted with the BUP 600 tool (Figure 3) manufactured by Zwick (Ulm, Germany). This machine is designed for sheet metal testing, which can lead to the determination of formability and influence of surface treatments and lubricants on the behavior of sheet metals during the deep drawing process. BUP–600 enables the inspection of the effectivity of the forming tool during the drawing process, as well as how individual process parameters affect the process. Basic machine parameters can be seen in Table 2.
To compare the effect of the lubricant on the sheet metal drawing, the lubricant type SAF 125 N from BBL Lubricants (Uhersky Brod, Czech) was used. SAF 125 N is based on synthetic and vegetable renewable polymers, specially designed for use in deep drawing areas and high-speed operations of ferrous and non-ferrous materials. The lubricant was sprayed as a thin layer on both sides of the sheet metal. Technical parameters of the lubricant can be seen in Table 3. All sheet metal thicknesses were drawn while lubricated with oil. For the 1 mm thickness, the deep drawing without oil and with oil was compared.

2.4. Sample Preparation

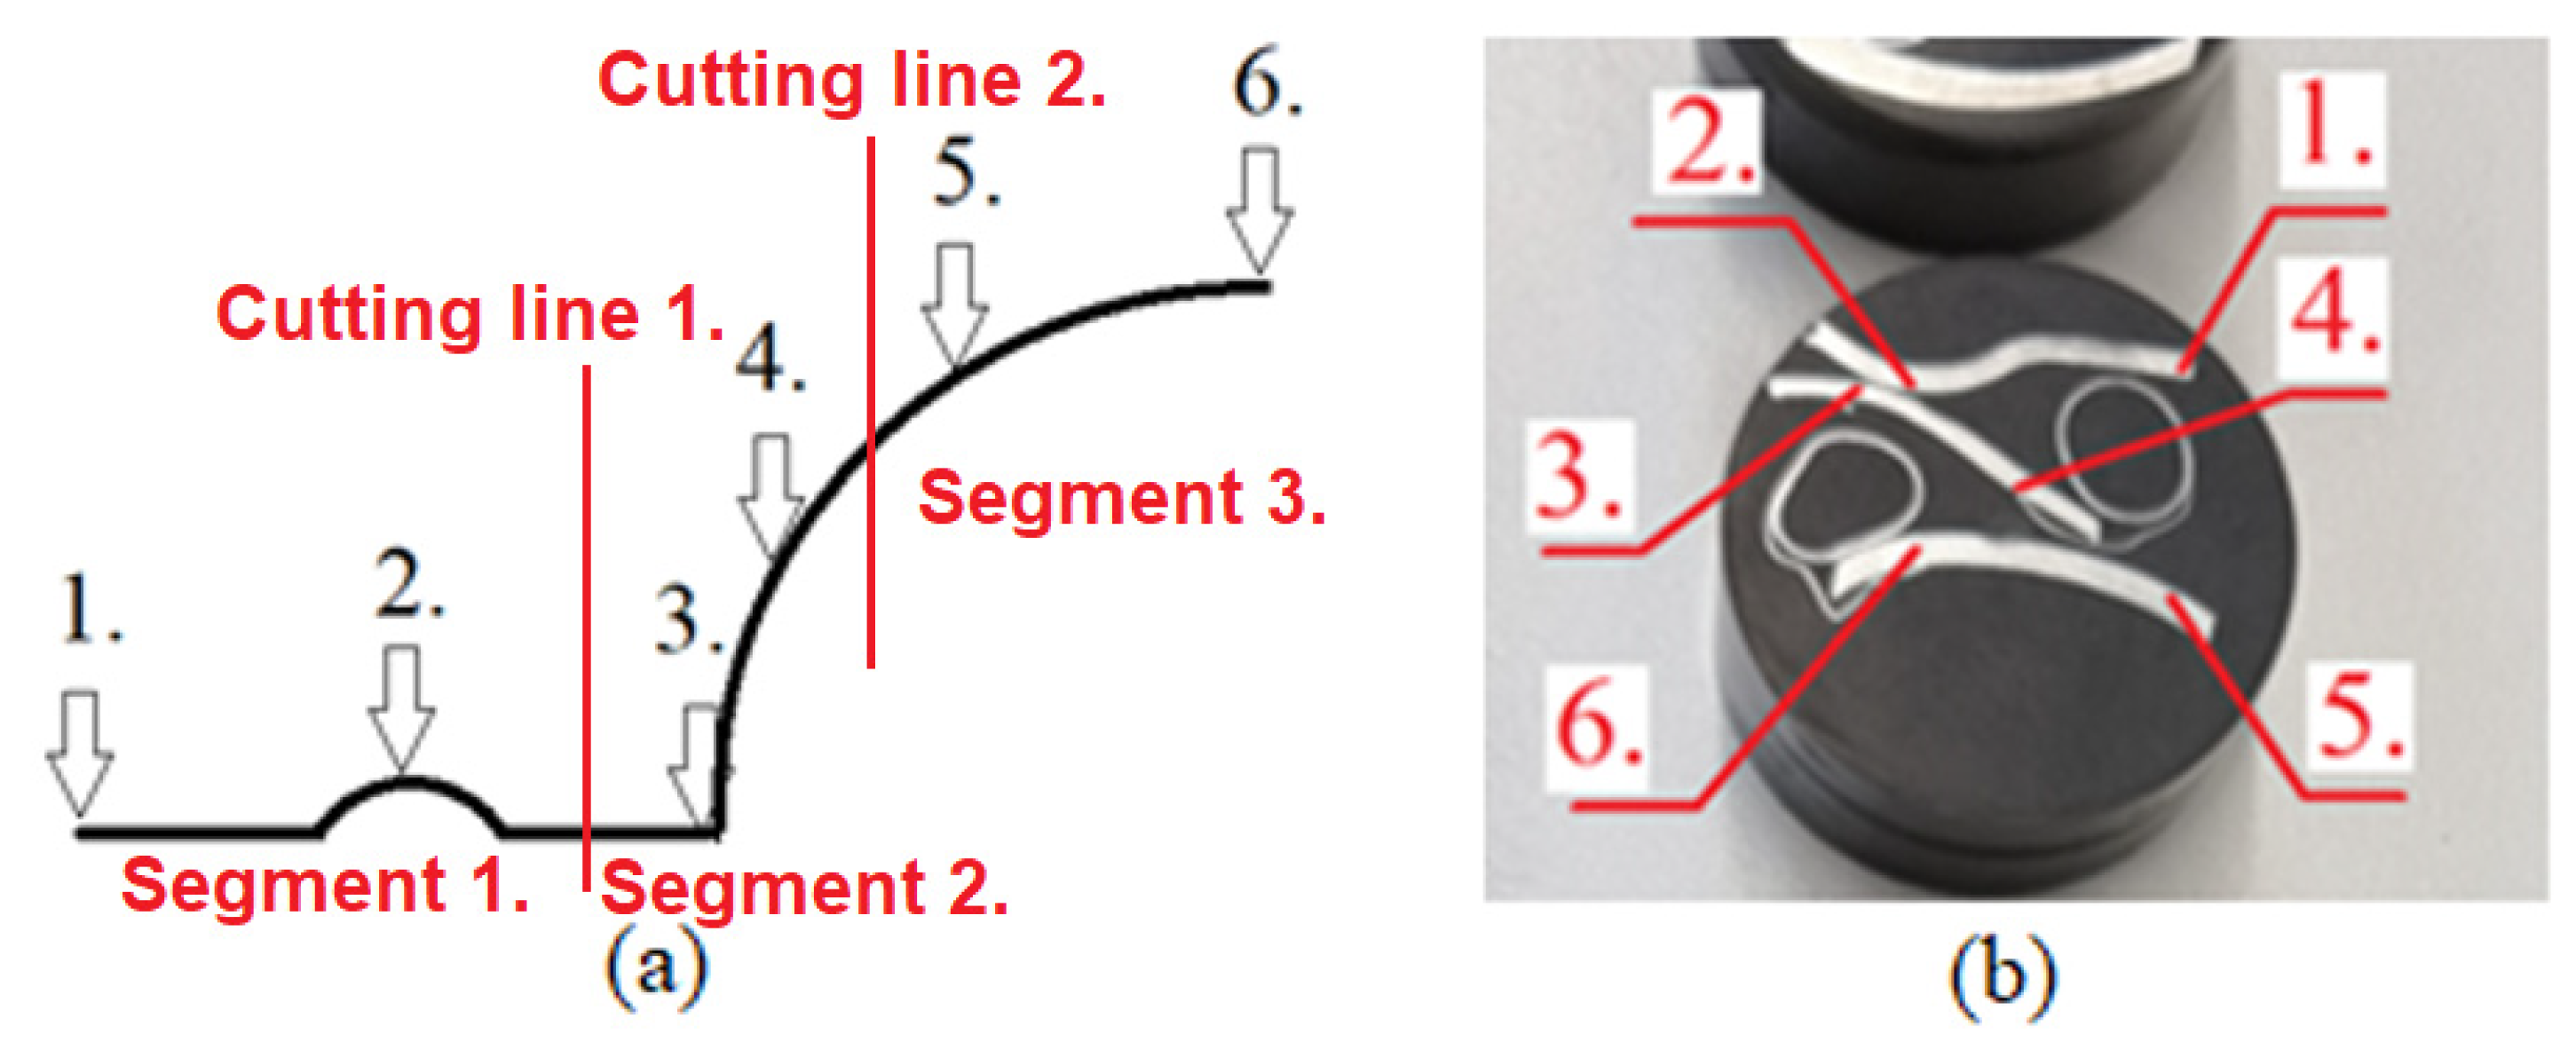
The sample preparation phase followed the deep drawing process. This phase consisted of segment cutting, resin pressing, and polishing. The segments of drawn sheet metal were cut, with emphasis on not influencing the critical points of the specimens, such as the lower radius (area 3), bottom (area 4), and top part (areas 5 and 6) of the sphere of the drawn part (Figure 4 and Figure 5). The sheet metal was cut into 3 segments, and the cutting lines were put in between areas 2 and 3 and 4 and 5. The tested sheet metal X8CrMnNi 19-6-3 is an austenitic stainless steel which is of an anisotropic nature. Due to this, the cuts and testing of micro-mechanical properties were conducted along the axis of anisotropy, which was also carried out by other authors in their publications [31].
Sample cutting was performed on a laboratory linear saw IsoMet 4000 with a diamond grinding wheel manufactured by Buehler (Lake Bluff, IL, USA). Cooling was carried out by cutting fluid, which was brought precisely to the cut point of the grinding wheel. The revolution of the saw was set to 1800 per minute.
Tested samples of sheet metals were pressed into resin by the automatic press SimpliMet 1000 manufactured by Buehler (Lake Bluff, IL, USA). The Automatic press SimpliMet 1000 is commonly used for the production of thermoset and thermoplastic samples. The following settings were used: heating time (90 s), cooling time (240 s), pressure (29 MPa), sample diameter (40 mm), and temperature (150 °C). PhenoCure by Buehler (Lake Bluff, IL, USA) was used as the resin.
The samples were grinded by EcoMet 250 Pro with rotating head AutoMet 250. Both tools were manufactured by Buehler (Lake Bluff, IL, USA). The following settings were used: head rotational speed of 40 rpm, table rotational speed of 100 rpm, and pressing force of 20 N. Water was brought into the process for improved cooling effect and to take away chipping waste. The grinding process was performed in multiple steps with various grinding wheels of differing grain sizes (P180, P320, P600, and P1200). Finally, samples were polished by diamond suspense with particle sizes 9 and 3 µm. Final polishing is carried out without cooling (Figure 4).

2.5. Micro-Mechanical Properties

The instrumented hardness test was performed with the micro-combi tester MCT3 produced by Anton Paar instruments (Graz, Austria), which is a universal measuring tool for a complete characterization of volumetric bodies (metals and polymers). It can also be used to measure hard coatings or thermal/plasma injections. The following settings were used: indentation force (1 N), loading/deloading speed (2 N/min), and load duration 12 s. The measurements were carried out according to the ČSN EN ISO 14557 [35] standard using the DSI (depth sensing indentation) method.
The LDH method with bead groove was used at measuring points, which can be seen in Figure 5.
  • Area of first change to mechanical properties (1);
  • Area of bead element (2);
  • Area of deep drawing start (3);
  • Area during deep drawing (4);
  • Area during deep drawing (5);
  • Area of deep drawing peak (6).
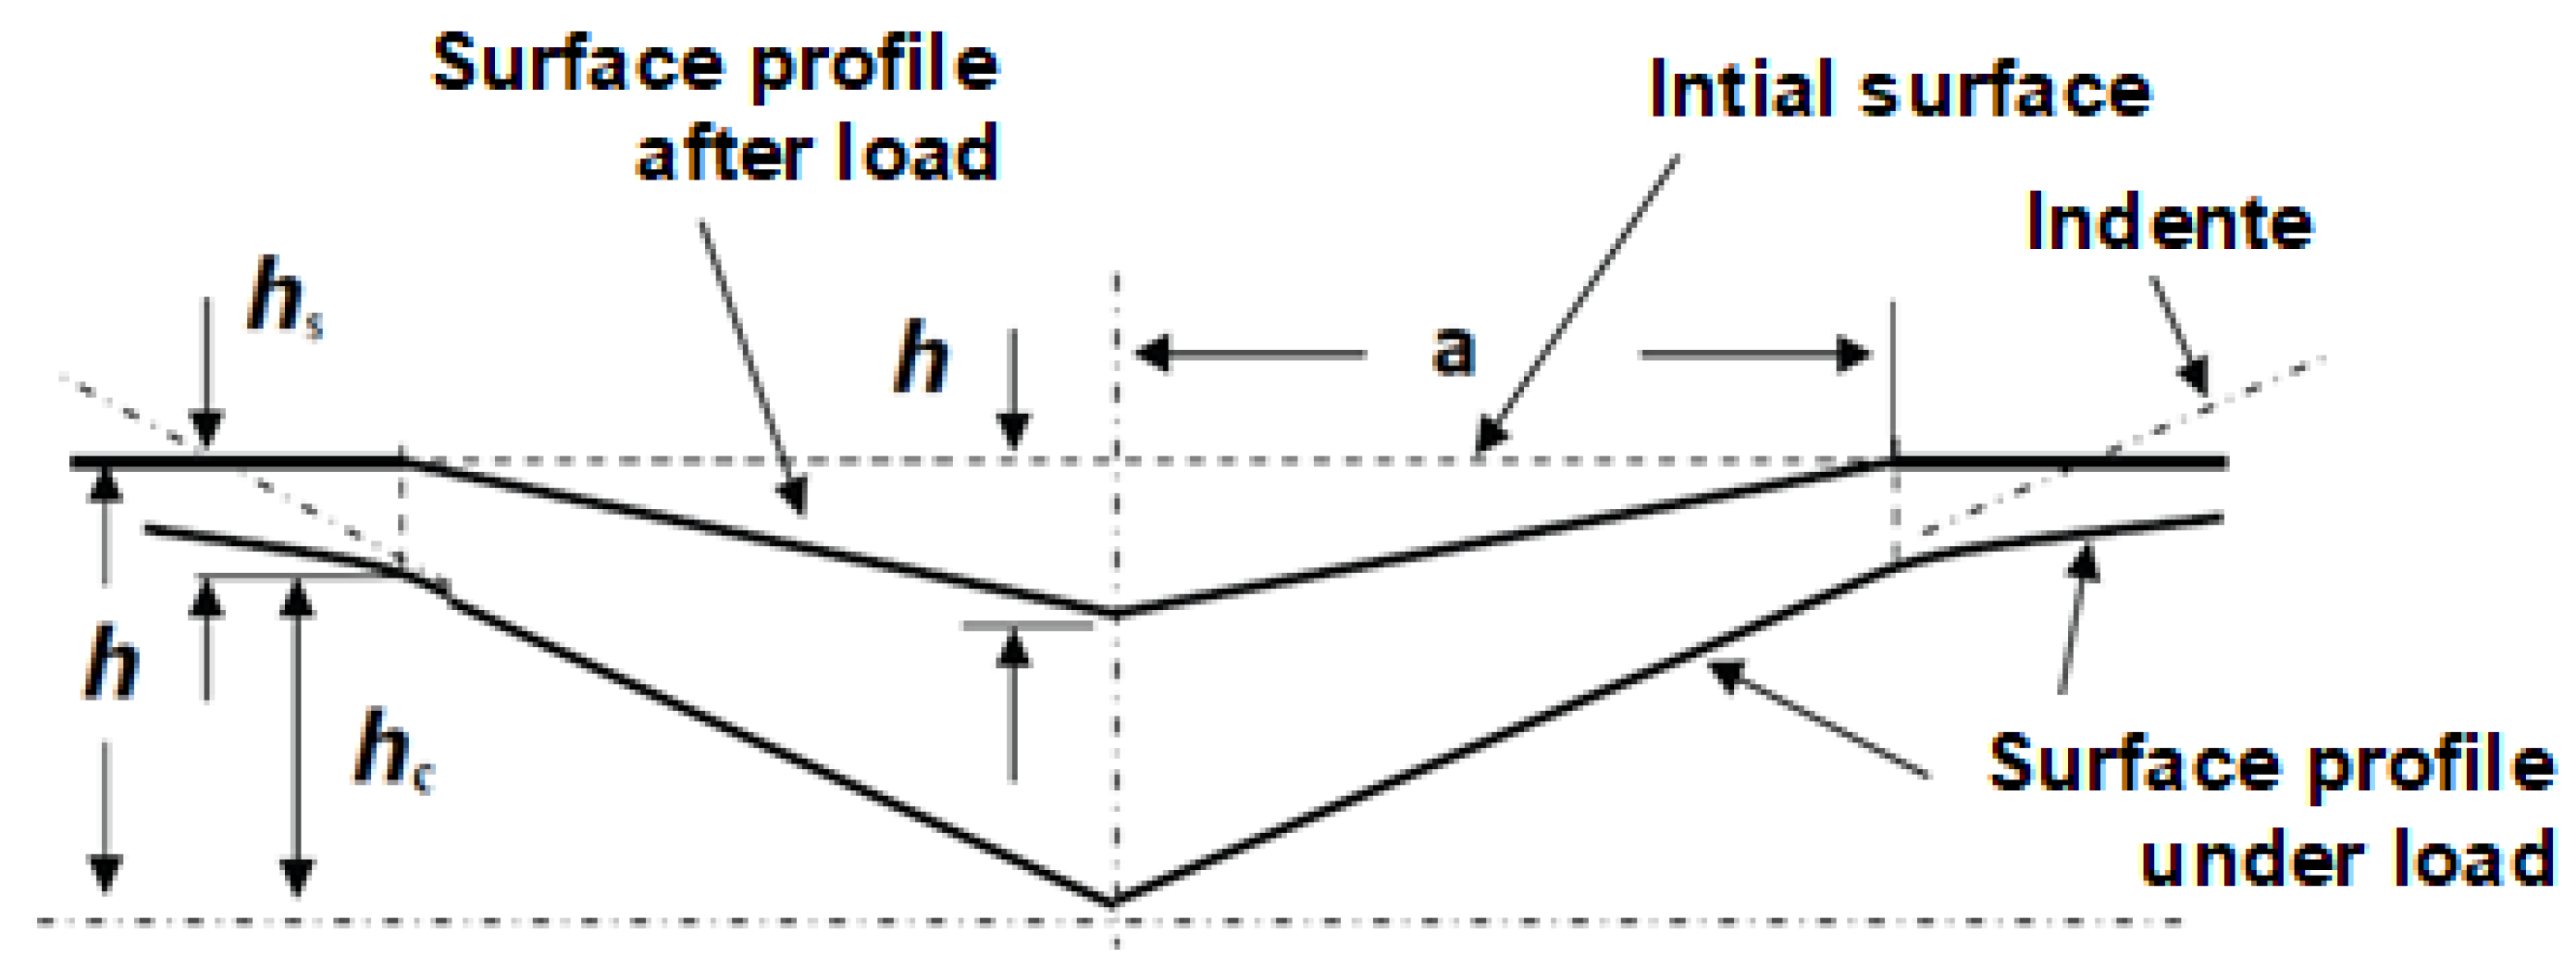
According to the aforementioned standard, the following parameters were evaluated: indentation hardness, indentation modulus, and indentation creep. Calculation of individual values was performed by the Oliver and Pharr method (Figure 6).
Indentation hardness HIT represents the degree of resistance to permanent deformation or damage. Indentation hardness HIT is generally defined as the maximum loading force Pmax divided by area of contact (Ap) between the indentor and test sample.
Further material properties that can be gained from the indentation test carried out by the DSI method are the indentation modulus EIT. In an ideal case, the indentation modulus has the exact same meaning as the elastic (Young’s) modulus. In general, the indentation modulus can be determined from the slope of the tangent line used for the calculation of indentation hardness HIT. The calculations involve Poisson’s ratio (vs), which is usually between 0.2 and 0.4 for metal materials and 0.3 to 0.4 for polymer materials.
This work focused on measuring the following parameters: indentation hardness, Vickers hardness, indentation modulus, and deformation work. As presented by other authors [32,33,36], measured mechanical properties belong to a group of micro-mechanical properties. Micro-mechanical properties are characterized by the magnitude of the applied loading force. Thus, the micro-perspective is considered only if the applied loading force is in the range of 0.5 N to 30 N, as described by ČSN 14557.

3. Results

Prepared sheet metals with varying thicknesses were deep-drawn with the LDH method and their micro-mechanical properties were measured (indentation hardness, Vickers hardness, indentation modulus, and deformation work). Critical points were found by deep drawing process simulation.

3.1. Comparison of Lubricant Influence

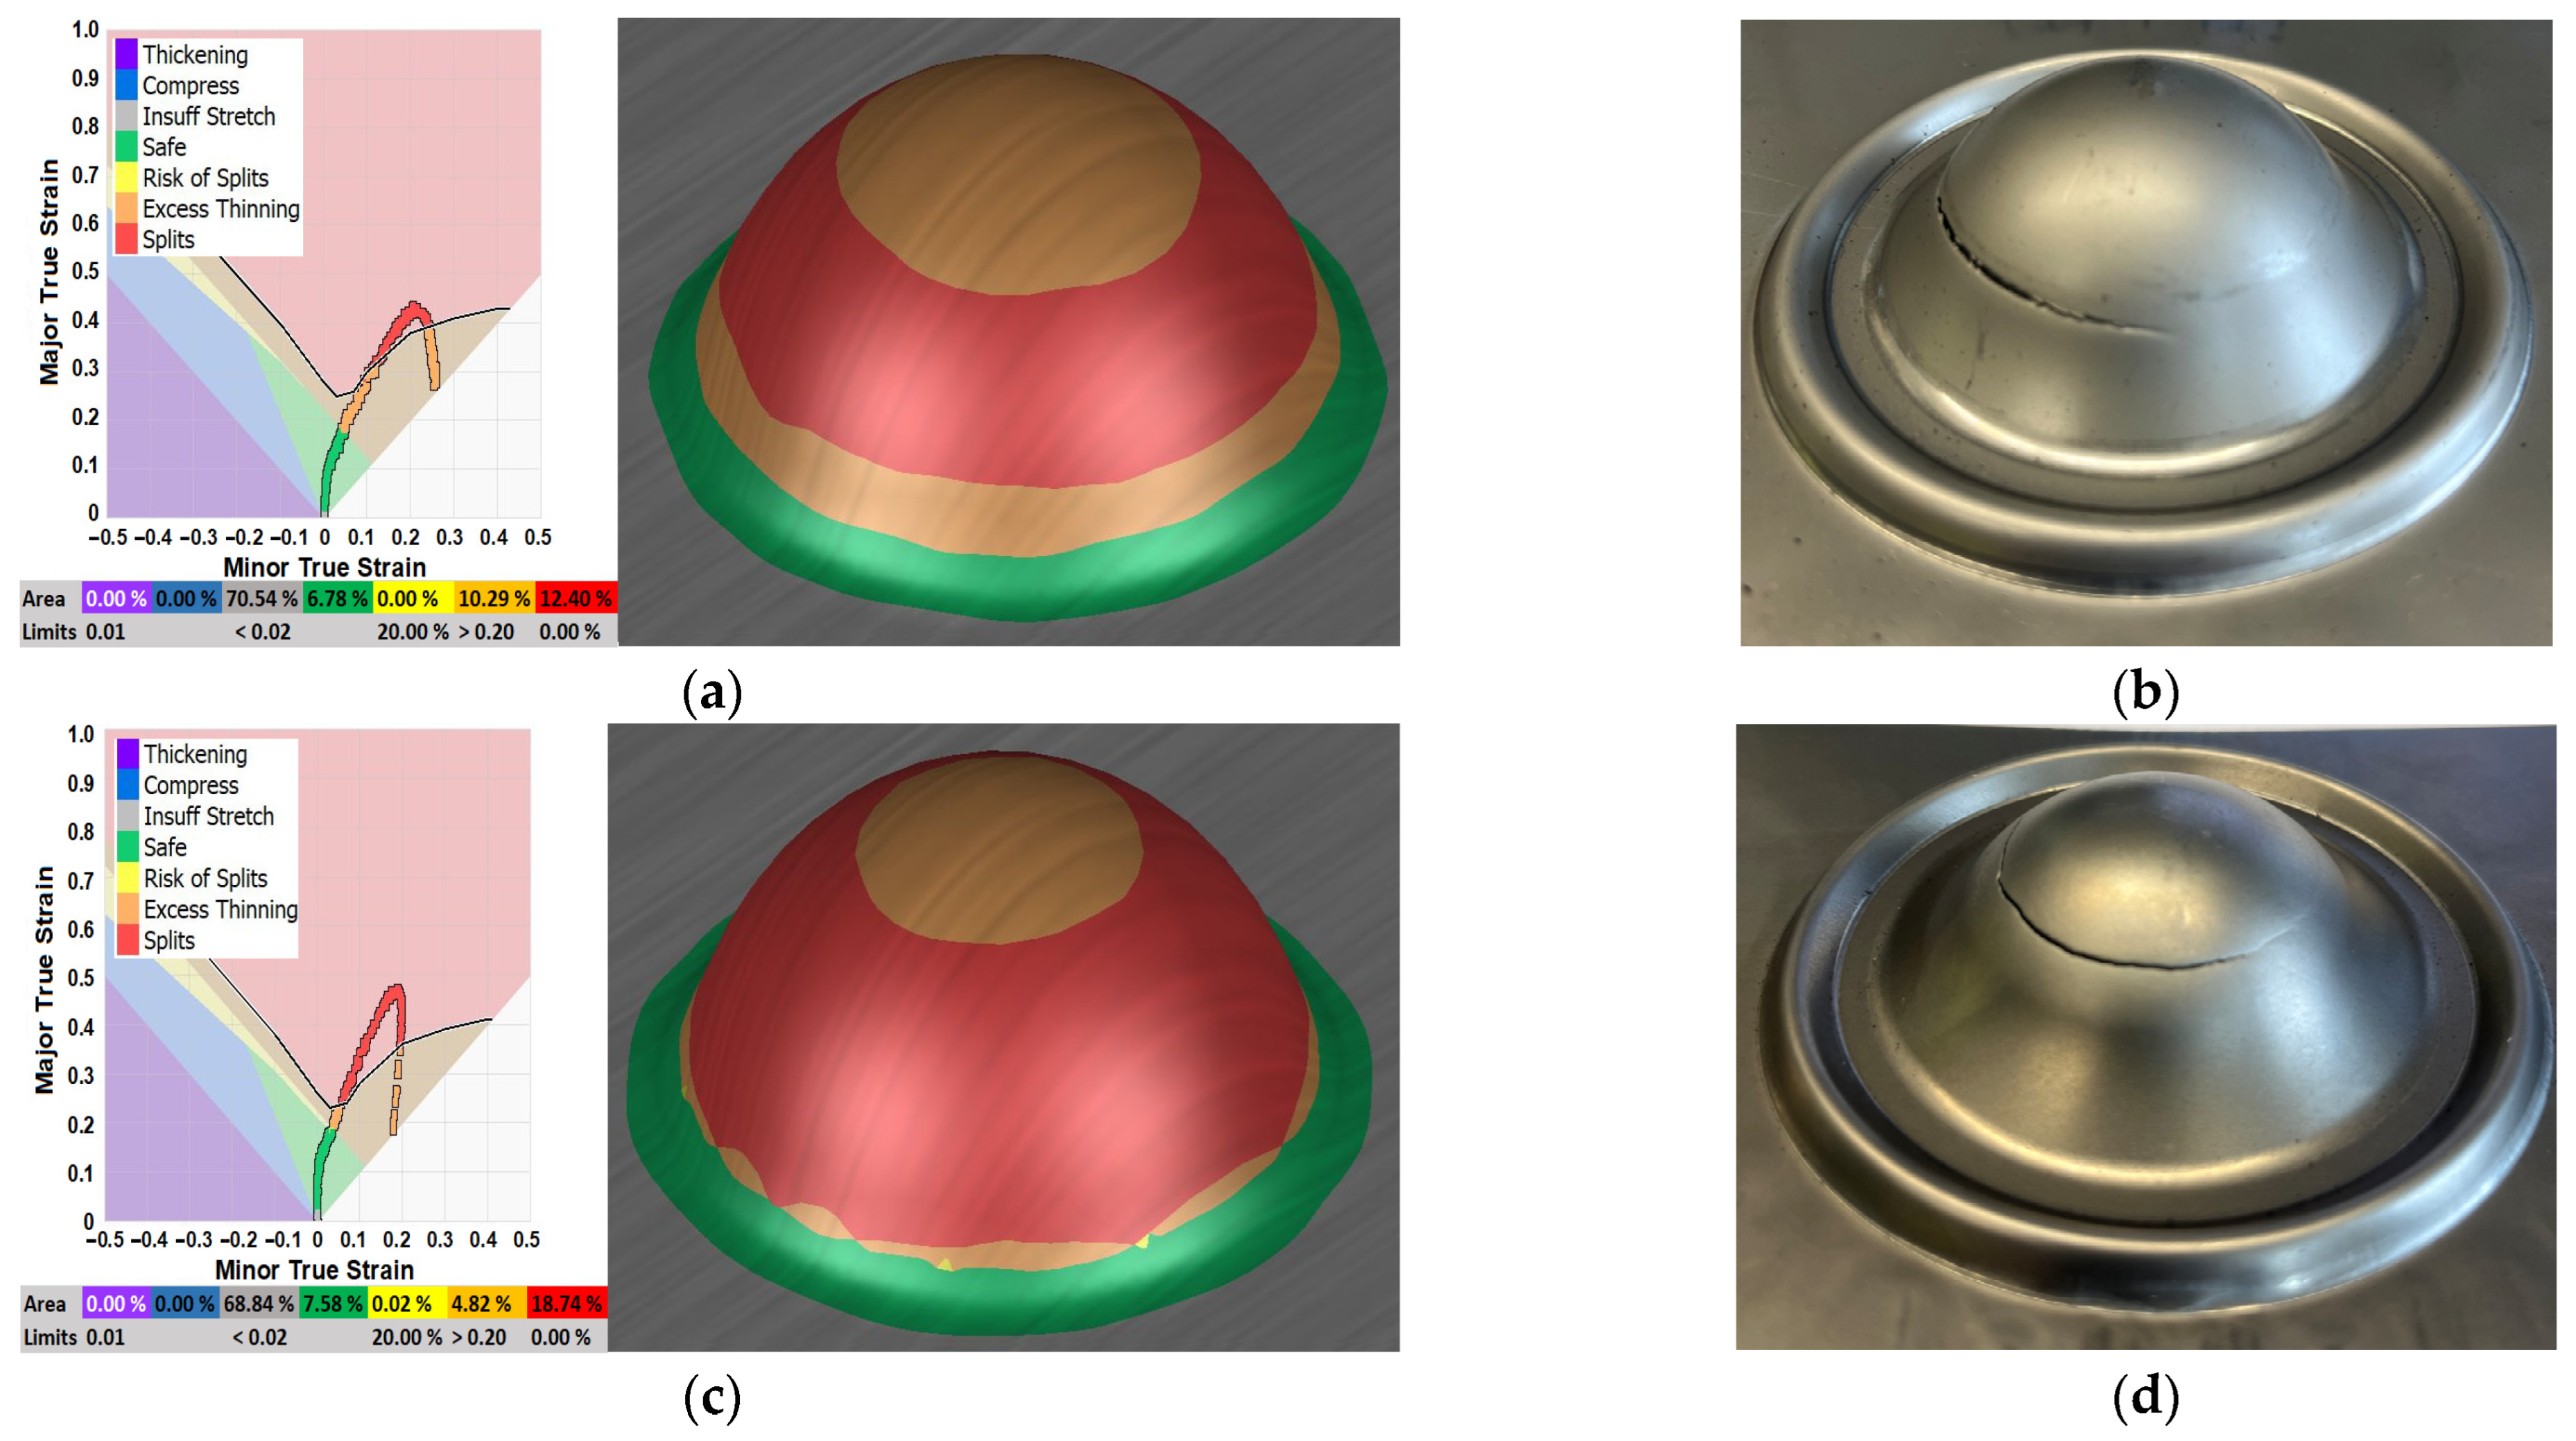
In this chapter, the drawing of 1 mm sheet thickness with and without lubricant was compared. The simulation in AutoForm software was set according to a real test of formability (based on depth of deep drawing required for the creation of fracture). Red-colored surfaces shown by the simulation indicate areas prone to the initiation of bursting. A comparison of the simulation (Figure 7a,c) and real test (Figure 7b,d) shows that bursting-prone areas were estimated correctly by the simulation. As the formability results from the simulation in Autoform software (Figure 7a,c) show, the lubricant has a significant effect on the formability process. The results show a higher depth of deep drawing and fewer critical areas when using lubricant; the deep drawing depth of the real process was 10.6 mm and the deep drawing depth determined from the simulation was 10.4 mm. On the other hand, without the use of lubricant, cracking occurred at a lower deep drawing depth; the deep drawing depth of the real process was 8.2 mm and the deep drawing depth determined from the simulation was 8.6 mm.
Based on the simulations, a deep drawing test was performed for a sheet metal thickness of 1 mm without and with lubricant. As shown by the deep drawing curves in Figure 8, the maximal drawing value was obtained at 10.6 mm with the lubricant and the maximum force obtained was 19 kN. On the other hand, without lubricant, the depth was 8 mm, and the maximum force achieved was 14 kN. These results are consistent with those obtained in the AutoForm simulation, and to exploit the maximum potential of the sheet metal, lubricant should be used in the deep drawing process.
Other deep drawing tests for sheet metal thicknesses of 1.5 mm and 3 mm were carried out with the application of lubricant.

3.2. Forming Simulation

The most important parameters of forming were evaluated from the simulation:
  • Formability (forming limit diagram—FLD);
  • Max failure;
  • Thinning.

3.2.1. Formability

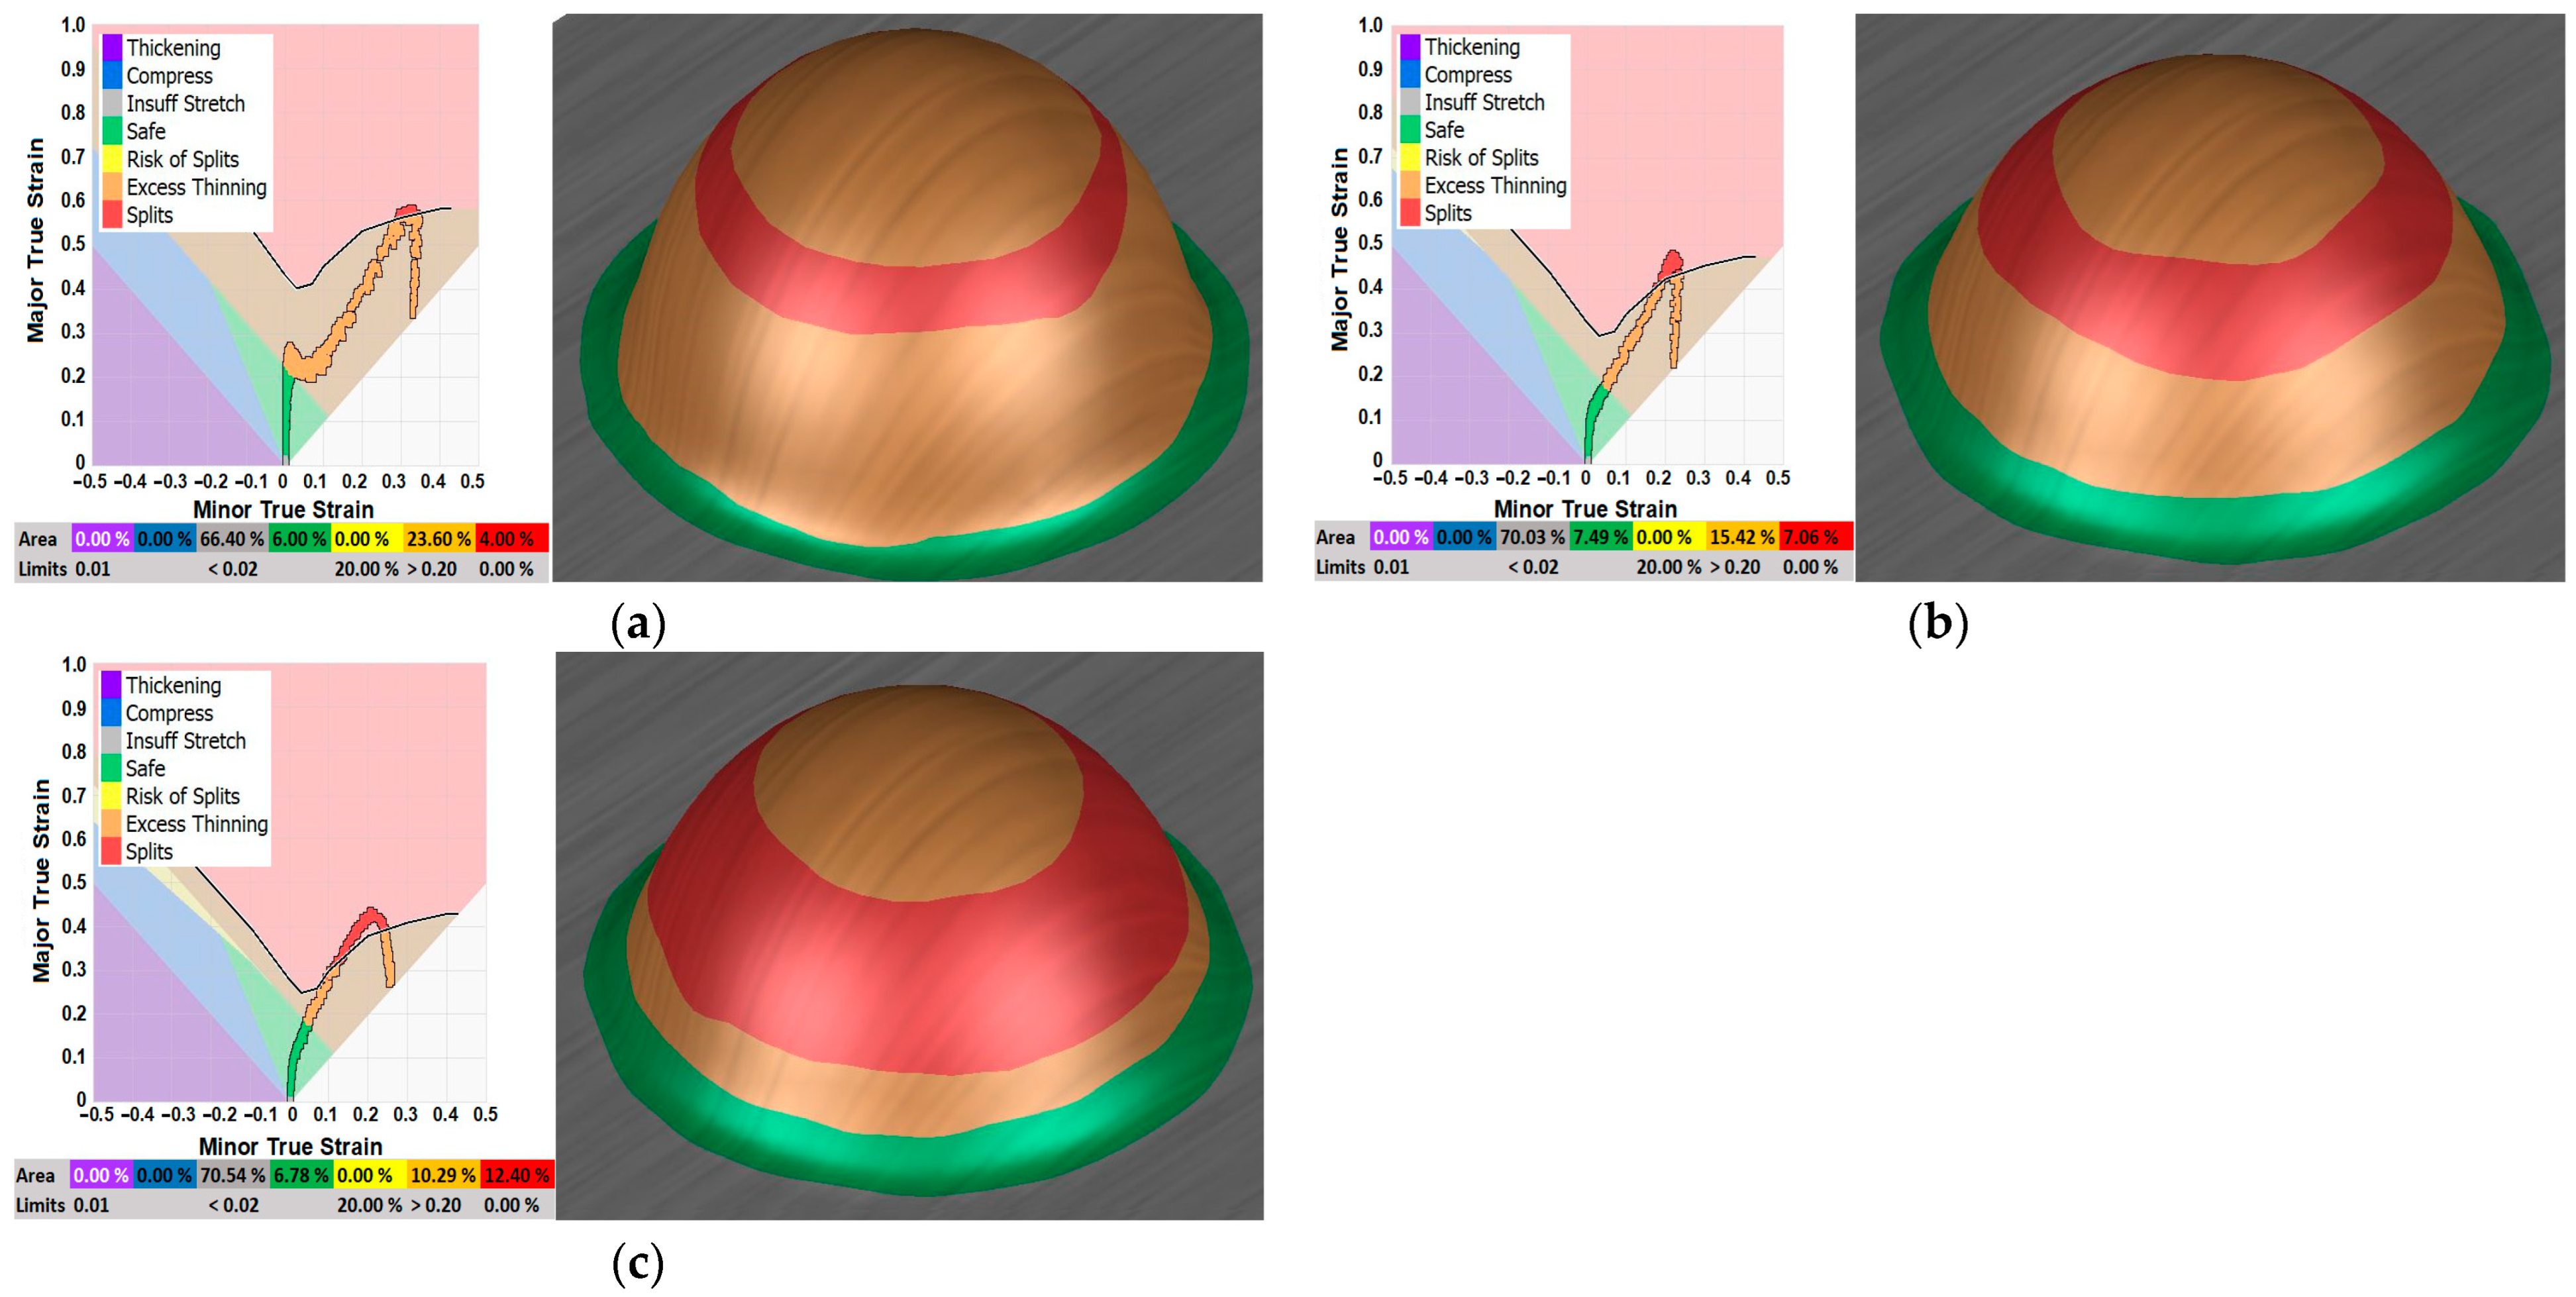
Formability can be evaluated by the FLD diagram, which considers the suitability of pressed sheet metal in accordance with preset process parameters (Figure 9). The main goal of the process is to achieve the highest percentage value in the green area of the graph (safe area). The goal of this work is not the elimination of dangerous areas, but the measurement of final values of micro-mechanical properties which can be used to predict the creation of dangerous failure areas (red and orange color).
The test of sheet metal formability by the LDH method with bead grooves was carried out with a forming tool with a diameter of 100 mm. The value of the dangerous area was 9%, while the area of possible bursting was almost 20%. Bead grooves were set to 7 mm depth so there was a maximum braking effect. In a real experiment, the bead element will press into the sheet metal. On the other hand, simulation will not visualize the presence of a bead groove.
Decreasing the thickness of sheet metal in LDH metal demonstrated increased critical area of bursting (going over 16.16%). Results show that the highest stress was found in the upper part of the sphere, while the top of the formed part demonstrated lower stress.
The critical area of sheet metal with a thickness of 1 mm rose to 21%, which indicated further increase in comparison with thicker metal sheets.

3.2.2. Max Failure

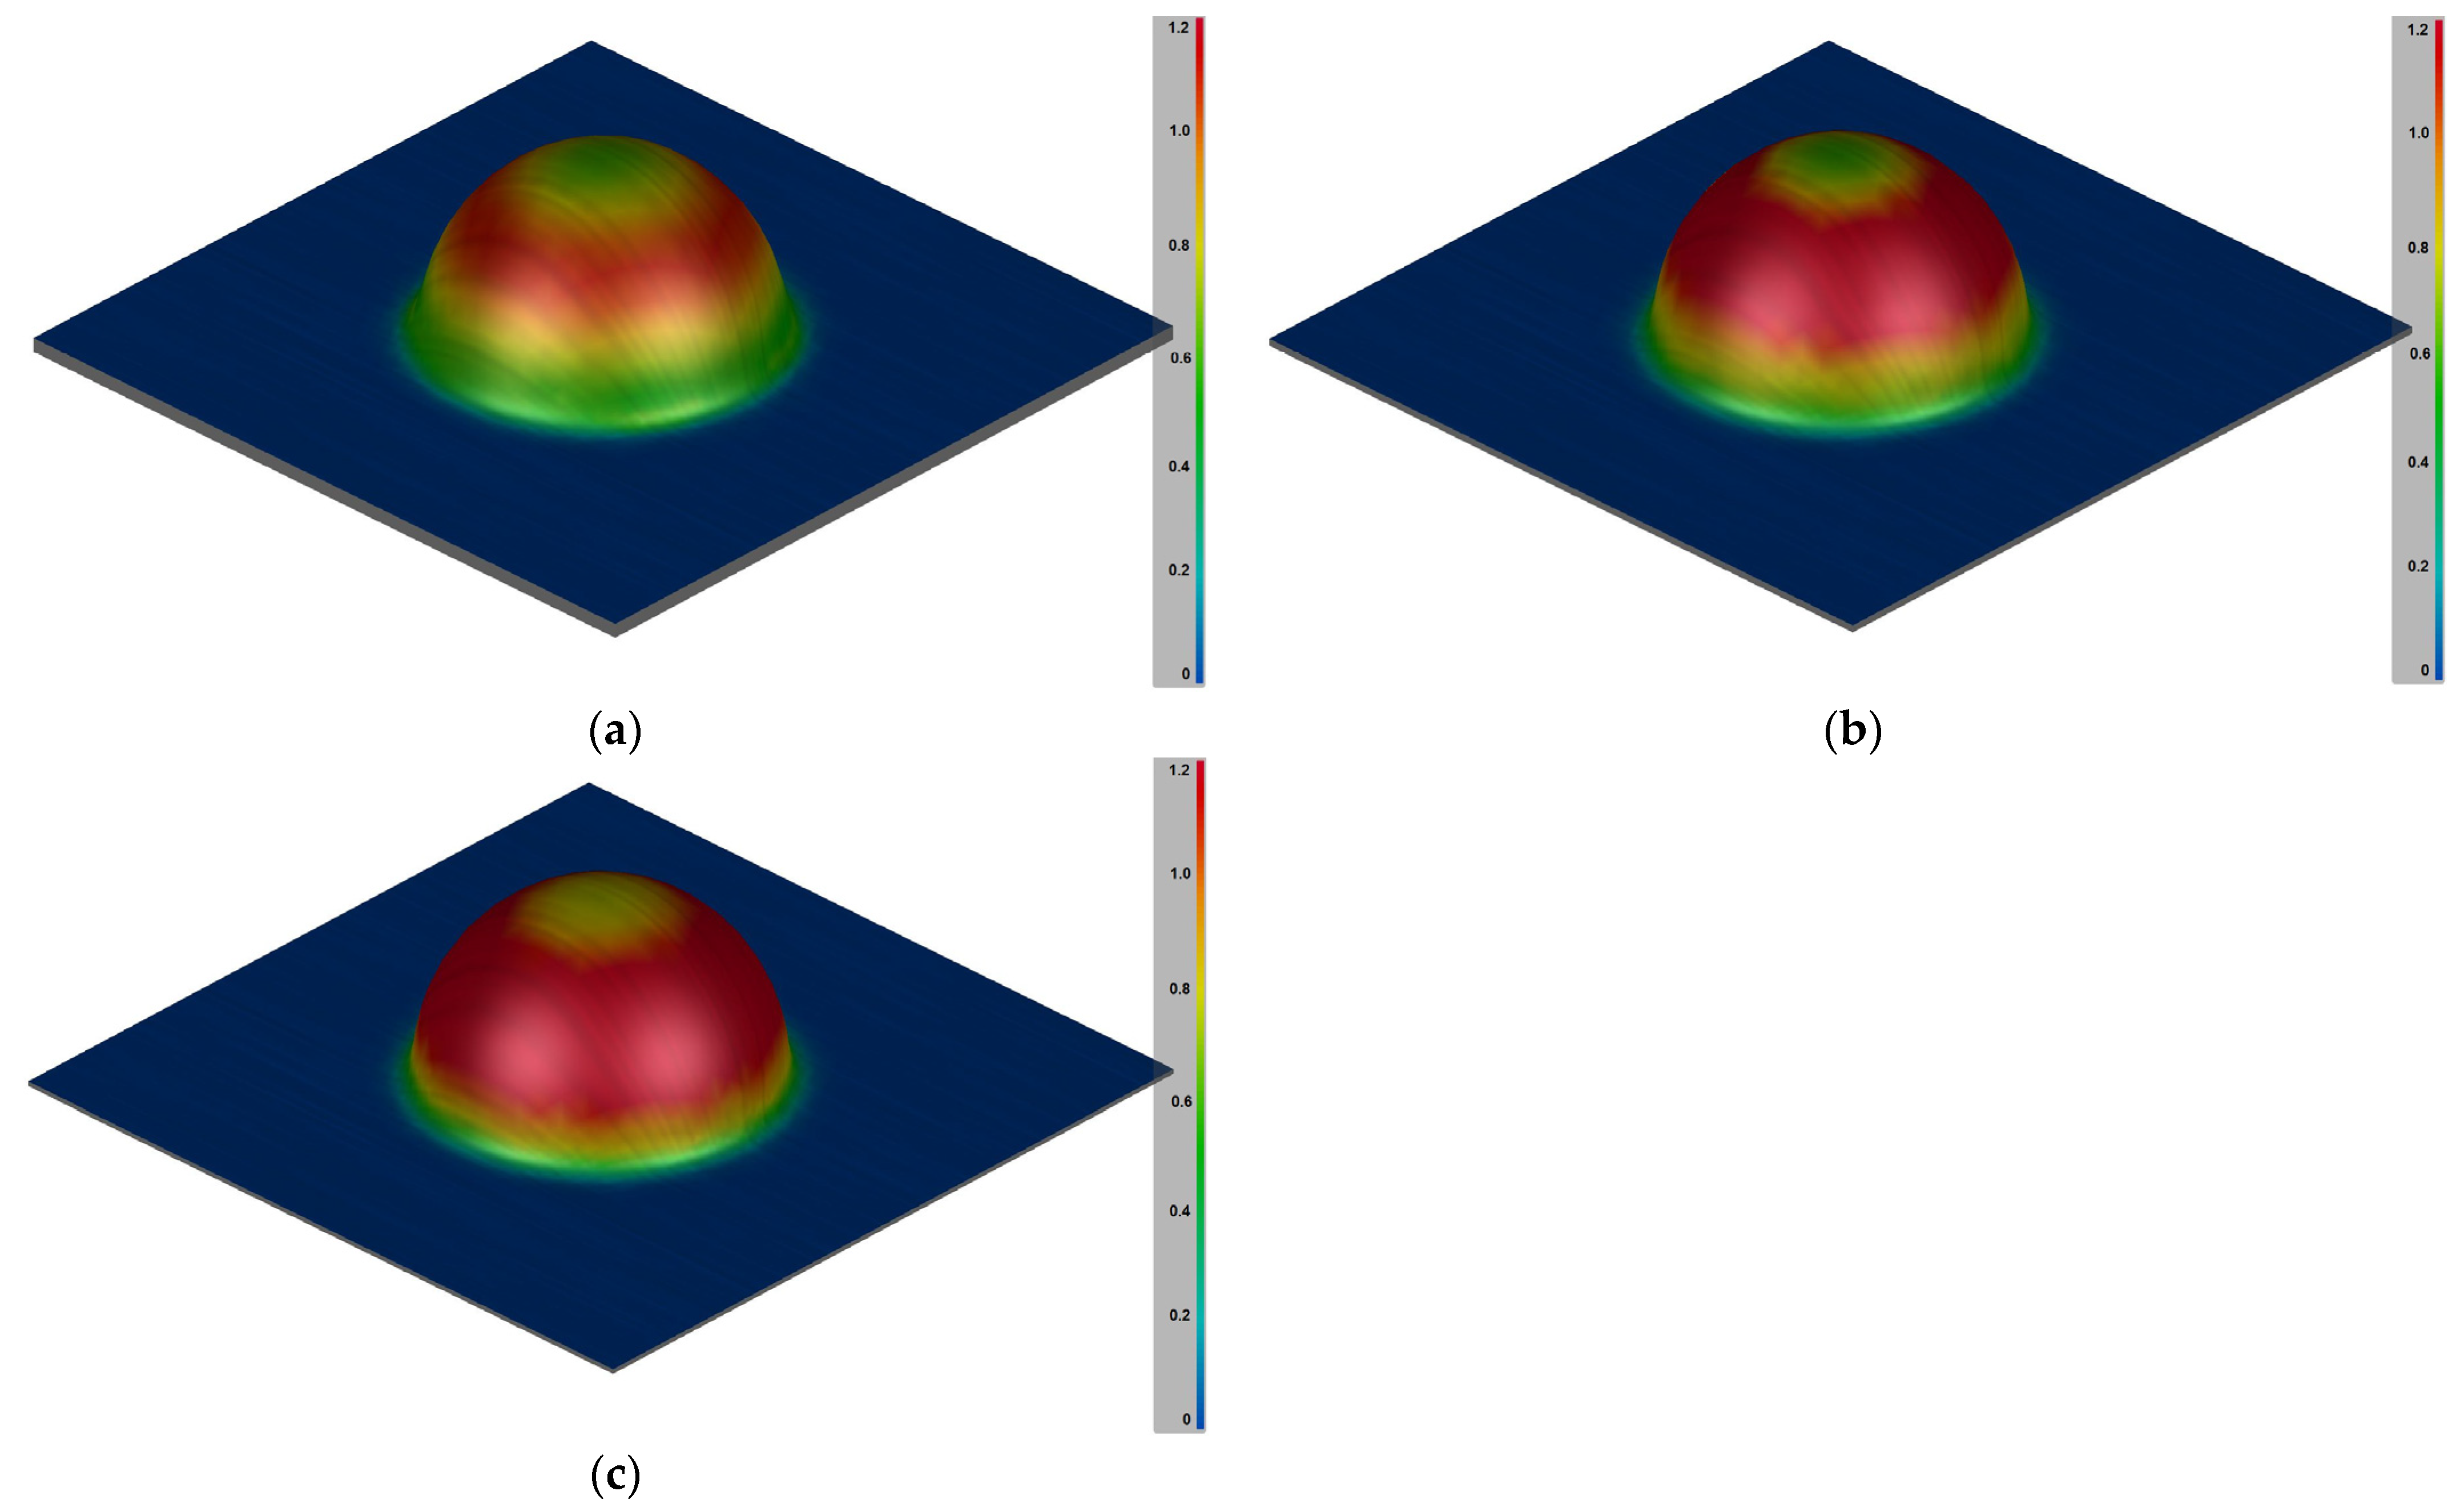
The max failure value signifies the magnitude of formed part failure in percent (Figure 10). Color scale represents a value between 0 and 1 and serves to easily identify problems when deep drawing sheet metal parts. Breaching value 1 is considered a serious failure which leads to the complete bursting of the formed part. Each point can be inspected separately, and a problem can be identified. A single result of the simulation does not indicate a serious problem, which is why entered conditions matter. For example, the value of maximum failure can exceed the preset limit (commonly 0.8), if the value of sheet metal thinning is below the limit. In this case, a closer examination of the problem in a given point must be conducted.
Method LDH, which was specifically used in this research, does not lower the failure value, but it takes less area. The decrease in area enables the usage of bead elements which promote better deep drawing of complex shapes without causing failures or creating bursting. Better results were reached in sheet metals with bigger thickness, in which the volume of material prevents failures.
There was growth in dangerous area found in sheet metal with thickness 1 mm, which was measured with same conditions and settings as previous samples. The value of maximum failure reached 1.2.

3.2.3. Thinning

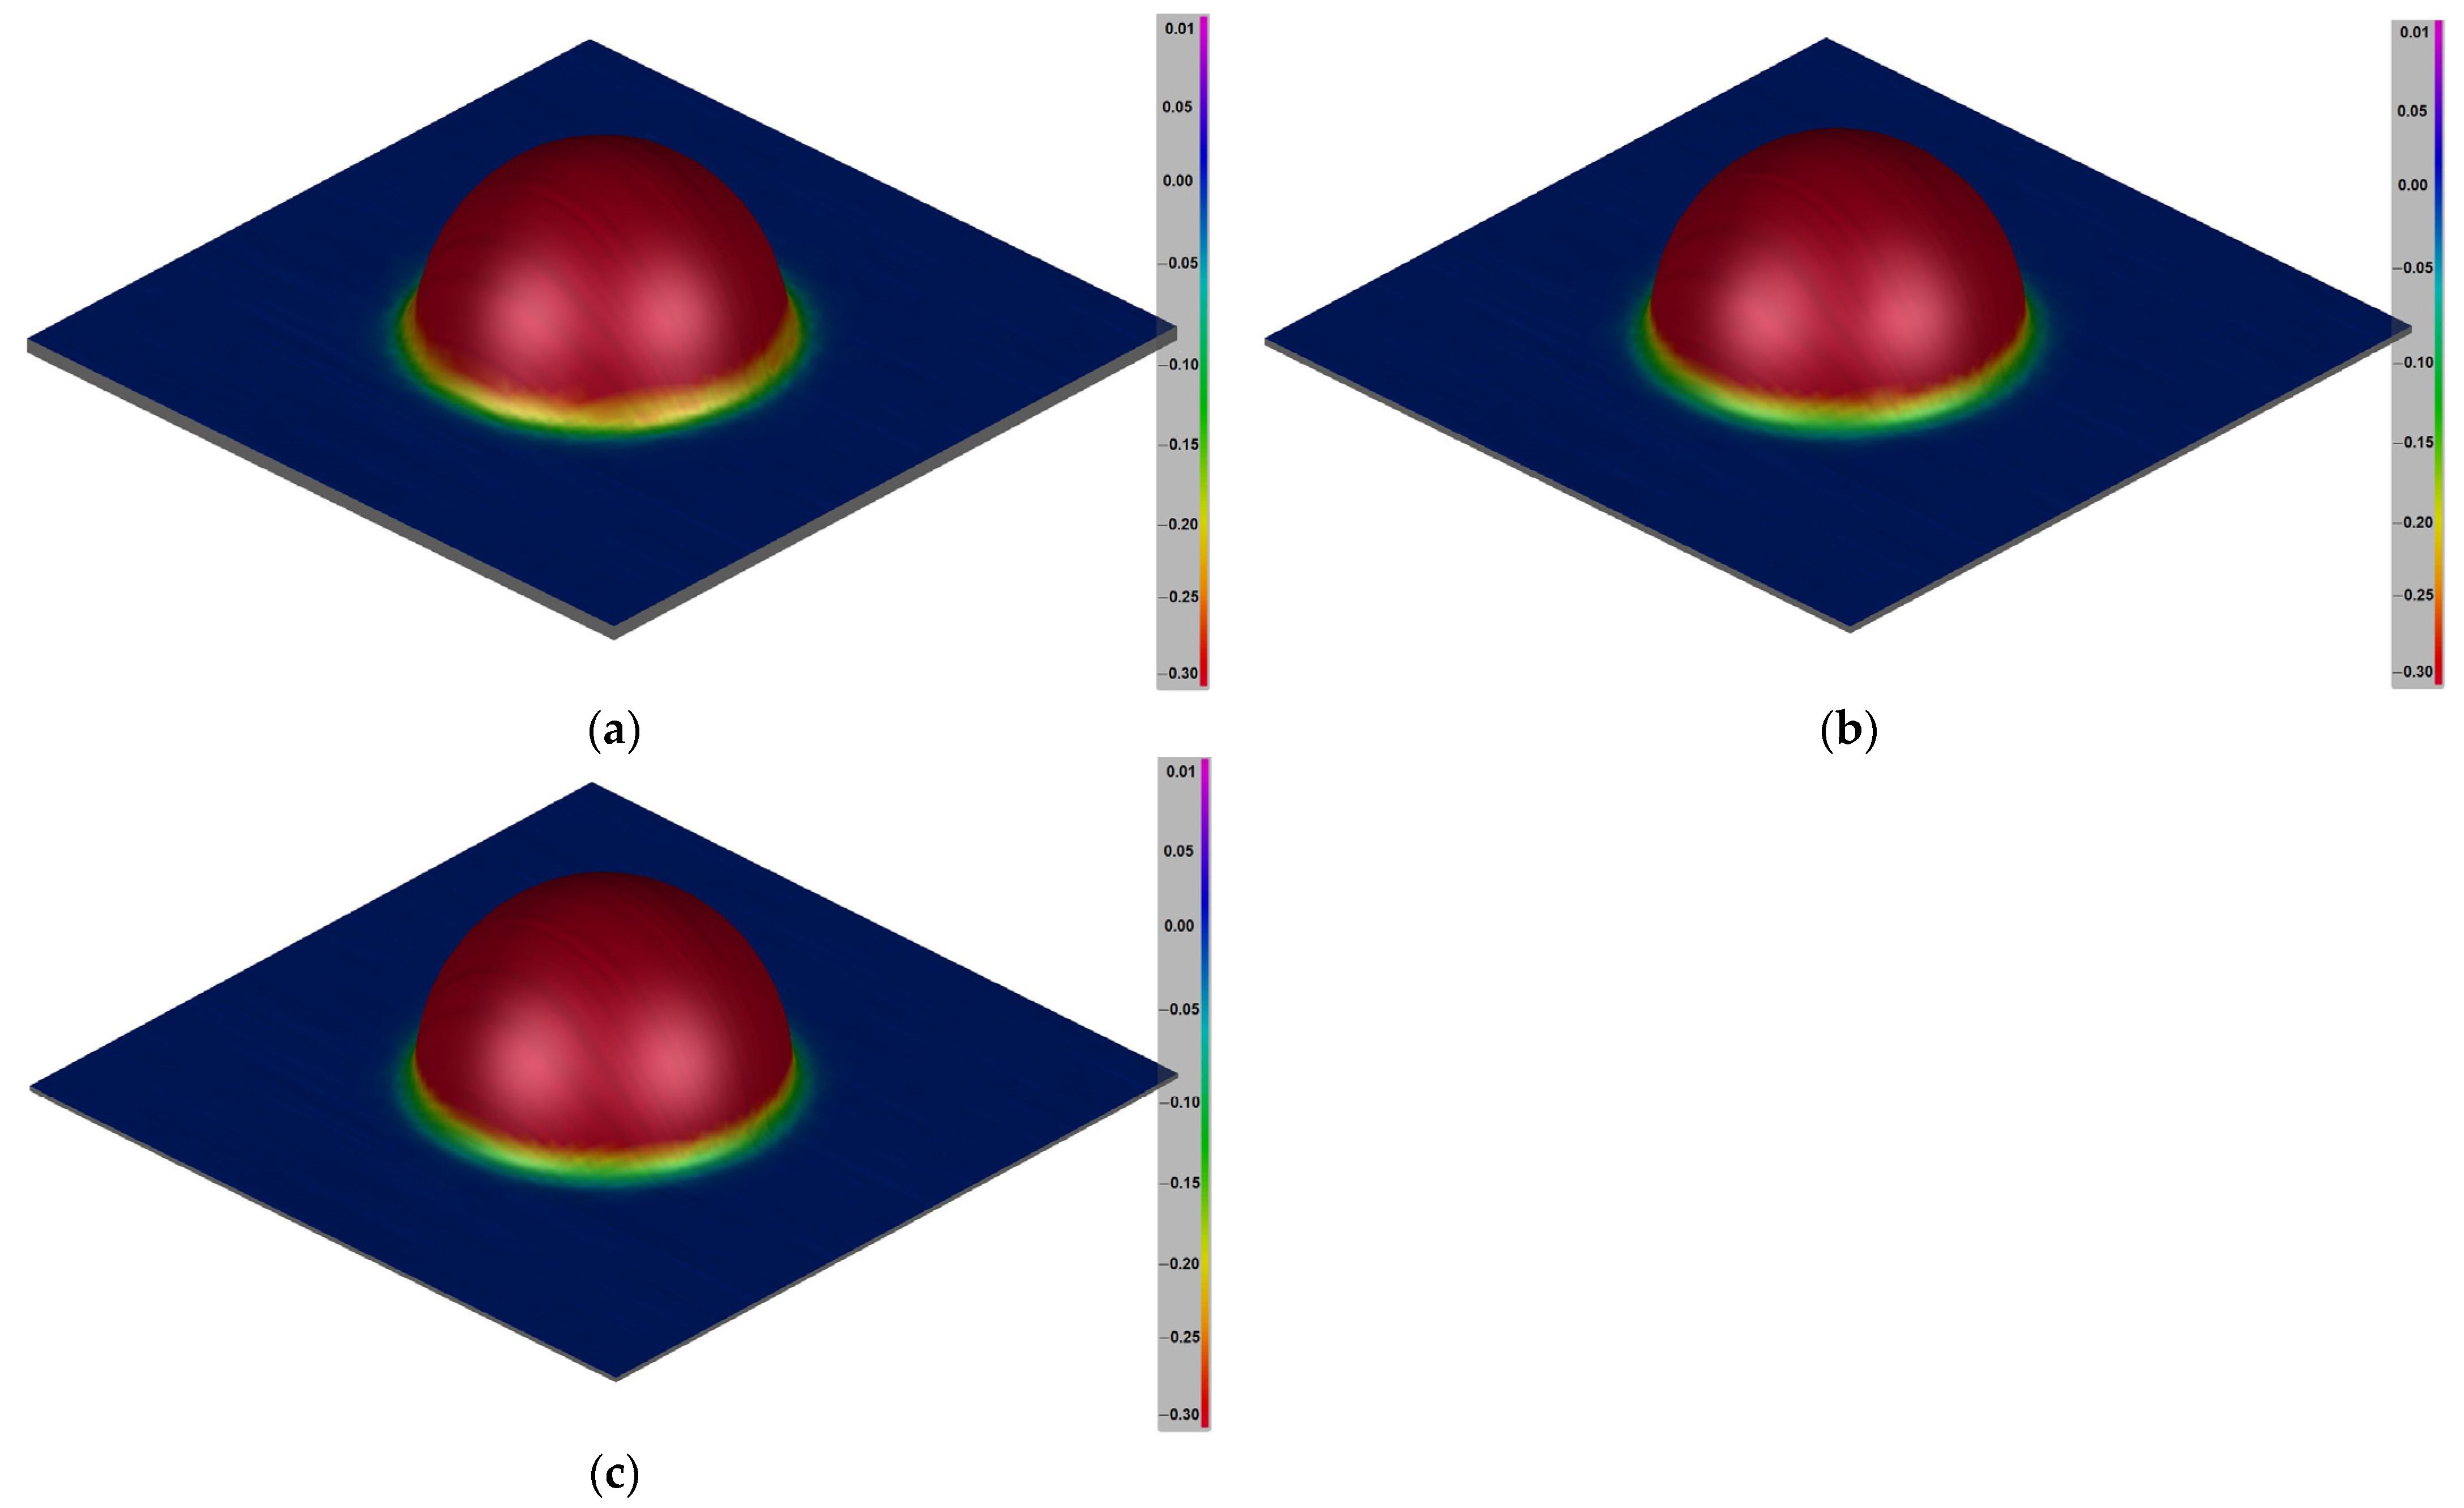
Correct setup of the simulation can provide results that represent sheet metal thinning at individual points caused by deep drawing. The micro-mechanical properties determine the material’s tendency to deform and work hardening (Figure 11). The sheet metal part which underwent thinning will not only exhibit strength that is lower than required, but also fail to fulfill the desired function. The thinning parameter needs to be watched during the process, in order to produce quality parts without failures. Thinning is characterized by a color scale with values that represent percentage thinning of sheet metal thickness. Simulation comes from the FEM model, which is composed of individual elements. In order to easily identify problems, the points in the molded part are marked in color according to their rate of thinning.
In the case of the LDH method, the thinning was 30% for sheet metal with 3 mm thickness. Several points with values approximating 0.3 were examined. Sheet metal with 1.5 mm thickness was similar to that with 3 mm thickness, only with a difference in thinning value (maximum is 30% out of the sheet metal thickness).
The thinning parameter was the same for individual sheet metals tested by the LDH method. The difference was found only in the ratio of thinning value to sheet metal thickness.

3.3. Deep Drawing of Sheet Metal by LDH Method

Sheet metals with varying thicknesses were examined on BUP–600. These samples can be seen in Figure 12. Each sheet metal had the following parameters evaluated: maximum force Fmax, maximum break force Fbreak, and trajectory length to break Travelbreak.
Table 4 shows the deep drawing results for different sheet thicknesses. The highest draw depth and maximal force were shown by the 3 mm thickness. The maximal deep drawing value was 11.7 mm, after which the formed part bursts. The maximal value of force was 30.4 kN. The maximal force for sheet metal with 1.5 mm thickness was 22.8 kN. The size of the formed part decreased after bursting to 11.2 mm. The lowest values of deep drawing were found in sheet metal with a thickness of 1 mm, where the trajectory length was 10.6 mm, while the load was 18.6 kN. Different process conditions of deep drawing cause a change in individual parameters, which makes it necessary to design the entire deep drawing process without any defects.
The output of sheet metal testing on BUP–600 is data containing loading force and trajectory length. A visualization of these data can be seen in Figure 12. Throughout the course of testing, the samples are subjected to deep drawing and increasing application of force. Application of maximum possible load leads to sheet metal failure and a decrease in loading force to a value of zero. Individual courses of force were similar but differed in magnitude of loading force and trajectory length of deep drawing. Figure 13 shows a realistic deep drawing of sheet metals by the LDH method for three sheet thicknesses.

3.4. Mico-Mechanical Properties

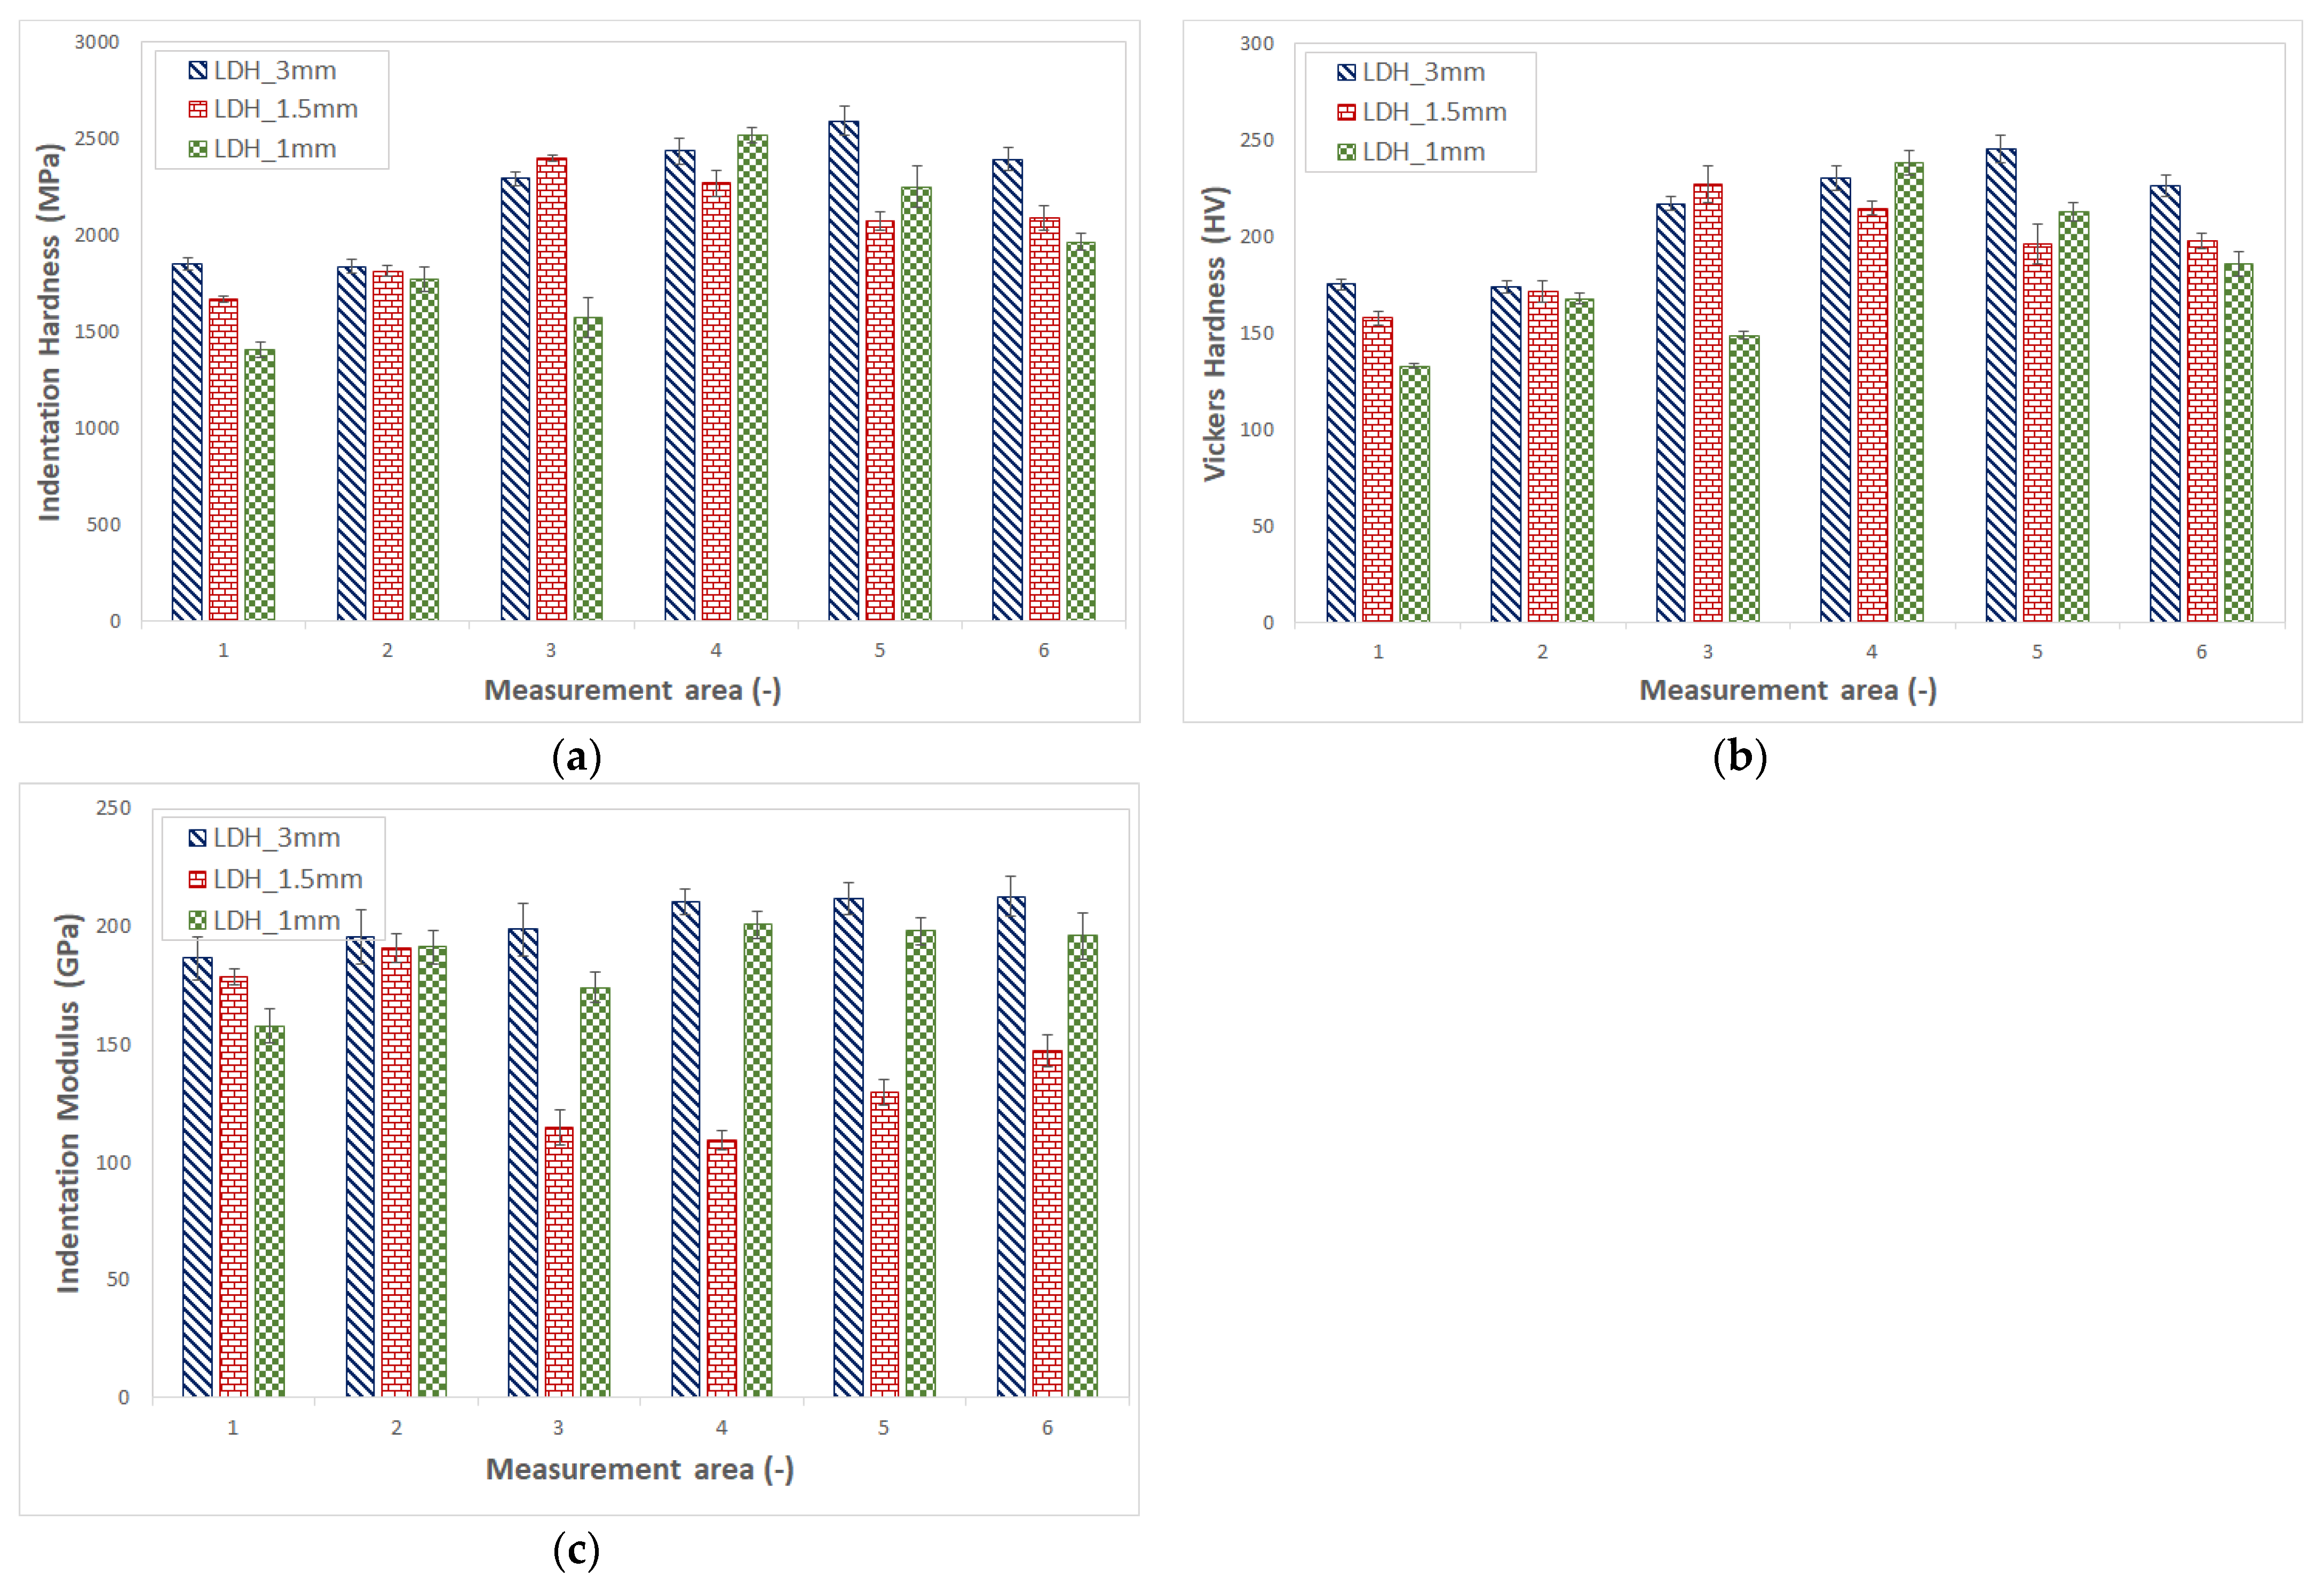
Measuring of micro-mechanical parameters was carried out by the Oliver–Pharr method, which was used to gain micro-mechanical properties from data obtained during indentation. The first evaluated micro-mechanical property was indentation hardness, which can be seen in Figure 14a. Hardness characterizes the resistance of a material against the indenting body.
Area 1 represents the point before the bead element, up to which no significant change to micro-mechanical properties of sheet metals can be observed. Indentation hardness is affected by sheet metal production and its thickness. The cold rolling process causes an increase in hardness, a change in the grain shape, and the creation of deformation bands in the sheet metal. The increase in hardness is caused by the effect of deformation strengthening. This phenomenon occurs when the mobility of dislocations is limited due to the doubling of dislocations. Indentation hardness increased in the area of bead element, especially in sheet metals with lower thickness. Sheet metal with 3 mm thickness was observed to have decreased indentation hardness. Hardness in the bead groove area was the same for all sheet metals independent of their thickness. Area 3 represents the beginning of deep drawing as well as the area behind the bead element. Sheet metal with 1 mm thickness had its hardness reduced due to deep drawing. Sheet metals with higher thicknesses in this area had their hardness significantly increased. Sheet metal with 1.5 mm thickness was observed to have the highest hardness in relation to all measured areas. The measurements for sheet metals with 1.5 mm thickness show that the area behind the bead element can be considered as most dangerous. Area 4 describes the course of forming tool deep drawing and demonstrates the highest increase in hardness for sheet metal with 1 mm thickness. According to the simulation, this was the most dangerous area vulnerable to formed part bursting. Sheet metal with 3 mm thickness had another increase in hardness, which peaked in area 5. The examined area of the top of the formed part, designated by position 6, shows a decrease in indentation hardness value in comparison with the previously evaluated area. Evaluation of measured values corresponds with dangerous areas of the simulation, so it is necessary to pick the correct material, appropriate thickness of the sheet metal, and deep drawing conditions.
The highest change in indentation hardness was found in sheet metal with 1 mm thickness. On the other hand, this thickness was the least suitable for the chosen process conditions of deep drawing due to expected bursting. The difference between the unaffected area (area 1) and the most critical area during deep drawing (area 4) was 45%. This significant reinforcement is complemented by possible bursting in critical points. The difference in hardness for sheet metals with 3 mm thickness was up to 86%.
Aside from indentation hardness, it is possible to gain Vickers hardness, which is commonly used in technical practice (Figure 14b). Courses of measured values for Vickers and indentation hardness are similar. Area 1, describing sheet metal before the bead element, shows the lowest values of micro-hardness in relation to other measured points of the deep drawing part. The point with the bead element had slightly lower Vickers hardness in sheet metals with 3 mm thickness, while sheet metals with other thicknesses had increased hardness. Values of Vickers hardness are quite similar for sheet metals with all thicknesses in area 2. The highest value of Vickers hardness was found in sheet metal with 1.5 mm thickness in area 3 (same as with indentation hardness), but following this area, the Vickers hardness decreased. The maximal value (sheet metal with 1.5 mm thickness) was 227 HV. Once again, there was an expected bursting in area 3 during deep drawing. Sheet metal with a thickness of 3 mm reached maximum Vickers hardness in area, which is in agreement with the simulation. The dangerous area in the simulation corresponds with a local increase in hardness during sheet metal deep drawing. The highest Vickers hardness was 245 HV.
Vickers hardness in sheet metal with 1 mm thickness decreased in the area behind the bead element (area 3) but increased during the beginning of deep drawing (area 4). The simulation shows the highest value of failure in this area, which corresponds with real results. Throughout the course of the next deep drawing, the hardness decreased.
Another important parameter describing the micro-mechanical properties of the material is the indentation modulus. Indentation elastic modulus is a material constant that represents the stress required to reach specific deformation. With the increasing value of elastic modulus, the stress required for the same deformation grows (Figure 14c).
Elastic modulus measured in sheet metals with 3 mm thickness was not recorded to change significantly. The lowest value (187 GPa) was measured in the area before the bead groove. The elastic modulus is basically the same for all three thicknesses at the bead element area. Beyond the bead element, the modulus increased and then remained constant with the following deep drawing. A bigger amount of material, in the form of greater thickness, affects the elastic modulus minimally. The process of deep drawing had no effect on the elastic modulus. The elastic modulus measured in sheet metal with 1 mm thickness beyond the bead element decreased from 191 GPa to 174 GPa. The deep drawing process saw the elastic modulus move between 201 and 196 GPa. The thickness of sheet metal caused a decrease in elastic modulus in less thick sheet metals. The most pronounced behavior difference was recorded in sheet metals with 1.5 mm thickness. Translation from area 1 to area 2 led to an increase in elastic modulus, while it rapidly decreased in areas 3 and 4. Further areas saw an increase in elastic modulus. And so, sheet metal with 1.5 mm thickness seems to be inadequate for the deep drawing process with these settings, because of the significant decrease in elastic modulus and micro-mechanical properties. The decrease in elastic modulus was influenced by sheet metal thinning and the creation of deep drawing, which led to bursting in critical areas.
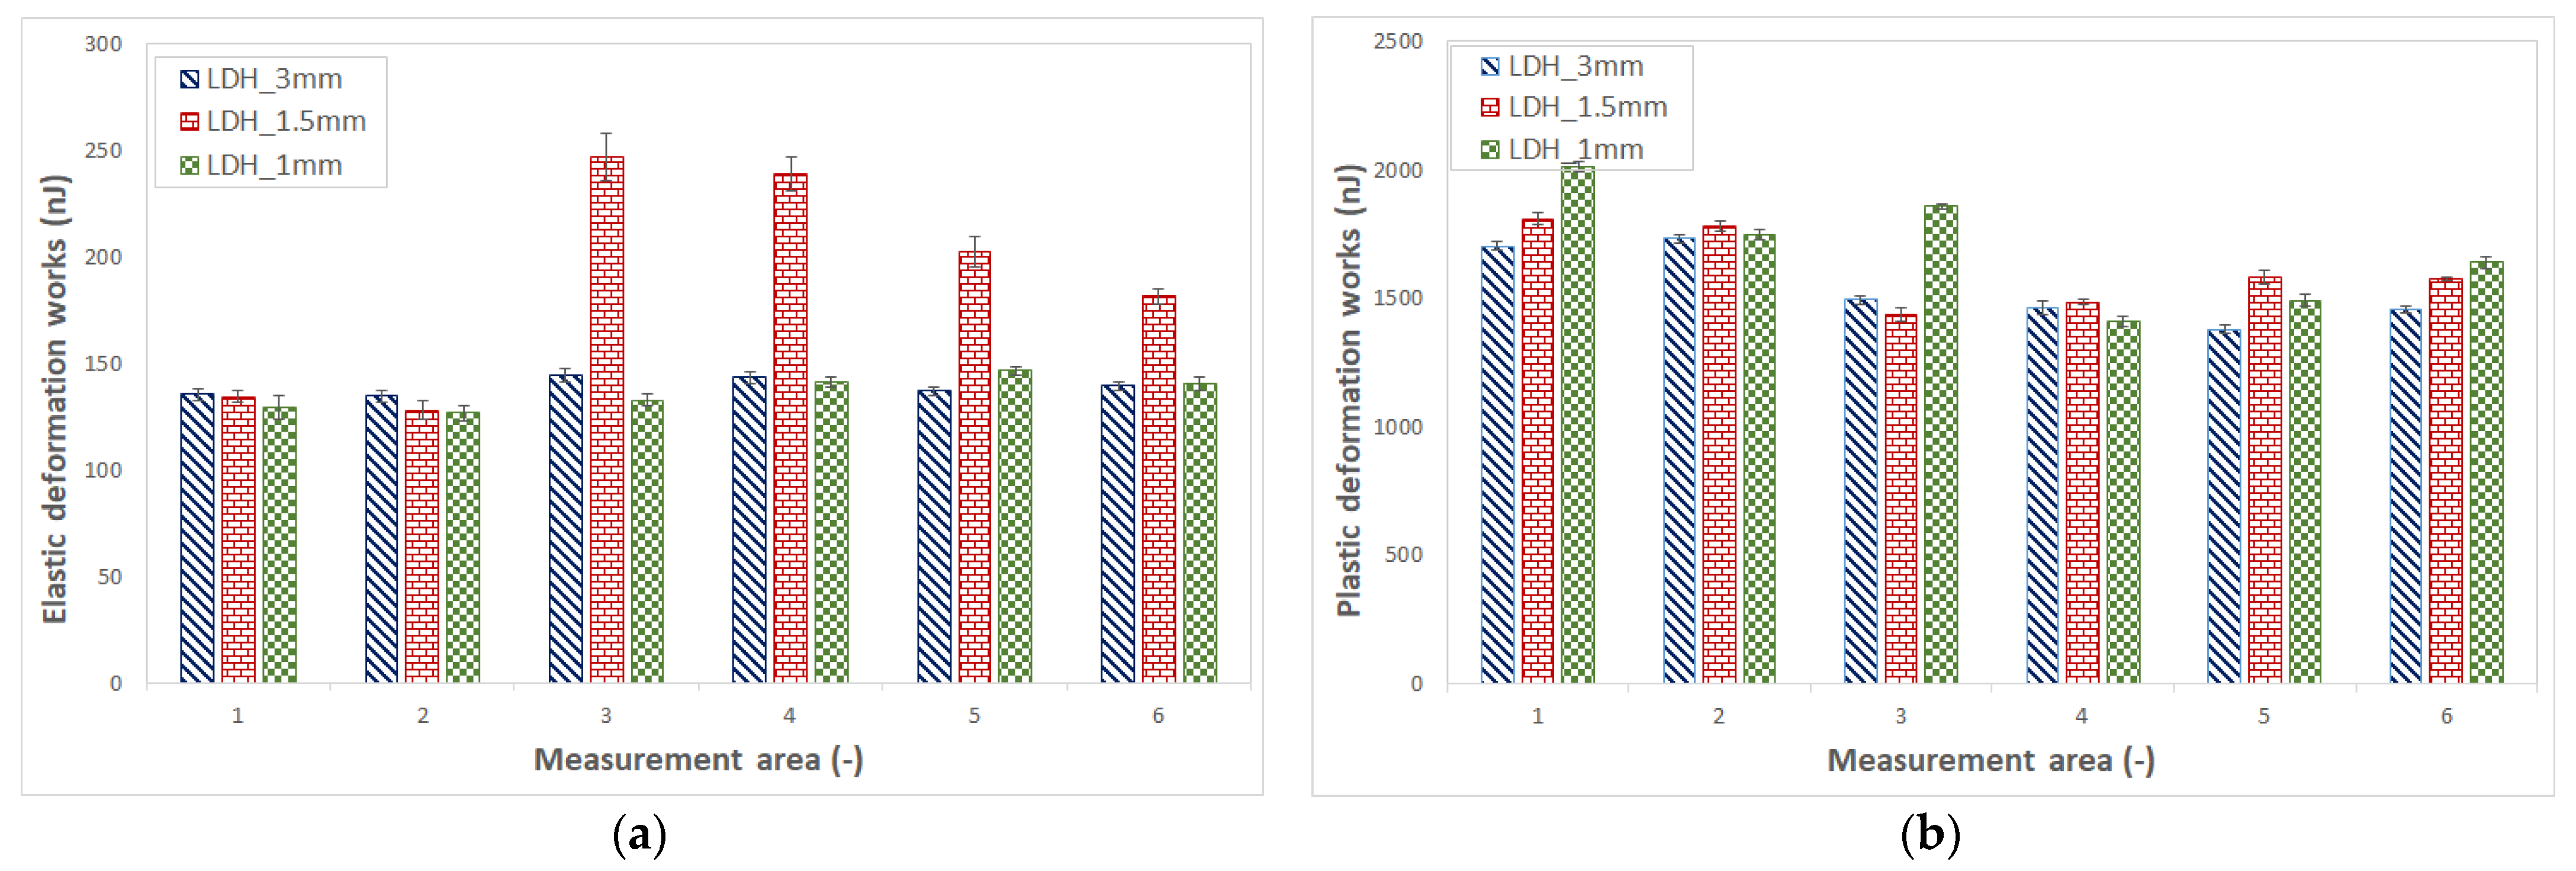
The elastic parts of the work (Figure 15a) representing the indentation process in sheet metals with 1 and 3 mm thickness are similar to each other. No substantial changes in the elastic part of the work were detected in the observed areas. The lowest value of Welast for sheet metal with 3 mm thickness was measured in the bead groove area (132 nJ), while the highest value was found in the starting area of deep drawing behind the bead (144 nJ). The lowest value in sheet metal with 1 mm thickness was detected in the same area as in the previous sample. The highest value of Welast was measured in area 5 (146 nJ), which corresponds with the upper part of the deep drawing area. Sheet metal with 1.5 mm thickness displayed different behavior. The lowest value of elastic work was found in the braking area, as with previous cases, but the values in area three were almost twofold of the preceding area. Elastic components and results of hardness and elastic modulus confirm essential changes at the beginning of the drawing. Other considered areas were observed to have lower elastic work. Even then, values in different areas were higher than in previous samples.
The highest value of the plastic part of the indentation process’s work for sheet metal with 1 mm thickness was 2013 nJ (Figure 15b). Measured values were highest in area 1 (before bead) and area 3 (behind bead), where the highest value was 1858 nJ. Values of plastic work were lower during deep drawing but increased again towards the top of the formed part. Thickness measurements for this sheet metal showed the highest values in the area before the bead element, which were followed by values at the bead. Wplast values decreased to 1437 nJ following the bead element, which was the lowest measured value for sheet metal with 1.5 mm thickness. Among the individual sheet metals, the lowest values of plastic work were measured in sheet metal with the highest thickness. The measured maximum at the bead area was 1731 nJ. Other measured areas had lower plastic work. The last evaluated point at the top of the formed part displayed slightly elevated values of Wplast. These measurements indicate higher values of Wplast for thin sheet metals, while sheet metals with higher thickness reached lower values of plastic work.
Overall, mechanical work of the indentation process can be divided into plastic and elastic work. The elastic part of the work is considered as residual work spent during the deloading process. This part of the work describes elastic deformation, which disappears after the load is lifted. On the other hand, the plastic part of the work stays in the form of an indentation mark with specific depth.
The problem of deep drawing of sheet metals by the LDH method and the effect of this technology on micro-mechanical properties were investigated only by a handful of studies. These studies often investigated the process of stamping by the LDH method with no consideration of the influence of the area of deep-drawn products on the micro-mechanical properties. Authors of [37] conducted a numerical investigation on the influence of the variability of mechanical properties of sheet metals with the occurrence of suspension of the system and maximum thinning on the process of sheet metal forming. Authors of [38] dealt with the problematic influence of process parameters on thinning of thickness and mechanical properties of deep drawing parts. The results show that the maximum velocity of thinning was decreasing with increasing magnitude of thinning and bigger tools. Furthermore, in comparison with the original sheet metal, the values of hardness, yield strength, and tensile strength increased due to deformation strengthening. A similar problem, i.e., the influence of sheet metal forming on mechanical properties, was also investigated in the following research papers [39,40], which focused on the methodology of numerical simulation in comparison with the mechanical properties. All provided publications taken in the context of this work confirm the influence of deep drawing on mechanical properties.
The issue of numerical simulation of the deep drawing process in AutoForm software was also investigated in [41,42,43,44,45]. The provided results of simulations are in agreement with the results shown in this research paper.

4. Discussion

In this work, the deep drawing of sheet metal X8CrMnNi19-6-3 (1.4376) with thicknesses 3 mm, 1.5 mm, and 1 mm was described. The testing was carried out by the LDH method (limiting dome height), which was used to brake grooves using a forming tool with a diameter of 100 mm. The deep drawing was supplemented by simulation in AutoForm R8 software. The set parameters of the simulation approximated the real testing of sheet metals. The simulation was performed for each test, with respect to the used material, thickness of sheet metal, and used drawing tools. Part of the evaluation was the parameters of maximal failure (max failure), thinning, and shaping (FLD diagram). The results of the AutoForm simulation were in most cases close to the results of the real deep drawing process and can be used to predict the behavior of the real process in practice.
After the deep drawing, samples were prepared and specific areas of interest were pinpointed. The measuring strategy considered points before the creation of the formed part, at the point/behind the bead for the LDH method, the starting area of deep drawing, the duration of dome drawing, and the top of the formed part. In comparison with the effect of lubricant on the deep drawing process, a 1 mm sheet thickness was formed both without and with lubricant. As shown by the results of deep drawing without and with lubricant, the lubricant has a significant effect on the deep drawing of the sheet metal. Both the process analysis and formability test showed deeper draws with the application of lubricant and hence higher drawing force. The conditions of deep drawing were dependent on the application of lubrication, which led to a higher depth of deep drawing (10.6 mm) and higher maximum force (19 kN); the depth of deep drawing determined from the simulation was 10.4 mm. On the other hand, without lubrication, the reached depth was only 8.2 mm and the maximum force was 14 kN; the draw depth determined from the simulation was 8.6 mm. The difference in depth of deep drawing with the application of lubrication was 33%. The results indicate that these were the optimal conditions for deep drawing of sheet metal with 1 mm thickness: maximum deep drawing force 19 kN, velocity of deep drawing 0.5 mm/s, and force of retainer 40 kN. The results of deep drawing by LDH method testing show that the depth of deep drawing for sheet metal with 3 mm thickness was 11.7 mm at maximum force (30.4 kN). For sheet metal with a thickness of 1.5 mm, the measured depth of draw was 11.2 mm for 22.8 kN maximum force, while for the sheet metal with 1 mm thickness, the depth of draw was only 10.6 mm for maximum force 18.6 kN. The difference in magnitudes of maximum force for varying thicknesses of sheet metal was 63%. Lubrication for the deep drawing process is very important, as it leads to a reduction in the forces required, an increase in the depth of deep drawing, a reduction in tool wear, and defects on the deep drawing. By tamping the material in the formed area, a new surface is formed that is rougher than the original. As the deep drawing results have shown, frictional losses represent a 33% increase in deep drawing force, which leads to the fact that lubrication also results in energy savings. Lubrication is therefore intended to prevent the sheet metal from seizing at the tool contact surfaces, thus ensuring smooth pull-out walls.
Measuring of mechanical properties was carried out by instrumented hardness test DSI (depth sensing indentation). The DSI method can be used to obtain indentation hardness, Vickers hardness, elastic modulus, and elastic/plastic work of the process. Results indicate noticeable changes in micro-mechanical properties, such as indentation hardness, elastic modulus, and value of deformation work for the same material with varying thickness and different tools. The Vickers hardness demonstrated significant changes in individual points of the drawn part. These changes had an essential influence on the properties of the part manufactured by deep drawing. Area 5 (barely above the upper part of the sphere) showed the highest strengthening (245 HV) for sheet metal with 3 mm thickness. The difference between area 1 (unaltered sheet metal) and area 5 was 40%. The highest strengthening for sheet metal with 1.5 mm thickness was found in area 4 (at the middle part of the deep drawing), which demonstrated a hardness of 240 HV. The difference between unaltered sheet metal and this area was 85%. Lastly, for the sheet metal with 1 mm thickness, the highest strengthening was found in area 3 (radius), which demonstrated a hardness of 250 HV. This resulted in a difference of 56%. On the other hand, a decrease in micro-mechanical properties was observed for sheet metals of all thicknesses in area 6 (the upper part of a drawn product). Other measured properties (indentation hardness, indentation modulus, and deformation work) showed similar tendencies as Vickers hardness. The results of the FEM analyses in AutoForm showed critical areas (maximum failure, maximum thinning) on the drawn sheet metal, and these areas were reflected in the micro-mechanical property measurements, where an increase in micro-mechanical properties was observed in these areas. Thus, it can be concluded that FEM analysis can be used to predict not only the deep drawing process itself but also the increase or decrease in micro-mechanical properties in particular areas of the drawn sheet, which significantly expands the possibilities of using FEM analysis in practice. No single change to a parameter can influence the complex process of deep drawing, so it is important to think about the process in its entirety, including choice of material, sheet metal thickness, type of drawing machine/tool, and additional elements.
In any manufacturing process, it is necessary to observe all parameters that could lead to the creation of defects. The course of hardness and elastic modulus influence the future function of parts and any change to process parameters can negatively impact them. This work discusses individual changes in pinpointed areas and contemplates reasons for micro-mechanical property changes. The process of deep drawing has a significant influence on the final micro-mechanical properties of deep-drawn sheet metal. Each area of deep drawing demonstrated varying micro-mechanical properties, which can signify a critical point for products intended for practical use. These critical points could lead to subsequent bursting of the part in a real work environment. Thus, the simulation could be quite helpful for the prediction of critical areas and give the engineers a suitable method to deal with these problems right at the beginning.

5. Conclusions

In this work, the deep drawing of sheet metal X8CrMnNi19-6-3 (1.4376) with thicknesses 3 mm, 1.5 mm, and 1 mm was described. The testing was carried out by the LDH method (limiting dome height), which is used for bead grooves and uses a forming tool with a diameter of 100 mm. The results are summarized in the following sections:
  • As shown by the results of deep drawing without and with lubricant, the lubricant has a significant effect on the deep drawing of the sheet metal. The difference in depth of deep drawing with the application of lubrication was 33%. Lubrication for the deep drawing process is very important, as it leads to a reduction in the forces required, an increase in the depth of deep drawing, and a reduction in tool wear and defects on the deep drawing.
  • Measurements of the micro-mechanical properties at different points in the deep drawing sheet metal showed the effect of the deep drawing point on the Vickers hardness and elastic modulus. The difference in micro-mechanical properties was up to 85%. During sheet metal deep drawing, the micro-mechanical properties of the sheet metal are increased in critical areas, which is caused by the strengthening of the sheet metal (compaction) and thus a change in the structure. These areas can be partially predicted by FEM analyses.
  • Measured values were backed by simulation in AutoForm R8 software, which approximated the real process closely in most cases, where the height of the deep drawing and the characterization of the critical points corresponded to the drawing tests. Thus, it can be concluded that FEM analysis can be used to predict not only the drawing process itself but also the increase or decrease in micro-mechanical properties in particular areas of the drawn sheet, which significantly expands the possibilities of using FEM analysis in practice.
  • The deep drawing process is a complex issue, and a large number of parameters need to be monitored to avoid damage to the part. An important role is played by the influence of the lubricant, which has a positive effect on the reduction in friction and the increase in the deep drawing distance, and improves the economy of the whole process.

Author Contributions

Conceptualization, M.O.; methodology, M.O. and M.S.; formal analysis, M.B., M.R. and M.S.; data curation, M.O., M.B. and M.S.; writing—original draft preparation, M.O.; visualization, M.O.; project administration, M.O.; funding acquisition, M.S. All authors have read and agreed to the published version of the manuscript.

Funding

This article was written with the support of the project TBU in Zlin Internal Grant Agency: No. IGA/FT/2024/003.

Institutional Review Board Statement

Not applicable.

Informed Consent Statement

Not applicable.

Data Availability Statement

The data presented in this study are available on request from the corresponding author.

Conflicts of Interest

The authors declare no conflicts of interest.

References

  1. Wang, D. (Ed.) Handbook of Metal Forming Process; NY Research Press: New York, NY, USA, 2015. [Google Scholar]
  2. Dvorak, M.; Gajdos, F.; Novotny, K. Technologie Tváření: Plošné a Objemové Tváření, 5th ed.; Akademické nakladatelství CERM: Brno, Czech Republic, 2013. [Google Scholar]
  3. Boljanovic, V. Sheet Metal Forming Processes and Die Design; Industrial Press: New York, NY, USA, 2004. [Google Scholar]
  4. ČSN EN ISO 12004-2; Metallic materials—Sheet and strip—Determination of forming-limit curves—Part 2: Determination of forming-limit curves in the laboratory. 2nd ed. Czech Agency for Standardization: Prague, Czech Republic, 2021.
  5. Merklein, M.; Allwood, J.M.; Behrens, B.A. Bulk forming of sheet metal. CIRP Ann. 2012, 61, 725–745. [Google Scholar] [CrossRef]
  6. Groover, M.P. Fundamentals of Modern Manufacturing, 4th ed.; John Wiley: New York, NY, USA, 2011. [Google Scholar]
  7. Larsson, J.; Jansson, A.; Karlsson, P. Monitoring and evaluation of the wire drawing process using thermal imaging. Int. J. Adv. Manuf. Technol. 2019, 101, 2121–2134. [Google Scholar] [CrossRef]
  8. Ballikaya, H.; Savas, V.; Ozay, C. The limit drawing ratio in die angled hydromechanical deep drawing method. Int. J. Adv. Manuf. Technol. 2020, 106, 791–801. [Google Scholar] [CrossRef]
  9. Hoffman, H.; Schuler. Metal Forming Handbook, 2nd ed.; Springer-Verlag: Berlin/Heidelberg, Germany, 2012. [Google Scholar]
  10. Bodhe, A.B.; Mandavgade, N.K.; Tajne, A. Selection of Blank Size for Deep Drawing of Rectangular Parts. In Smart Technologies for Energy, Environment and Sustainable Development; Springer: Singapore, 2019. [Google Scholar]
  11. Hirayama, S.; Iwai, H.; Tanimoto, Y. Mechanical evaluation of five flowable resin composites by the dynamic micro-indentation method. J. Dent. Biomech. 2014, 5, 1758736014533983. [Google Scholar] [CrossRef] [PubMed]
  12. Hufnagel, T.C.; Schuh, C.A.; Falk, M.L. Deformation of metallic glasses: Recent developments in theory, simulations, and experiments. Acta Mater. 2016, 109, 375–393. [Google Scholar] [CrossRef]
  13. Pouranvari, M.; Marashi, S.P.H. Critical review of automotive steels spot welding: Process, structure and properties. Sci. Technol. Weld. Join. 2013, 18, 361–403. [Google Scholar] [CrossRef]
  14. Idriss, M.; Bartier, O.; Mauvoisin, G.; Hernot, X. Determining the stress level of monotonic plastically pre-hardened metal sheets using the spherical instrumented indentation technique. J. Mech. Sci. Technol. 2019, 33, 183–195. [Google Scholar] [CrossRef]
  15. Sundararajan, G. Understanding dynamic indentation behaviour of metallic materials. Mater. Sci. Technol. 2012, 28, 1101–1107. [Google Scholar] [CrossRef]
  16. Huang, Z.-C.; Huang, G.-H.; Shan, F.-W.; Jiang, Y.-Q.; Zou, Y.-Q.; Nie, X.-Y. Forming quality and microstructure evolution of aa6061-t6 aluminum alloy joint during flow drill screwing process. Adv. Eng. Mater. 2023, 25, 2300054. [Google Scholar] [CrossRef]
  17. Tekkaya, A.; Karbasian, E.H.; Homberg, W.; Kleiner, M. Thermo-mechanical coupled simulation of hot stamping components for process design. Prod. Eng. 2007, 1, 85–89. [Google Scholar] [CrossRef]
  18. Lazarescu, L.; Nicodim, I.; Banabic, D. Evaluation of Drawing Force and Thickness Distribution in the Deep-Drawing Process with Variable Blank-Holding. Key Eng. Mater. 2015, 639, 33–40. [Google Scholar] [CrossRef]
  19. Carleer, B.; Burchitz, I.; Stippak, M. Systematic Drawbead Design; Zurich, Switzerland, 2019. [Google Scholar]
  20. Zaid, I.O. Effect of Different Lubricants on Deep Drawing of Galvanized Steel. Int. J. Sci. Eng. Res. 2017, 8, 1584–1589. [Google Scholar]
  21. Szpunar, M.; Trzepiecinski, T.; Zaba, K.; Ostrowski, R.; Zwolak, M. Effect of Lubricant Type on the Friction Behaviours and Surface Topography in Metal Forming of Ti-6Al-4V Titanium Alloy Sheets. Materials 2021, 14, 3721. [Google Scholar] [CrossRef] [PubMed]
  22. Dwivedi, R.; Agnihotri, G. Study of Deep Drawing Process Parameters. Mater. Today Proc. 2017, 4, 820–826. [Google Scholar] [CrossRef]
  23. Sahu, Y.K.; Pradhan, M.K. Modelling and Simulation of Deep Drawing Process of Circular Cup on AL1200 Using Finite Element Analysis. In Advances in Simulation, Product Design and Development; Springer: Singapore, 2020; pp. 29–42. [Google Scholar]
  24. Schreijag, S. Microstructure and Mechanical Behavior of Deep Drawing DC04 Steel at Different Length Scales, 18th ed.; KIT Scientific Publishing: Karlsruhe, Germany, 2013. [Google Scholar]
  25. Hu, P.; Ma, N.; Zhu, Y. Theories, Methods and Numerical Technology of Sheet Metal Cold and Hot Forming: Analysis, Simulation and Engineering Applications; Springer: London, UK, 2013. [Google Scholar]
  26. Ray, R.K.; Ghosh, P.; Bhattacharjee, D. Effects of composition and processing parameters on precipitation and texture formation in microalloyed interstitial free high strength (IFHS) steels. Mater. Sci. Technol. 2013, 25, 1154–1167. [Google Scholar] [CrossRef]
  27. Pereloma, E.; Timokhina, I. Bake hardening of automotive steels. Automot. Steels 2017, 259–288. [Google Scholar]
  28. Huang, G.; Sadagopan, S.; Schreier, H. Determination of Forming Limit and Fracture Limit Curves Using Digital Image Correlation. SAE Int. J. Mater. Manuf. 2014, 7, 574–582. [Google Scholar] [CrossRef]
  29. Uriya, Y.; Yanagimoto, J. Bore-expanding test for thermosetting carbon-fiber-reinforced plastic sheets. Int. J. Mater. Form. 2017, 10, 823–829. [Google Scholar] [CrossRef]
  30. Moore, P.; Booth, G. Mechanical testing of welds. In The Welding Engineers Guide to Fracture and Fatigue; Elsevier: Amsterdam, Netherlands, 2015; pp. 113–141. [Google Scholar]
  31. Muzyka, N.R. Influence if the Anisotropy of Materials on the Accuracy of Measuring of the Vickers Hardness. Strength Mater. 2007, 39, 211–218. [Google Scholar] [CrossRef]
  32. Chen, P.; Han, Q.; Ma, T.; Lin, D. The mechanical properties of shale based on micro-indentation test. Pet. Explor. Dev. 2015, 42, 723–732. [Google Scholar] [CrossRef]
  33. Li, W.; Liu, W.; Qi, F.; Chen, Y.; Xing, Z. Determination of micro-mechanical properties of additive manufactured alumina ceramics by nanoindentation and scratching. Ceram. Int. 2019, 45, 10612–10618. [Google Scholar] [CrossRef]
  34. ČSN EN 10080; Stainless steels—Part 1: List of stainless steels. Publisher: Praha, Czech Republic, 2024.
  35. ČSN EN ISO 14577; Metallic materials—Instrumented indentation test for hardness and materials parameters. Publisher: Praha, Czech Republic, 2003.
  36. Falsafi, J.; Demirci, E. Micro-indentation based study on steel sheet degradation through forming and flattening: Toward a predictive model to assess cold recyclability. Mater. Des. 2016, 109, 456–465. [Google Scholar] [CrossRef]
  37. Prates, P.A.; Adaixo, A.S.; Oliveria, M.C.; Fernandes, J.V. Numerical study on the effect of mechanical properties variability in sheet metal forming processes. Int. J. Adv. Manuf. Technol. 2018, 96, 561–580. [Google Scholar] [CrossRef]
  38. Li, Y.; Chen, X.; Zhai, W.; Wang, L.; Li, J.; Guoqun, Z. Effects of process parameters on thickness thinning and mechanical properties of the formed parts in incremental sheet forming. Int. J. Adv. Manuf. Technol. 2018, 98, 3071–3080. [Google Scholar] [CrossRef]
  39. Schmid, H.; Merklein, M. Study of the mechanical properties of sheet metals drawn through drawbeads. Manuf. Rev. 2019, 6, 14. [Google Scholar] [CrossRef]
  40. Xu, G.; He, J.; Lu, Z.; Li, M.; Xu, J. Prediction of mechanical properties for deep drawing steel by deep learning. Int. J. Miner. Metall. Mater. 2023, 30, 156–165. [Google Scholar] [CrossRef]
  41. Chrastansky, L.; Sanovec, J.; Martawirya, Y.Y.; Vales, M. Applicability Verification of Autoform Software for FEM Simulation of Mechanical Fixation of Hemmed Joints. Acta Polytech. 2019, 59, 554–559. [Google Scholar] [CrossRef]
  42. Ulibarri, U.; Galdos, L.; Argandona, E.S.; Mendiguren, J. Experimental and Numerical Simulation Investigation on Deep Drawing Process of Inconel 718 with and without Intermediate Annealing Thermal Treatments. Appl. Sci. 2020, 10, 581. [Google Scholar] [CrossRef]
  43. Bressan, J.D.; Cieto, J.C.; Vieira, F.H.; Bastos, L.S.B.; Rojas, P.A.M. A Numerical Simulation Study of Deep Drawing Testing and Experimental Results of Steel Sheets, Using a Comercial Software. Int. J. Mater. Form. 2010, 3, 231–234. [Google Scholar] [CrossRef]
  44. Bahanan, W.; Fatimah, S.; Go, J.H.; Oh, J.M.; Kim, M.J.; Kim, M.J.; Kang, J.H.; Kim, D.J.; Widiantara, I.P.; Ko, Y.G. A Finite Element Analysis of Cold Deep Drawing of Al Alloy Considering Friction Condition and Corner Design of Plunger. Lubricants 2023, 11, 388. [Google Scholar] [CrossRef]
  45. Trzepiecinski, T.; Szwajka, K.; Szewczyk, M. Pressure-Assisted Lubrication of DC01 Steel Sheets to Reduce Friction in Sheet-MetalForming Processes. Lubricants 2023, 11, 169. [Google Scholar] [CrossRef]
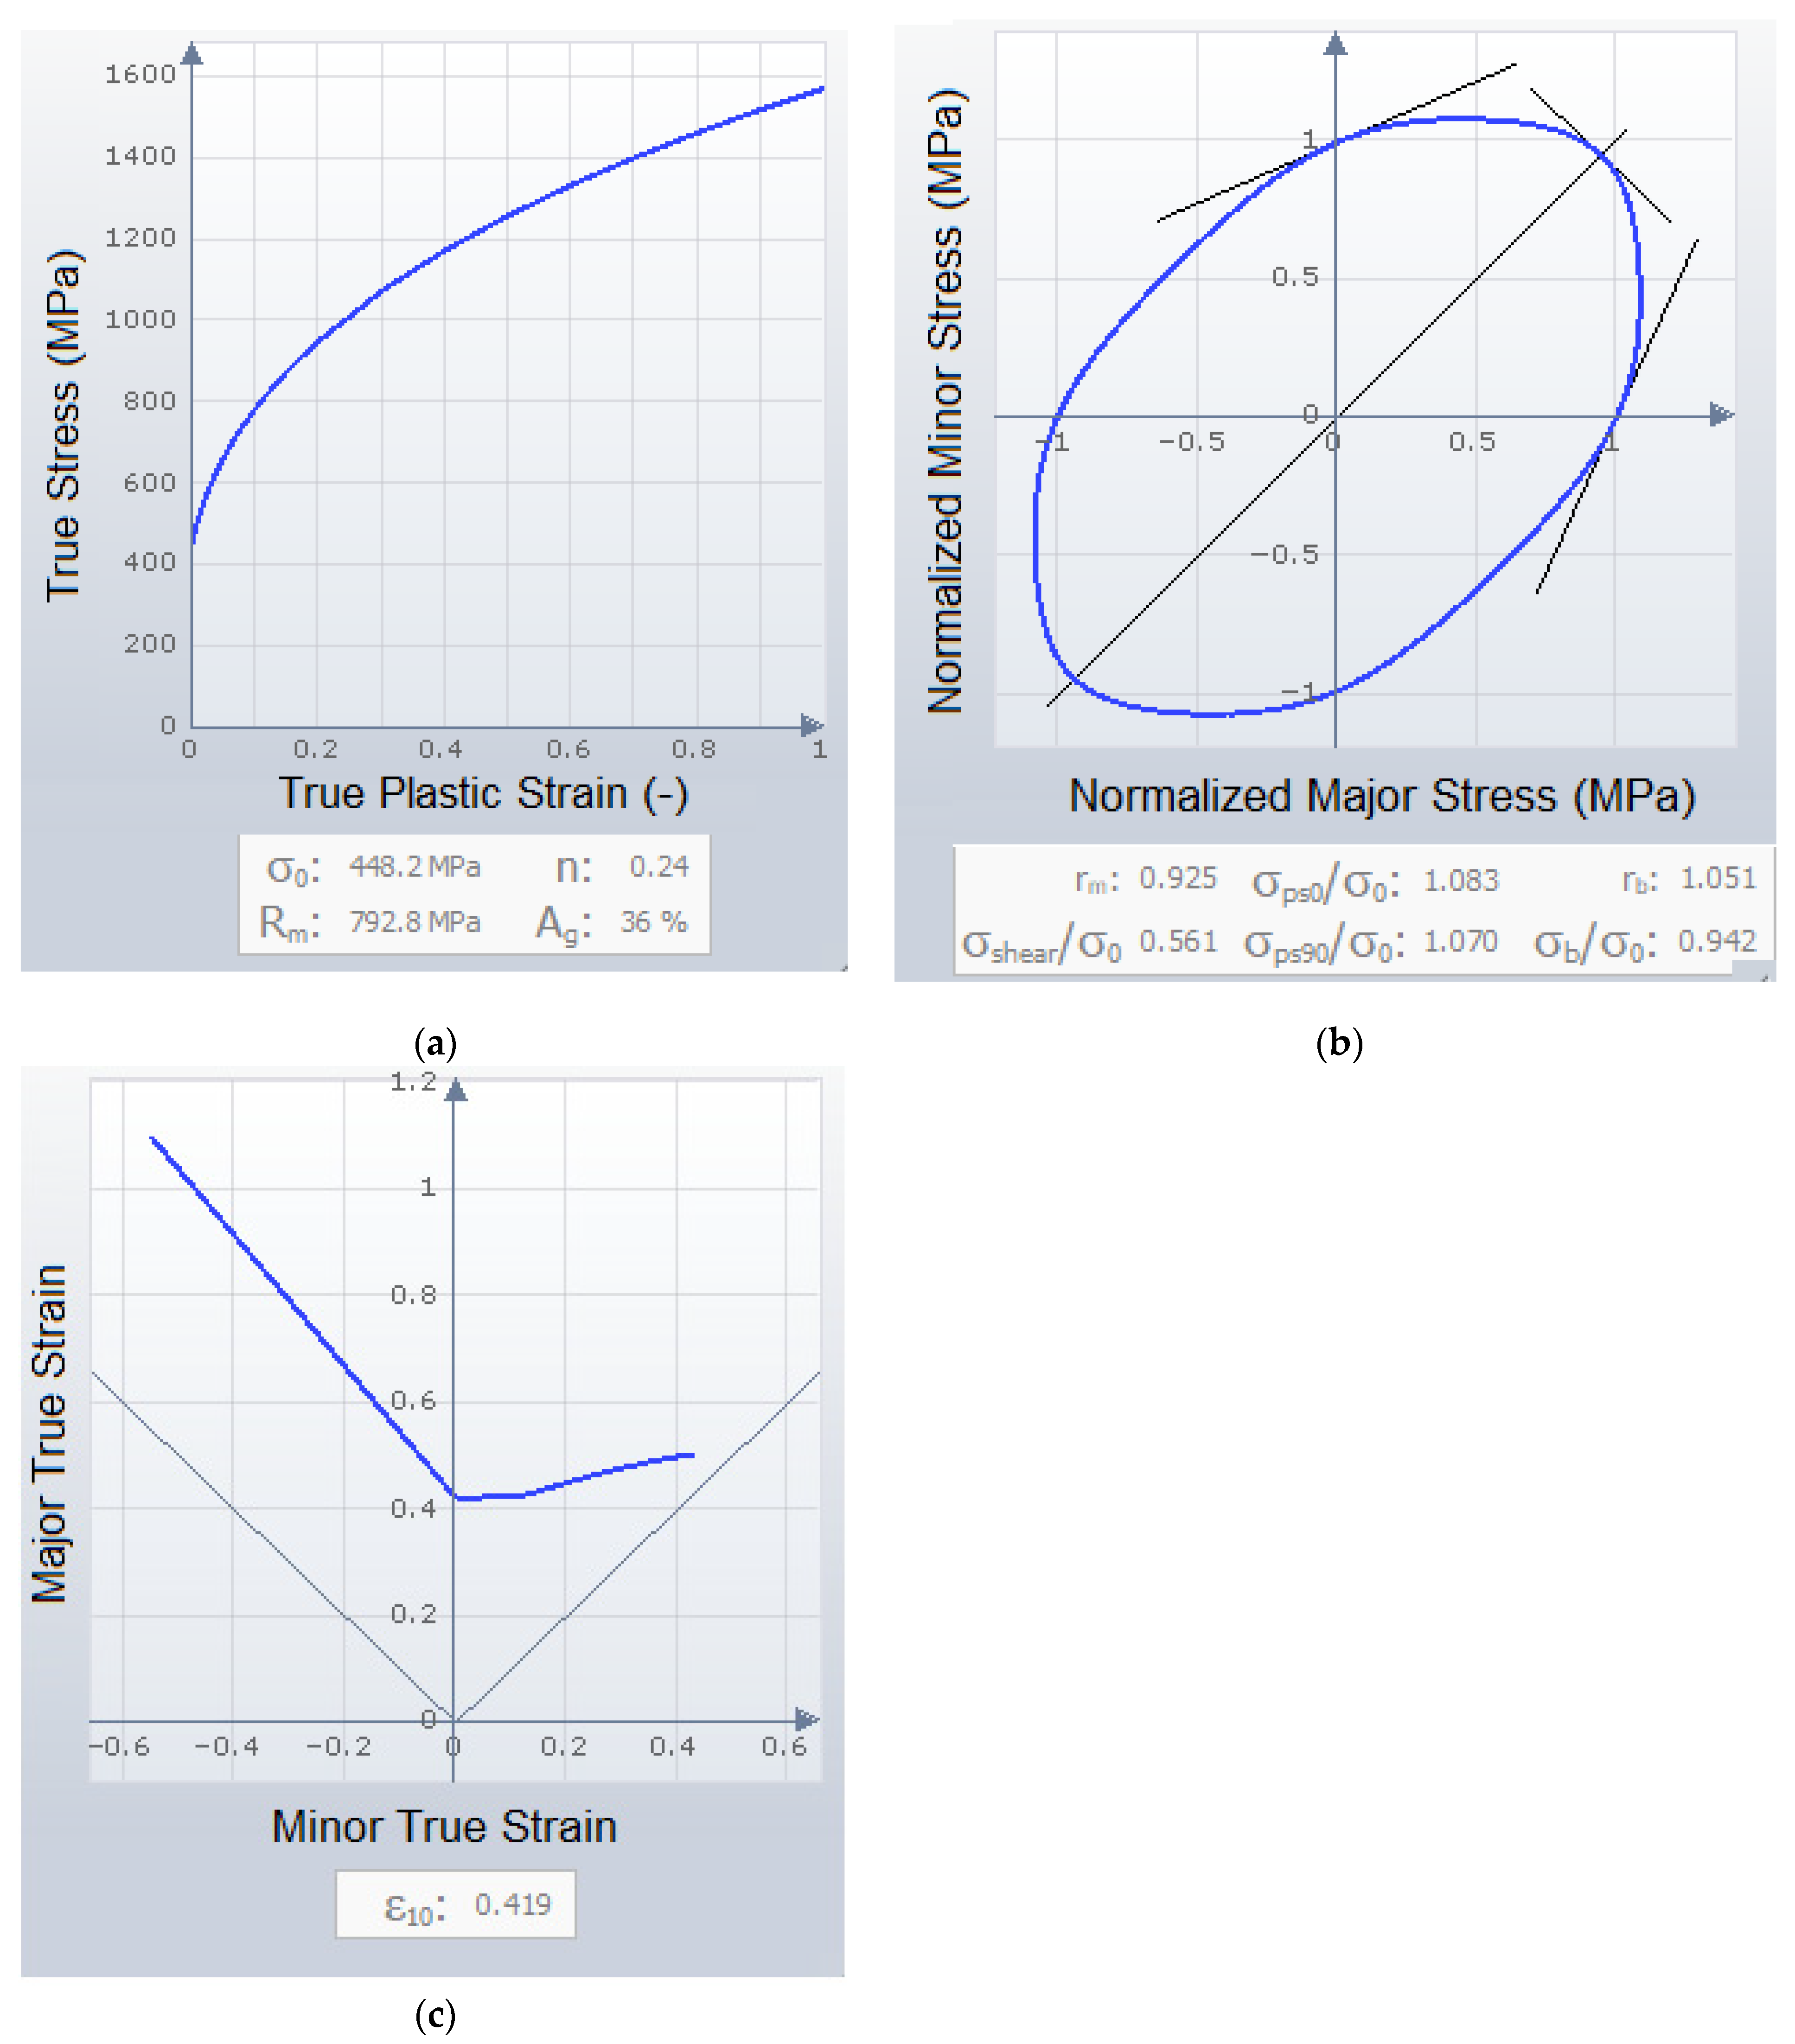
Figure 1. Material card: (a) hardening curve; (b) yield surface with BBC criterion; (c) Formability Limit Curve (FLC).
Lubricants 12 00260 g001
Figure 2. Setup design dimensions—Limiting Dome Height (FLD) test.
Lubricants 12 00260 g002
Figure 3. BUP–600 machines for testing of sheet metal deep drawing.
Lubricants 12 00260 g003
Figure 4. Grinded samples containing cut sheet metals.
Lubricants 12 00260 g004
Figure 5. Measured areas for LDH test: (a) scheme of the cutting plane; (b) individual segments.
Lubricants 12 00260 g005
Figure 6. Schematic representation of the indentation processes showing the decrease in the indentation depth during loading (according to Oliver and Pharr).
Lubricants 12 00260 g006
Figure 7. FLD diagram with visualization of deep drawing process—sheet metal thickness 1 mm: (a) FLD diagram—lubricant, (b) photo of deep drawing process—lubricants, (c) FLD diagram—lubricant-free, (d) photo of deep drawing process—lubricant-free.
Lubricants 12 00260 g007
Figure 8. Dependence of loading force of forming tool on trajectory length—lubricant and lubricant-free.
Lubricants 12 00260 g008
Figure 9. Forming limit diagram (FLD) with visualization of deep drawing process: (a) sheet metal thickness 3 mm, (b) sheet metal thickness 1.5 mm, (c) sheet metal thickness 1 mm.
Lubricants 12 00260 g009
Figure 10. Maximal failure of formed part: (a) sheet metal thickness 3 mm, (b) sheet metal thickness 1.5 mm, (c) sheet metal thickness 1 mm.
Lubricants 12 00260 g010
Figure 11. Thinning of formed part: (a) sheet metal thickness 3 mm, (b) sheet metal thickness 1.5 mm, (c) sheet metal thickness 1 mm.
Lubricants 12 00260 g011
Figure 12. Dependence of loading force of forming tool on trajectory length.
Lubricants 12 00260 g012
Figure 13. Photos of deep drawing by LDH method: (a) sheet metal thickness 3 mm, (b) sheet metal thickness 1.5 mm, (c) sheet metal thickness 1 mm.
Lubricants 12 00260 g013
Figure 14. Deep drawing by LDH method: (a) indentation hardness, (b) Vickers hardness, (c) indentation modulus.
Lubricants 12 00260 g014
Figure 15. Deep drawing by LDH method: (a) elastic part of deformation work, (b) plastic part of deformation work.
Lubricants 12 00260 g015
Table 1. Chemical composition (%) of steel X8CrMnNi19-6-3.
FeCSiMnCrNiN
71.40.080.47.016.54.50.10
Table 2. Preset parameters of BUP–600.
ParameterUnitValue
Force clampkN30
Speed cupmm/s0.5
FmaxkN100
Force punchkN70
Table 3. Technical data of SAF 125 N.
ParameterUnitValue
Appearance-Green/Blue
pH-8.3–8.5
Specific Gravity-1.01–1.03
Viscosity (ISO)cSt4
Table 4. Parameters of sheet metal deep drawing by LDH method.
Sheet Metal Thickness3 mm1.5 mm1 mm
Fmax (kN)30.422.818.6
Fbreak (kN)30.221.918.1
TravelBrake (mm)11.711.210.6
Disclaimer/Publisher’s Note: The statements, opinions and data contained in all publications are solely those of the individual author(s) and contributor(s) and not of MDPI and/or the editor(s). MDPI and/or the editor(s) disclaim responsibility for any injury to people or property resulting from any ideas, methods, instructions or products referred to in the content.