1. Introduction
The contact of hyperelastic solids like rubber is ubiquitous in everyday life and industrial production, encompassing applications such as tires, seals, cables, and more [
1]. It is worth noting that the nonlinear behavior of hyperelastic materials would be magnified by stress concentration due to microscale contacts and render the study of hyperelastic solid contact behavior significantly more complex. So far, investigating the impact of hyperelasticity on contact behavior represents a crucial challenge within academic fields [
2,
3,
4,
5].
Incorporating surface roughness into contact models presents a formidable challenge because of the intricate nature of the randomness and features across various scales. Currently, two primary characterizations of rough surface morphology prevail: statistical description and fractal description. In the early stages of research, Greenwood and Williamson [
6] proposed a classical statistical model to describe the contact behaviors between rough surfaces in 1966, known as the GW model. When the contact load is extremely small, this model is groundbreaking in establishing a linear relationship between the contact load and actual contact area by employing Hertz’s solution. However, the GW model assumes that surface micro-asperities are spherical and their heights follow a Gaussian distribution. In practical applications, many surfaces are non-Gaussian. Leighton [
7] processed non-Gaussian surfaces through wear experiments and demonstrated the variations of key surface topography parameters during the wear process. They indicated the necessity of the Gaussian model to enable its application to more practical rough surfaces. Based on the GW model, various statistical models have since emerged, each incorporating different hypotheses. These hypotheses include considerations for nonuniform asperities [
8,
9,
10], elliptical paraboloid asperities [
11], and anisotropic rough surfaces [
12]. The aforementioned models have made assumptions about the protrusion shapes and heights on rough surfaces, which clearly deviate from reality. Therefore, these models are difficult to accurately predict the contact behavior of rough surfaces. On the other hand, fractal descriptions can effectively mitigate the effect introduced by explanatory descriptions on the results. The fractal theory was initially proposed by Mandelbrot [
13], who discovered most rough surfaces in real life exhibited fractal characteristics. The fractal concept here is that surface roughness is composed of asperities (protuberances) that are overlaid with smaller asperities, and this pattern continues with even smaller asperities. The power spectral density (PSD) of an ideally self-affine surface exhibits a power–law correlation with the spatial frequency of roughness, with its exponent linked to the fractal dimension of the surface. Building upon fractal theory and using the entire power spectral density (PSD) of a surface, Persson derived the probability density function (PDF) solely for compressive pressure within a diffusion equation, presenting the closed-form solution as an infinite sum of sine functions [
14]. This approach, known as Persson’s theory of contact in tribology, adopts a probability-based perspective on contact mechanics. Recently, Wang [
15] adopted the Abbott-Firestone curve (cumulative distribution function) to represent the rough surface topography and put forward an incremental contact model for elastic and elastoplastic rough surfaces. This model was validated by the finite element method [
15,
16] (FEM) and experiments [
17], focusing on the relative contact area within the 15% range. These aforementioned contact theories could contribute to the realization of the mechanism of rough surfaces.
Besides morphology descriptions and contact mechanisms [
18,
19], the property of materials is one of crucial factors affecting the contact response [
20]. In many studies, FEM simulations offer an alternative and convenient method to investigate rough surface contact considering complex influencing factors [
21], for example the nonlinearity of materials. Song [
22], Zhang [
23], and Jiang [
24] studied the contact behaviors of rough surfaces by taking size dependence into account. Zhang and Yang [
25] noted that the indentation behaviors of hyperelastic spheres primarily depend on the combined influences of substantial deformation and material nonlinearity. Similarly, Lengiewicz [
26] emphasized that hyperelasticity introduces notable differences in the contact deformation process under high loads, as observed through FEM analysis. All these studies indicate that the nonlinearity of materials plays as a significant role in deformation. Hyperelastic materials are the most common materials and possess highly pronounced mechanical nonlinearity characteristics. Their hyperelastic properties as an essential factor cannot be ignored in the study of hyperelastic rough surface contact. By introducing the instantaneous tangent modulus
Et, Jiang [
27] extended the incremental contact model into the hyperelasytic materials and this extension was subsequently validated through FEM. However, this model has not been validated by conducting experiments.
Theoretical frameworks and numerical simulations offer expedient methodologies for investigating rough surface contact, while the progression of interfacial contact can also be elucidated through empirical observations. Physical technologies, such as the contact resistance method (thermal resistance [
28] or electric resistance [
29]), the acoustic method [
30,
31,
32], the third body method [
33,
34,
35], and the optical method [
36,
37,
38,
39,
40] can estimate the actual contact area by measuring the variations in specific physical quantities at the contact interface. The contact resistance method can estimate the size of contact patches by measuring the contact resistance and using the closed-form solution derived by Holm [
41]. The acoustic method is suitable for observing indirect contact between non-transparent objects. However, there are two limitations: firstly, the acoustic method can only measure the actual contact area on a macroscopic scale. Secondly, the acoustic transducer needs to be immersed in a water bath to ensure the suitable focusing of incident waves through the interface. The third body method and the optical technique are the most widely utilized techniques to investigate rough surface contact with the advantage of in-site measurement and direct observation. The third body approach requires the presence of a third substance between the contacting surfaces, such as fluorescent molecules or radioactive substances. By attaching pressure-sensitive fluorescent molecules onto an extremely smooth and flat glass surface, Weber [
34] visualized the entire actual contact area as these molecules emitted light upon contact. By comparing theoretical models and elastic simulations, they emphasized that protrusion deformations and the actual contact area can be accurately predicted by considering the interaction between the contact patches and the material constitutive models. The optical technique can conveniently obtain the real contact area by identifying the changes in the light rays at the contact position. Liang [
17] and Li [
40] utilized the frustrated total internal reflection technique (FTIR) for studying the elastoplastic deformation of metals that possess super catoptric performance. As an alternative optical technique, Hertz pioneered the use of interferometric techniques to measure surface separation and established the foundation for the field of contact mechanics [
42]. For polymer materials, Krick [
37] employed the 0th order interference fringe to identify the actual contact regions, and Benz [
43] utilized an optical interferometric analysis to measure polymer deformation at the contact interface. Compared to FTIR, the application of the optical interferometric technique results in reduced light pollution and enhances the detection of small contact regions.
In this paper, the incremental contact model for hyperelastic rough surface contact was experimentally validated. Firstly, we conducted uniaxial tensile (UT), planar tensile (PT), and biaxial tensile (BT) experiments to comprehensively determine the mechanical property of the hyperelastic material. Moreover, the 6th-order Ogden constitutive model was selected and fitted in commercial ABAQUS software with the experimental data. Subsequently, rough surface contact experiments were conducted using an interferometric optical method and compared with the incremental model for hyperelastic materials [
27]. Both results reached good agreement within a relative contact area range of 90%. Furthermore, it was found that the incremental model demonstrated a strong predictive capability for the contact behavior of hyperelastic rough surfaces. At the same time, the application of a tangent modulus introduced the nonlinearity of the material. The ratio of the tangent modulus to the linear elastic modulus varied with contact stresses and consistently fell within the range of approximately 2.2~3, which aligns with the FEM results presented in the reference [
27]. This research experimentally demonstrates that the influence of the material’s nonlinearity on contact behavior, driven by stress concentration at the contact surface, enhances the instantaneous tangent modulus of the material at the contact interfaces.
2. Experiments on the Material Constitutive Model
Selecting a proper material constitutive model and precise parameterization are pivotal factors in accurately capturing mechanical deformation. Because the strain energy density (SED) functions for hyperelastic materials are formulated based on phenomenological or statistical theories, their functional expressions exhibit variability and involve distinct parameters. In order to exactly represent the mechanical properties of the materials in the deformation, UT, PT, and BT experiments are required [
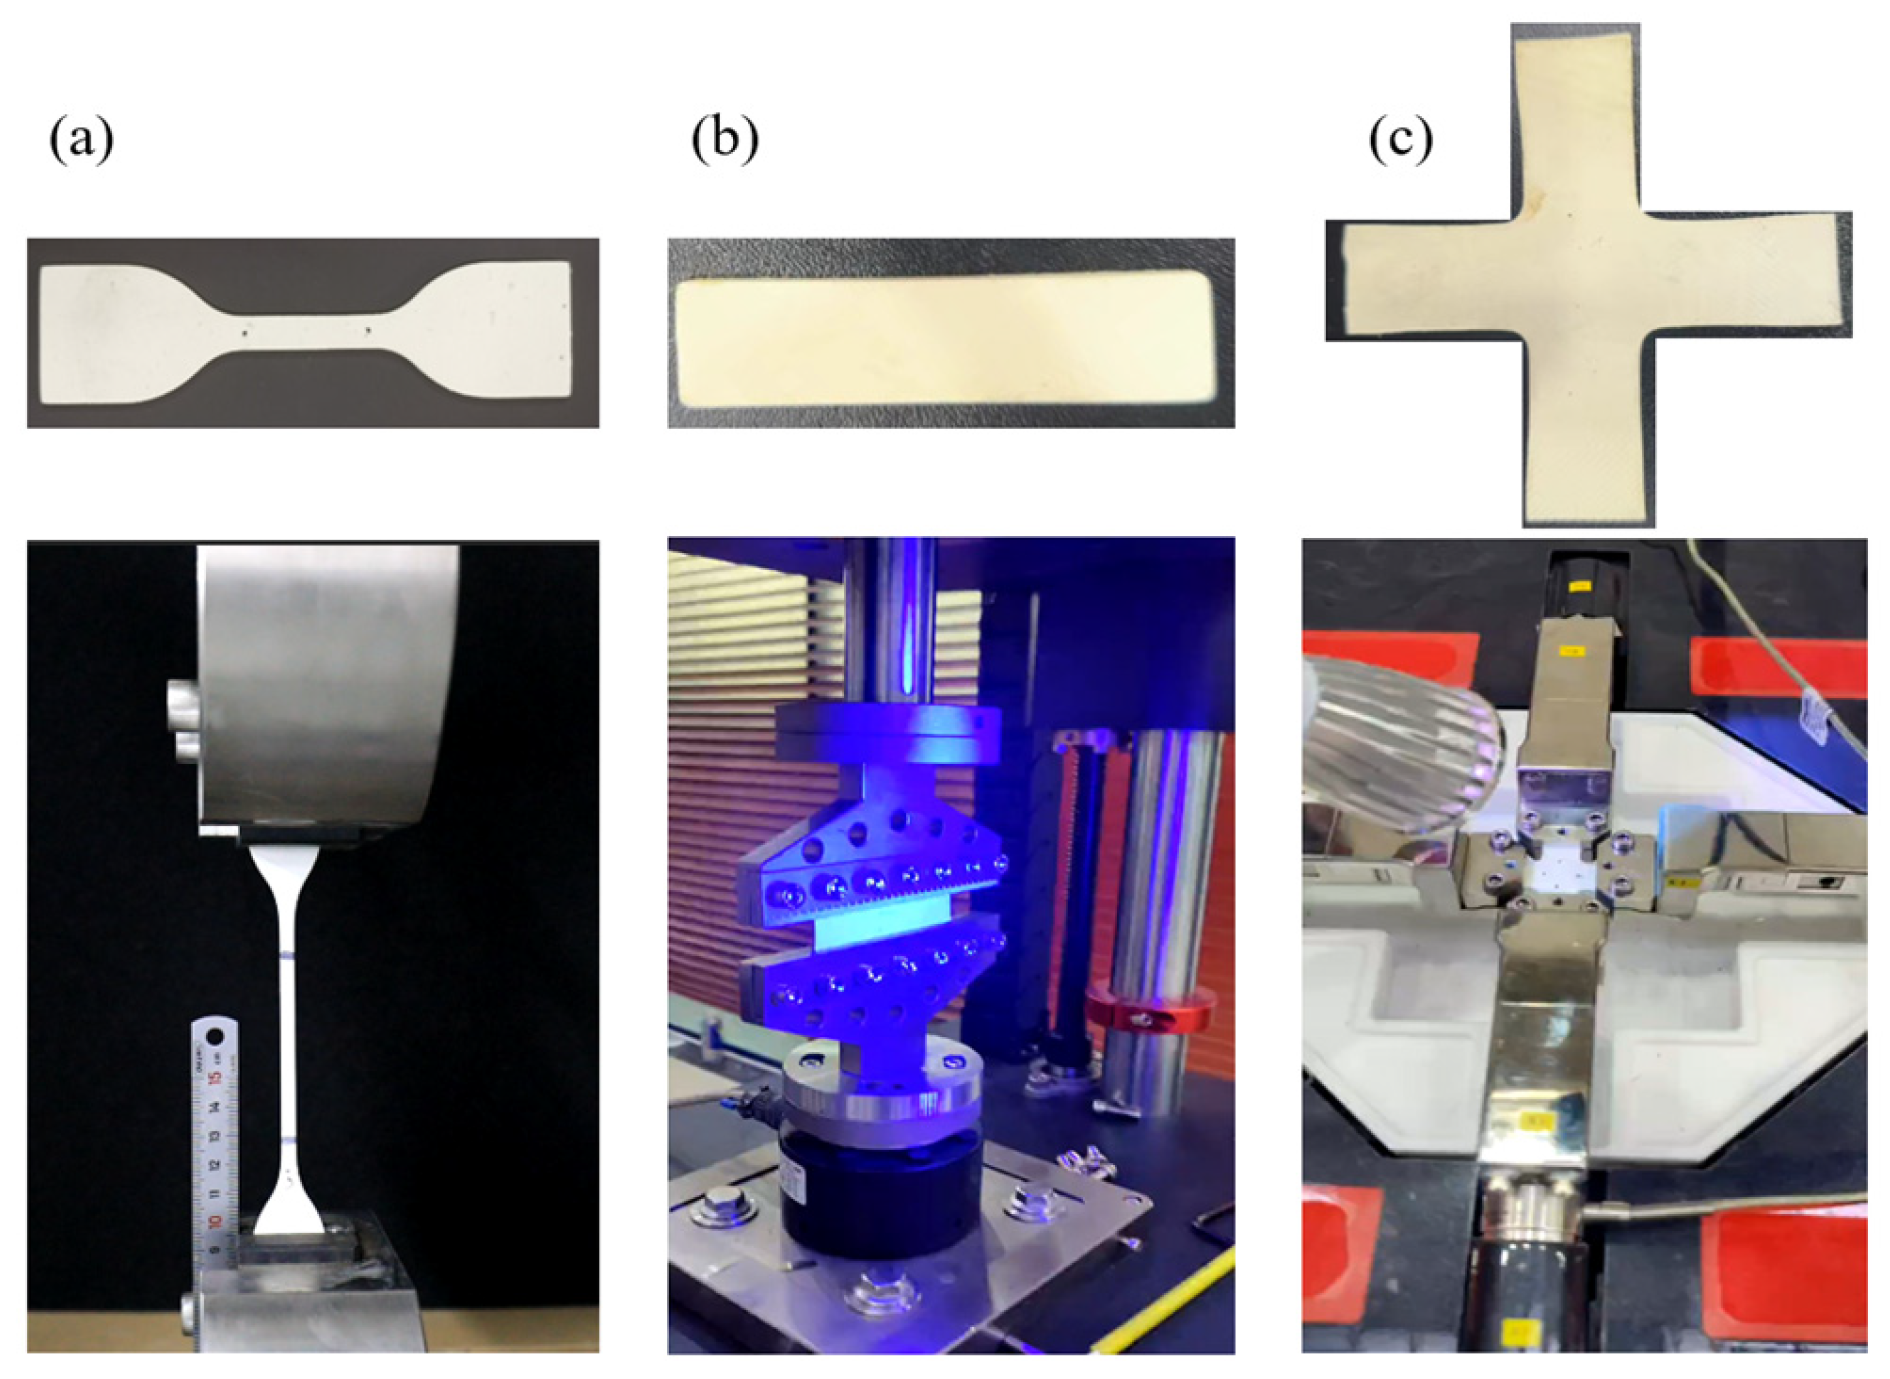
5]. The rubber samples for the UT, PT, and BT experiments were crafted from the same sheet of ethylene propylene diene monomer (EPDM). This material is generally applied in waterproof materials, cable sheaths, heat-resistant rubber pipes, and sealings. The UT experiment employed a standard dumbbell-shaped specimen measuring 6 mm × 115 mm × 1.5 mm. For the PT experiment, a rectangular specimen with dimensions of 40 mm × 10 mm × 1.5 mm was employed, while the BT experiment utilized a cross-shaped specimen measuring 40 mm × 12 mm × 1.5 mm. The UT equipment was WANCE@ETM104B, featuring a maximum sensor range of 10 kN and a minimum resolution of 0.01 N. The PT equipment, identified as EUM-25k25, utilized a sensor with a maximum range of 3 kN and a minimum resolution of 0.1 N. The biaxial tensile equipment was IPBF-300, featuring a sensor with a maximum range of 300 N and a minimum resolution of 0.01 N.
Three different types of experimental samples and tensile testing equipment are illustrated in
Figure 1. The tensile load could be continuously monitored in real-time via the force sensor, whereas the strain measurements required calculations involving the continuous tracking of the markers (
Figure 1a) on the samples through digital image processing technology, a technique known as non-contact strain measurement technology. This method is commonly employed in digital image correlation (DIC) for the purpose of capturing related information. Sprayed speckle markers were applied to the samples’ surface to instantaneously capture the movement and deformation of the speckles using a camera in situ. This method offers several advantages, including minimal demands on the experimental environment, non-contact whole-field measurement capabilities, robust resistance to interference, and high measurement precision. Consequently, we employed MATLAB software to perform the image processing and calculation of the elongation ratio and strain by utilizing the initial undeformed image.
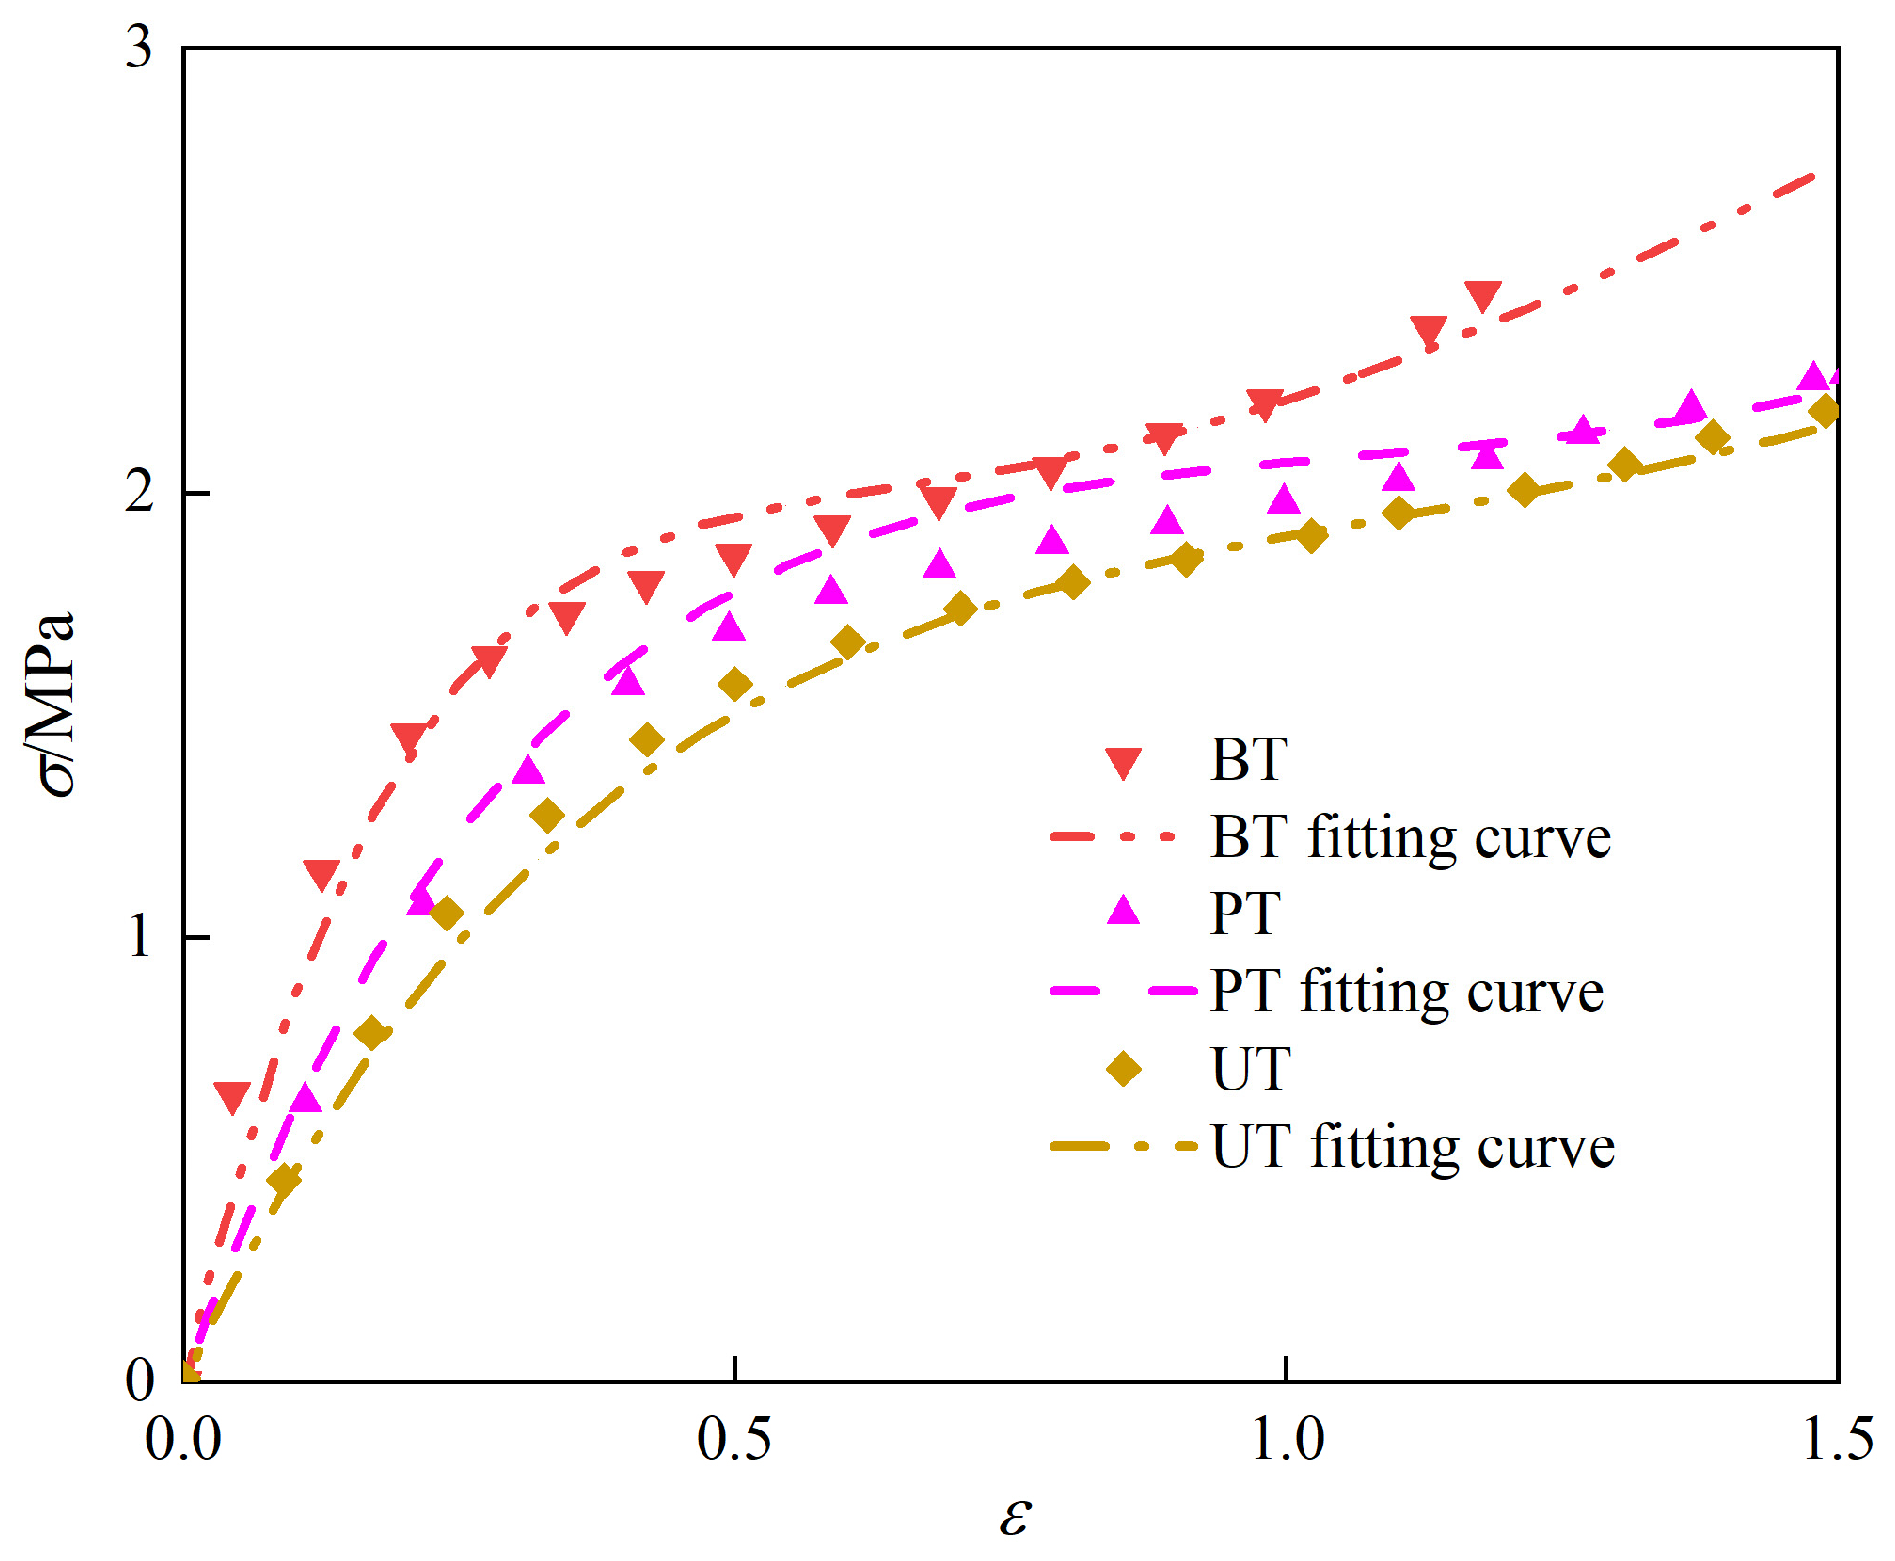
As depicted in
Figure 2, the symbols represent the stress–strain data obtained through the experiments, and the dashed lines represent the fitting data. Using one proper SED function to satisfy the three experimental data simultaneously is a challenge on the form of the function. To better characterize the mechanical properties of the materials, the three kinds of tensile experimental data were fitted simultaneously in the ABAQUS commercial software. By employing various SED functions for fitting and conducting the comparative analyses, we determined that the 6th-order Ogden SED function was the most appropriate choice for the experimental data. The SED function is written as [
5]:
where
µi and
αi are the material constants, listed in
Table 1. The stretch
λi = 1 +
εi is a function of strain
εi and the initial shear modulus
. To facilitate normalization, here, we provide the initial Young’s modulus
E0 = 2
µ0(1 +
v) and the initial composite modulus
=
E0/(1 −
v2). For the incompressible materials, we used the Poisson ratio
v = 0.5 in this paper. The stress–strain curve could be derived by invoking the principle of virtual work [
44], donated as:
where
S represents the Piola-Kirchhoff stress.
3. Contact Experiments on the Hyperelastic Rough Surface
The optical interferometric technique [
37,
43] has been adopted to estimate the actual contact areas of hyperelastic materials. In this paper, we built an analogous experimental setup to conduct the rough surface contact experiments using the optical interferometric technique.
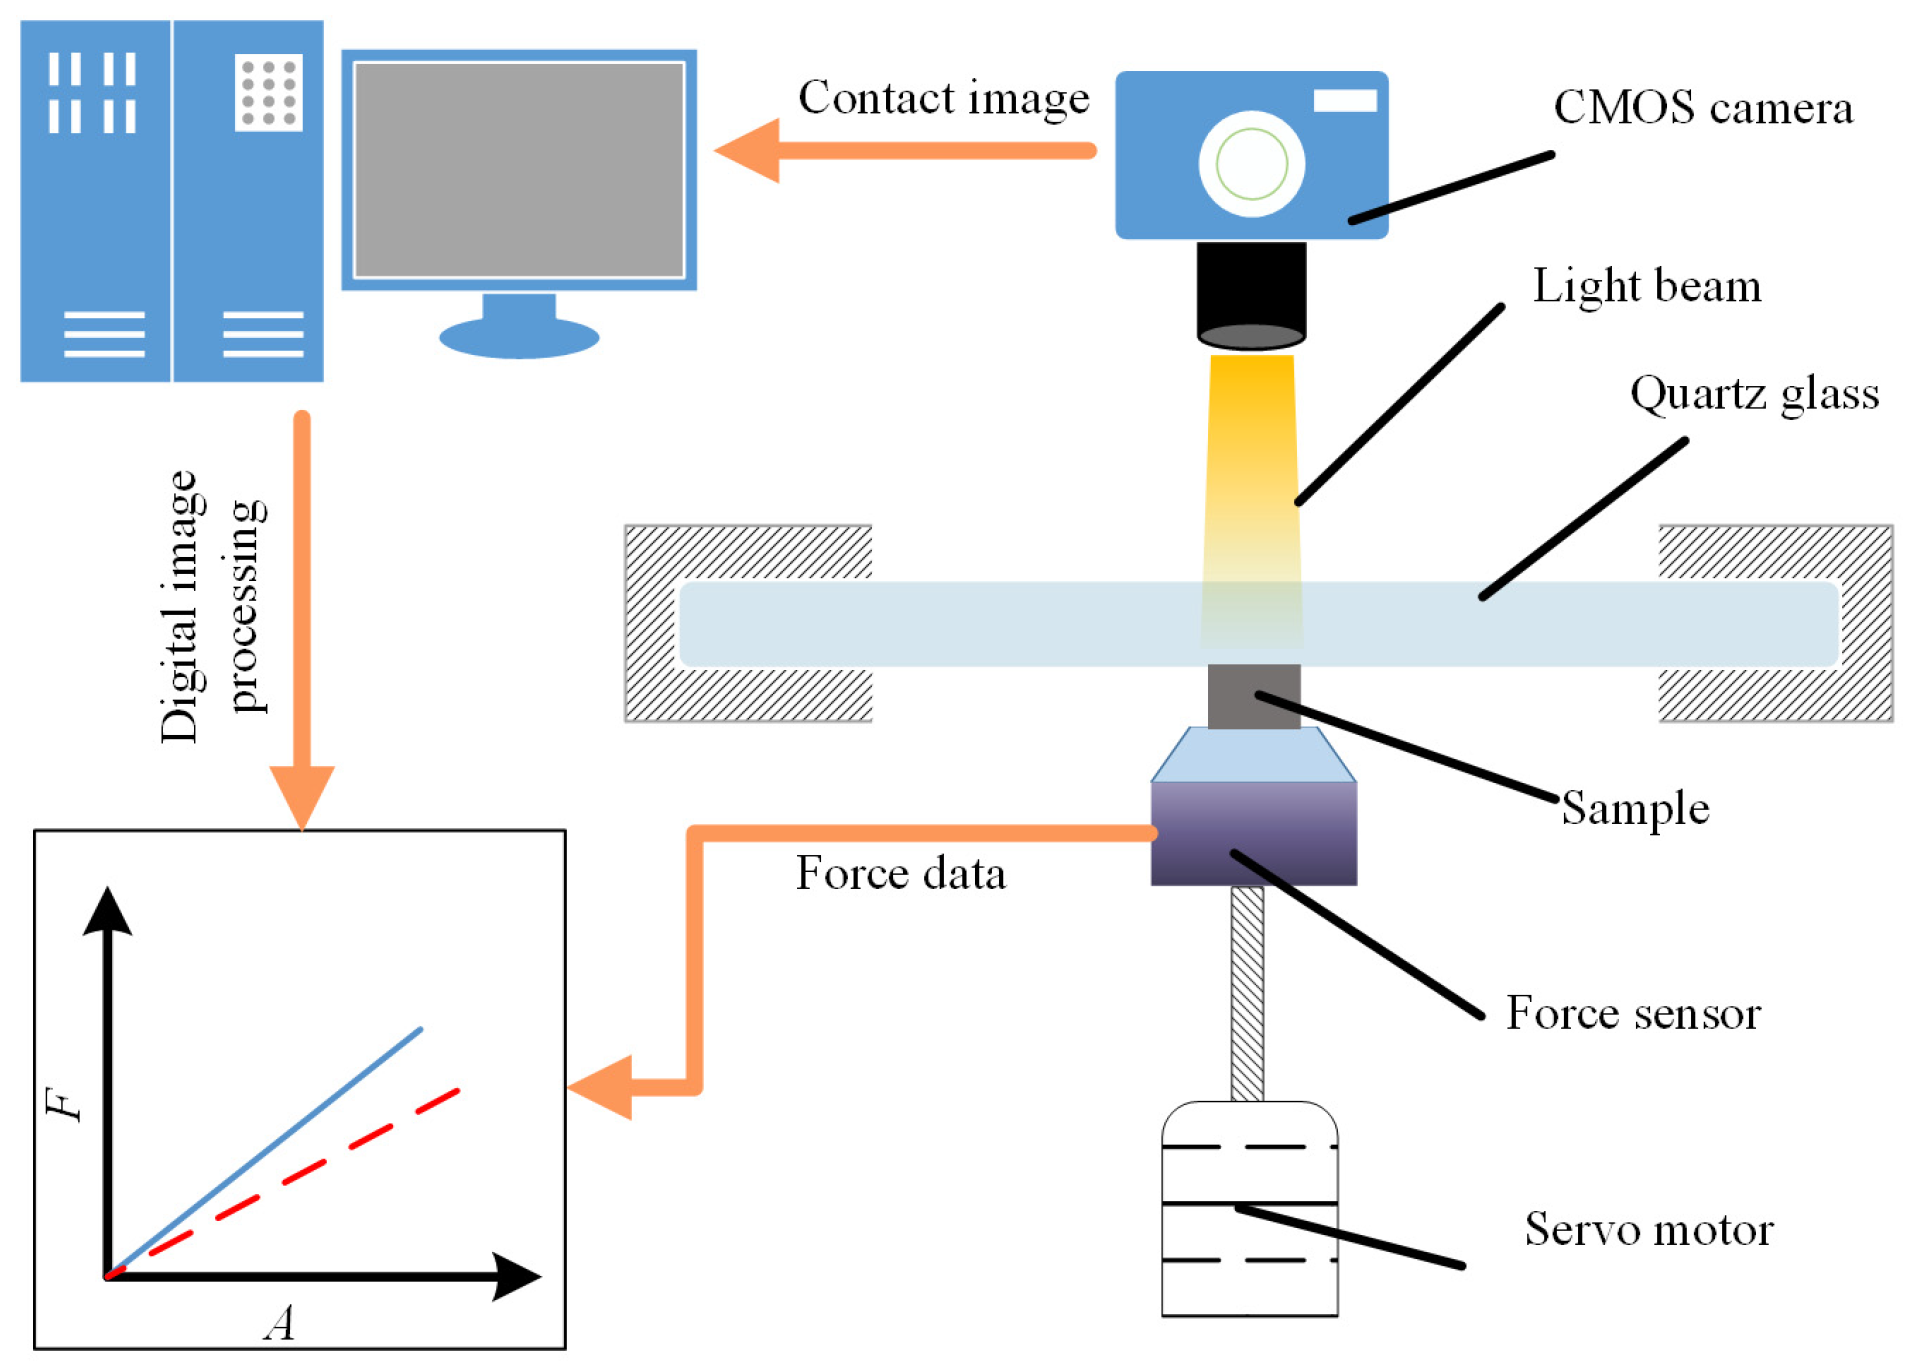
Figure 3 illustrates the schematic of the experimental setup for rough surface contact, comprising primarily three integral components: the loading system, the contact module, and the camera capture system.
In the loading system, a rough surface sample was positioned on a force sensor (FA703, SIMBATOUCH) with a data acquisition rate of 50 Hz and a resolution of 0.01 N. The force sensor recorded the variation of the contact force. These components were driven using a servo motor with a minimum loading rate of 3 µm/s, which was slow enough to guarantee a quasi-static state and reduce the influence of material viscoelastic relaxation on the contact area. A high-quality scientific complementary metal oxide semiconductor (CMOS) camera (2048 × 2048 pixels, with a pixel size of 6.5 µm × 6.5 µm and an impressive 16-bit gray depth, specifically the pco.panda 4.2C model) was positioned vertically above the rough surface samples for precise image capture. To ensure optimal image quality, the camera’s exposure time was finely tuned to 50 ms. To generate thin-film interference, a white coaxial illuminant (TZ-D5W) delivered a beam of light. Then, the light could be reflected to pass through the objective utilizing an internal mirror in the CMOS lens. This vertically illuminated onto the lower surface of the quartz glass and the surface of the sample. The light reflected at both interfaces underwent interference. Due to the presence of half-wave losses [
37], the image captured using the CMOS exhibited a notably darker appearance in the actual contact regions. Subsequently, the contact area and the numbers of contact patches could be determined based on the intensity of the pixels by employing digital image processing in MATLAB2020b [
17].
In the experiments, we controlled the movement of the samples to achieve complete contact with the quartz glass according to abovementioned experimental process. After synchronizing the data, the relationship between the contact area A and contact load F was obtained.
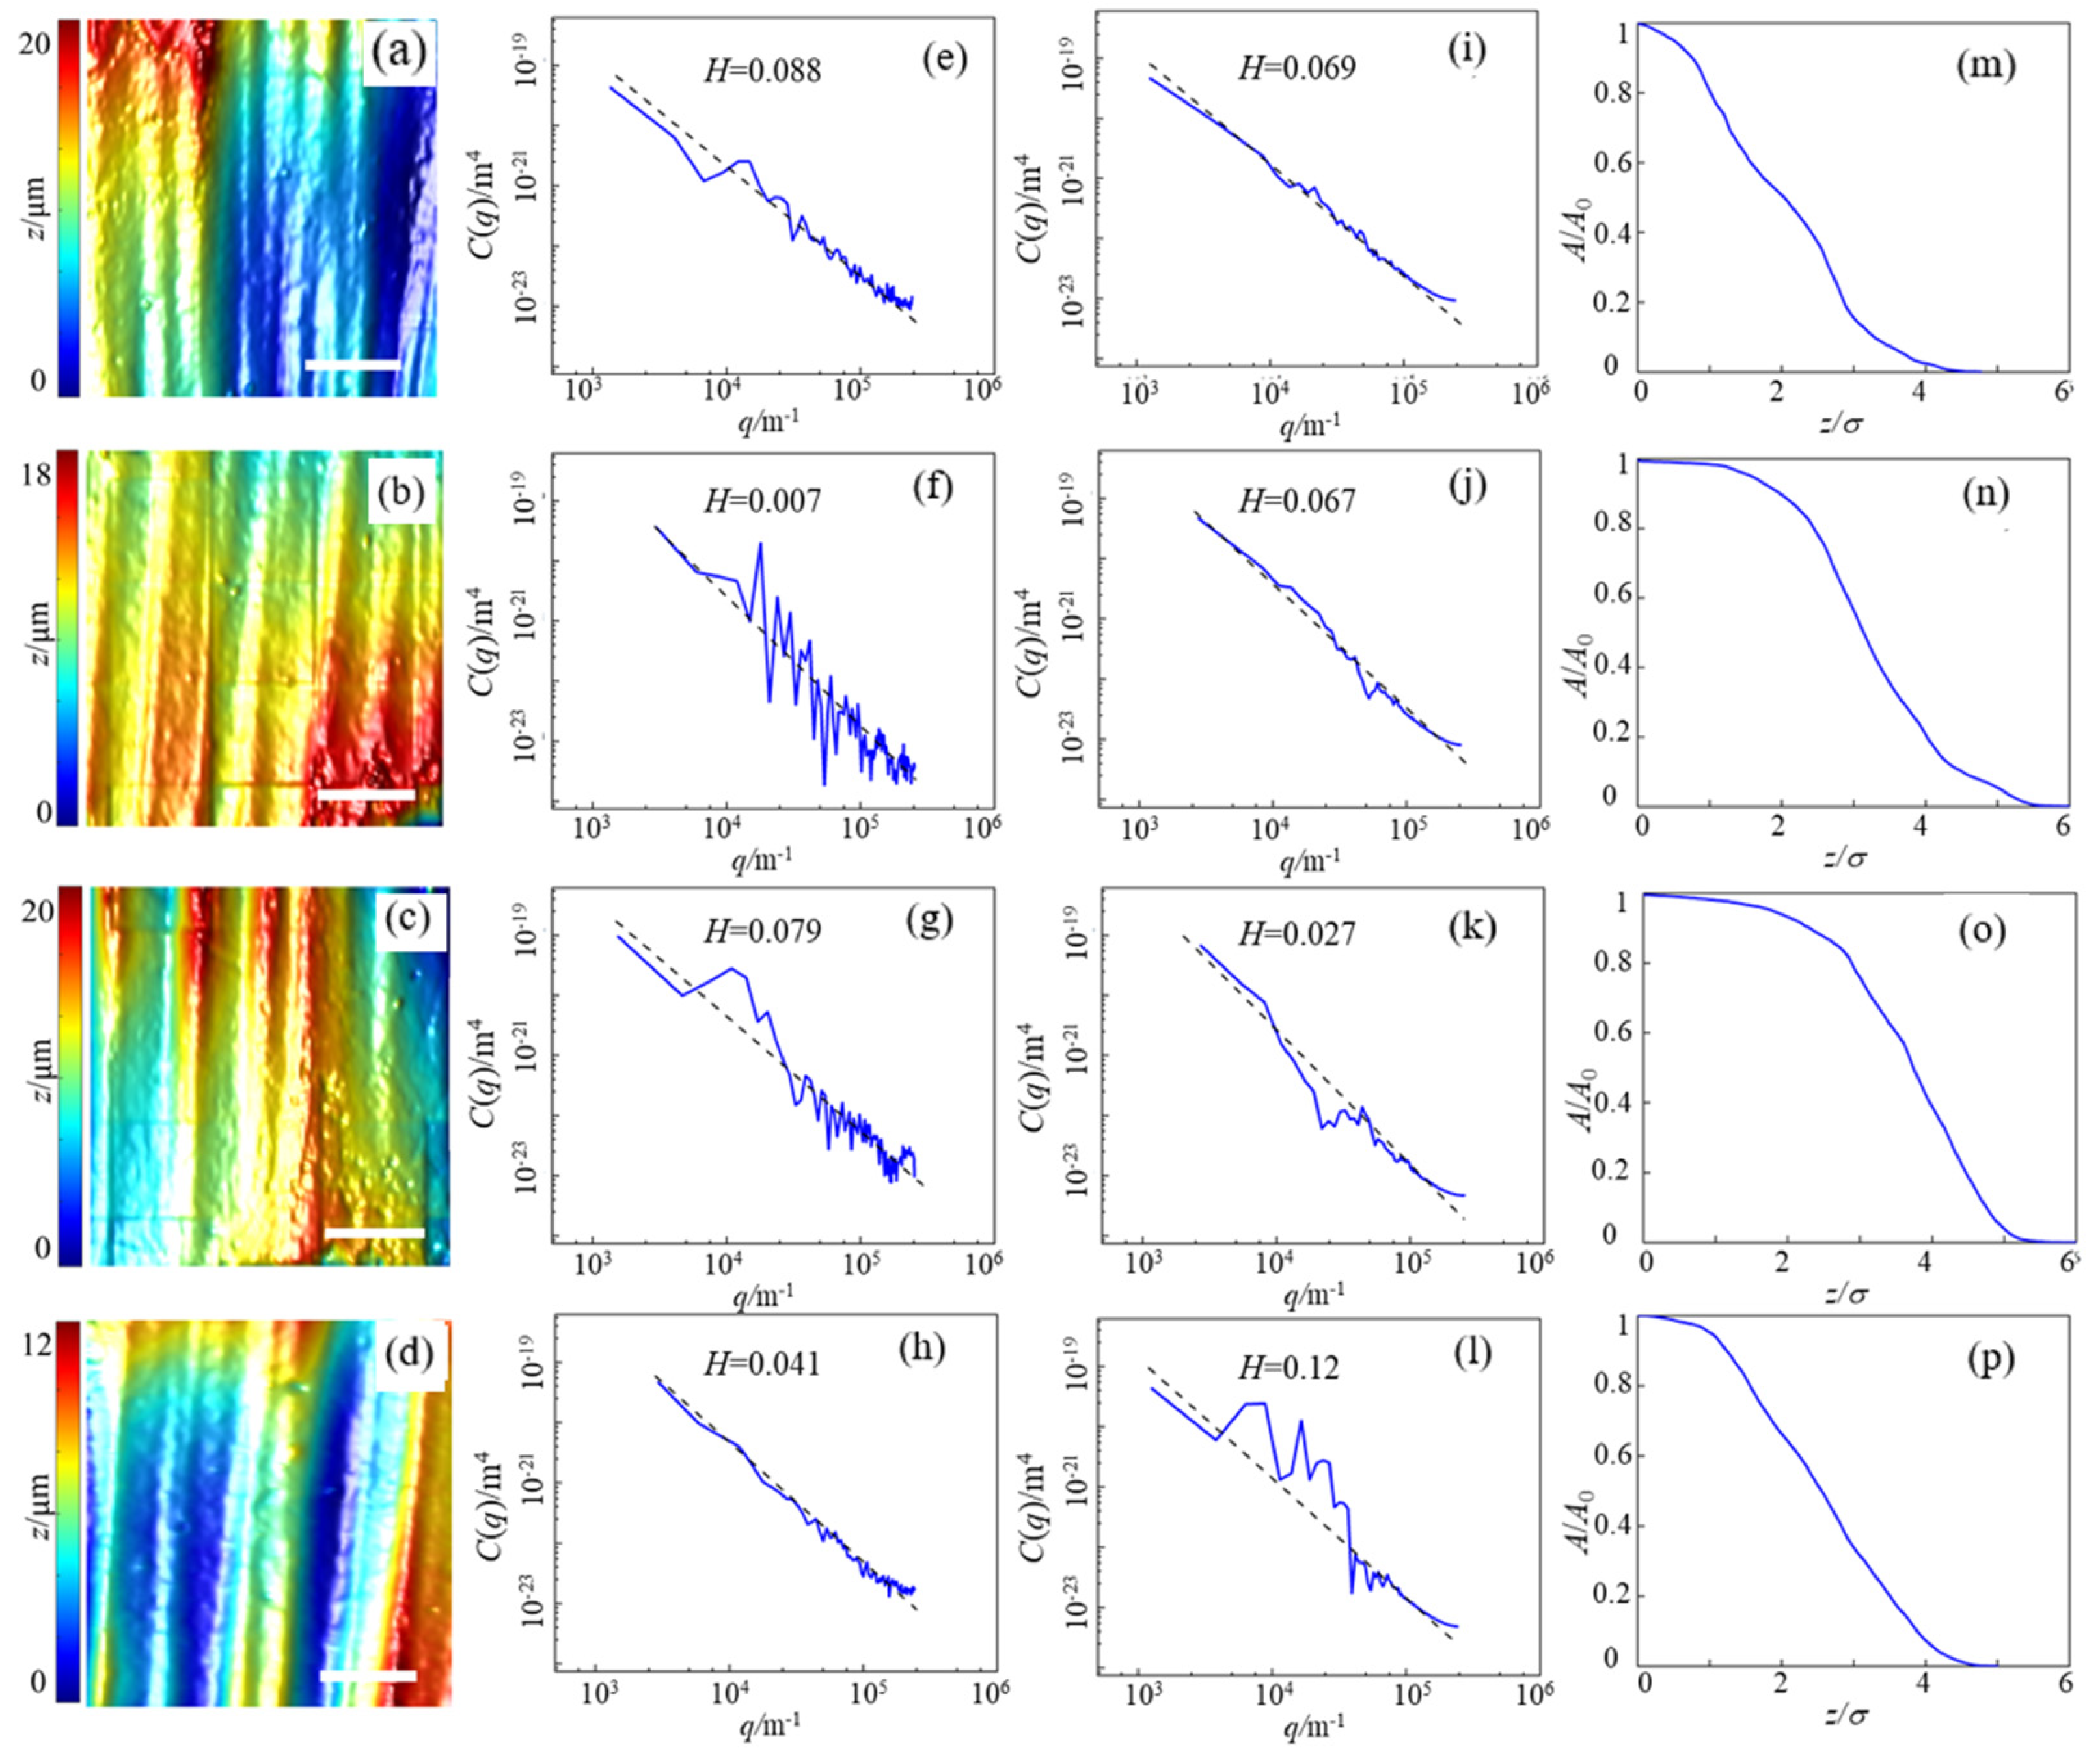
The morphologies of the rough surface were meticulously scanned using a white light interferometer (NanoMap-1000WLI, AEP(Aeptechnology, Saratoga, CA, USA) with a vertical resolution of 0.01 nm before the contact experiments. Installed with a 10× interference objective lens, each scanning procedure captured a projection area measuring 1047.9 µm × 1047.9 µm. Through an automatic stitching process and filtered to have a lateral resolution of 20 µm, the complete surface morphology could be reconstructed from multiple individual scans, as shown in
Figure 4. Each sample’s morphology was composed of multiple single scans stitched together. To ensure the quality of stitching, adjacent single-scan morphologies had overlapping regions. The stitching software could identify these overlapping regions through algorithms, thereby ensuring high-quality stitching.
The PSD contains essential information for describing a random rough surface. The PSD
C(
q) of rough surfaces can be written as [
14]:
where
q0 is the lower frequency cut-off and
qs is the upper frequency cut-off.
H is the Hurst exponent (dashed line in
Figure 4),
Hx = 0.088, 0.007, 0.079, 0.041 and
Hy = 0.069, 0.067, 0.027, 0.12 for samples T1, T2, T3, and T4 in the
x direction and
y direction, respectively. Through fast Fourier transformation, the PSDs
C(
q) in the
x and
y directions of the four rough surfaces are displayed in the subplots e, f, g, h, i, j, k, and l, respectively. It becomes evident that all four surfaces exhibited self-affine fractal characteristics. For each sample, the lowest surface node was selected as the reference height of the
z-coordinate. By employing a virtual plane to truncate the morphologies and disregarding the deformation of the non-contact regions, we could roughly approximate the relative contact area,
A/
A0, varying with the distance,
z/
σ, between the virtual plane and the reference plane, as illustrated in the subplots m, n, o, and p.
A0 and
σ represent the nominal contact area and roughness of the surface, respectively.
4. The Incremental Equivalent Circular Contact Model for Hyperelastic Materials
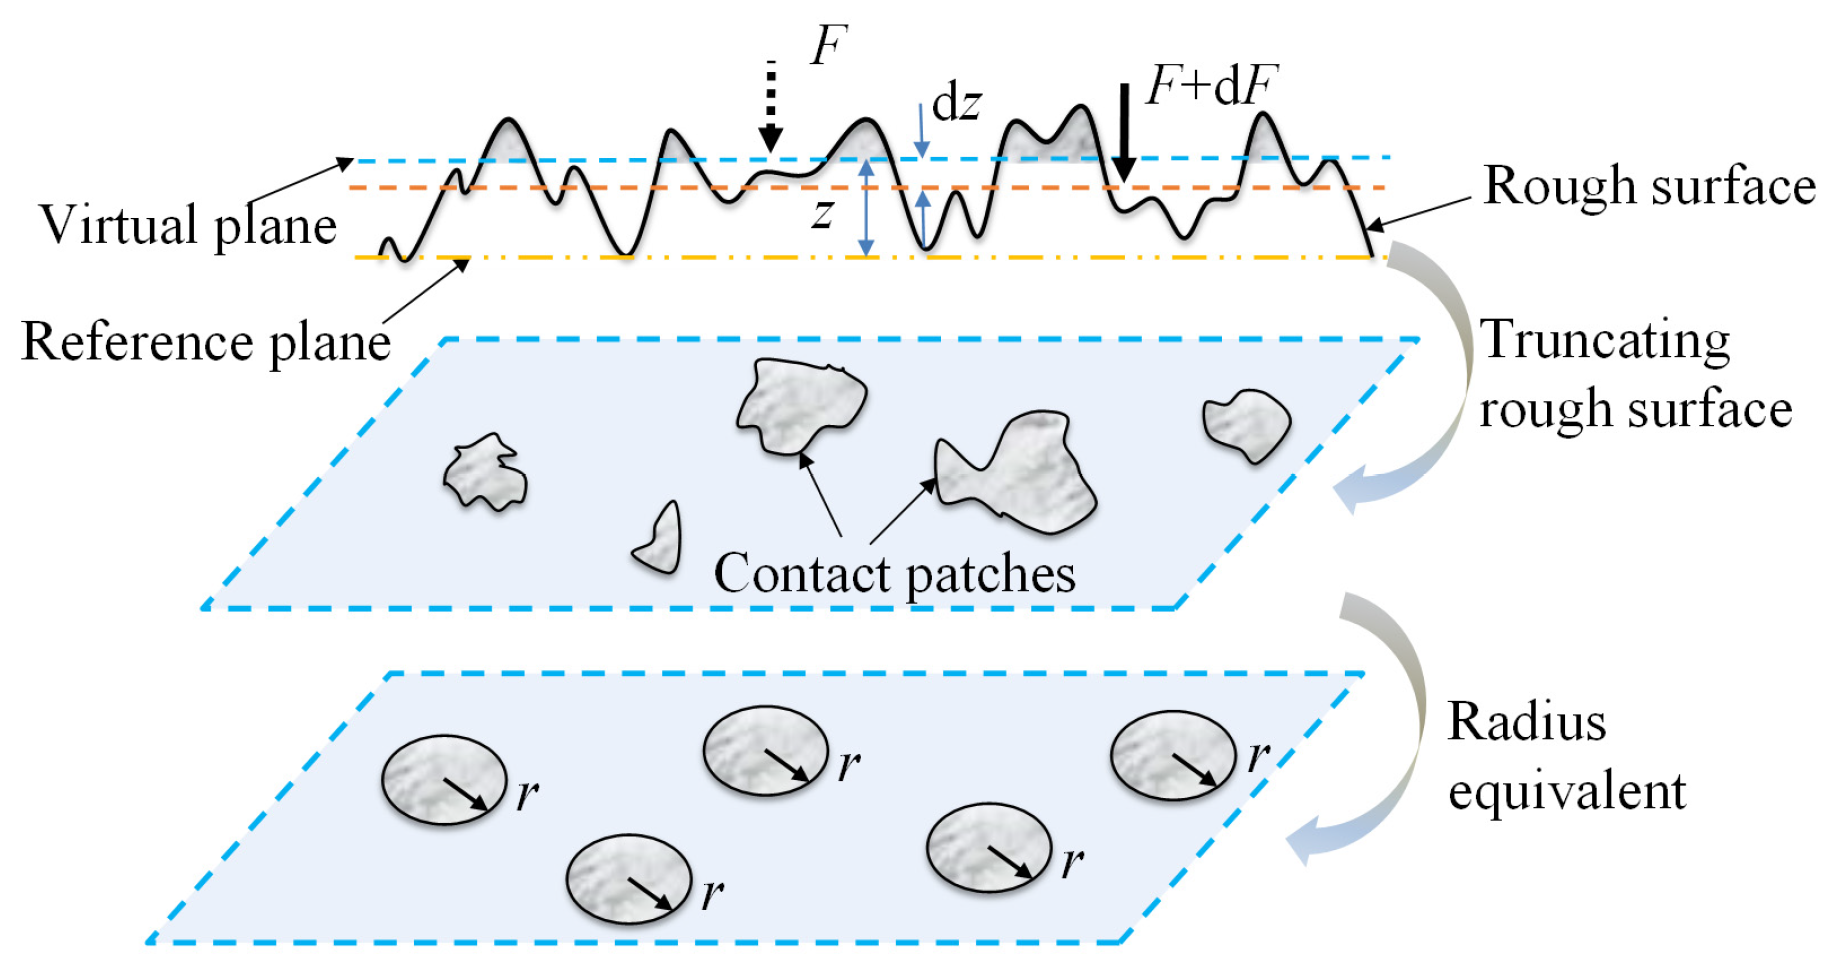
Figure 5 illustrates the schematic of the incremental equivalent circular contact model. Here, the lowest node of the rough surface was still selected as the reference height of the
z-coordinate. Following the profile theory outlined by Abbott and Firestone [
45], using a virtual plane to truncate the morphologies of a rough surface, we could extract the contact area,
A(
z), and the number of contact patches,
N(
z).
z represents the separation between the virtual plane and the reference plane. While it is important to note that the profile theory does not account for finite deformation elastic coupling effects, it remains a valuable tool for estimating the contact area [
15,
16,
46]. For convenience, an averaging assumption was used to calculate the radius
r(
z) of the contact patches, maintaining
A(
z) and
N(
z) constant at separation
z. Irregular contact patches were assumed to be uniformly circular in size. Then, the radius
r(
z) could be written as [
15]
For the contact of a flat circular rigid indenter on an infinite substrate, the contact stiffness was derived by Sneddon [
47], denoted as 2
E*r.
E* =
E/(1 −
v2) represents the composite elastic modulus, with
E representing the Young’s modulus of the substrate. Consequently, by multiplying
N(
z), the stiffness of the contact interface at the separation
z can be expressed as the following [
15]:
In terms of hyperelastic materials, the stress–strain curve exhibits high nonlinearity, especially in compression. The nonlinearity would cause the tangent modulus to fluctuate with stress, rendering the use of the initial elastic modulus for calculating the contact stiffness inappropriate. Analogous to the buckling theory [
48], the tangent modulus
Et is suggested in compressive research for hyperelastic materials. Therefore, we introduced the composite tangent modulus,
= Et/(1 −
v2), into the incremental contact model to replace
E*. Then, Equation (5) could be rewritten as the following:
The tangent modulus
Et for the 6th-order Ogden constitutive model could be derived by differentiating Equation (2) with respect to
ε, and could be written as:
where
ϕ−1(
S) is the inverse function of
S =
ϕ(
ε), provided in Equation (2). The mean contact stress,
F(
z)/
A(
z), was used to evaluate the Piola-Kirchhoff stress,
S, in the current model. Substituting Equation (7) into Equation (6), the interfacial stiffness could be denoted as:
The geometric functions
A(
z) and
N(
z) in Equation (8) could be obtained either numerically [
15] or analytically [
49] depending on the specific surface morphology. Subsequently, the relationship between the contact area,
A, and the normal load,
F, can be derived by solving the differential equation Equation (8) using the explicit iteration method with the initial condition
F(
zmax) = 0.
5. Results and Discussion
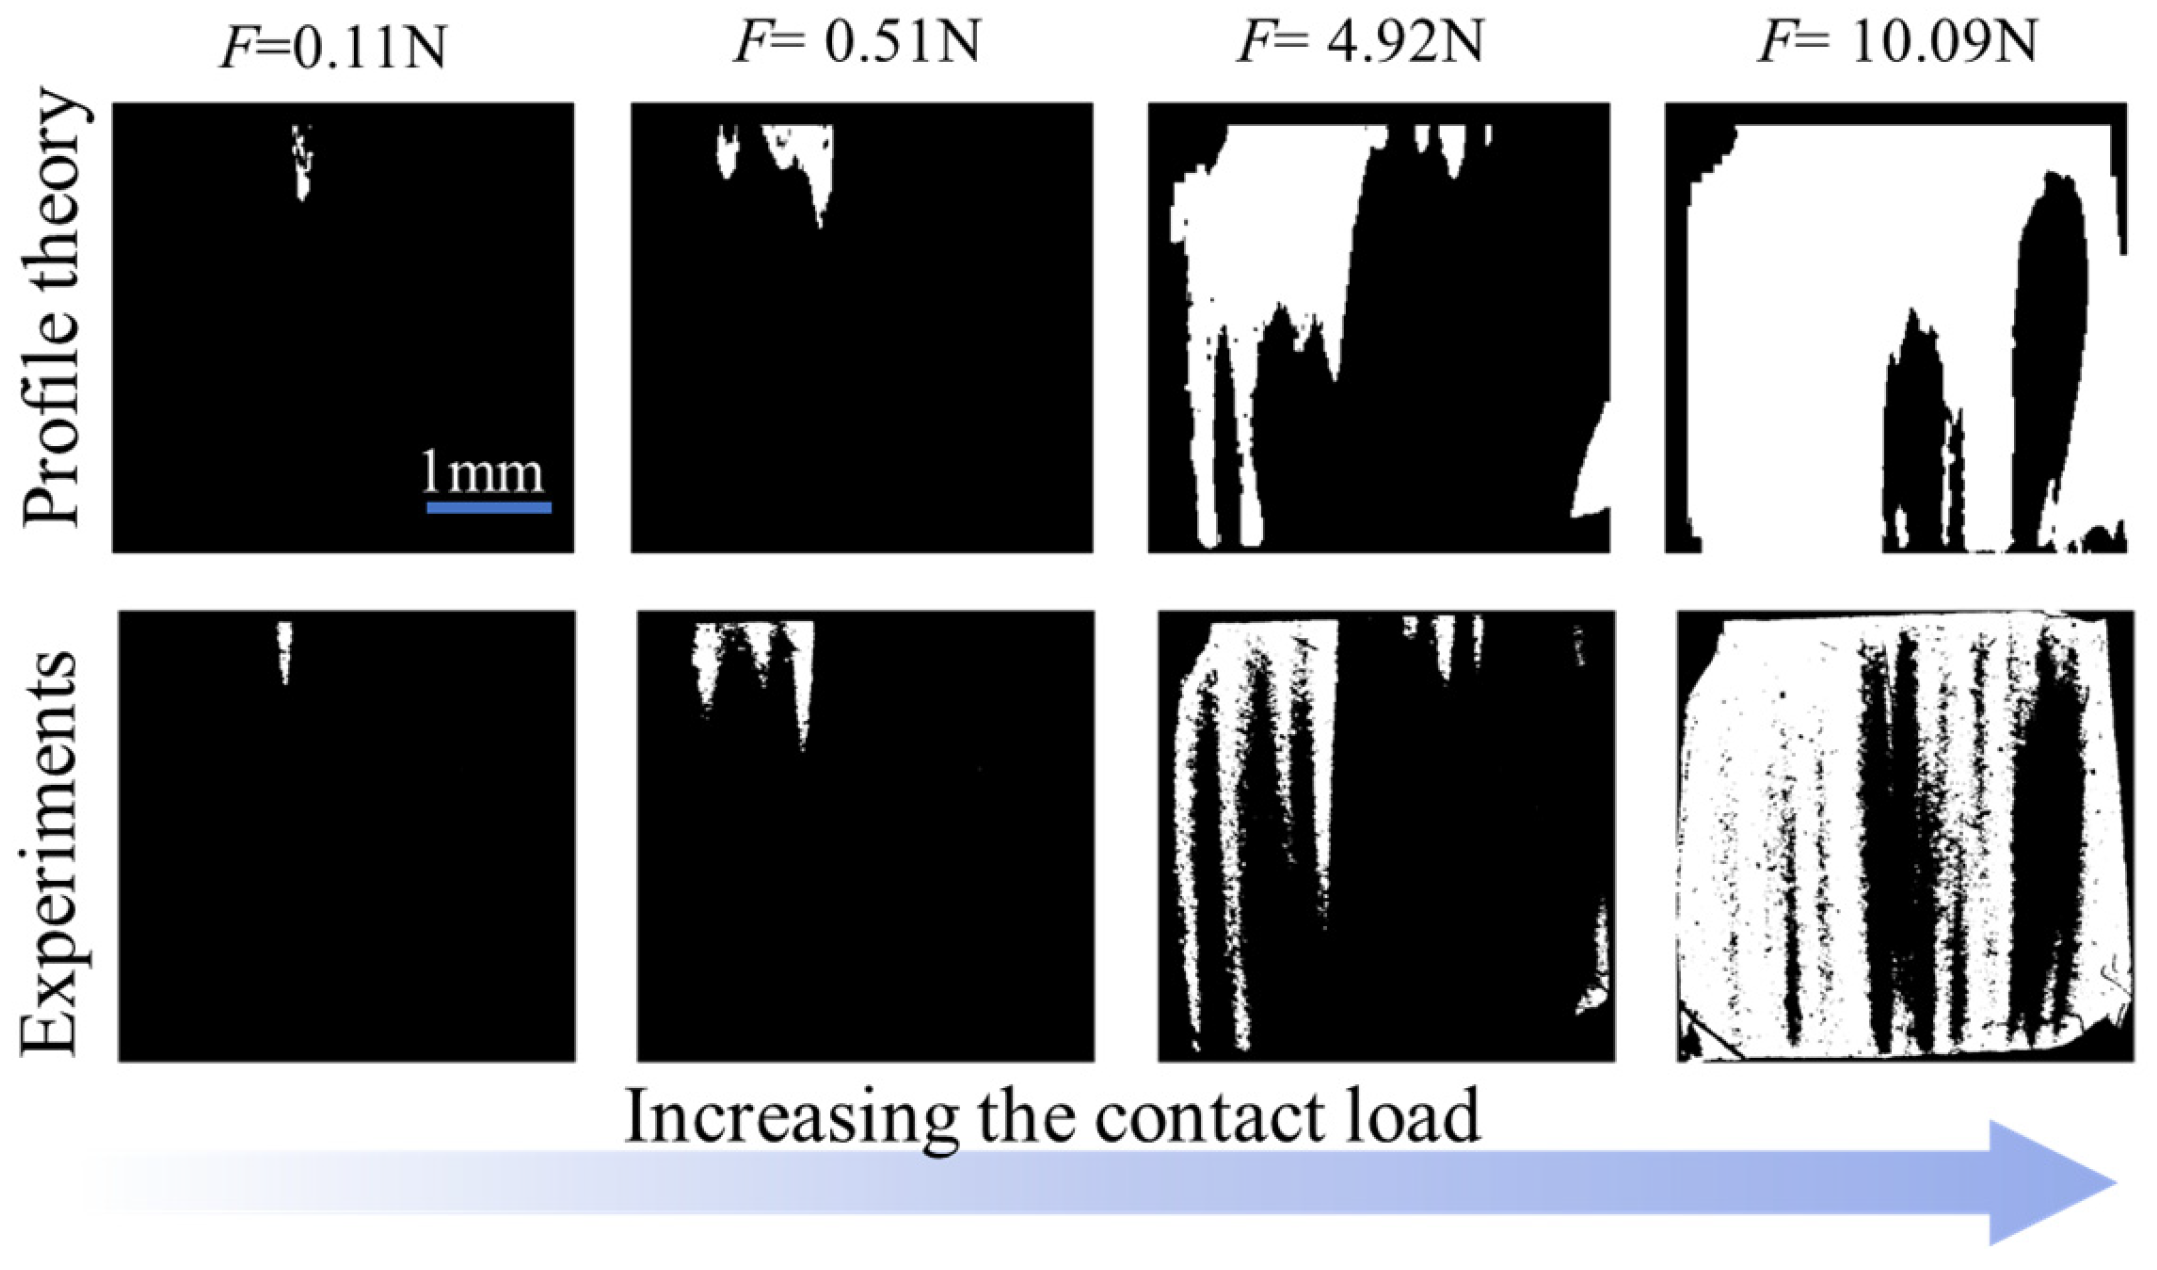
Figure 6 shows the evolution of the contact area for sample T1 under different loads through the experimental and profile theory methods. Because the acquisition of three-dimensional surface data and rough surface contact experiments was not conducted on the same device, it was necessary to pre-rotate the three-dimensional surface data to align the truncated contact regions with those in the contact experiments. The processing of the experimental images was achieved using the Otsu method [
50], which is capable of automatically identifying contact and non-contact pixels and determining the contact area by counting the number of contact pixels. Due to the deformation of the rough surface, some differences in the obtained contact regions between the two methods were inevitable. However, the consistency in the primary contact regions could be ensured in this work.
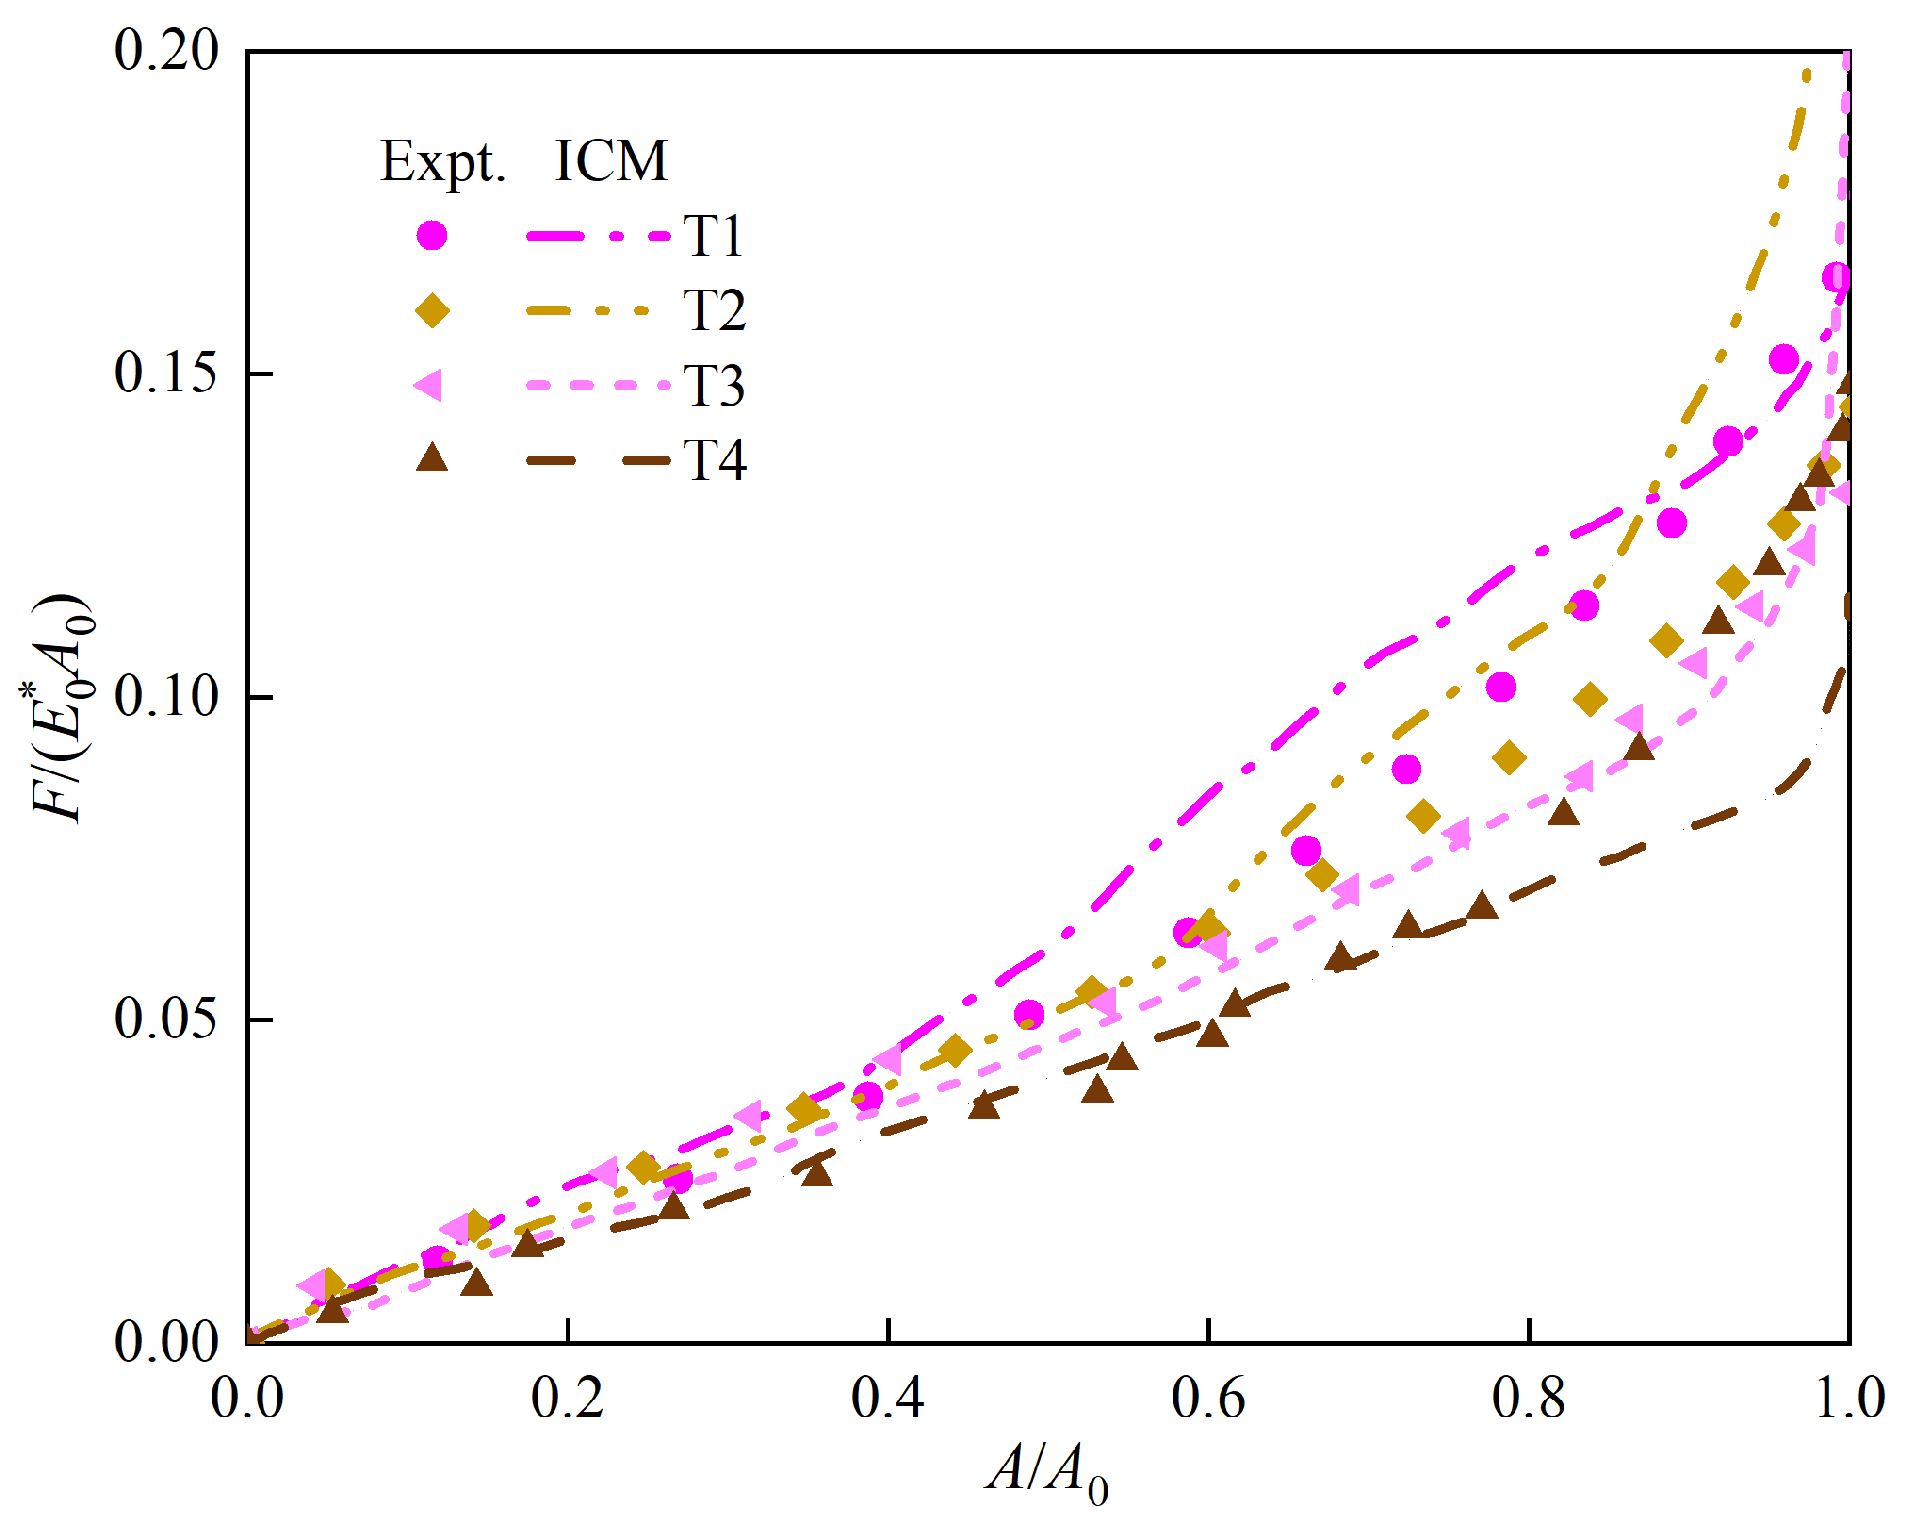
The normalized load–area relationships for the T1, T2, T3, and T4 samples are shown in
Figure 7. The dotted lines represent the incremental contact model calculations, and the symbols represent the experimental results. The obvious differences in the load–area relationships of the four samples could be observed, roughly reflecting the contact load
FT1 >
FT2 >
FT3 >
FT4 under the same contact area fraction in a larger area range. This phenomenon implies that the mean contact stresses on the rough surfaces follow the same trend. Additionally,
Figure 7 reveals that the predictions of the incremental model were in good agreement with the experimental results in a contact fraction range of 90%. However, it must be admitted that there were still some discrepancies between the individual experimental curves and the incremental model results, which may be related to the finite deformation of the rough surface. When the indentation depth is large, the bottom regions of some rough surface asperities no longer maintain the original contour due to finite deformation. The profile theory used in the incremental model assumes that the surface contour of the uncontacted region remains unchanged throughout the contact process. This assumption may introduce some differences. However, in terms of the overall effect, the incremental model, which takes into account the material nonlinearity of the hyperelastic material, could predict the contact response of the rough surface successfully.
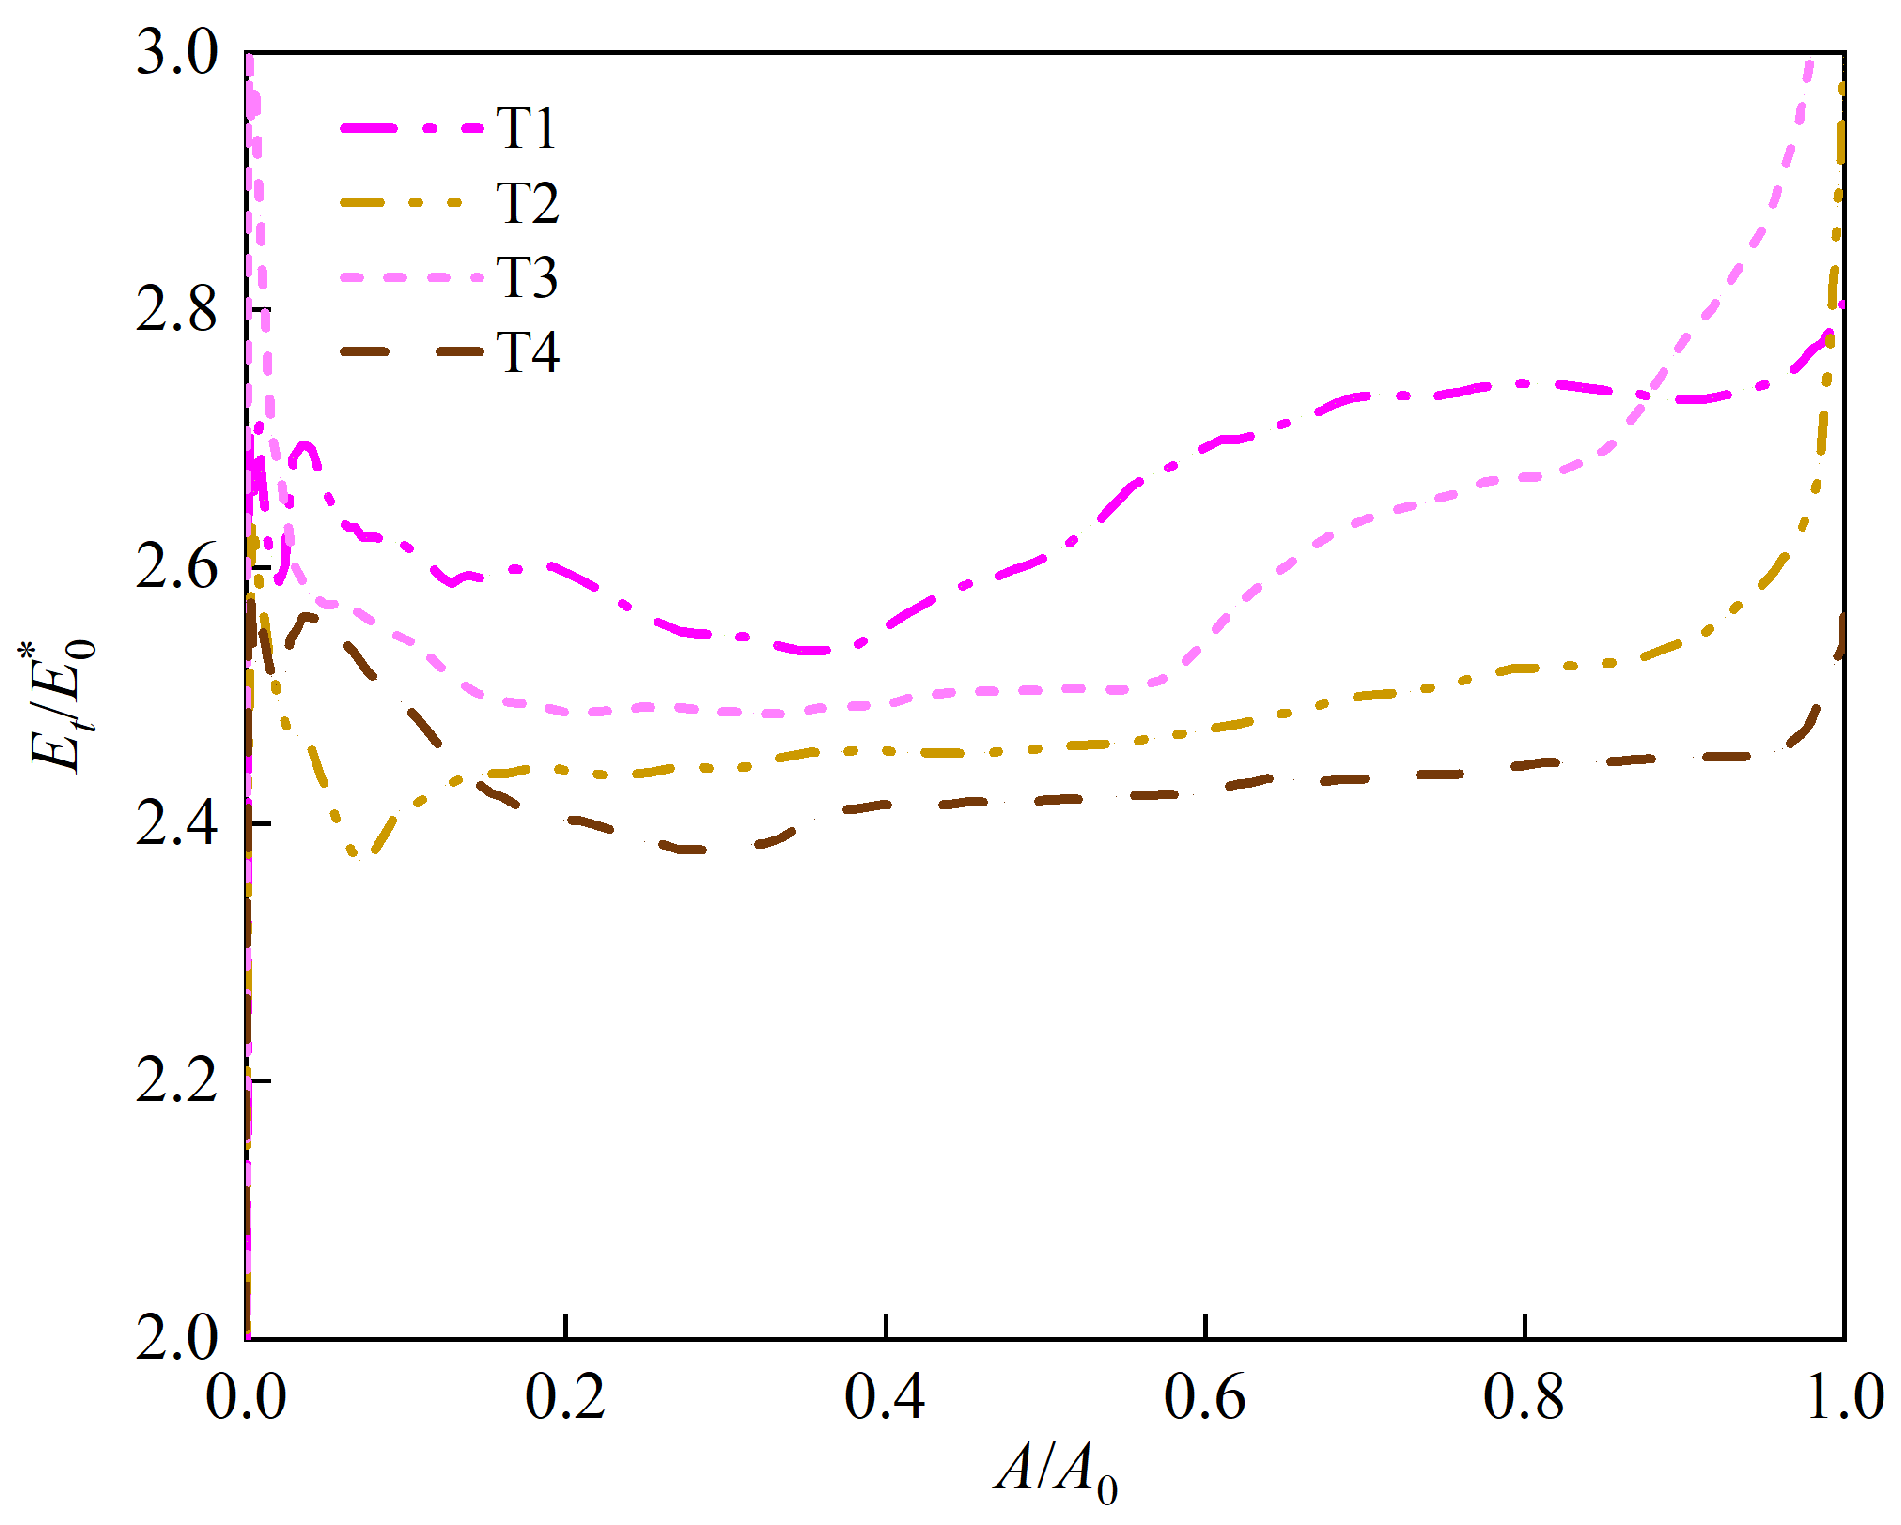
In the calculation of the load–area relationship, we adopted the instantaneous tangent modulus
Et, which depends on the mean contact stress. The dimensionless tangent modulus,
/
, varying with the contact area fraction is illustrated in
Figure 8. It was found that the
/
fell within the range of 2.2~3, which is similar to the results of previous research [
27] on validating the incremental model using the FEM. The
Et in the initial stage of contact was larger than in the middle stage, which may be due to the higher contact stress introduced by the high frequency of the rough surface, which is dominated by the material properties. Furthermore, this observation underscores the profound influence of hyperelastic material nonlinearity in response to contact stress. This influence would increase the instantaneous modulus of the material and the stiffness of the contact interface. In contrast, the modulus of conventional linear elastic materials remained unaffected by the variations in the stress. By introducing the tangent modulus into the incremental model, we effectively incorporated the nonlinearity of hyperelastic materials into the numerical calculations.
6. Conclusions
In this work, we measured the relationship between the real contact area and the load of hyperelastic rough surface contact using optical interference technology. Additionally, we experimentally validated the incremental contact model of hyperelastic materials. Firstly, the hyperelastic constitutive model was determined via three types of tensile experiments: UT, PT, and BT. Then, the four surfaces were manufactured from the same material batch and scanned with a white light interferometer to obtain 3D morphology data. Subsequently, the morphology data were substituted into the incremental model for the hyperelastic material, meaning the relationship between the contact load and actual area could be predicted. Finally, we conducted rough surface contact experiments using the optical interferometric technique to validate the modified incremental model.
The results illustrate an agreement between the results of the theoretical model and the experimental method when the relative contact area falls within a range of 90%. In addition, consistent with previous FEM research [
27], the findings indicate that the ratio of the tangent modulus to the linear modulus of elasticity,
/
, varied with the contact stress and fell within the range of 2.2~3. This observation underscores that the nonlinear characteristics of hyperelastic materials are amplified due to stress concentration and profoundly influence the contact behaviors of rough surfaces. Future research endeavors may aim to enhance and broaden the model’s applicability, extending its utility across a broader spectrum of hyperelastic materials and diverse contact scenarios.


