1. Introduction
Ultrasonic waves can travel through different media due to the excitation and displacement of particles in the medium. Generally, this excitation is carried out using piezoelectric sensors, which are elements capable of producing sound waves in response to stimuli from a voltage pulse. When this piezoelectric element is coupled to a solid material, a mechanical displacement propagates through this material [
1].
The principle of measuring different characteristics of tribological contacts using ultrasonic reflection was first established at the University of Sheffield around two decades ago [
2]. Since then, it has been used for measuring lubricant film thickness [
3,
4,
5], lubricant viscosity [
6], thermoelastic compliance [
7], contact forces [
8], friction [
9,
10], contact dimensions [
11], contact surface roughness [
2], among other relevant information about tribological contacts. In addition to a number of works under laboratory conditions, this technique has been adapted to a range of real applications, varying from typical engineering applications such as the piston/liner system in engines [
3,
7,
12,
13], sliding bearings [
14,
15,
16,
17], roller bearings [
18,
19], and metal-forming applications [
11,
20], to a much broader realm of applications, such as measuring the thickness of leaves in tree canopies [
21].
In lubricated systems, monitoring the thickness of the lubricating film layer is fundamental to guaranteeing the correct functioning of mechanical components and equipment [
22,
23]. One of the main difficulties for real-time monitoring of the lubricating film layer is the complexity involved in developing non-invasive systems that can be directly applied to mechanical components [
24]. Lubricating film thickness measurement techniques based on optical [
25] and electrical [
26] principles have been widely discussed by several authors [
27]. Although both methods prove to be effective, they have limitations. In the case of electrical methods, there may be a need to electrically insulate the contacting elements. As for the use of optical methods, it is necessary to use transparent contacting elements, which makes application outside the laboratory environment difficult. The ultrasound film thickness measurement technique does not have such limitations. Furthermore, it has proven to be a very promising technique, mainly due to its versatility and measurement capacity [
13].
In a lubricated contact, the ultrasonic wave will have part of its energy reflected and part transmitted when it encounters a thin layer of fluid. The amount of this reflection is then associated with the acoustic impedance of the materials creating the interfaces. The greater the disparity of this acoustic property of the materials, the greater the proportion of the reflected wave. The part of the wave transmitted through the solid-oil interface will be reflected again upon reaching a new interface. These successive reflections of the waves tend to overlap into very thin film layers (in the order of the pulse wavelength) [
28,
29].
Several reliable models for measuring film thickness using ultrasonic sensors have been developed, allowing the investigation of a wide range of film thicknesses. In fact, the different methods complement each other, suppressing the limitations of each one [
5,
29,
30,
31]. Some criteria, such as the magnitude of the film thickness, the geometry of the lubricated contact, and the characteristics of the ultrasonic pulse, need to be considered to guarantee the accuracy of the chosen model [
30].
The information regarding the incident and reflected waves has been used in the different models proposed in the literature to compute lubricant film thickness. The spring model considers the reflection coefficient (
R) of the reflected waves to extract information about the lubricant layer [
19]. When the spring model is used to obtain film thicknesses, it is considered that the behavior of the ultrasonic waves is governed by the stiffness of the lubricant layer (
K), which depends on the mass modulus (
B) and the thickness of the film layer (
h). This is due to the fact that the film layers investigated by the spring model are very thin (below 10 µm), causing the interaction of sound waves with this thin liquid layer to present a very high first resonance frequency. The spring model uses the information obtained in the amplitude of the returned signal together with the acoustic properties of both the fluid and the materials of the contacting surfaces [
1,
13,
22,
32,
33]. A simplified relationship between the stiffness of the film layer (
K) and the reflection coefficient (
R) was presented by Reddyhoff, Dwyer-Joyce, Zhang, and Drinkwater [
22] to define the film thickness between two surfaces:
where
ρ is the density of the liquid,
c is the speed of sound in the lubricant,
z′ is the acoustic impedance of the materials on each side of the fluid (in this case the same material was considered for both sides),
f is the center frequency of the ultrasonic sensor, and
R is the reflection coefficient. The signals referring to the pulses returned both from the reference interface and from the lubricant layer, first obtained in the time domain, are converted to the frequency domain through a fast Fourier transform (FFT). The amplitude of the signal reflected by the oil film layer (
Ameas) and a reference amplitude (
Aref) obtained without the presence of lubricant are used to obtain the reflection coefficient. To perform the film thickness calculations, the reflection coefficient (
R) can be calculated by Equation (2) [
17]:
As the lubricant film gets thicker, the spring model no longer results in accurate values; thus another model known as the resonance model can be used to determine subsequent thickness [
14,
15]. Similarly to the spring model, the resonance model approach also considers that the behavior of the lubricating film layer is governed by the reflection coefficient. However, this model relates the thickness of the lubricating film layer to the resonant frequency of the incident wave along with its velocity in the liquid medium. The resonance frequencies can be defined in the regions where the reflection coefficient,
R, presents periodic minima. For the calculation of the film thickness via the resonance model, the minimum coefficient of reflection is considered when the resonance frequencies occur within the bandwidth region of the ultrasonic sensor. The relationship between film thickness and resonance frequency range is given by Equation (3) [
34,
35]:
where
c is the speed of sound in the lubricant and ∆
fm corresponds to the interval between two minimum frequencies. Sometimes the periodicity between these minima is not evidenced, and only a resonance is perceived in the spectrum of the reflection coefficient in the frequency domain. When this occurs, the frequency corresponding to this minimum is considered as the ∆
fm interval itself. Thus, very similar to Equation (3), the thickness of the film layer can be calculated by [
36]:
Despite the increasing use of ultrasound to monitor tribological contacts, including works that have used the technique very successfully in real mechanical components under industrial conditions, it is important to point out that many factors can affect the measurements. For example, the type of oil and temperature affect the acoustic properties of the lubricants, but it is common that the models use room temperature values, and sometimes the values for the speed of sound in the lubricant are not measured but taken as average values for a similar lubricant. Moreover, the effects of such effects may vary depending on the model used, since the film thickness values may vary either linearly or with the square of the speed of sound for the different models. Although the models used in this work have been widely used in the literature, in this work we utilized a calibrated gap between the steel plates so that the real geometry of the lubricant film thickness was accurately known. Therefore, it was possible to compare and identify the limitations of the models for oils with different acoustic properties. Since the steel-to-steel gap was completely characterized in terms of geometry and materials, this test setup can be proposed as a new way to characterize oil properties in a thin gap. Moreover, although not addressed in the literature regarding acoustic measurements of tribological contacts, when air (or other gaseous matter) is trapped in the gap, the measurement could be affected, so that an incorrect measurement could be obtained. This setup avoids this problem by overflowing the gap; since the gap is not closed, air should not be trapped, thus ensuring that only the lubricant’s properties will be addressed.
The spring model and the resonance model were used to verify the relationship between the acoustic properties of the measured film layer in terms of its stiffness,
K, and its ability to reflect incident ultrasonic waves. For the spring model, a nominal gap geometry around 10 µm was chosen because it is around the limit recommended in the literature for using the spring model [
34]. The other three gaps with a thickness greater than 10 µm were employed for the resonance model. The phase variation of the incident and reflected waves was used to assist in the identification of resonance frequencies. Four oils, with different properties, were allocated between stainless steel plates so that they were kept static and with a previously defined spacing. A sensor with a central frequency of 14 MHz, coupled to the opposite face of one of the plates, was used to emit and receive ultrasonic signals. The aim was to identify the limitations of the models in terms of the acoustic properties of the fluid for a well-controlled gap geometry.
2. Materials and Methods
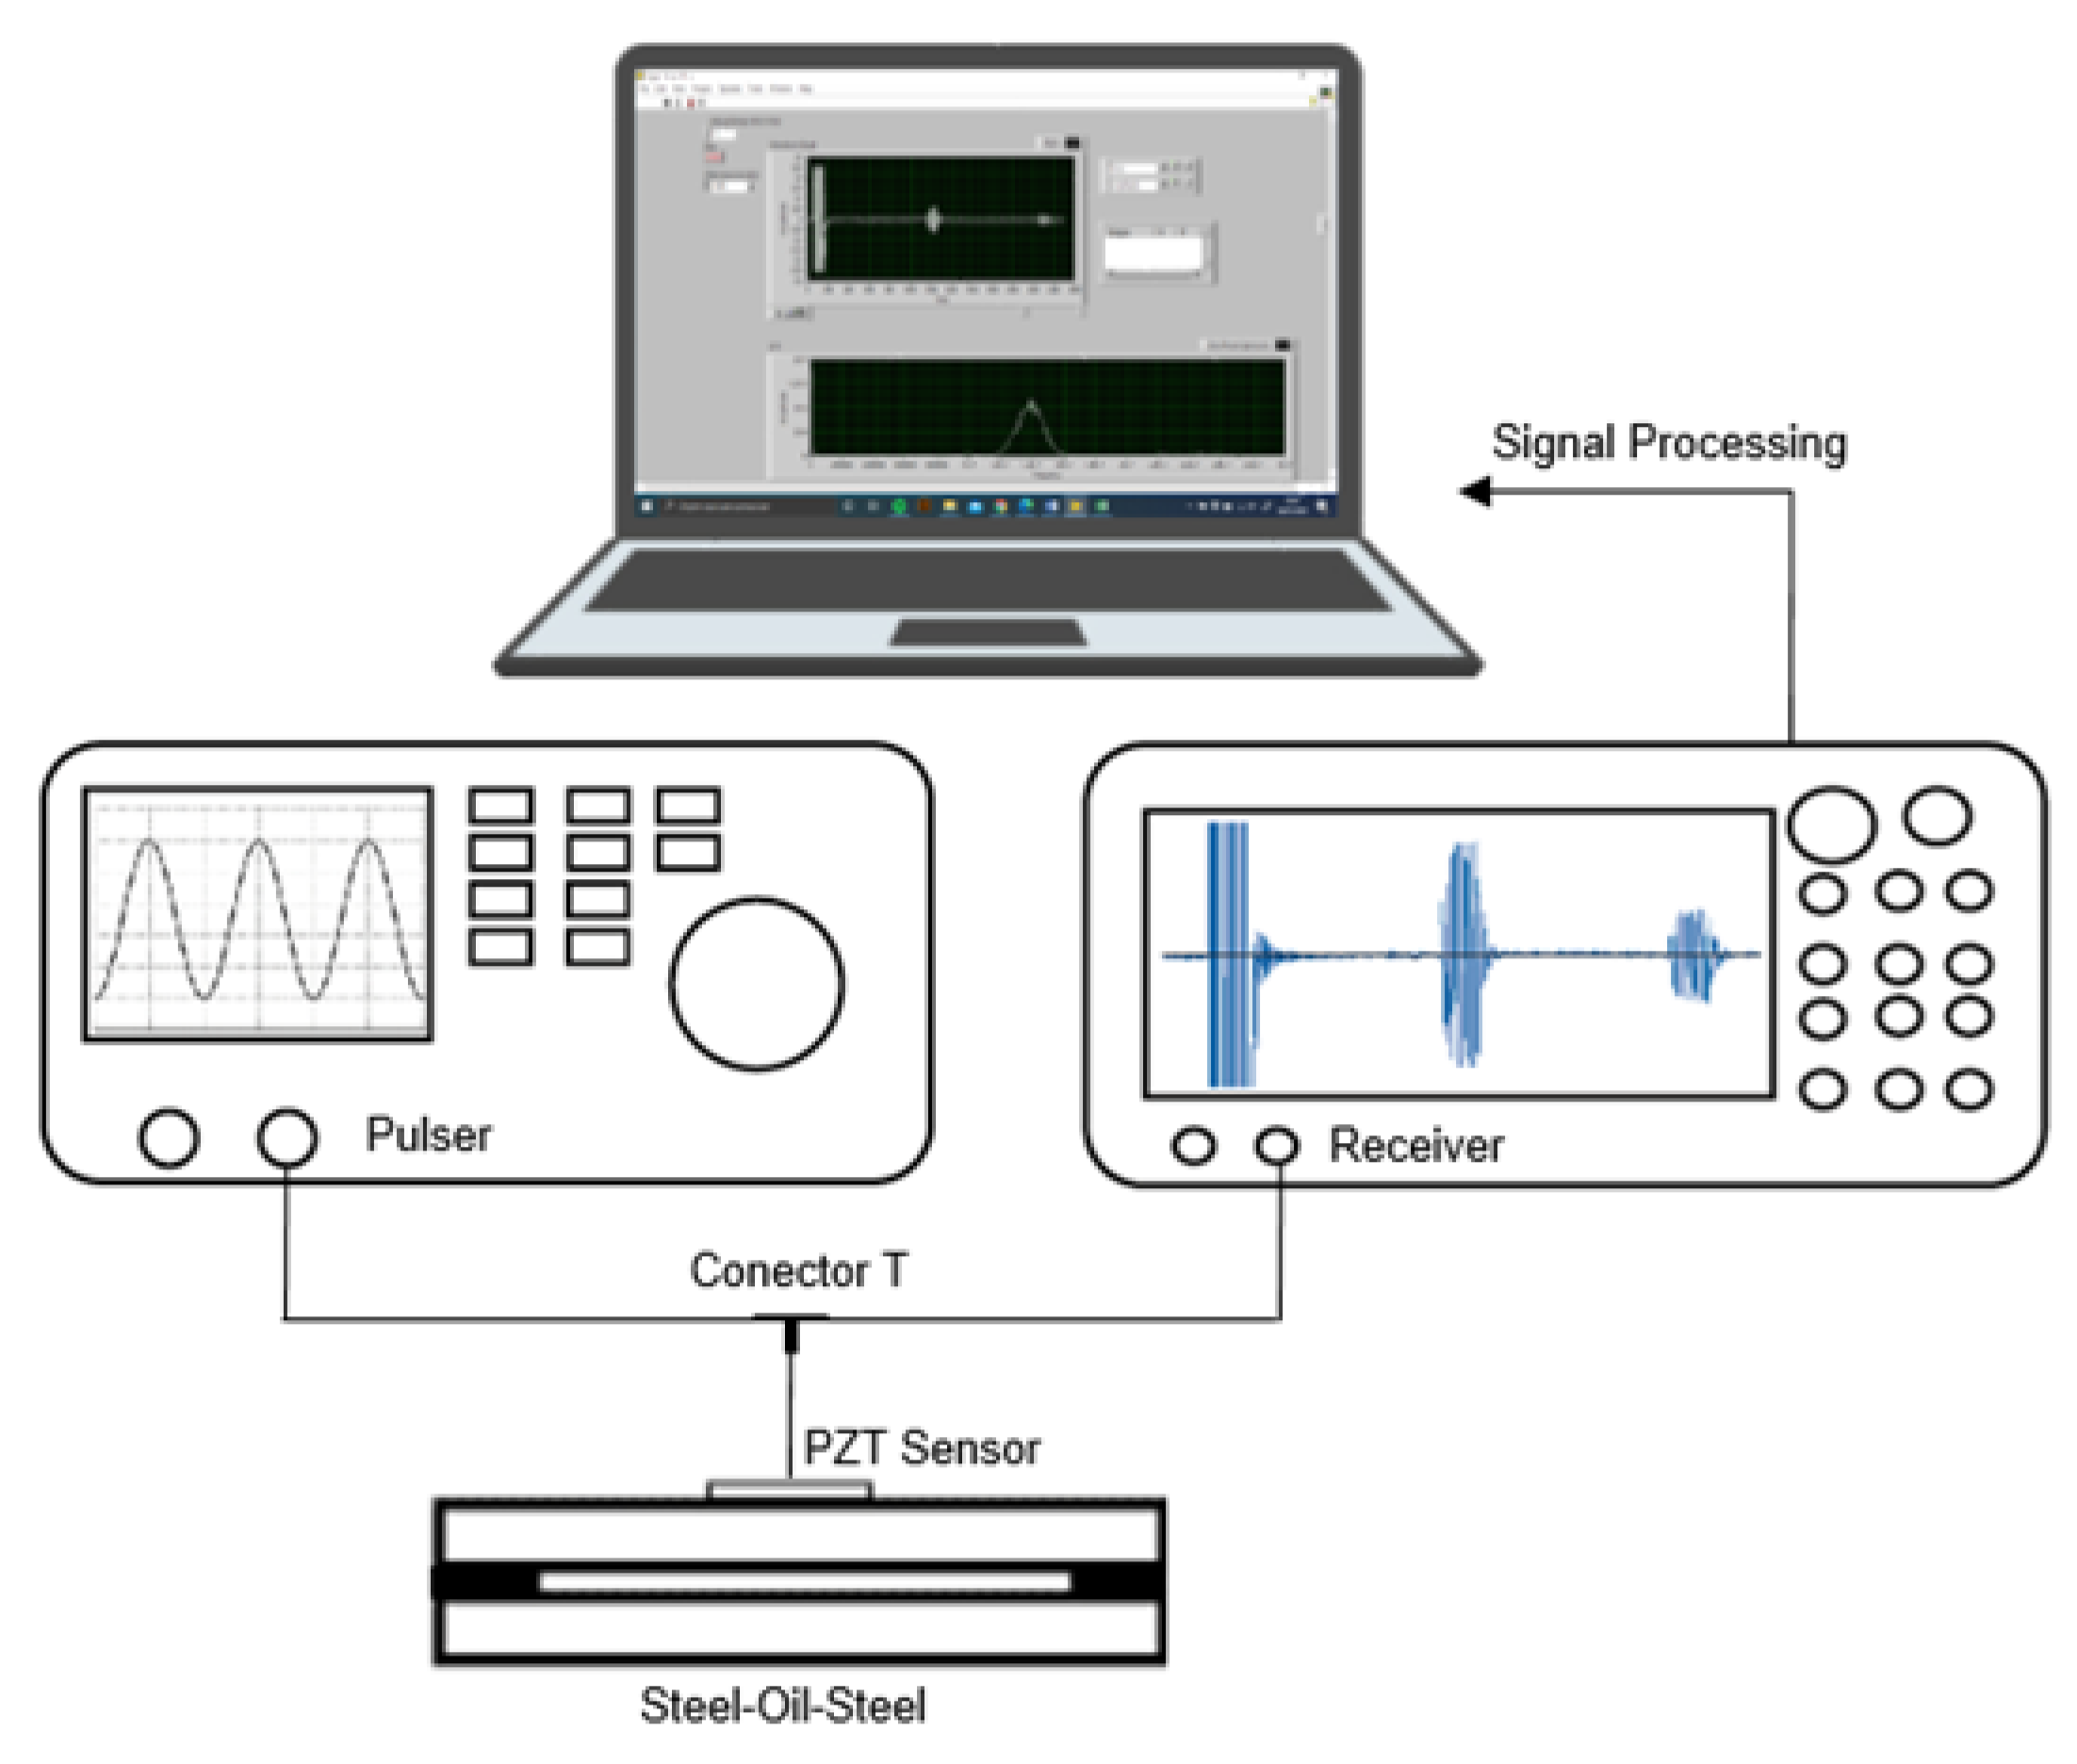
Figure 1 shows a scheme for the experimental setup used to measure lubricant film thickness by ultrasound. Two stainless steel plates separated by a lubricant layer created a three-layer system (steel–oil–steel). A piezoelectric sensor with a central frequency of 14 MHz was fixed onto the upper plate. The excitation of the sensor was performed using a function generator to create arbitrary functions of 100 MHz and a sampling rate of 250 megapoints/s, which provided a burst of sine waves in the range of the central frequency of the sensors. The reception and acquisition of signals emitted and returned by the sensors were performed using a 100 MHz oscilloscope with a sampling rate of 2 gigapoints/s. A dedicated Labview (Version 18.0) interface was created for data acquisition and processing.
The plates were manufactured from the same block of martensitic stainless steel 1.4313—X3CrNiMo13-4, both with identical dimensions (90 × 90 × 14 mm). During the execution of the tests, the piezoelectric sensor, fixed on the upper plate, operated in pulse-echo mode. The bottom plate is responsible for delimiting the amount of lubricant between the two plates. For this, two standard steel gauges with the same thickness were fixed at the ends of the face of the lower plate. The steel gauges used on the lower plate limit the approximation between the two plates, thus creating a channel with a height corresponding to the thickness of the steel gauges.
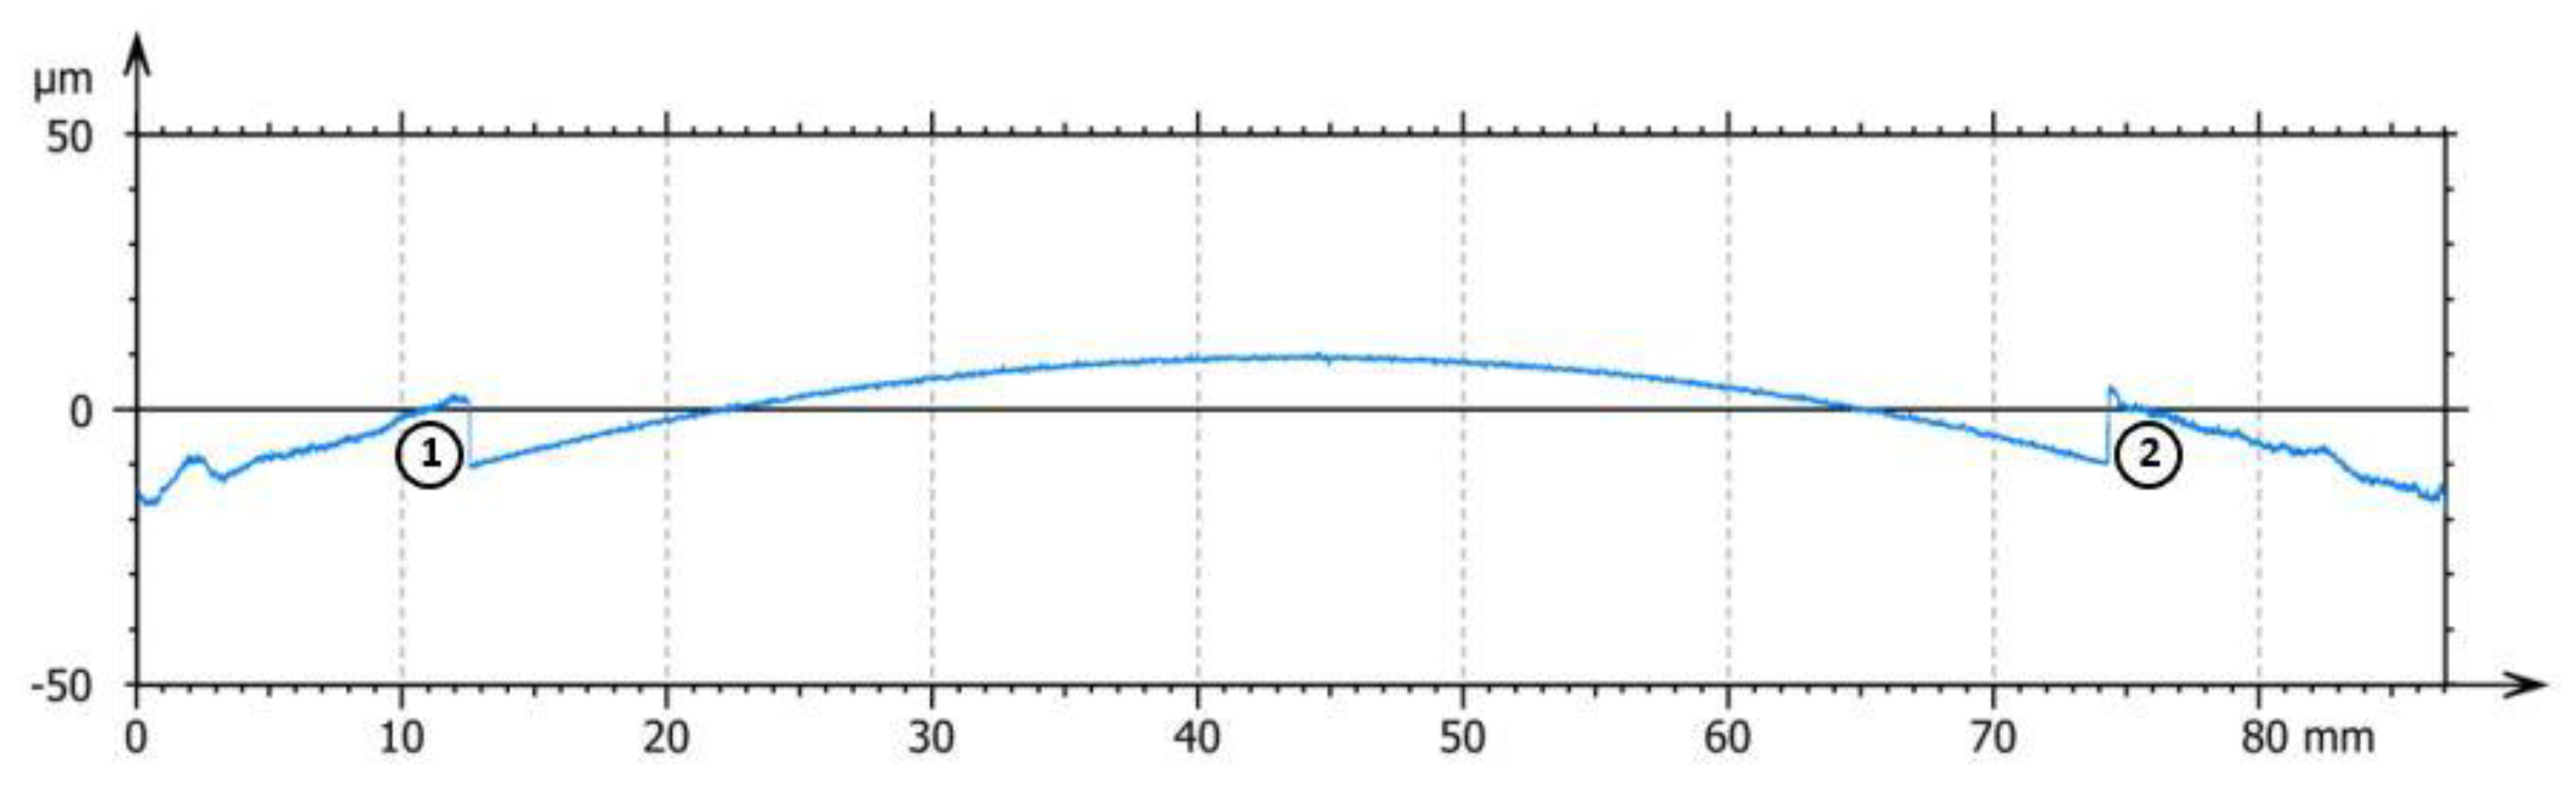
In this work, the surface finish of the plates used was brought to its best condition according to the needs and characteristics of the film thickness measurement models adopted. The plates were carefully ground to obtain the lowest achievable roughness. Attempts were made to achieve even lower roughness levels via lapping, but that led to a deterioration of the surface flatness. Even if lapping can confer an even better roughness condition, the surface profile tends to vary in flatness. In
Figure 2, it is possible to notice the variation in the flatness of the bottom plate when a very refined polishing was applied. This indicates that there really is a limit to which the decrease in roughness does not interfere with the surface profile. For the film thickness measurement settings and conditions adopted in this work, it is essential that the surfaces that limit the lubricating oil are parallel to each other in order to ensure the accuracy of the results.
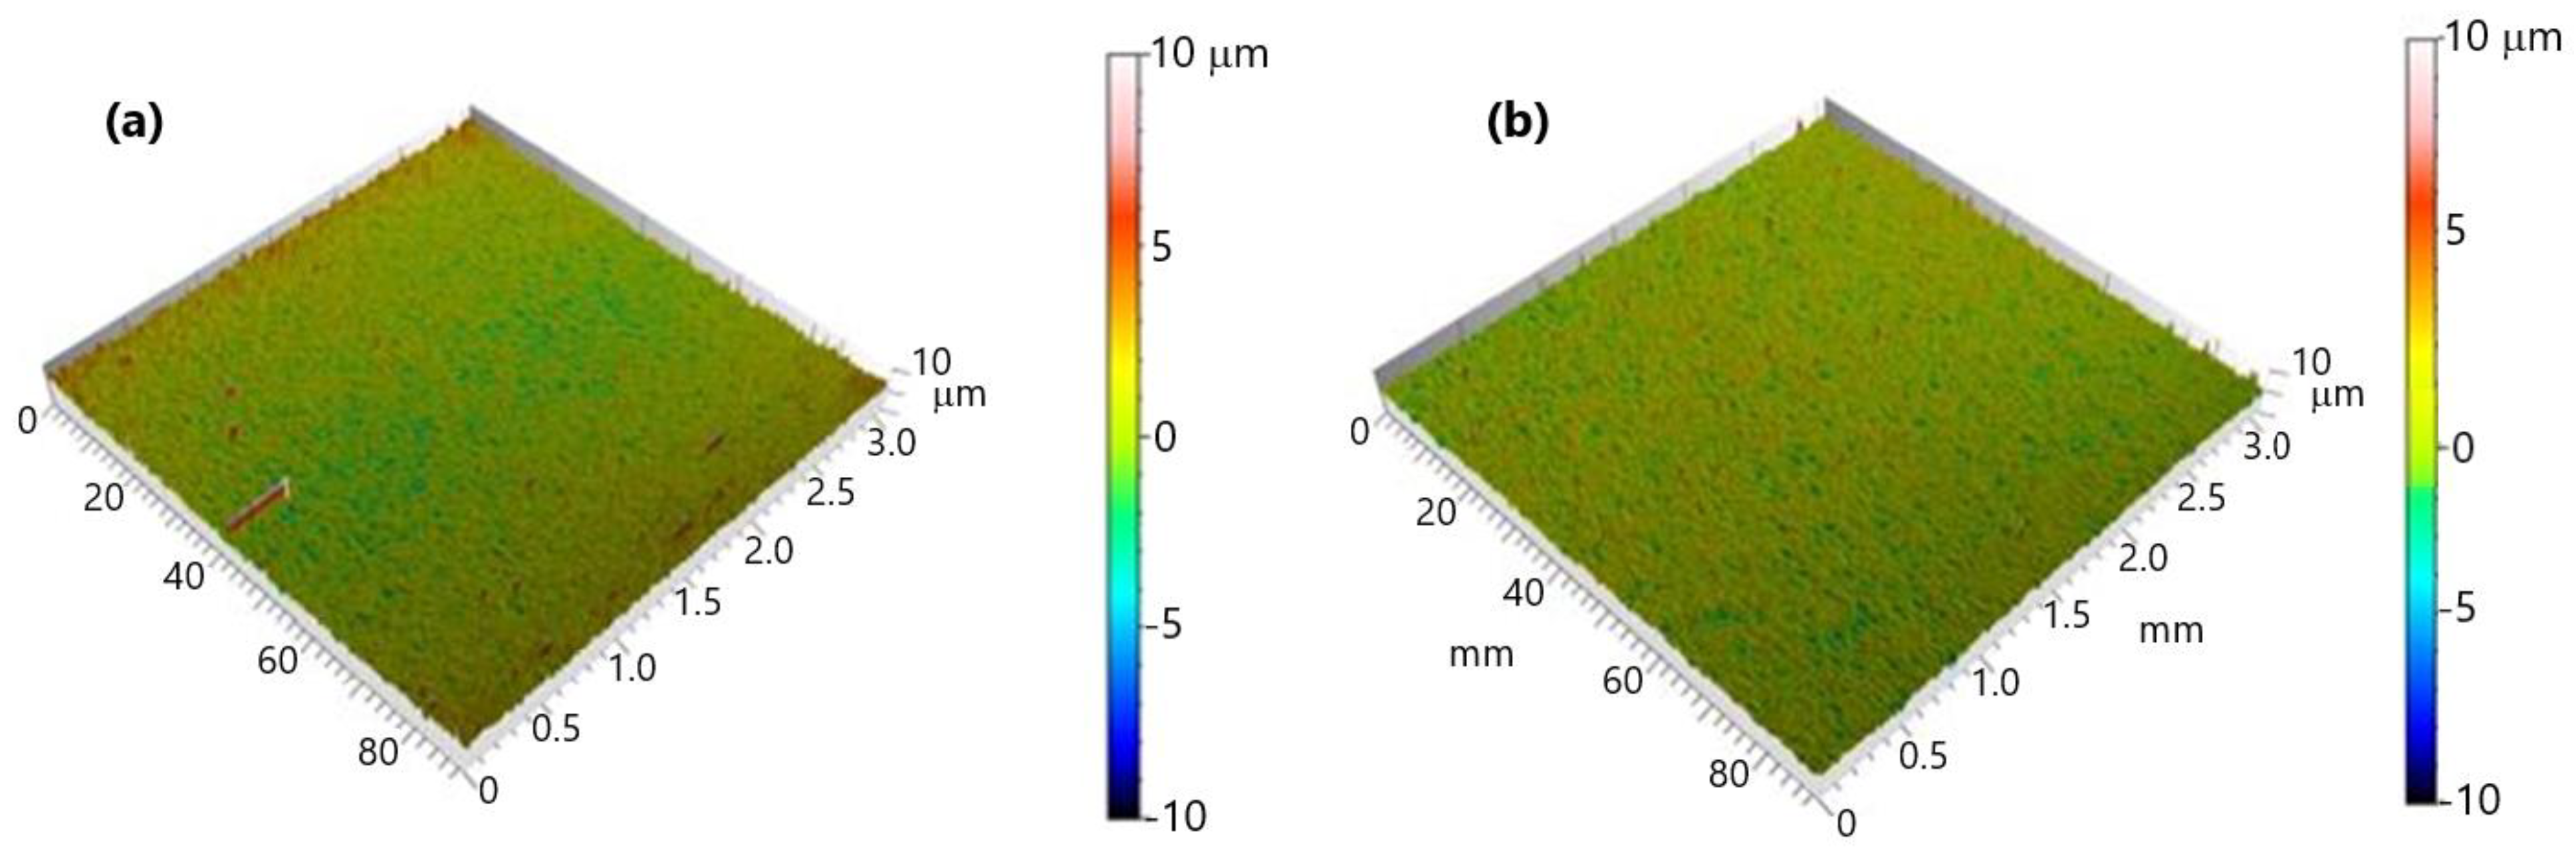
The 3D topographic maps presented in
Figure 3 represent the best possible surface finish for the lapping process used so that the surface profile was maintained. The plate profile was measured using an Alicona 3D optical microscope. The quantification of the surface roughness of the plates was carried out via the 2D roughness parameters presented in
Table 1.
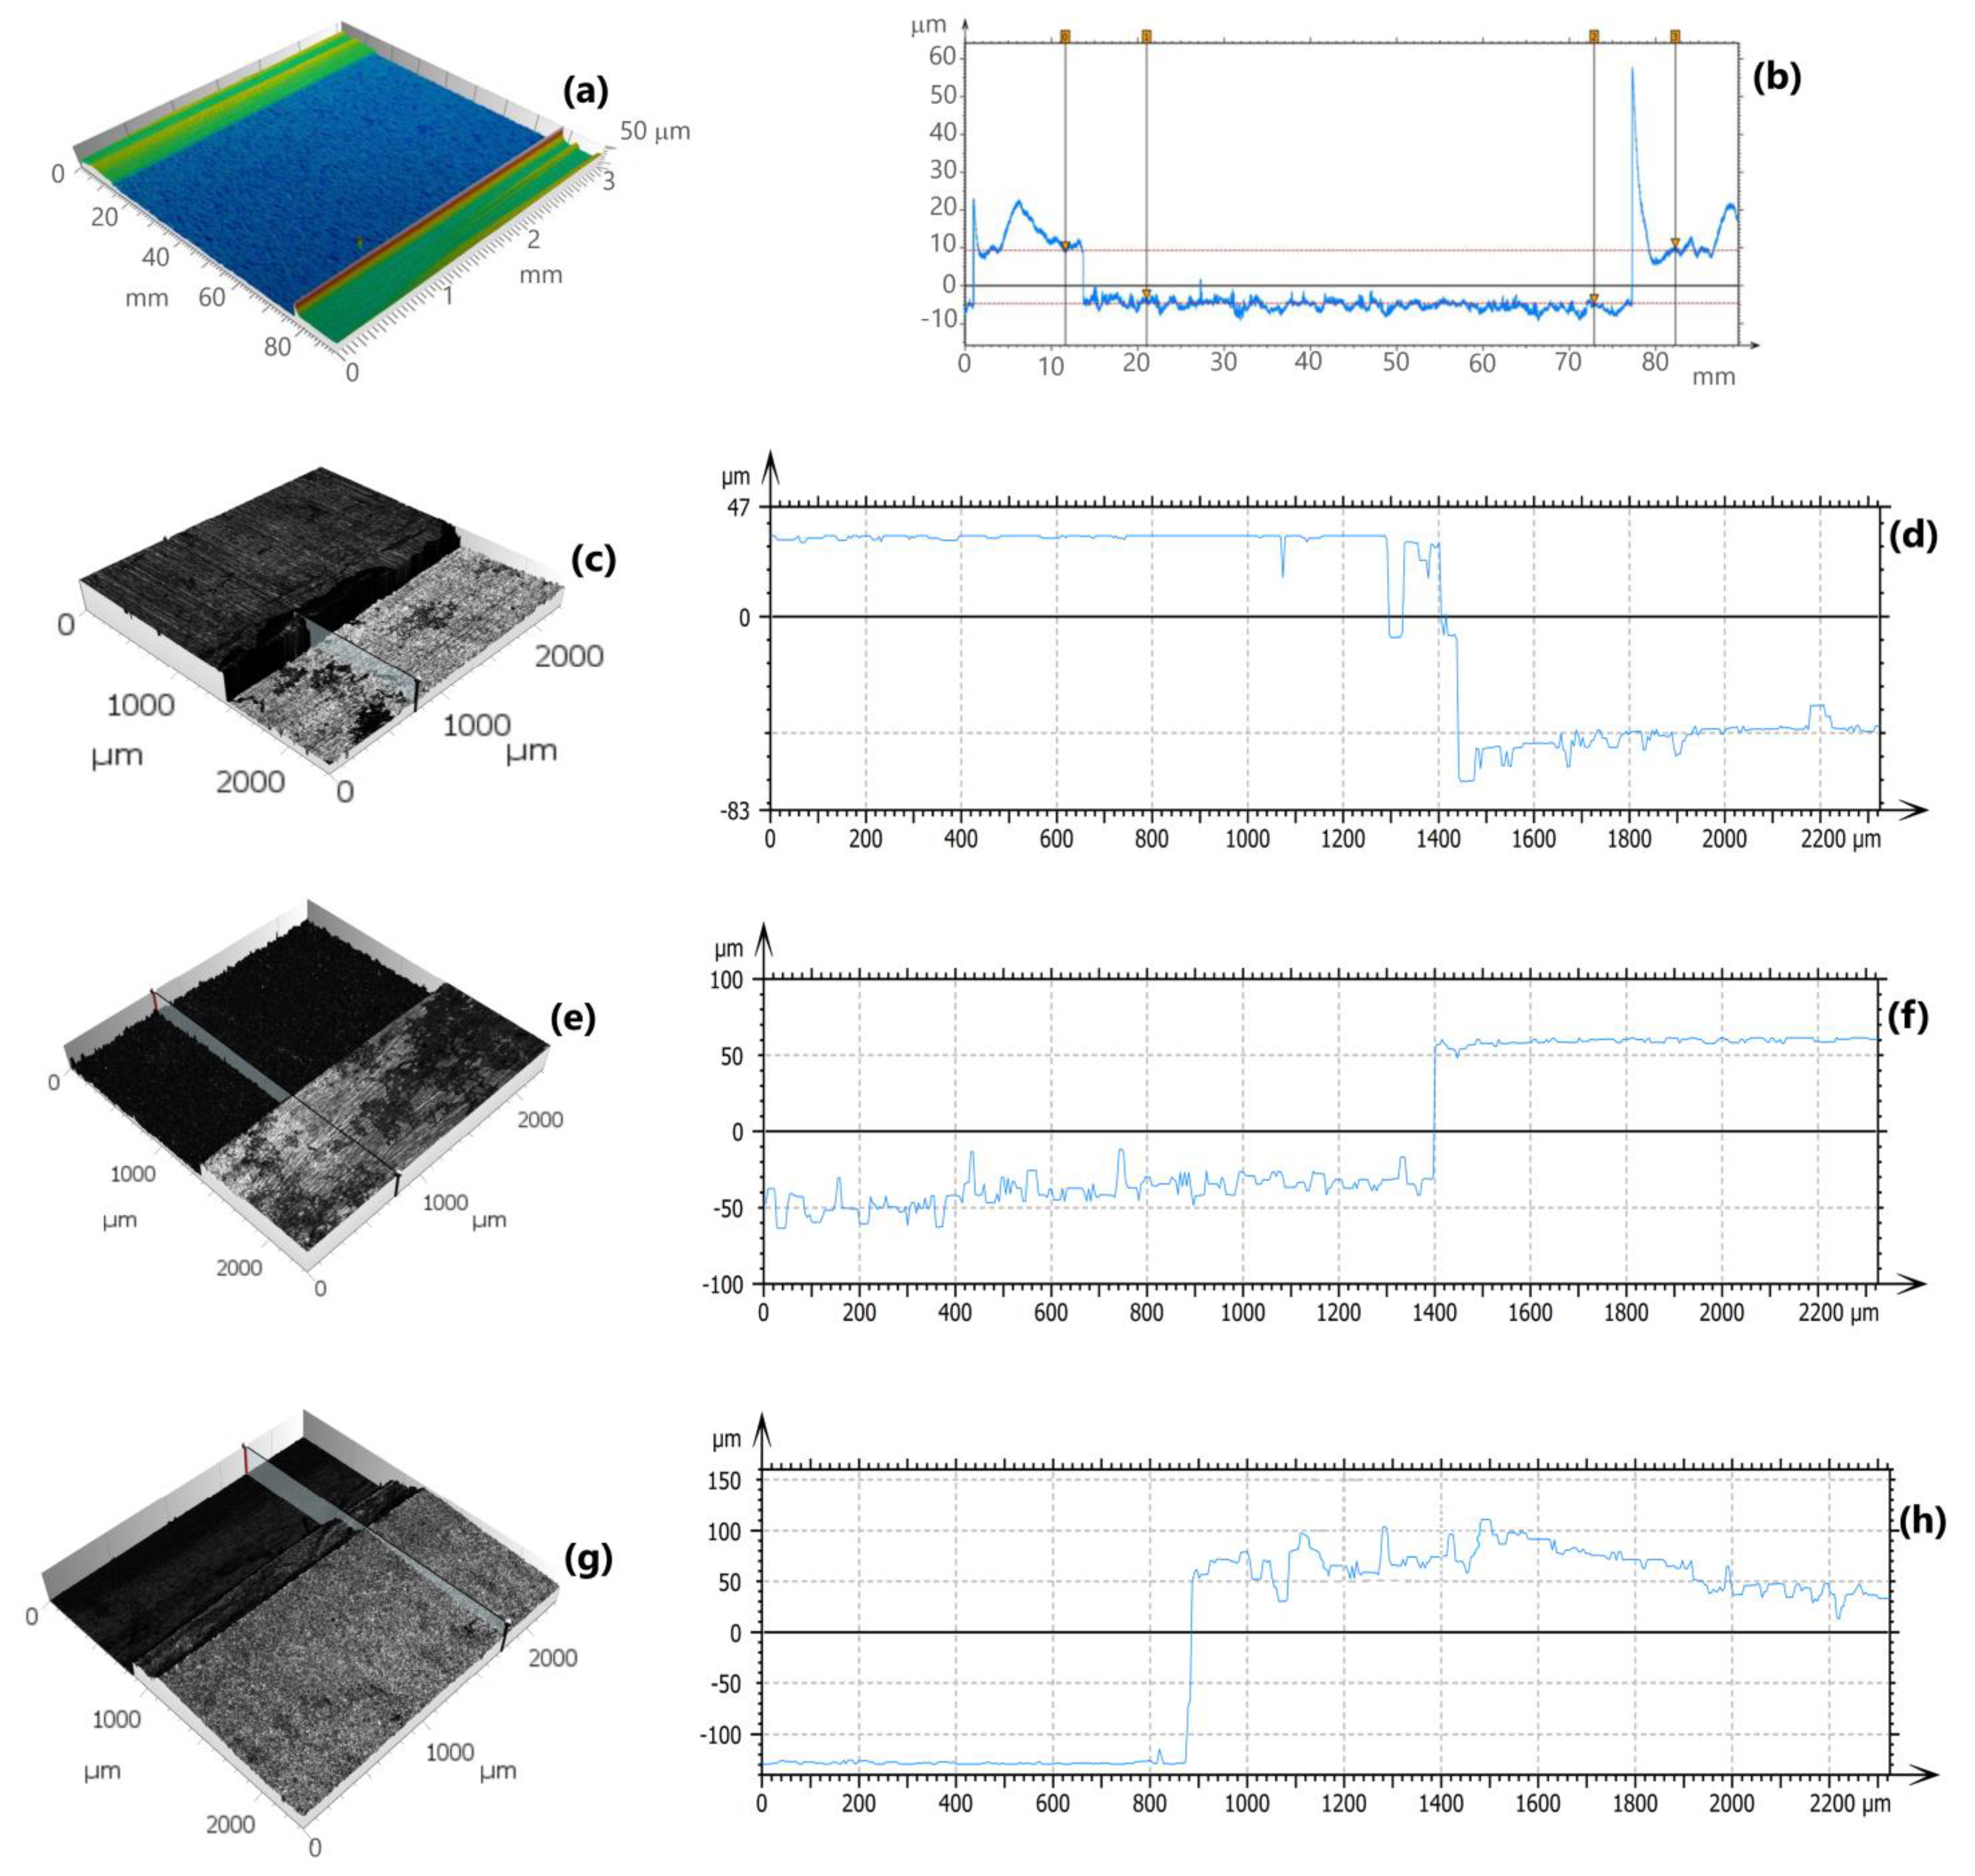
After the plates were polished to their best condition of surface finish, standard steel gauges were glued at the ends of the lower plate.
Figure 4 shows the 3D topography map of the lower plate after gluing the gauges that formed the channel intended to restrict the oil sample between the plates for different gaps. To facilitate the visualization of the channel heights created by the standard steel gauges on the lower steel plate, cross-sections with topographic profiles are shown in the left column. The measurements for the smaller gap (nominal thickness = 10 µm) were carried out using an Alicona 3D optical microscope. The channels formed in the bottom plate presented heights close to those specified by standard steel gauges that were fixed in the lower plate, around 11–12 µm. The peak in
Figure 4b (close to 78 mm) does not concern the height of the channel and can be considered as a reflection measurement error. For the thicker gaps, the measurements used a confocal microscope model Leica, TCS SP8. Since the measured areas that could be measured by the confocal microscope were substantially smaller, only one side of the gap could be evaluated, but no significant differences were found when measurements were carried out for both sides of the channel were compared.
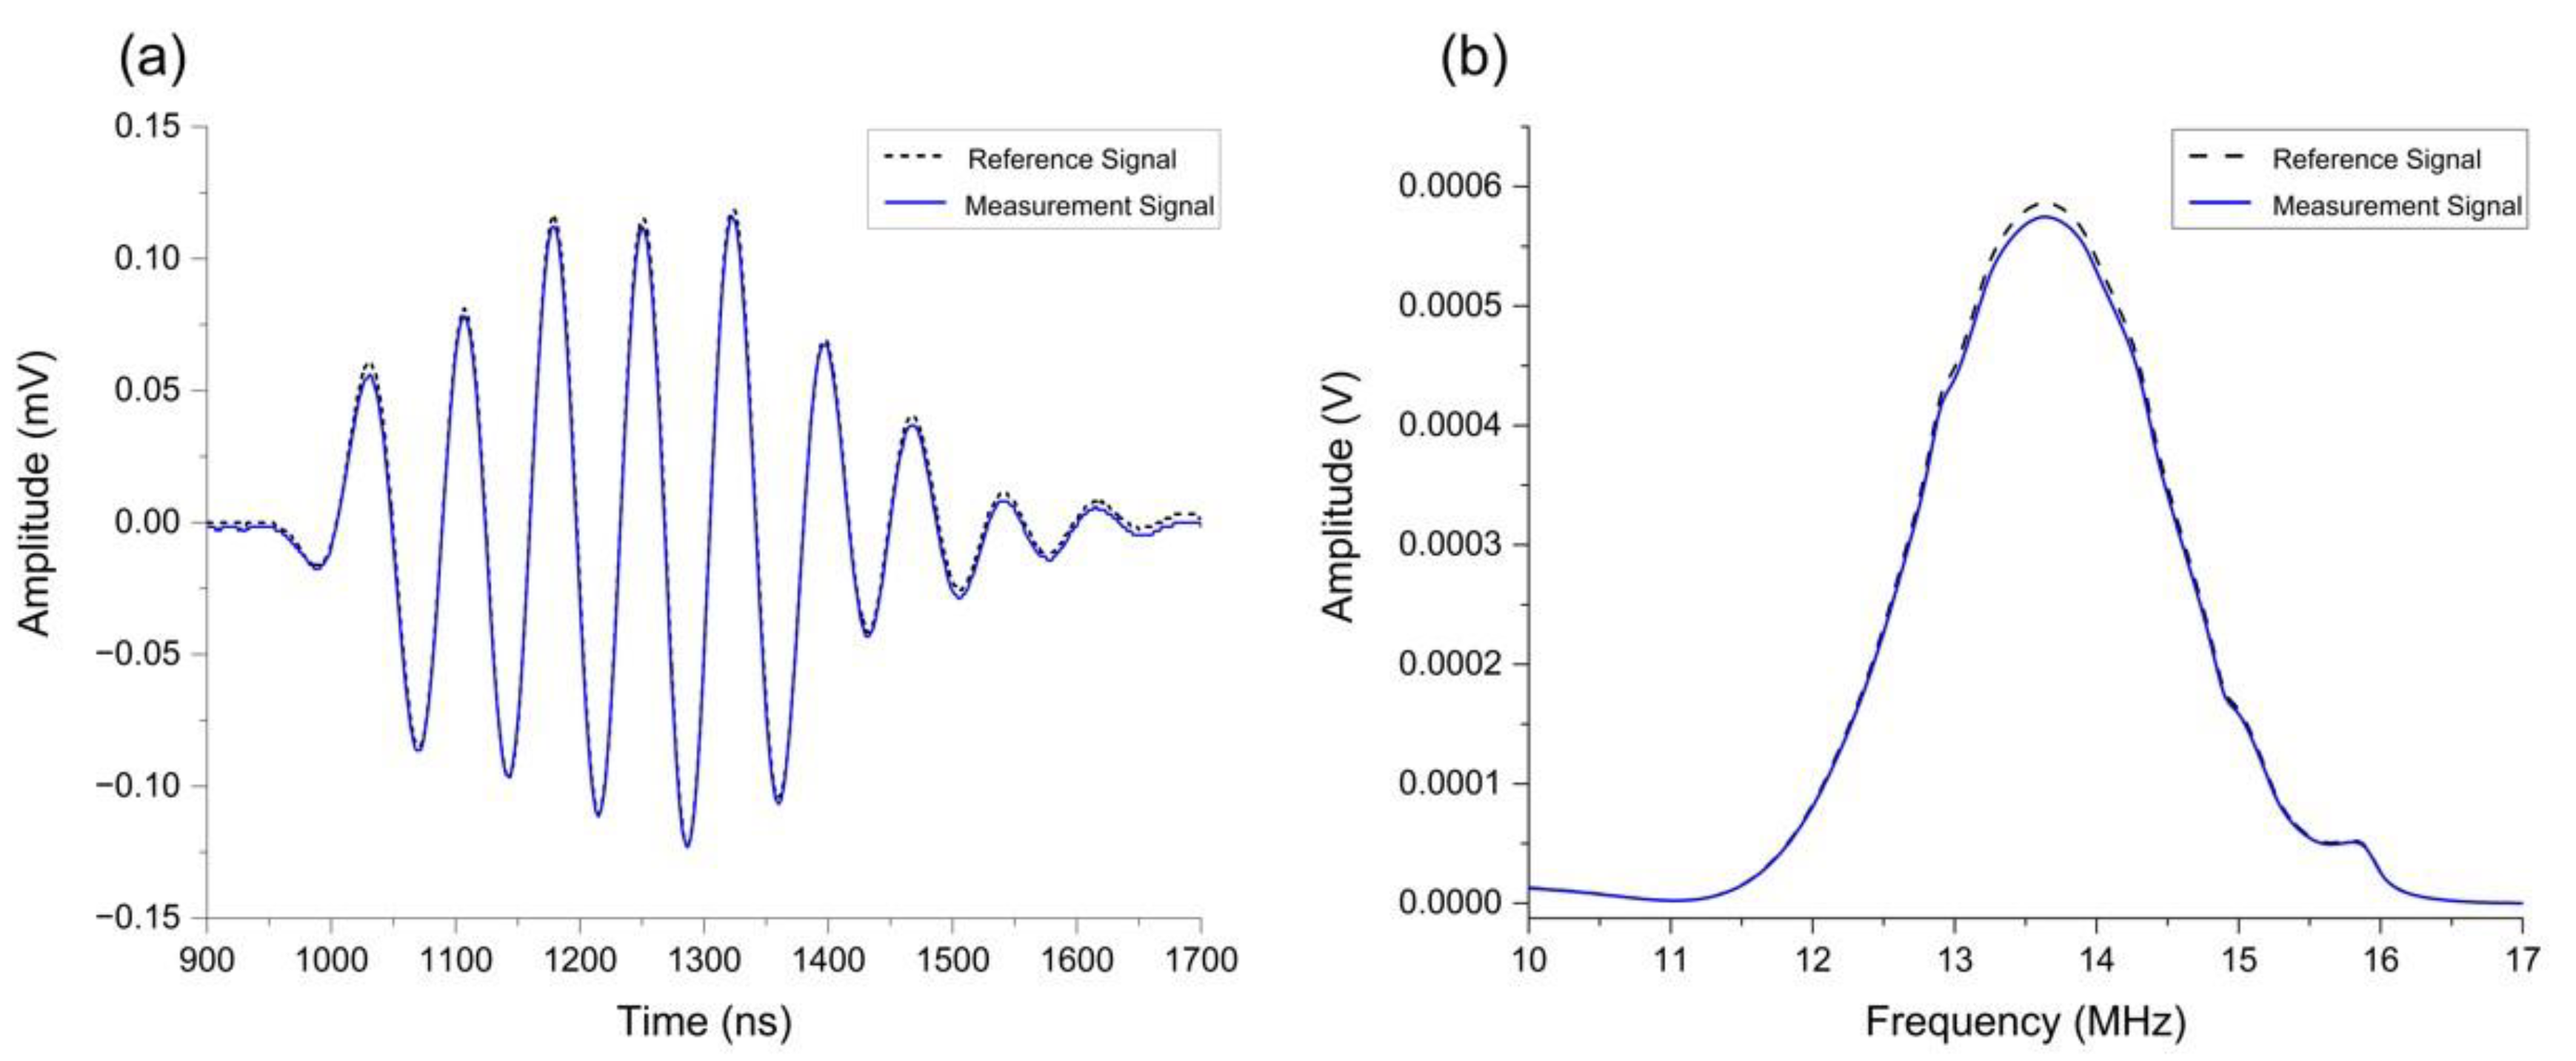
To use the spring model, a reference signal is necessary in addition to the signals reflected at the steel–liquid interface. The reference signals are obtained when the upper plate does not contact with any oil sample, that is, it considers a steel–air interface. An example of how the signals are presented can be seen in
Figure 5, showing both the reference and the measured signals in the presence of a drop of oil between the two plates. The signals are shown in the time domain (
Figure 5a) and in the frequency domain after the fast Fourier transform (FFT) (
Figure 5b). The determination of a reference signal is carried out using only the top plate of the measuring system. When an ultrasonic wave reaches the boundary of the plate’s interface with the air, it will be reflected almost in its entirety, presenting a large amount of information about the incident wave. The spring model was used only for the smaller gap of 11–12 µm, which is around the limit for the piezoelectric sensor used in this work, with a central frequency of 14 MHz.
For the resonance model, Equations (3) and (4) were used to identify the lubricant film thickness present between the metallic plates for the gaps of 85, 100, and 170 µm. The precision of the measurements using this model is linked to the extraction of resonant frequencies that occur within the useful frequency region of the sensor used; hence, the importance of correctly identifying the resonance frequencies in the reflection coefficient spectrum.
Four different oils were used in the measurements. The choice of lubricants took into account the need for testing oils with different viscosities, as well as choosing both a base oil (PAO 4) and a wide range of formulated lubricants. The time-of-flight method was also used, but simply to determine the speed of sound propagation (
c) in each of the oils and stainless-steel plates. For this, the response time for ultrasonic waves imposed on lubricant samples when they were limited to a container with known dimensions was recorded. From the values of the speed at which sound propagates in a medium and having information on the density of the material (
ρ), it is possible to determine its acoustic impedance (
z =
c∙
ρ). The acoustic properties of the four lubricating oils used in this study, together with the acoustic characteristics of the stainless-steel plates, are presented in
Table 2, where the speed of sound for the steel and each lubricant was measured (three repetitions) at a temperature of 25 °C using a commercial ultrasound system model Phasor XS from manufacturer GE, Boston, MA, USA.
The measurements were performed by depositing a drop of oil on the lower steel plate and then positioning the upper plate, containing the piezoelectric sensor, on the metal shims. Each measurement was repeated six times. The test temperature was kept constant at around 25 °C, which is the same temperature for the measurement of the material´s acoustic properties. This is an important point, as a few degrees of difference between measurements will have a considerable impact on the results. Both the reference signal and the other signals measured during the tests were acquired in the time domain; therefore, they needed to be converted to the frequency domain through a fast Fourier transform. This conversion was performed using a VI (virtual instrument), created in the LabView (version 18.0) interface, simultaneously with the data collection.
3. Results and Discussion
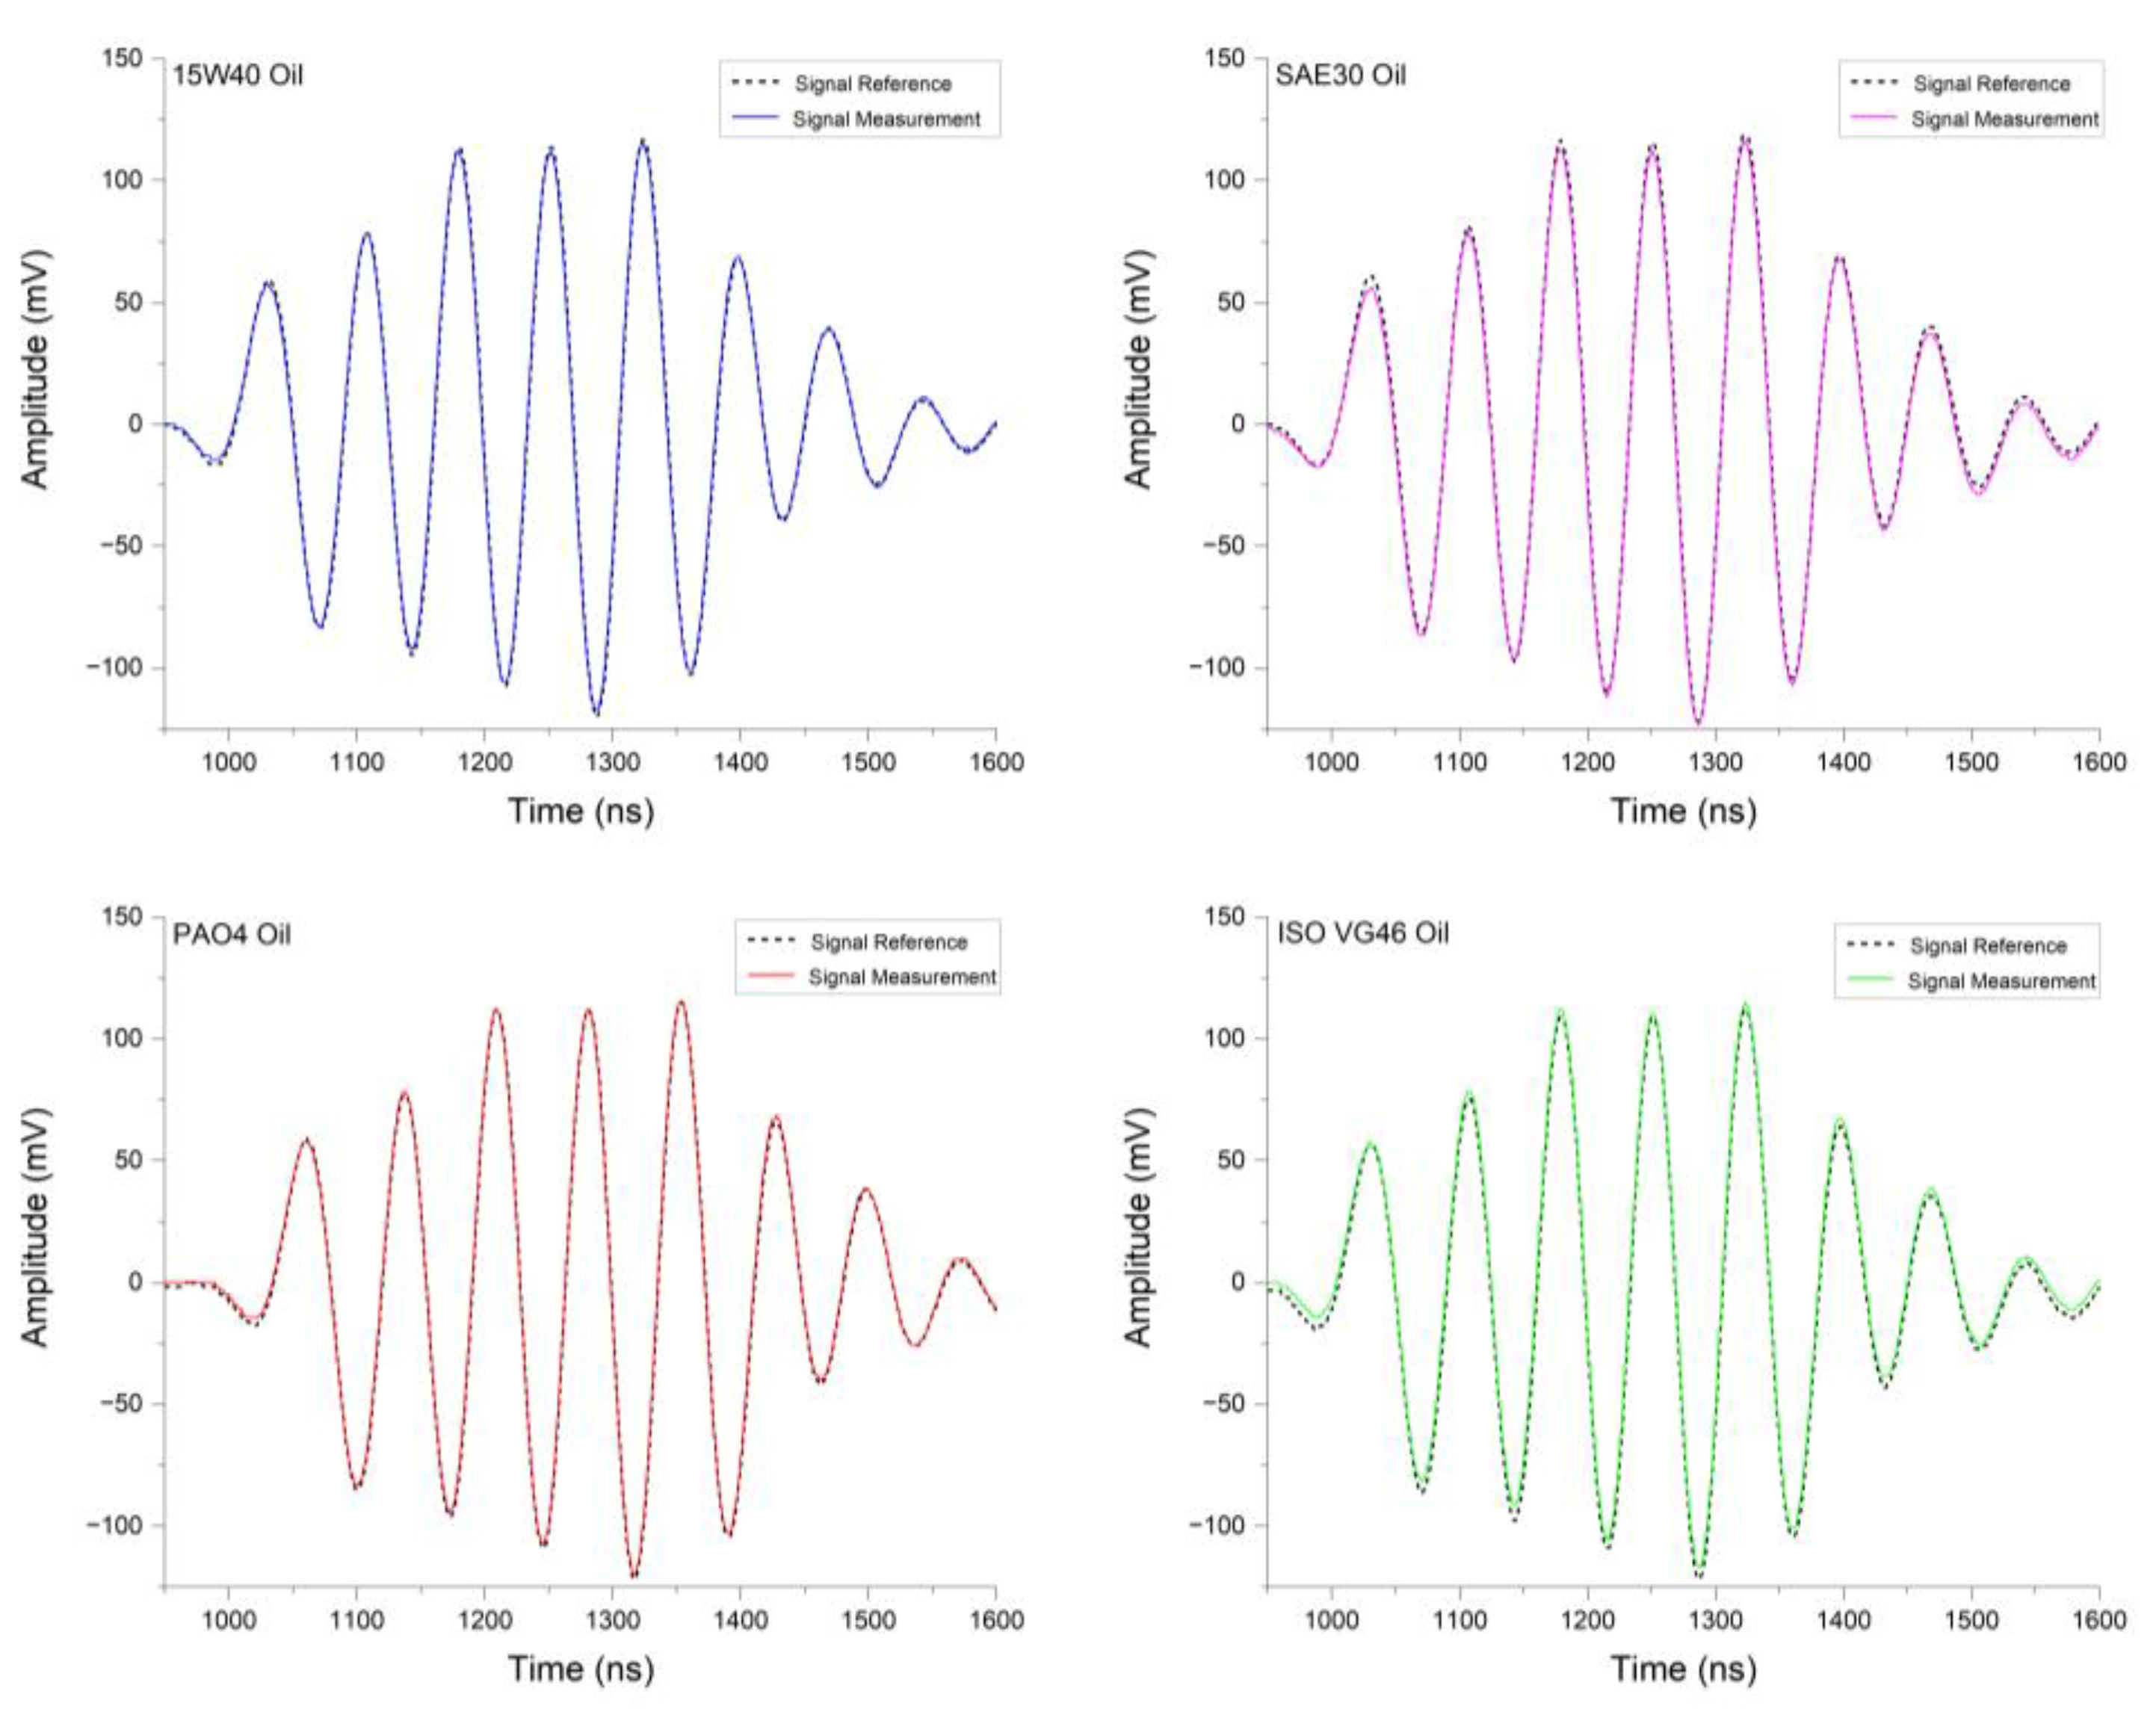
First, the spring model was used to verify the agreement between the measured film thickness values and the real geometry of the thinner gap (10 µm). The spectra of the signals reflected in the oil layer for each of the lubricants used are presented in
Figure 6 and
Figure 7, together with the spectra of the reference signal. The signals obtained in the time domain,
Figure 6, were converted to the frequency domain through the fast Fourier transform,
Figure 7. With this, the maximum amplitudes were used to define the reflection coefficient (
R) of each layer of oil measured.
During the measurements, it was possible to notice that the central frequency of the received signals was slightly below the central frequency of the piezoelectric sensor, around 13.6 MHz. This difference between the incident and received frequencies can be related to the attenuation of the waves when crossing the upper plate [
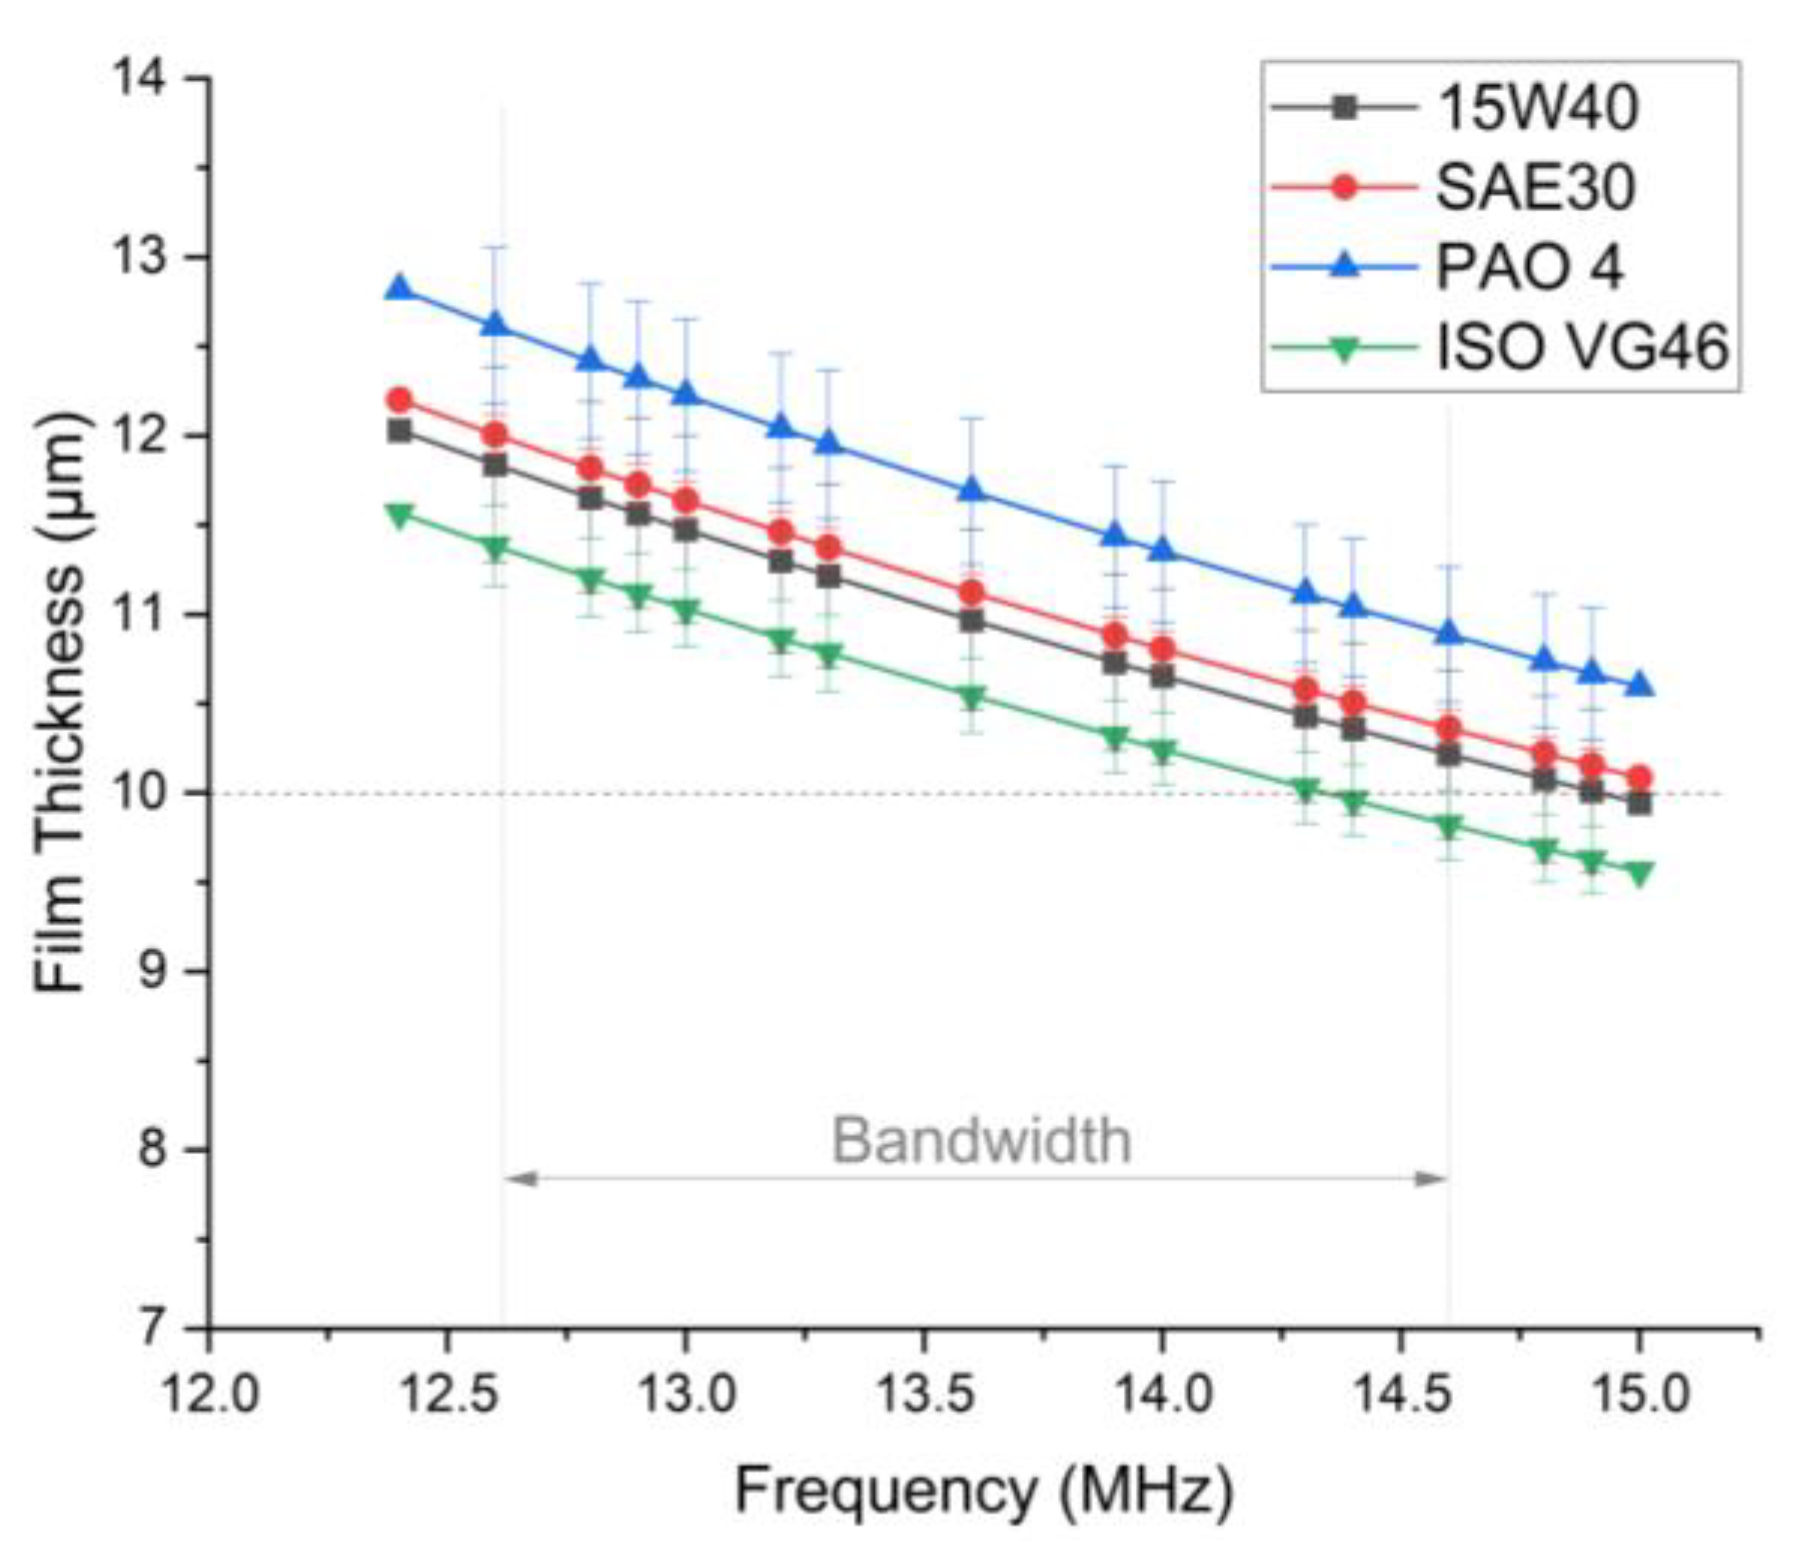
37]. For this central frequency of the received signals, the bandwidth (−6 dB) was defined between 12.6 MHz and 14.6 MHz, as shown in
Figure 7. The amplitude spectra show agreement in the behavior of the different measured layer spectra. This was already expected since the gap size and measurement conditions were kept identical for the four samples tested. The magnification in the region of the peaks of the spectra shows that for the PAO4 oil sample, there was a smaller attenuation of the reflected signal. This behavior may be related to its lower acoustic impedance compared to other oils.
From the spectra of the reference signal and the signals measured in the lubricant film layer in the frequency domain, the values for the reflection coefficient were obtained using Equation (2). From
Figure 6, the reflection coefficient values referring to the central frequency can be seen in
Table 3, corresponding to averages from six repetitions for each oil. When the standard deviation of the measurements is taken into account, no significant differences are observed between the average reflection coefficients for the different oils.
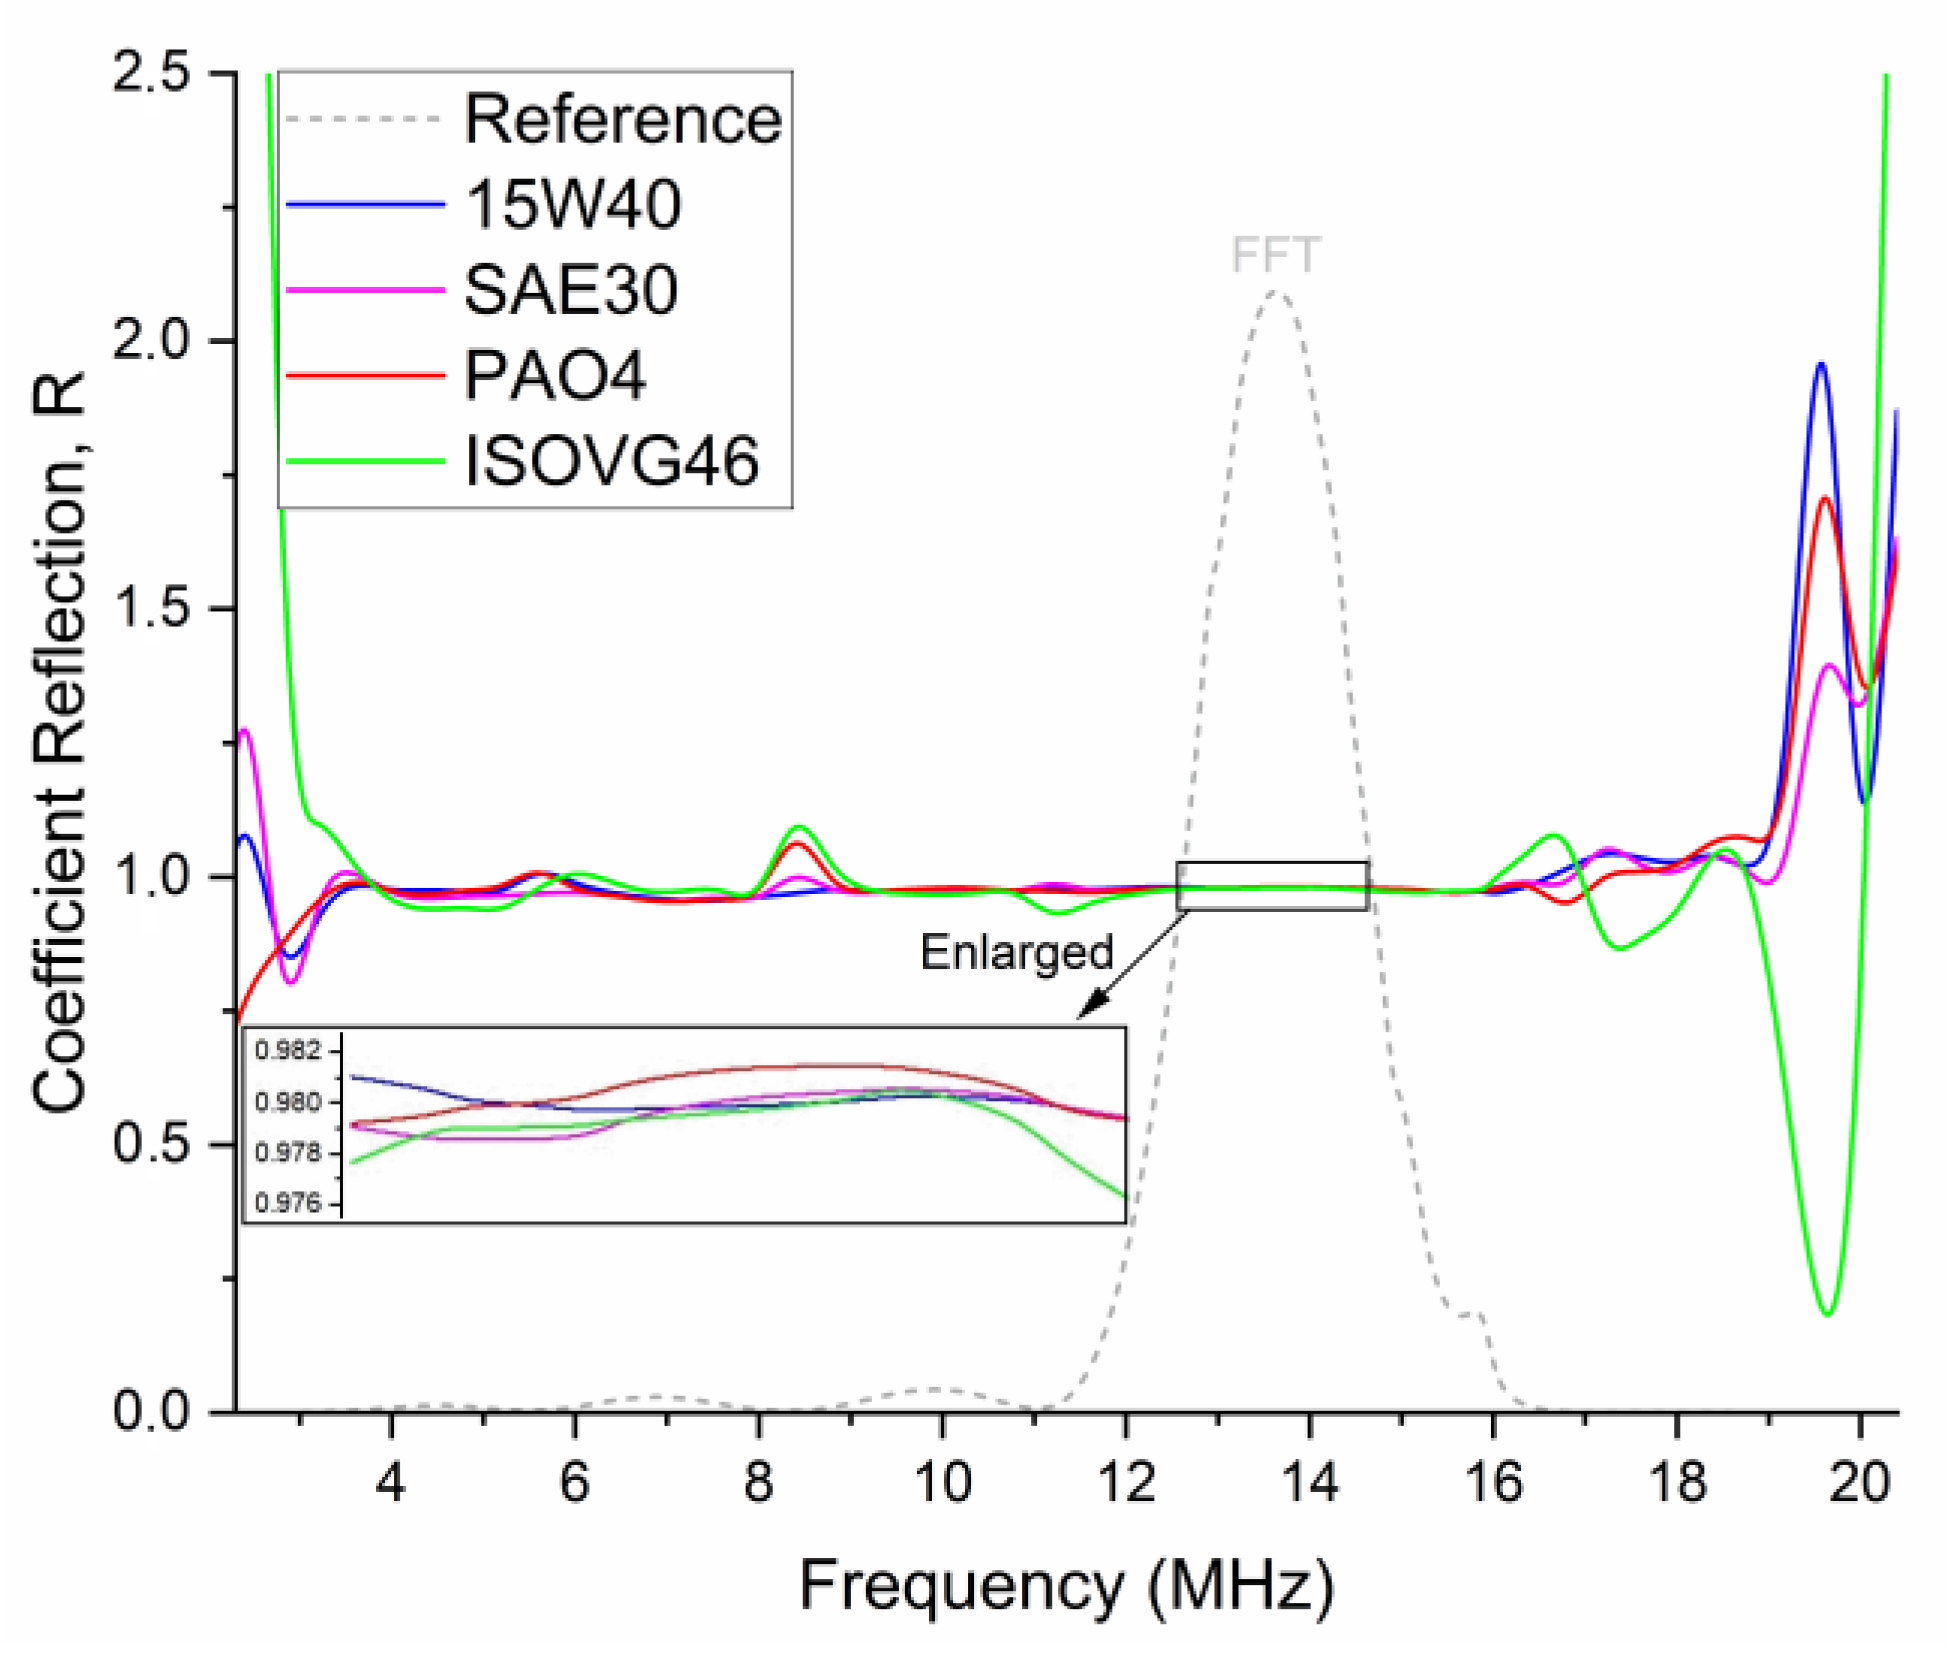
In
Figure 8, it is possible to notice the stability of the reflection coefficient curves within the bandwidth (BW) region of the FFT spectrum. This is one of the indications that an adequate choice of measurement model was made for the investigated film thickness range. The reflection coefficient values were very close to one (≈0.98). This value is in line with the results presented by Dwyer-Joyce, Harper, and Drinkwater [
33], where reflection coefficients above 0.9 were obtained when using 3 MHz sensors to determine films in the 10 µm range via the spring model. For sensors with a central frequency of 14 MHz, such as those used in this study, the reflection coefficient values are very close to one, favoring the increase in measurement uncertainty.
Figure 9 presents the thickness values within the bandwidth (BW) for the four oils measured using a 10 µm gap. The film thickness values are in good agreement with the true gap height shown in
Figure 4b, confirming the suitability of the ultrasonic model for this thickness range. and the adopted configuration are suitable for the purpose of this work.
In the measurements carried out, there is a limit for the values of the reflection coefficient where measured thicknesses present acceptable values. Below 0.975 and above 0.986, these measurements showed significant variations in relation to the nominal gap (given by the gauge thickness). As the gap used in this work is close to the measurement limits for the spring model, the sensitivity of the measurement system can be easily affected by factors inherent to the measurement process. As with the reflection coefficient, the thickness of the measured lubricant film layer is governed by its stiffness, K.
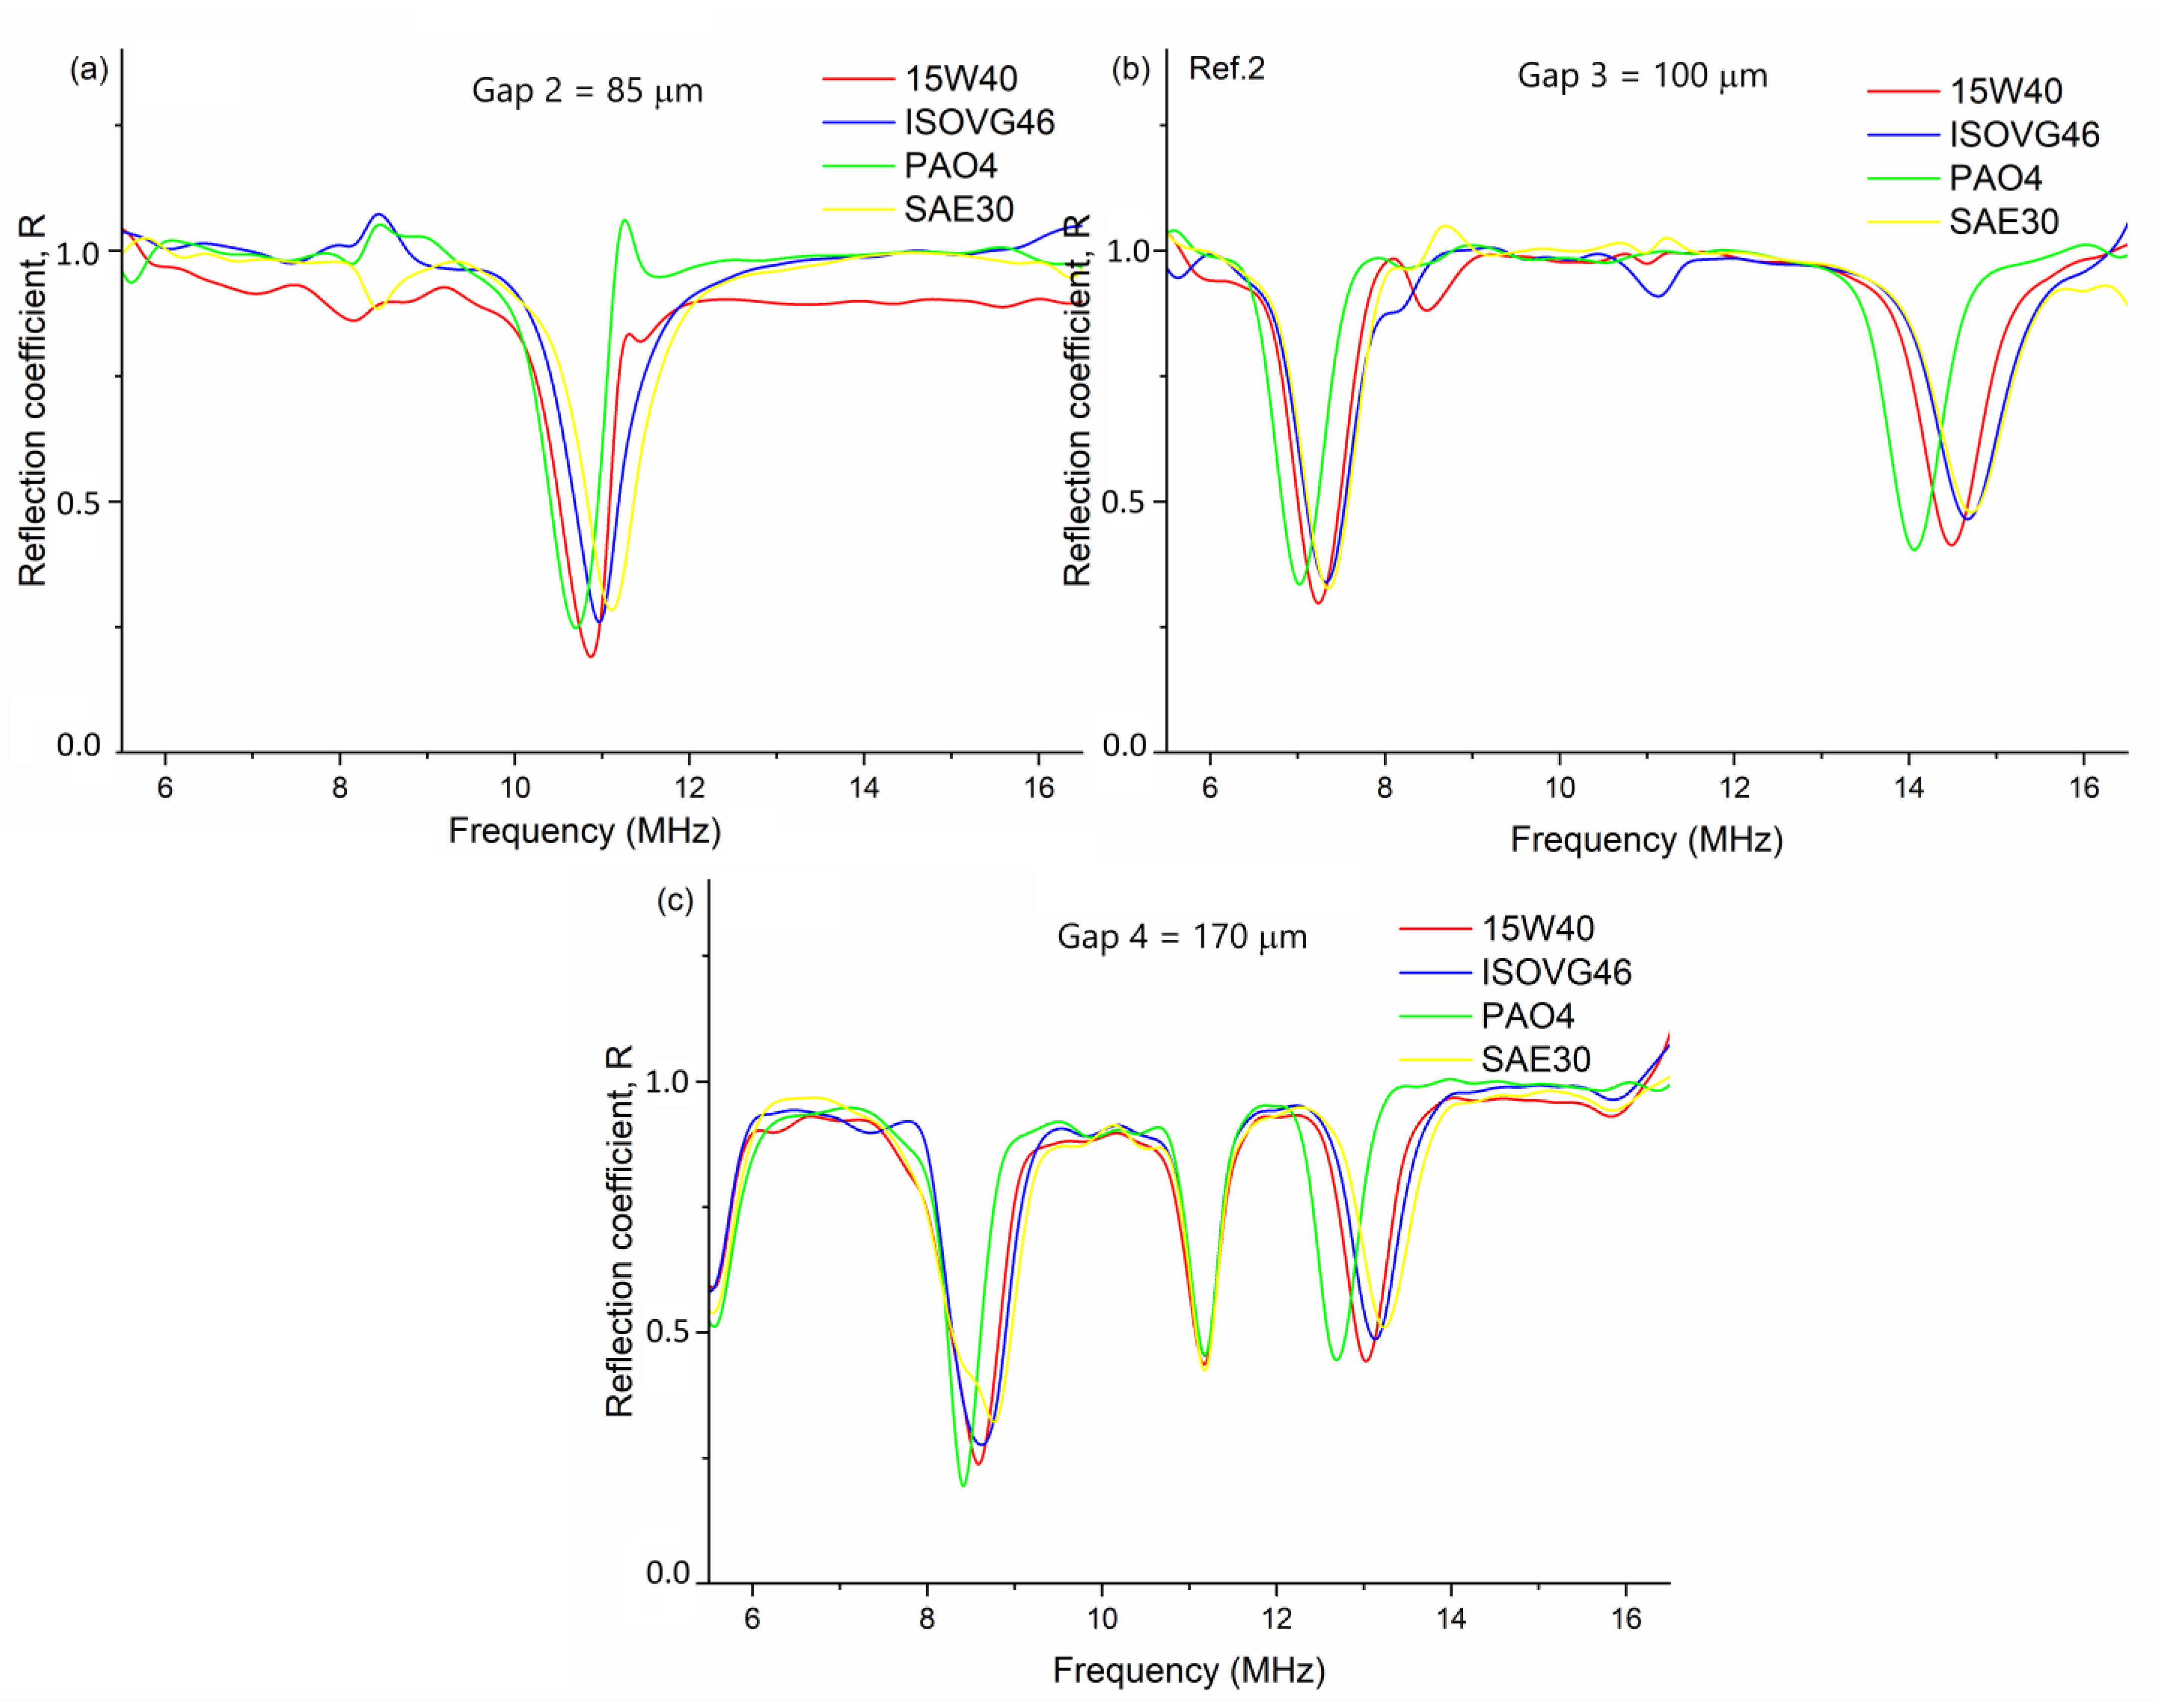
Having the thickness limitation for the spring model confirmed, the same experimental configuration was used to measure the three thicker gaps using the resonance model. The presence of minimum amplitude in the reflected signal spectrum is one of the main indications that the choice of the resonance model may be the most appropriate to determine the film thickness. The minimums representing the resonance frequencies for the gaps used in the experiments are shown in
Figure 10.
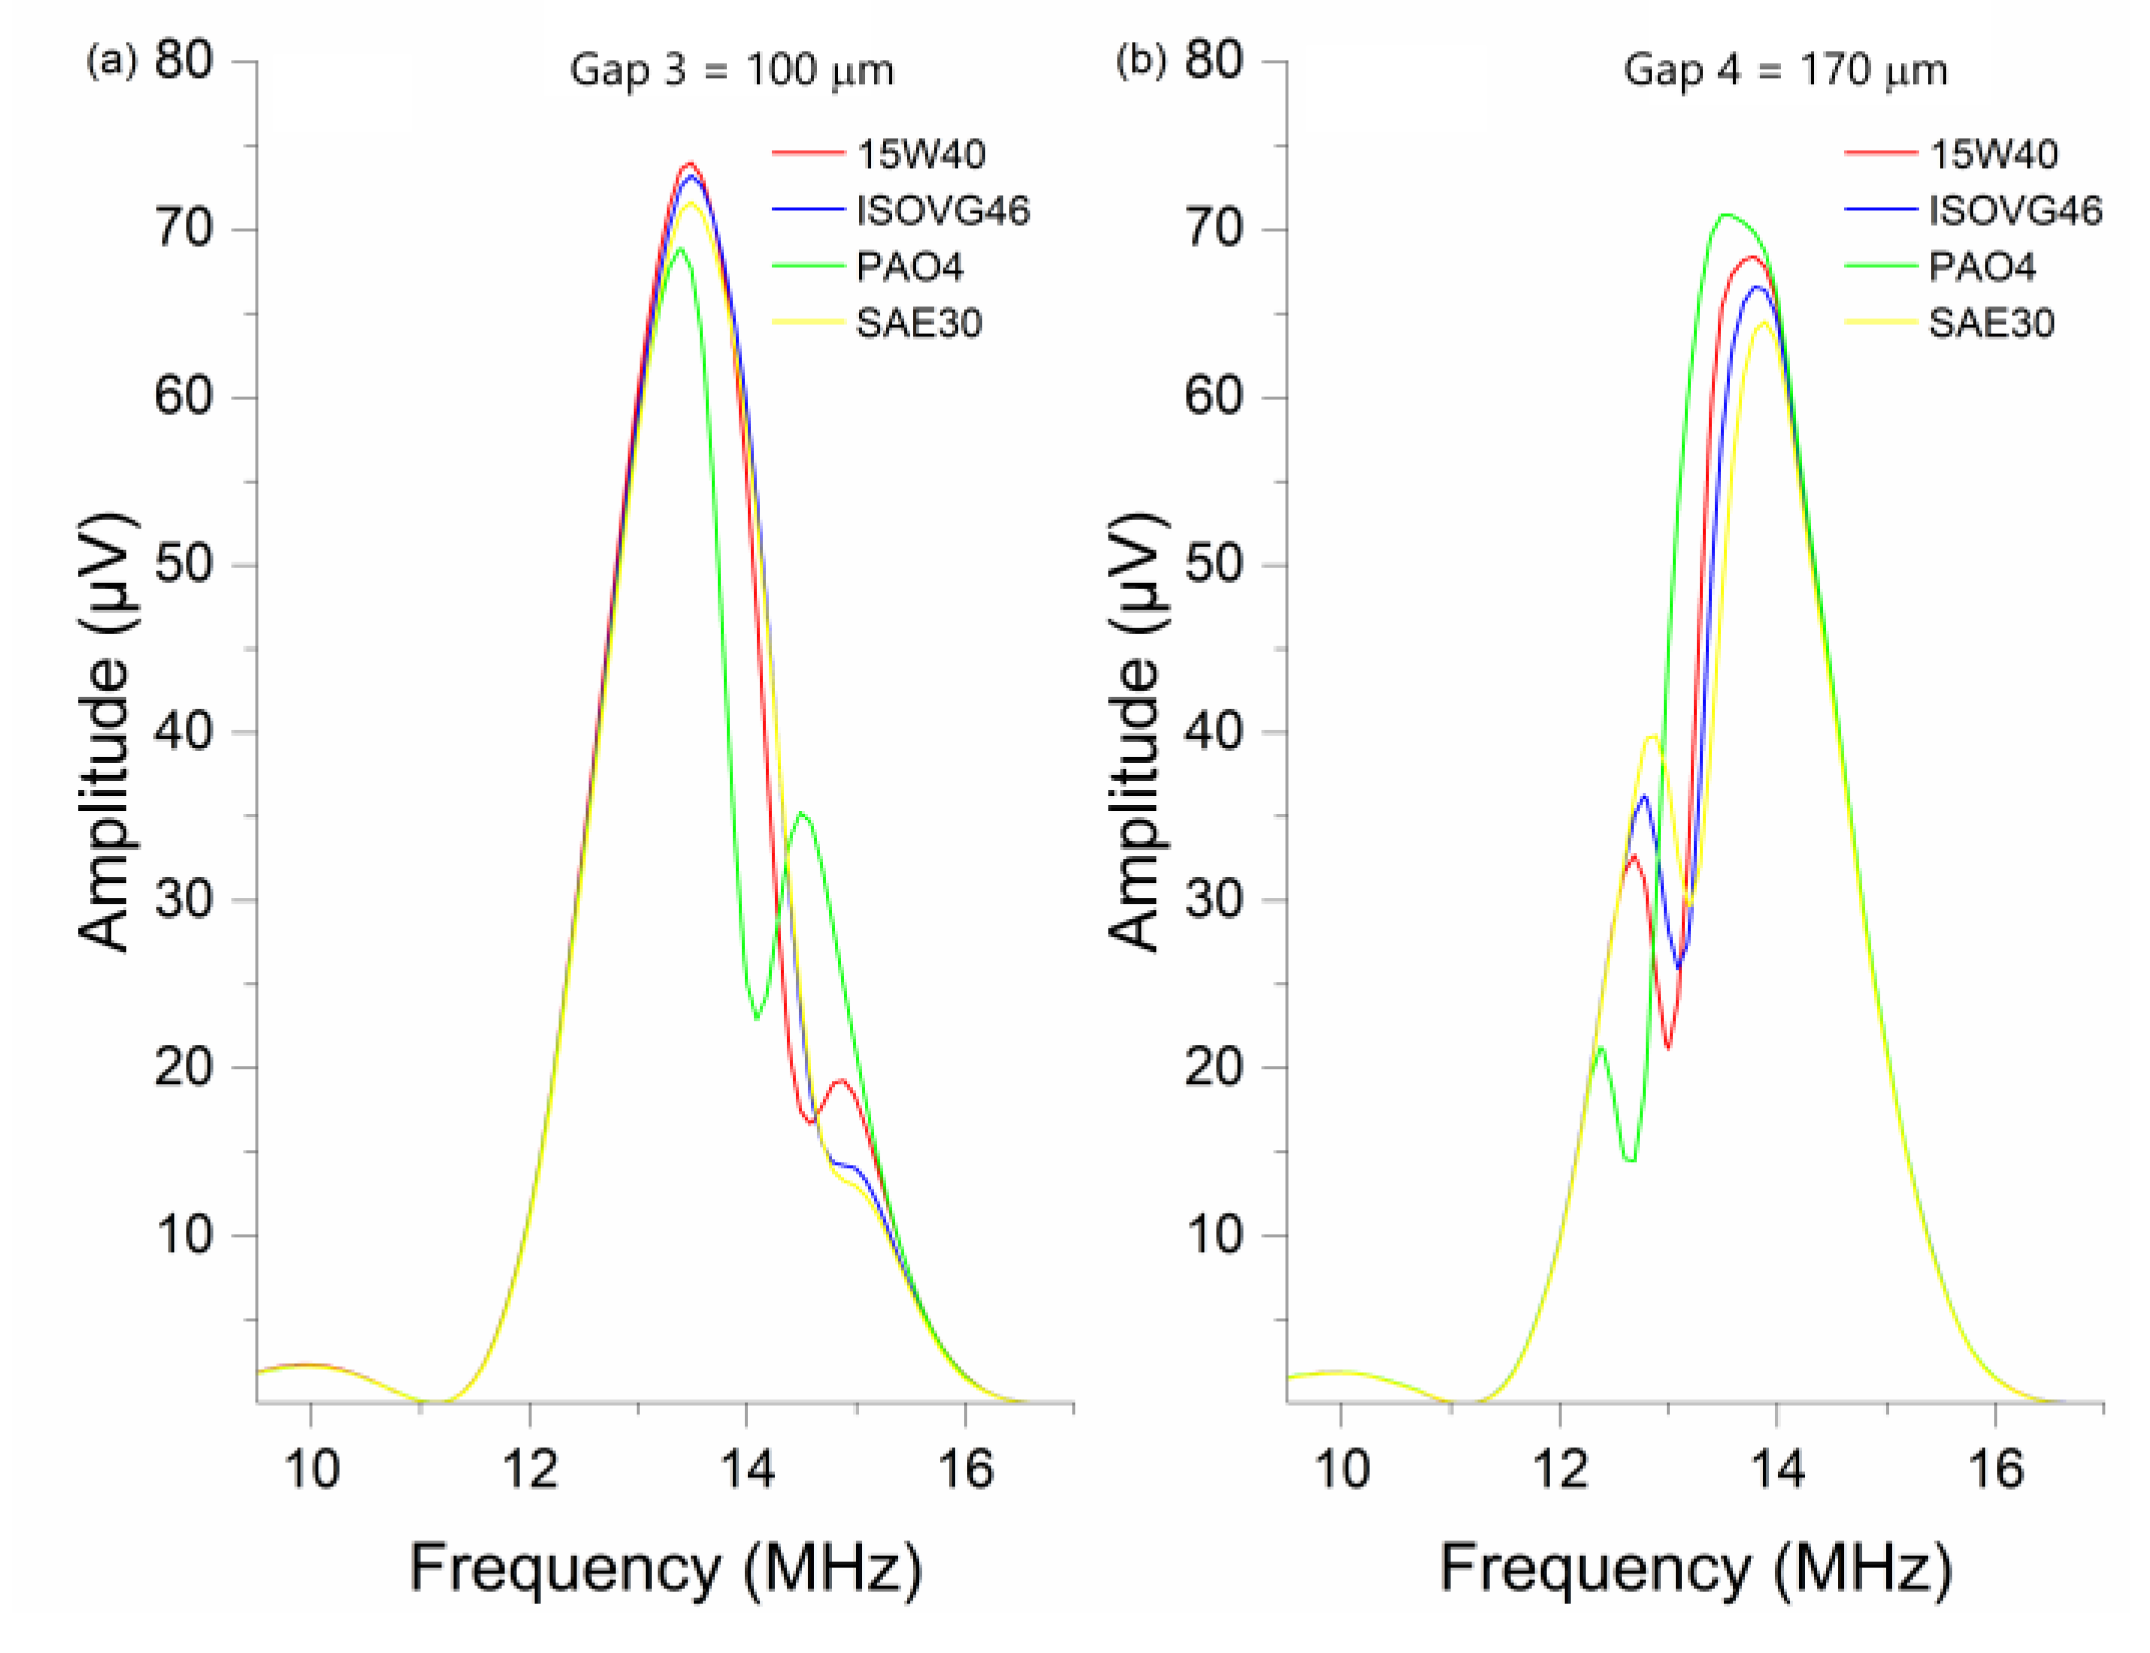
For the first reference thickness used (85 µm), these minima were not evidenced in the amplitude spectrum of the reflected signal within the bandwidth, but a minimum occurred slightly below the beginning of the bandwidth region. For the other two reference thicknesses, 100 and 170 µm, more than one resonance frequency was observed, and at least one of these occurred within the bandwidth. For the thicker gaps (100 µm and 170 µm), it was thus possible to identify the minimum amplitude in the spectrum of the measured signal, as can be seen in
Figure 11. By identifying the minimum frequency, the thickness of each of the tested oils can be defined by Equation (4).
The amplitude minima identified in
Figure 11 within the bandwidth show a behavior that goes according to what is expected by Equation (3), with a displacement in the occurrence of valleys as the thickness of the film increases. Comparing the curves in
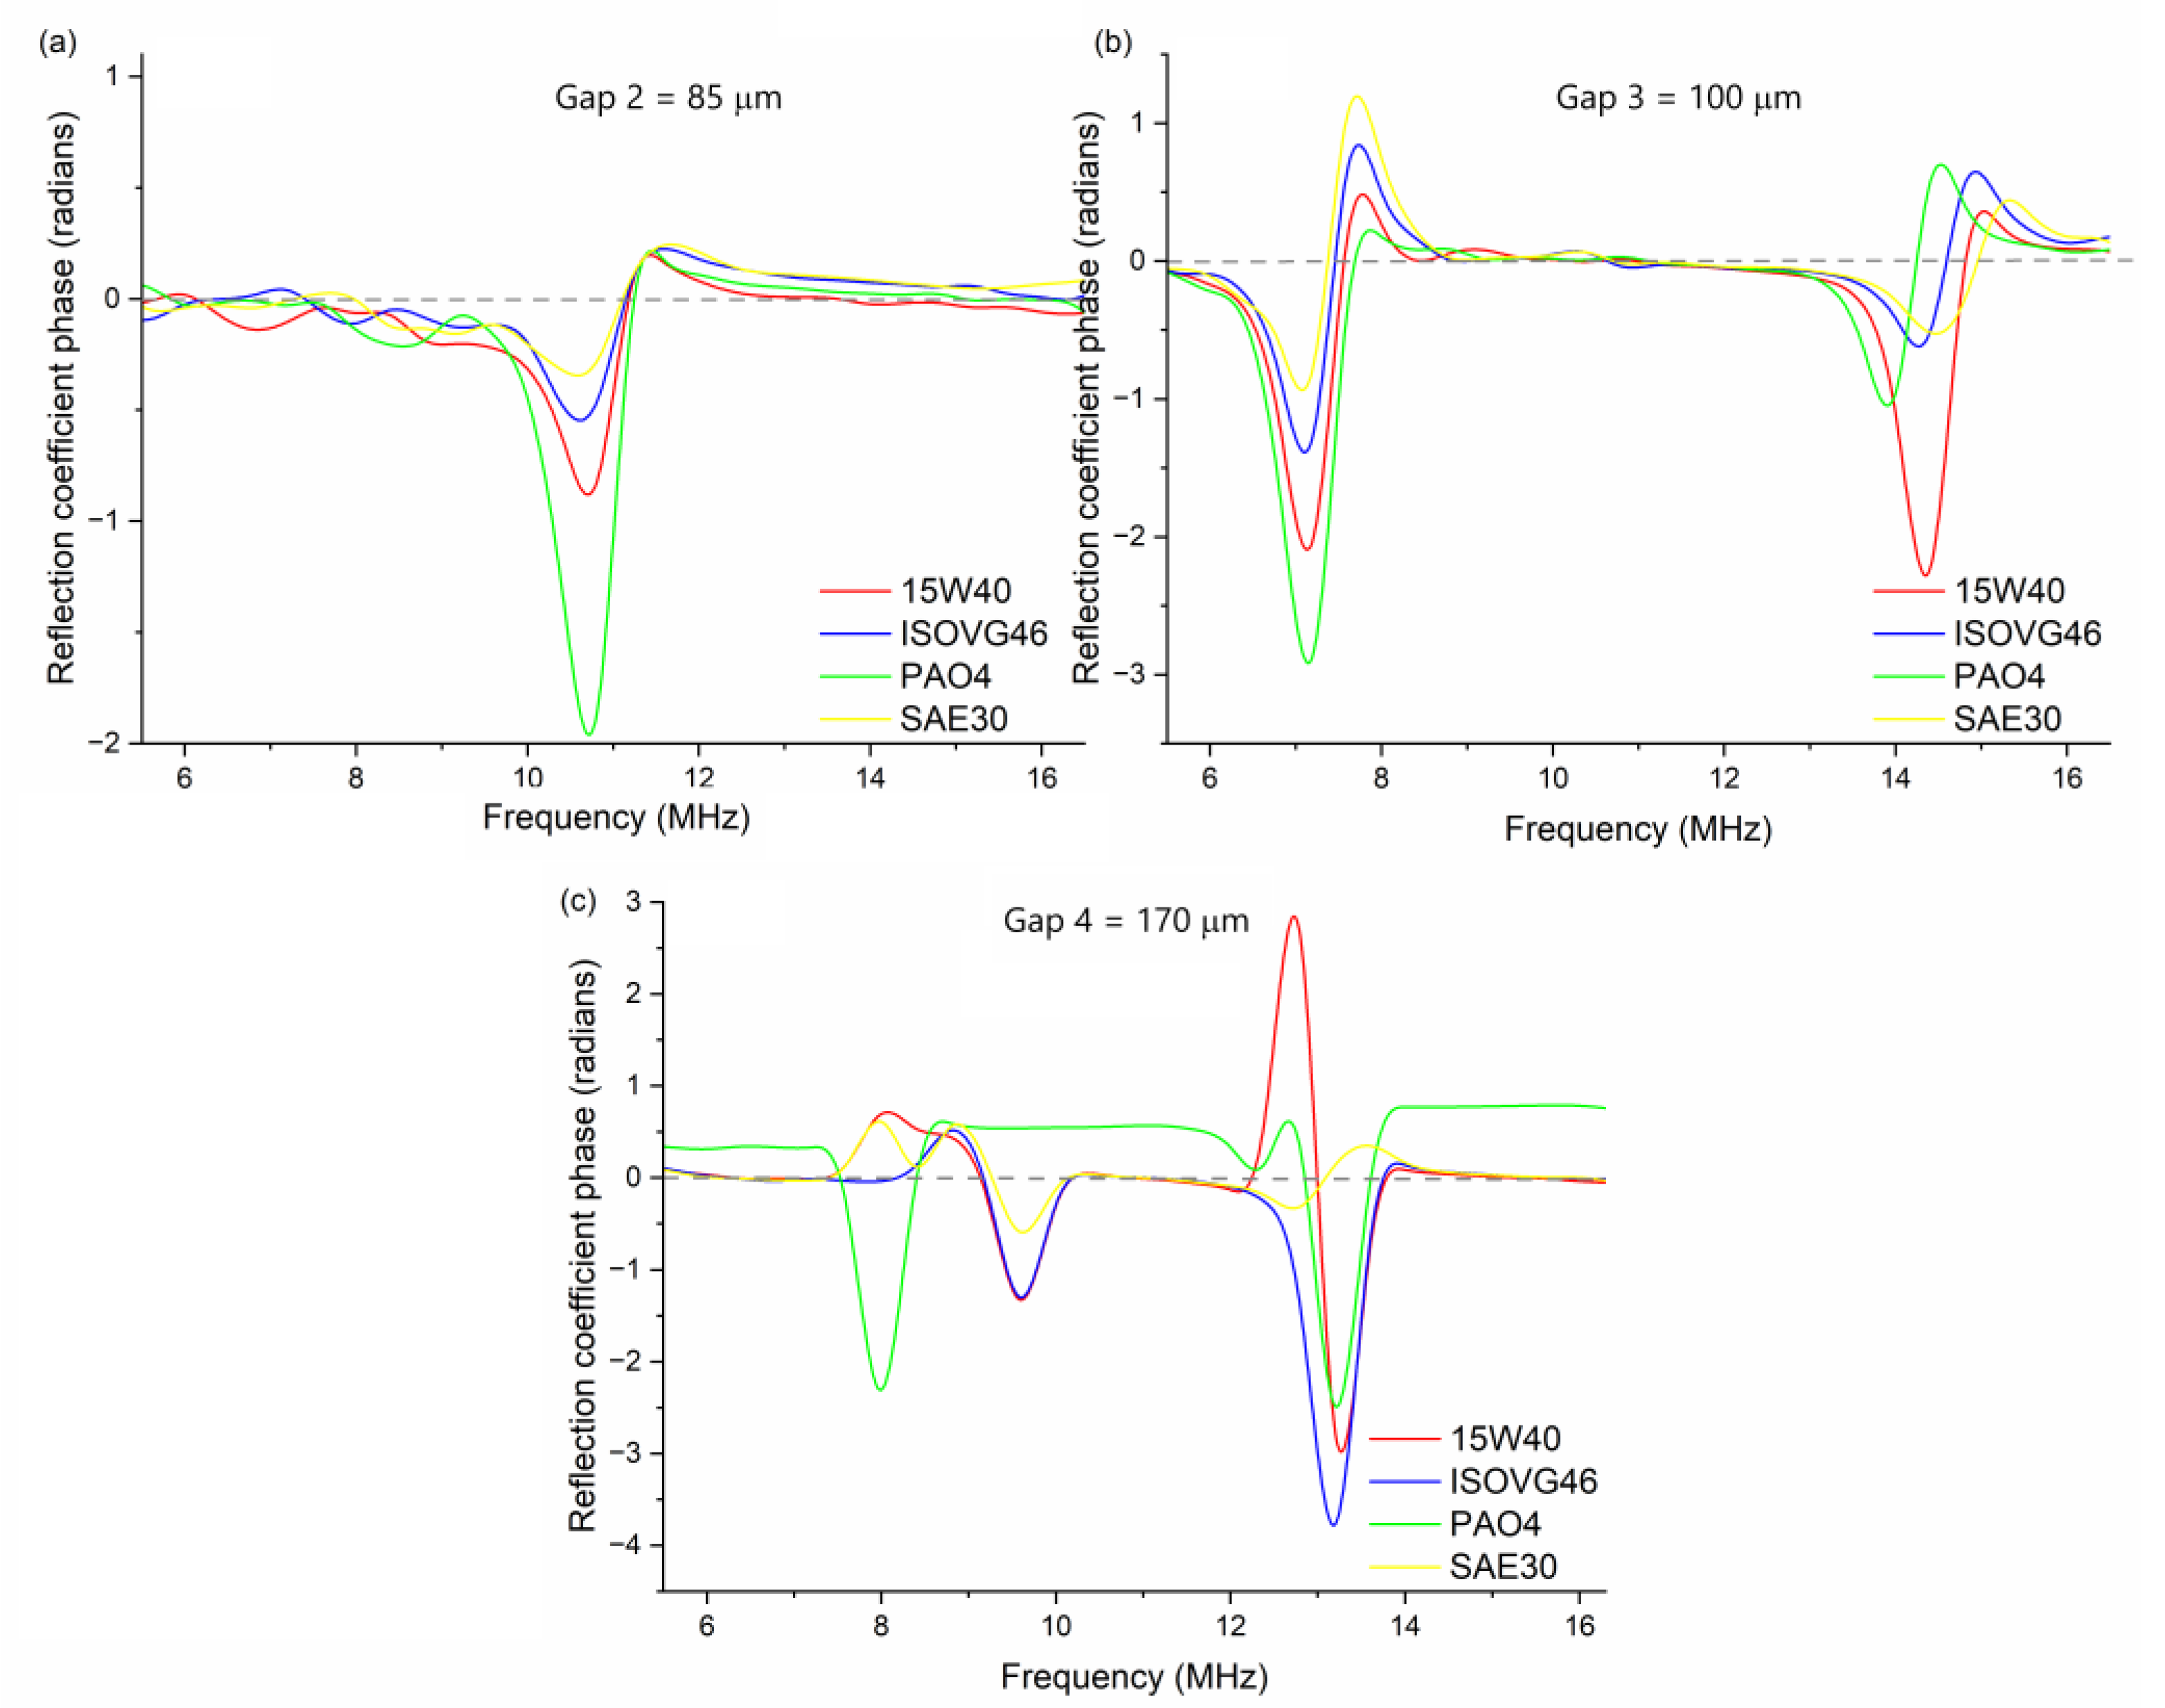
Figure 12a,b, it is noted that with the increase in thickness, the minima tend to occur at lower frequencies.
Figure 12 shows the behavior of the phase angle that undergoes a sudden change when approaching resonance frequencies, crossing the zero line. From the identification of the crossing point, it is also possible to apply Equation (4) to extract film thickness values.
Comparing the spectra of the phase reflection coefficient (
Figure 12) with the spectra of
R (
Figure 10), it is possible to observe that the points where the phase angle inversion occurs coincide with the minimum frequency that characterizes the resonances in the film layer. From the identification of these frequencies, the thicknesses were calculated by Equations (3) and (4) for the three gaps used (85 µm, 100 µm, and 170 µm), as shown in
Table 4.
To evaluate the statistical significance of the differences between the oils, an analysis of variance (ANOVA) was carried out for a confidence interval of 95%.
Table 5 summarizes the
p-values obtained from the ANOVA, showing that at least one of the oils had a value that was statistically different from the others in the group (
p-values lower than 0.05).
However, the results in
Table 5 do not discriminate which oils showed statistically different values. For that, a Tukey test was carried out, which is summarized in
Table 6. In this table, the oils that were different appear highlighted. For the spring model, the only significant difference occurs between the oils ISO VG6 and PAO4. For the analysis made for the resonance model, there is a significant difference almost in all cases, not only in the measurements of gap 4 (170 µm) between the oils ISO VG46 and SAE-30. Therefore, this statistical analysis showed that the acoustic properties of the oil (speed of sound) affect the measurements, since the largest difference in speed of sound was found for the PAO4 oil, which, in turn, always showed different thickness values in relation to the other oils.
The results in
Table 4 showed a reasonably good agreement with the gap heights measured by optical methods. In order to compare the effects of the oil acoustic properties using the two models,
Table 7 summarizes the errors calculated in relation to the nominal gap height measured by optical methods.
The larger discrepancy was observed for the smaller gap of 85 µm measured with the resonance model (gap 2), probably because the resonance occurred outside the bandwidth. Despite this, the use of the phase spectrum to confirm the resonance frequencies can be helpful when no minima for the reflection coefficient are found within the sensor bandwidth. For the larger gaps (3 and 4), the errors were up to around 6% for all the oils. When using the spring model, the errors were slightly higher, in particular for the PAO oil, which showed the highest speed of sound. For the spring model, the lubricant film thickness varies with the square of the speed of sound of the oil, so that small errors in the measurement of the speed of sound can have a larger impact on the calculated thickness.

 ,
, 


