2. Materials and Methods
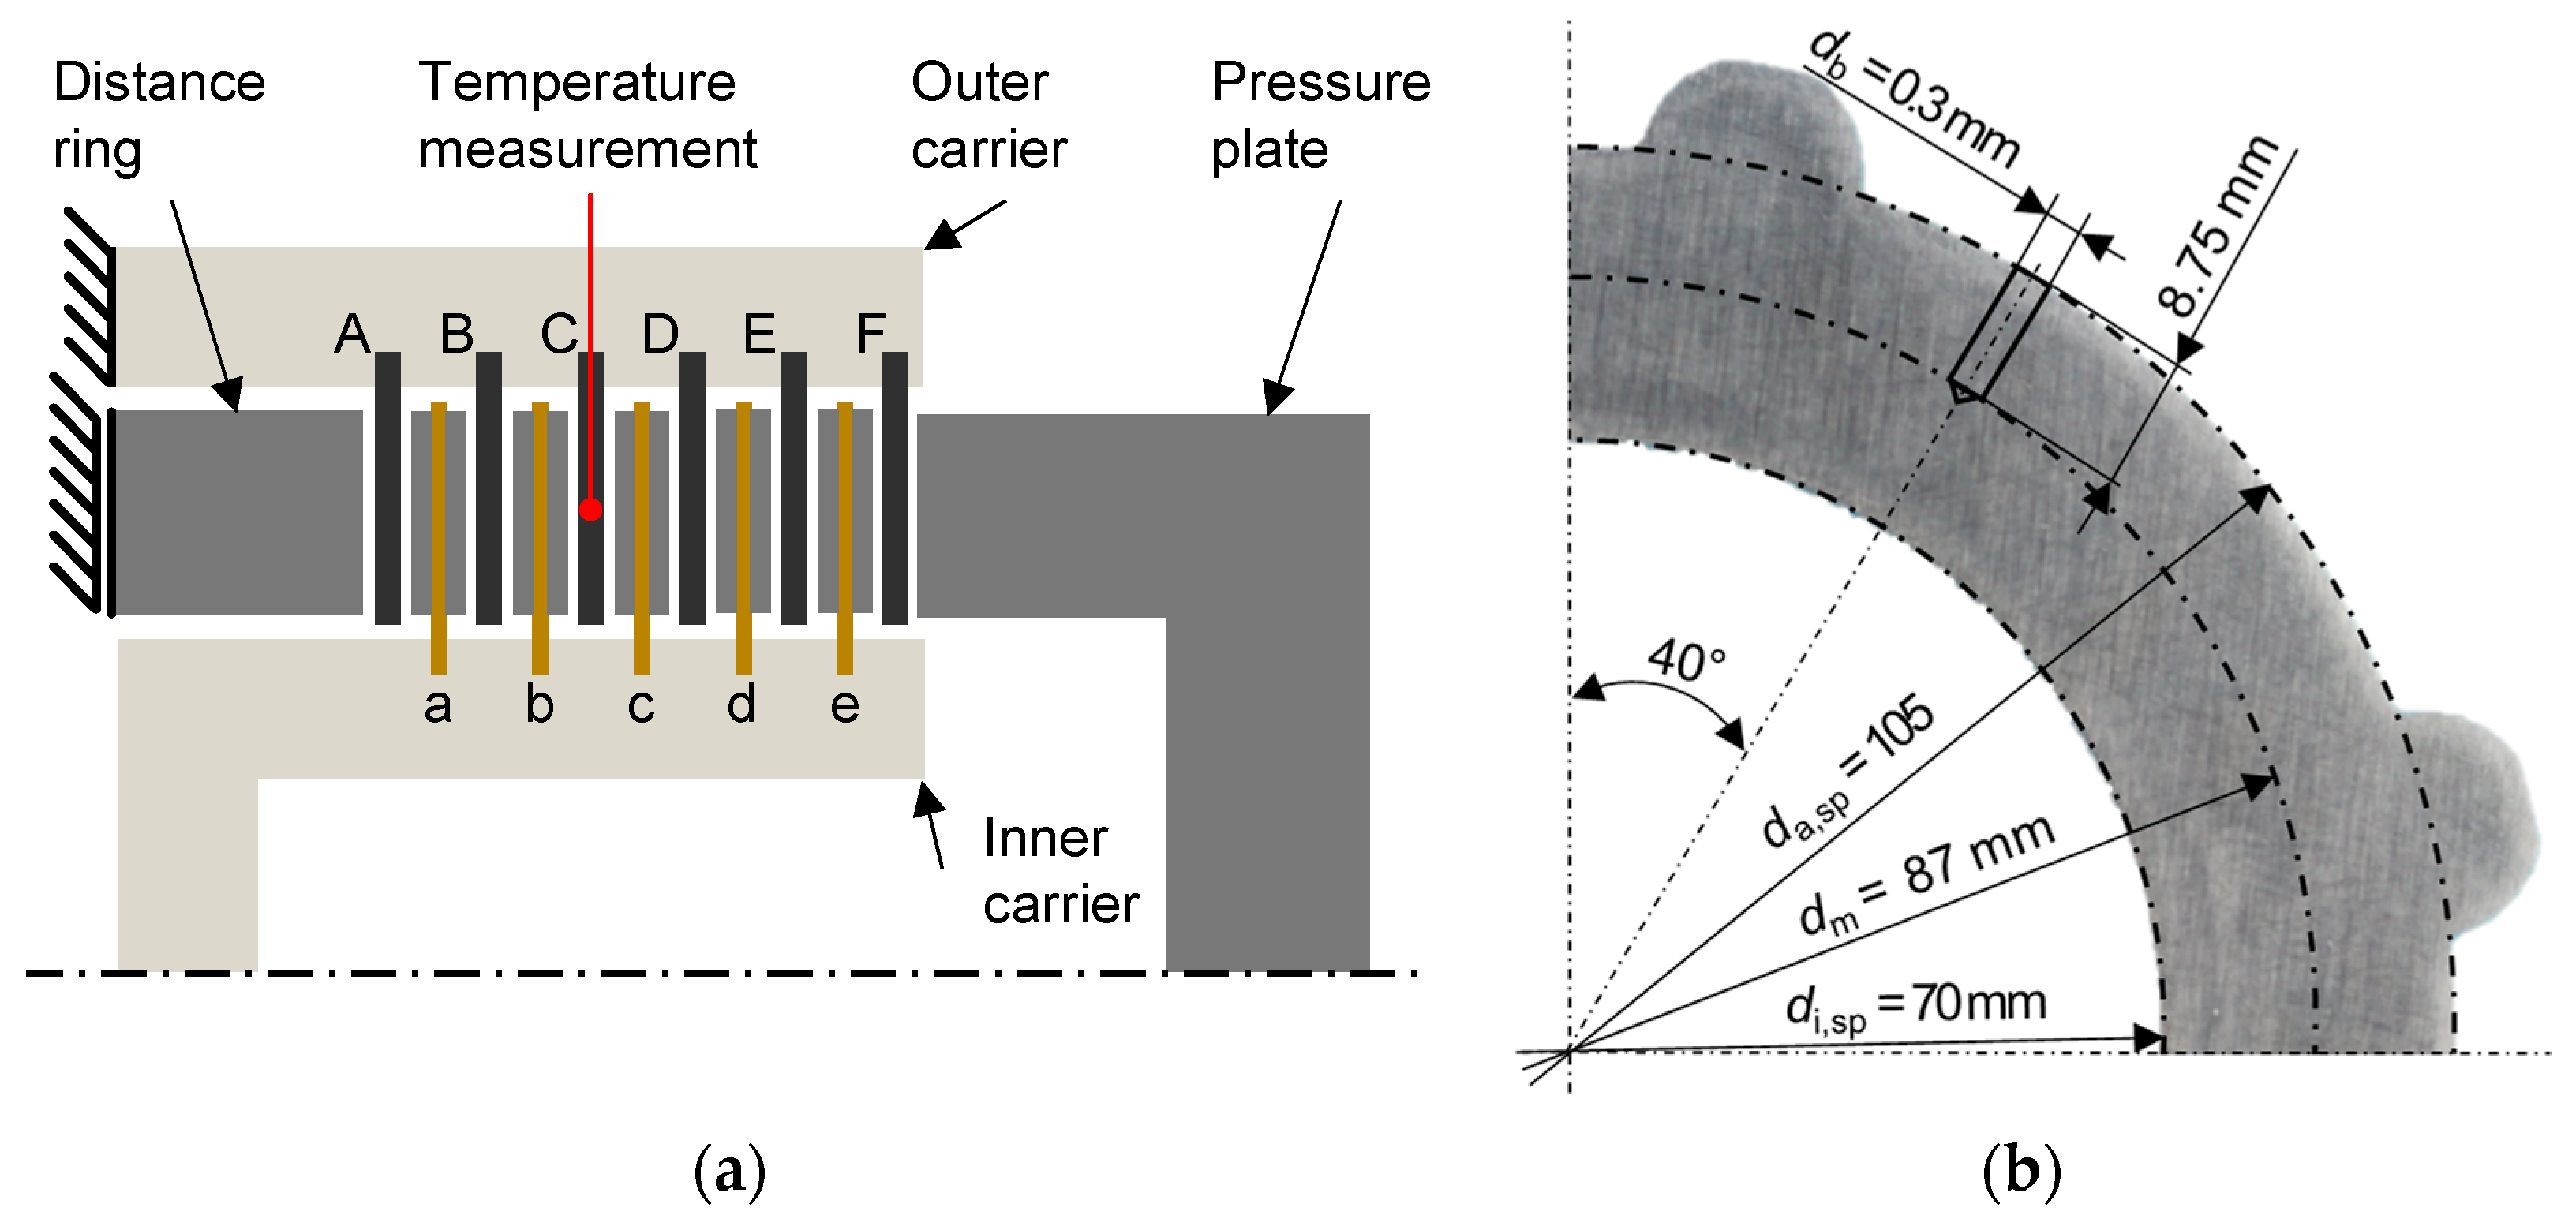
The clutch systems investigated are composed of 10 friction interfaces, encompassing 6 external and 5 internal plates.
Figure 1a illustrates the arrangement of these clutch components. Each plate is distinctly marked for unambiguous identification, and these marks are aligned with corresponding indicators on the carriers at the test rig to guarantee consistent assembly. To measure temperature during the experimental trials, a type K thermocouple [
14] is attached to the steel plate labeled “C”, positioned at the center of the clutch assembly (see
Figure 1b). For this, a hole is radially drilled into the steel plate to insert the temperature sensor. The drill hole, with a diameter of
db = 0.3 mm, is made radially up to the mean friction diameter of the steel plate. A type K thermocouple NiCr-Ni [
14], featuring an Inconel 600 outer sheath and a diameter of
dt = 0.25 mm, is utilized for temperature measurement. The measuring range and the limit deviations for type K thermocouples are defined in DIN EN 60584 [
15]. Before attaching the thermocouple, thermal paste [
16] is applied into the hole.
Figure 2 presents photographic documentation of the steel plates under study, alongside their respective friction counterparts. The research focuses on three distinct variants of friction plates. Friction plate FP1 is characterized by a paper-based friction lining, whereas FP2 incorporates a lining made of carbon composite. Notably, both FP1 and FP2 share an identical segmented groove design. In contrast, friction plate FP3 is distinguished by its woven carbon friction lining and exhibits a groove pattern that sets it apart from FP1 and FP2. The friction systems FS1, FS2, and FS3 are formed by pairing the steel plate with the friction plates FP1, FP2, and FP3.
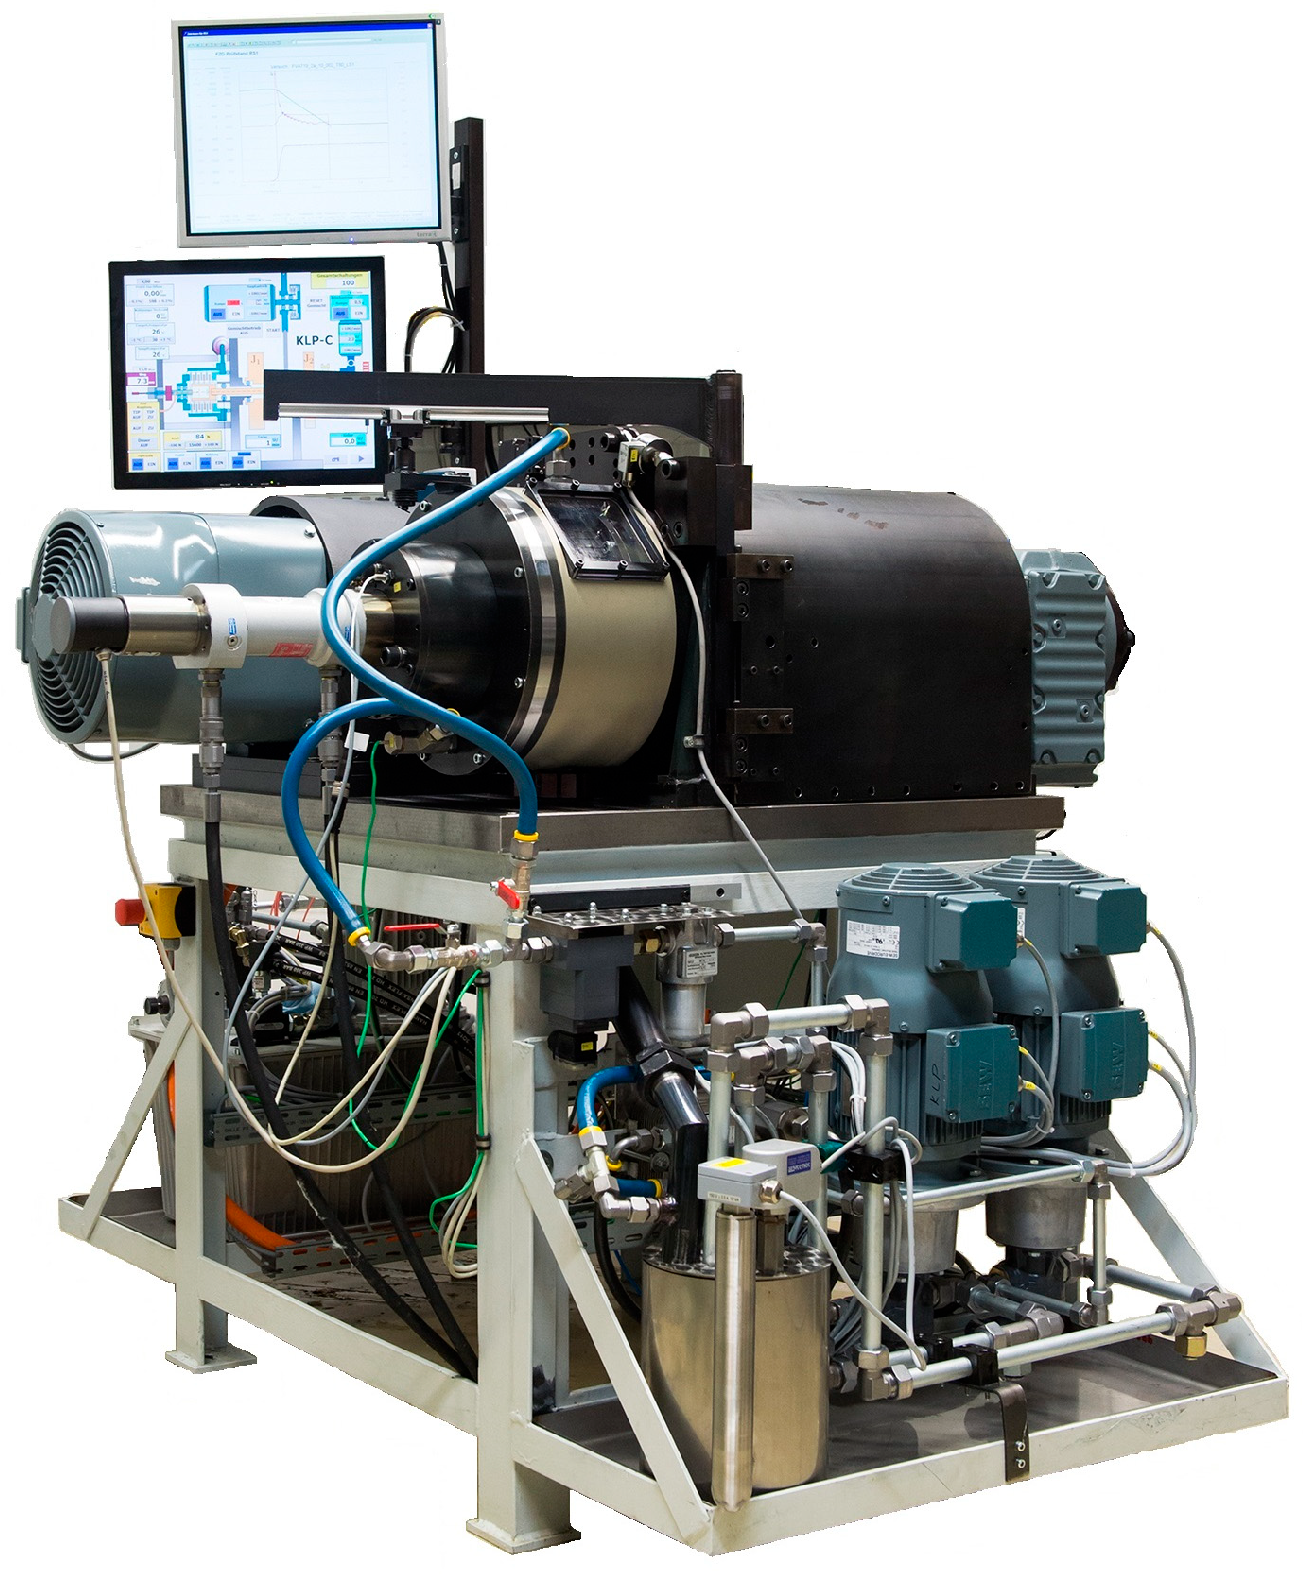
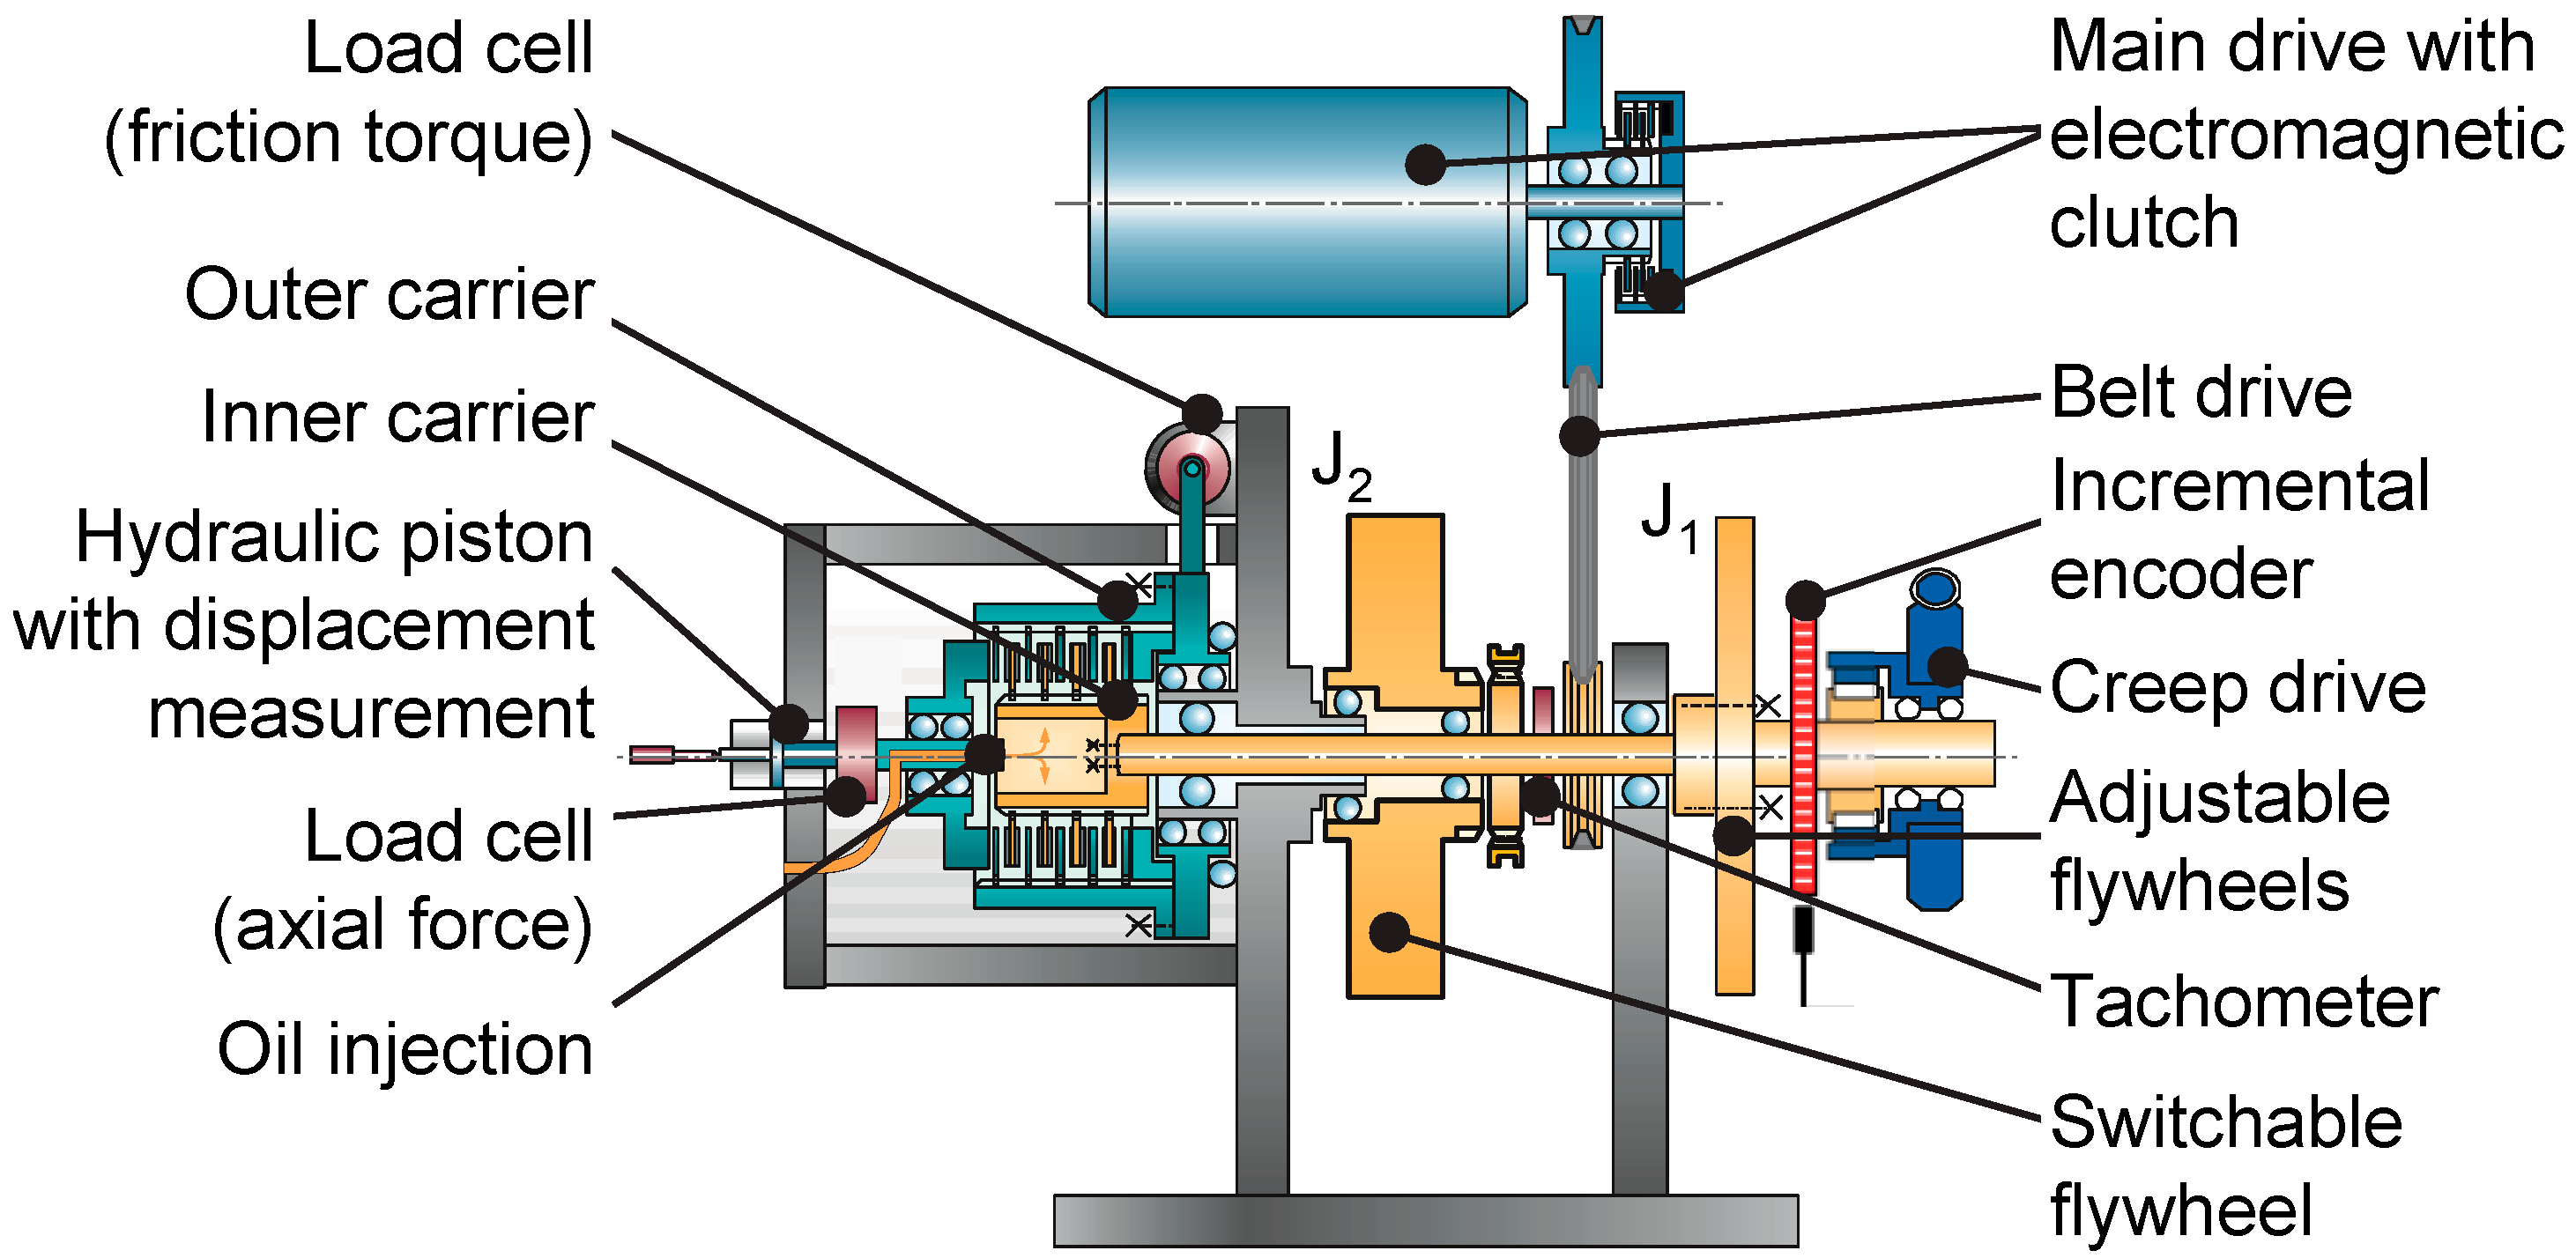
The experimental investigations are executed using the component test rig KLP-260. A schematic representation of this test rig is depicted in
Figure 3. The KLP-260 is capable of functioning in various modes: power shift, transient slip, and steady-state slip. To measure friction torque, a load cell links the outer carrier to the housing of the test rig. The inner carrier affixed to the main shaft is powered either by the main drive or the creep drive. When necessary, the inner carrier can be coupled with the adjustable mass inertia J
2 and a manually tunable mass J
1. A hydraulic piston, equipped with a displacement measuring system, activates the clutch. The test clutch benefits from an advanced lubrication system, capable of delivering lubricant both internally and from above, with volume and temperature control. This ensures thorough lubrication of the entire clutch assembly, particularly at lower speeds. In the power shift mode, the speed-regulated main drive increases the velocity of the main shaft, while an axially directed force is applied to the clutch plates through a force-adjusted hydraulic cylinder, employing a thrust ring. For steady-state and transient slip modes, the clutch experiences a differential speed induced by the creep drive, under a pre-defined axial force. During these modes, the electromagnetic clutch disengages the main drive [
17].
A very detailed explanation of the test rig is also given by Strobl [
17]. In the
Appendix A, in
Figure A4, you will find a photograph of the actual test rig setup.
Prior to testing, each clutch assembly undergoes a run-in process, characterized by a non-linear variation in friction coefficient based on shifting frequency, as detailed by Voelkel [
18]. Voelkel’s [
18] test methodology, formulated to closely mirror real-world applications of slipping clutches, forms this study’s foundation. It involves a load collective with six typical application load levels, differing in pressure and differential speed. The run-in’s load collective completes 200 cycles.
Table 1 lists these levels, S1 to S6, and their corresponding parameters, cycled in the sequence S1-S4-S2-S5-S3-S6. Voelkel [
18] provides a detailed description of the run-in procedure.
In alignment with the current state of the art, as described by Strebel [
19], this work utilizes step tests to examine the occurrence of spontaneous damage. Step tests typically involve a gradual, stepwise escalation of one or more load parameters during the testing process, which facilitates the observation and recording of damage development. The specific load of a wet clutch, defined in terms of specific friction work and specific friction power during transient slip operation, is determined by variables such as pressure, maximum differential speed, and duration of load while presupposing a stable coefficient of friction. The primary objective of this research is to explore the broadest feasible parameter space. Consequently, all parameters are subject to variation. Between different step tests, there is a variation in pressure and maximum differential speed, with each test utilizing a distinct test clutch. Within an individual step test, both the duration of the load and the number of slip phases are progressively increased, as depicted in
Figure 4. The definition of a load level is based on the number of slip phases, N; for instance, load level 1 includes a single slip phase and load level 2 comprises two slip phases. Incrementally increasing the number of slip phases from one load level to the next results in a corresponding increase in specific friction work.
Prior to initiating each step test, the test parts in the rig undergo a preparatory phase, where the clutch idles for an hour at an oil injection temperature of 80 °C. This process ensures saturation of the porous friction lining with oil and a uniform mass temperature for the test components and establishes a stable temperature distribution throughout the test rig’s mass. Subsequently, the multi-plate clutch designated for testing undergoes a load level involving 10 iterations of a slip cycle. Following each slip cycle, a cooling phase is initiated, allowing the plates to return to the baseline temperature of
T = 80 °C. This is monitored using the thermocouple signal from steel plate C, as depicted in
Figure 1. Each load level is succeeded by a reference load level, employing loads S5 (see
Table 1) from the initial run-in. The slip cycle of this reference level, conducted 10 times, serves as a benchmark for assessing the clutch pack’s damage progression (see
Figure 5). Upon completing a load level and its associated reference cycles, the plates undergo a cleaning process and a thorough damage inspection, and any observed damage is meticulously recorded. Following a visual inspection, the clutch is reassembled into the test rig. The experiment then progresses to the subsequent, more intense load level, with this procedure being repeated until clutch failure is observed. The specific oil flow rate during these load levels is maintained at
oil = 0.25 mm
3/mm
2/s, with the oil being evenly distributed from both the inside (50%) and the top (50%) of the clutch. This external lubrication approach, distributing oil evenly from both the clutch’s inside and top, effectively maintains lubrication, even under decreased speed conditions.
The analysis of friction behavior in this study is conducted through the examination of characteristic friction coefficient values. Voelkel [
18] employs the friction characteristic in the context of transient slip to define a key parameter,
µtop. This parameter represents the friction coefficient at the peak slip speed, effectively encapsulating the overall level of friction coefficient (as illustrated in
Figure 6). The assessment of friction properties is focused primarily on the final slip phase of each test. During this phase, the friction coefficient is graphically plotted against the slip speed, specifically for the decreasing segment of the slip phase. This method facilitates an objective characterization of the friction behavior, primarily through the analysis of the
µtop value. Subsequent analytical procedures are then undertaken. For a comprehensive presentation of the
µtop values across various load levels and corresponding reference load levels within the step tests, bar charts complemented by error bars are utilized. This format allows for an in-depth examination of the scatter of the
µtop value within each load level and the detection of any alterations in the friction coefficient levels between different load levels.
3. Results
3.1. Damage Patterns
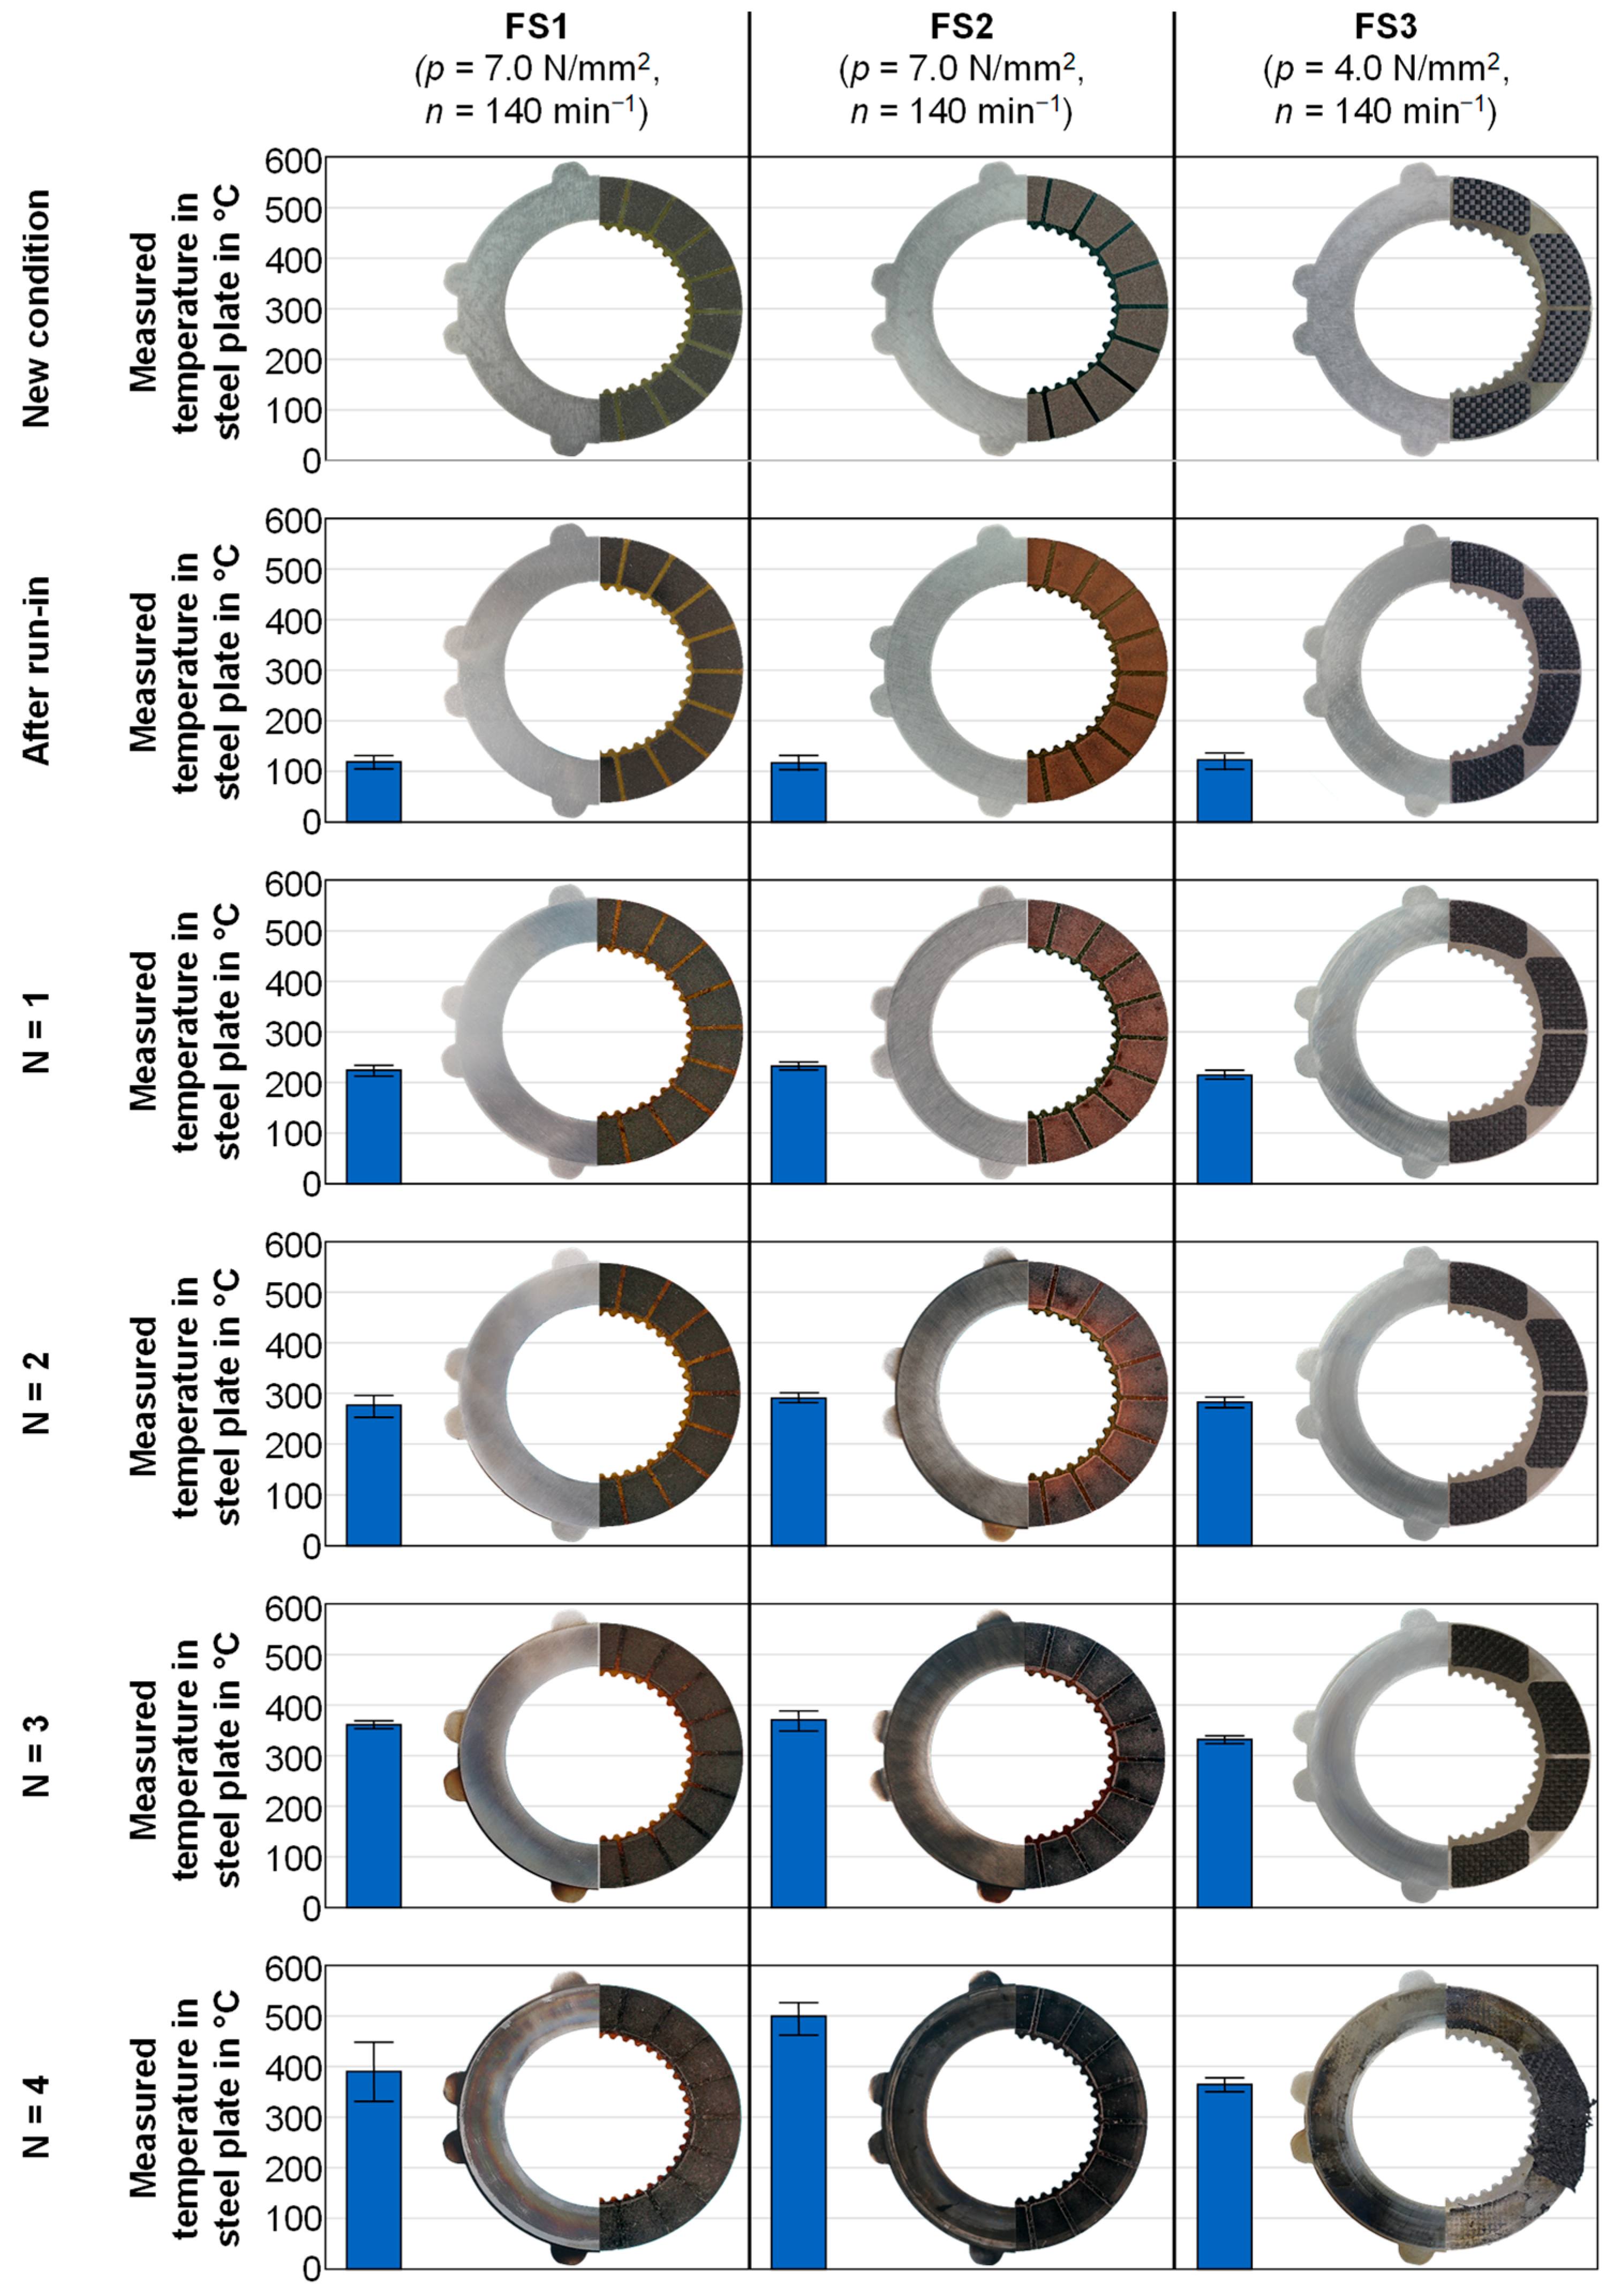
Figure 7 offers a detailed representation of the damage behaviors observed in three different friction systems subjected to various step tests. This figure provides a visual representation of each system’s condition: new condition, after run-in, and following slip cycles at N = 1, N = 2, N = 3, and N = 4. The focus is on steel plates and friction plates, which are located in the center of the clutch unit. Additionally, the figure records the temperature measurements of the central steel plate at each load level, facilitating a comparative analysis. For a more coherent comparison, three specific tests are chosen, where the failure of the friction system occurs after four slip phases. The test conditions are as follows:
FS1: p = 7.0 N/mm2, n = 140 min−1, Toil = 80 °C,
FS2: p = 6.0 N/mm2, n = 140 min−1, Toil = 80 °C,
FS3: p = 4.0 N/mm2, n = 140 min−1, Toil = 80 °C,
Figure 7.
Damage pattern progression for friction systems FS1, FS2, and FS3.
Figure 7.
Damage pattern progression for friction systems FS1, FS2, and FS3.
In the scenario of friction system FS1, post-run-in observations reveal a smoothing effect on the steel plate surfaces. During the subsequent step test, discoloration of the steel plate emerges at load level 3 (N = 3), accompanied by temperature readings reaching 350 °C. At load level 4, system failure is attributed to the buckling of the steel plates, with temperature measurements displaying considerable variance, averaging around 400 °C. Additionally, the friction plates exhibit discoloration around the groove and friction lining pads. The failure load level is marked by abrasive wear in regions where the steel plate buckles.
Friction system FS2 also fails due to buckling of the steel plate. Initial damage, indicated by steel plate discoloration, is noted at load level 2 (N = 2) with temperatures around 295 °C. Escalating load parameters lead to further discoloration and eventual buckling at load level 4 (approximately 500 °C), alongside a notable increase in temperature measurement variability. Post-run-in, the friction lining shows a lightening effect due to oil absorption. At elevated loads and temperatures, the friction lining darkens significantly. The final load level is characterized by visible abrasive wear on the outer diameter.
The friction system FS3′s failure is precipitated by the detachment of the friction lining. Prior to failure, neither discoloration is observed on the steel plates, nor are there visible changes on the friction plate. The failure event is marked by discoloration on both the steel and lining plates, along with lining detachment. Temperature measurements of the steel plate at the point of failure hover around 370 °C. Notably, FS3 does not exhibit the increased temperature measurement scatter observed in FS1 and FS2 at their respective failure load levels.
3.2. Modification of Friction and Temperature Behavior
In this study, a series of nine step tests, each with varied pressure and slip speed parameters, are executed using the FS1 friction system.
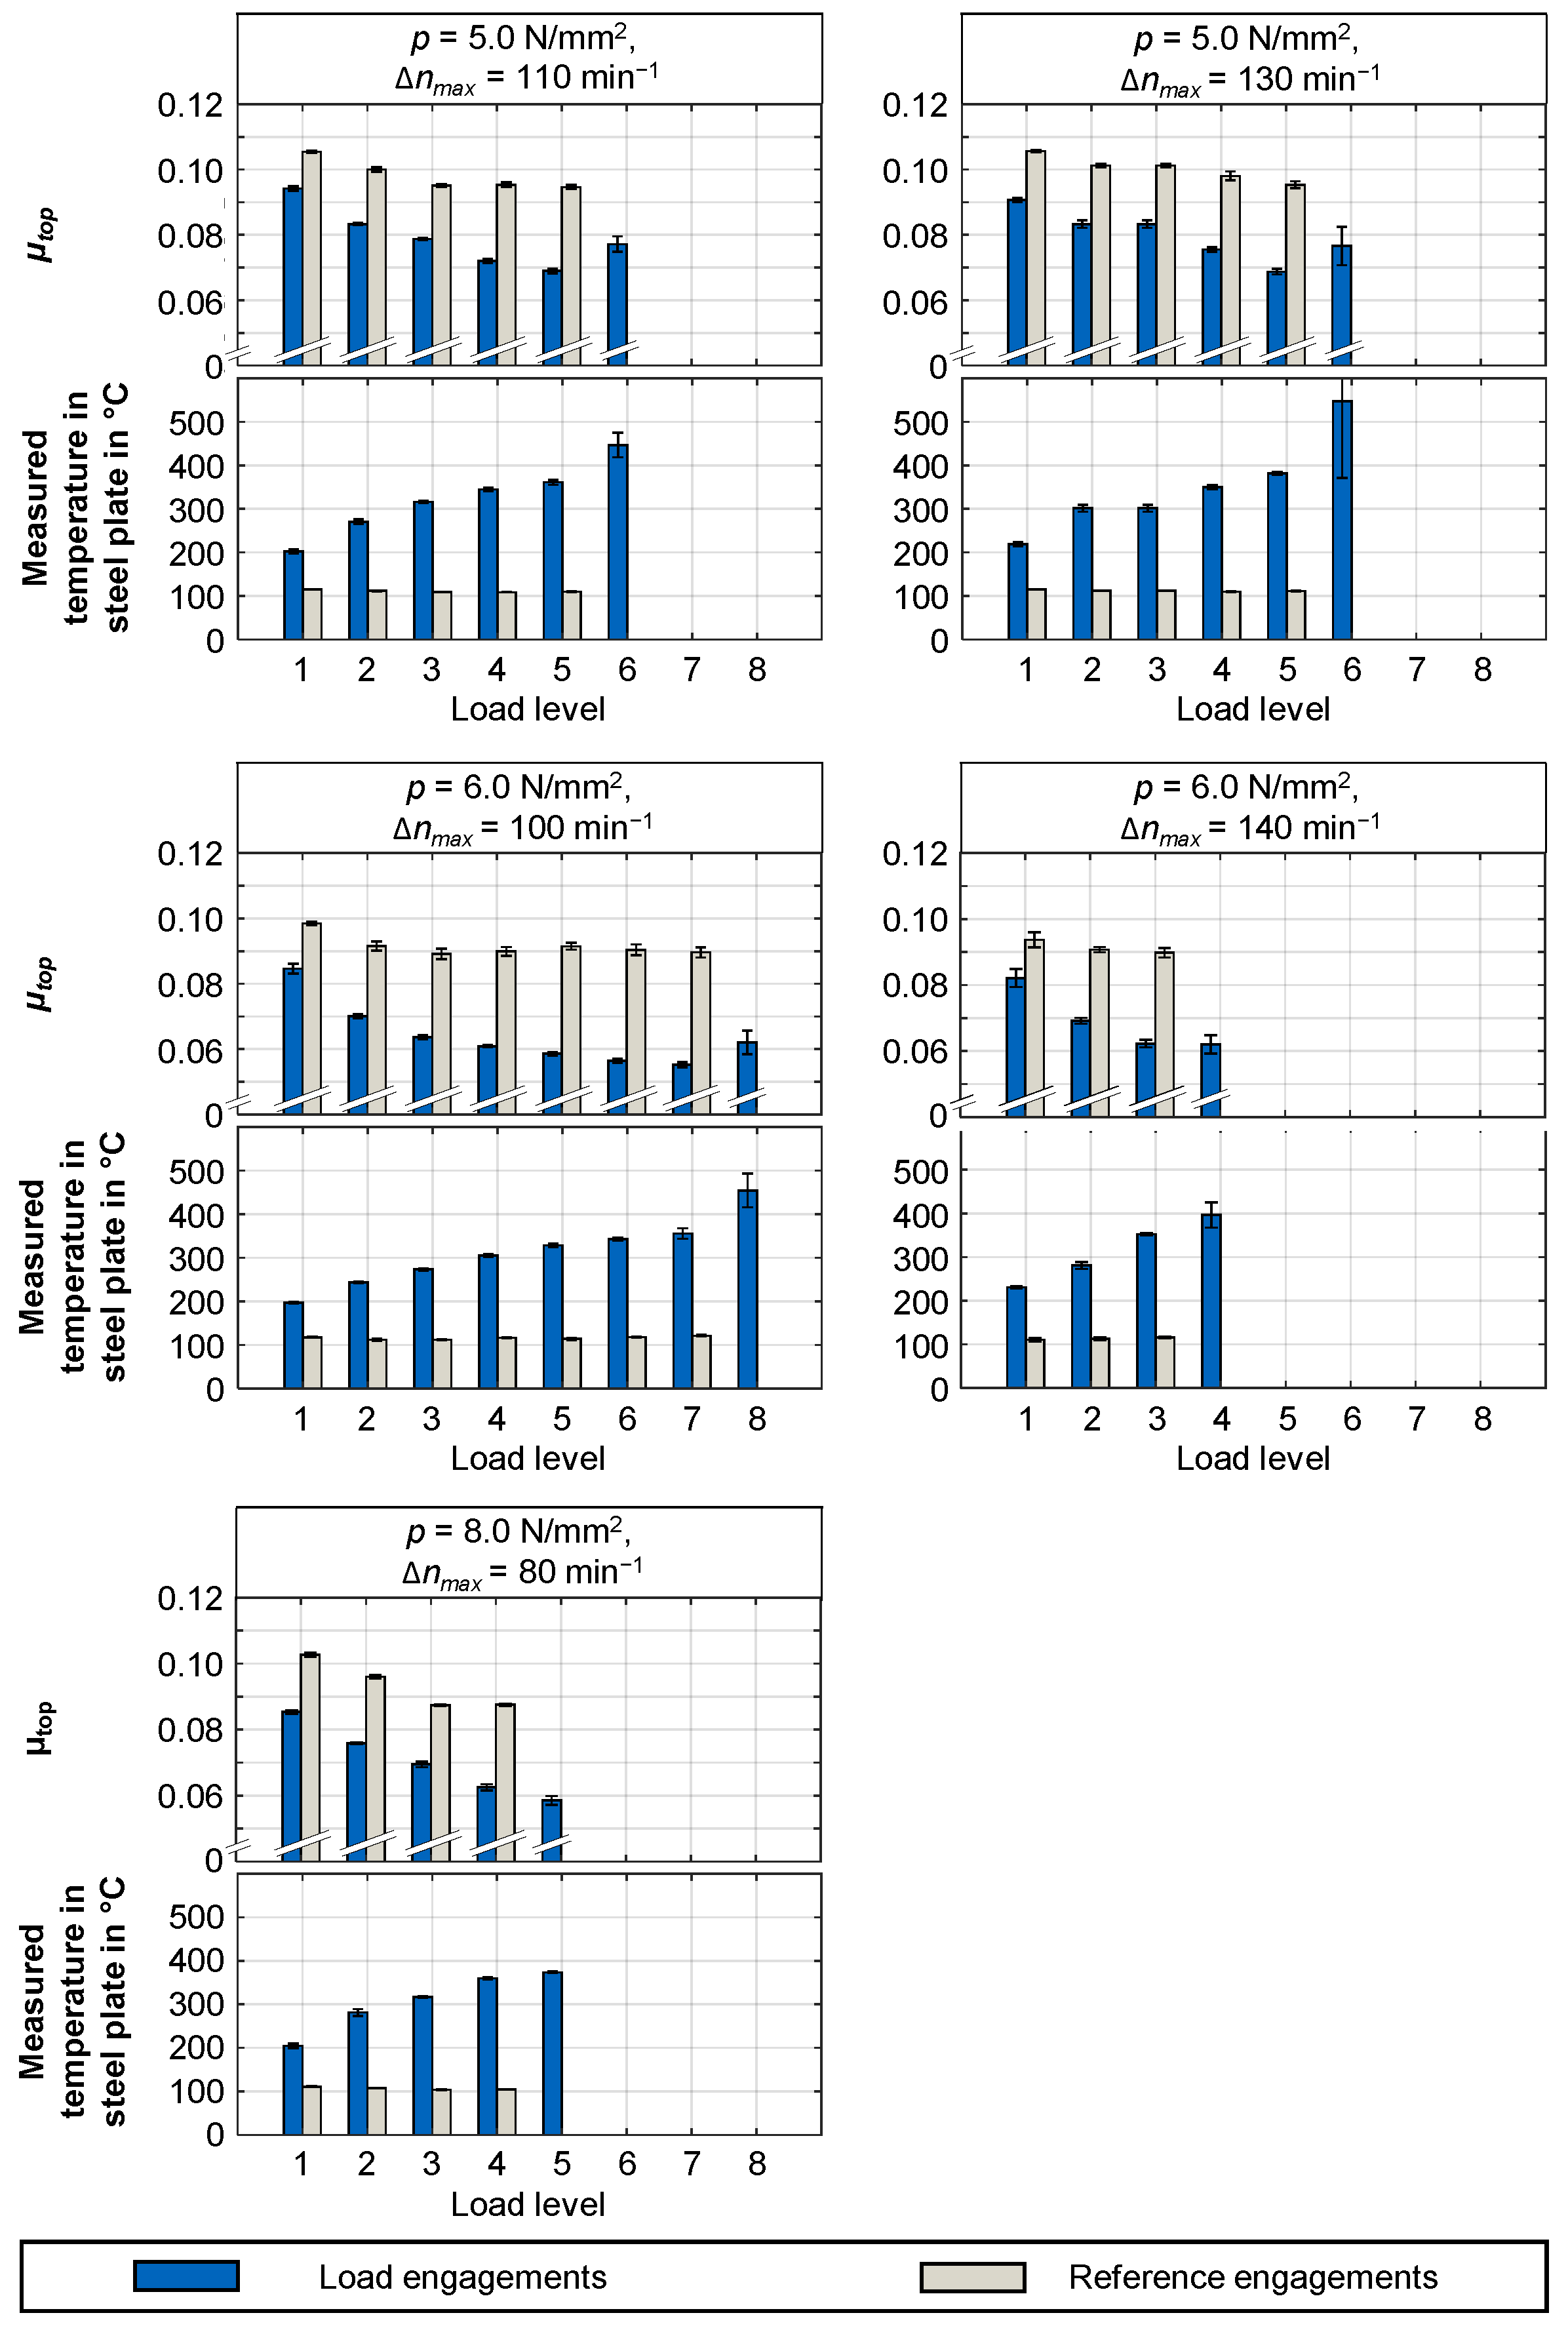
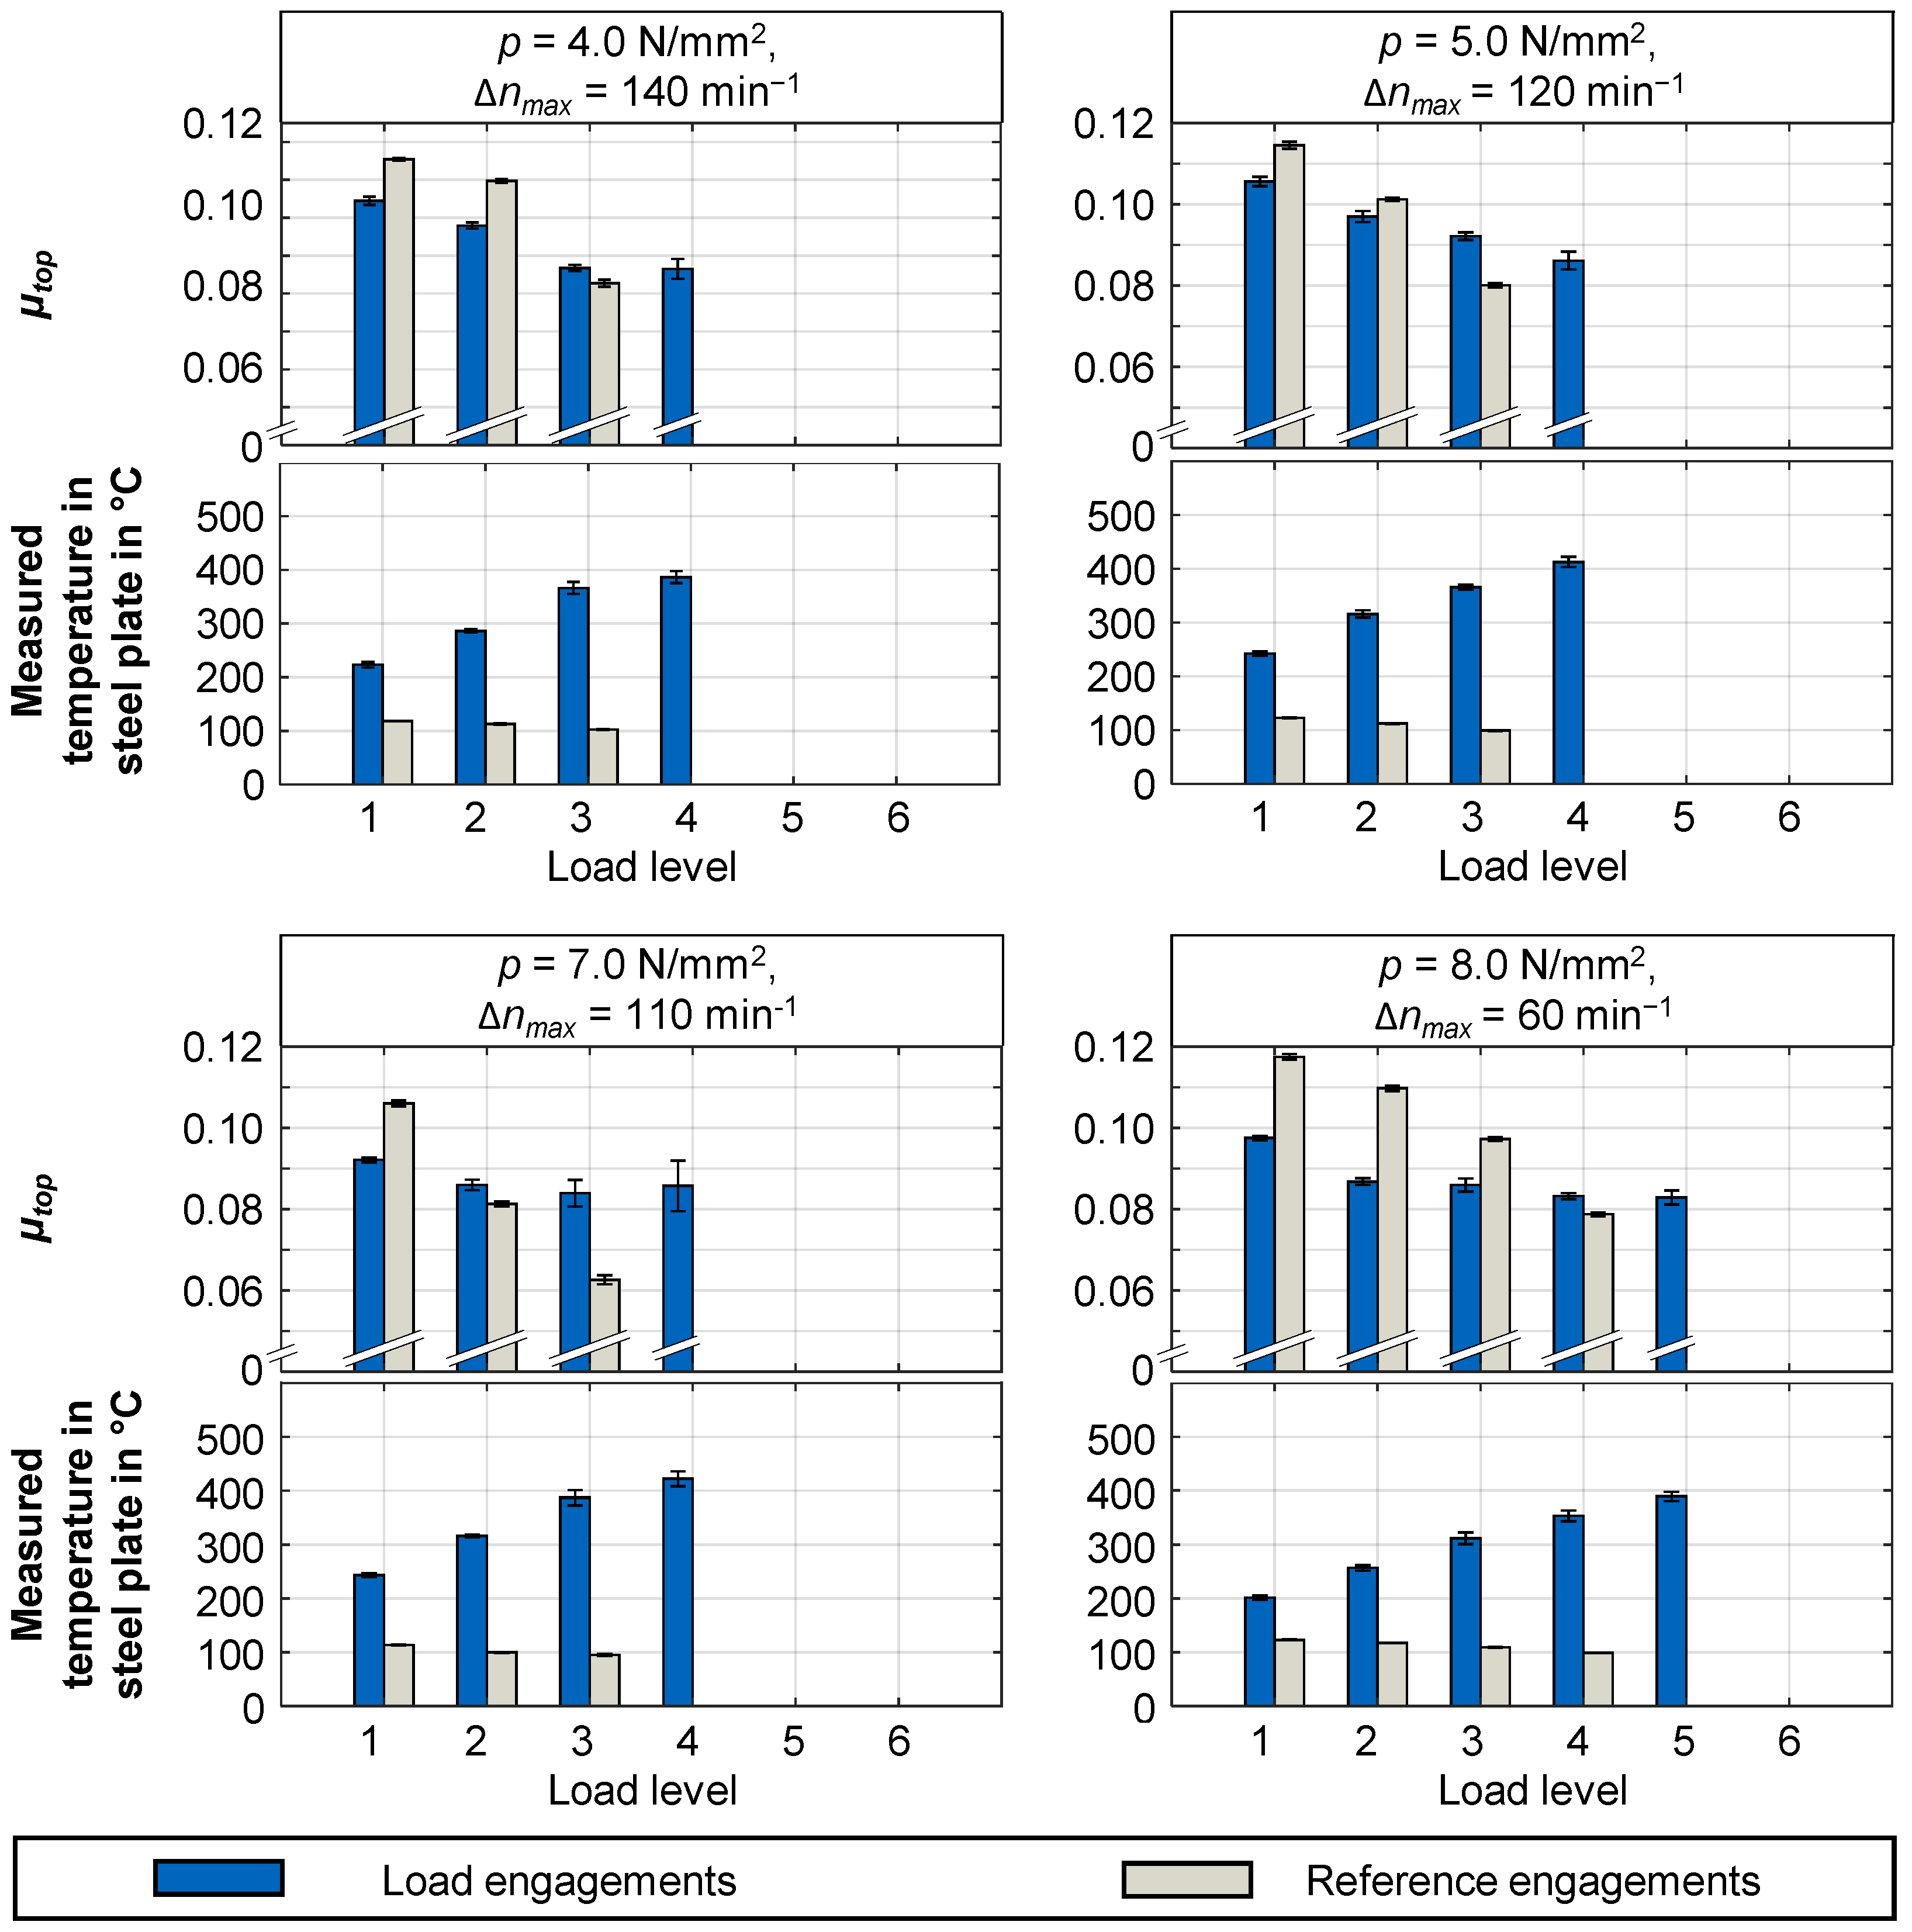
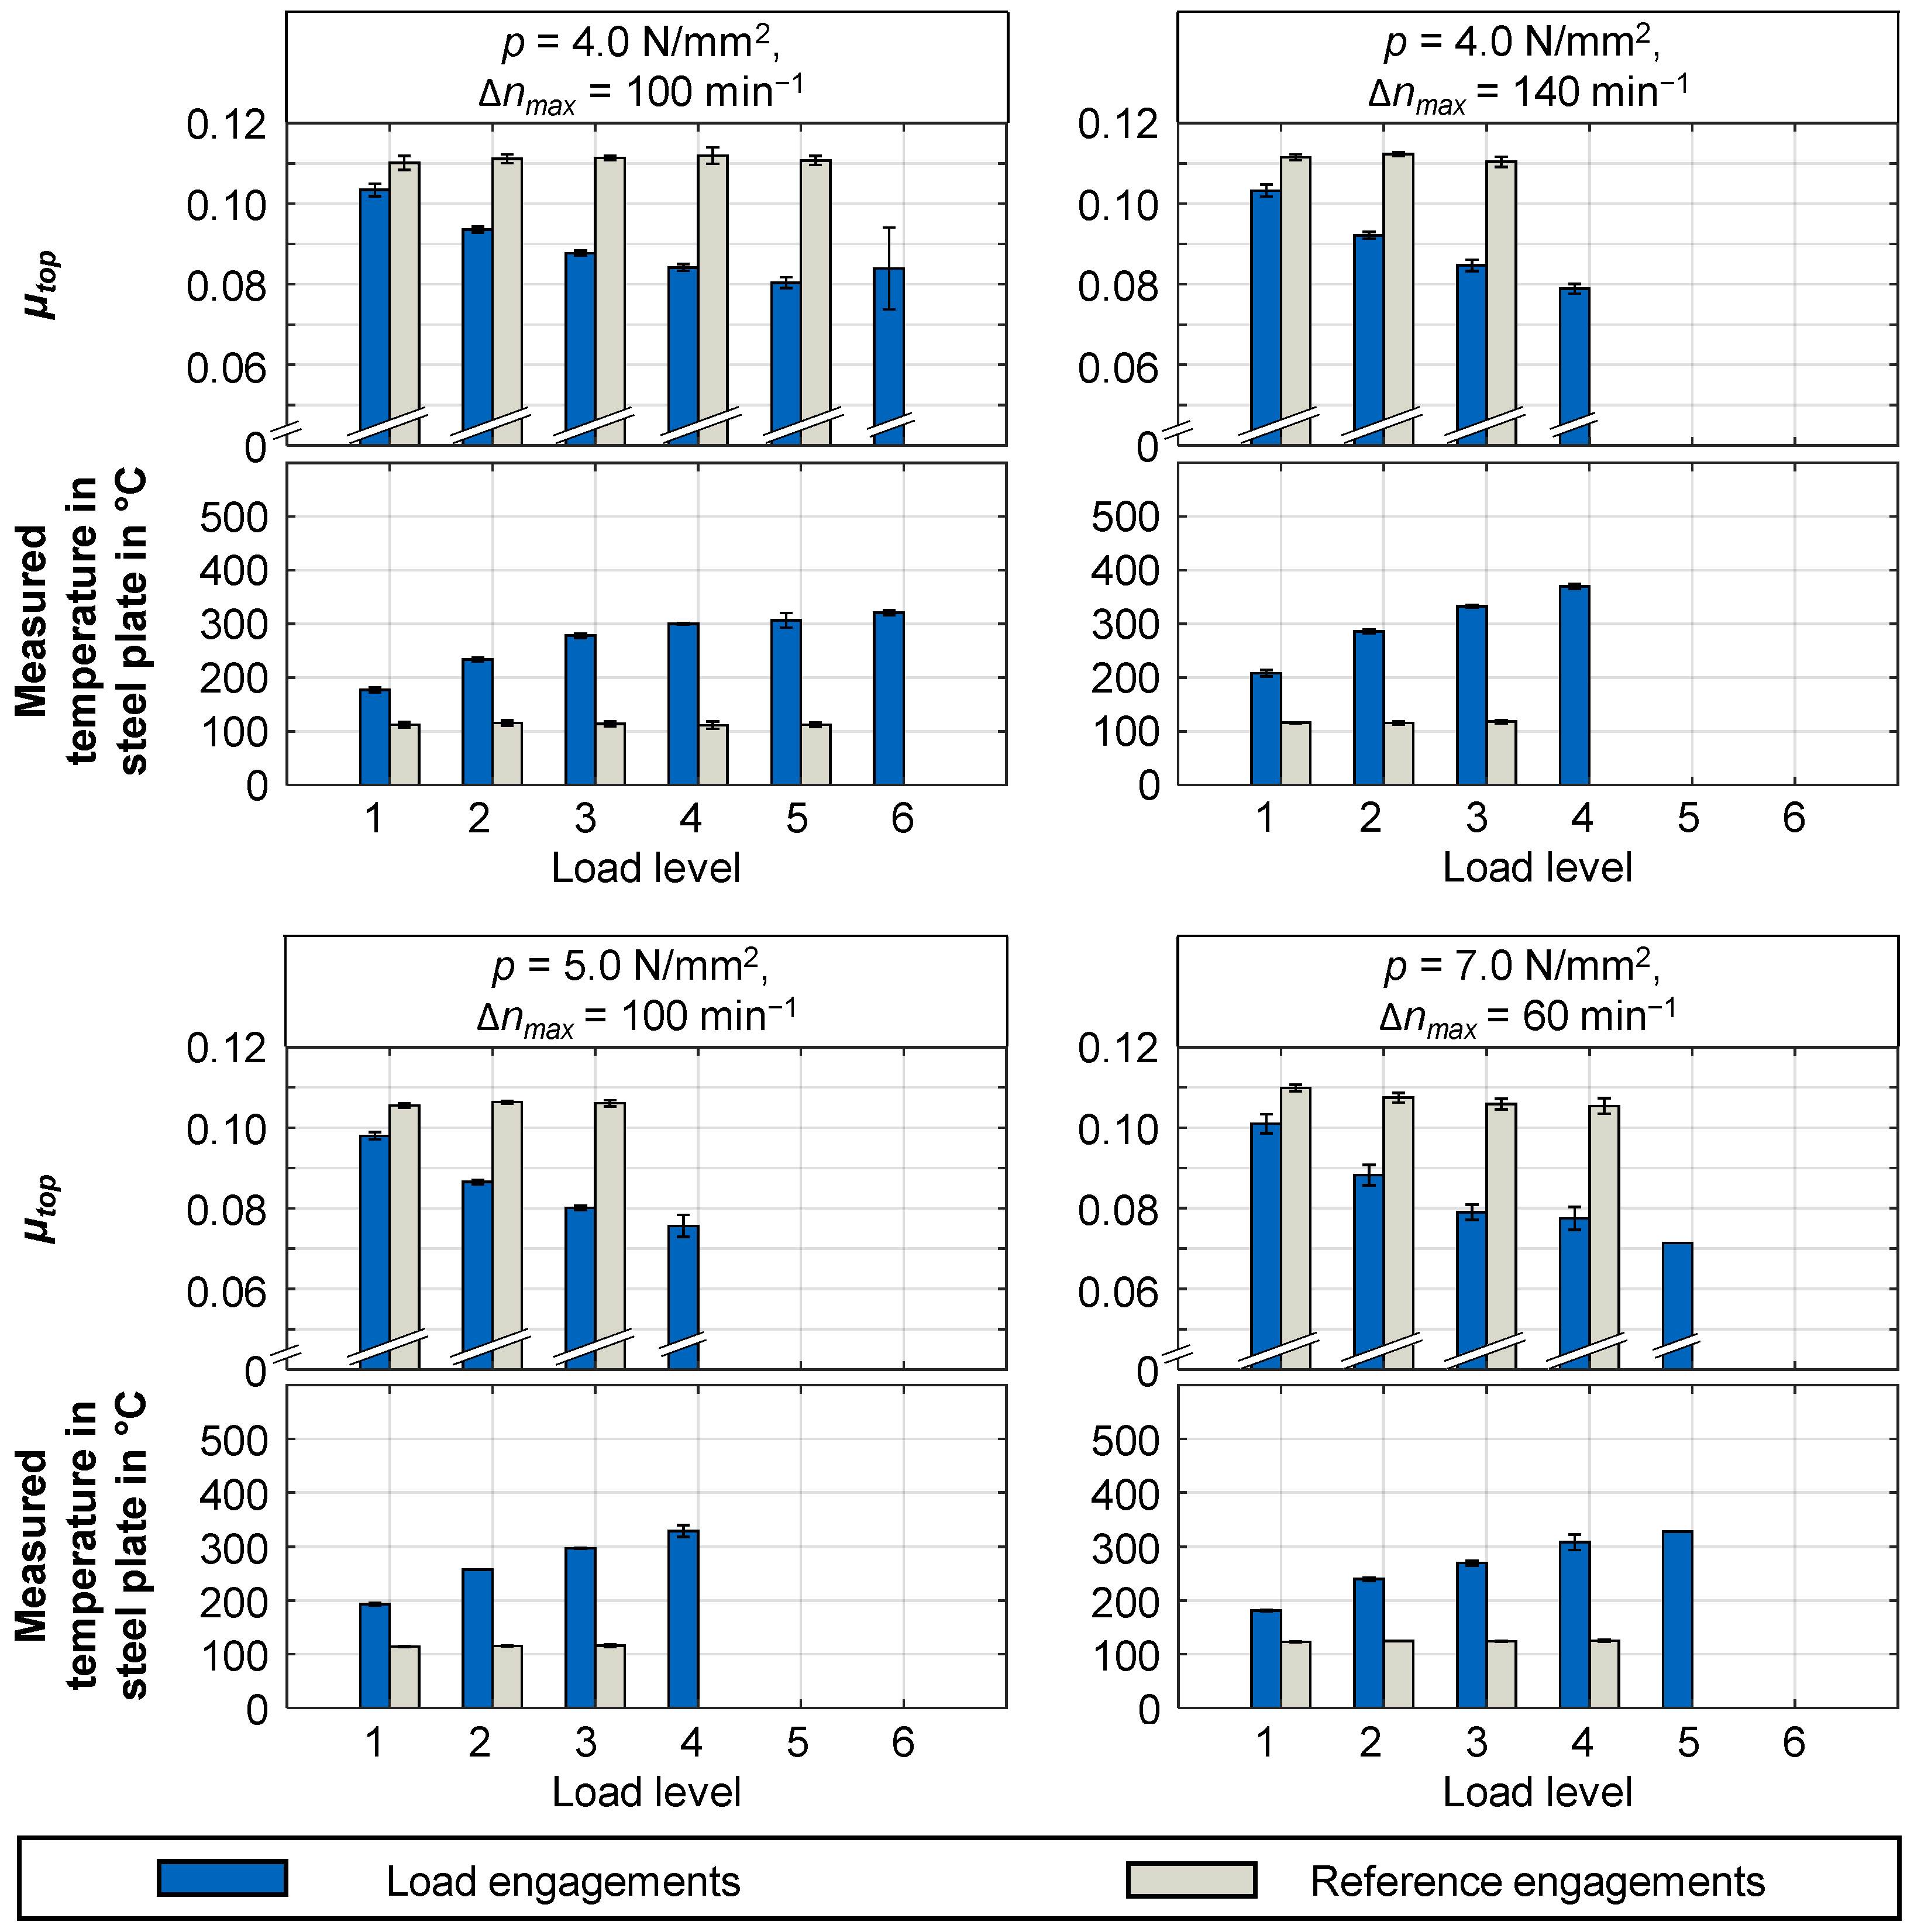
Figure 8 illustrates the outcomes, specifically highlighting the characteristic friction coefficient
µtop and the highest recorded temperature of the steel plate in four of these step tests. Data from the remaining five step tests are comprehensively detailed in the appendix. The damage patterns observed in the tests conducted align with those detailed in
Section 3.1. The results are graphically represented through bar charts that include standard deviations. Within these charts, blue bars indicate the outcomes of the load engagements, while the gray bars correspond to the results from the reference engagements. The step tests involving the FS1 system are conducted under pressures ranging from 4.0 to 8.0 N/mm
2, and a maximum slip speed varying between 80 and 140 min⁻
1. A notable trend observed during these tests is the reduction in the characteristic friction coefficient
µtop in the load engagements (depicted in blue). However, at the failure load level, there is an observable increase in the friction characteristic value
µtop in certain step tests. Additionally, the standard deviation of
µtop tends to escalate as the load level intensifies. Regarding the maximum temperatures measured in the steel plate, both the values and their standard deviations display an upward trend in the load levels as the step tests progress. Conversely, in the reference engagements (represented in gray), the temperature levels remain relatively constant across all load levels, with minimal standard deviation. The characteristic friction coefficient
µtop in these reference engagements initially shows a decrease in the first few load levels. In experiments featuring multiple load levels, the
µtop stabilizes around 0.09. Beyond this point, no further systematic decline in this characteristic value is observed in the subsequent load levels.
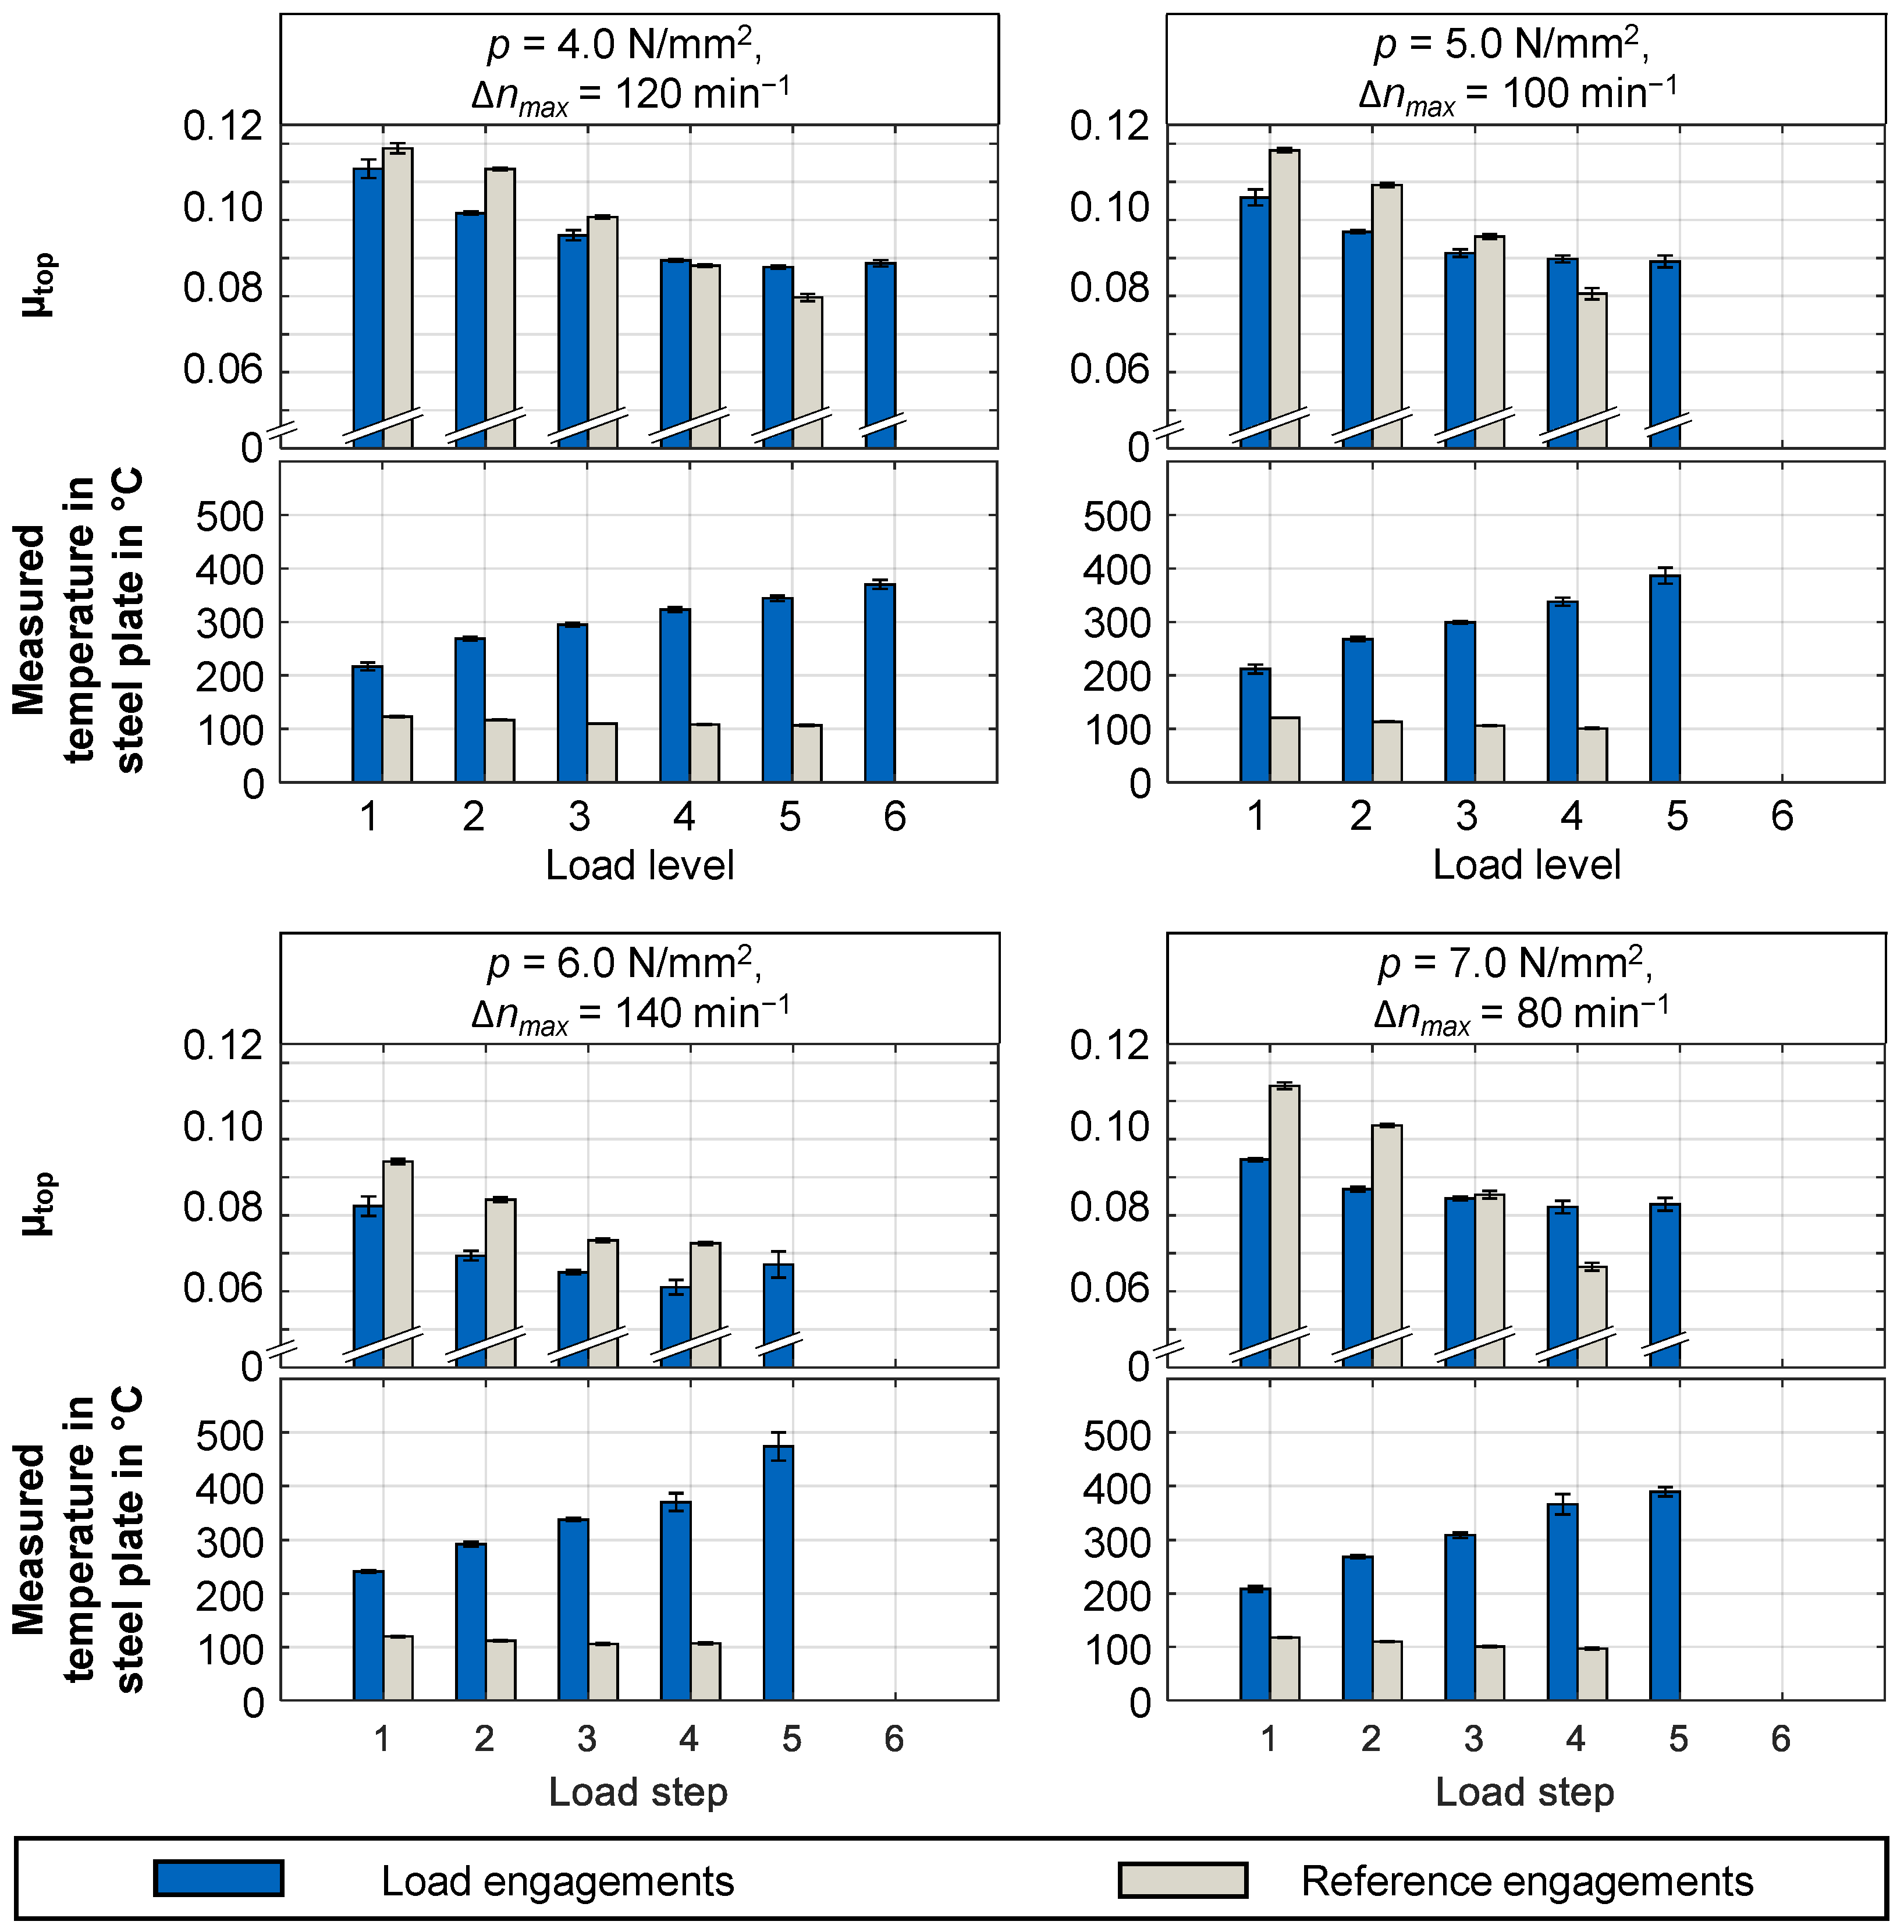
Figure 9 presents the recorded peak temperatures in the steel plate and the characteristic friction coefficient
µtop, specifically for four step tests utilizing the FS2 friction system. Additional data pertaining to other step tests within this series are detailed in the appendix. The observed damage patterns in the conducted tests correspond to those described in
Section 3.1. Throughout the step tests with the FS2 system, pressure is varied within the range of 4.0 to 8.0 N/mm
2, and the maximum slip speeds fluctuated between 60 and 140 min⁻
1. A notable pattern observed is the consistent decrease in the characteristic friction coefficient
µtop across successive load levels during the load engagements. Concurrently, both the highest temperature measured in the steel plate and its standard deviation exhibited an upward trend as the step tests progressed. In the case of the reference engagements, depicted in gray, there is a marked consistency in the temperature levels, characterized by minimal standard deviation across all the load levels. Interestingly, the characteristic friction coefficient
µtop in these reference engagements exhibits lower values at the higher load levels compared to those at the beginning of the step test. Furthermore, there is a discernible downward trend in
µtop from one load level to the next.
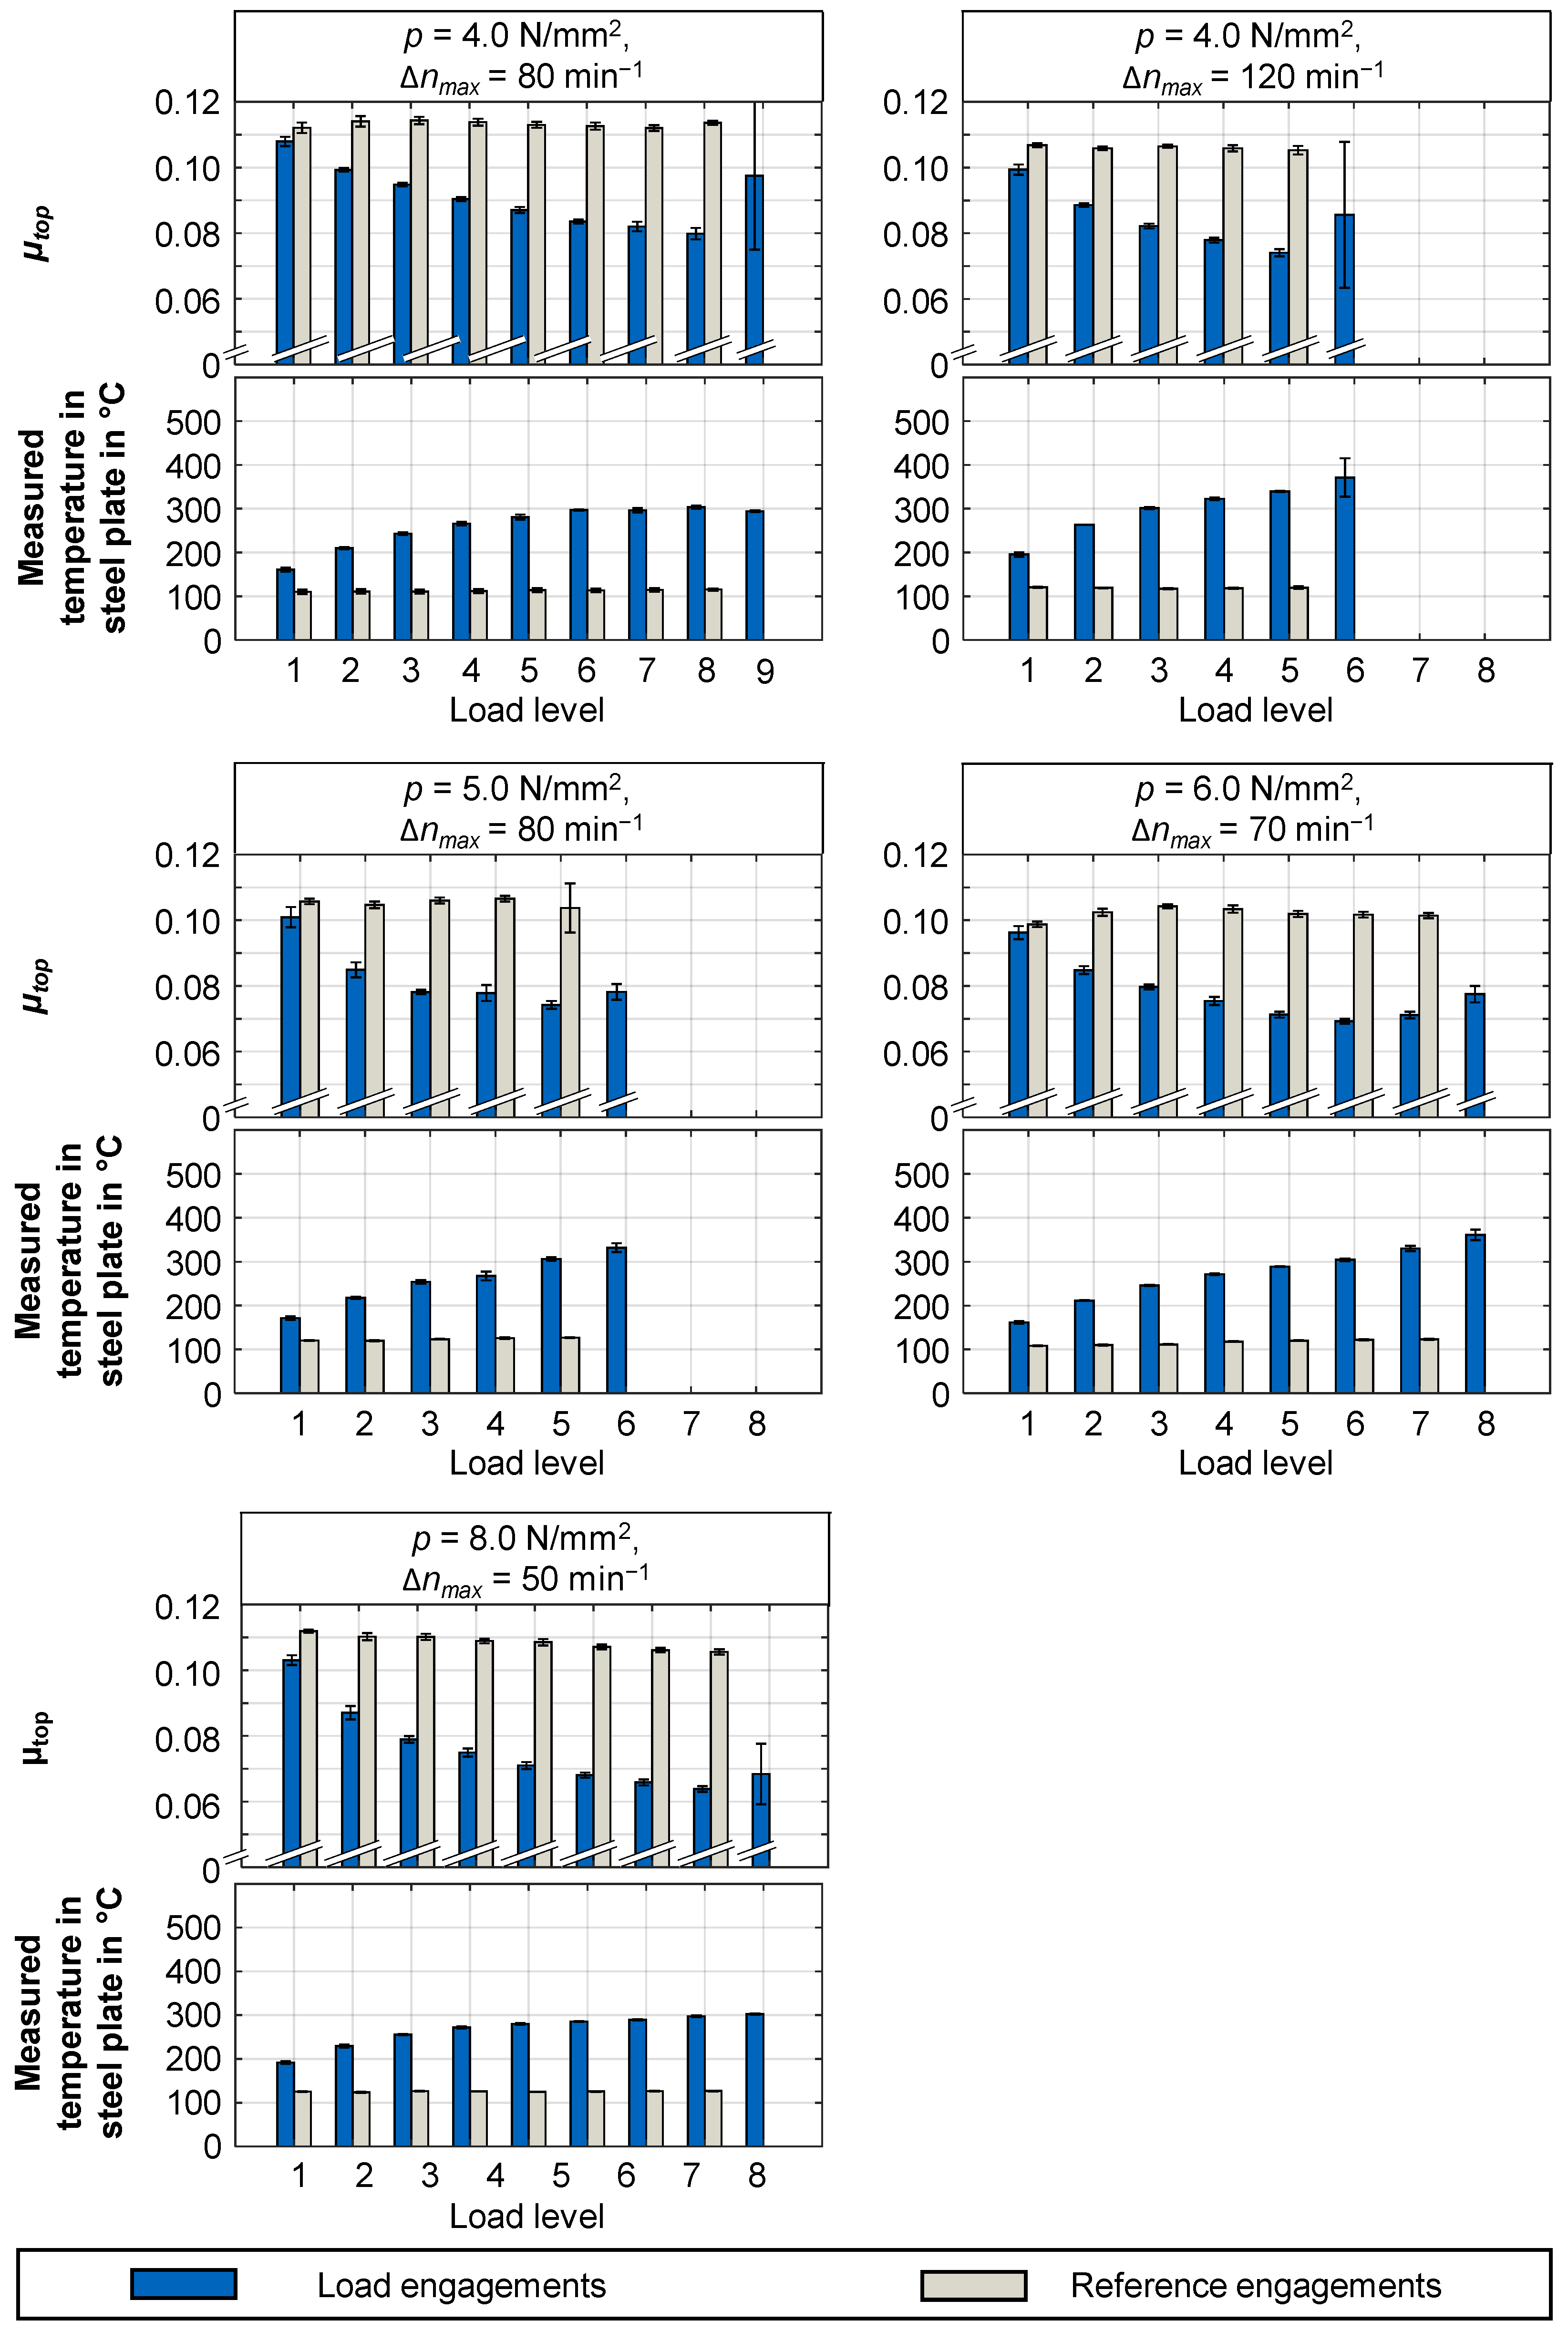
Figure 10 provides a detailed visualization of the peak temperatures recorded in the steel plate and the characteristic friction coefficient
µtop, as observed in four step tests conducted with the FS3 friction system. Complementary data from additional step tests are comprehensively compiled in the appendix. The patterns of damage identified in the conducted tests correspond to those described in
Section 3.1. In the tests, the pressures applied varied from 4.0 to 8.0 N/mm
2, while the maximum slip speeds oscillated between 50 and 140 min⁻
1. A consistent trend noted in the step tests during the load engagements is the gradual decrease in the characteristic friction coefficient
µtop across the successive load levels. Simultaneously, there is a continuous rise in both the maximum temperature measured in the steel plate and its associated standard deviation throughout the step test. Notably, temperatures exceeding 300 °C have been recorded in the load levels where failure occurred. In terms of the reference engagements, there is an observable stability in the temperature levels, which remains consistent across all tests for the FS3 system. As for the characteristic friction coefficient
µtop within these reference engagements, it maintains a consistently high level throughout the entirety of the step test, indicating a uniform frictional behavior across the various load levels.
3.3. Derivation of a Limit of Damage and Damage Prevention
The definition of critical damage thresholds is of decisive importance for the prevention of spontaneous damage in wet clutches during the operating phase. The empirical investigations carried out in this work on the friction systems FS1 to FS3 (see
Figure 7,
Figure 8,
Figure 9,
Figure 10,
Figure A1,
Figure A2 and
Figure A3) confirm the occurrence of spontaneous damage under increased thermal load. This is not only evident from the temperature measurements of the steel plates.
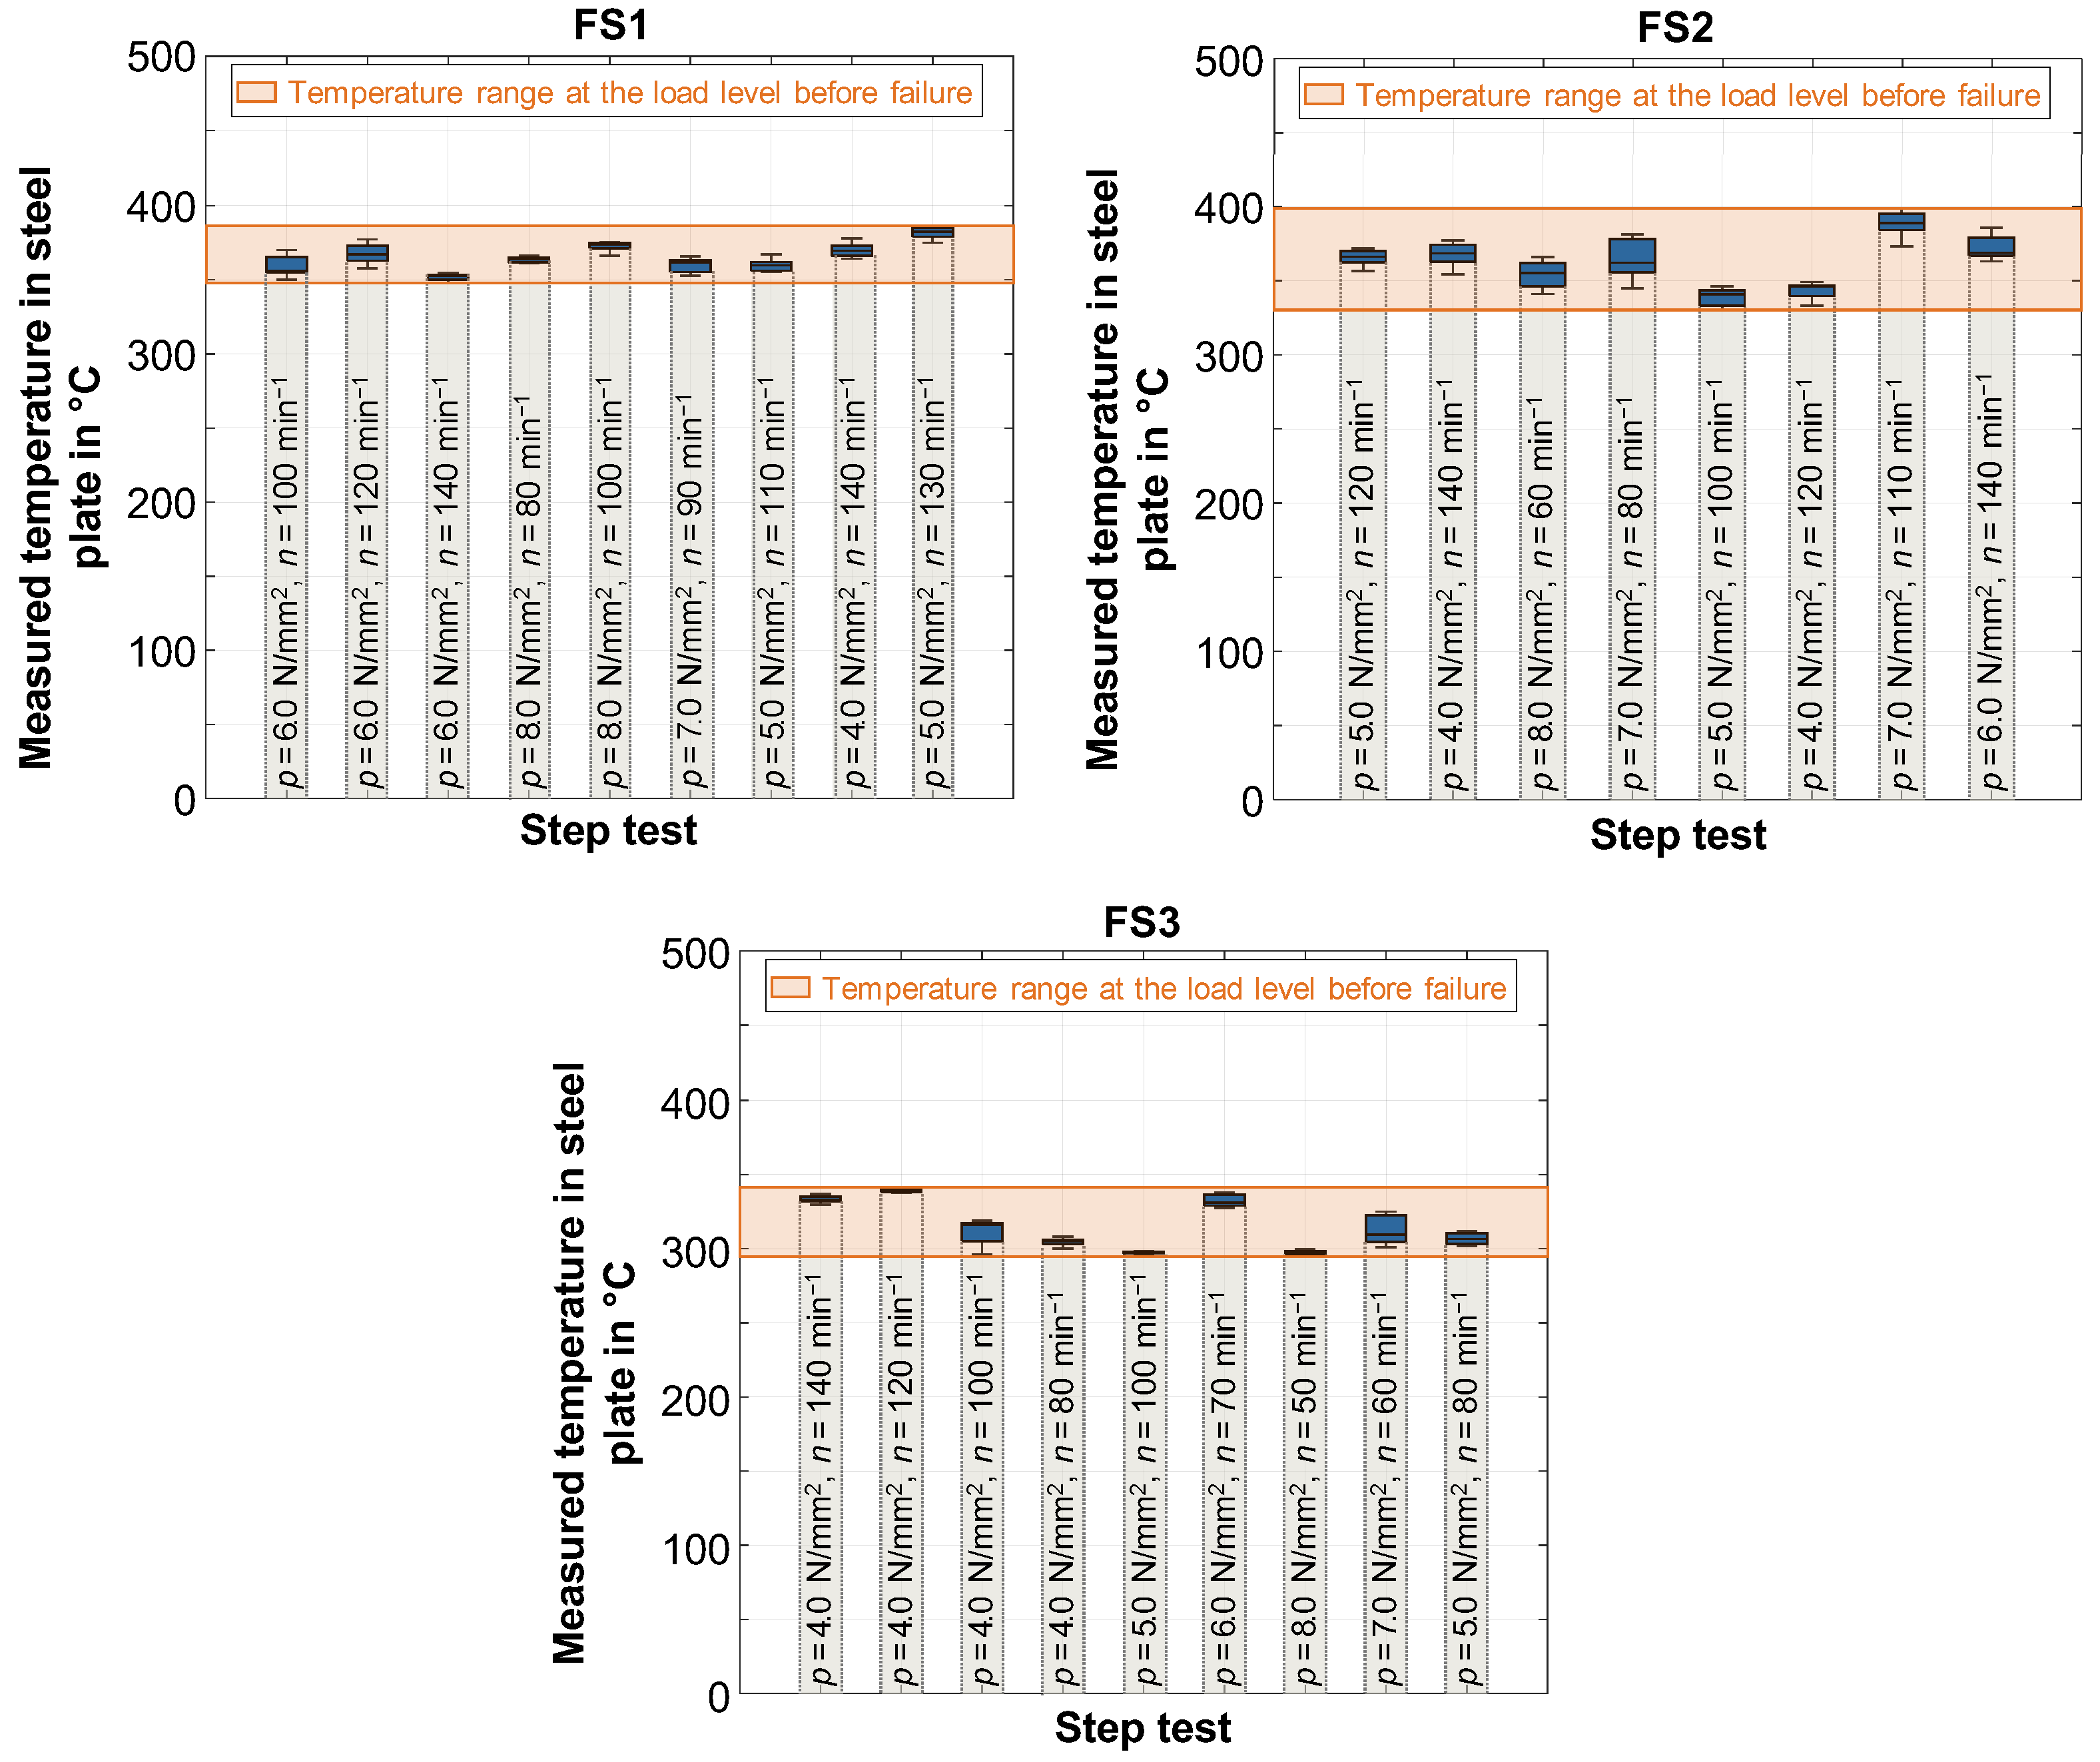
Figure 11 shows the recorded temperatures of the steel plates in the penultimate load level—the level just before the failure load level—for the friction systems FS1 to FS3. These data are consistent with the results shown in
Figure 8,
Figure 9,
Figure 10,
Figure A1,
Figure A2 and
Figure A3. A common observation for these friction systems is the consistently high temperature at the penultimate load level before failure, regardless of variations in parameters, such as pressure, maximum differential speed, and the number of sliding phases.
While the friction systems FS1 and FS2 have similar temperature profiles, the measured values for FS3 are comparatively lower. From the experimental data, it is inferred that specific critical temperature ranges conducive to spontaneous damage can be established for each friction system, even when the patterns of damage differ, such as buckling or lining detachment. These findings facilitate the definition of a critical temperature range for each friction system, which, if exceeded, could lead to spontaneous damage. The determined critical temperature ranges for the friction systems are as follows:
FS1: 348 °C–386 °C
FS2: 330 °C–398 °C
FS3: 294 °C–340 °C
4. Discussion
Contemporary research identifies various types of damage in friction materials, such as the transfer of sinter material in metallic types and the occurrence of hot spots and bands in organic materials. These damages are primarily associated with power shift modes and have been the subject of thorough studies. However, there is a noticeable gap in detailed research on damage patterns linked to spontaneous damage in transient slip modes.
This work’s experimental studies on transient slip modes indicate that steel plate buckling is the prevalent failure mechanism in friction systems FS1 and FS2. Cenbo et al. [
10] have provided insights into this phenomenon through their experimental and theoretical work, noting that buckling occurs when significant radial temperature differences arise and in-plane bending moments exceed critical levels. For friction system FS3, clutch failures are attributed to the separation of the lining from the carrier plate, suggesting that the bonding’s adhesive and cohesive forces are highly sensitive to temperature changes, weakening as temperatures increase. It is also deduced that the woven friction lining, rich in carbon fiber and sparse in matrix material, has greater thermal conductivity than the paper-based lining of friction plate FP1 and the composite carbon lining of FP2 [
20,
21,
22]. This characteristic allows for more efficient use of the carrier plate’s thermal capacity, maintaining lower clutch temperatures. Yang and Lam [
23] found that in traditional clutches, over 90% of heat is absorbed by the steel plate, creating a significant temperature gradient through the lining during engagement. The temperature at the bond interface between the carrier plate and friction material is substantially lower than at the surface, suggesting room for improvement in the clutch’s overall thermal performance. However, designing the bond layer to withstand necessary shear forces under high thermal conditions remains crucial. A common initial sign of damage in all friction systems is the discoloration of steel plates, a phenomenon well-documented in literature [
4,
24] and associated with power shifting. This discoloration, resulting from oil-cracking product deposits, occurs in both sintered and organic systems. In organic systems under power shift mode, damages like hot spots or bands are reported, often linked to thermoelastic instabilities as extensively discussed in the literature [
25,
26,
27,
28]. However, such damages are not typically seen in transient slip operations, as the frictional power in these modes is considerably lower than in power shifting, reducing the likelihood of thermoelastic instabilities. Additionally, the intermittent nature of slip phases in transient operations helps mitigate these instabilities and the formation of high temperature gradients, thus preventing hot spots.
The findings from
Section 3 clearly show that all friction systems (FS1–FS3) exhibit a limited temperature range at load levels just before failure, despite varying failure mechanisms. This indicates that thermal load is a critical factor in the spontaneous damage of wet multi-plate clutches during transient slip operations. Essentially, the experimental data conclude that reaching a specific thermal threshold is necessary for spontaneous damage to occur.
Torque transmission, a clutch’s primary function, is significantly affected by changes in load, particularly under conditions that can cause damage. The step test evaluations in
Section 3.2 (
Figure 8,
Figure 9,
Figure 10,
Figure A1,
Figure A2 and
Figure A3) clearly demonstrate a decrease in the
µtop characteristic value with increasing mechanical and thermal loads. This consistent behavior across the three friction systems suggests that temperature impacts lubricant properties. These findings align with the research of Marklund et al. [
29], which highlights the substantial impact of thermal effects on the transmissible torque in differentials under limited slip conditions.
