Evaluation of Antioxidant Properties and Molecular Design of Lubricant Antioxidants Based on QSPR Model

 ,
,
Abstract
:1. Introduction
2. Materials and Methods
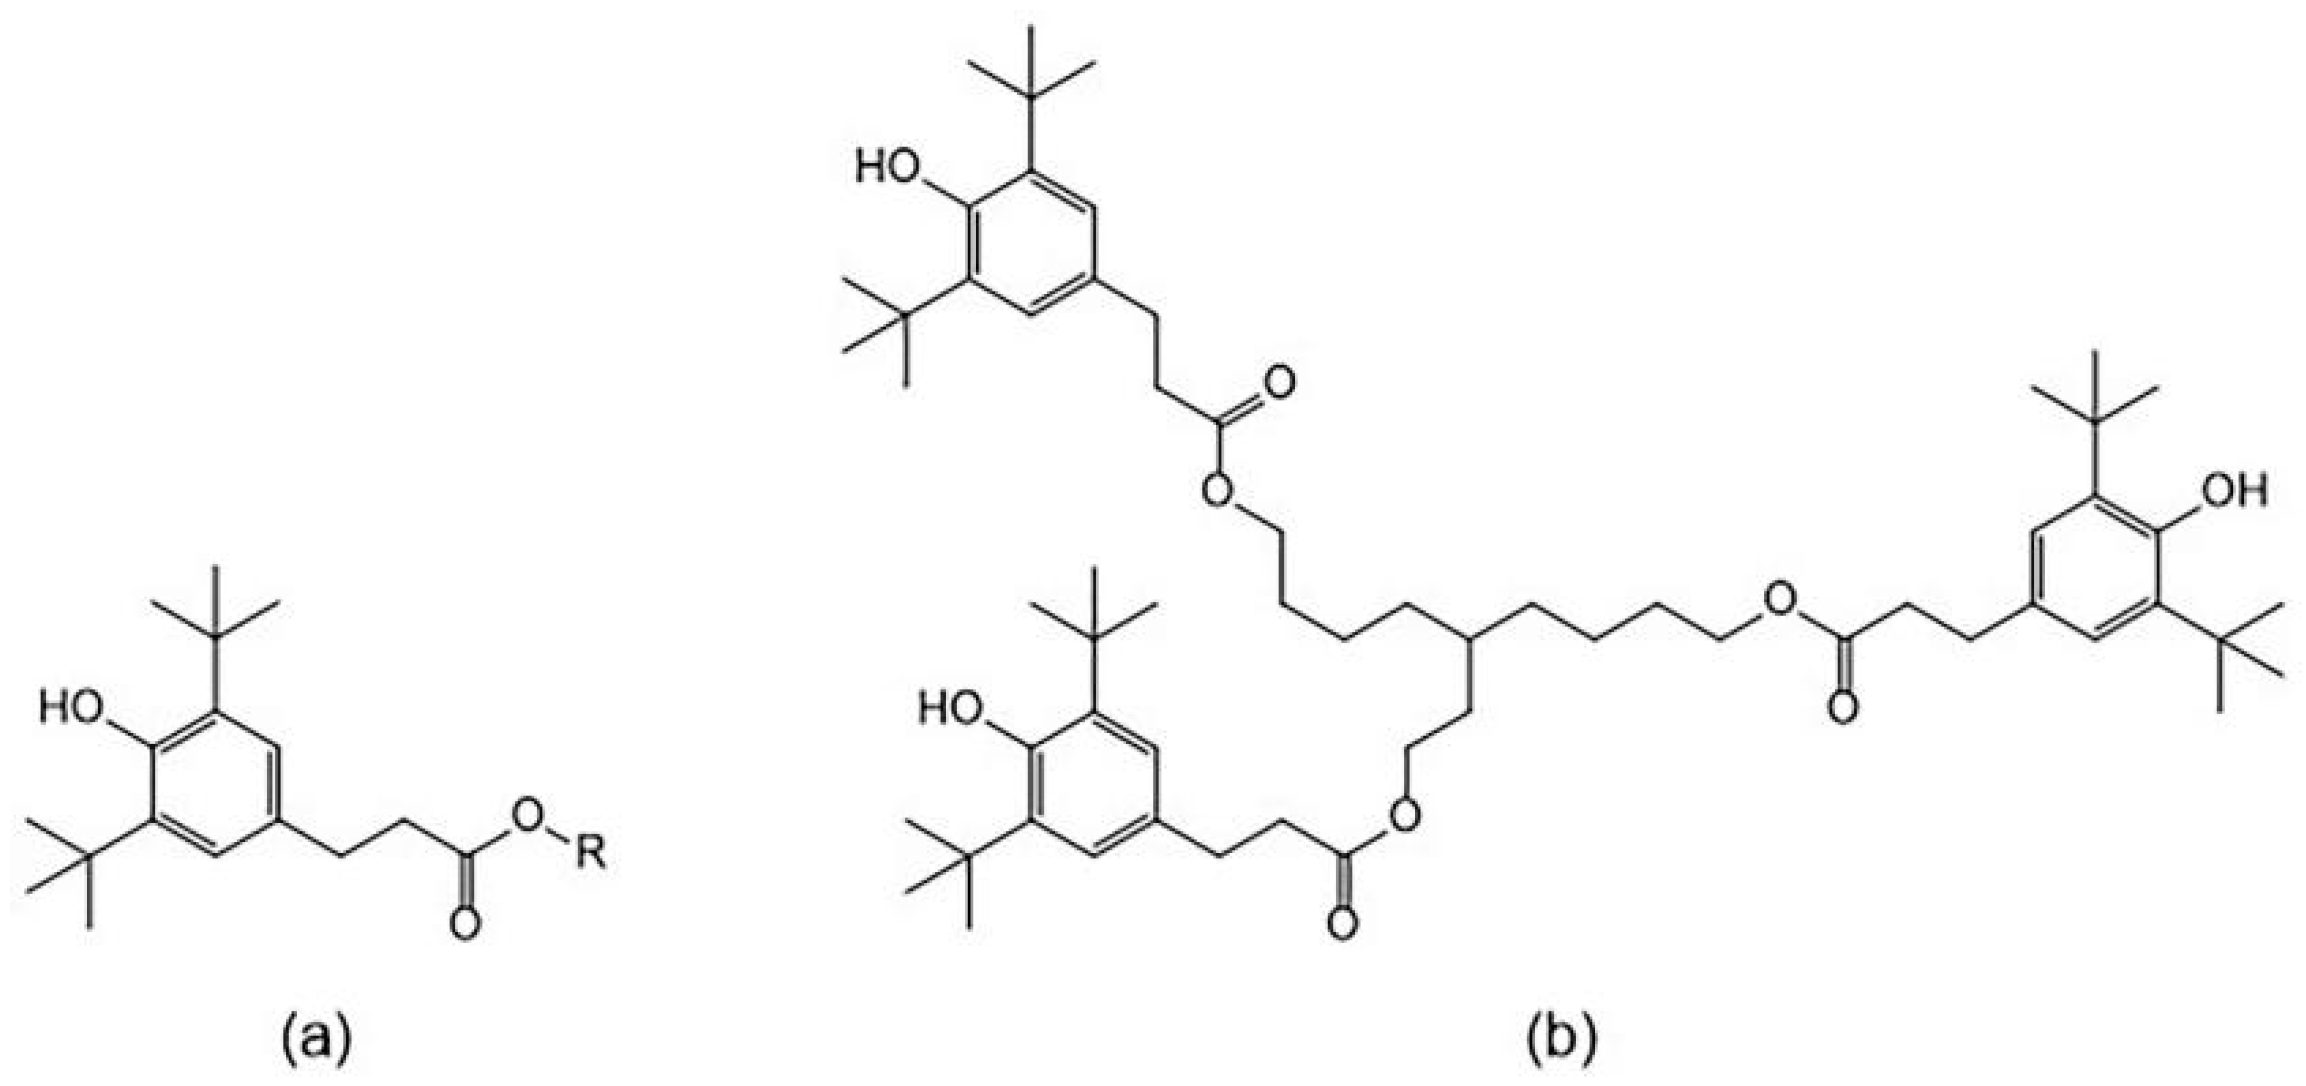
2.1. Data Sources of Antioxidants
2.2. Construction of QSPR Model
2.3. Quality Evaluation of the Model
2.4. Molecular Design of Lubricant Antioxidants
3. Results and Discussion
3.1. Established QSPR Model
3.2. Reliability of Model
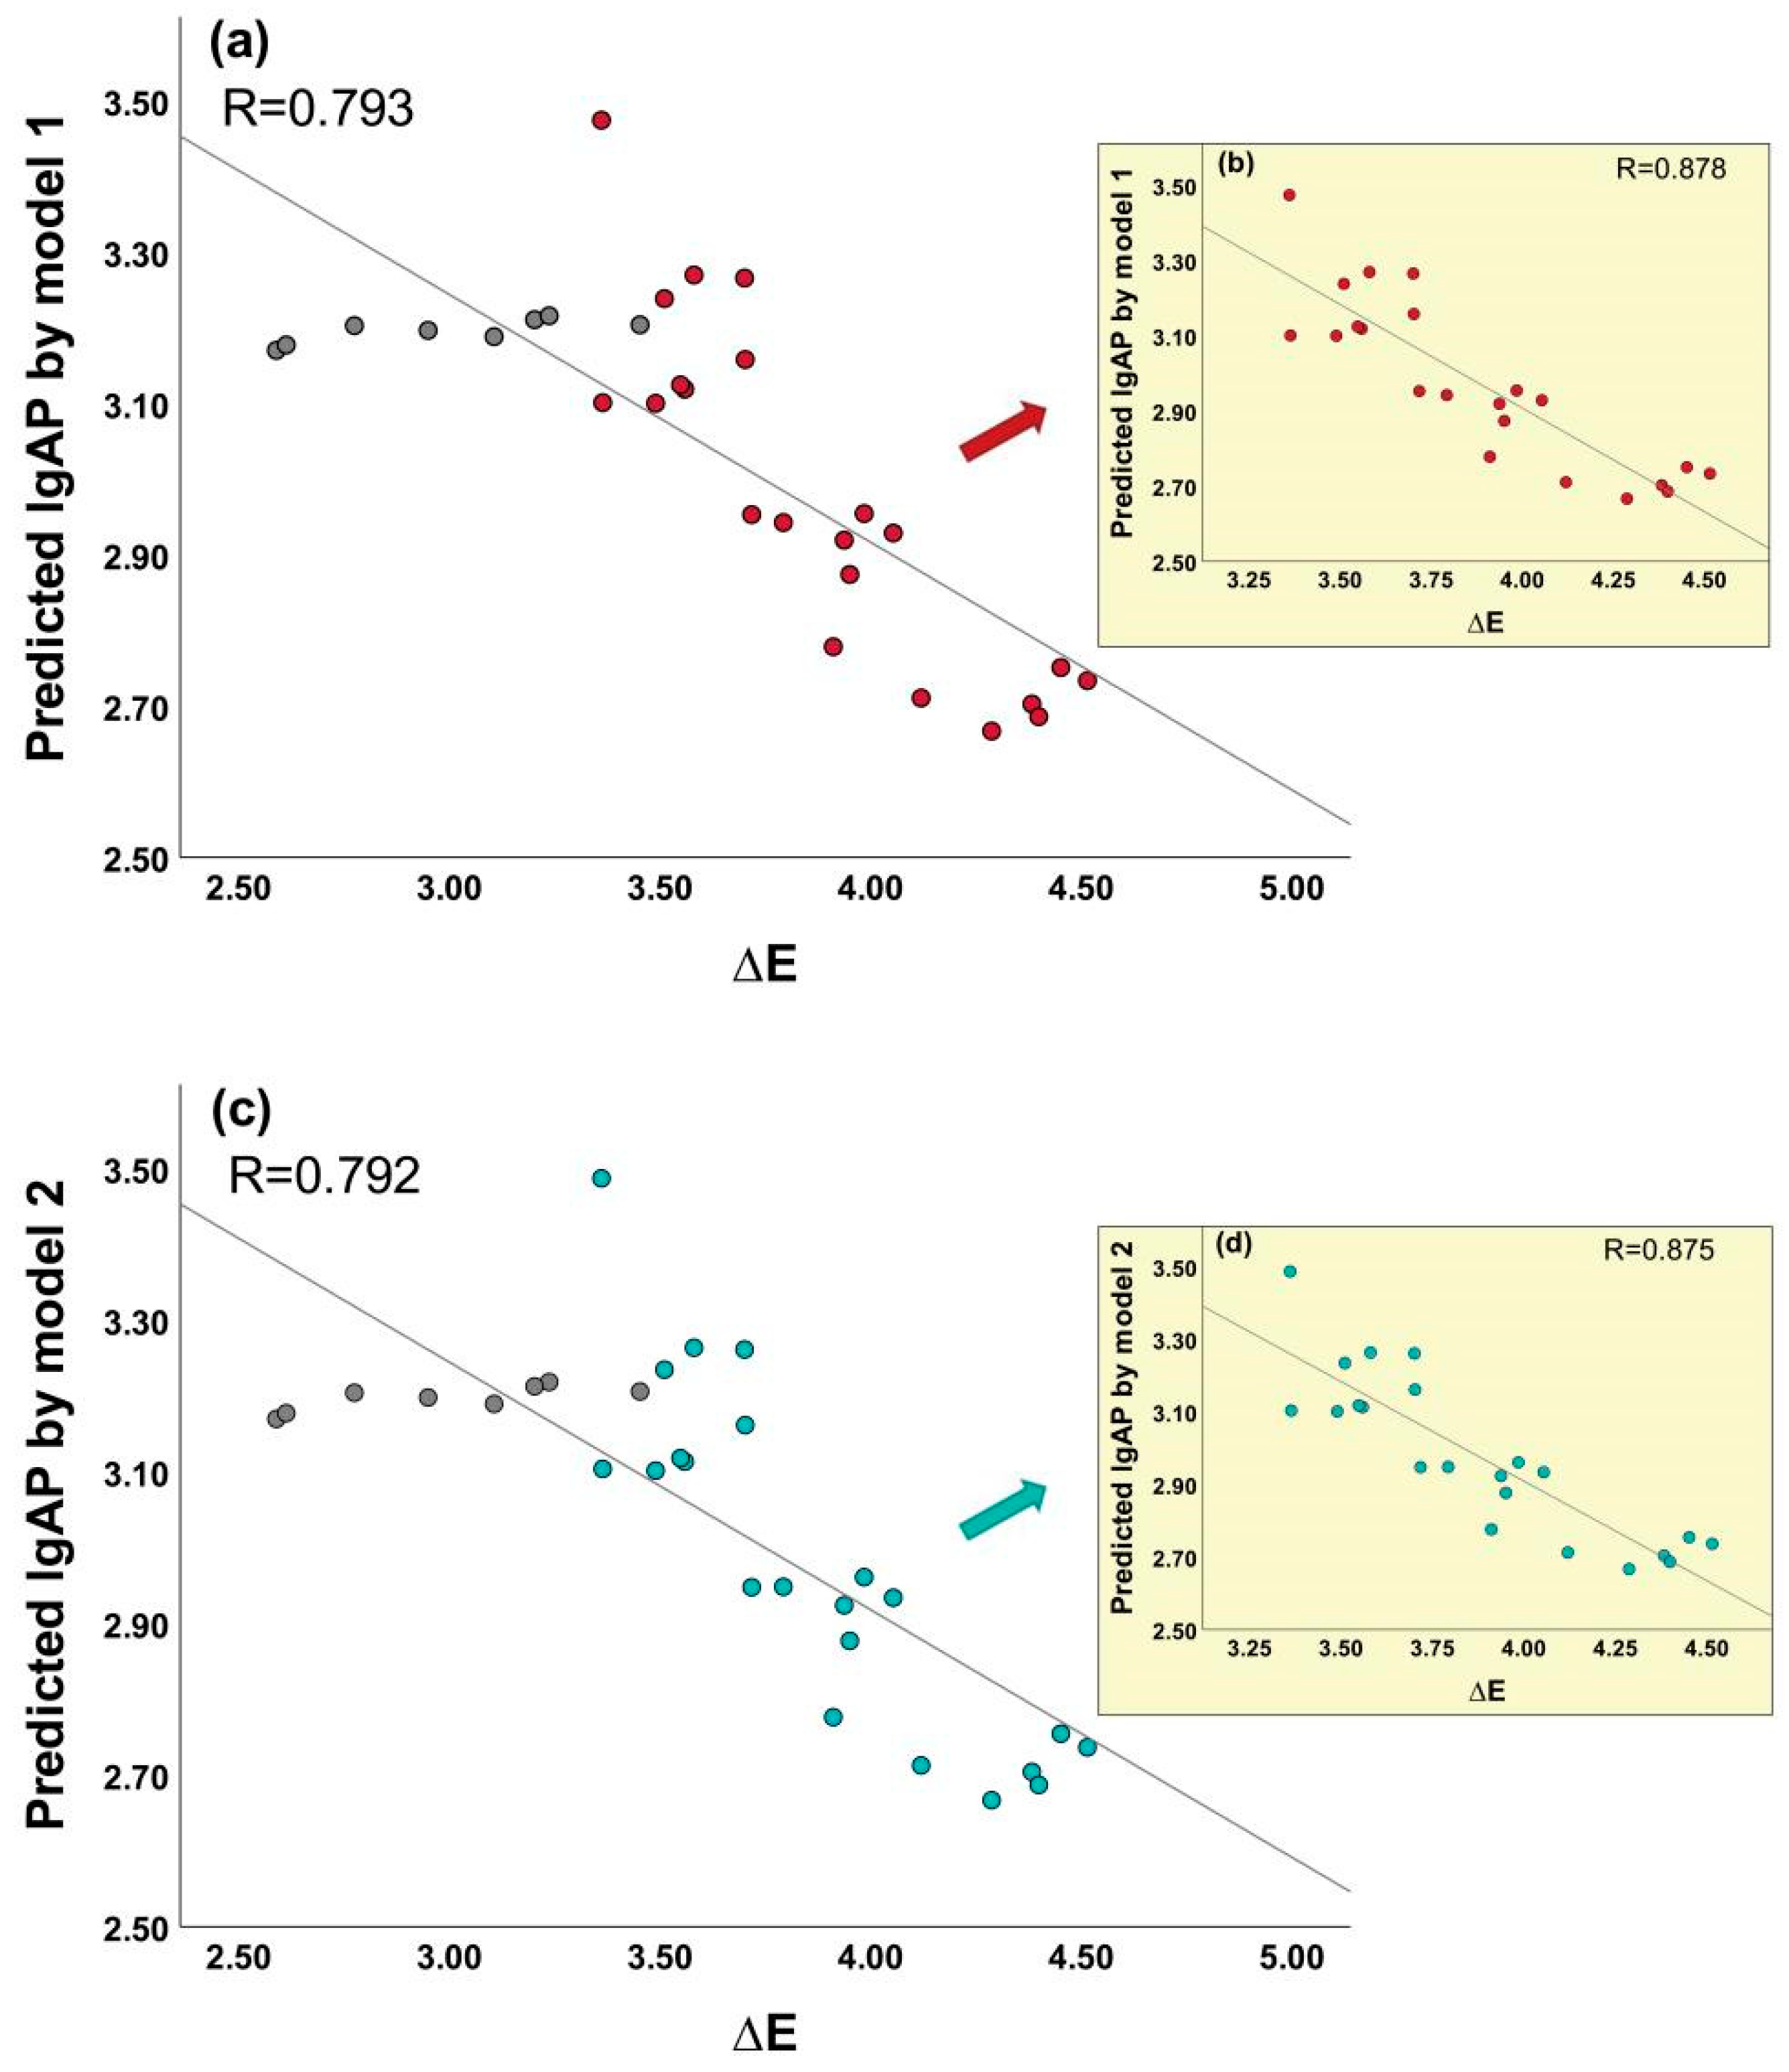
3.3. Interpretation of Model
3.4. Molecular Structure Design of Antioxidants
4. Conclusions
Author Contributions
Funding
Data Availability Statement
Conflicts of Interest
References
- Li, Y.; Zhou, W.D.; Xue, W.A.; Huang, Y.W.; Zhang, Q.; Han, J.B. The Enhancement of Overall Performance of Lubricating Grease by Adding Layered Double Hydroxides. Lubricants 2023, 11, 260. [Google Scholar] [CrossRef]
- Lacroix-Andrivet, O.; Hubert-Roux, M.; Bourhis, C.L.; Moualdi, S.; Siqueira, A.L.M.; Afonso, C. Characterization of Base Oil and Additive Oxidation Products from Formulated Lubricant by Ultra-High Resolution Mass Spectrometry. Lubricants 2023, 11, 345. [Google Scholar] [CrossRef]
- Gijsman, P. A review on the mechanism of action and applicability of Hindered Amine Stabilizers. Polym. Degrad. Stab. 2017, 145, 2–10. [Google Scholar] [CrossRef]
- Zheng, Y.Z.; Li, F.S.; Zhang, H.C.; Wang, S.; Zhao, Z.J.; Wang, W.C.; Chen, R.Y. Fishhook characteristics of biodiesel lubricity during autoxidation. Fuel 2023, 331, 125897. [Google Scholar] [CrossRef]
- Orives, J.R.; Galvan, D.; Pereira, J.L.; Coppo, R.L.; Borsato, D. Experimental Design Applied for Cost and Efficiency of Antioxidants in Biodiesel. J. Am. Oil Chem. Soc. 2014, 91, 1805–1811. [Google Scholar] [CrossRef]
- Parveen, S.; Awan, N.U.; Farooq, F.B.; Fanja, R.; Anjum, Q.U. Topological Indices of Novel Drugs Used in Autoimmune Disease Vitiligo Treatment and Its QSPR Modeling. Biomed Res. Int. 2022, 2022, 6045066. [Google Scholar] [CrossRef]
- Osman, M.S.; Awad, T.A.; Shantier, S.W.; Garelnabi, E.A.; Osman, W.; Mothana, R.A.; Nasr, F.A.; Elhag, R.I. Identification of some chalcone analogues as potential antileishmanial agents: An integrated and evaluation. Arab. J. Chem. 2022, 15, 103717. [Google Scholar] [CrossRef]
- Khan, K.; Kumar, V.; Colombo, E.; Lombardo, A.; Benfenati, E.; Roy, K. Intelligent consensus predictions of bioconcentration factor of pharmaceuticals using 2D and fragment-based descriptors. Environ. Int. 2022, 170, 107625. [Google Scholar] [CrossRef]
- Ni, Z.H.; Li, F.S.; Wang, H.; Xiao, H. Prediction of physical parameters of Jatropha biodiesel-ethanol dual fuel based on topological indices. Appl. Energy 2022, 328, 120202. [Google Scholar] [CrossRef]
- Koné, A.; Es-Sabar, A.; Do, M.T. Application of Machine Learning Models to the Analysis of Skid Resistance Data. Lubricants 2023, 11, 328. [Google Scholar] [CrossRef]
- Navabi, A.; Isfahani, T.M.; Ramazani, M.; Alimoradi, M. QSPR Models for Predicting Retention Indices of Polygonum minus Huds. Essential Oil Composition Using GA-BWMLR and GA-BPANN Methods. J. Essent. Oil Bear. Plants 2021, 24, 879–896. [Google Scholar] [CrossRef]
- Wang, H.W.; Zhang, C.H.; Yu, X.W.; Li, Y.Y. Evaluating Wear Volume of Oligoether Esters with an Interpretable Machine Learning Approach. Tribol. Lett. 2023, 71, 43. [Google Scholar] [CrossRef]
- Tao, C. Quantitative Structure-Activity Relationship on Adsorption Coefficient of Organic Pollutants between Microplastics and Water Environment. Master’s Thesis, Yangzhou University, Yangzhou, China, 2023. [Google Scholar]
- Liu, P.X.; Long, W. Current Mathematical Methods Used in QSAR/QSPR Studies. Int. J. Mol. Sci. 2009, 10, 1978–1998. [Google Scholar] [CrossRef]
- Yu, X.L.; Zhan, R.M.; Deng, J.Y.; Huang, X.W. Prediction of the maximum nonseizure load of lubricant additives. J. Theor. Comput. Chem. 2017, 16, 1750014. [Google Scholar] [CrossRef]
- Liu, Y.L.; Deng, J.Y.; Yu, X.L. Quantitative Structure-Property Relationships of Antiwear Performance of Lubricant Additives. Rev. Roum. Chim. 2017, 62, 849–855. [Google Scholar]
- Abdulfatai, U.; Uzairu, A.; Uba, S.; Shallangwa, G.A. Molecular design of antioxidant lubricating oil additives via QSPR and analysis dynamic simulation method. Heliyon 2019, 5, e02880. [Google Scholar] [CrossRef]
- Abdulfatai, U.; Uzairu, A.; Uba, S.; Shallangwa, G.A. Quantitative Structure-Properties Relationship of Lubricating Oil Additives and Molecular Dynamic Simulations Studies of Diamond-Like-Carbon (DLC). Iran. J. Chem. Chem. Eng.-Int. Engl. Ed. 2020, 39, 281–295. [Google Scholar] [CrossRef]
- Higgins, C.L.; Filip, S.V.; Afsar, A.; Hayes, W. Synthesis, characterisation, and performance evaluation of tri-armed phenolic antioxidants. Tetrahedron Lett. 2020, 61, 152127. [Google Scholar] [CrossRef]
- Higgins, C.L.; Filip, S.V.; Afsar, A.; Hayes, W. Evaluation of thermal and oxidative stability of three generations of phenolic based novel dendritic fuel and lubricant additives. React. Funct. Polym. 2019, 142, 119–127. [Google Scholar] [CrossRef]
- Higgins, C.L.; Filip, S.V.; Afsar, A.; Hayes, W. Increasing the antioxidant capability via the synergistic effect of coupling diphenylamine with sterically hindered phenol. Tetrahedron 2019, 75, 130759. [Google Scholar] [CrossRef]
- Zhan, S.P.; Duan, H.T.; Hua, M.; Xu, H.P.; Shang, H.F.; Jin, Y.L.; Jia, D.; Tu, J.S.; Li, J. Studies of antioxidant performance of amine additives in lubricating oil using 3D-QSAR. Sci. China-Technol. Sci. 2017, 60, 299–305. [Google Scholar] [CrossRef]
- Tetko, I.V.; Gasteiger, J.; Todeschini, R.; Mauri, A.; Livingstone, D.; Ertl, P.; Palyulin, V.; Radchenko, E.; Zefirov, N.S.; Makarenko, A.S.; et al. Virtual computational chemistry laboratory—Design and description. J. Comput.-Aided Mol. Des. 2005, 19, 453–463. [Google Scholar] [CrossRef]
- Wang, Y.Q.; Zhou, P.P.; Lin, Y.; Shu, M.; Hu, Y.; Xia, Q.Y.; Lin, Z.H. Quantitative Prediction of Class I MHC/Epitope Binding Affinity Using QSAR Modeling Derived from Amino Acid Structural Information. Comb. Chem. High Throughput Screen. 2015, 18, 75–82. [Google Scholar] [CrossRef]
- Liu, J.F.; Zhang, R.R.; Yang, S.C.; Liu, T.; Yi, C.L.Z.; Zhang, Y.Y.; Jia, D. Evaluation of Anti-wear Properties of Different Vegetable Oils Based on QSPR Model. Tribol. Lett. 2023, 71, 35. [Google Scholar] [CrossRef]
- Lai, I.K.W.; Hitchcock, M. A consideration of normality in importance-performance analysis. Curr. Issues Tour. 2015, 18, 979–1000. [Google Scholar] [CrossRef]
- Tropsha, A. Best Practices for QSAR Model Development, Validation, and Exploitation. Mol. Inf. 2010, 29, 476–488. [Google Scholar] [CrossRef]
- Wang, G.R.; Xue, Y.S.; An, L.; Zheng, Y.G.; Dou, Y.Y.; Zhang, L.; Liu, Y. Theoretical study on the structural and antioxidant properties of some recently synthesised 2,4,5-trimethoxy chalcones. Food Chem. 2015, 171, 89–97. [Google Scholar] [CrossRef]
- Xue, Y.S.; Liu, Y.P.; Luo, Q.Q.; Wang, H.; Chen, R.; Liu, Y.; Li, Y. Antiradical Activity and Mechanism of Coumarin-Chalcone Hybrids: Theoretical Insights. J. Phys. Chem. A 2018, 122, 8520–8528. [Google Scholar] [CrossRef]
- Alasalvar, C.; Soylu, M.S.; Guder, A.; Albayrak, C.; Apaydin, G.; Dilek, N. Molecular structure, quantum mechanical calculation and radical scavenging activities of (E)-4,6-dibromo-2- (3,5-dimethylphenylimino)methyl -3-methoxyphenol and (E)-4,6-dibromo-2- (2,6-dimethylphenylimino)methyl -3-methoxyphenol compounds. Spectrochim. Acta Part A-Mol. Biomol. Spectrosc. 2014, 130, 357–366. [Google Scholar] [CrossRef]
- Boulmokh, Y.; Belguidoum, K.; Meddour, F.; Amira-Guebailia, H. Investigation of antioxidant activity of epigallocatechin gallate and epicatechin as compared to resveratrol and ascorbic acid: Experimental and theoretical insights. Struct. Chem. 2021, 32, 1907–1923. [Google Scholar] [CrossRef]
- Szewczuk, N.A.; Duchowicz, P.R.; Pomilio, A.B.; Lobayan, R.M. Resonance structure contributions, flexibility, and frontier molecular orbitals (HOMO-LUMO) of pelargonidin, cyanidin, and delphinidin throughout the conformational space: Application to antioxidant and antimutagenic activities. J. Mol. Model. 2023, 29, 2. [Google Scholar] [CrossRef]
- Eliasi, M.; Taeri, B. Balaban index of zigzag polyhex nanotorus. J. Comput. Theor. Nanosci. 2007, 4, 1174–1178. [Google Scholar] [CrossRef]
- Cash, G.G.; Anderson, B.; Mayo, K.; Bogaczyk, S.; Tunkel, J. Predicting genotoxicity of aromatic and heteroaromatic amines using electrotopological state indices. Mutat. Res.-Genet. Toxicol. Environ. Mutagen. 2005, 585, 170–183. [Google Scholar] [CrossRef]
- Wang, J.; Lv, C.S.; Li, J.; Li, H.Y.; Li, C.Q.; Chen, S. Study on kinetics and antioxidant activity of hindered phenolic antioxidant by oxygen uptake measurement. Chem. Eng. 2015, 29, 4–7. [Google Scholar] [CrossRef]


| Compound | Molecular Structure | Onset Temperature T (°C) | lgAP |
|---|---|---|---|
| 1 |  | 250.6 | 2.6749 |
| 2 |  | 256.6 | 2.7531 |
| 3 |  | 249.3 | 2.6845 |
| 4 |  | 246.0 | 2.7081 |
| 5 |  | 242.2 | 2.6389 |
| 6 |  | 247.5 | 2.7343 |
| 7 |  | 245.5 | 2.7466 |
| 8 |  | 243.1 | 2.8290 |
| 9 | 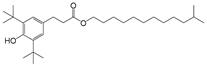 | 242.8 | 2.8950 |
| 10 | 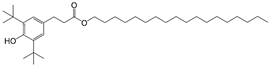 | 242.7 | 2.9546 |
| 11 | 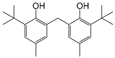 | 258.4 | 2.9916 |
| 12 |  | 248.6 | 2.9588 |
| 13 | 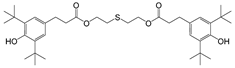 | 249.5 | 3.1525 |
| 14 | 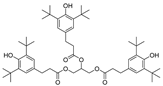 | 246.8 | 3.1874 |
| 15 | 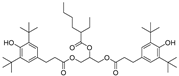 | 248.6 | 3.1461 |
| 16 |  | 245.3 | 2.9996 |
| 17 |  | 251.0 | 3.2858 |
| 18 | 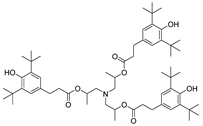 | 245.0 | 3.1998 |
| 19 | 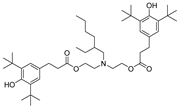 | 245.0 | 3.0801 |
| 20 |  | 249.0 | 3.1692 |
| 21 | 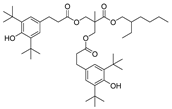 | 249.4 | 3.1769 |
| 22 | 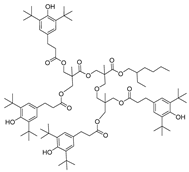 | 249.6 | 3.4686 |
| 23 | 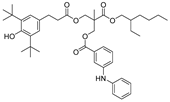 | 250.6 | 3.1575 |
| 24 |  | 251.0 | 3.1629 |
| 25 | 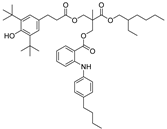 | 242.9 | 3.0485 |
| 26 | 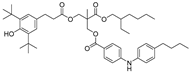 | 250.3 | 3.1862 |
| 27 |  | 251.1 | 3.1980 |
| 28 | 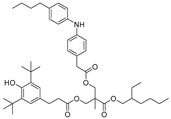 | 253.4 | 3.2413 |
| 29 |  | 254.4 | 3.2630 |
| 30 |  | 254.3 | 3.2607 |
| Independent Variables | Molecular Descriptors | Species | Correlation Coefficient |
|---|---|---|---|
| X1 | Total dipole | Electronic | 0.7193 |
| X2 | Balaban index JX | Topological | −0.9182 |
| X3 | Estate keys (sums): S_sOH | Topological | 0.5827 |
| X4 | Estate keys (sums): S_dO | Topological | 0.8998 |
| X5 | Estate keys (sums): S_ssO | Topological | 0.8847 |
| X6 | Shadow ratio | Spatial | 0.4474 |
| X7 | Total energy | Structure | 0.6026 |
| X8 | Inversion energy | Structure | 0.5296 |
| X9 | Electrostatic energy | Structure | −0.3133 |
| Model | R2 | Durbin– Watson | X | NS | S | p | VIF |
|---|---|---|---|---|---|---|---|
| 1 | 0.9416 | 1.6962 | constant | 3.5379 | |||
| X2 | −0.2267 | −0.7211 | 0.0000 | 4.9330 | |||
| X3 | 0.0034 | 0.1460 | 0.0222 | 1.4987 | |||
| X4 | 0.0031 | 0.3003 | 0.0035 | 3.5777 | |||
| X6 | −0.0461 | −0.1484 | 0.0493 | 2.1675 | |||
| 2 | 0.9413 | 1.6603 | constant | 3.5778 | |||
| X2 | −0.2362 | −0.7512 | 0.0000 | 4.3860 | |||
| X3 | 0.0031 | 0.1320 | 0.0421 | 1.5832 | |||
| X5 | 0.0065 | 0.2863 | 0.0038 | 3.2930 | |||
| X6 | −0.0482 | −0.1550 | 0.0403 | 2.1395 |
| Compound | X2 | X3 | X4 | X5 | X6 | lgAP | lgAP1 | RD1 (%) | lgAP2 | RD2 (%) |
|---|---|---|---|---|---|---|---|---|---|---|
| 1 | 3.3405 | 10.2600 | 0.0000 | 0.0000 | 1.7560 | 2.6749 | 2.7346 | 2.20 | 2.7360 | 2.30 |
| 2 | 3.2750 | 9.8363 | 0.0000 | 0.0000 | 1.6750 | 2.7531 | 2.7517 | −0.08 | 2.7540 | 0.05 |
| 3 | 3.4805 | 10.3845 | 0.0000 | 0.0000 | 1.7496 | 2.6845 | 2.7035 | 0.67 | 2.7036 | 0.73 |
| 4 | 3.6529 | 10.6502 | 0.0000 | 0.0000 | 1.6965 | 2.7081 | 2.6678 | −1.52 | 2.6662 | −1.52 |
| 5 | 3.5486 | 10.6390 | 0.0000 | 0.0000 | 1.7935 | 2.6389 | 2.6869 | 1.78 | 2.6861 | 1.81 |
| 6 | 3.4284 | 10.6050 | 0.0000 | 0.0000 | 1.8455 | 2.7343 | 2.7117 | −0.86 | 2.7119 | −0.80 |
| 7 | 3.2467 | 10.6164 | 11.3441 | 4.7024 | 2.0444 | 2.7466 | 2.7789 | 1.16 | 2.7759 | 1.08 |
| 8 | 2.6007 | 10.7909 | 12.1106 | 5.4007 | 3.2199 | 2.8290 | 2.8741 | 1.59 | 2.8769 | 1.70 |
| 9 | 2.3075 | 10.8488 | 12.2588 | 5.4762 | 2.9273 | 2.8950 | 2.9547 | 2.06 | 2.9609 | 2.28 |
| 10 | 2.0994 | 10.8854 | 12.3357 | 5.5133 | 4.7248 | 2.9546 | 2.9194 | −1.19 | 2.9238 | −1.04 |
| 11 | 2.5597 | 21.6358 | 0.0000 | 0.0000 | 1.9074 | 2.9916 | 2.9433 | −1.64 | 2.9483 | −1.45 |
| 12 | 2.7146 | 22.1110 | 0.0000 | 0.0000 | 1.4815 | 2.9588 | 2.9294 | −1.02 | 2.9337 | −0.84 |
| 13 | 1.7033 | 21.8336 | 24.8405 | 10.8766 | 3.1520 | 3.1525 | 3.1577 | 0.18 | 3.1619 | 0.29 |
| 14 | 1.7619 | 33.5276 | 40.0022 | 17.2228 | 2.3389 | 3.1874 | 3.2687 | 2.58 | 3.2648 | 2.40 |
| 15 | 2.1141 | 22.1536 | 39.2605 | 17.0618 | 2.9880 | 3.1461 | 3.1179 | −0.86 | 3.1140 | −1.04 |
| 16 | 2.9421 | 11.0231 | 38.5657 | 16.9106 | 1.6429 | 2.9996 | 2.9522 | −1.55 | 2.9478 | −1.73 |
| 17 | 1.6315 | 33.4346 | 39.2911 | 17.1374 | 3.0121 | 3.2858 | 3.2647 | −0.61 | 3.2623 | −0.75 |
| 18 | 1.7386 | 33.6506 | 40.3083 | 17.9739 | 3.1610 | 3.1998 | 3.2374 | 1.21 | 3.2359 | 1.10 |
| 19 | 1.9735 | 22.1344 | 25.8748 | 11.4882 | 3.1717 | 3.0801 | 3.0998 | 0.66 | 3.1021 | 0.70 |
| 20 | 2.0784 | 22.2411 | 26.4243 | 11.9754 | 2.6829 | 3.1692 | 3.1006 | −2.15 | 3.1043 | −2.06 |
| 21 | 2.1794 | 22.2293 | 40.1104 | 17.2650 | 2.6044 | 3.1769 | 3.1237 | −1.64 | 3.1186 | −1.85 |
| 22 | 1.6867 | 45.7926 | 85.8960 | 42.8523 | 2.2933 | 3.4686 | 3.4718 | 0.18 | 3.4893 | 0.54 |
| 23 | 1.6854 | 11.0853 | 40.0083 | 17.1862 | 2.5119 | 3.1575 | 3.2017 | 1.44 | 3.2047 | 1.48 |
| 24 | 1.6597 | 11.0787 | 39.8197 | 17.1236 | 2.7595 | 3.1629 | 3.1955 | 1.07 | 3.1984 | 1.11 |
| 25 | 1.7172 | 11.1257 | 40.6188 | 17.4085 | 3.1046 | 3.0485 | 3.1692 | 4.00 | 3.1702 | 3.98 |
| 26 | 1.6497 | 11.1065 | 40.0747 | 17.2220 | 2.5195 | 3.1862 | 3.2097 | 0.78 | 3.2131 | 0.83 |
| 27 | 1.6824 | 11.1154 | 40.3005 | 17.2993 | 3.1033 | 3.1980 | 3.1762 | −0.64 | 3.1777 | −0.64 |
| 28 | 1.6130 | 11.1086 | 39.9162 | 17.2076 | 2.8364 | 3.2413 | 3.2030 | −1.14 | 3.2064 | −1.09 |
| 29 | 1.5786 | 11.1108 | 39.8302 | 17.2032 | 2.7446 | 3.2630 | 3.2148 | −1.44 | 3.2189 | −1.36 |
| 30 | 1.6066 | 11.1176 | 39.9594 | 17.2474 | 3.2148 | 3.2607 | 3.1872 | −2.22 | 3.1899 | −2.18 |
| Model | Q2LOO | RMSE | Q2F1 | Q2F2 | Q2F3 |
|---|---|---|---|---|---|
| 1 | 0.8674 | 0.0555 | 0.983 | 0.983 | 0.889 |
| 2 | 0.8723 | 0.0557 | 0.983 | 0.982 | 0.886 |
| Compound | EHOMO (eV) | ELUMO (eV) | △E (eV) |
|---|---|---|---|
| 1 | −4.6690 | −0.1545 | 4.5145 |
| 2 | −4.7185 | −0.2672 | 4.4513 |
| 3 | −4.4956 | −0.1131 | 4.3826 |
| 4 | −4.5163 | −0.2292 | 4.2871 |
| 5 | −4.5194 | −0.1205 | 4.3989 |
| 6 | −4.2683 | −0.1487 | 4.1196 |
| 7 | −4.6543 | −0.7434 | 3.9109 |
| 8 | −4.5852 | −0.6348 | 3.9504 |
| 9 | −4.6105 | −0.6260 | 3.9845 |
| 10 | −4.5795 | −0.6422 | 3.9372 |
| 11 | −4.2939 | −0.5011 | 3.7927 |
| 12 | −4.4267 | −0.3731 | 4.0535 |
| 13 | −4.7269 | −1.0246 | 3.7023 |
| 14 | −4.6105 | −1.0300 | 3.5806 |
| 15 | −4.5967 | −1.0378 | 3.5588 |
| 16 | −4.6897 | −0.9724 | 3.7173 |
| 17 | −4.5853 | −0.8846 | 3.7007 |
| 18 | −4.3167 | −0.8064 | 3.5103 |
| 19 | −4.2479 | −0.7582 | 3.4896 |
| 20 | −4.0158 | −0.6519 | 3.3639 |
| 21 | −4.5637 | −1.0154 | 3.5483 |
| 22 | −4.4459 | −1.0850 | 3.3609 |
| 23 | −4.5799 | −1.8055 | 2.7744 |
| 24 | −4.5878 | −1.6386 | 2.9492 |
| 25 | −4.4673 | −1.8783 | 2.5890 |
| 26 | −4.6075 | −1.4051 | 3.2023 |
| 27 | −4.4912 | −1.8784 | 2.6128 |
| 28 | −4.4272 | −0.9747 | 3.4524 |
| 29 | −4.3505 | −1.1136 | 3.2369 |
| 30 | −4.2340 | −1.1280 | 3.1059 |
| Compound | X2 | X3 | X4 | X5 | X6 | lgAP1 | lgAP2 |
|---|---|---|---|---|---|---|---|
| 31 | 1.5444 | 33.3964 | 38.9782 | 17.2138 | 2.2545 | 3.3194 | 3.3188 |
Disclaimer/Publisher’s Note: The statements, opinions and data contained in all publications are solely those of the individual author(s) and contributor(s) and not of MDPI and/or the editor(s). MDPI and/or the editor(s) disclaim responsibility for any injury to people or property resulting from any ideas, methods, instructions or products referred to in the content. |
© 2023 by the authors. Licensee MDPI, Basel, Switzerland. This article is an open access article distributed under the terms and conditions of the Creative Commons Attribution (CC BY) license (https://creativecommons.org/licenses/by/4.0/).
Share and Cite
Liu, J.; Zhang, Y.; Yi, C.; Zhang, R.; Yang, S.; Liu, T.; Jia, D.; Yang, Q.; Peng, S. Evaluation of Antioxidant Properties and Molecular Design of Lubricant Antioxidants Based on QSPR Model. Lubricants 2024, 12, 3. https://doi.org/10.3390/lubricants12010003
Liu J, Zhang Y, Yi C, Zhang R, Yang S, Liu T, Jia D, Yang Q, Peng S. Evaluation of Antioxidant Properties and Molecular Design of Lubricant Antioxidants Based on QSPR Model. Lubricants. 2024; 12(1):3. https://doi.org/10.3390/lubricants12010003
Chicago/Turabian StyleLiu, Jianfang, Yaoyun Zhang, Chenglingzi Yi, Rongrong Zhang, Sicheng Yang, Ting Liu, Dan Jia, Qing Yang, and Shuai Peng. 2024. "Evaluation of Antioxidant Properties and Molecular Design of Lubricant Antioxidants Based on QSPR Model" Lubricants 12, no. 1: 3. https://doi.org/10.3390/lubricants12010003
APA StyleLiu, J., Zhang, Y., Yi, C., Zhang, R., Yang, S., Liu, T., Jia, D., Yang, Q., & Peng, S. (2024). Evaluation of Antioxidant Properties and Molecular Design of Lubricant Antioxidants Based on QSPR Model. Lubricants, 12(1), 3. https://doi.org/10.3390/lubricants12010003