Abstract
An accurate power loss prediction in the gearbox is desirable for improving vehicle efficiency. To achieve this objective, evaluating the power loss is necessary. However, power loss is influenced by factors such as the gearbox structure, operating conditions, and gear oil formulation, making power loss evaluation a bottleneck in practice. Therefore, a systematic modeling methodology was developed to evaluate the gearbox power loss in an E-Axle that focuses on the influence of the gear oil factors in the load and no-load cases. The gearbox used in a light-duty truck E-Axle was tested to verify the proposed model. The test was performed under various operating speeds, input loads, and oil temperatures, and four types of gear oil with different formulations were also included to quantify their influence on the power loss. The results showed that the gearbox power loss was significantly influenced by the E-Axle operating conditions, oil temperatures, and different gear oil formulations, promoting different power losses. The comparison results showed good consistency between the predicted power loss and the measured data. The proposed methodology can be utilized to effectively predict the power loss of the E-Axle gearbox and further improve the E-Axle efficiency by selecting suitable oil formulations and adjusting oil temperatures.
1. Introduction
The integrated electric axle (E-Axle) is one of the fastest-developing electric vehicle drive systems due to its promising potential for compactness and efficiency [1]. The electric motor rotates at a very high speed, typically 12,000 revolutions per minute (rpm), while the wheel rotates at a lower speed, typically 300 rpm. Thus, a reduction gearbox is always inserted between the electric motor and the wheel. The gearbox used in the E-Axle usually consists of three stages, with a cylindrical helical gear for each of the first two stages and a planetary gear for the output stage [2].
Due to the continuously increasing concern for sustainability, powertrain efficiency has become a major concern. As part of this concern, power losses from the gearbox are one of the major issues of E-Axle engineers. Power losses in the gearbox can be classified into two major groups: (i) the load-dependent power losses associated with the friction at the gear teeth and the bearing contacts, which increase with the torque transmitted by the gearbox; and (ii) the no-load (or load-independent) power losses such as from the gears and bearings churning and the friction generated from seals [3]. Power loss reduction directly influences efficiency improvement and lubricant life extension, i.e., lower energy dissipation and oil operating temperature. For load-dependent power losses, they are mainly affected by the gear tooth geometry and are difficult to reduce under the constraints of reliability and NVH. On the other hand, the load-dependent power losses are mainly affected by the gear oil formulation and the oil sump temperature and seem easier to modify [4].
In previous works [5,6], experimental investigations of the gear design, bearing lectotype and preload, and gear oil formulation led to a power loss optimization. At the same time, the gearbox test bench was upgraded to allow for more accurate power losses and load-independent power loss measurements, which led to a favorable research foundation for power loss investigations. However, it is impossible to make correct choices in the design step using experimental investigation, which will waste time and research funds. In recent decades, theoretical studies have been used to predict gearbox power losses quickly. For example, through experiments, Anderson et al. [7] used spur gears to study the influence of gear size and lubricant property on the total mesh power loss, and simple algebraic expressions were used to fit the power loss expression. By summarizing many experimental works, BS ISO/TR 14179 [8,9] presents calculation formulas for the power losses, which can be modified by considering the influences of geometrical parameters of the gear system, oil formulation, oil temperature, etc. By considering the flow regimes of oil, Changenet et al. [10] compared several established equations for gear power losses and proposed principles that the effectiveness of equations depended on the Reynolds number, and they found that the tooth profile has a significant effect on the load-dependent power loss, while it rarely has a relatively weak effect on the load-independent power losses. Recently, Neurouth et al. [11] used axial flanges in the gearbox to study the influence of the flange diameter on churning power losses. As a result, a useful method was proposed to determine the optimal position of the flanges. Besides fitting equations, investigations have also been conducted on the Computational Fluid Dynamics (CFD) method, which provides a new direction for load-independent power loss calculation [12,13]. A comprehensive review of the gearbox power loss evaluation can be found in [14,15] and the references therein.
The numerous abovementioned works aimed to reveal the energy dissipation mechanism of a gearbox in terms of load-dependent and load-independent power losses, both in terms of gears and bearings. Experimental investigations were performed, allowing the calibration of each influence factor, and then a fitting equation was developed. As a result, models for evaluating power loss sources like gears, bearings, and seals already exist. With suitable models to evaluate the power loss of the E-Axle gearbox, optimizing the design scheme with a virtual prototype model is possible. Still, to our knowledge, an appropriate model for a power loss evaluation of the E-Axle gearbox is missing. As the input speed of the E-Axle is typically up to 12,000–18,000 rpm and will lead to higher churning power loss, it is imperative to investigate the influencing factors (i.e., oil formulation, oil temperature) concerning gearbox churning power losses. Therefore, this paper aims to evaluate the power loss in an E-Axle gearbox by using a previously established sub-model and to reveal the gear oil influences on the E-Axle gearbox.
The rest of the paper is structured as follows. Section 2 shows the power loss evaluation model selected from the existing numerical model that considers the influence of the gear oil factor. Section 3 describes the E-Axle gearbox used for the experiment and the test procedure for the load and no-load losses. In Section 4, the calculation and test results are provided and compared, and some useful power loss reduction directions are disseminated. Finally, Section 5 presents this paper’s conclusions and future research areas.
2. Power Loss Calculation Model
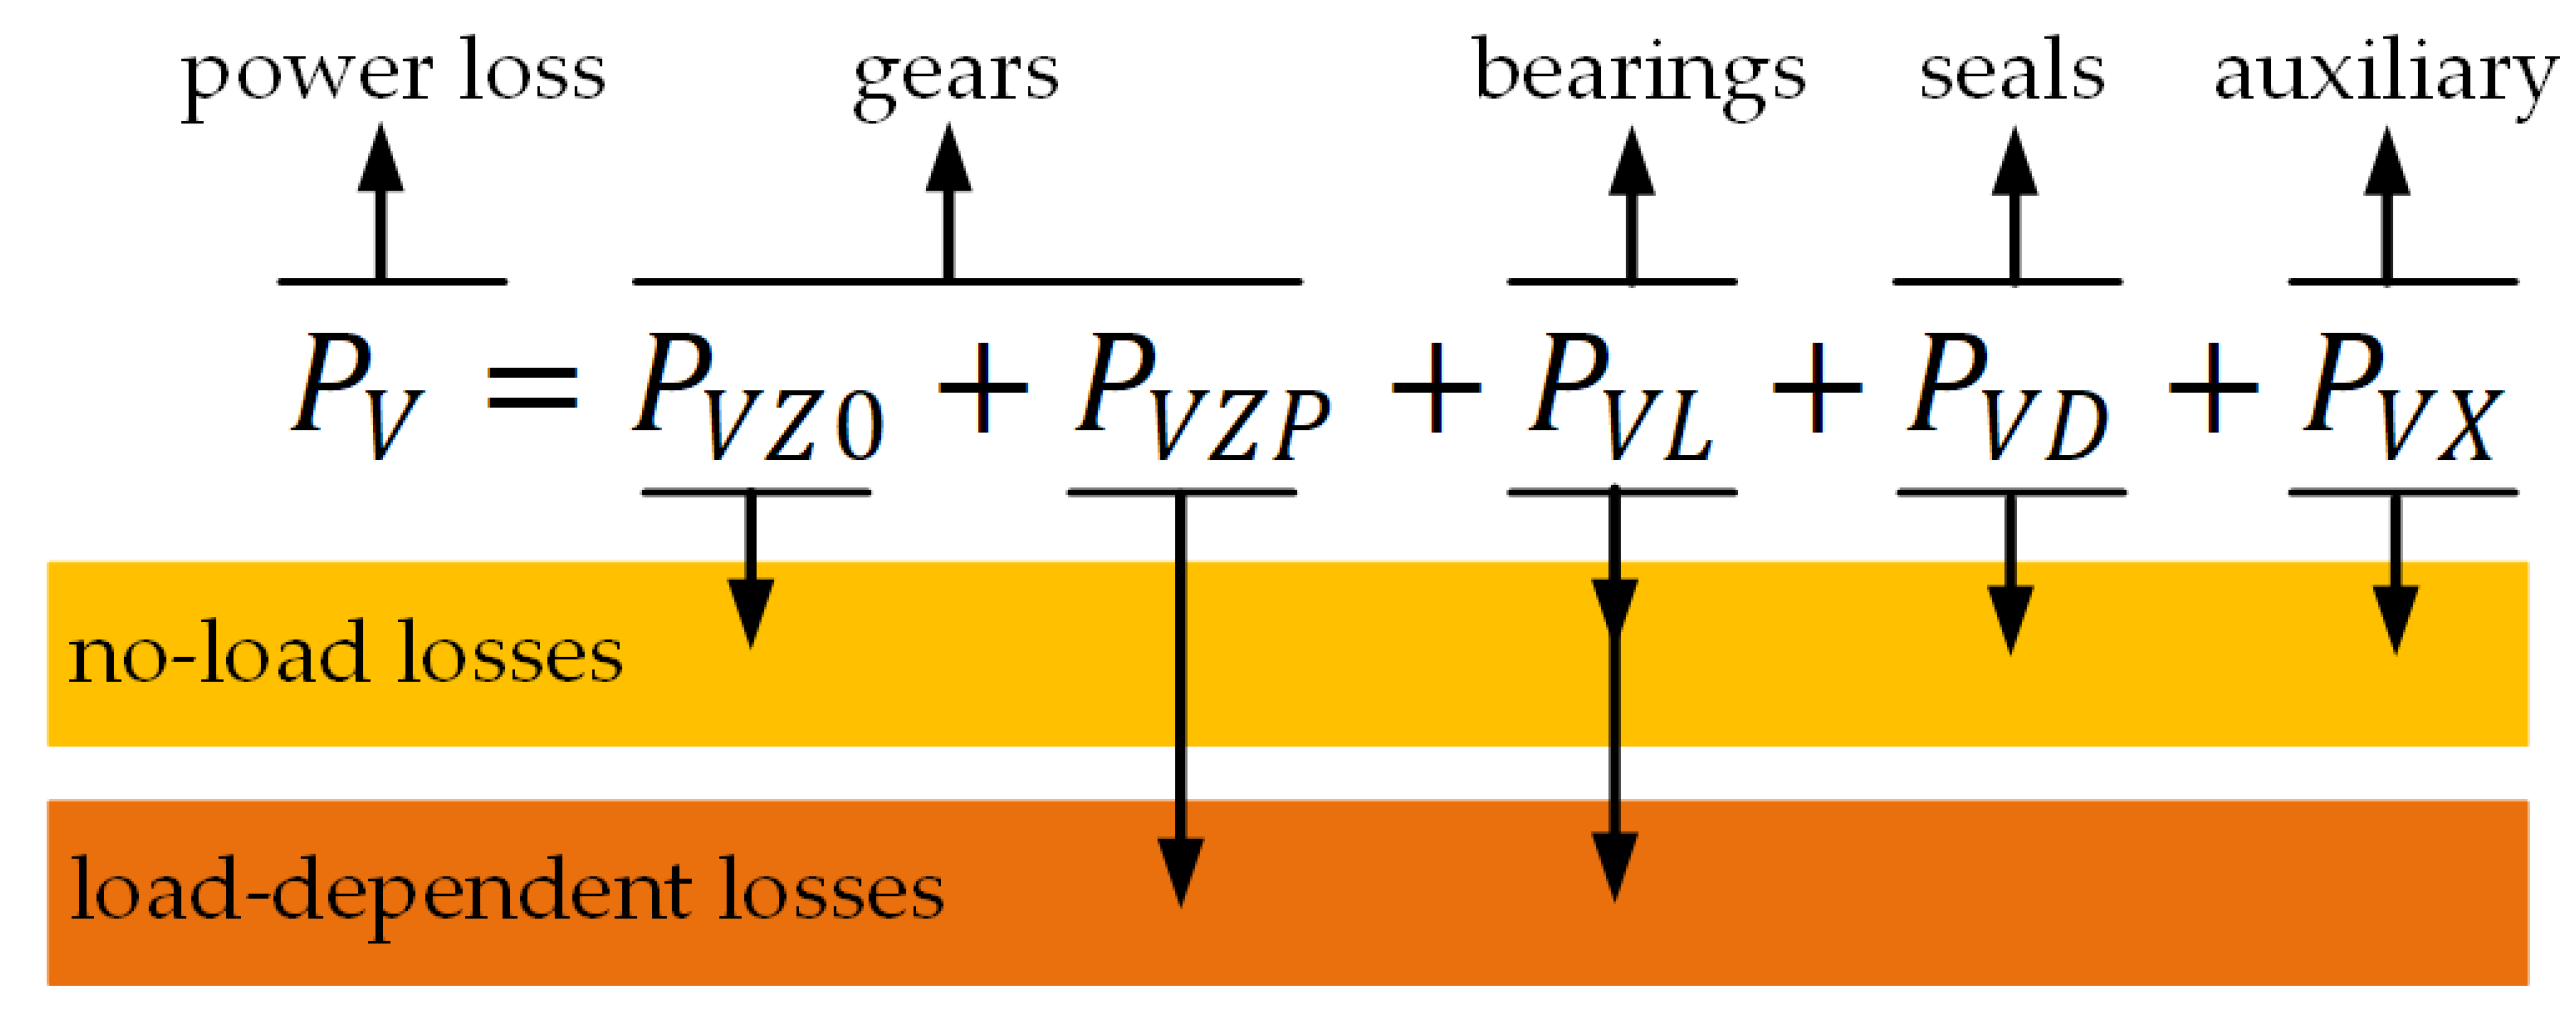
As described by Höhn et al. [16], as well as several other researchers [17,18,19,20], the total power loss in a gearbox is the sum of gear ( and ), bearing (), seal (), and auxiliary () losses, as presented in Figure 1.
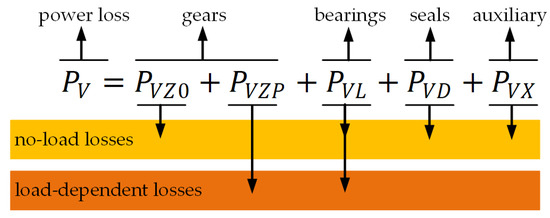
Figure 1.
Power loss contributions in a gearbox.
Following this evaluation framework, each of the power loss components was calculated with its appropriate empirical model. The gearbox power loss was then summed up using the equation in Figure 1. It is noted that the power loss model given here does not guarantee the most accuracy. In order to have a good evaluation of the power loss in the gearbox, dedicated tests and consummation are necessary.
2.1. Gear Power Loss Model
The gear power loss mainly consists of meshing, churning, and windage. The meshing power losses depend on the friction coefficient, which can be calculated by averaging several points along the tooth contact line. Churning and windage power losses are principally hydraulic and load-independent.
2.1.1. Gear Meshing Power Losses
The meshing gear power loss is calculated by using the Ohlendorf Equation (1) [21], which has been calibrated with many cases [22,23].
where represents gear mesh input power, represents the defined gear loss factor, and represents the average coefficient of friction.
The gear loss factor is given in Equation (2), which is effective for helical gears with profile shift.
where represents the gear transverse pitch (mm), represents the gear face width (mm), and are the gear normal force and sliding velocity in each meshing position along the contact path, respectively (N/mm, m/s), and and are the gear tangential force and gear tangential velocities on the base plane, respectively (N, m/s).
The average coefficient of friction is determined by using Equation (3).
where is the sum of the gear surface velocities on the pitch point (m/s), is the effective contact radius on the pitch point (mm), represents the dynamic viscosity, is the arithmetic average roughness of pinion and gear (um), and is the lubricant factor, which can be determined with experimental results for each oil formulation [19].
Please note that Equation (3) was derived from experimental tests with pure mineral gear oil with no additive packages. Thus, the lubricant factor must be adjusted when different gear oil formulations are used when accounting for the influence of base oils and additives. By doing this, the difference between the calculated and experimental values can be minimized.
Typical values of for pure mineral (MINR) and poly-alpha-olefin (PAOR) gear oil are 0.846 and 0.666, respectively. Table 1 shows the lubricant factor for all of the tested gear oils.

Table 1.
Lubricant factor for the tested gear oils.
2.1.2. Gear Churning Power Losses
The power losses produced by gear churning are calculated by using the Changenet method [24], which has also been calibrated in many cases [25,26]. The churning torque is formulated as
where represents the density of the oil (kg/), represents the rotation speed of the shaft (rad/s), represents the gear pitch radius (m), represents the immersion area of the pinion (), and represents the non-dimensional torque.
The non-dimensional torque can be written as
where is the Reynolds number, is the Froude number, represents the immersion depth of the pinion (m), and and represent the volume displaced by submerged gears and the oil in the sump (), respectively.
Take note that it is difficult to form a general and simple formulation to evaluate the churning power losses in real applications due to the housing design choice of gearboxes, of which there are an almost infinite combination.
2.1.3. Gear Windage Power Losses
The windage power loss is calculated by using Equation (6), which was also proposed by Ohlendorf [22].
where is the rotation speed of the gear and represents the absolute viscosity of the oil/air mixture.
2.2. Bearing Power Loss Model
The support bearings can also create a significant power loss for the gearbox. Here, the SKF model [27], considering the sum of four different power loss sources, is given below.
where and are the rolling and sliding torques, respectively, which can be represented by Equations (8) and (9),
where and are the sliding torque factor and rolling torque factor, respectively, which are defined by the bearing type, diameter, and the applied load; and is the sliding coefficient of friction.
Equation (10) defines the inlet friction torque weighting factor, and Equation (11) defines the kinematic starvation/replenishment reduction factor for the rolling element raceway contact.
For the drag losses , Equation (12) shows the ball bearing drag loss, and Equation (13) shows the roller bearings.
As the bearings have seals, the seal torque loss should be considered. Equation (14) shows the seal losses:
All the relevant constants are dependent on the geometry of the rolling bearing. Please see the SKF bearing manual for the detailed selection principles.
2.3. Seal Power Loss Model
Seal power loss comes from the friction in the contact area between the sealing lip and the rotating shaft. The contact area is very small, and it is difficult to parametrize its microscopic behavior. Although many researchers have paid much attention to it, the seal power losses are not well understood till now.
A general consensus is that the seal power losses are a function of rotational speed and seal diameter. After a large number of experimental measurements [28], Freudenberg Simrit culminated a Formula (15) to calculate seal power losses. Please note that the formula still does not consider the influence of the gear oil factors.
where is the shaft seal diameter (mm) and represents the rotational speed (rpm).
2.4. Auxiliary Losses
As for the other energy dissipation sources that are not incurred from gears, bearings, and seals, such as the differential carrier, all are accounted for as auxiliary losses.
3. Gearbox Efficiency Test
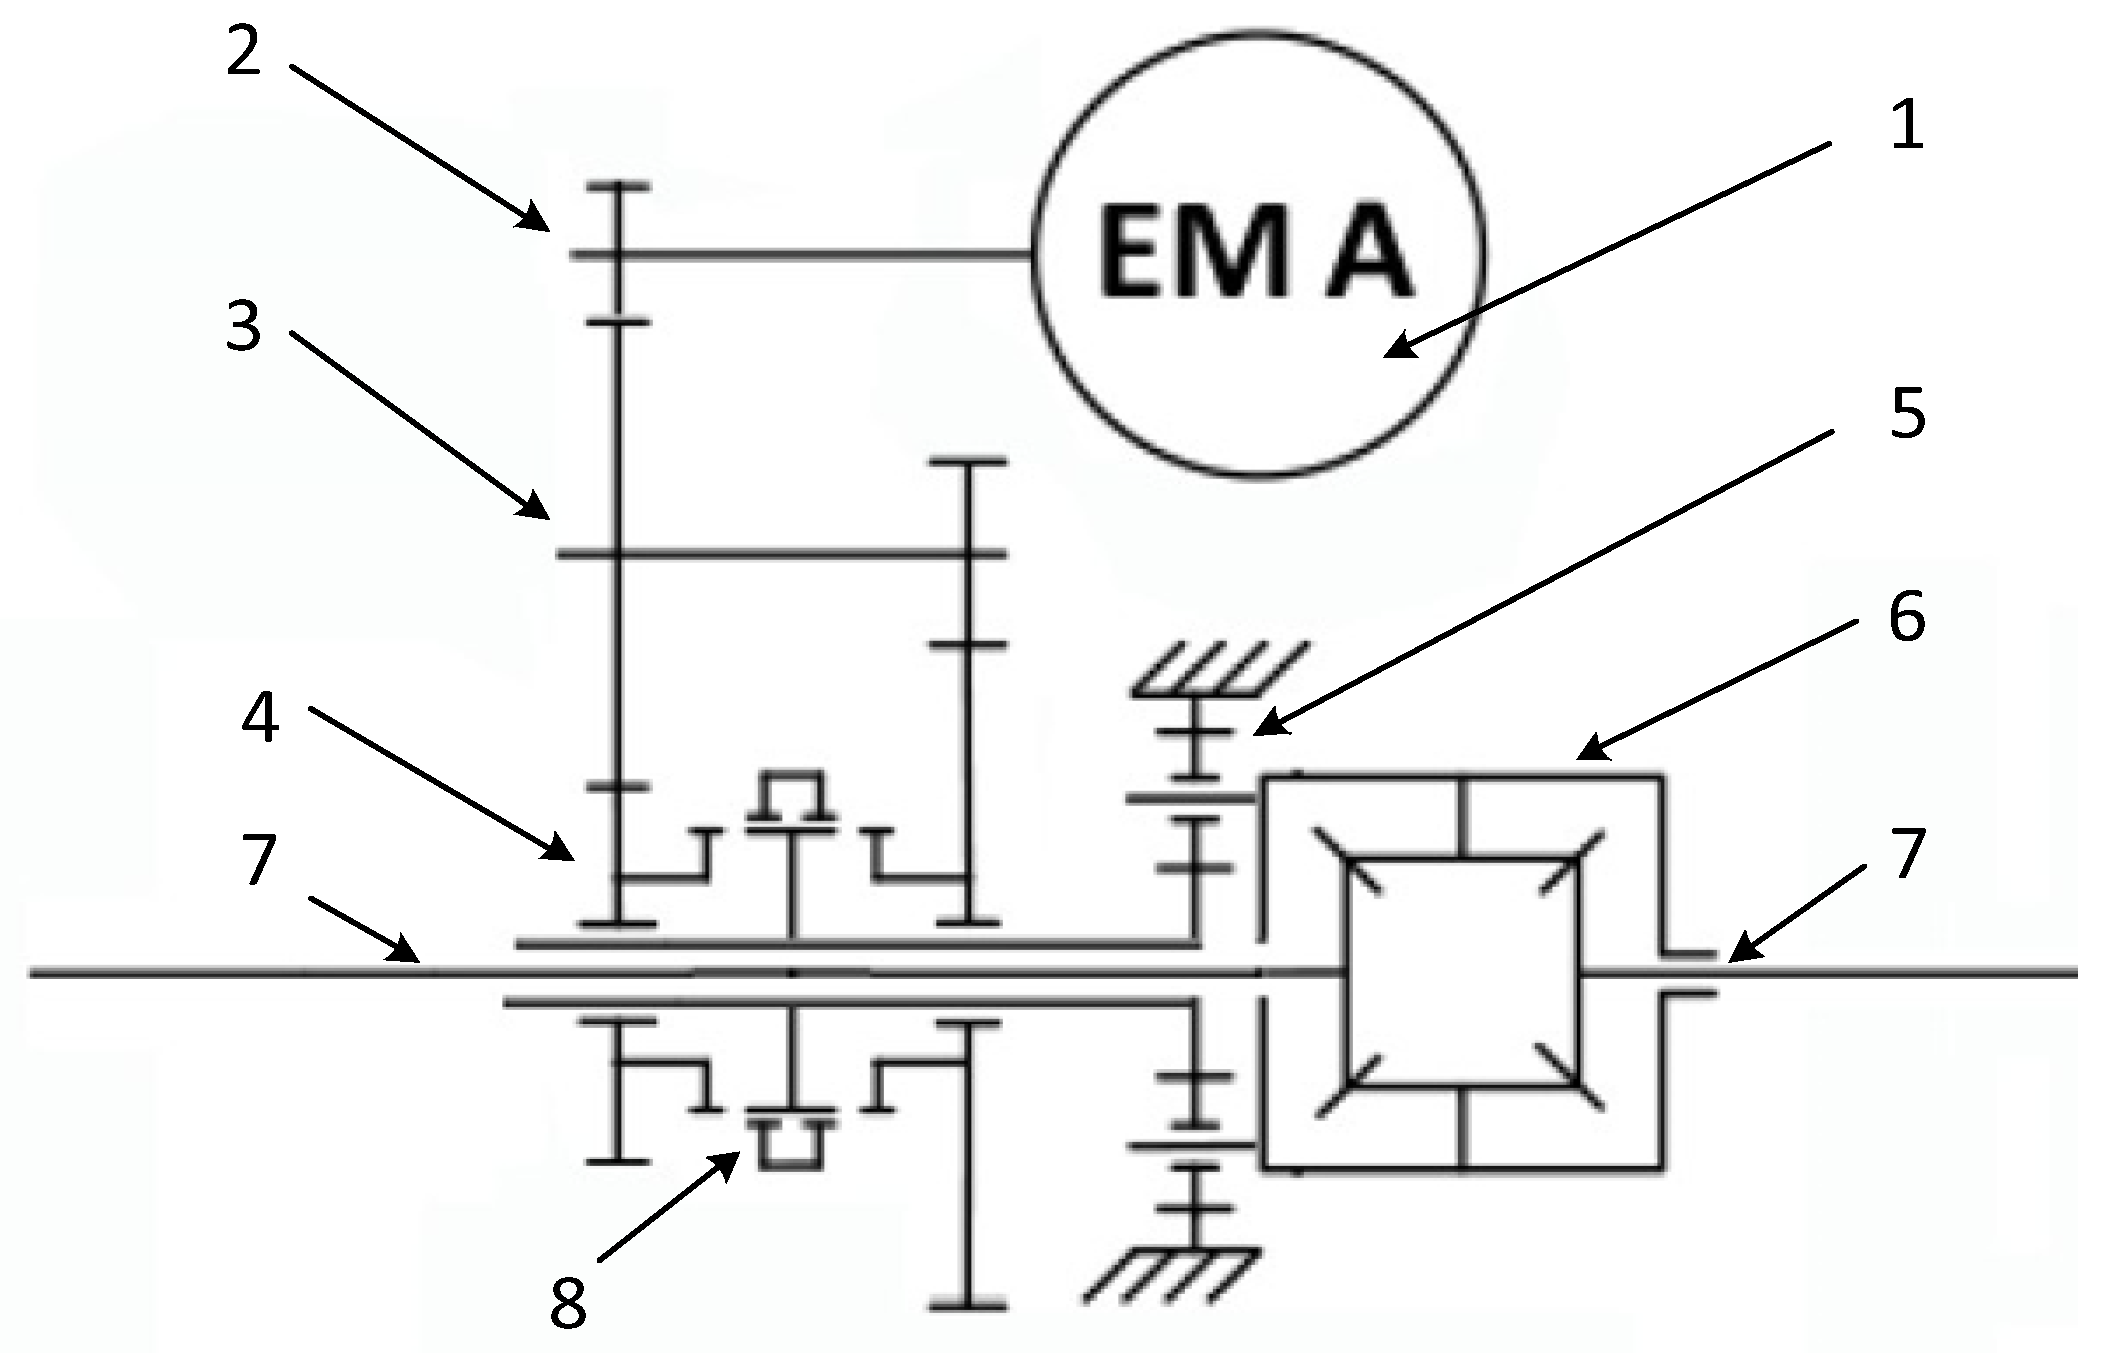
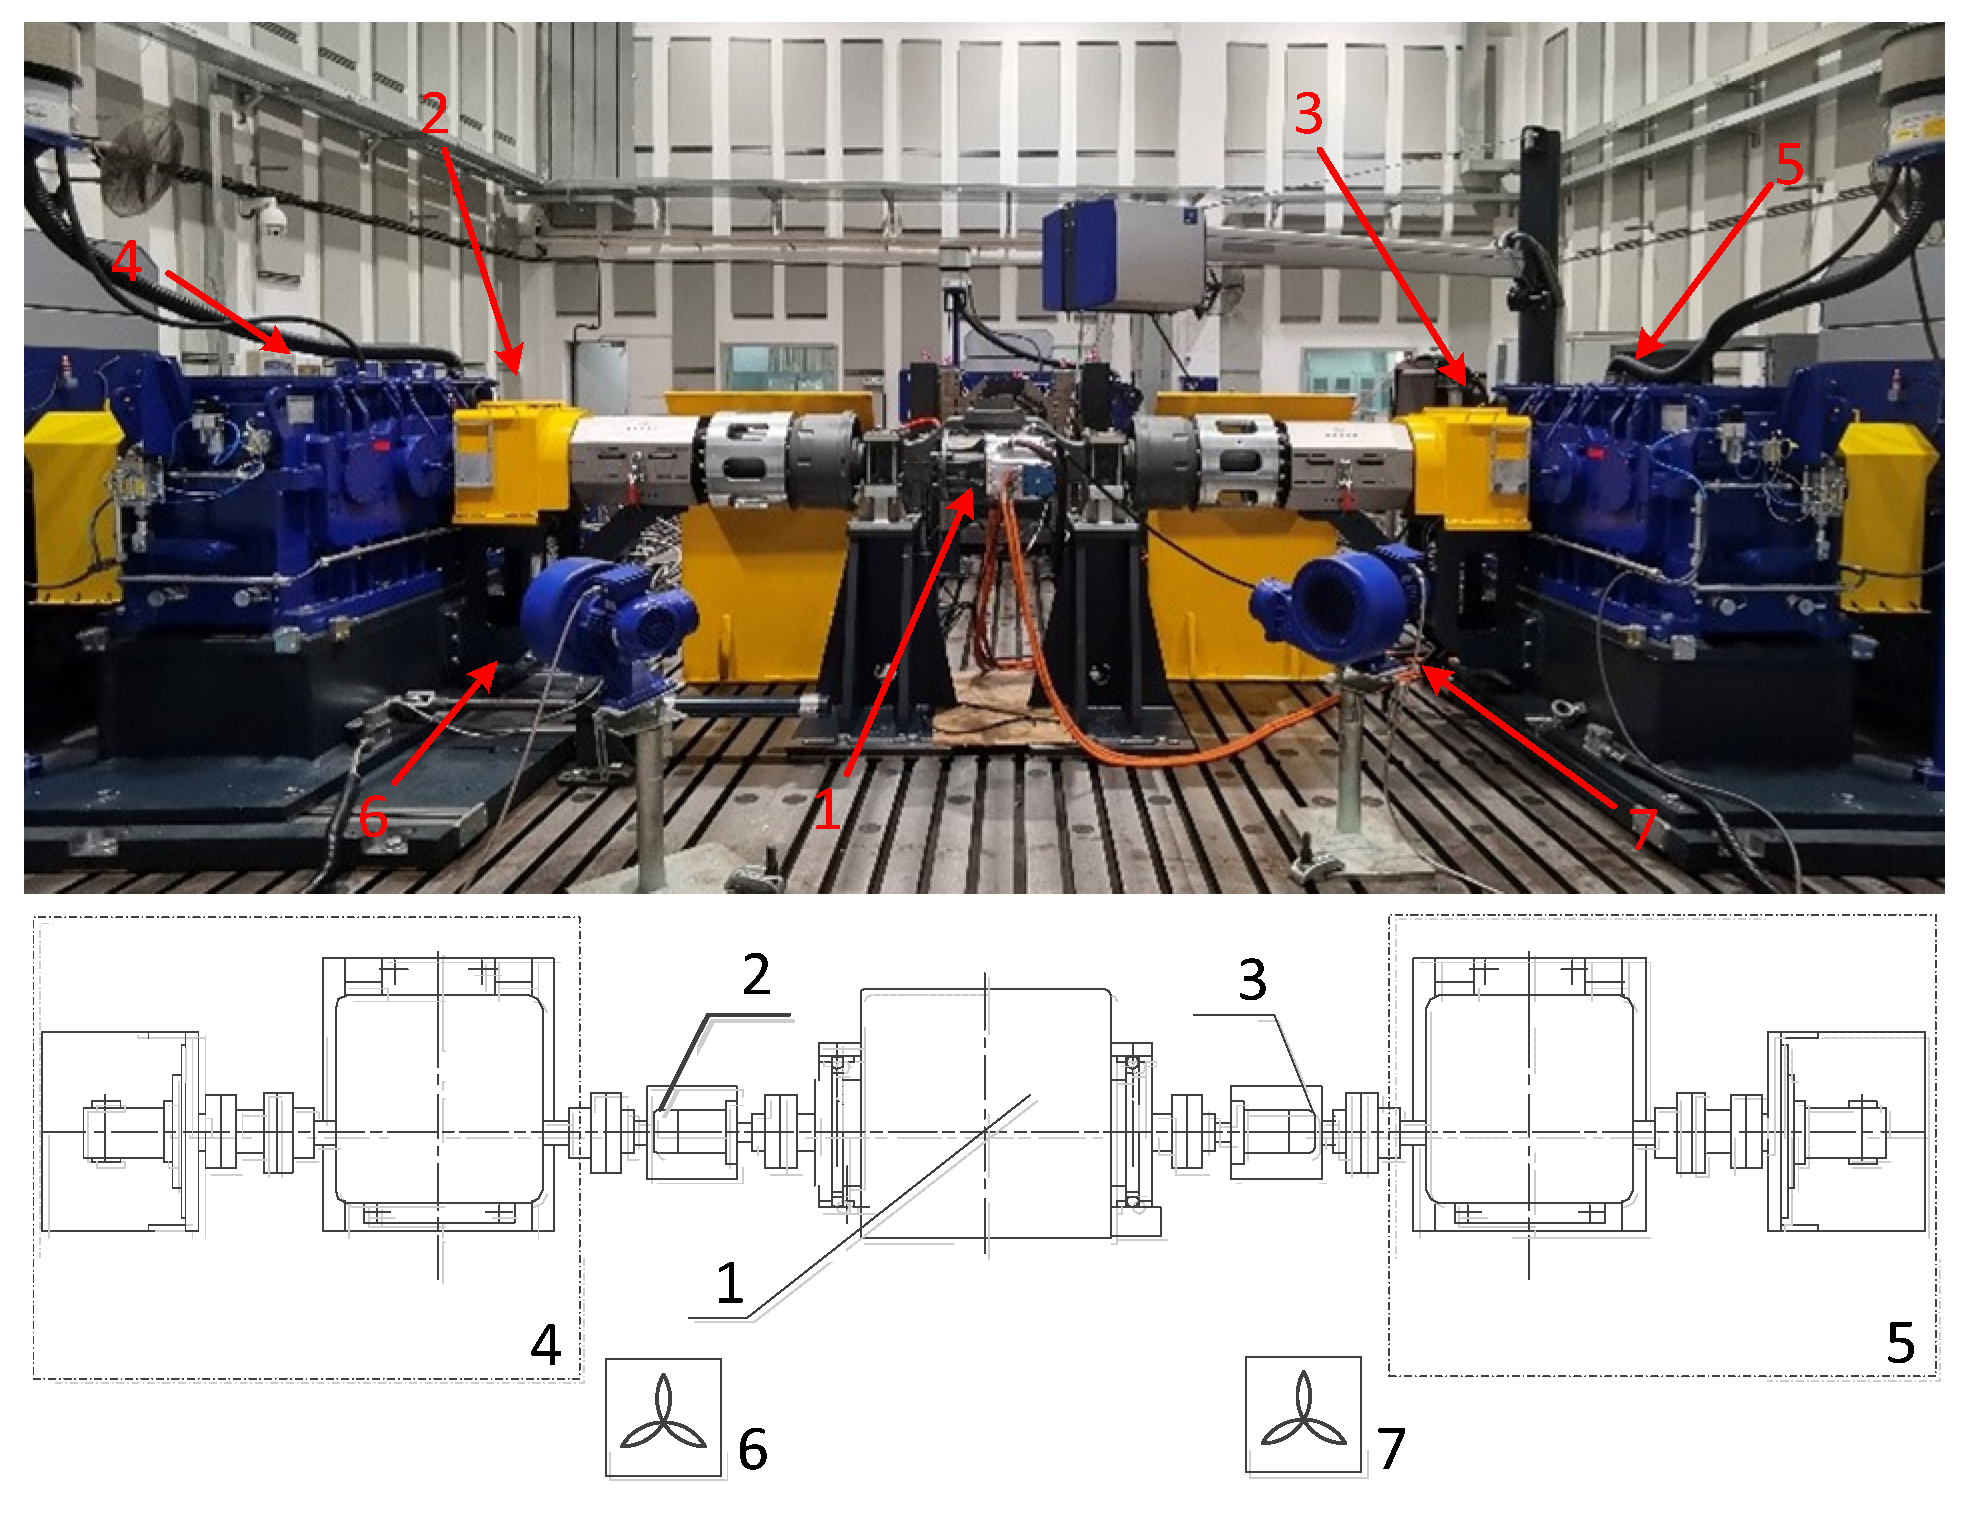
A typical E-Axle gearbox was used to illustrate the power loss evaluation process and the influence of the gear oil factors on its power losses. The E-Axle gearbox (shown in Figure 2) has two parallel helical gear pair stages and a final planetary stage with a differential mechanism [2]. It is newly developed for electric trucks. The input torque and speed on the parallel helical gear pair are made in the sun shaft, and the output is through the planetary carrier. That is to say, a fixed ring configuration is utilized. Figure 3 shows the test bench that was used in this paper. The test bench contained an electric motor as a power unit and bilateral symmetrical loads, including gearboxes and load motors.
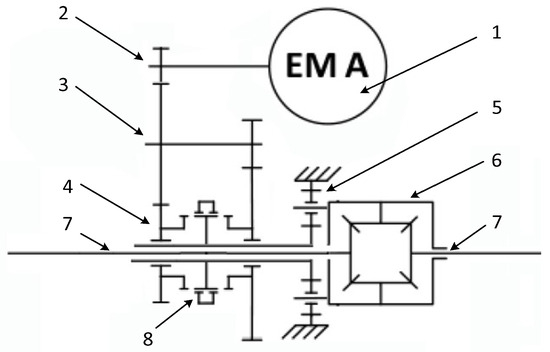
Figure 2.
Sketch diagram of the E-Axle. 1—electric motor; 2—first shaft; 3—second shaft; 4—third shaft; 5—planetary; 6—differential; 7—output shafts; 8—shift mechanism.
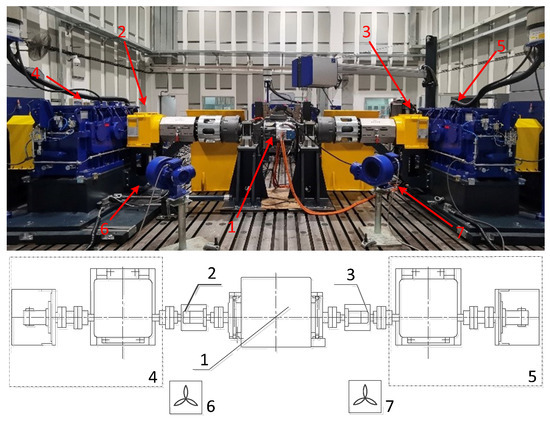
Figure 3.
Durability and performance test bench of the E-Axle. 1—E-Axle; 2,3—torque and speed sensors; 4,5—loading motor and gearbox; 6,7—cooling fan.
3.1. Overview of the Gearbox and Gear Oil
The selected E-Axle gearbox was designed for light commercial vehicles with a two-speed reducer system (i = 25.3/11.8), a maximum input speed of 12,000 rpm, and a maximum input torque of 350 Nm. The properties of the gear and the support bearing are reported in Table 2 and Table 3, respectively.

Table 2.
Gear properties of the E-Axle gearbox.

Table 3.
Bearing properties in the E-Axle gearbox.
The E-Axle gearbox was tested with four different gear oils. Due to practical purposes, it is interesting to cover a good range of possible products, mainly in terms of viscosity grade. All the selected gear oils have the same base oil PAOR and were expected to have the same traction coefficient under full film conditions [29]. Among the selected oils were an electric motor oil with a viscosity grade of 75W-80 (BEV 75W-80) and three types of traditional gear oil with different viscosity grades. These oils’ viscosity and other related properties are listed in Table 4.

Table 4.
Physical properties and chemical composition of the tested gear oils.
As shown in Table 4, 75W-90 has the highest kinematic viscosity, which means that this oil is the one that may have the largest churning power losses. Opposingly, 75W has the lowest kinematic viscosity, and BEV 75W-80 and 75W-80 show an intermediate kinematic viscosity.
As for chemical compositions, the main differences are in the sulfur and phosphorous values of BEV 75W-80 when compared to the other multi-grade oils. 75W-90 and 75W-80 are constituted by a significant amount of phosphorus and sulfur due to their traditional extreme pressure (EP) additive system, while BEV 75W-80 has dozens of times lower sulfur and phosphorous levels due to its specific design for copper corrosion.
3.2. Load Tests
To simulate actual operating conditions, the E-Axle gearbox was tested under a load spectrum derived from a field test. The load spectrum data were collected from a durability road test on a real city road in Jinan, China. Data from more than 6000 km over 30 days were used for load spectrum statistical analysis. Using this load spectrum data, the test conditions considered for the present study can be obtained by selecting the commonly used input speed, torque, and operation oil temperature, as shown in Table 5.

Table 5.
E-Axle gearbox conditions for power loss test.
3.3. No-Load Tests
To further understand the influence of the gear oil factors on the power loss behavior of the E-Axle gearbox, no-load tests were planned. The couplings between the speed and torque sensors (2,3) and the tested E-Axle were removed (Figure 2) so that no torque was transmitted through the tested E-Axle. The measurement in the electric motor (1, Figure 2) was then directly the no-load torque loss.
The E-Axle was then tested at 12 different speeds from 1000 rpm to 12,000 rpm. Considering the scarcity of the test bench, the no-load test was only conducted at 80 °C, which is the nominal operating temperature of the E-Axle. This test procedure was repeated for each speed step and allowed us to obtain the no-load power loss curves as a function of the input speed.
4. Results
In this section, the test results are presented to show the influence of the gear oil factors on power loss. A comparison analysis was also conducted to investigate the effectiveness of the power loss model in Section 2.
4.1. Power Loss Experimental Results
To understand the behavior of the E-Axle gearbox power losses, a batch of E-Axle tests was carried out under different input speeds, torques, and temperatures using four different gear oils.
4.1.1. Load Test Results
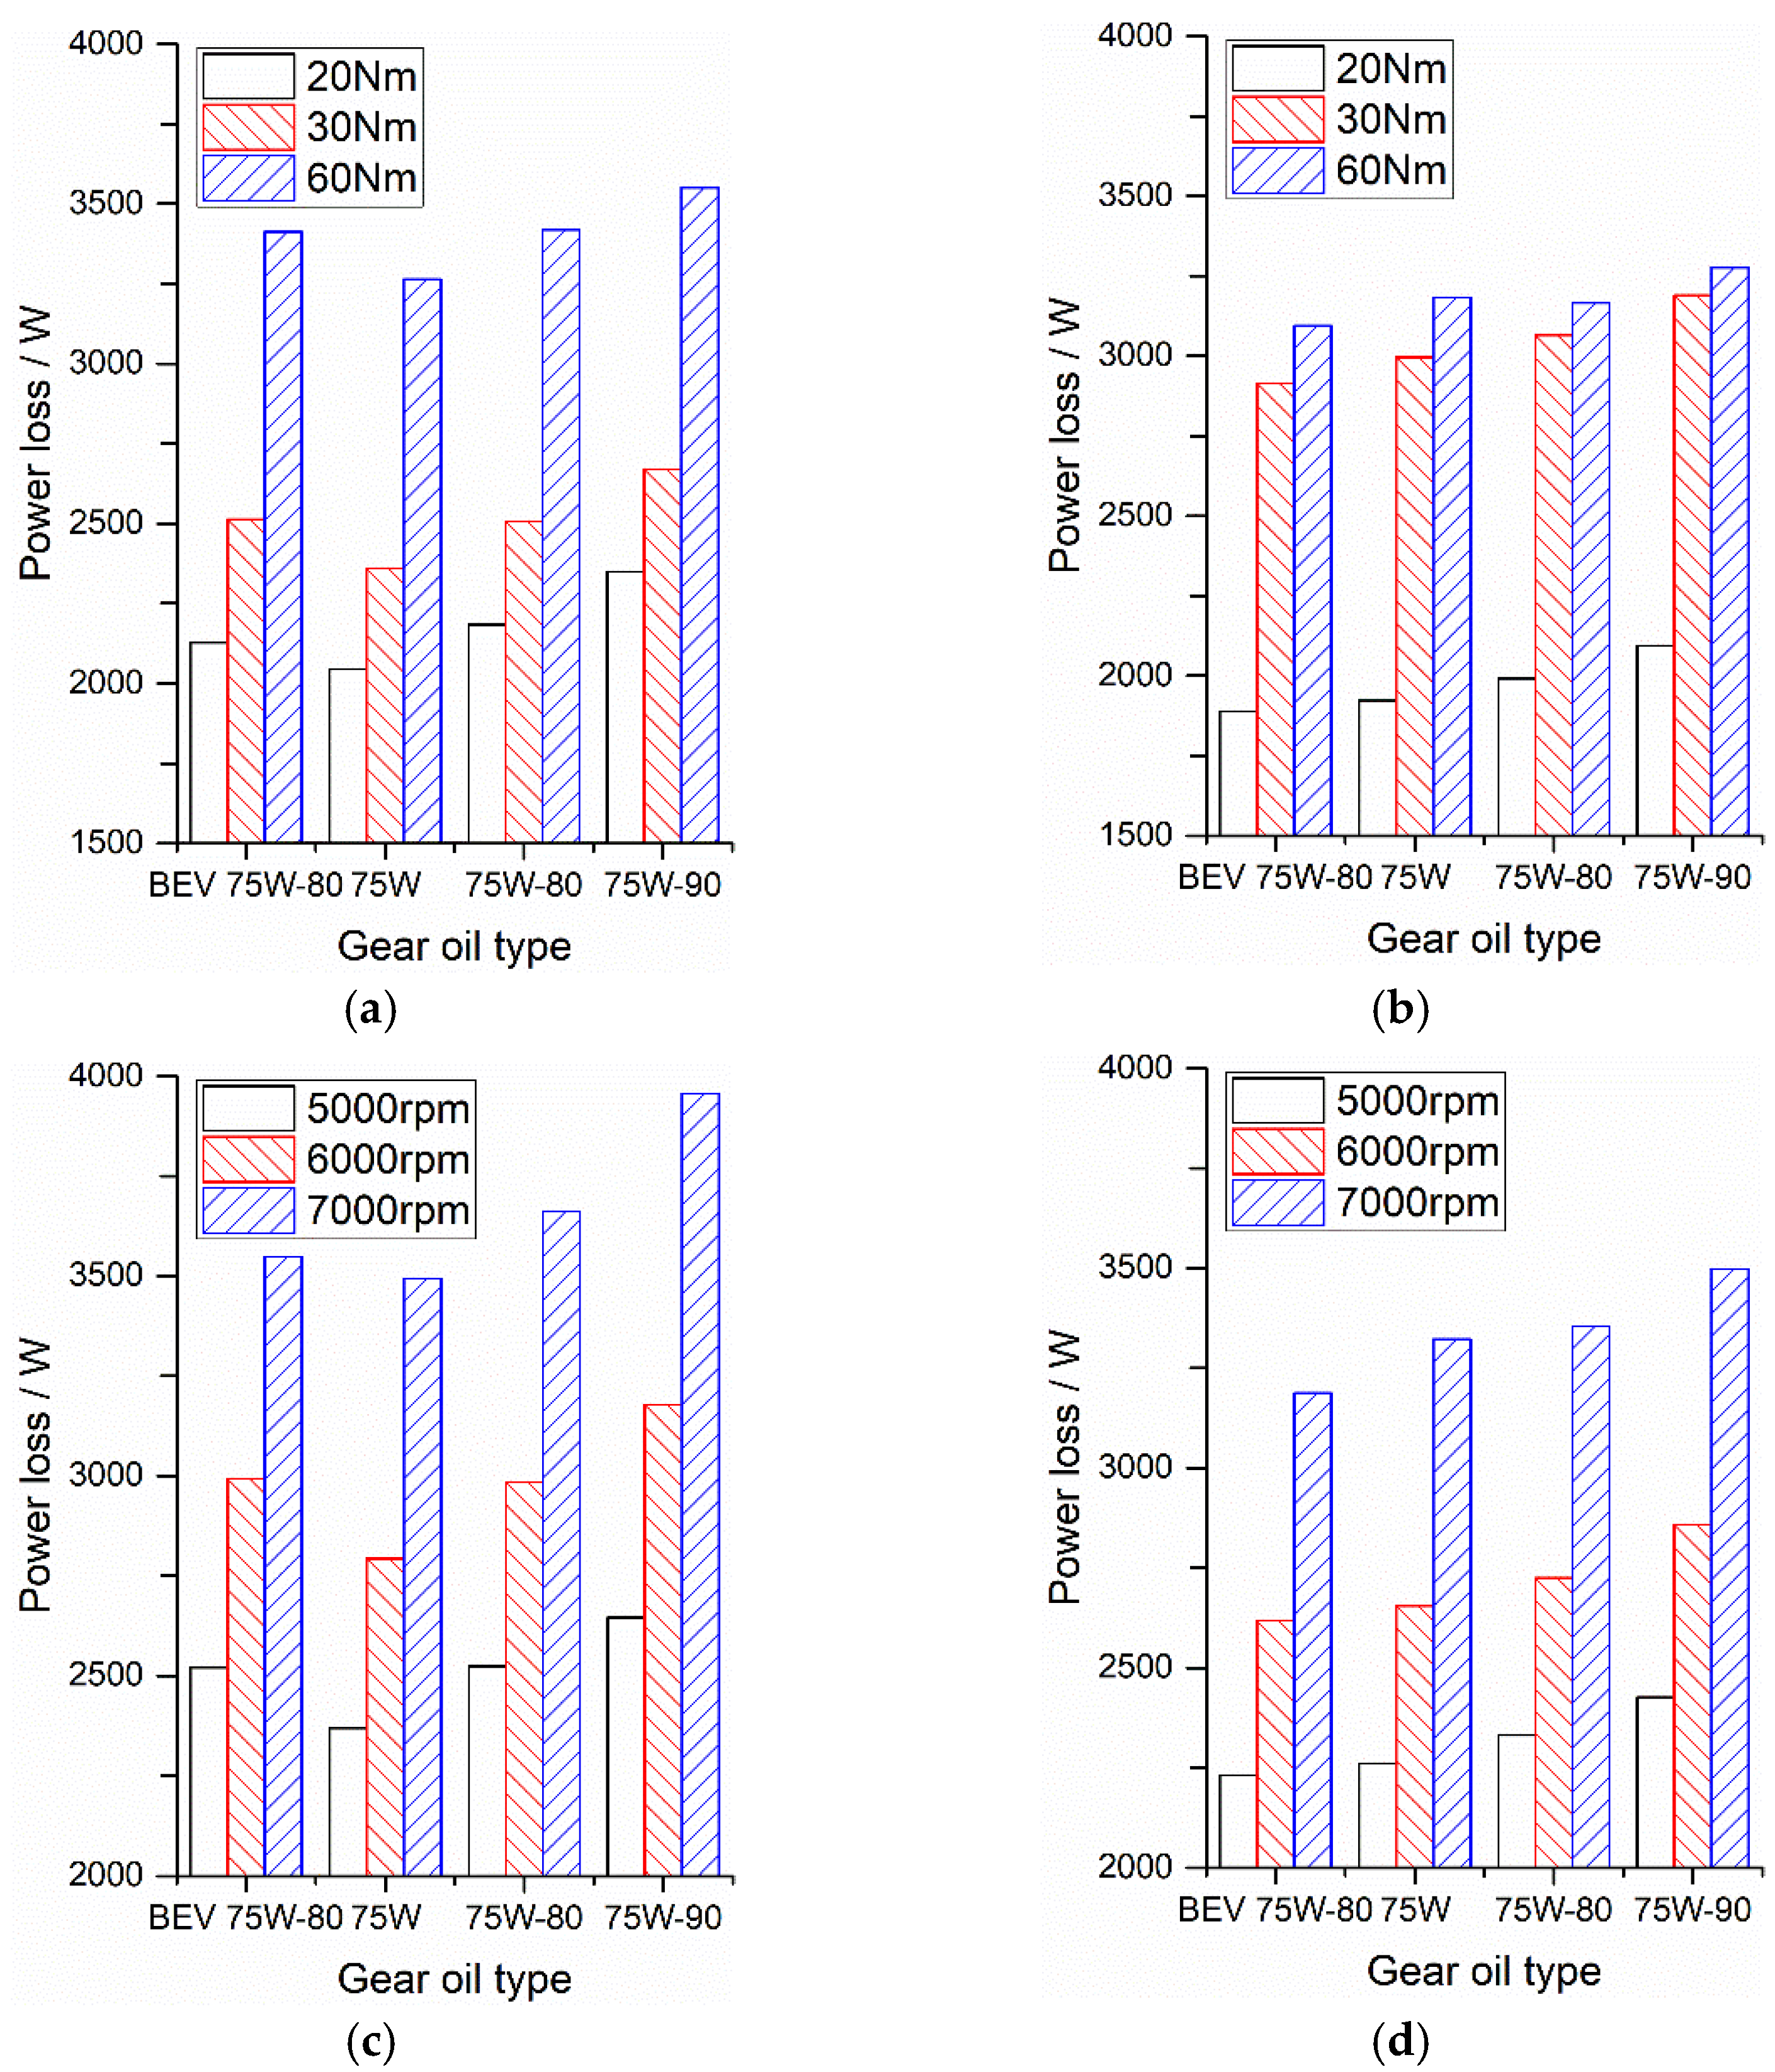
The power losses for the tested gear oils during the load test are shown in Figure 4. For all the operating conditions at nominal operating temperature (80 °C), the BEV 75W-80 gear oil showed the lowest power losses, which indicates that BEV 75W-80 oil should be the potential gear oil that leads to the best transmission efficiency.
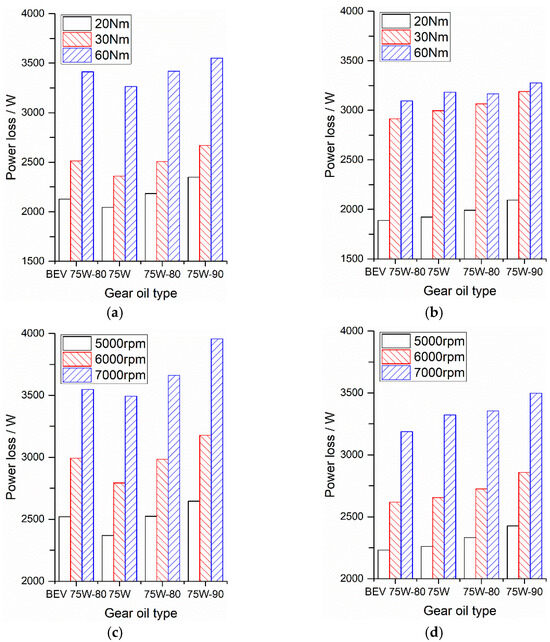
Figure 4.
Power losses for the tested oils. (a) 50 °C, average of speed cases; (b) 80 °C, average of speed cases; (c) 50 °C, average of torque cases; (d) 80 °C, average of torque cases.
For the lower operating temperature (50 °C), the 75W oil showed the lowest power losses. For all the other tests, the highest power loss was reached by the 75W-90 oil, and the BEV 75W-80 and 75W-80 oils showed an intermediate power loss consistent with the kinematic viscosity values. However, it is worth noting that the 75W oil kept the power loss almost constant with the operating temperature increasing from 50 °C to 80 °C. At the same time, the BEV 75W-80 oil started with a relatively high value but showed a notable decrease to its minimum at 80 °C.
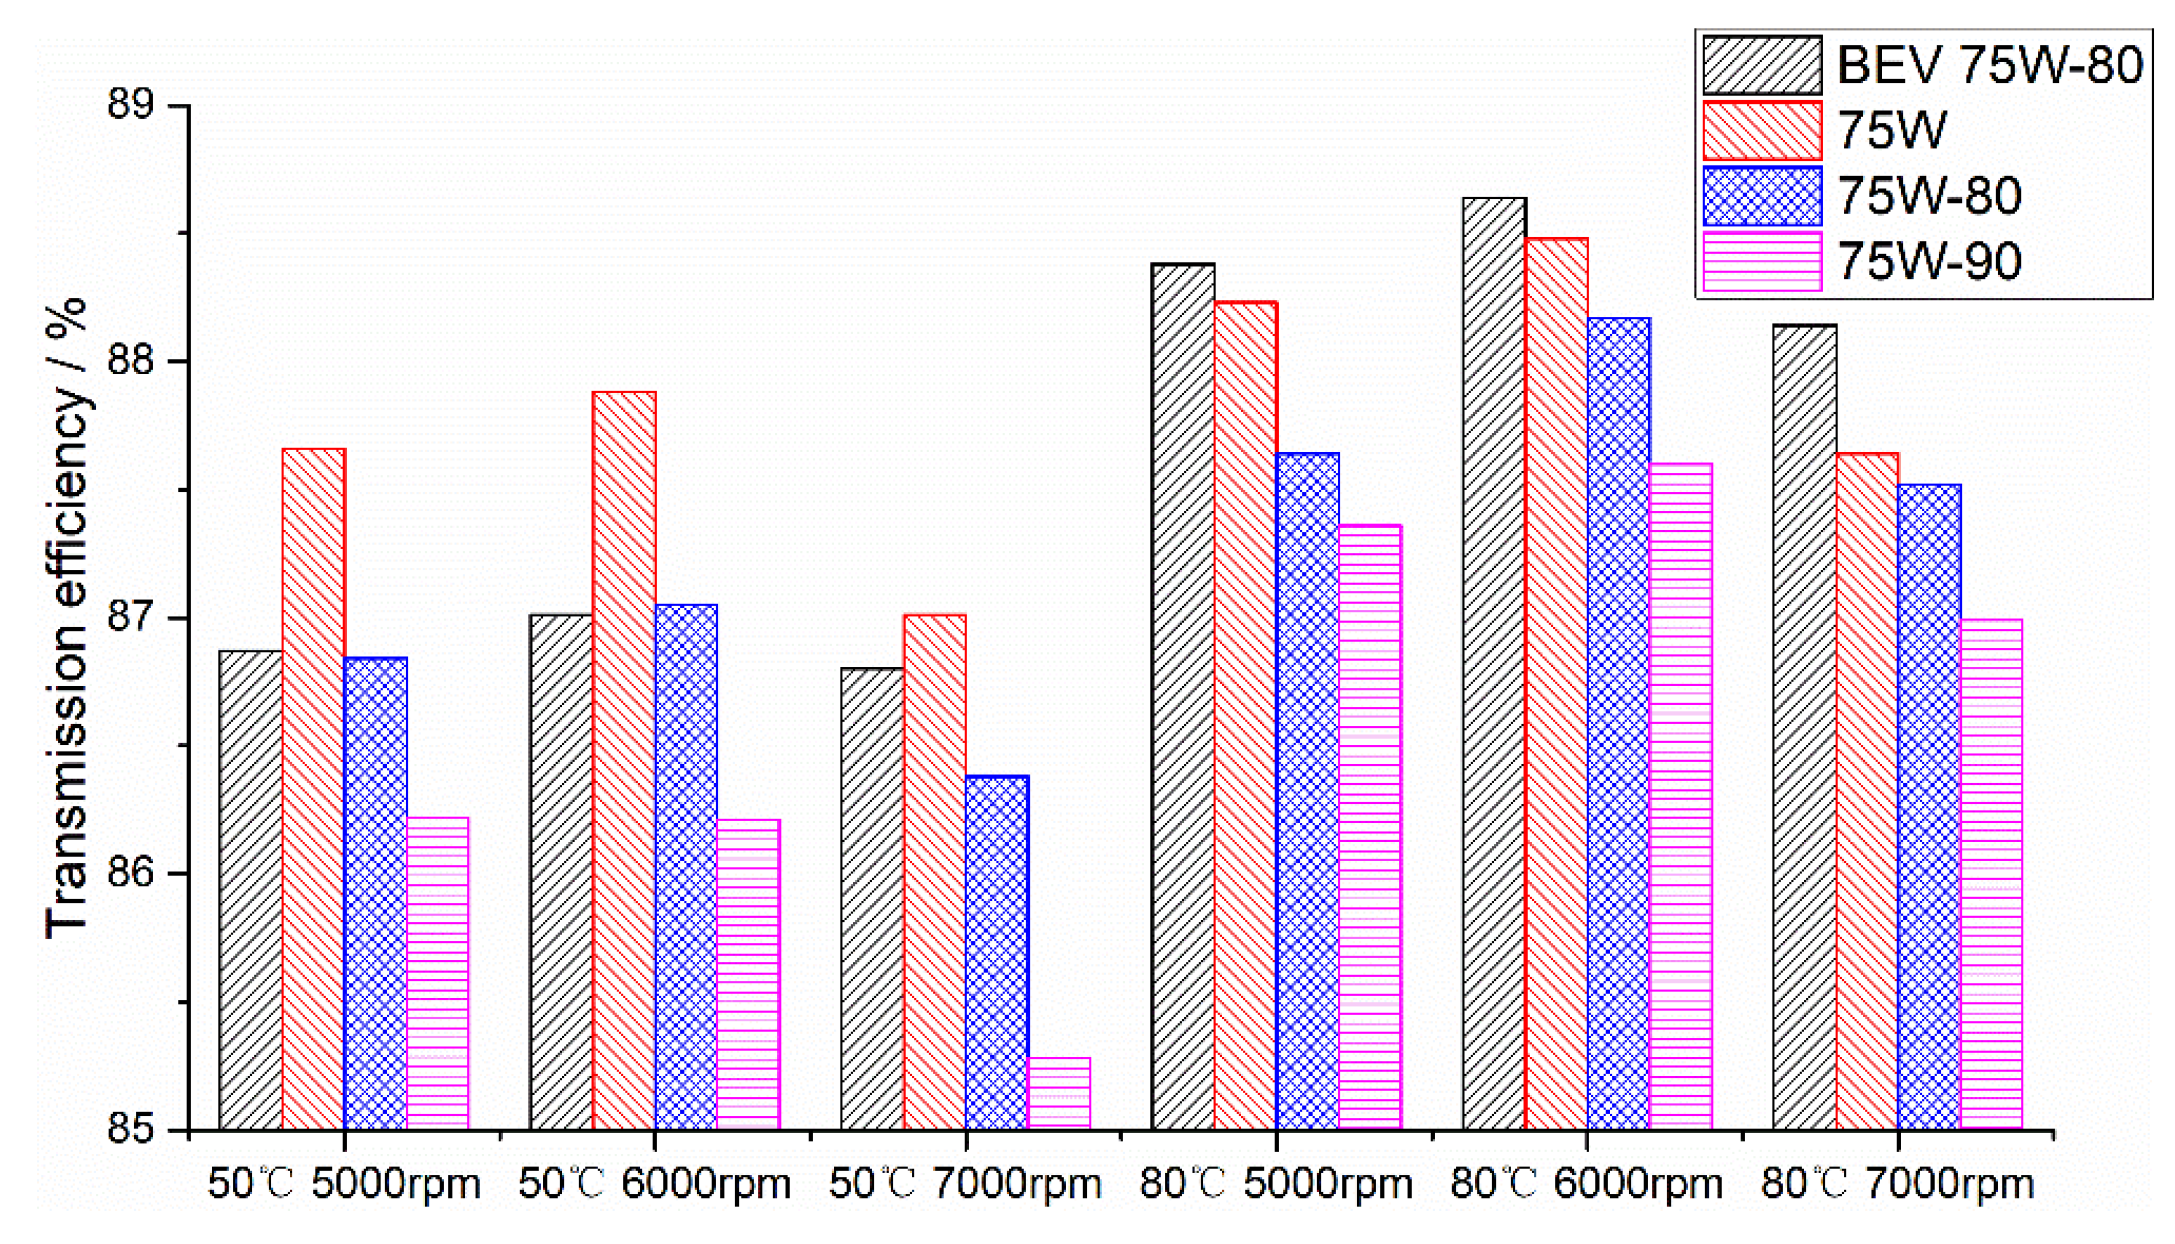
All the tested gear oils showed a significant power loss increase with increasing input speed and input torque (increasing input power). The power loss dominated the ranking of the gearboxes regarding their stabilization temperature, which in turn affected the efficiency of the gearbox (gear churning as well as the friction coefficient depending on the oil temperature). Thus, the transmission efficiency of the gearbox, which was affected by the oil temperature, is also presented in Figure 5.
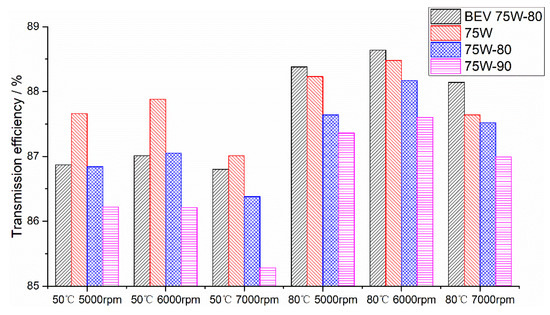
Figure 5.
Transmission efficiency for the tested oils.
The transmission efficiency results follow the same trends that were observed in Figure 4. The 75W-90 oil showed the worst transmission efficiency performance while the BEV 75W-80 oil usually had the best (1.04% higher at 80 °C), the exception being the 75W oil at the lower operating temperature (50 °C). As for the 75W-80 oil, it usually showed an intermediate transmission efficiency.
4.1.2. No-Load Power Loss Test Results
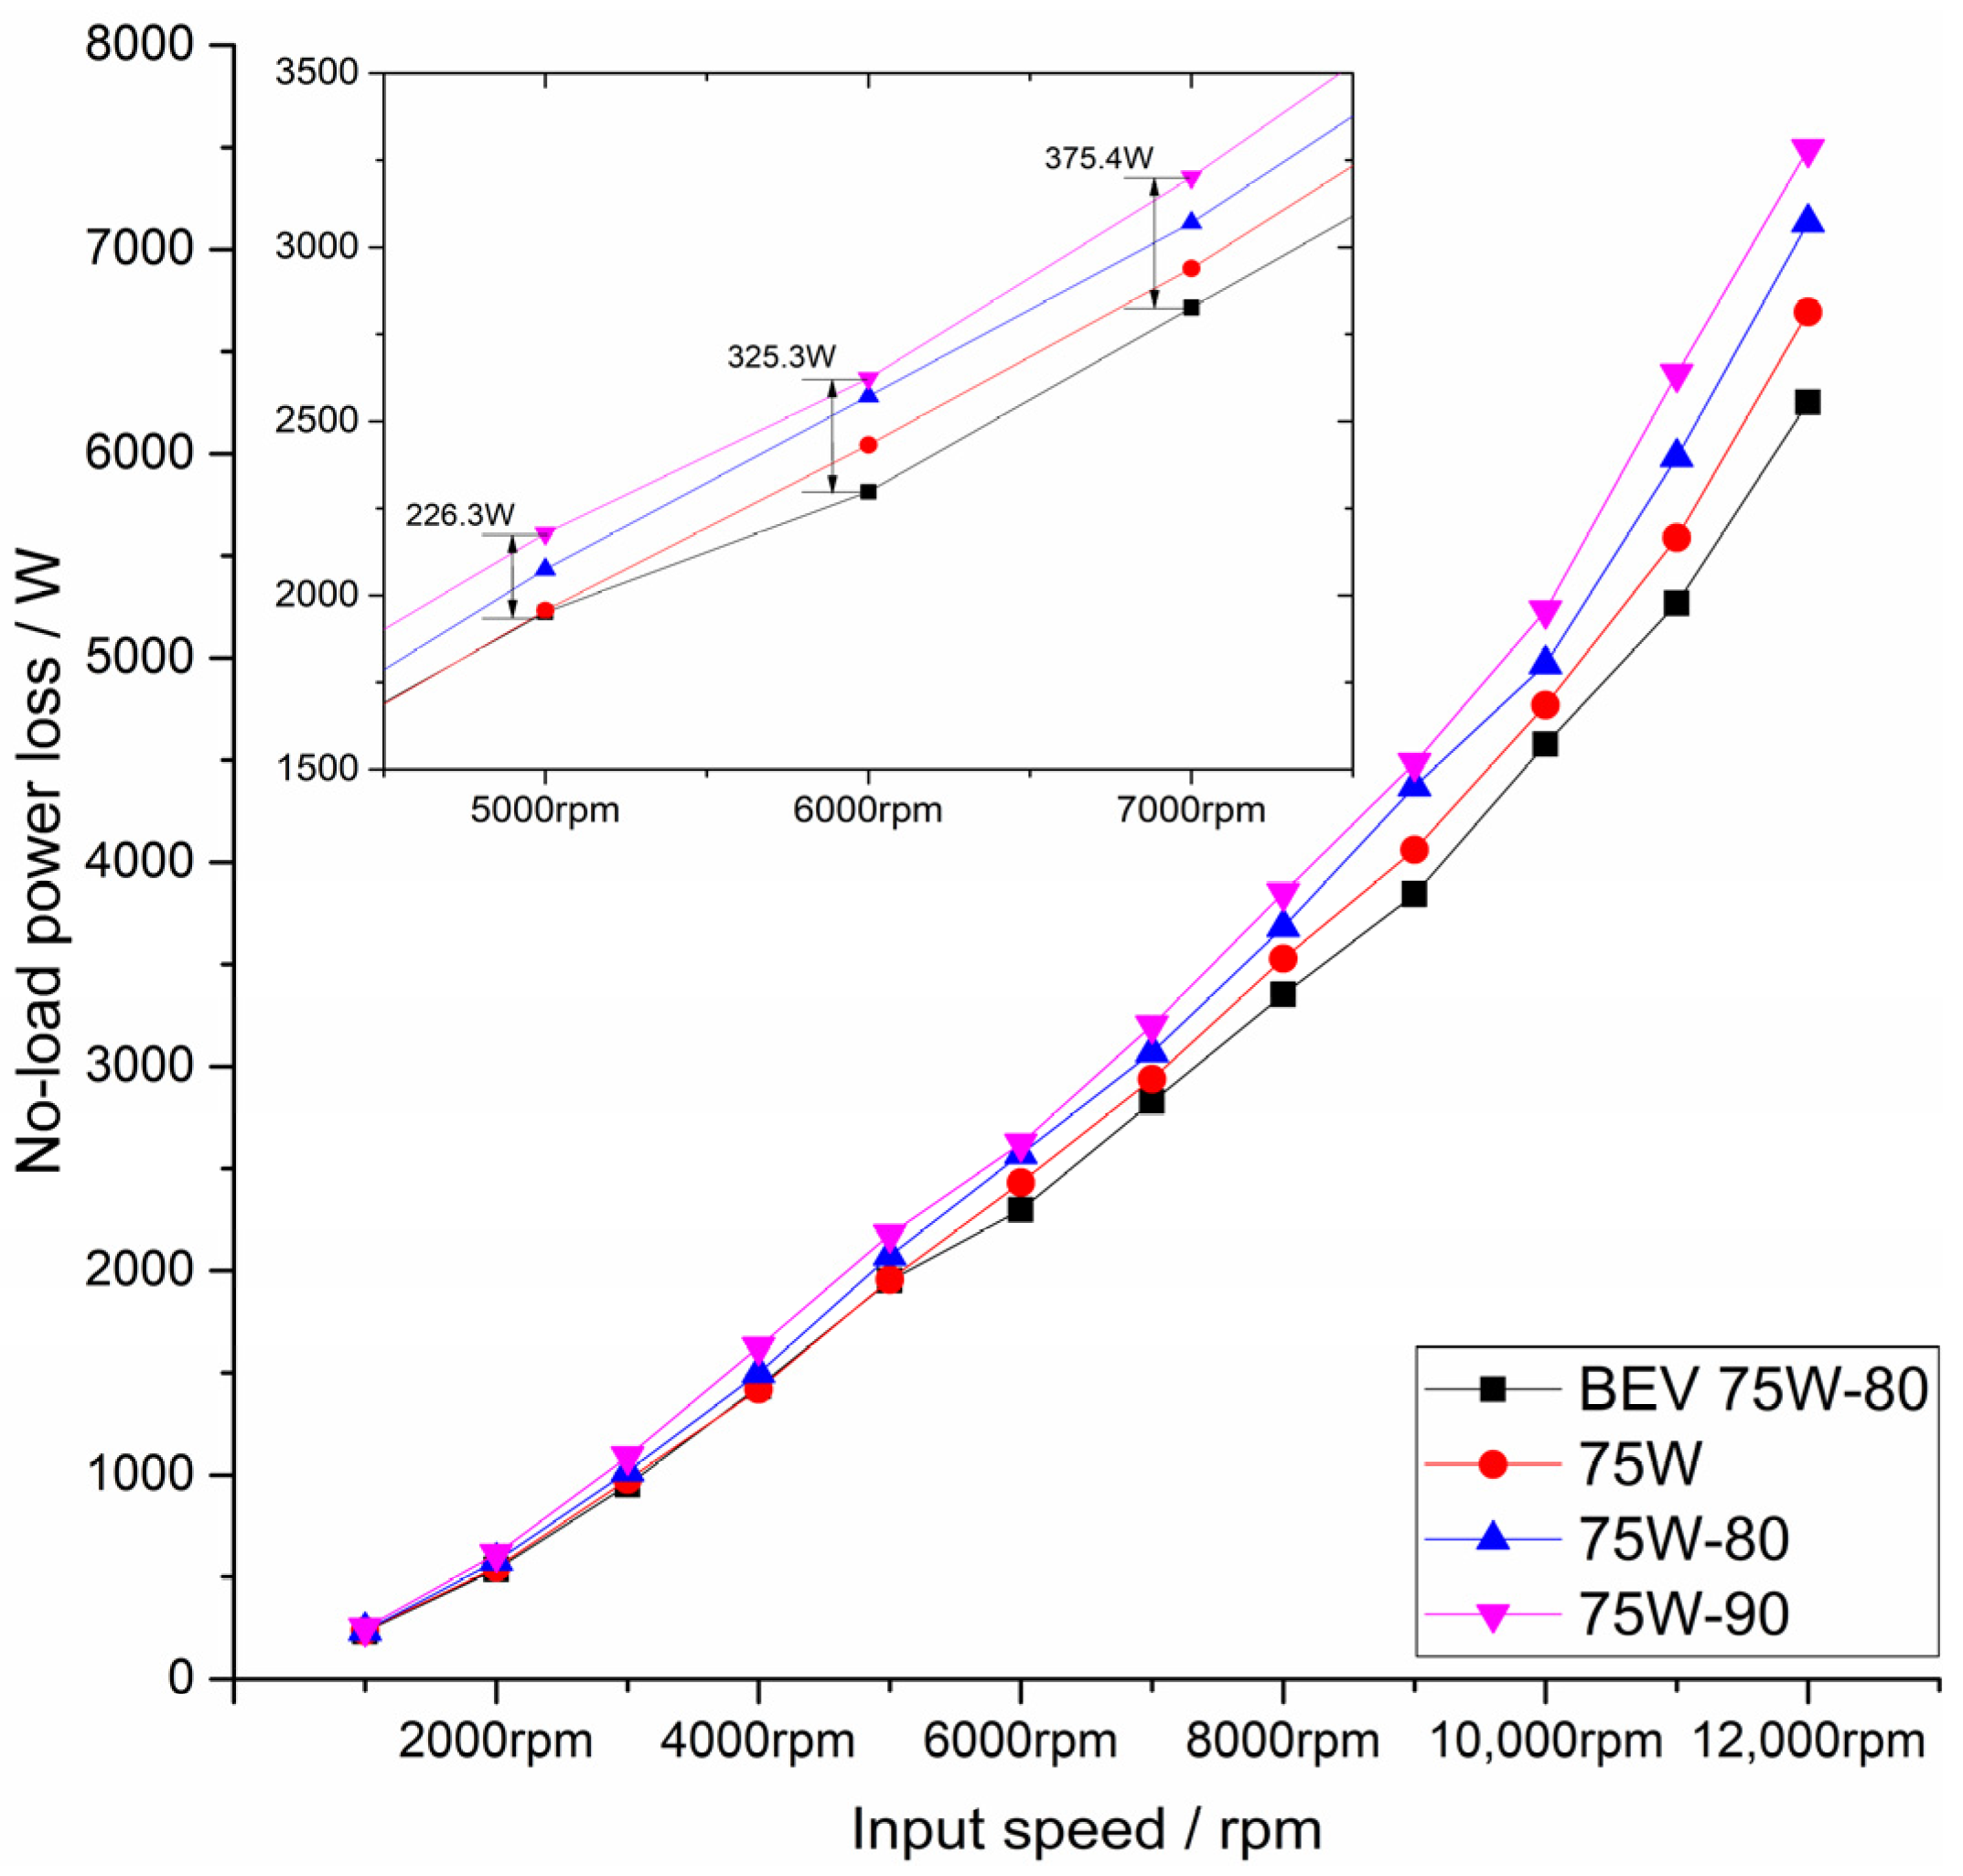
The experimental no-load power loss results are shown in Figure 6. Please note that the measured no-load power losses include not only the gear churning losses but also the rolling bearing and seal power losses. As we have mentioned above, the taper roller bearings are always preloaded, which means that in the experimental no-load power losses, it also has a taper roller bearing load power loss component.
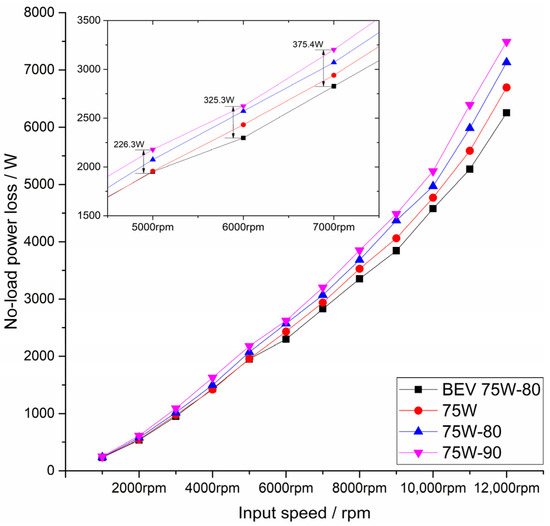
Figure 6.
No-load power loss for the tested oils at 80 °C.
Regarding the no-load power loss, the BEV 75W-80 oil exhibited almost the lowest power loss while the 75W-90 oil had a much higher no-load power loss than the others. The 75W-90 oil had the highest kinematic viscosity and density, so whether from the perspective of overcoming the fluid viscous resistance or accelerating a larger mass of oil, more energy must be used in this process. Therefore, it should be believed that these differences should result from churning power loss. From the local enlarged image, it can be seen that the difference between selected oil types became larger as the speed increased. For an electric gearbox with high input speed, controlling the churning power loss can bring considerable benefits.
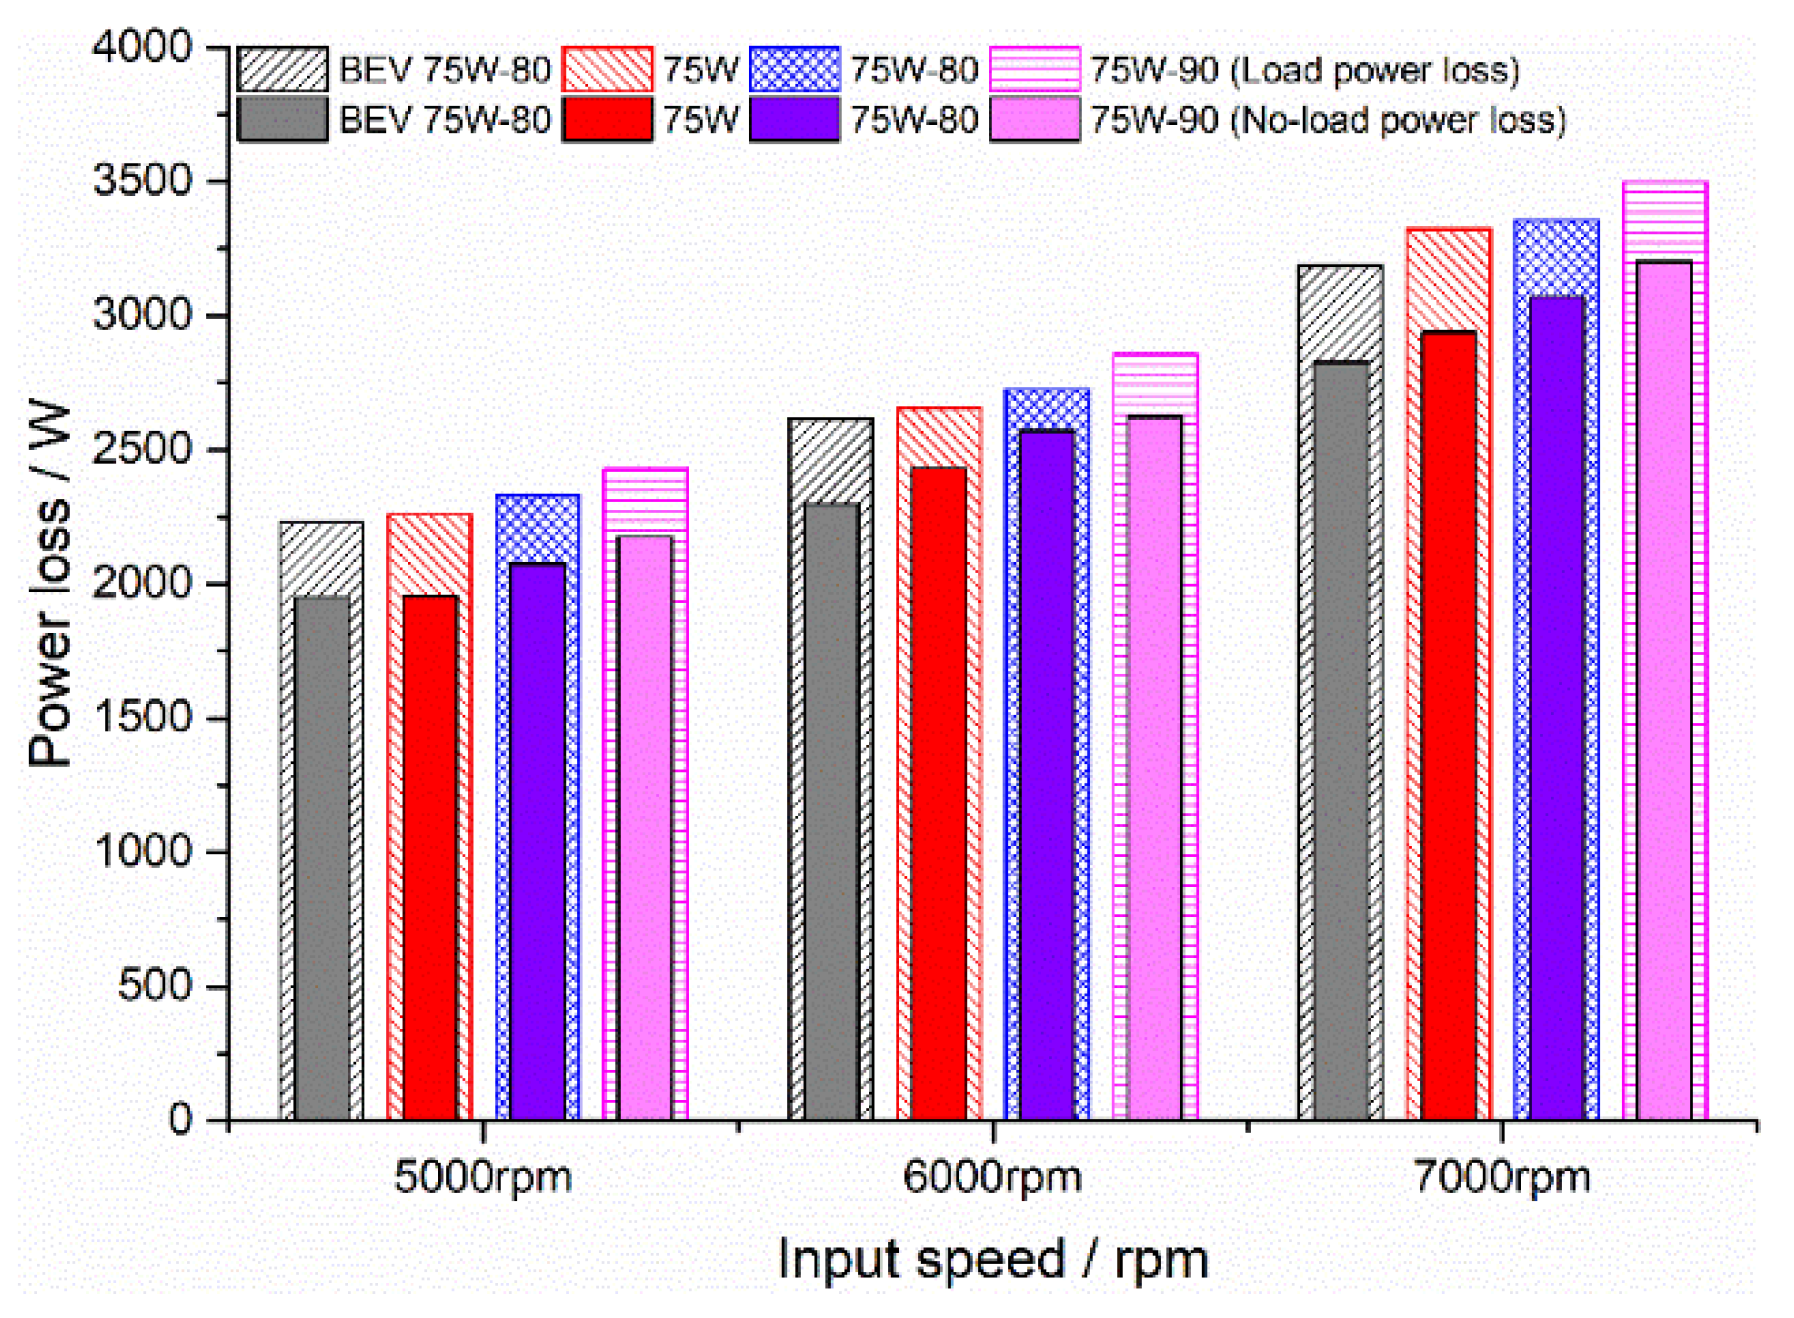
Figure 7 shows a comparison between the load power losses and the no-load power losses. It is visible that for all selected gear oil types the no-load power loss accounted for most of the overall power loss (>80%).
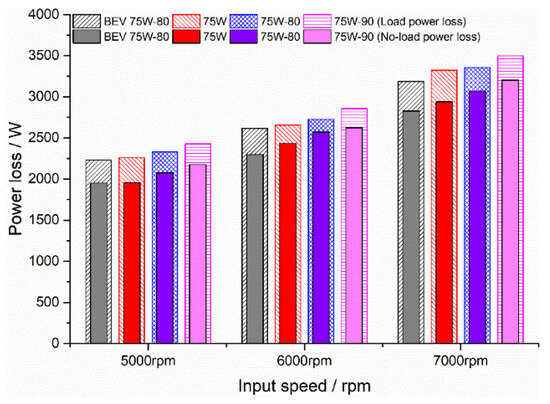
Figure 7.
No-load power loss and load power loss at 80 °C.
4.2. Power Loss Calculation Results
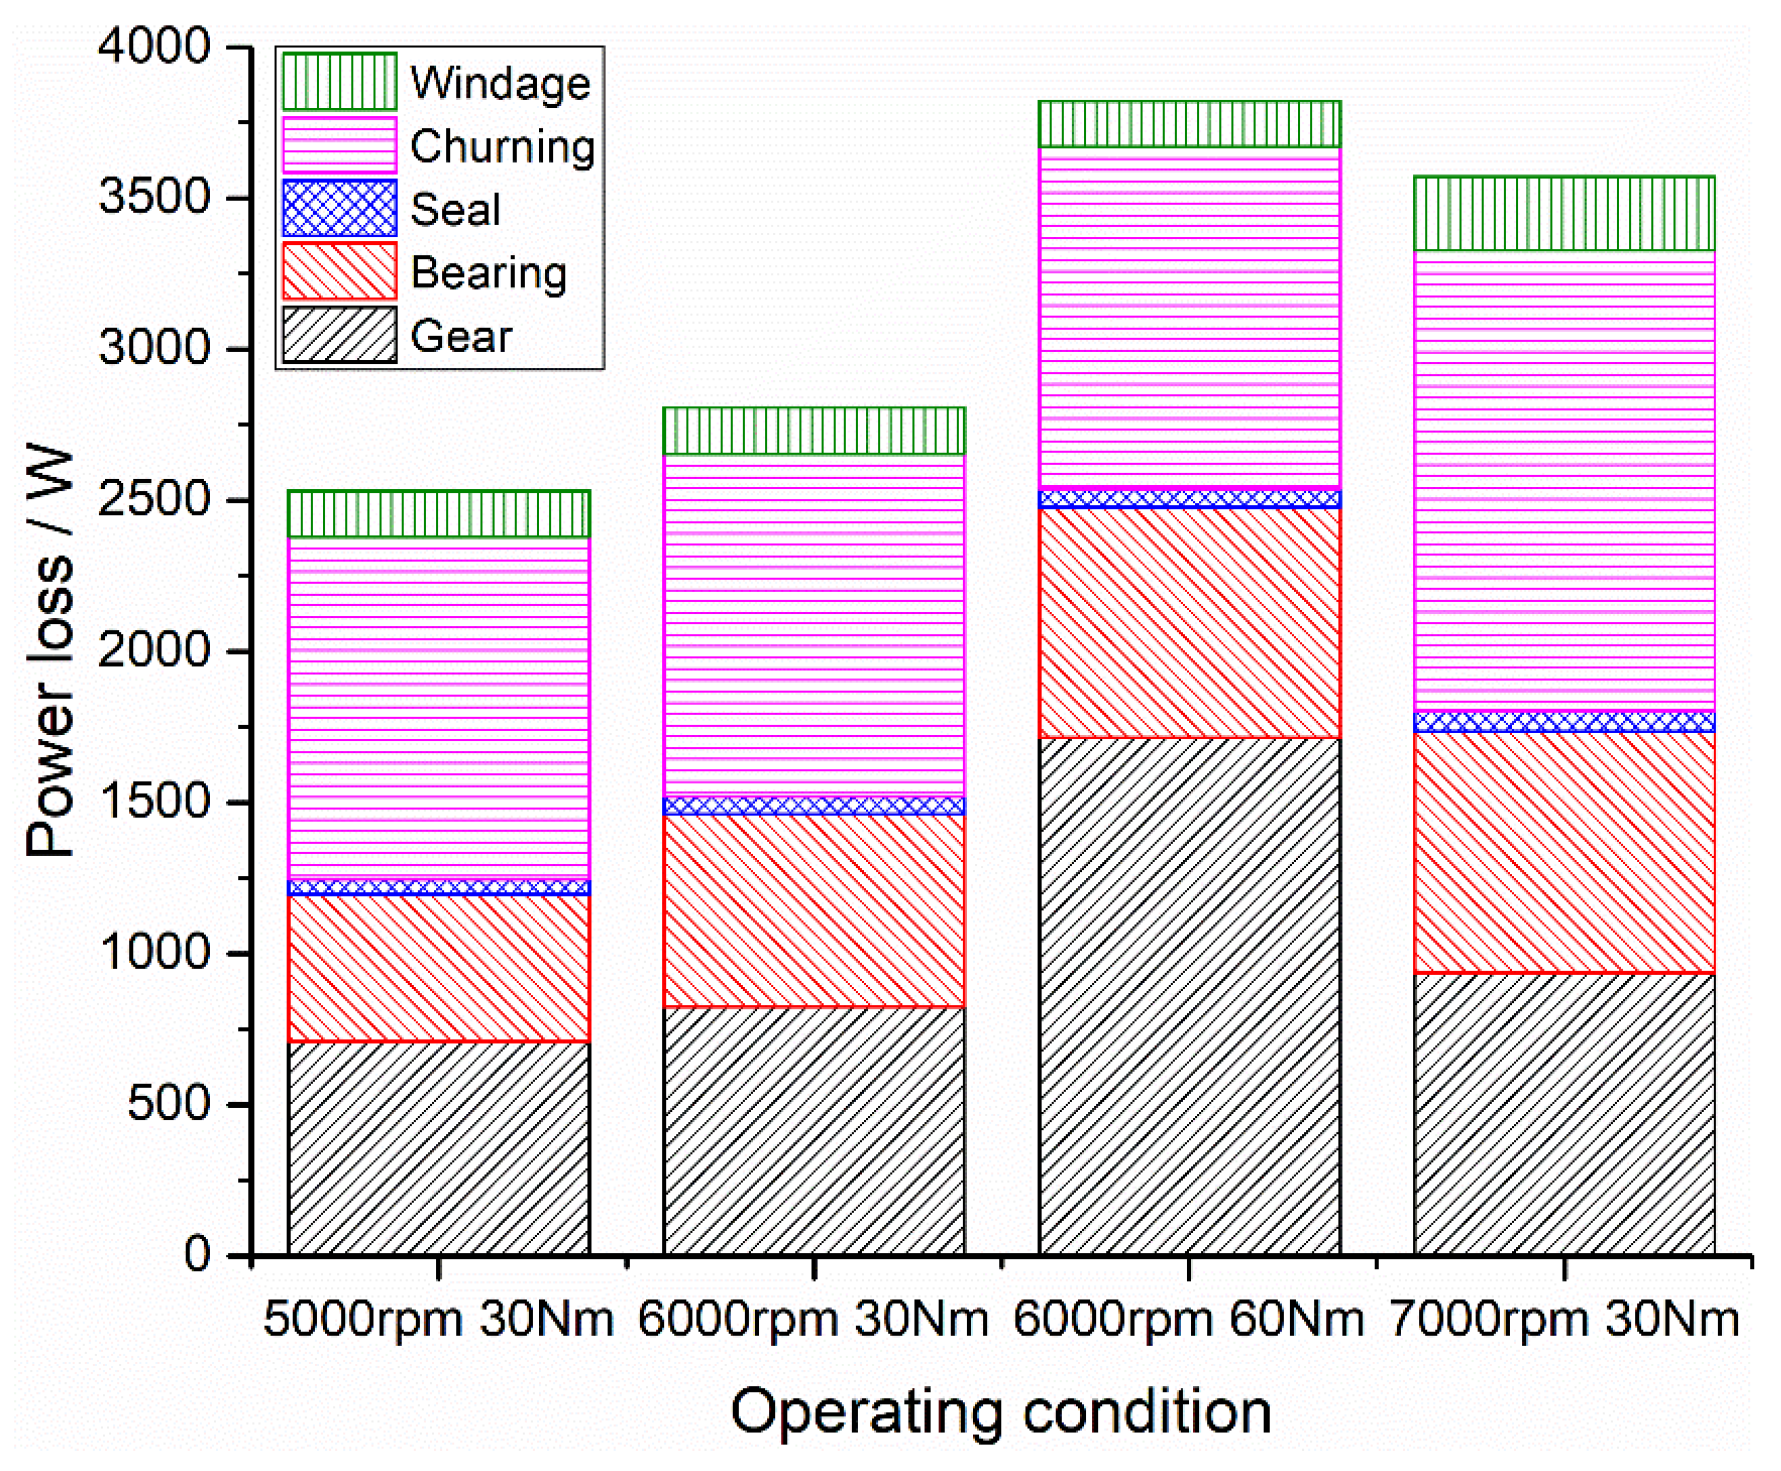
Figure 8 presents the calculated power loss distribution of each one of the tested gear oils. Due to space constraints, only the calculation results based on the 75W-90 gear oil are shown below. The churning power loss presented in Figure 8 was calculated using Formula (16). To simulate the actual no-load power loss test, the preloaded tapered bearings and seals were subtracted from the no-load power loss measurement. Please note that the shaft and housing deformation were not considered in the calculation.
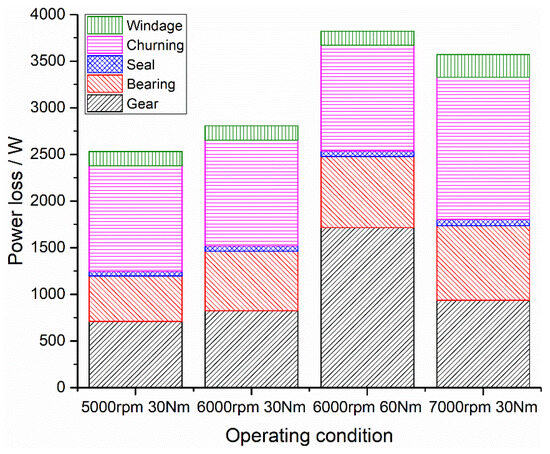
Figure 8.
Calculated power loss distribution of 75W-90 at 80 °C.
At these operating conditions collected from the true road spectrum, the churning power losses were the most influential component (>40%). The gears were the second most important power loss component. The bearings showed almost the same contribution as the gears. The churning power losses introduced by the gears were not affected by load variations, and that is why for a constant speed of 6000 rpm the churning power losses were almost the same. If an E-Axle power loss reduction is desired, the following directions can be implemented: (1) add oil guide plates to reduce the amount of oil stirred up; (2) use low-viscosity gear oils to reduce the friction between oil molecules; and (3) replace the preload tapered rolling bearing arrangement with a more efficient rolling bearing arrangement. Mainly due to their input speed, the gear windage is a negligible source of power losses. As for the other selected gear oils, the power loss proportion was very similar.
4.3. Experimental and Model Results Comparison
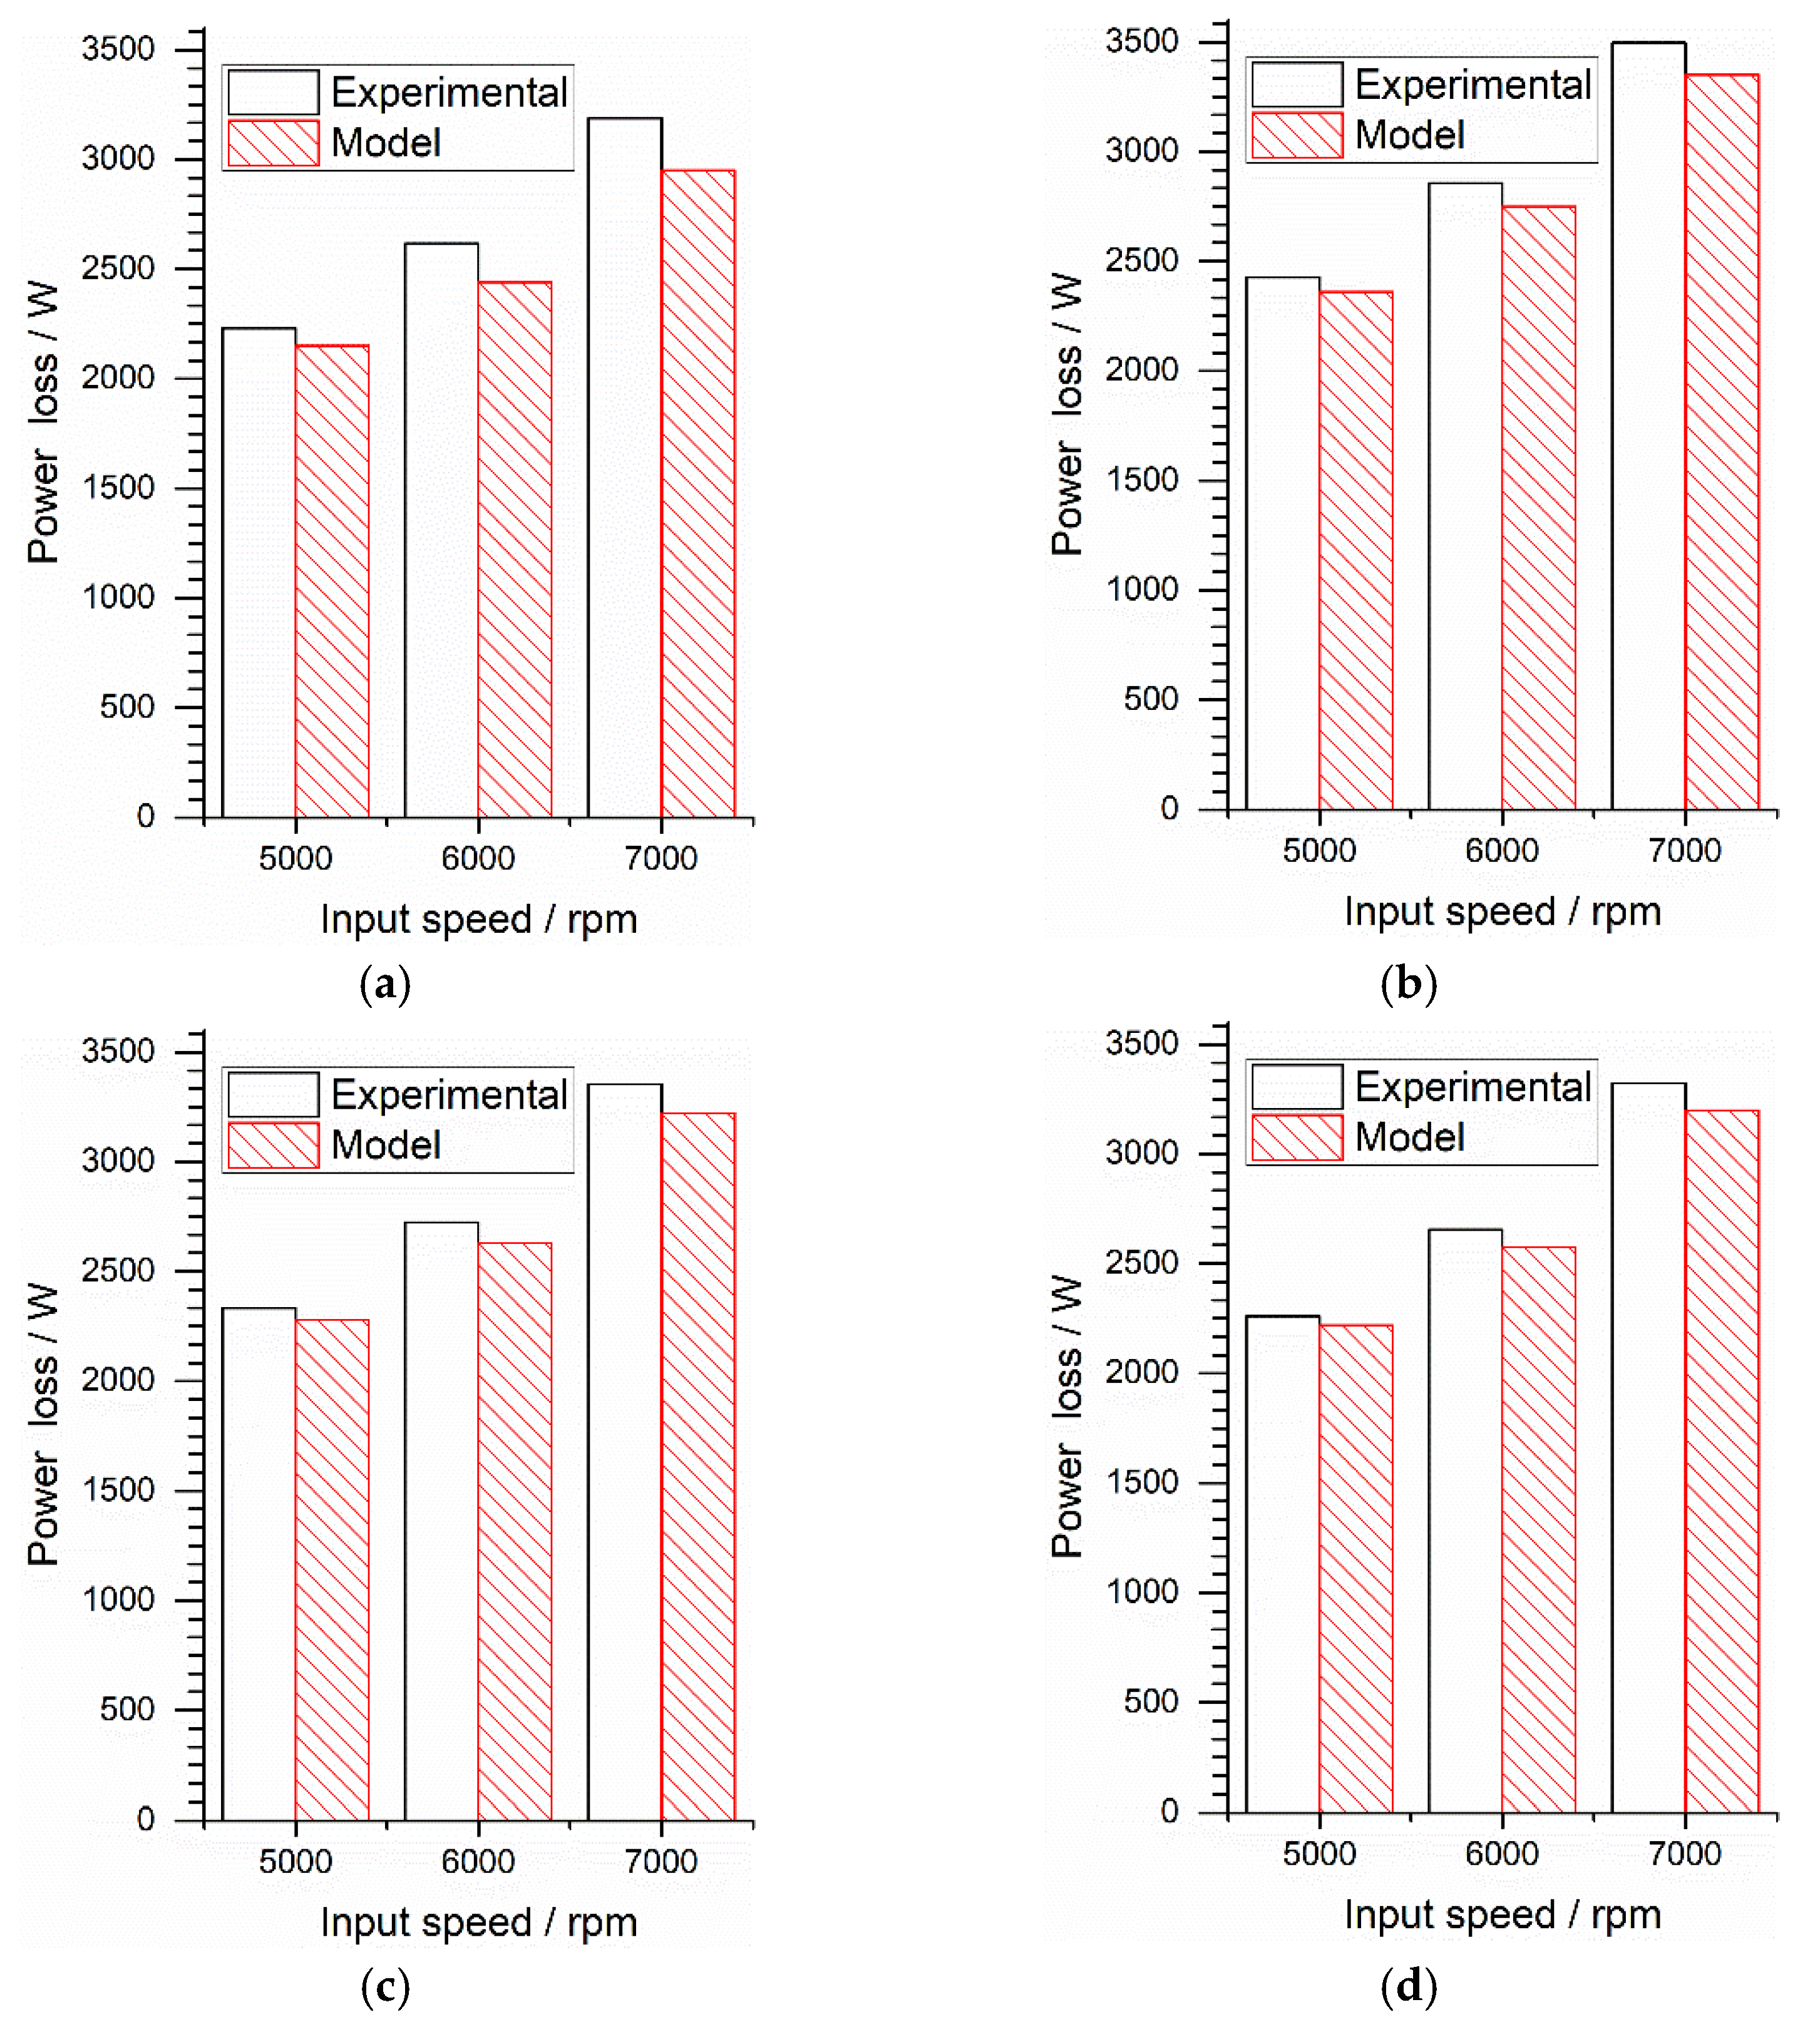
Figure 9 presents a comparison between the experimental evaluation and the model power losses. The model evaluations consist of the load-independent power losses component in summation to the load-dependent power losses that were calculated.
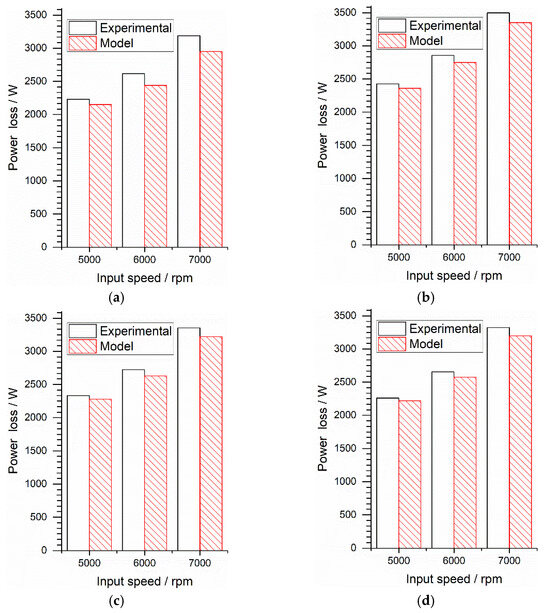
Figure 9.
Experimental measured vs. model calculated power loss at 80 °C; (a) BEV 75W-80; (b) 75W-90; (c) 75W-80; (d) 75W.
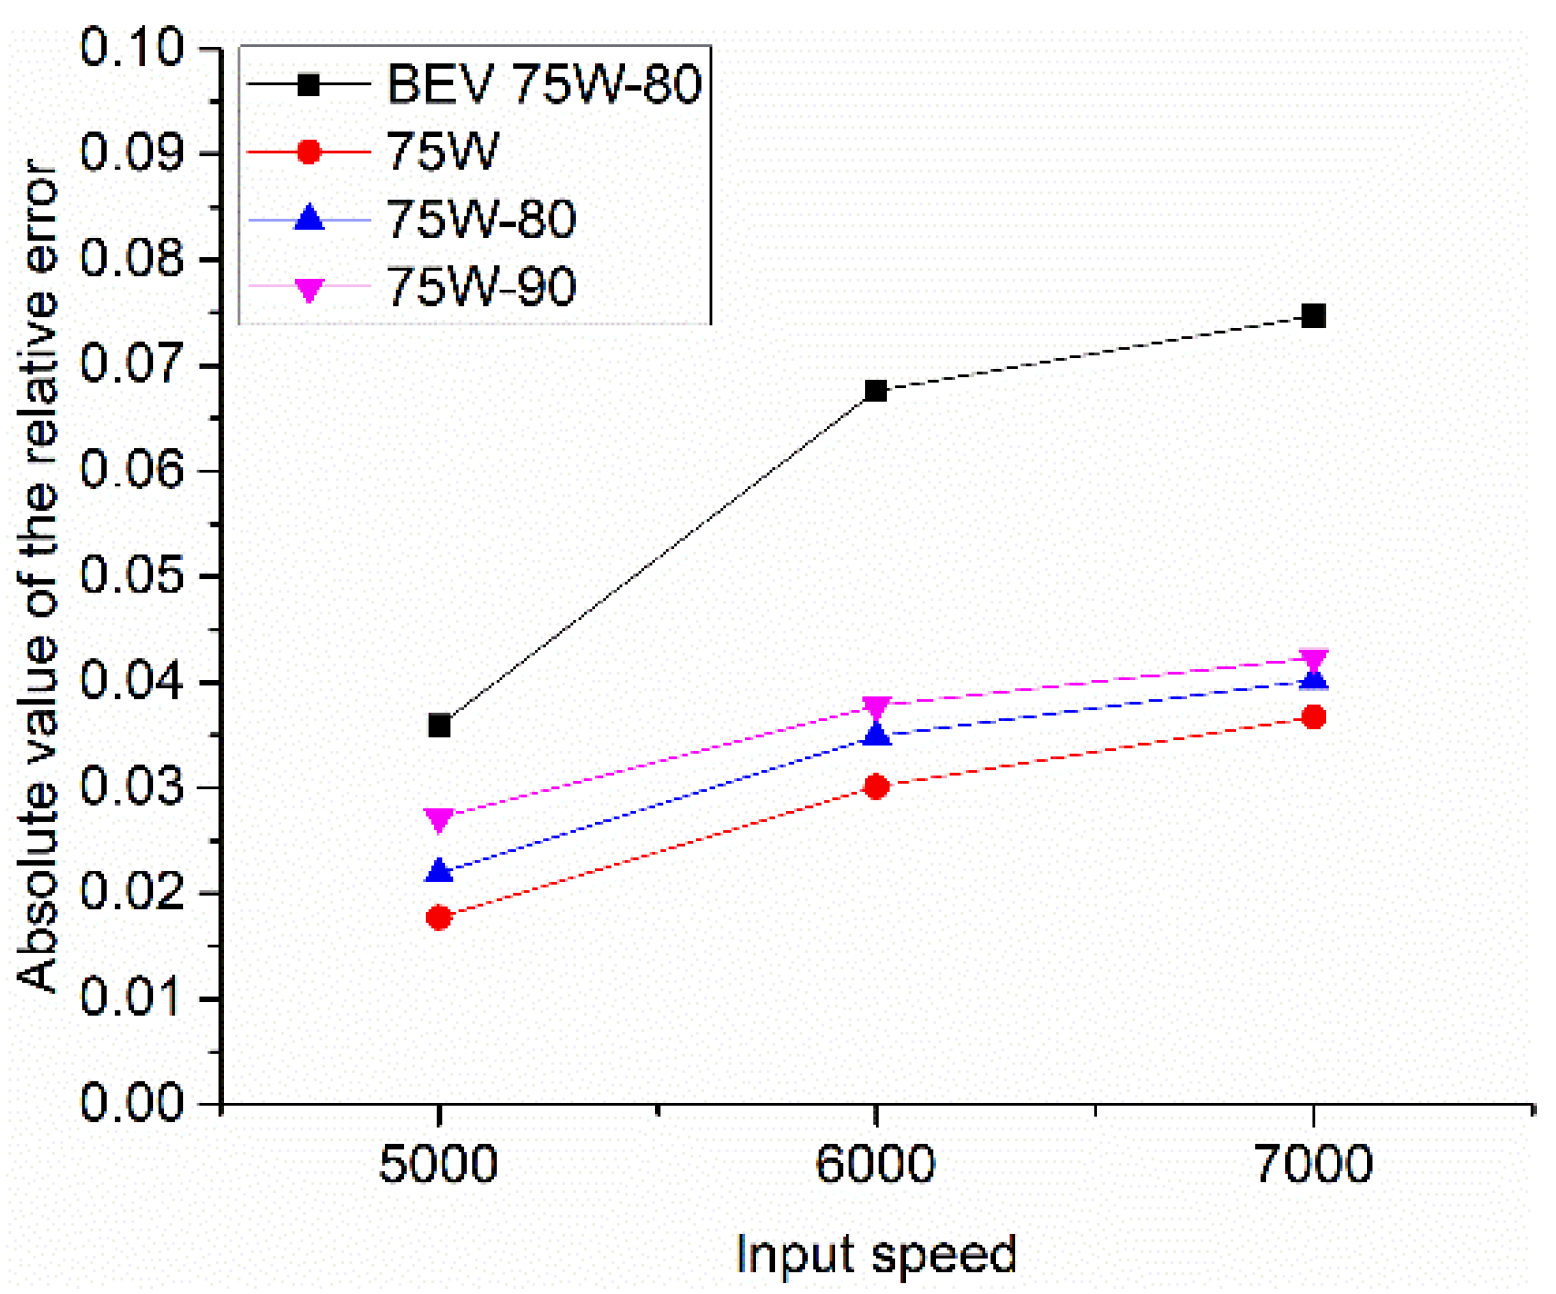
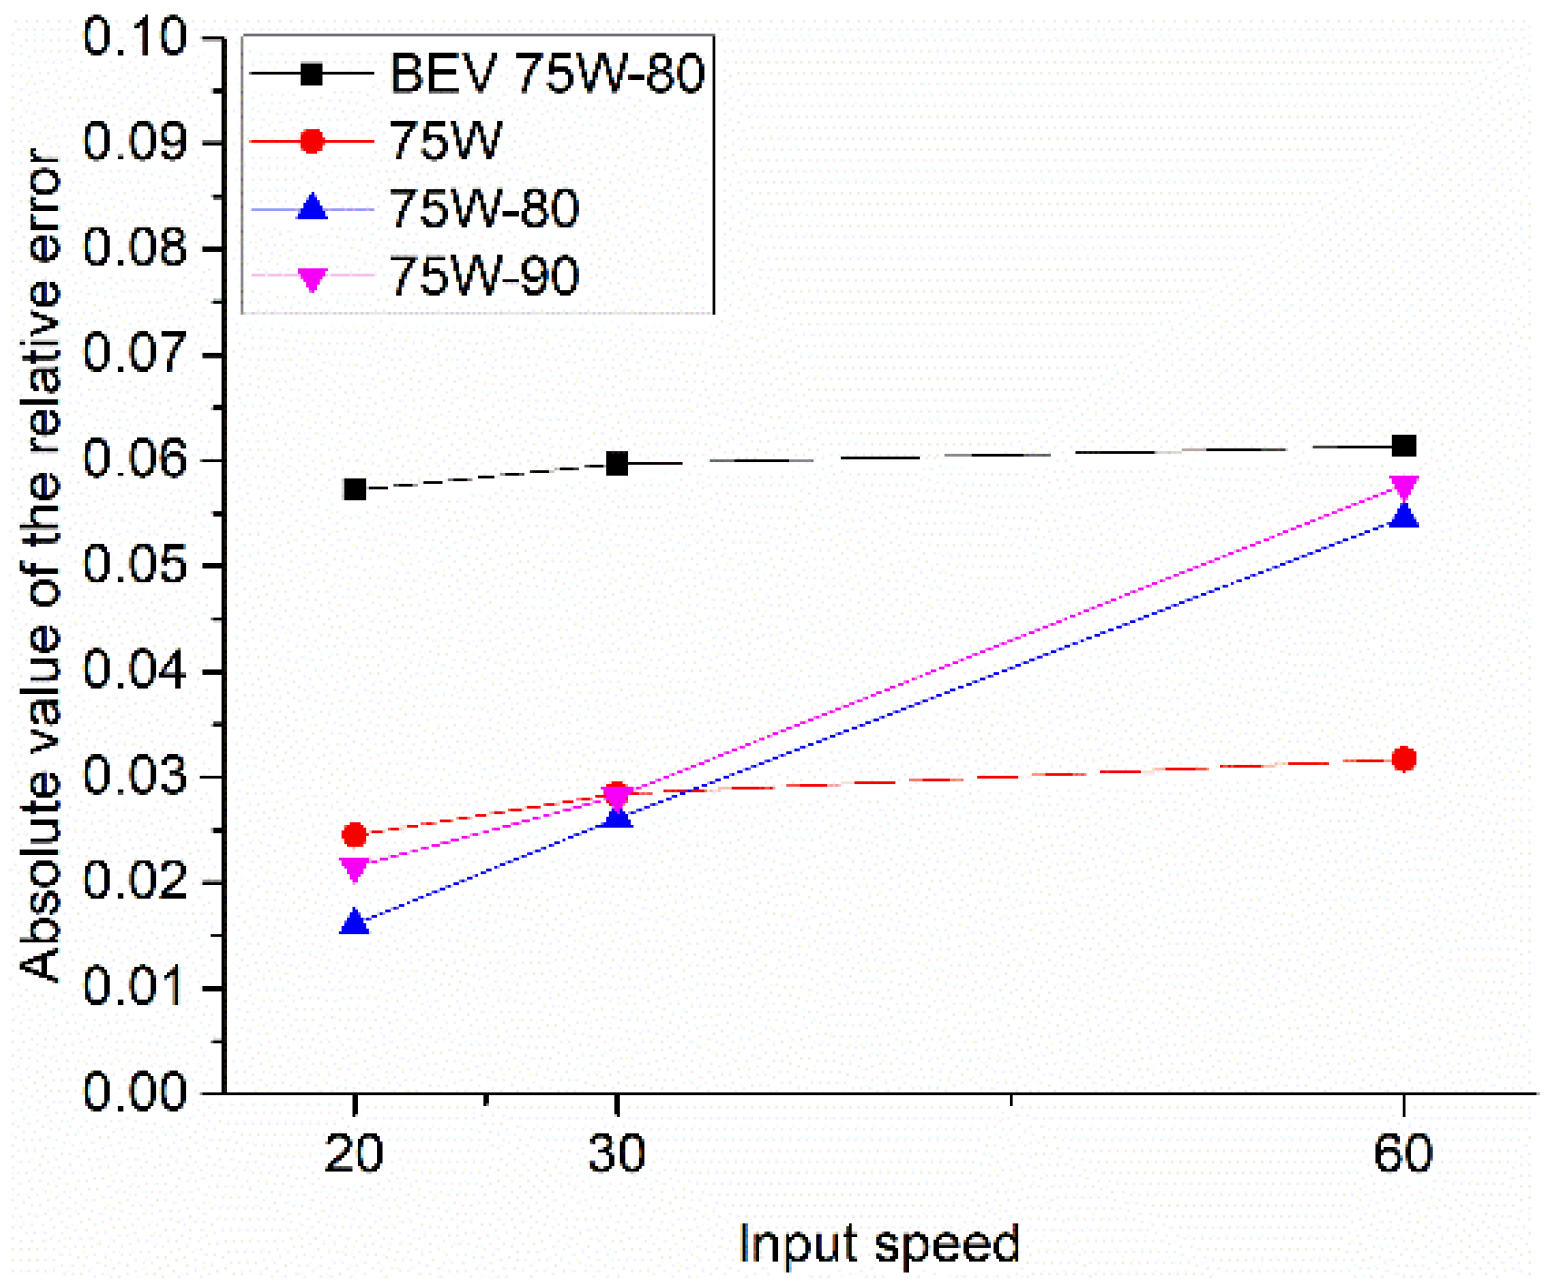
To evaluate the performance of the systemic modeling methodology for power loss evaluation, the relative error between the calculated power loss and experimentally measured power loss was calculated. Two cases were considered for this comparison: (1) the power loss under different input speeds and (2) the power loss under different input torques. Specifically, the relative error, , was defined as the relative difference between the model calculated and experimentally measured power loss.
The absolute value of the relative error between each selected gear oil at different input speeds and input torques is shown in Figure 10 and Figure 11, respectively.
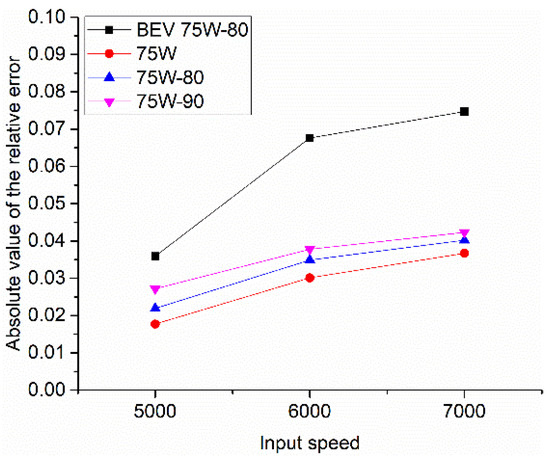
Figure 10.
Relative error (input speeds).
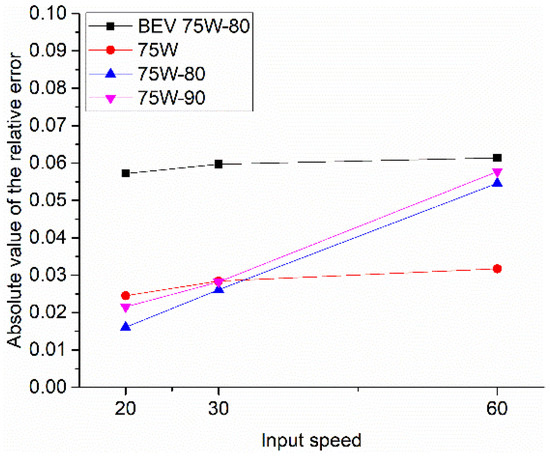
Figure 11.
Relative error (input torques).
- The power loss evaluations were in good agreement with the experimental results; specifically, the relative error was less than 8% for all the selected evaluation cases, indicating that the systematic modeling methodology is reliable and suitable for predicting E-Axle gearbox power loss.
- The modeling methodology appeared to yield the worst results for the BEV 75W-80 gear oil. The BEV 75W-80 gear oil has some additive adjustments for high-speed electric driving systems, especially in terms of the anti-foaming properties that may lead to significant changes in the oil surface tension, leading to a larger calculation error in churning power loss.
- As the input torque increased from 20 Nm to 60 Nm, the BEV 75W-80 and 75W gear oils showed a constant relative error, while the 75W-80 and 75W-90 gear oils showed an increasing trend. The 75W-90 and 75W-80 gear oils are heavy-duty automotive gear oils that have a lot of EP additives added to improve the load carrying capacity. When the input torque is high, a chemical protective film will form on the gear contact surface, which may result in significant errors.
In general, these results show that the systemic modeling methodology provides a good prognostic result, indicating that the developed model can be employed to evaluate the E-Axle gearbox’s power loss. However, it should be noted that gear oils with significant additive adjustments may lead to larger prediction errors.
5. Conclusions
In this paper, a systematic modeling methodology was developed to evaluate the gearbox power loss in a high-speed E-Axle. The power loss model was based on previously well-established models for gears, bearings, seals, etc. The developed methodology was validated using an E-Axle used in light-duty trucks under various operating conditions and gear oil formulations. The influence of oil formulations, oil temperature, and operating conditions on the gearbox total power loss and churning power loss were analyzed. The conclusions are as follows:
- The tested E-Axle gearbox power loss is significantly influenced by the operating conditions and oil formulations. The power loss increases with increases in the input speed and input torque. For all the oils, the source of most of the power loss was no-load power loss, almost always accounting for more than 80%.
- Considering the test results, the BEV 75W-80 gear oil seems to be the optimal gear oil for the tested E-Axle applications if power loss is one of the main concerns. The test results showed that BEV 75W-80 gear oil can promote an efficiency increase of up to 1.04% when compared with 75W-90 gear oil at 80 °C.
- The developed systemic modeling methodology provides a good prognostic result for the E-Axle gearbox power loss evaluation. The relative error between the calculated power loss and the experimental results was less than 8% for all the elected evaluation cases, indicating the reliability of the methodology.
- The calculated results show that at the nominal operating conditions of the light-duty truck, churning is the most significant power loss source, accounting for more than 40%. The highest proportion is due to its high input speed and deeper immersion depth. The gears are the second most important power loss source, with a similar proportion attributed to the bearings.
The main contribution of this paper is not only providing a new direction in evaluating the gearbox power loss by using a systemic model, but also providing opportunities to identify which elements (gears, bearings, and oil formulation) need an alternative selection or redesign. The following are some possible directions for future research:
- A calibration procedure with more measured or empirical data for each power loss source may have to be conducted to produce an accurate power loss model.
- An improved power loss calculation model considering the additive effects should be established when dealing with oils with significant additives.
- An investigation on gear power loss evaluation considering modified tooth geometry and elastic effects in the load distribution should be carried out.
Author Contributions
Conceptualization, S.Y. and Z.K.; methodology, S.Y.; software, S.Y. and X.H.; validation, S.Y., Y.H. and Z.K.; formal analysis, H.L. and L.Z.; investigation, S.Y.; resources, Z.K. and H.L.; data curation, X.H.; writing—original draft preparation, S.Y.; writing—review and editing, S.Y.; visualization, S.Y.; supervision, Z.K.; project administration, Z.K.; funding acquisition, Z.K. All authors have read and agreed to the published version of the manuscript.
Funding
This research was partially funded by the R & D Project of the China National Heavy Duty Truck Group for E-Axle (under grant numbers YF01123390R, YF01123358R, and YF01122008R).
Data Availability Statement
Data are contained within the article.
Conflicts of Interest
The authors declare no conflicts of interest.
References
- Martino, M.; Pescetto, P.; Pellegrino, G. Advanced Functionally Integrated E-Axle for A-Segment Electric Vehicles. In Proceedings of the 2020 AEIT International Conference of Electrical and Electronic Technologies for Automotive (AEIT AUTOMOTIVE), Turin, Italy, 18–20 November 2020. [Google Scholar] [CrossRef]
- Yan, S.; Kong, Z.; Liu, H.; Li, B.; Fan, M.; Zhang, X. Oil Change Interval Evaluation of Gearbox Used in Heavy-Duty Truck E-Axle with Oil Analysis Data. Lubricants 2022, 10, 252. [Google Scholar] [CrossRef]
- Michaelis, K.; Höhn, B.R.; Hinterstoißer, M. Influence factors on gearbox power loss. Ind. Lubr. Tribol. 2011, 63, 46–55. [Google Scholar] [CrossRef]
- Marques, P.M.; Fernandes, C.M.; Martins, R.C.; Seabra, J.H. Power losses at low speed in a gearbox lubricated with wind turbine gear oils with special focus on churning losses. Tribol. Int. 2013, 62, 186–197. [Google Scholar] [CrossRef]
- Petry-Johnson, T.T.; Kahraman, A.; Anderson, N.E.; Chase, D.R. An Experimental Investigation of Spur Gear Efficiency. ASME J. Mech. Des. 2008, 130, 062601. [Google Scholar] [CrossRef]
- Fernandes, C.M.; Blazquez, L.; Sanesteban, J.; Martins, R.C.; Seabra, J.H. Energy efficiency tests in a full scale wind turbine gearbox. Tribol. Int. 2016, 101, 375–382. [Google Scholar] [CrossRef]
- Anderson, N.E.; Loewenthal, S.H. Effect of geometry and operating conditions on spur gear system power loss. ASME J. Mech. Des. 1981, 103, 151–159. [Google Scholar] [CrossRef]
- ISO/TR 14179-1:2001; Gears—Thermal Capacity—Part 1: Rating Gear Drives with Thermal Equilibrium at 95 °C Sump Temperature. International Organization for Standardization: Geneva, Switzerland, 2001.
- ISO/TR 14179-2:2001; Gears—Thermal Capacity—Part 2: Thermal Load Carrying Capacity. International Organization for Standardization: Geneva, Switzerland, 2001.
- Changenet, C.; Leprince, G.; Ville, F.; Velex, P. A note on flow regimes and churning loss modeling. ASME J. Mech. Des. 2011, 133, 5159–5171. [Google Scholar] [CrossRef]
- Neurouth, A.; Changenet, C.; Ville, F.; Octrue, M.; Tinguy, E. Experimental investigations to use splash lubrication for high-speed gears. J. Tribol. 2017, 139, 061104. [Google Scholar] [CrossRef]
- Hu, X.; Jiang, Y.; Luo, C.; Feng, L.; Dai, Y. Churning power losses of a gearbox with spiral bevel geared transmission. Tribol. Int. 2019, 129, 398–406. [Google Scholar] [CrossRef]
- Liu, H.; Jurkschat, T.; Lohner, T.; Stahl, K. Determination of oil distribution and churning power loss of gearboxes by finite volume CFD method. Tribol. Int. 2017, 109, 346–354. [Google Scholar] [CrossRef]
- Liu, H.; Liu, H.; Zhu, C.; Parker, R.G. Effects of lubrication on gear performance: A review. Mech. Mach. Theory 2020, 145, 103701. [Google Scholar] [CrossRef]
- Concli, F.; Gorla, C. Windage, churning and pocketing power losses of gears: Different modeling approaches for different goals. Forsch. Im Ing. 2016, 3, 85–99. [Google Scholar] [CrossRef]
- Höhn, B.R.; Michaelis, K.; Vollmer, T. Thermal Rating of Gear Drives: Balance between Power Loss and Heat Dissipation. AG-MA. 1996. Available online: https://members.agma.org/MyAGMA/MyAGMA/Store/Item_Detail.aspx?iProductCode=96FTM08&Category (accessed on 1 January 2023).
- Michaelis, K.; Höhn, B.R. Influence of lubricants on power loss of cylindrical gears. Tribol. Trans. 1994, 37, 161–167. [Google Scholar] [CrossRef]
- Fernandes, C.M.; Marques, P.M.; Martins, R.C.; Seabra, J.H. Gearbox power loss. Part I: Losses in rolling bearings. Tribol. Int. 2015, 88, 298–308. [Google Scholar] [CrossRef]
- Fernandes, C.M.; Marques, P.M.; Martins, R.C.; Seabra, J.H. Gearbox power loss. Part II: Friction losses in gears. Tribol. Int. 2015, 88, 309–316. [Google Scholar] [CrossRef]
- Fernandes, C.M.; Marques, P.M.; Martins, R.C.; Seabra, J.H. Gearbox power loss. Part III: Application to a parallel axis and a planetary gearbox. Tribol. Int. 2015, 88, 317–326. [Google Scholar] [CrossRef]
- Ohlendorf, H. Verlustleistung und Erwärmung von Stirnrädern. Ph.D. Dissertation, Technical University of Munich, München, Germany, 1958; pp. 9–16. Available online: https://mediatum.ub.tum.de/?id=1355973 (accessed on 1 January 2023).
- Douglas, C.E.; Thite, A. Effect of lubricant temperature and type on spur gear efficiency in racing engine gearbox across full engine load and speed range. Proc. Inst. Mech. Eng. Part J J. Eng. Tribol. 2015, 229, 1095–1113. [Google Scholar] [CrossRef]
- Sekar, R.P. Determination of load dependent gear loss factor on asymmetric spur gear. Mech. Mach. Theory 2019, 135, 322–335. [Google Scholar] [CrossRef]
- Changenet, C.; Velex, P. A Model for the Prediction of Churning Losses in Geared Transmissions—Preliminary Results. ASME. J. Mech. Des. 2007, 129, 128–133. [Google Scholar] [CrossRef]
- Zhou, X.; Walker, P.; Zhang, N.; Zhu, B.; Ruan, J. Numerical and experimental investigation of drag torque in a two-speed dual clutch transmission. Mech. Mach. Theory 2014, 79, 46–63. [Google Scholar] [CrossRef]
- Concli, F.; Gorla, C. Numerical modeling of the power losses in geared transmissions: Windage, churning and cavitation simulations with a new integrated approach that drastically reduces the computational effort. Tribol. Int. 2016, 103, 58–68. [Google Scholar] [CrossRef]
- Fotso, H.R.F.; Kazé, C.V.A.; Kenmoé, G.D. Real-time rolling bearing power loss in wind turbine gearbox modeling and prediction based on calculations and artificial neural network. Tribol. Int. 2021, 163, 107171. [Google Scholar] [CrossRef]
- Fernandes, C.M.; Hammami, M.; Martins, R.C.; Seabra, J.H. Power loss prediction: Application to a 2.5 MW wind turbine gearbox. Proc. Inst. Mech. Eng. Part J J. Eng. Tribol. 2016, 230, 983–995. [Google Scholar] [CrossRef]
- Fernandes, C.M.; Marques, P.M.; Martins, R.C.; Seabra, J.H. Film thickness and traction curves of wind turbine gear oils. Tribol. Int. 2015, 86, 1–9. [Google Scholar] [CrossRef]
Disclaimer/Publisher’s Note: The statements, opinions and data contained in all publications are solely those of the individual author(s) and contributor(s) and not of MDPI and/or the editor(s). MDPI and/or the editor(s) disclaim responsibility for any injury to people or property resulting from any ideas, methods, instructions or products referred to in the content. |
© 2024 by the authors. Licensee MDPI, Basel, Switzerland. This article is an open access article distributed under the terms and conditions of the Creative Commons Attribution (CC BY) license (https://creativecommons.org/licenses/by/4.0/).

