Effect of Graphene on Nickel Surface Relaxation: Molecular Dynamics Simulation

 , , , ,
Abstract
:1. Introduction
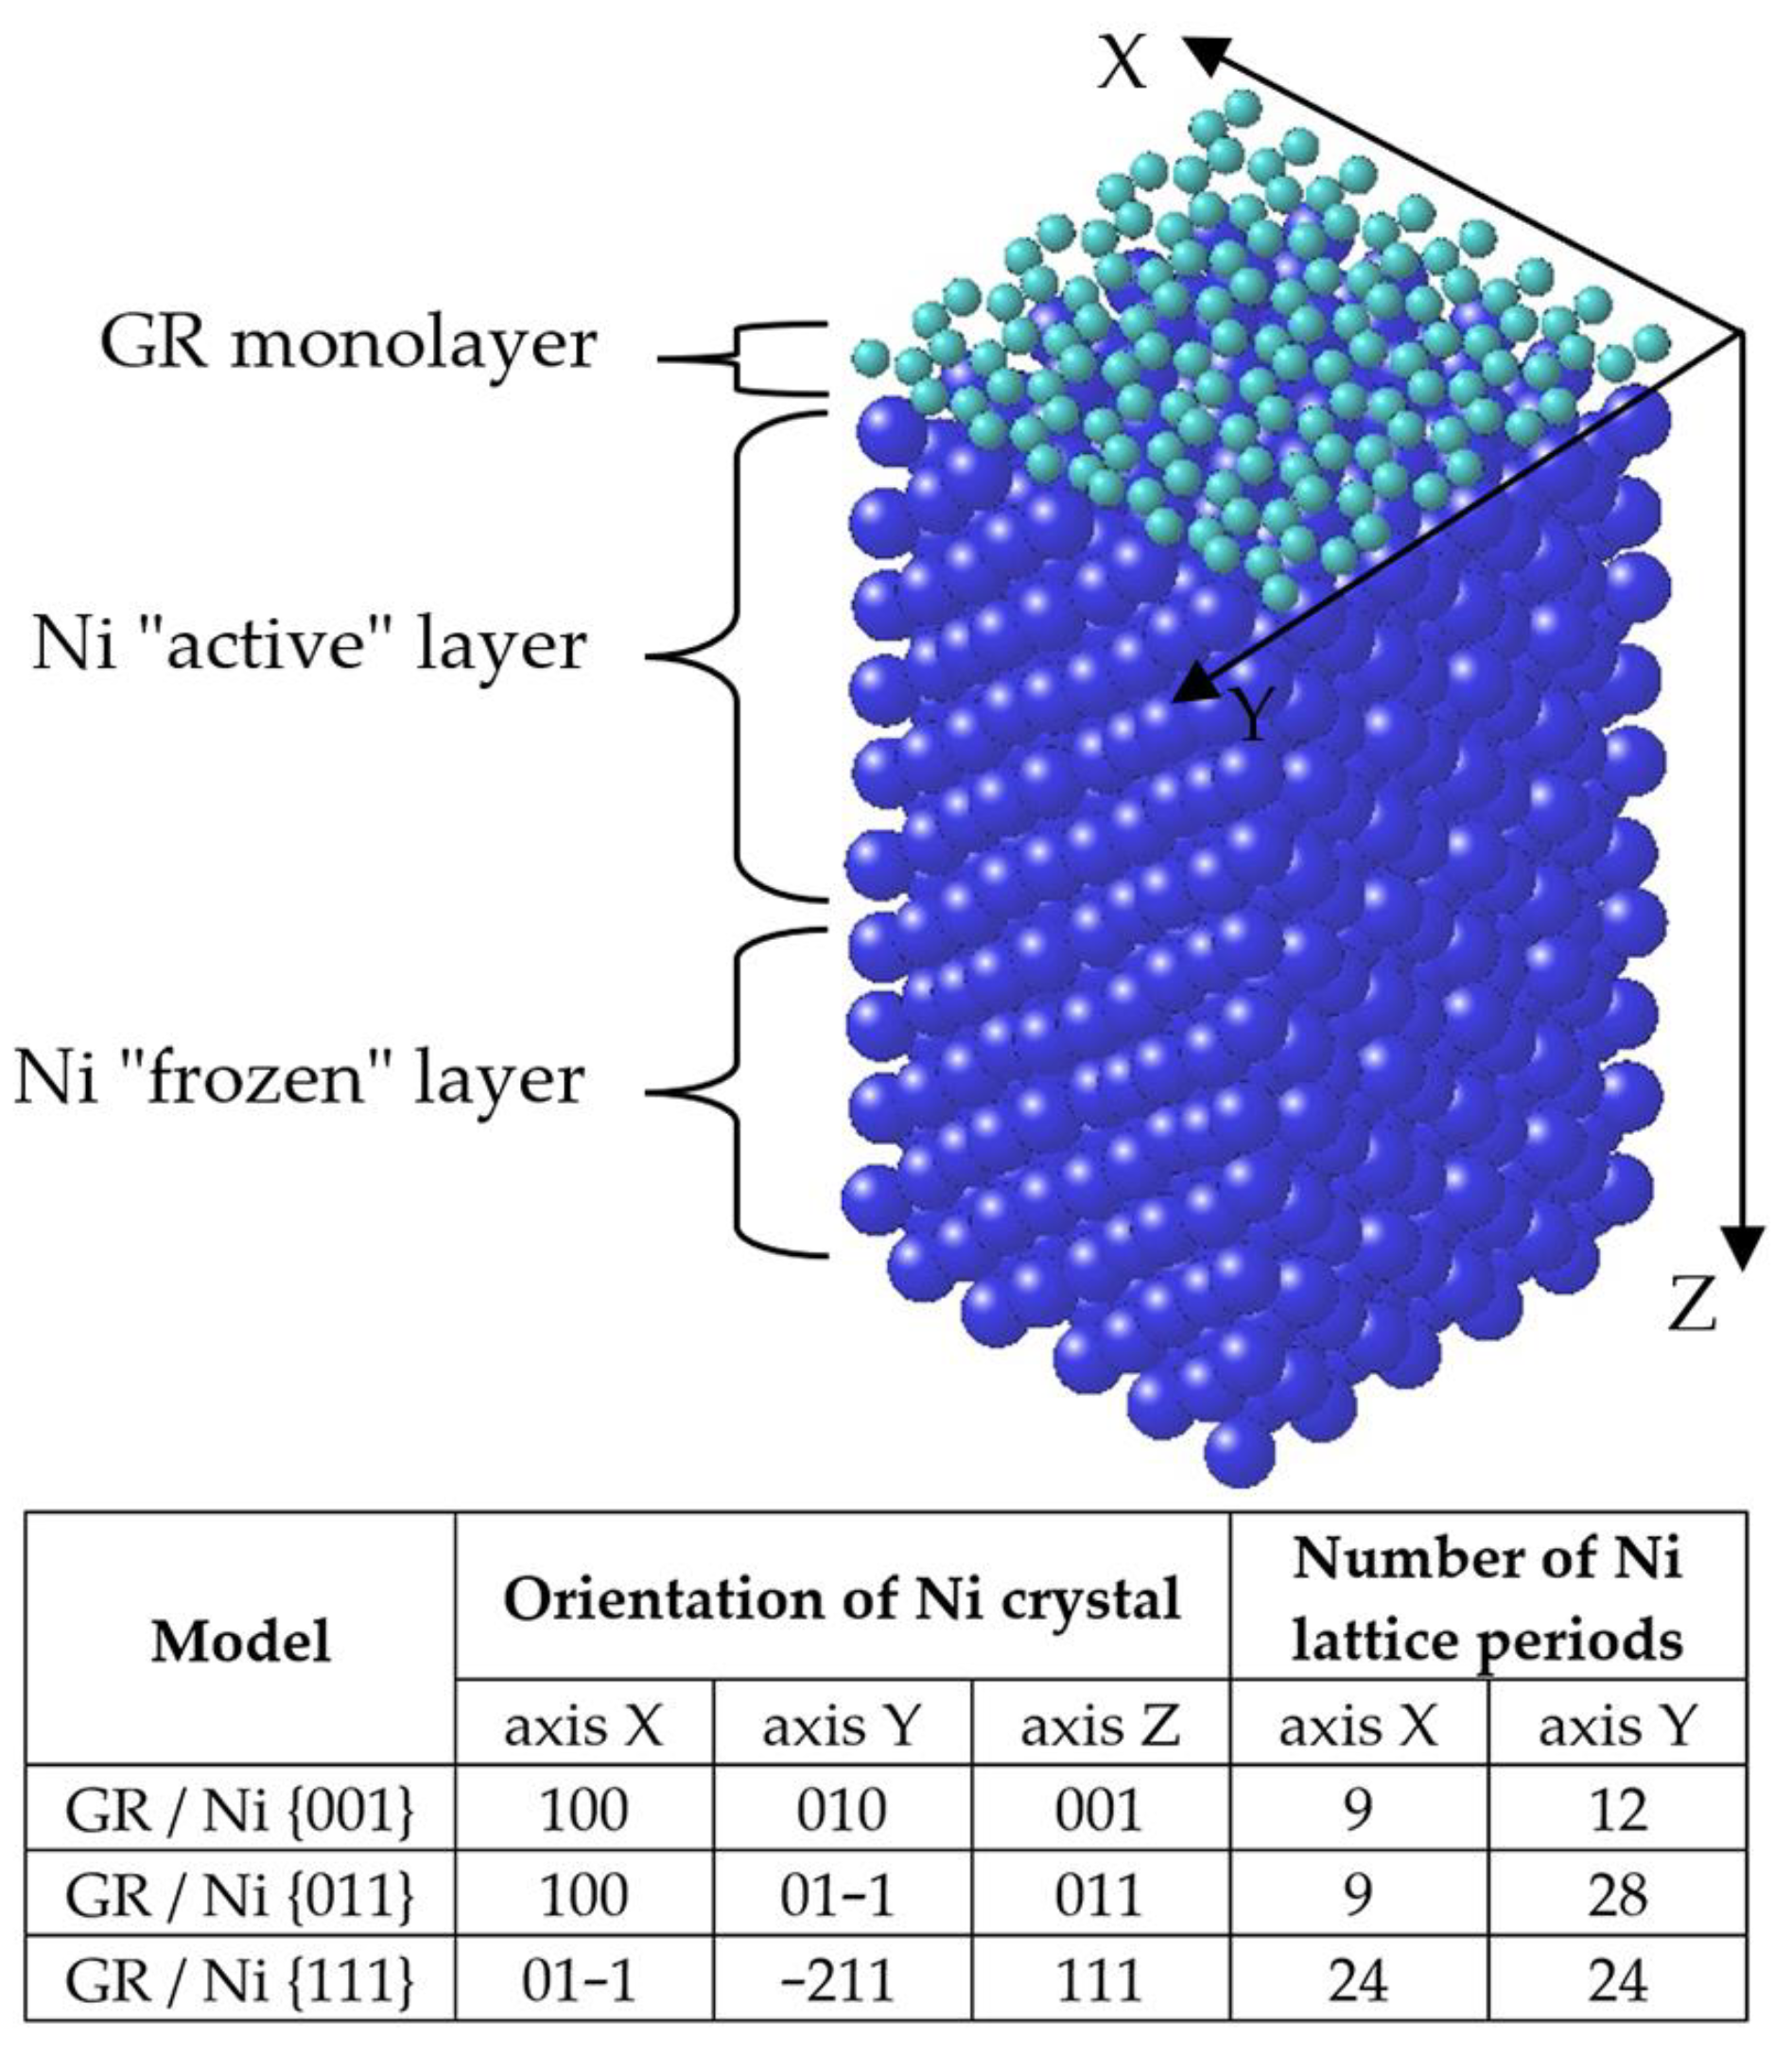
2. Simulation Procedure
3. Results
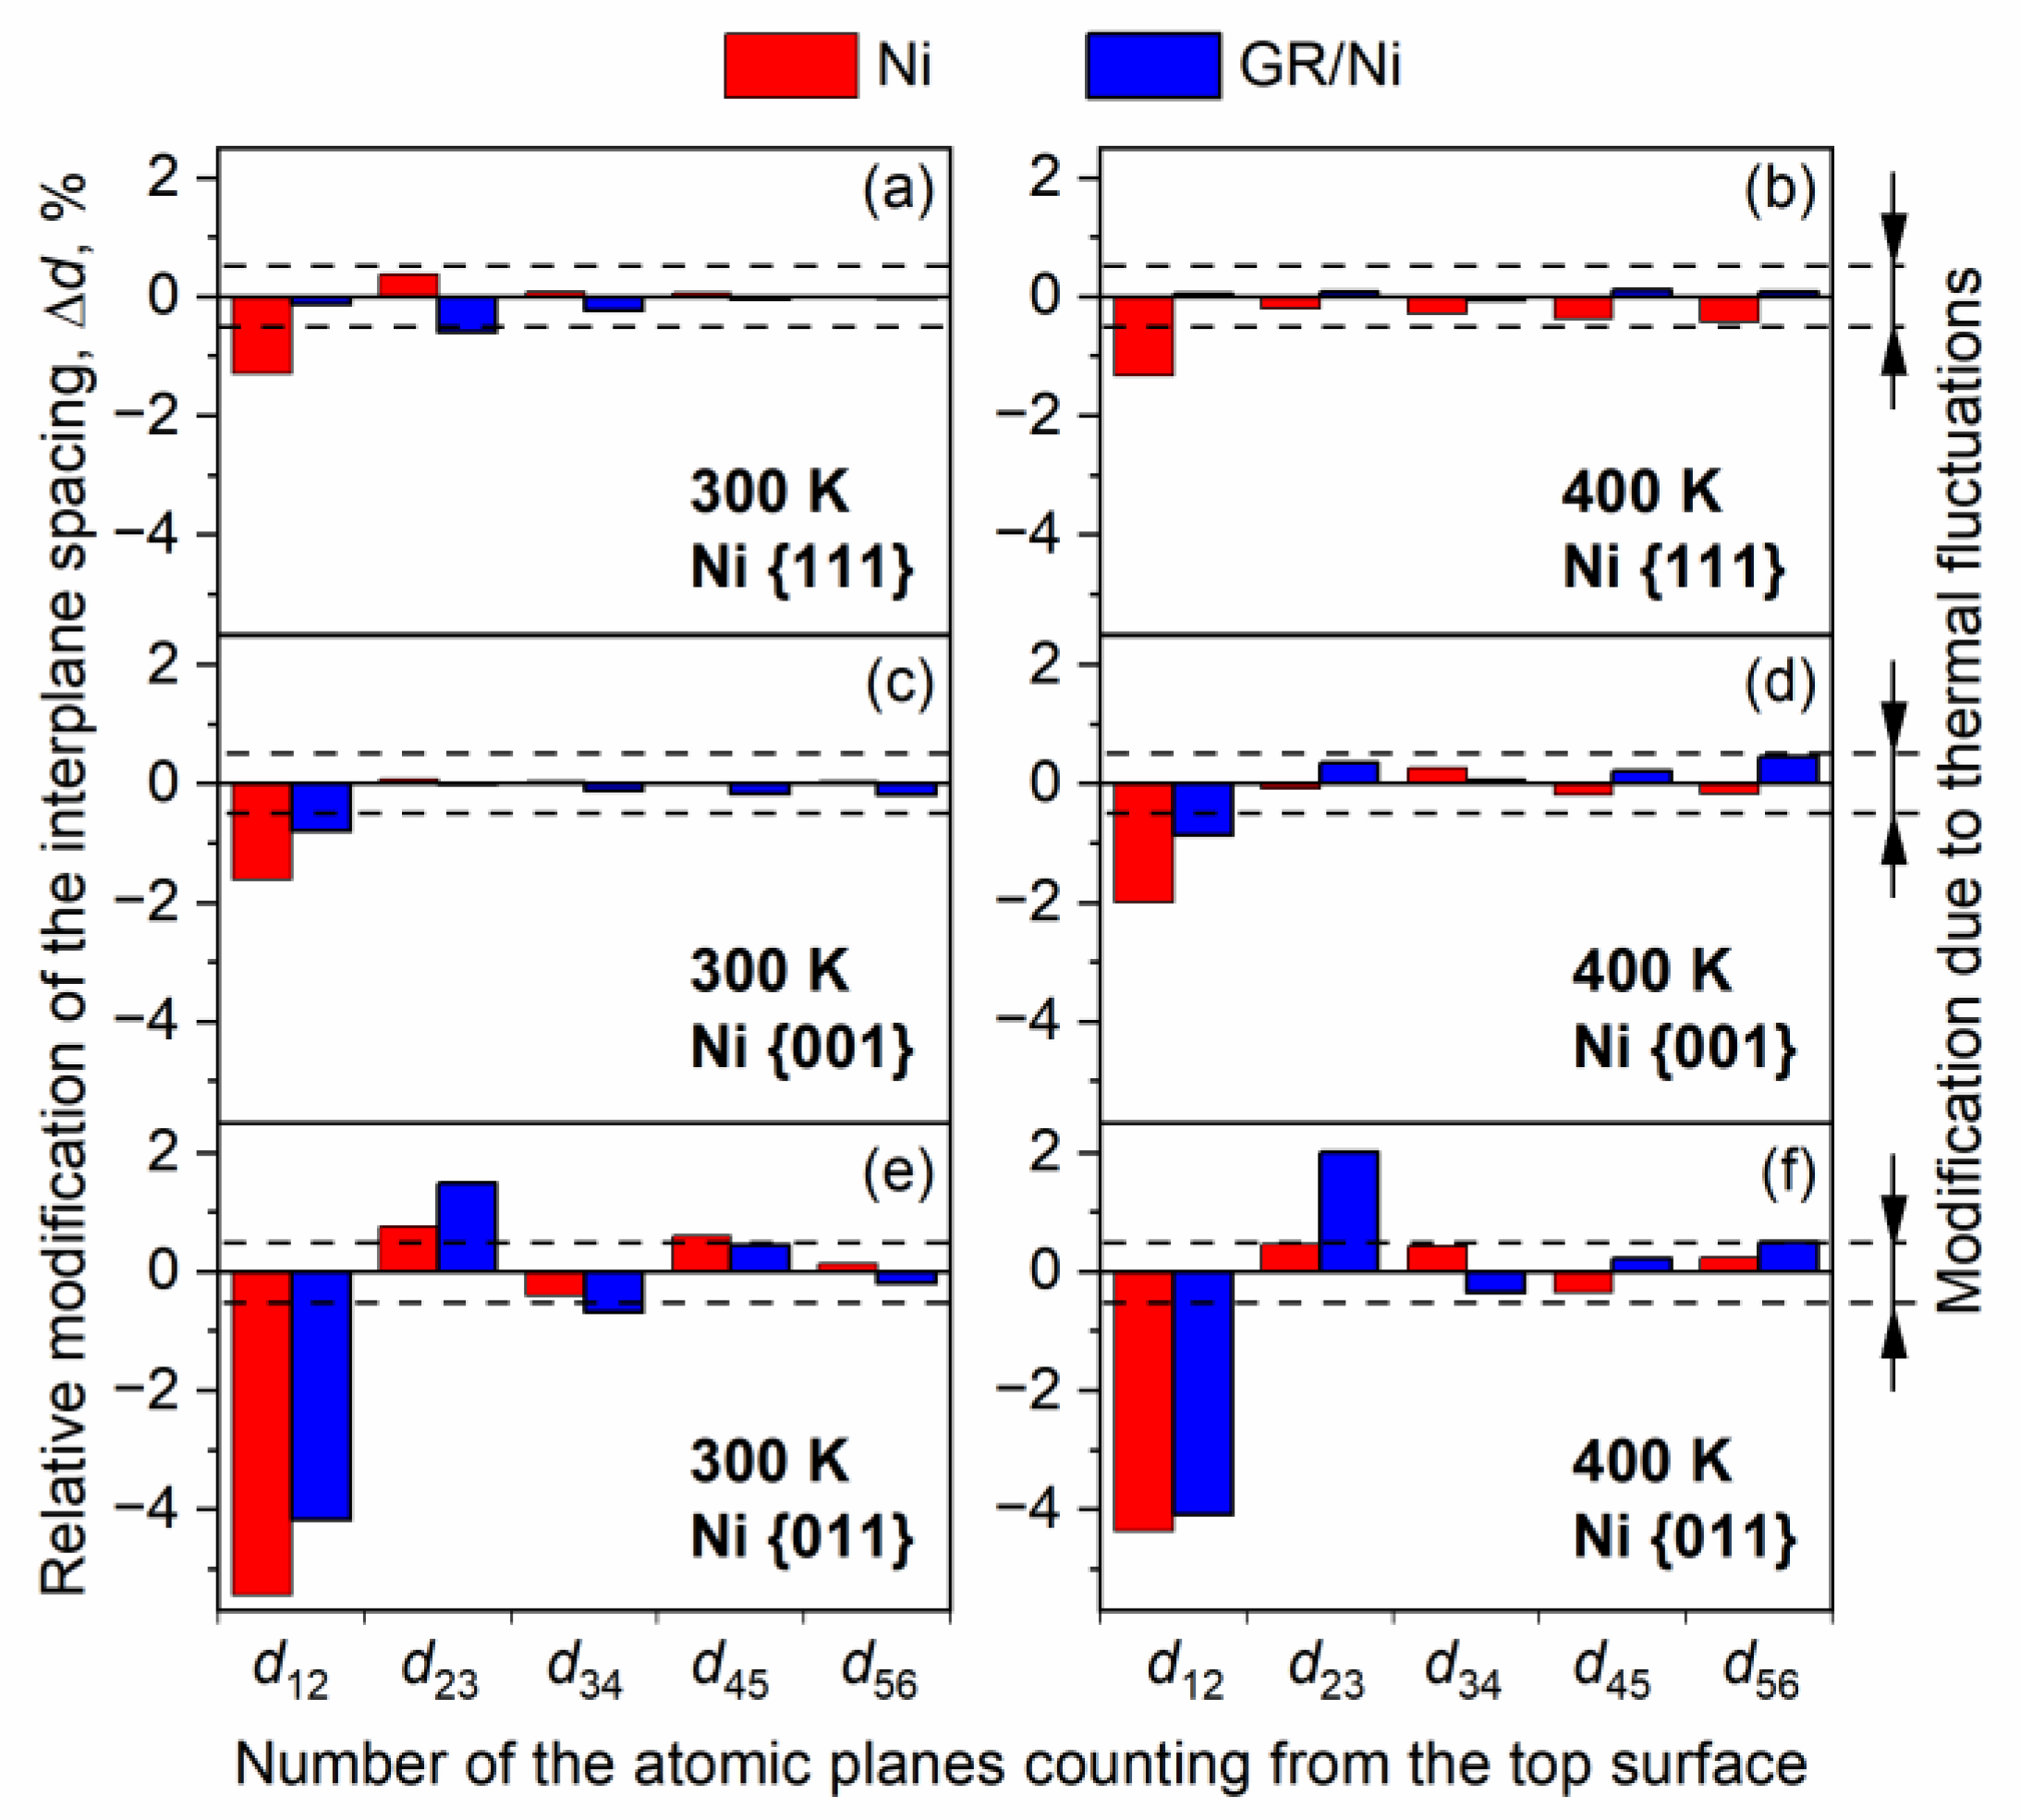
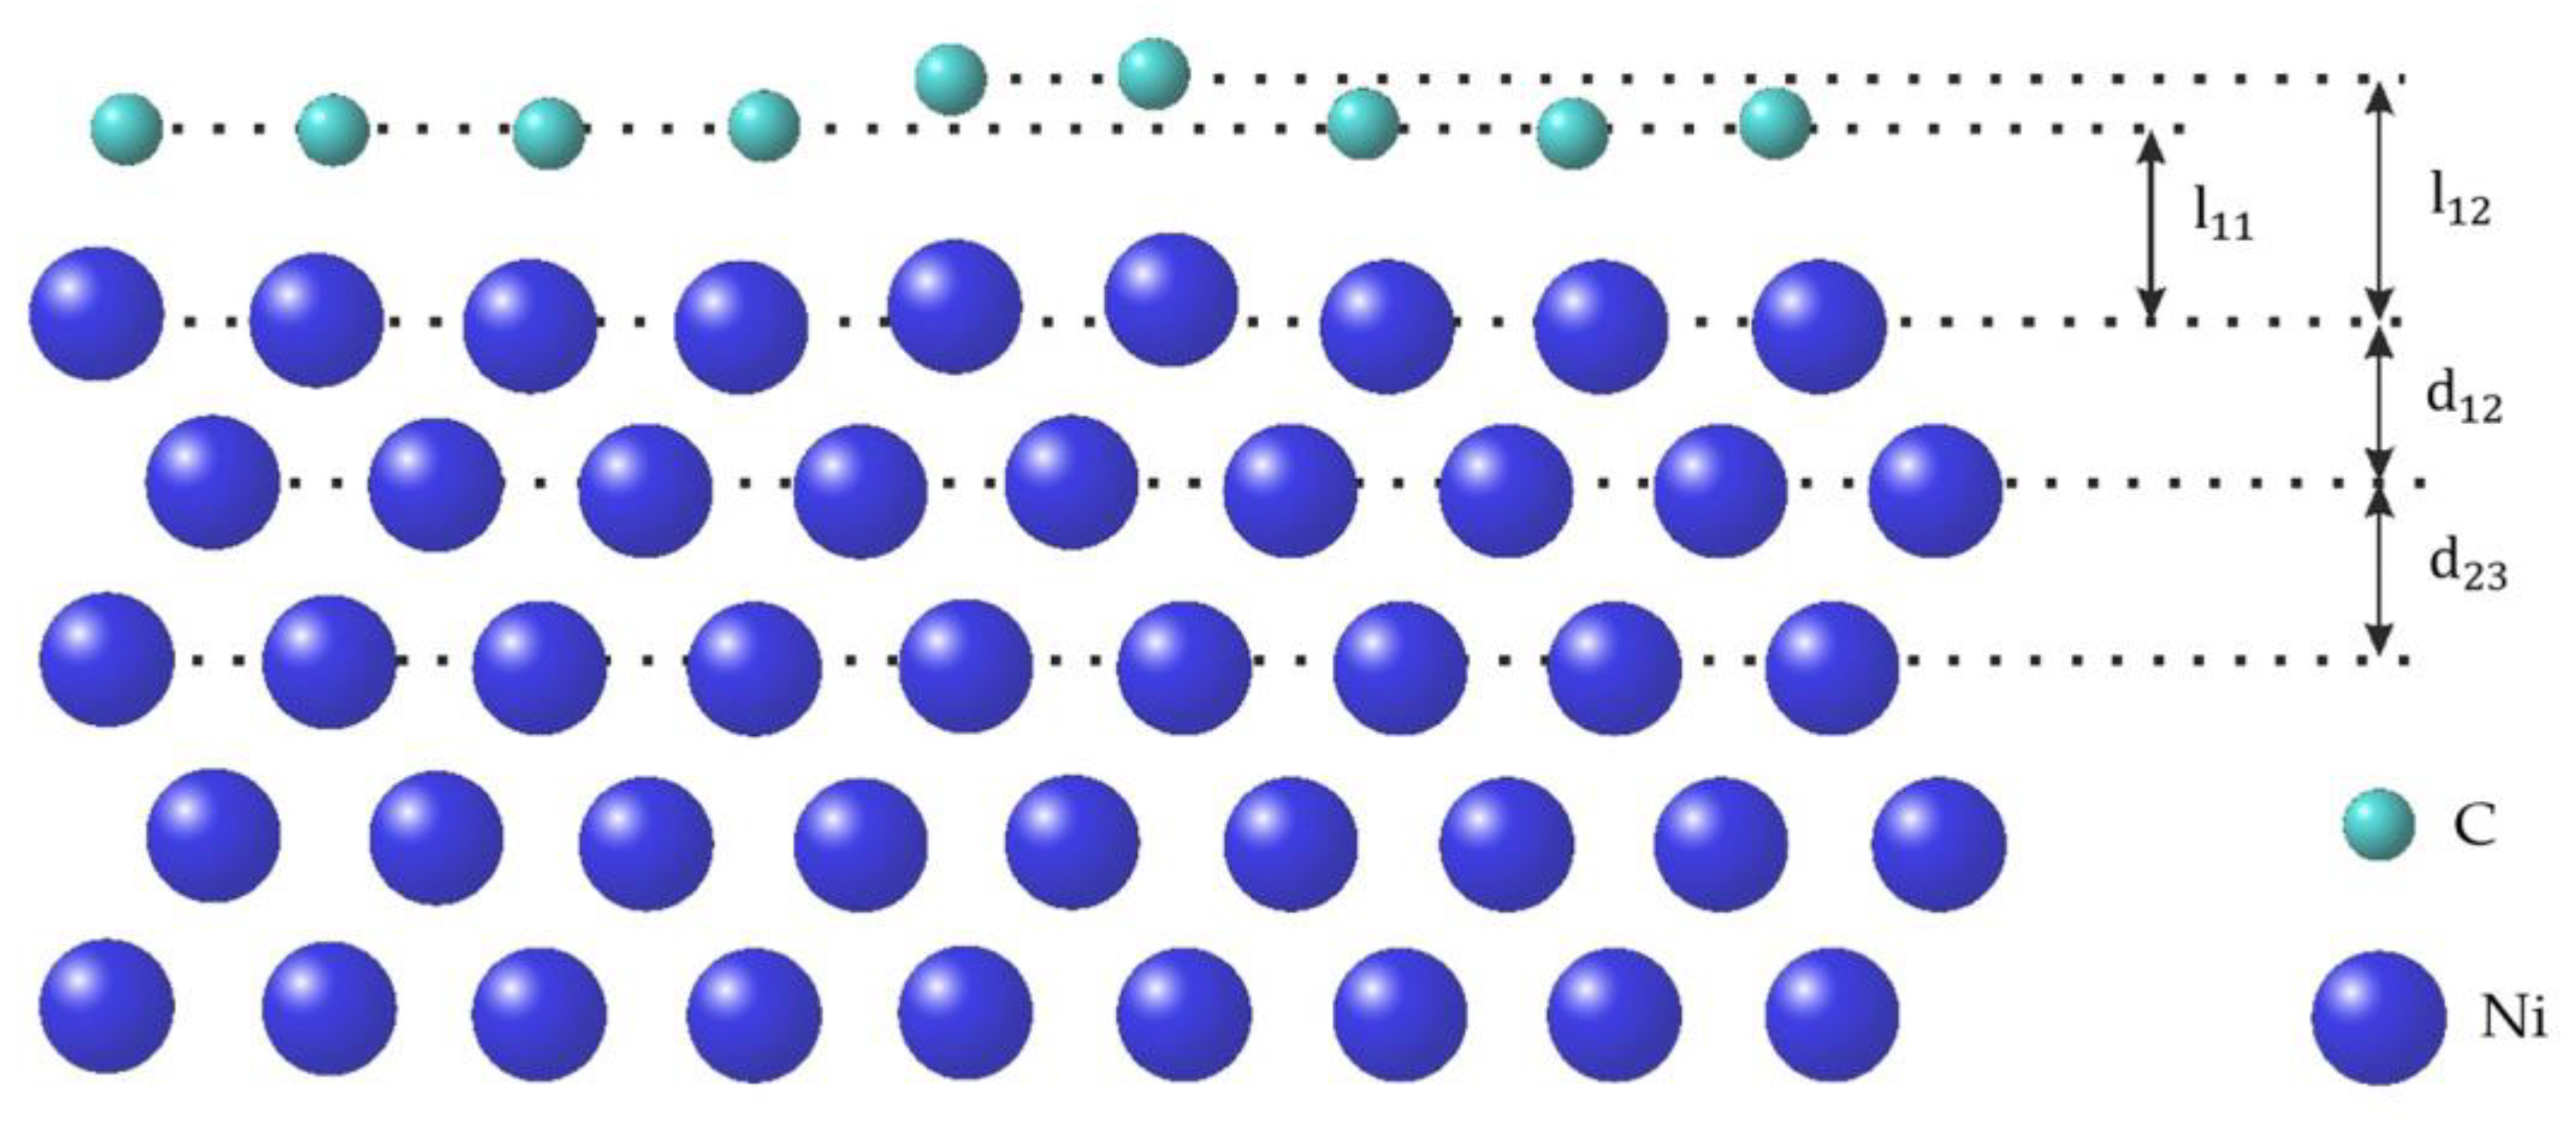
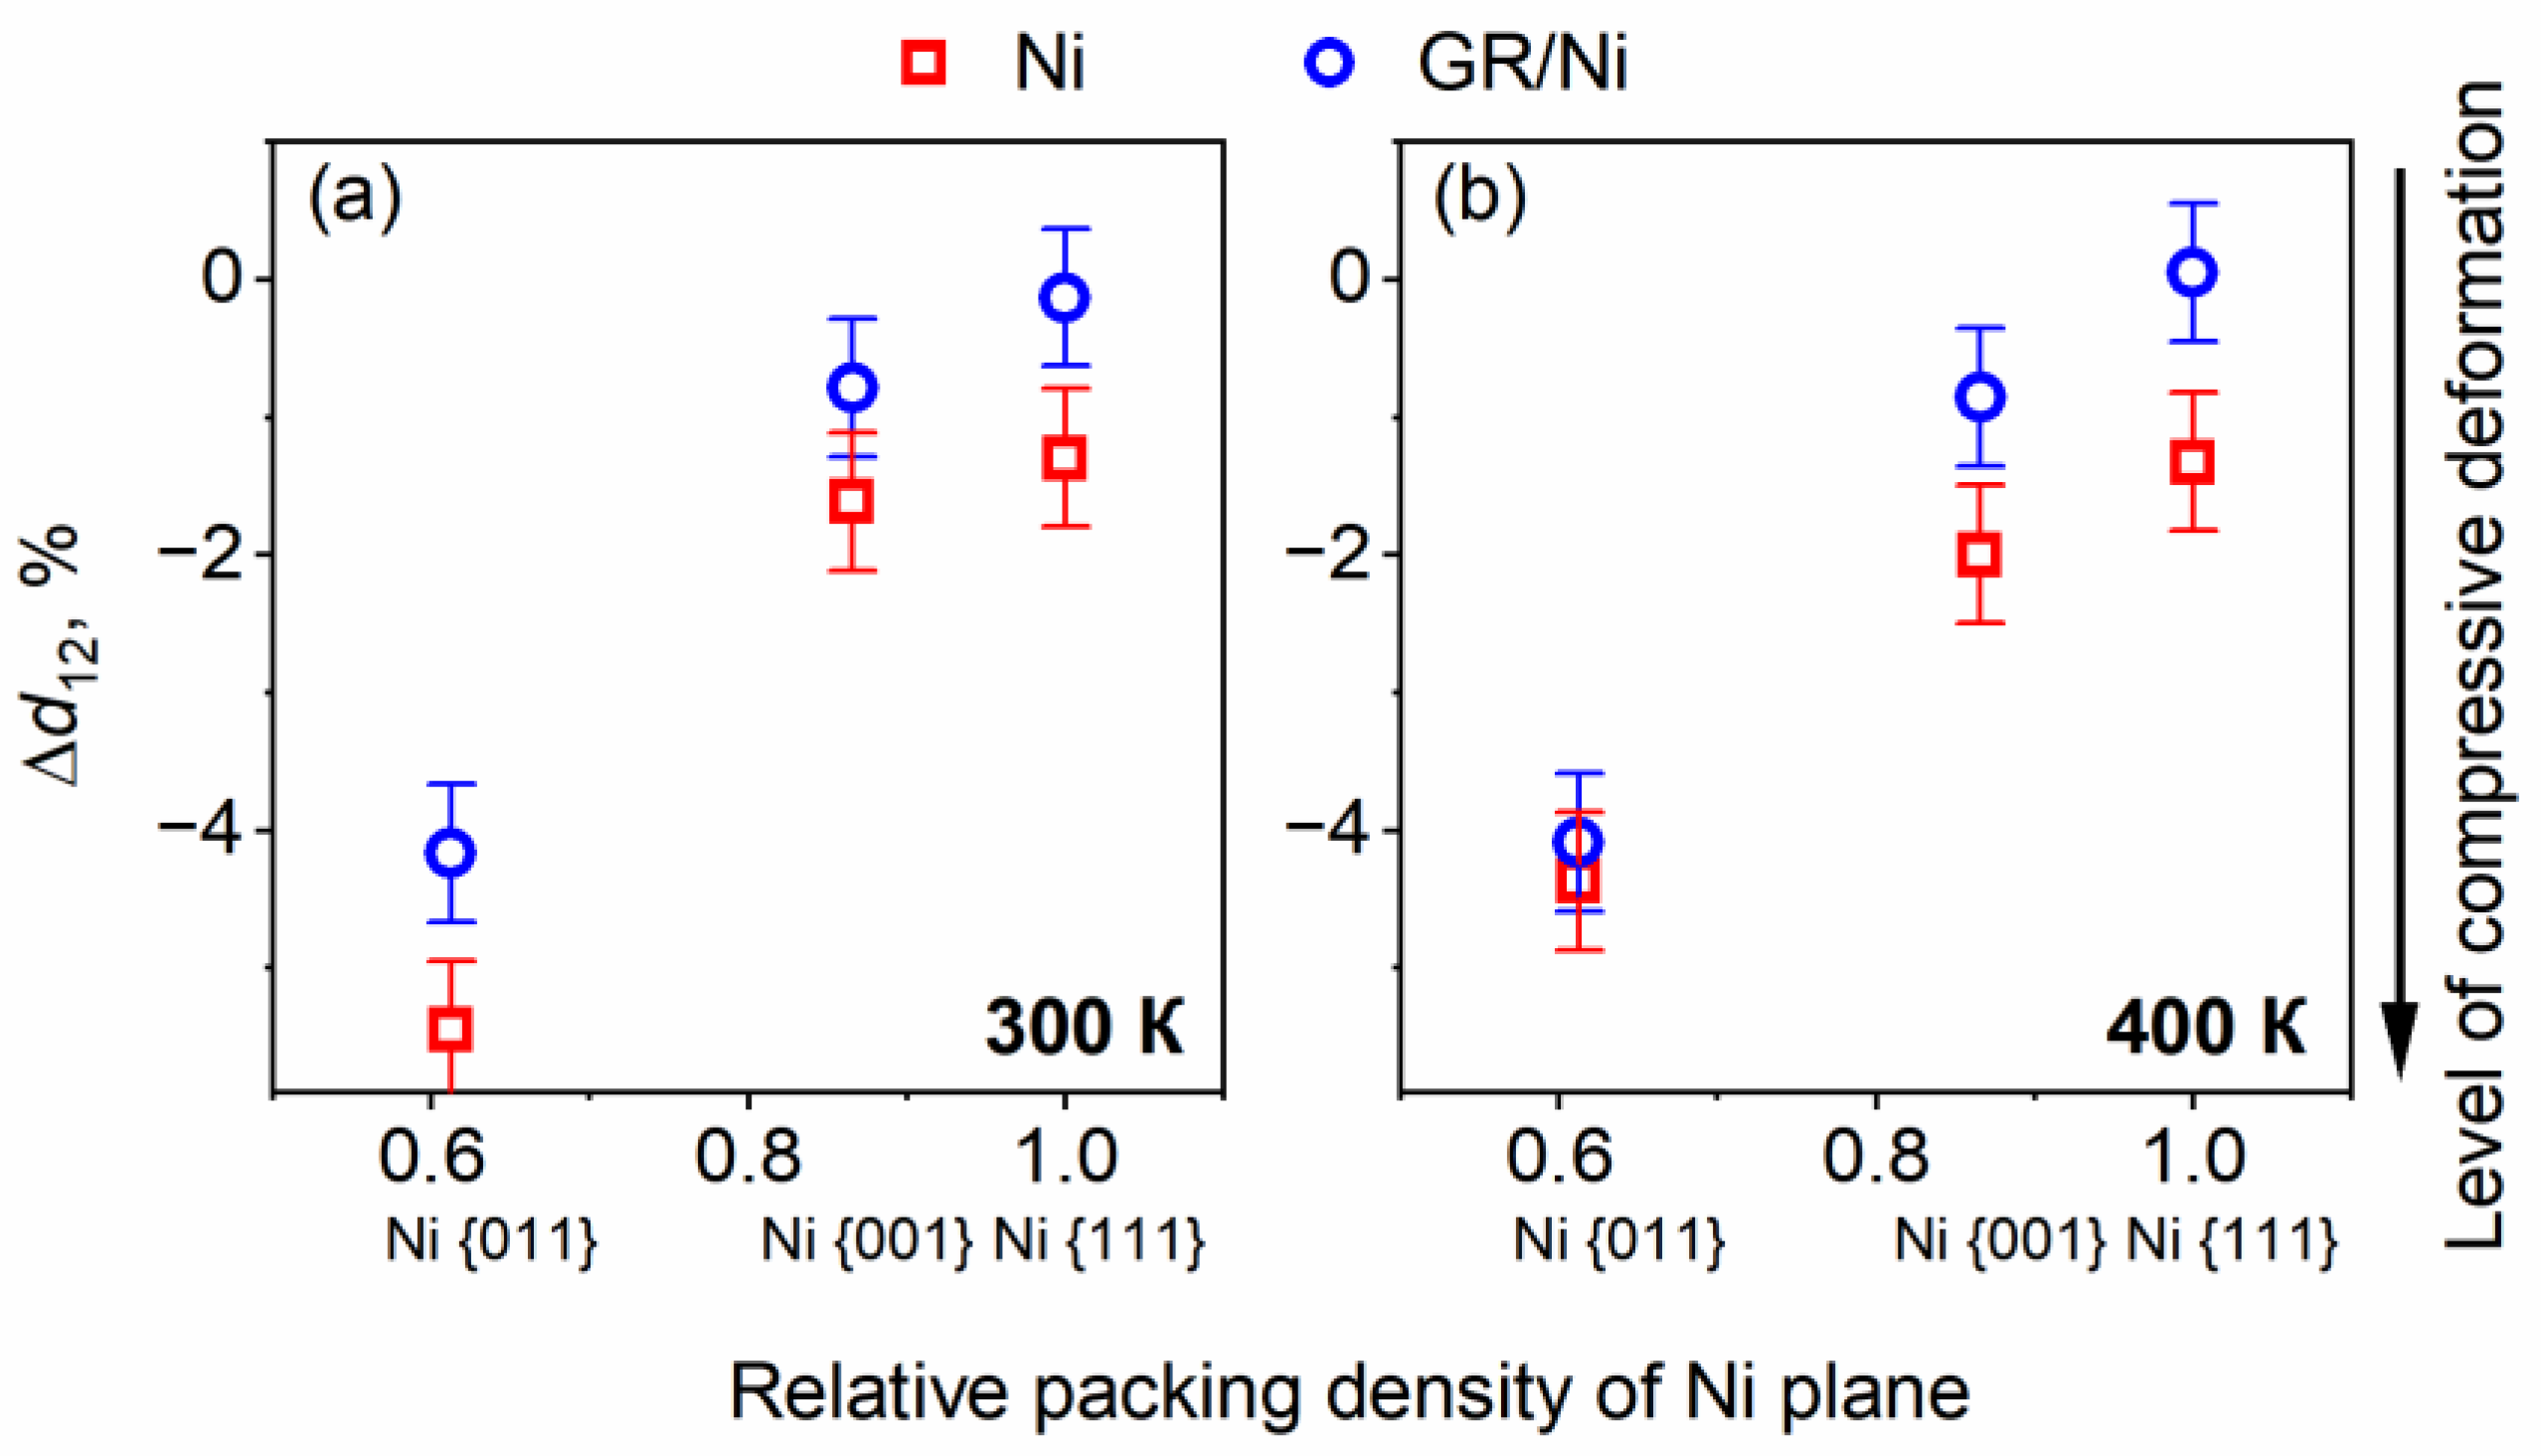
3.1. Surface Relaxation of Ni of Various Orientations with and without GR Layer
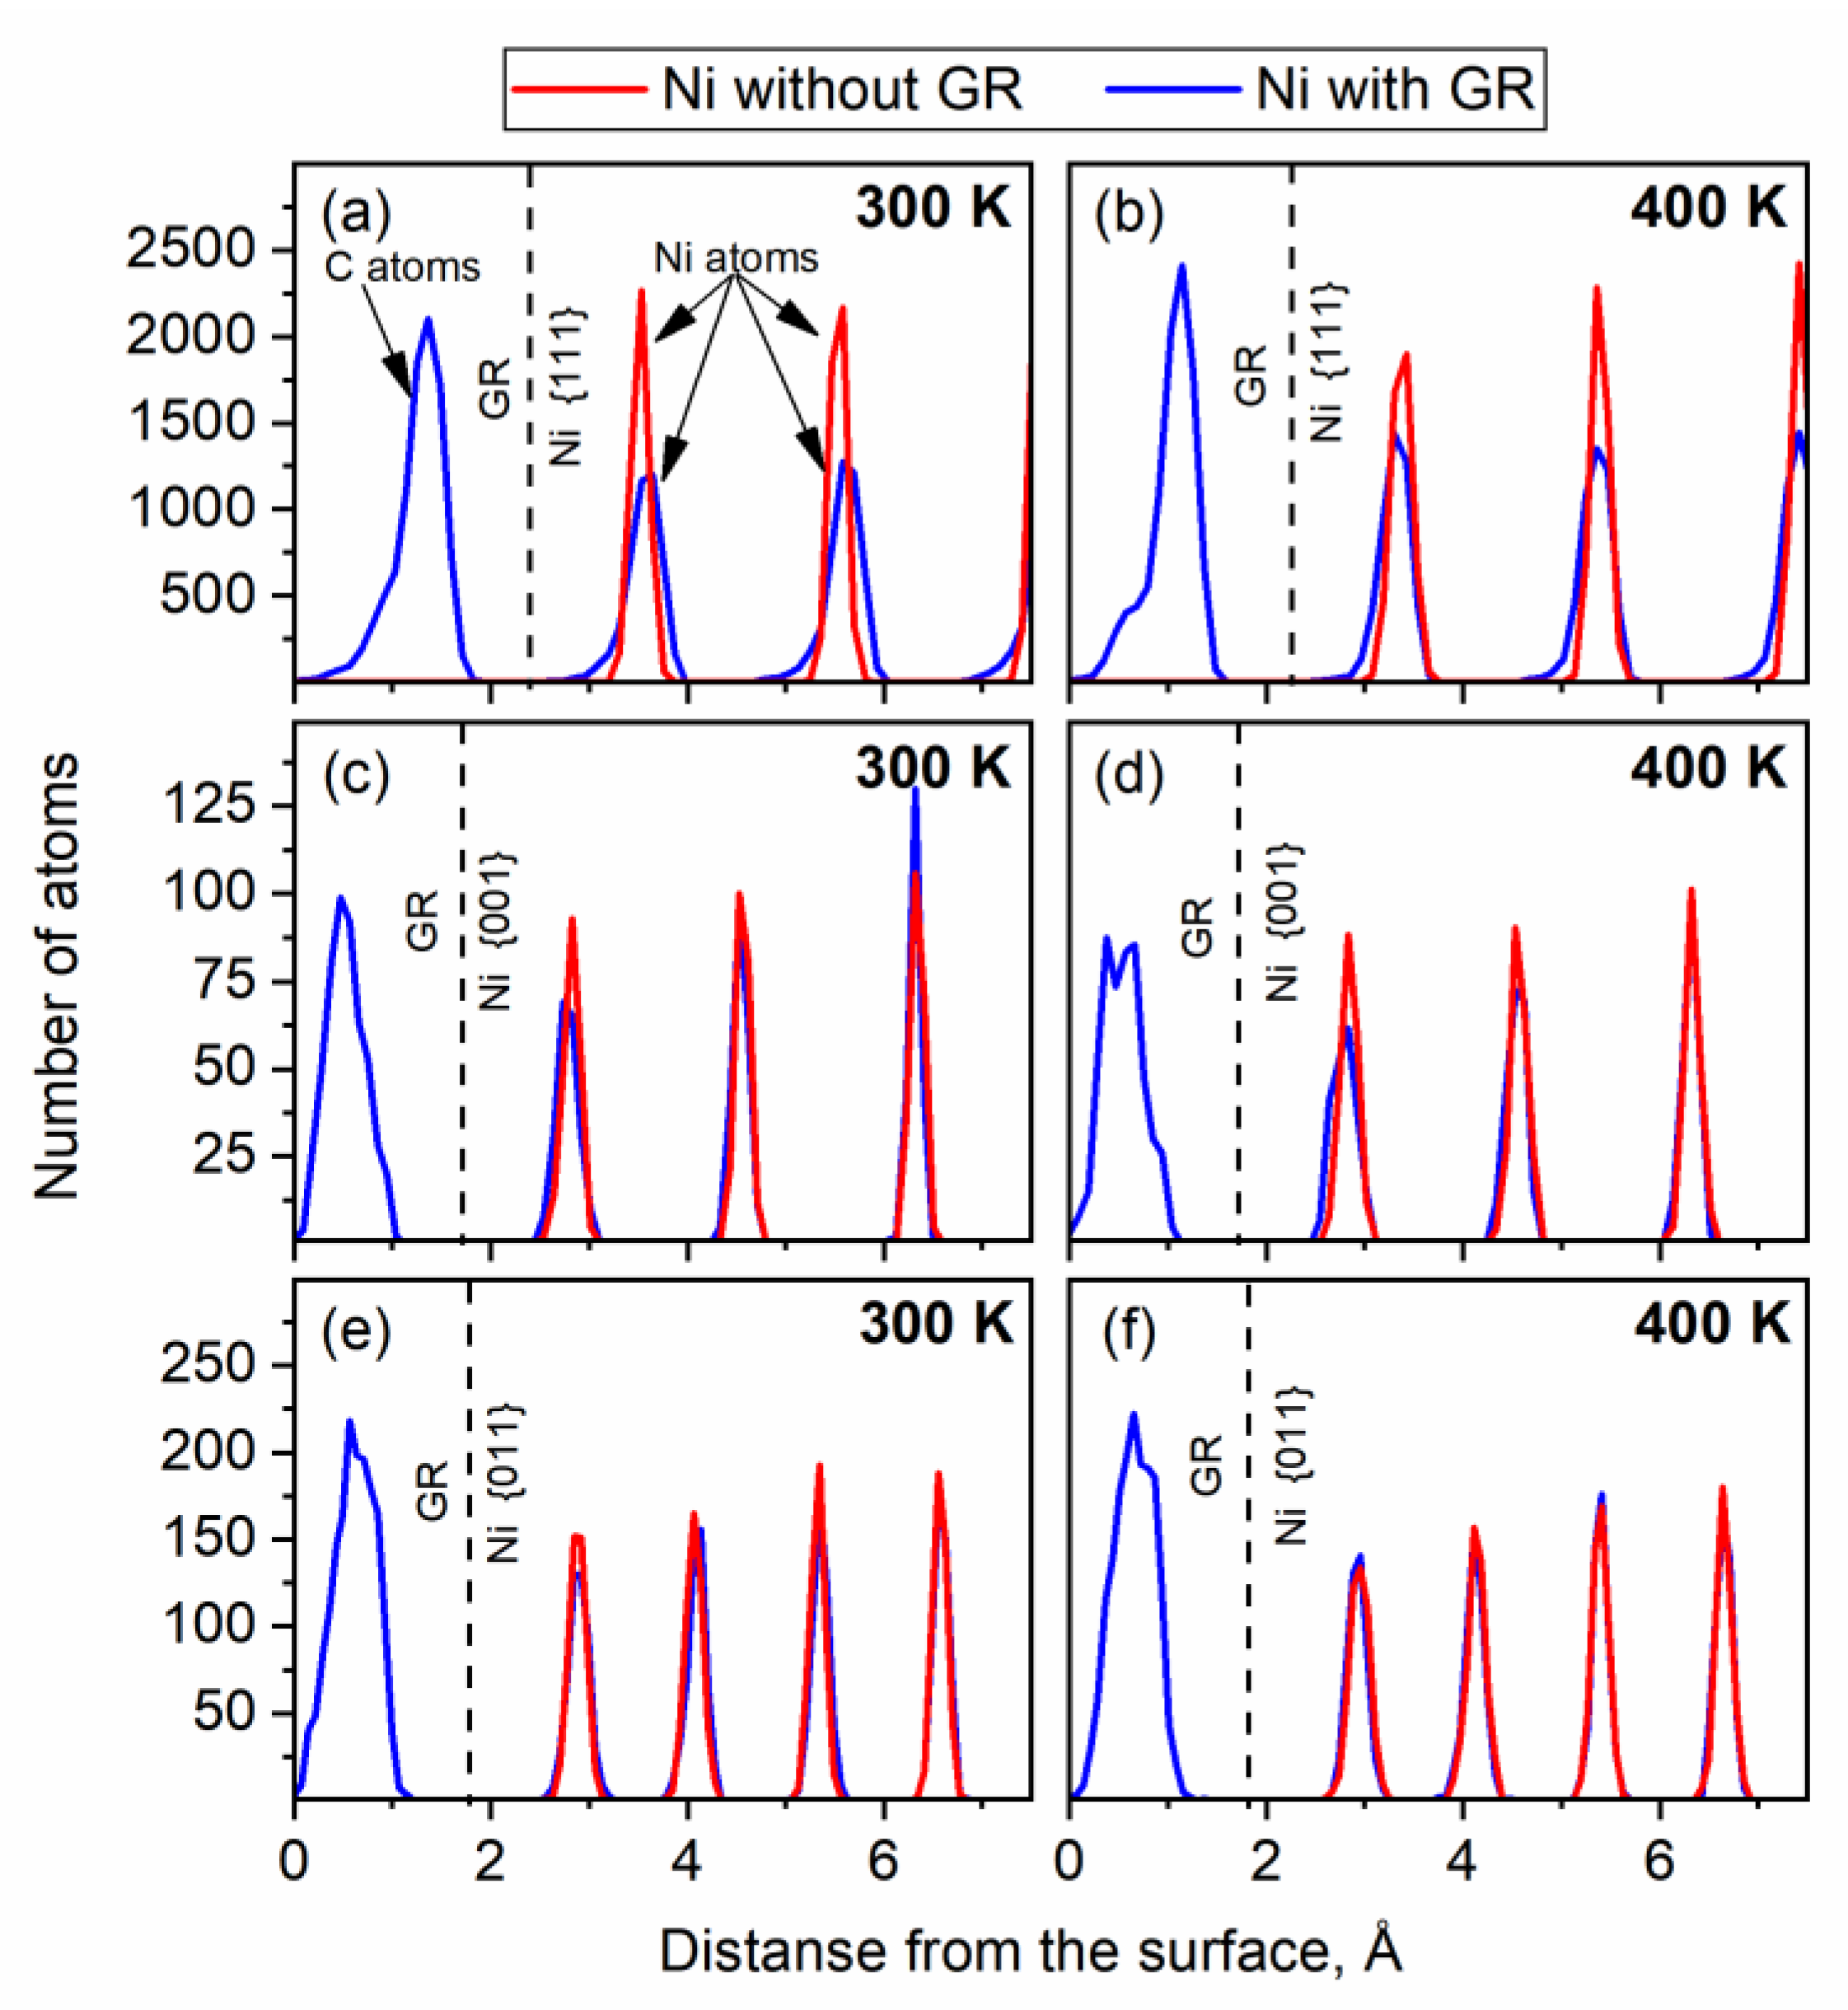
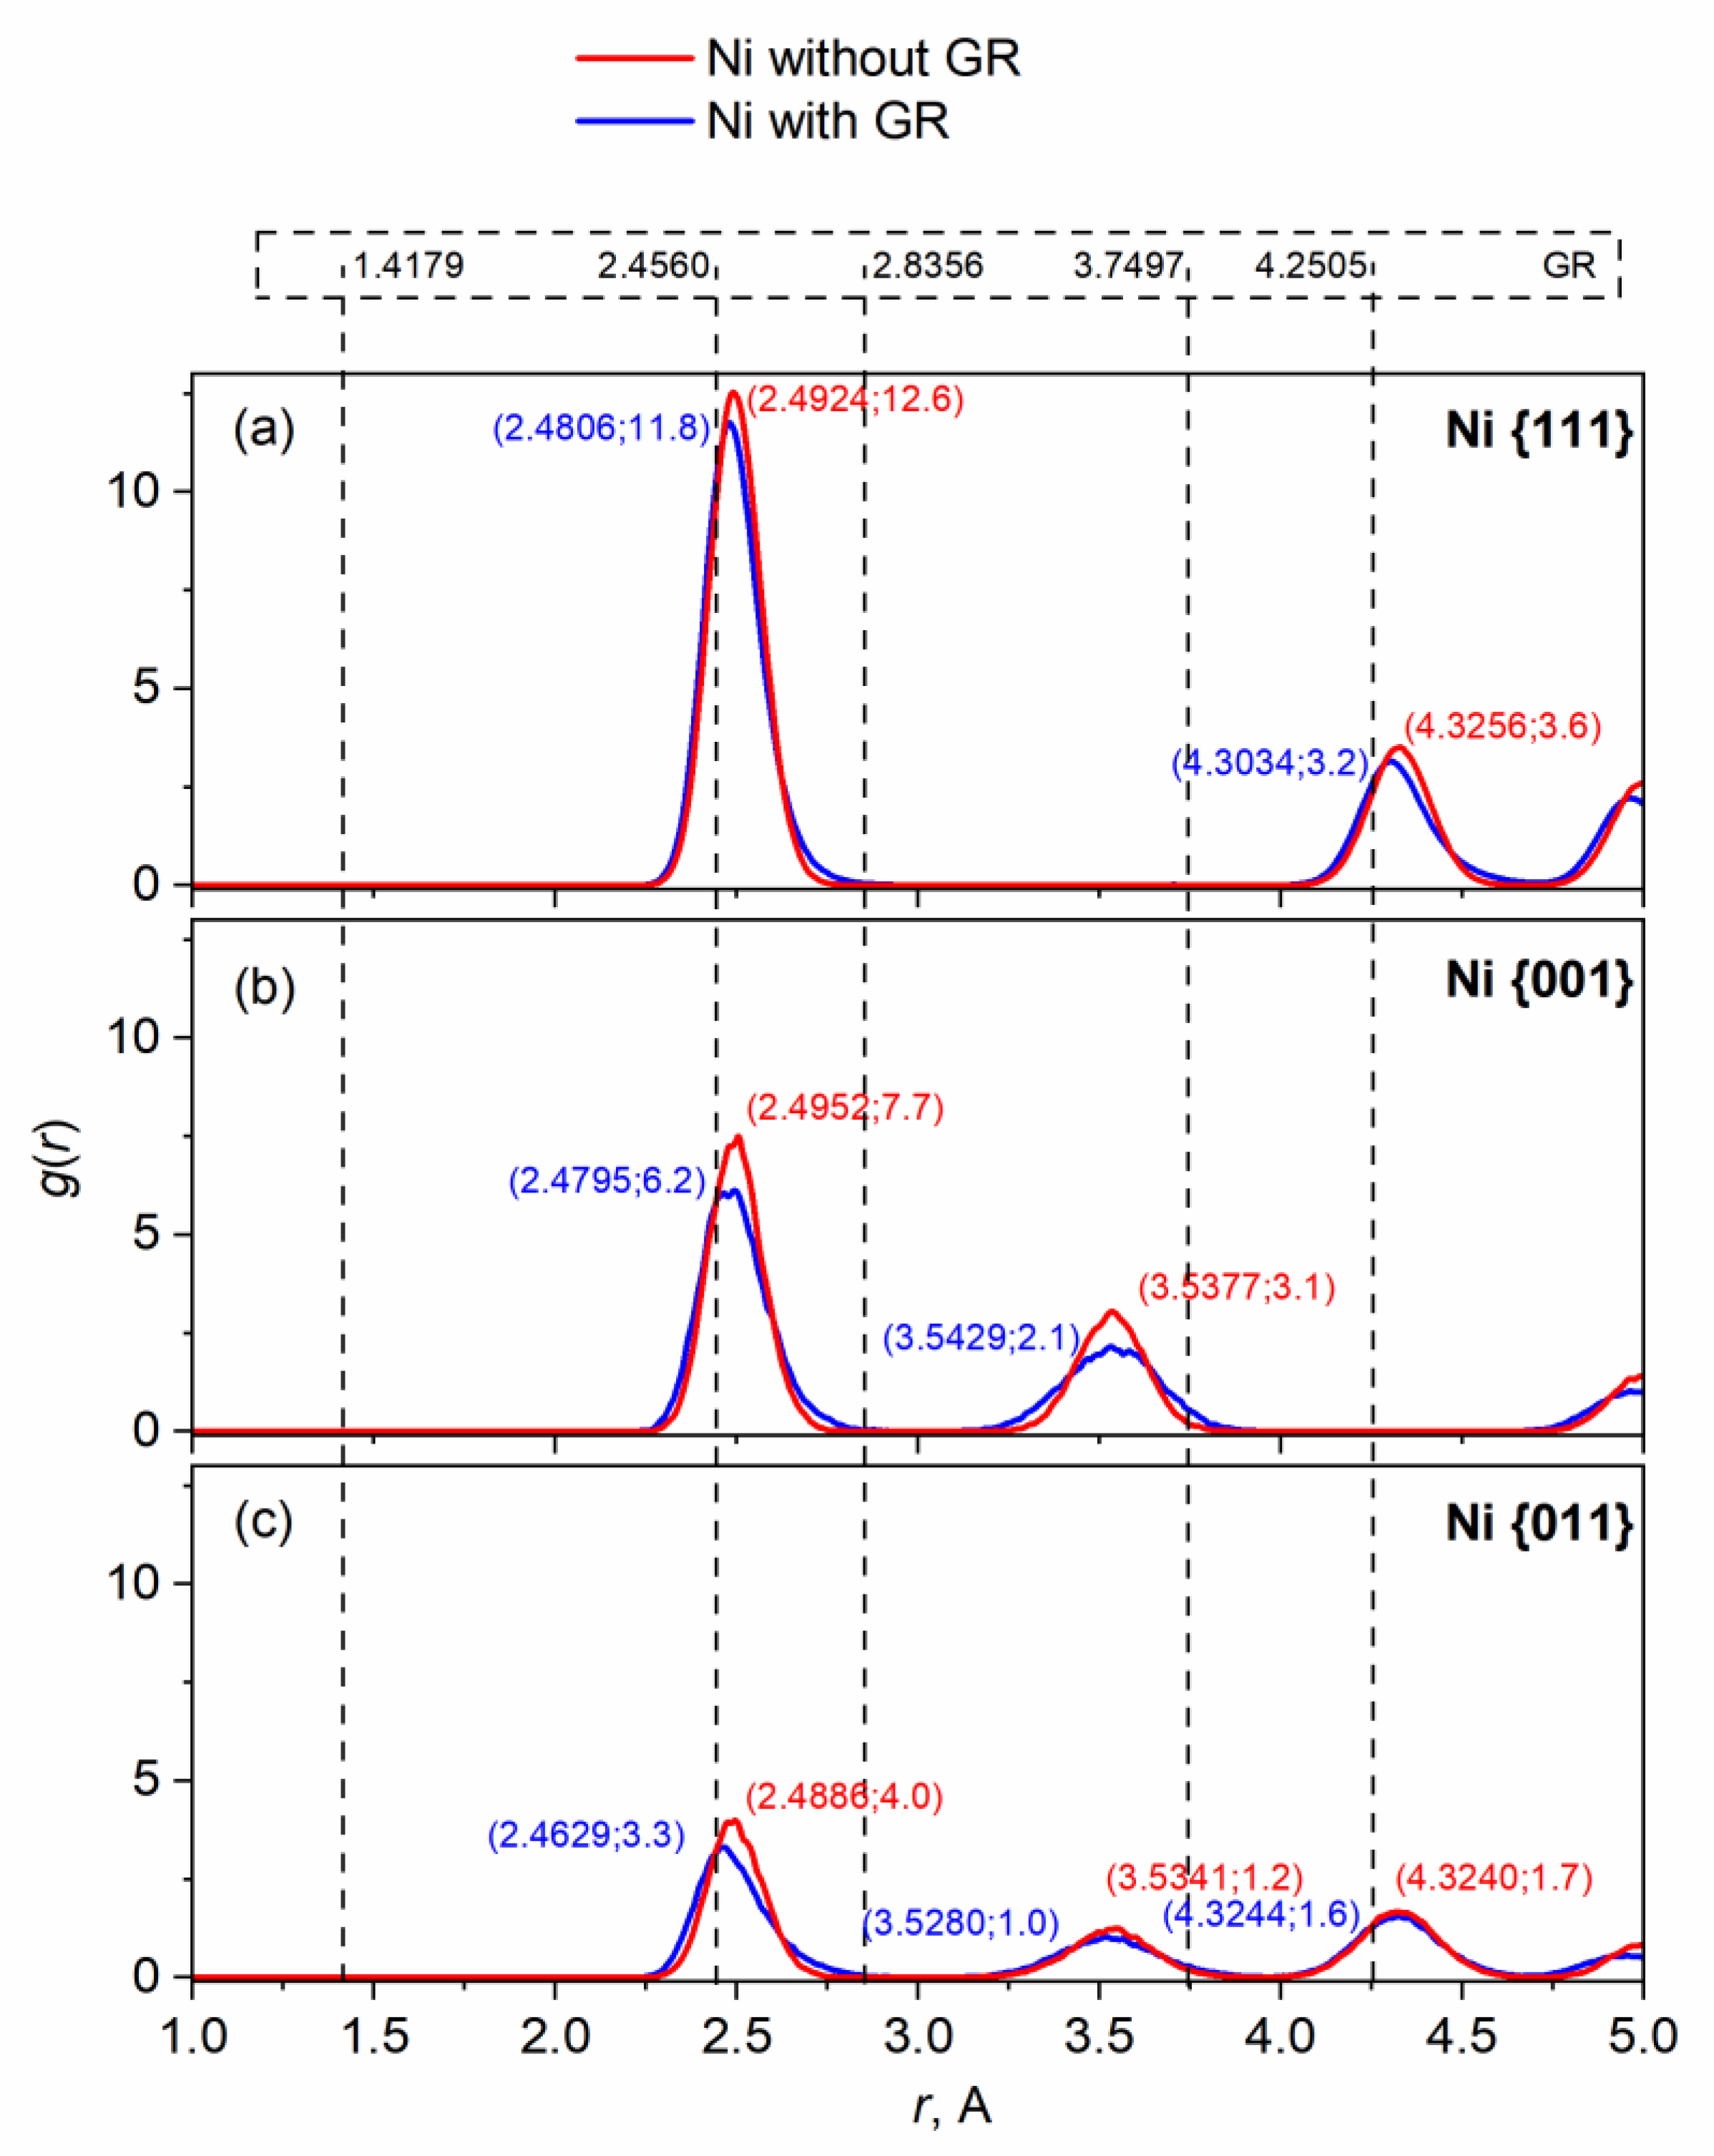
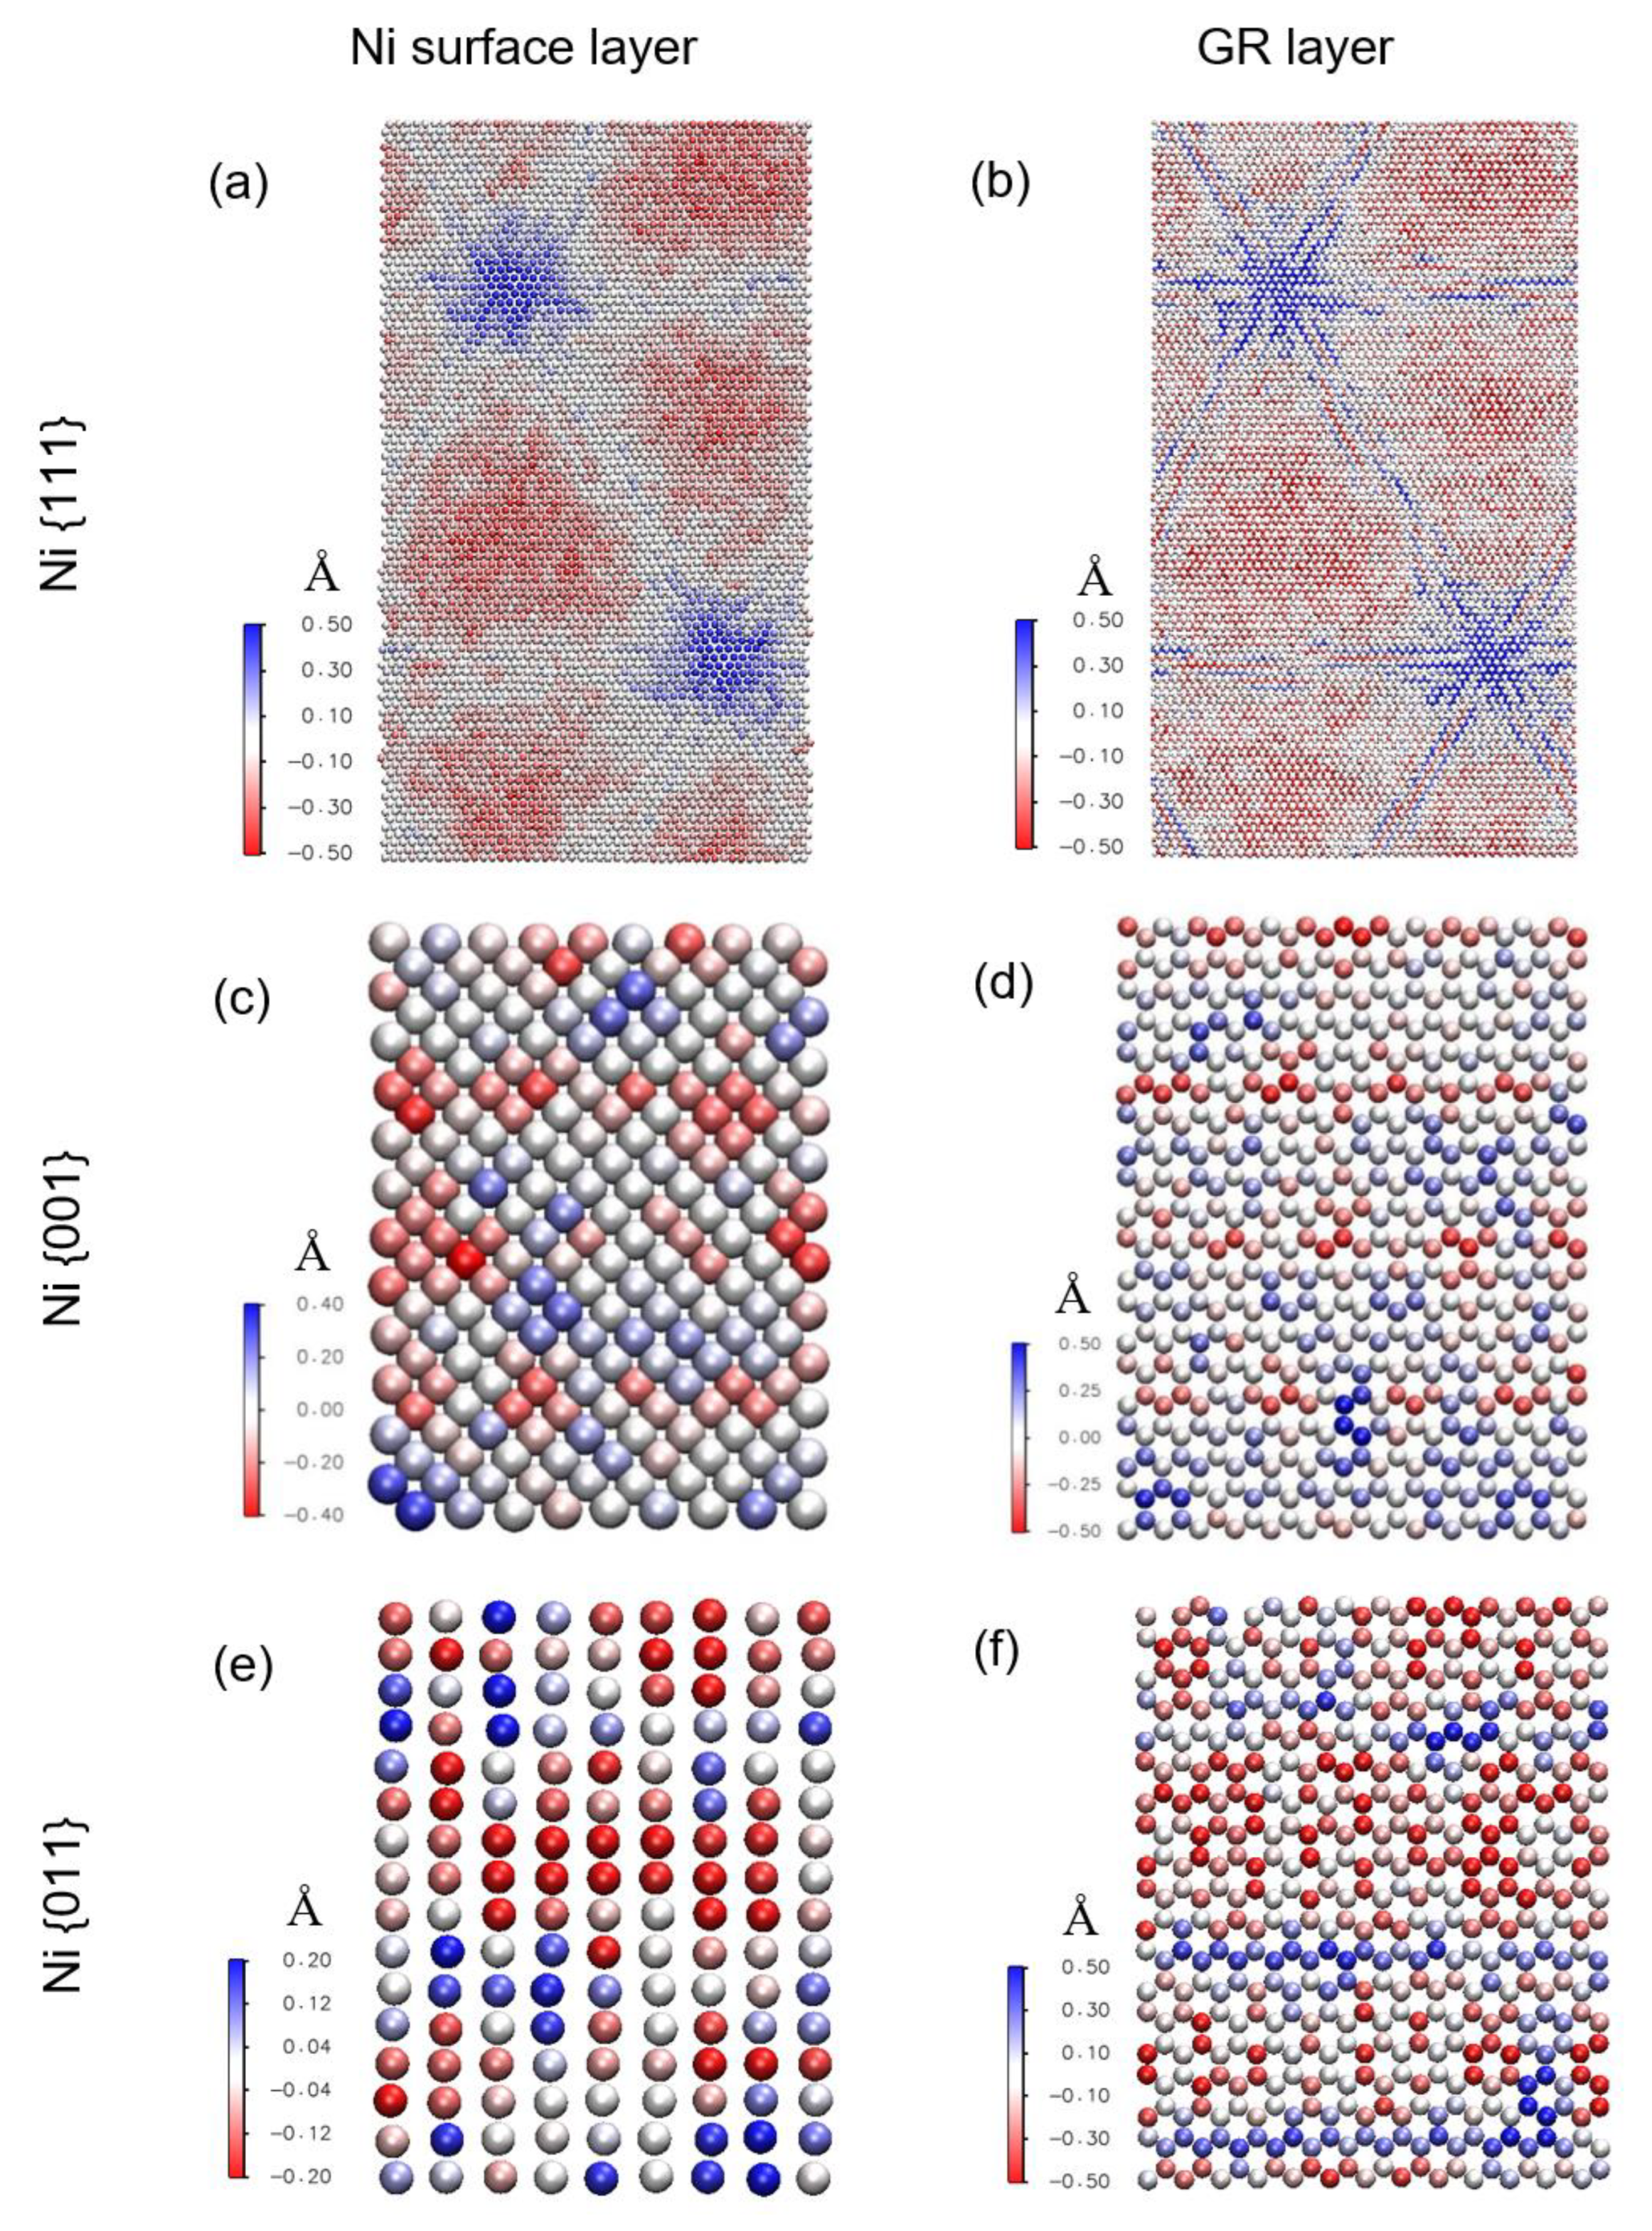
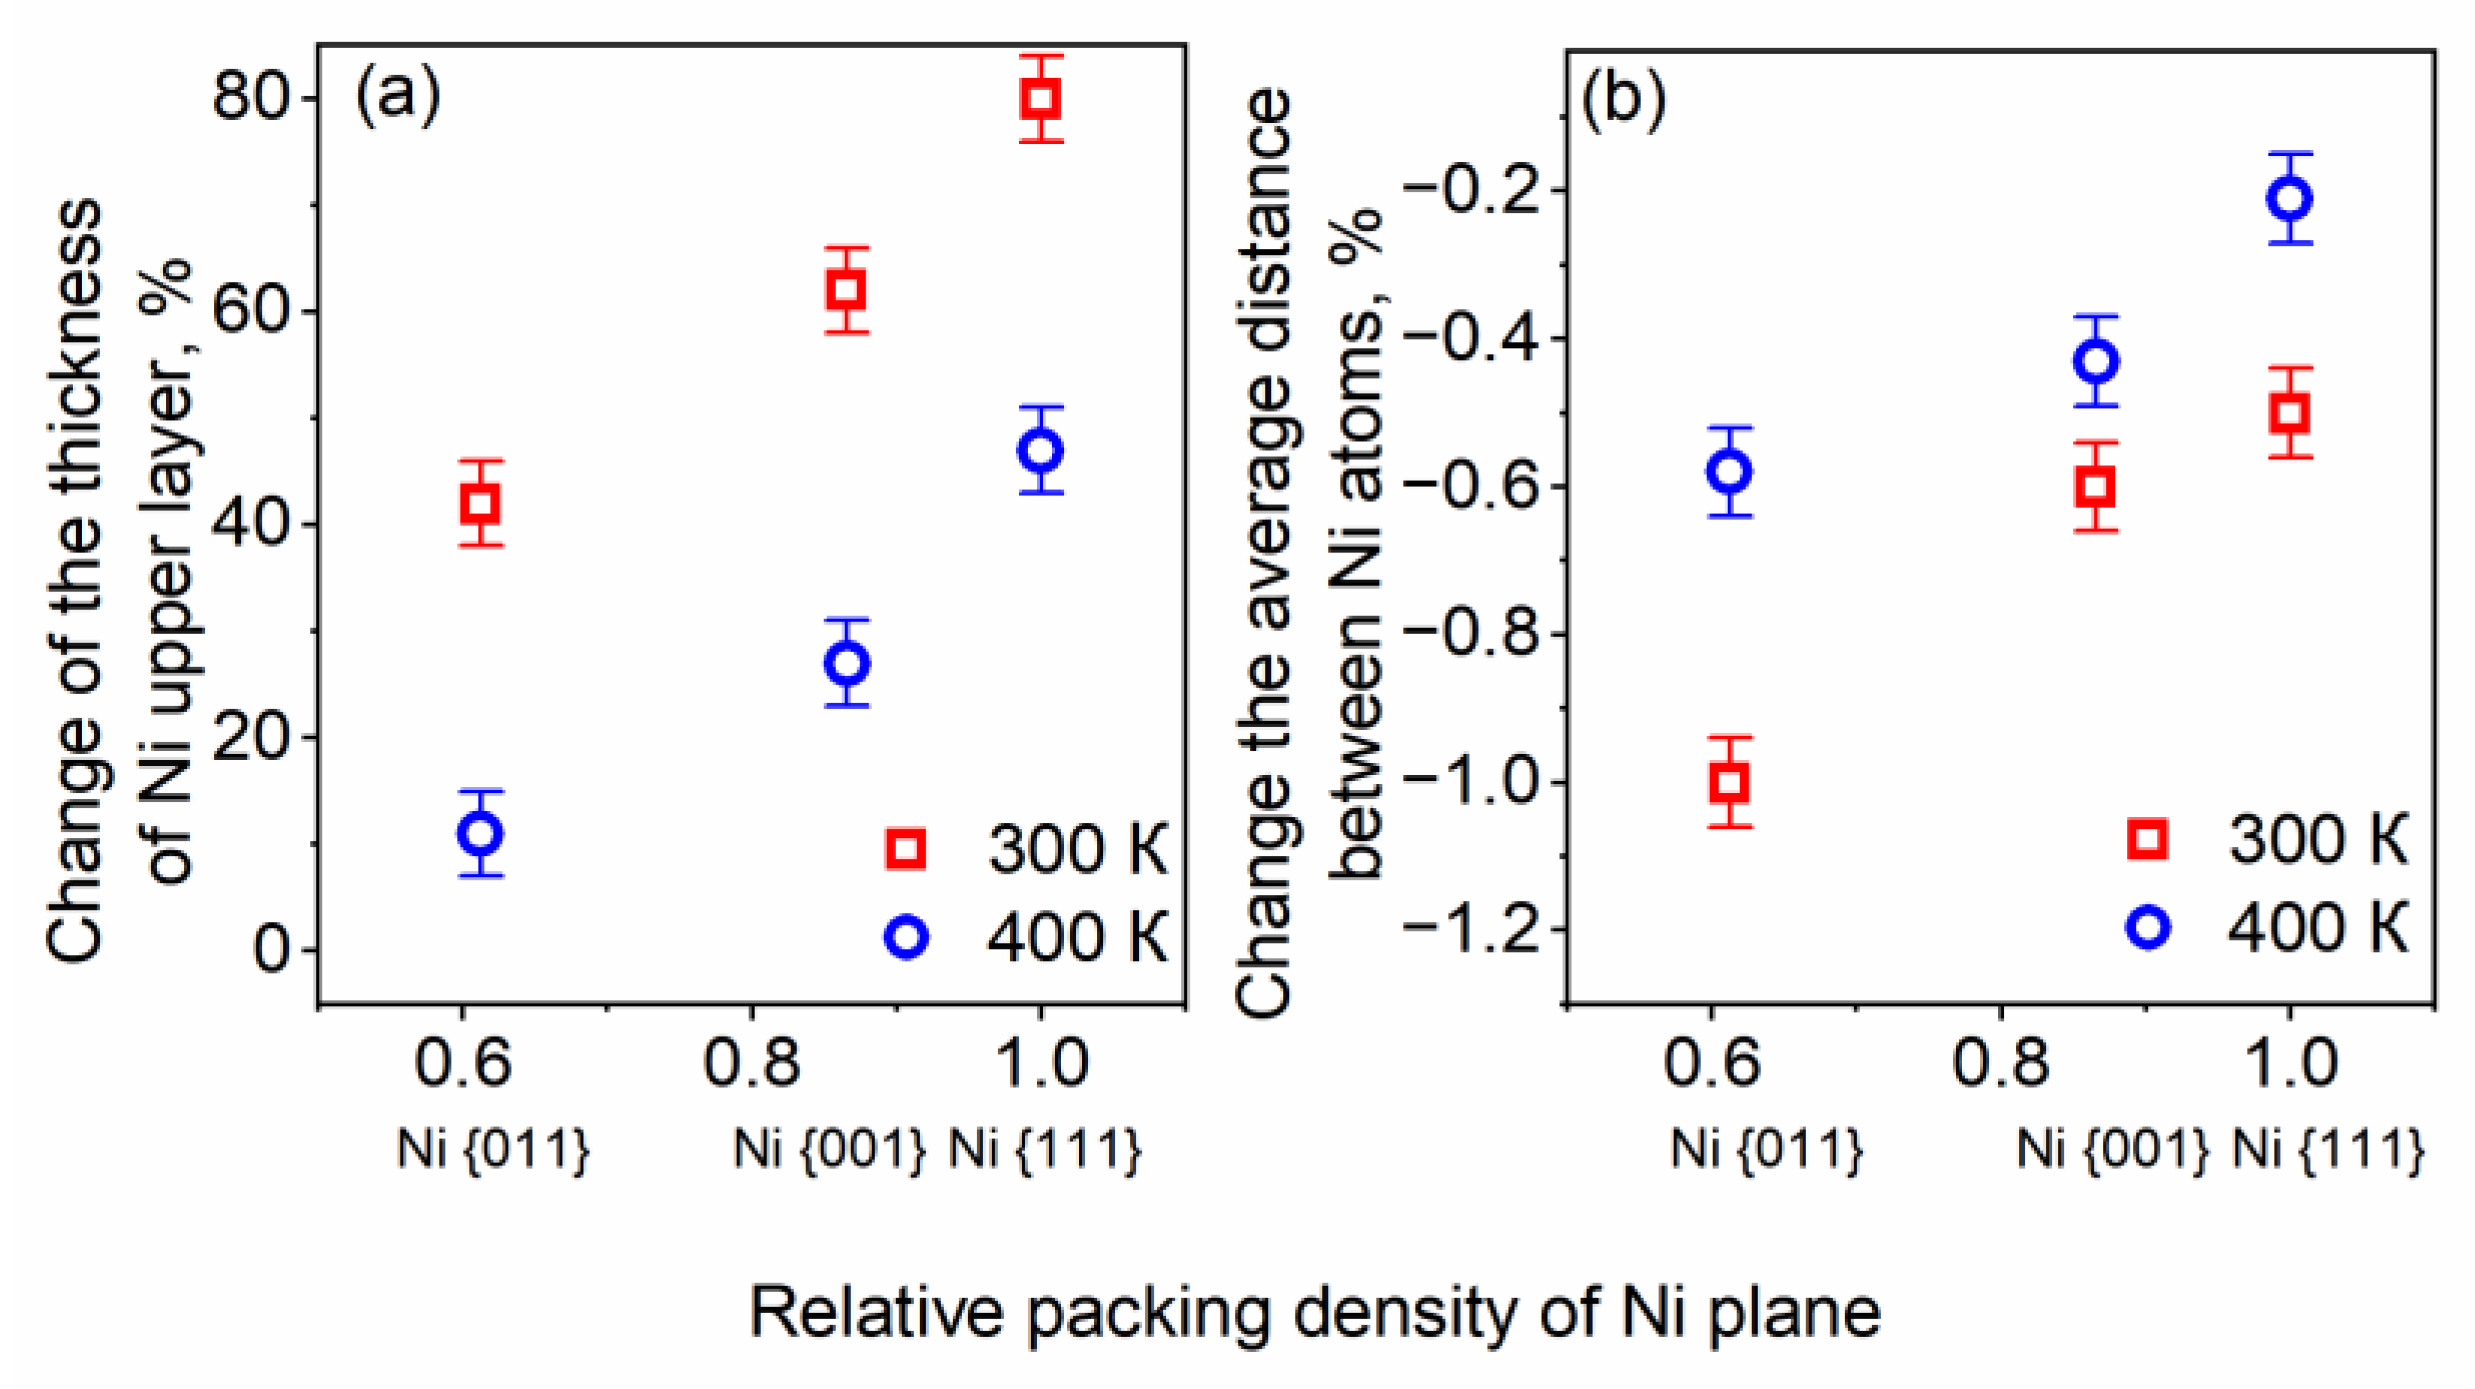
3.2. Surface Reconstruction
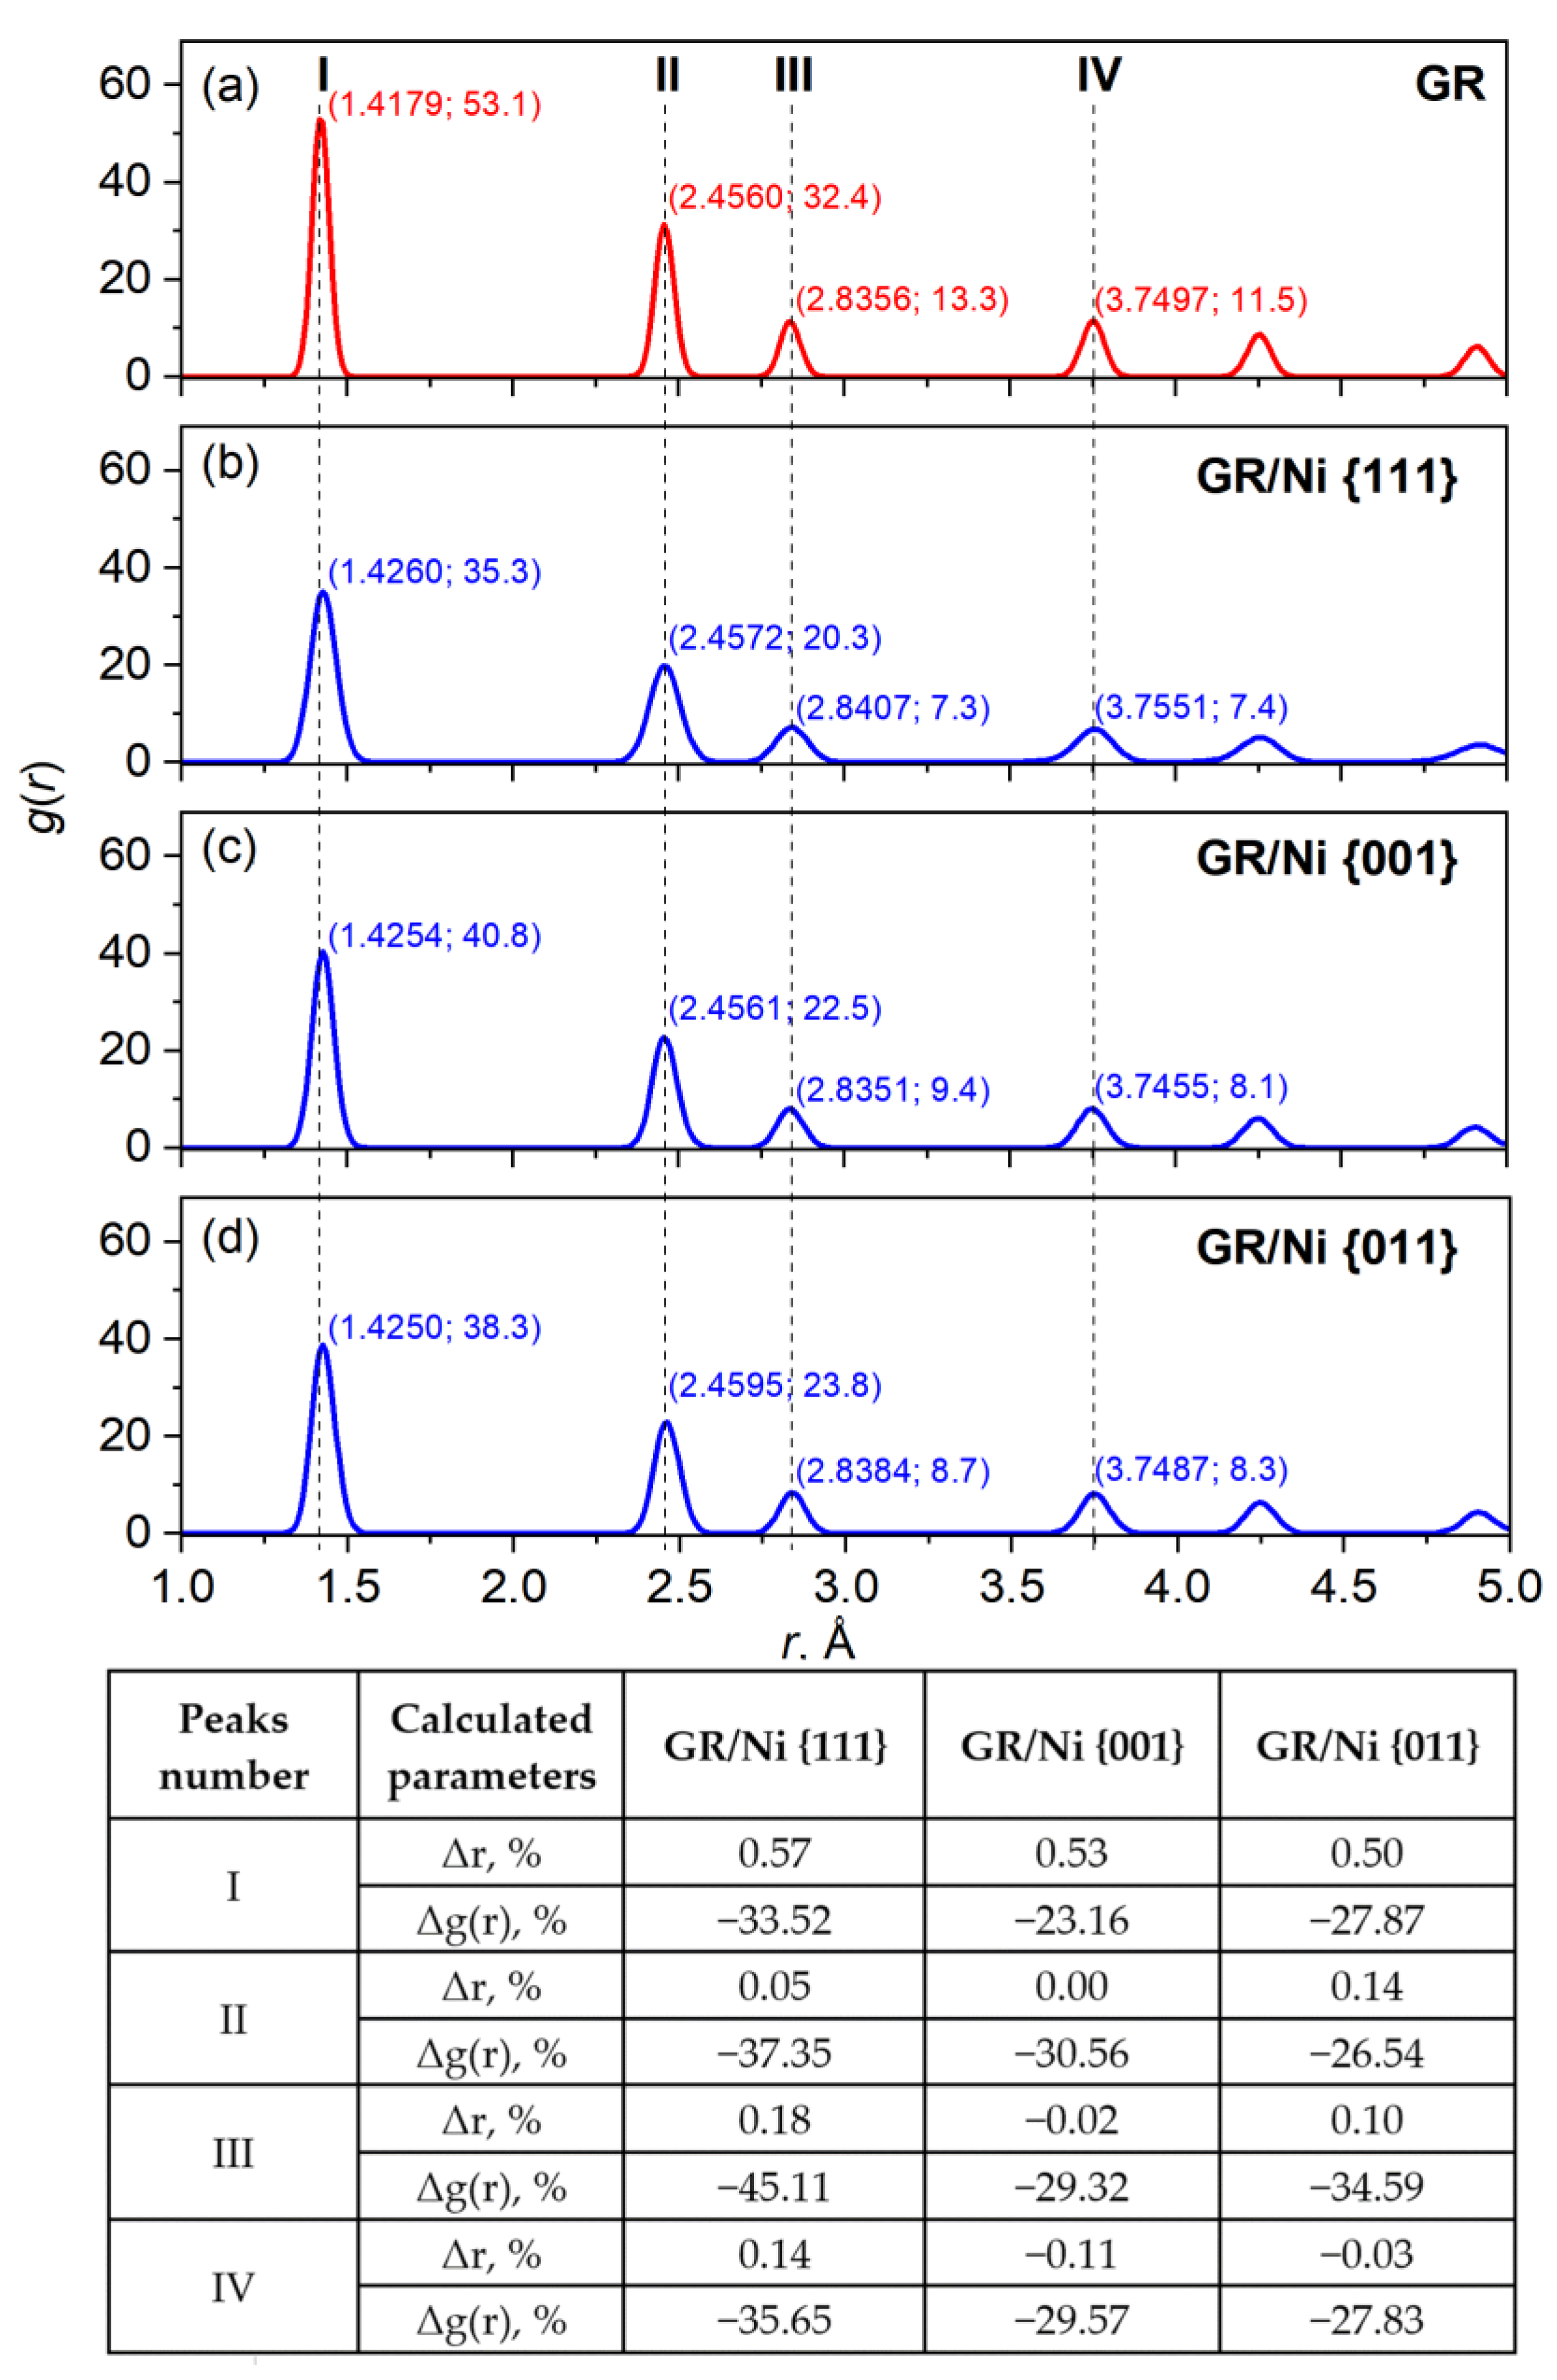
3.2.1. GR Reconstruction
3.2.2. Ni Reconstruction
4. Discussion
5. Conclusions
Author Contributions
Funding
Data Availability Statement
Conflicts of Interest
Abbreviations
| GR | graphene |
| CLTE | coefficients of linear thermal expansion |
| 2D | two-dimensional |
| RPDF | radial pair distribution function |
| LAMMPS | Large-scale Atomic/Molecular Massively Parallel Simulator |
References
- Balandin, A.A.; Ghosh, S.; Bao, W.; Calizo, I.; Teweldebrhan, D.; Miao, F.; Lau, C.N. Superior Thermal Conductivity of Single-Layer Graphene. Nano Lett. 2008, 8, 902–907. [Google Scholar] [CrossRef] [PubMed]
- Chen, S.; Moore, A.L.; Cai, W.; Suk, J.W.; An, J.; Mishra, C.; Amos, C.; Magnuson, C.W.; Kang, J.; Shi, L.; et al. Raman Measurements of Thermal Transport in Suspended Monolayer Graphene of Variable Sizes in Vacuum and Gaseous Environments. ACS Nano 2011, 5, 321–328. [Google Scholar] [CrossRef] [PubMed]
- Lim, S.; Park, H.; Yamamoto, G.; Lee, C.; Suk, J.W. Measurements of the Electrical Conductivity of Monolayer Graphene Flakes Using Conductive Atomic Force Microscopy. Nanomaterials 2021, 11, 2575. [Google Scholar] [CrossRef]
- Fernández, S.; Molinero, A.; Sanz, D.; González, J.P.; de la Cruz, M.; Gandía, J.J.; Cárabe, J. Graphene-Based Contacts for Optoelectronic Devices. Micromachines 2020, 11, 919. [Google Scholar] [CrossRef]
- Deshmukh, M.A.; Park, S.-J.; Hedau, B.S.; Ha, T.-J. Recent progress in solar cells based on carbon nanomaterials. J. Sol. Energy 2021, 220, 953–990. [Google Scholar] [CrossRef]
- Aepuru, R.; Aleksandrova, M.; Rao, C.N.; Sahare, S.; Savariraj, A.D.; Mangalaraja, R.V. Chapter 19—Transparent conducting electrode materials for solar cell technologies. In Green Sustainable Process for Chemical and Environmental Engineering and Science. Solid State Synthetic Methods; Boddula, I.R., Asiri, A.M., Rahman, M.M., Eds.; Elsevier: Amsterdam, The Netherlands, 2021; pp. 377–407. ISBN 9780128197202. [Google Scholar] [CrossRef]
- Muchuweni, E.; Mombeshora, E.T.; Martincigh, B.S.; Nyamori, V.O. Recent Applications of Carbon Nanotubes in Organic Solar Cells. Front. Chem. 2022, 9, 733552. [Google Scholar] [CrossRef]
- Akhtaruzzaman, M.; Selvanathan, V.; Shahiduzzaman, M.; Hossain, M.I. Chapter 4—Introduction to organic-inorganic hybrid solar cells. In Comprehensive Guide on Organic and Inorganic Solar Cells: Fundamental Concepts to Fabrication Methods; Akhtaruzzaman, M., Selvanathan, V., Eds.; Academic Press: Cambridge, MA, USA, 2022; pp. 187–193. ISBN 9780323855297. [Google Scholar] [CrossRef]
- Chen, R.; Das, S.R.; Jeong, C.; Khan, M.R.; Janes, D.B.; Alam, M.A. Co-percolating graphene-wrapped nilver nanowire network for High performance, highly stable, transparent conducting electrodes. Adv. Funct. Mater. 2013, 23, 5150–5158. [Google Scholar] [CrossRef]
- Kruhlov, I.; Orlov, A.; Zakiev, V.; Zakiev, I.; Prikhodko, S.; Voloshko, S. Multi-layered thin-film metal contacts for new generation solar cells. In Proceedings of the TMS 2022 151st Annual Meeting & Exhibition Supplemental Proceedings, Anaheim, CA, USA, 27 February–3 March 2022; The Minerals, Metals & Materials Series. Springer: Cham, Switzerland, 2022; pp. 431–441. [Google Scholar] [CrossRef]
- Afzal, A.M.; Khan, M.F.; Nazir, G.; Dastgeer, G.; Aftab, S.; Akhtar, I.; Seo, Y.; Eom, J. Gate Modulation of the Spin-orbit Interaction in Bilayer Graphene Encapsulated by WS2 films. Sci. Rep. 2018, 8, 3412. [Google Scholar] [CrossRef]
- Ding, J.; Zhao, H.; Wang, G.; Wang, J.; Zhu, J. Interface modulations of high-performance graphene anticorrosion coatings. Prog. Org. Coat. 2023, 178, 107463. [Google Scholar] [CrossRef]
- Al-Kuhaili, M.F. Electrical conductivity enhancement of indium tin oxide (ITO) thin films reactively sputtered in a hydrogen plasma. J. Mater. Sci. Mater. Electron. 2020, 31, 2729–2740. [Google Scholar] [CrossRef]
- Way, A.; Luke, J.; Evans, A.D.; Li, Z.; Kim, J.-S.; Durrant, J.R.; Lee, H.K.H.; Tsoi, W.C. Fluorine doped tin oxide as an alternative of indium tin oxide for bottom electrode of semi-transparent organic photovoltaic devices. AIP Adv. 2019, 9, 085220. [Google Scholar] [CrossRef]
- You, P.; Liu, Z.; Tai, Q.; Liu, S.; Yan, F. Efficient Semitransparent Perovskite Solar Cells with Graphene Electrodes. Adv. Mater. 2015, 27, 3632–3638. [Google Scholar] [CrossRef] [PubMed]
- Yoon, J.; Sung, H.; Lee, G.; Cho, W.; Ahn, N.; Jung, H.S.; Choi, M. Superflexible, high-efficiency perovskite solar cells utilizing graphene electrodes: Towards future foldable power sources. Energy Environ. Sci. 2017, 10, 337–345. [Google Scholar] [CrossRef]
- Luo, Q.; Ma, H.; Hou, Q.; Li, Y.; Ren, J.; Dai, X.; Yao, Z.; Zhou, Y.; Xiang, L.; Du, H.; et al. All-Carbon-Electrode-Based Endurable Flexible Perovskite Solar Cells. Adv. Funct. Mater. 2018, 28, 1706777. [Google Scholar] [CrossRef]
- Iqbal, M.Z.; Rehman, A.-U. Recent progress in graphene incorporated solar cell devices. Sol. Energy 2018, 169, 634–647. [Google Scholar] [CrossRef]
- Liu, X.; Wang, C.-Z.; Hupalo, M.; Lin, H.-Q.; Ho, K.-M.; Tringides, M.C. Metals on Graphene: Interactions, Growth Morphology, and Thermal Stability. Crystals 2013, 3, 79–111. [Google Scholar] [CrossRef]
- Yang, R.; Goethel, P.; Schwartz, J.; Lund, C. Solubility and diffusivity of carbon in metals. J. Catal. 1990, 122, 206–210. [Google Scholar] [CrossRef]
- Chung, T.F.; Shen, T.; Cao, H.; Jauregui, L.A.; Wu, W.; Yu, Q.; Newell, D.; Chen, Y.P.; Demirbaş, T. Synthetic graphene grown by chemical vapor deposition on copper foils. Int. J. Mod. Phys. B 2013, 27, 1341002. [Google Scholar] [CrossRef]
- Cho, J.; Gao, L.; Tian, J.; Cao, H.; Wu, W.; Yu, Q.; Yitamben, E.N.; Fisher, B.; Guest, J.R.; Chen, Y.P.; et al. Atomic-Scale Investigation of Graphene Grown on Cu Foil and the Effects of Thermal Annealing. ACS Nano 2011, 5, 3607–3613. [Google Scholar] [CrossRef]
- Huang, M.; Ruoff, R.S. Growth of Single-Layer and Multilayer Graphene on Cu/Ni Alloy Substrates. Acc. Chem. Res. 2020, 53, 800–811. [Google Scholar] [CrossRef]
- Patel, C.R.P.; Awasthi, K.; Yadav, T.P. Selective growth of uniform graphene films on metallic (Cu and Au) substrates. J. Int. Acad. Phys. Sci. 2022, 26, 175–184. Available online: https://www.iaps.org.in/journal/index.php/journaliaps/article/view/940 (accessed on 18 August 2023).
- Kiraly, B.; Iski, E.V.; Mannix, A.J.; Fisher, B.L.; Hersam, M.C.; Guisinger, N.P. Solid-source growth and atomic-scale characterization of graphene on Ag(111). Nat. Commun. 2013, 4, 2804. [Google Scholar] [CrossRef]
- Cheianov, V.V.; Fal’ko, V.I. Selective transmission of Dirac electrons and ballistic magnetoresistance of N−P junctions in graphene. Phys. Rev. B 2006, 74, 041403. [Google Scholar] [CrossRef]
- Giovannetti, G.; Khomyakov, P.A.; Brocks, G.; Karpan, V.M.; van den Brink, J.; Kelly, P.J. Doping Graphene with Metal Contacts. Phys. Rev. Lett. 2008, 101, 026803. [Google Scholar] [CrossRef]
- Dahal, A.; Batzill, M. Graphene–nickel interfaces: A review. Nanoscale 2014, 6, 2548. [Google Scholar] [CrossRef] [PubMed]
- Xiao, W.; Baskes, M.; Cho, K. MEAM study of carbon atom interaction with Ni nano particle. Surf. Sci. 2009, 603, 1985–1998. [Google Scholar] [CrossRef]
- LAMMPS Molecular Dynamics Simulator. Available online: www.lammps.org (accessed on 17 August 2023).
- Kittel, C. Introduction to Solid State Physics; Wiley India Pvt Ltd.: Hoboken, NJ, USA, 2012; ISBN 109788126535187. [Google Scholar]
- Rankin, D. CRC handbook of chemistry and physics, 89th edition, edited by David R. Lide. Crystallogr. Rev. 2009, 15, 223–224. [Google Scholar] [CrossRef]
- Barron, T.H.K.; White, G.K. Heat Capacity and Thermal Expansion at Low Temperatures; Springer: New York, NY, USA, 1999; ISBN 978-0-306-46198-9. [Google Scholar] [CrossRef]
- Yang, G.; Li, L.; Lee, W.B.; Ng, M.C. Structure of graphene and its disorders: A review. Sci. Technol. Adv. Mater. 2018, 19, 613–648. [Google Scholar] [CrossRef]
- Engelmann, Y.; Bogaerts, A.; Neyts, E.C. Thermodynamics at the nanoscale: Phase diagrams of nickel–carbon nanoclusters and equilibrium constants for phase transitions. Nanoscale 2014, 6, 11981–11987. [Google Scholar] [CrossRef]
- Frenken, J.; Smeenk, R.; van der Veen, J. Static and dynamic displacements of nickel atoms in clean and oxygen covered Ni(001) surfaces. Surf. Sci. 1983, 135, 147–163. [Google Scholar] [CrossRef]
- Feidenhans’L, R.; Sørensen, J.; Stensgaard, I. Surface relaxation of Ni(110) investigated by high energy ion scattering. Surf. Sci. 1983, 134, 329–337. [Google Scholar] [CrossRef]
- Manasoglu, G.; Celen, R.; Akgun, M.; Kanik, M. The Effect of Graphene Coating on Surface Roughness and Friction Properties of Polyester Fabrics. Mater. Sci. 2021, 27, 470–476. [Google Scholar] [CrossRef]
- Kumar, H.G.P.; Xavior, M.A. Effect of graphene addition and tribological performance of Al 6061/graphene flake composite. Tribol.-Mater. Surf. Interfaces 2017, 11, 88–97. [Google Scholar] [CrossRef]
- Kruhlov, I.O.; Vladymyrskyi, I.A.; Dubikovskyi, O.; Sidorenko, S.; Ebisu, T.; Kato, K.; Sakata, O.; Ishikawa, T.; Iguchi, Y.; Langer, G.; et al. Oxidation and reduction processes in Ni/Cu/Cr/Si(100) thin films under low-energy Ar+ ion bombardment. Mater. Res. Express 2020, 6, 126431. [Google Scholar] [CrossRef]
- Ren, S.; Cui, M.; Liu, C.; Wang, L. A comprehensive review on ultrathin, multi-functionalized, and smart graphene and graphene-based composite protective coatings. Corros. Sci. 2023, 212, 110939. [Google Scholar] [CrossRef]


| Material | Temperature, K | Lattice Constant, Å | CLTE, 10−6 1/K |
|---|---|---|---|
| Ni | 300 | 3.5347 (this work) 3.523 [31] | 12.75 (this work) 13.4 [32] 12.8 [33] |
| 400 | 3.5392 | ||
| GR | 300 | 1.4163 (this work) 1.42 [34] | 8.5 (this work) |
| 400 | 1.4175 |
| Ni Plane | Temperature | |
|---|---|---|
| 300 K | 400 K | |
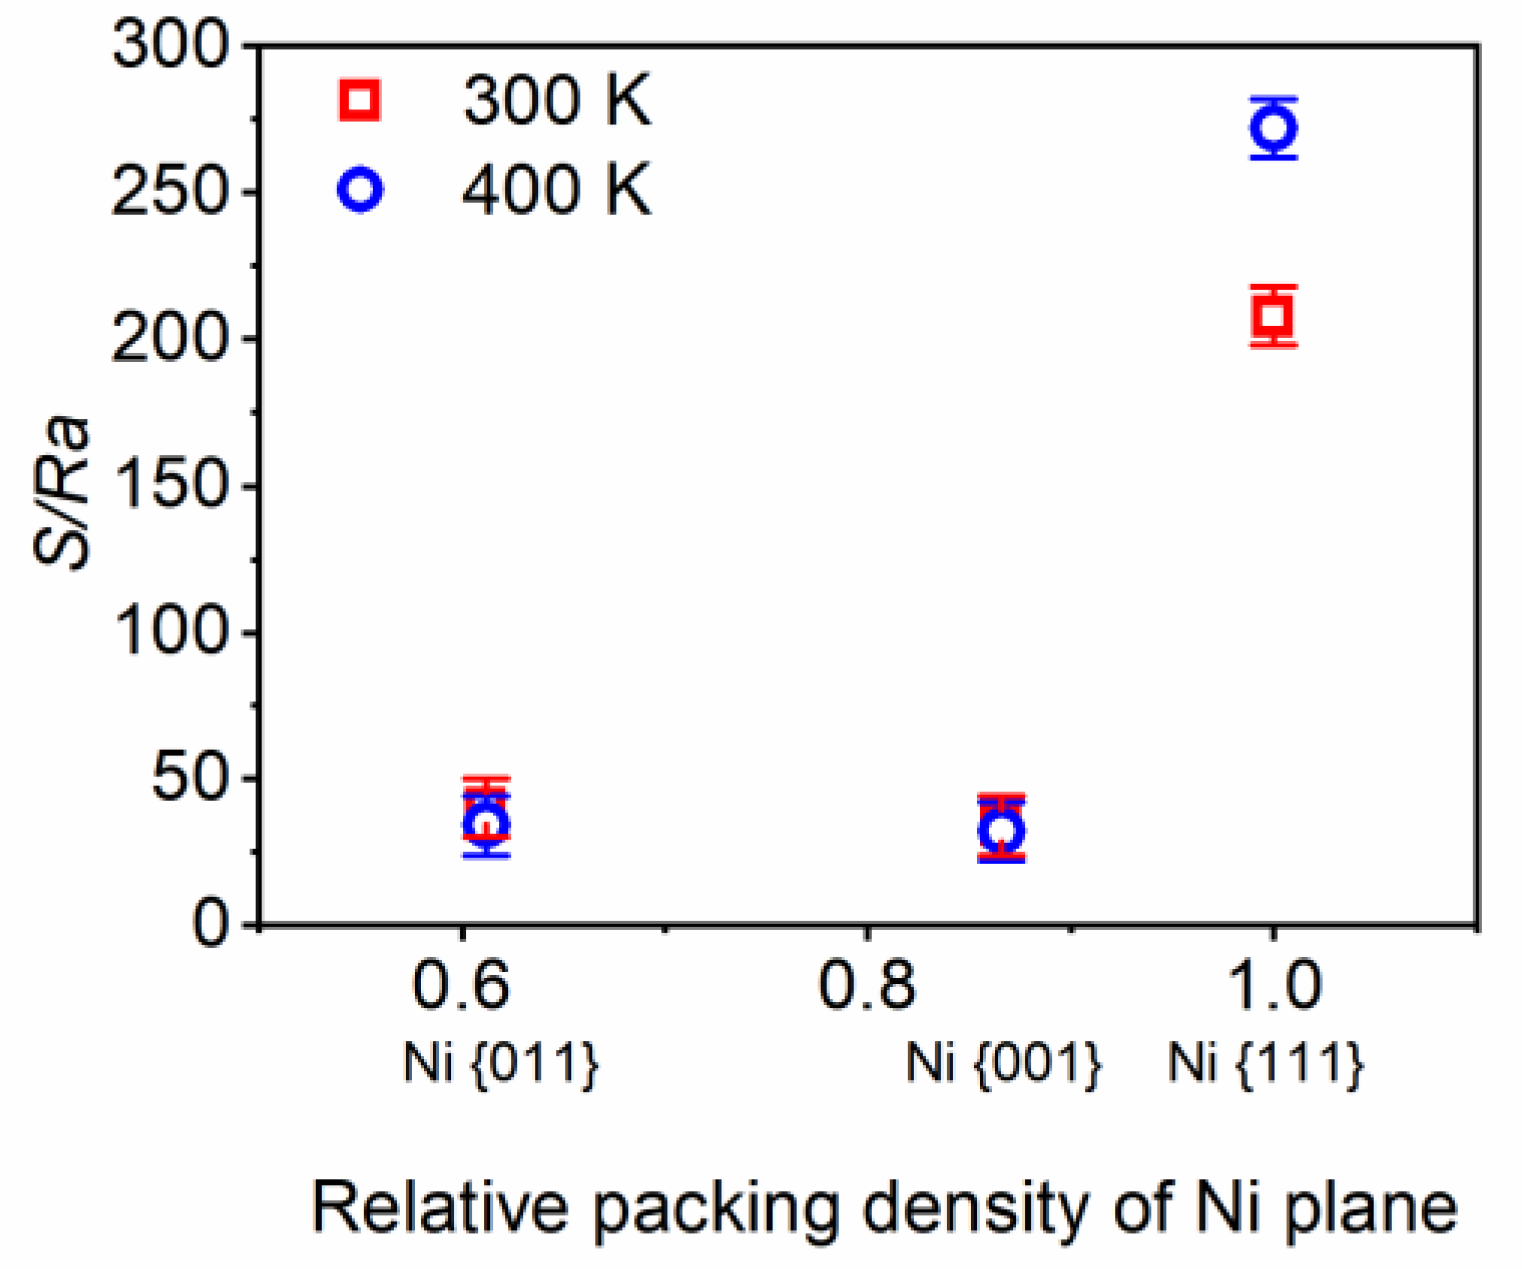
| {111} | Ra = 0.7 ± 0.05 Å | Ra = 0.55 ± 0.05 Å |
| Rmax = 1.95 ± 0.05 Å | Rmax = 1.75 ± 0.05 Å | |
| S = 146 ± 1.4 Å | S = 150 ± 1.4 Å | |
| S/Ra = 208 | S/Ra = 272 | |
| {001} | Ra = 0.35±0.05 Å | Ra = 0.4 ± 0.05 Å |
| Rmax =1.1 ± 0.05 Å | Rmax = 1.15 ± 0.05 Å | |
| S = 12 ± 1.4 Å | S = 13 ± 1.4 Å | |
| S/Ra = 34 | S/Ra = 32 | |
| {011} | Ra = 0.45 ± 0.05 Å | Ra = 0.55 ± 0.05 Å |
| Rmax = 1.2 ± 0.05 Å | Rmax =1.35 ± 0.05 Å | |
| S = 18 ± 1.4 Å | S = 19 ± 1.4 Å | |
| S/Ra = 40 | S/Ra = 34 | |
Disclaimer/Publisher’s Note: The statements, opinions and data contained in all publications are solely those of the individual author(s) and contributor(s) and not of MDPI and/or the editor(s). MDPI and/or the editor(s) disclaim responsibility for any injury to people or property resulting from any ideas, methods, instructions or products referred to in the content. |
© 2023 by the authors. Licensee MDPI, Basel, Switzerland. This article is an open access article distributed under the terms and conditions of the Creative Commons Attribution (CC BY) license (https://creativecommons.org/licenses/by/4.0/).
Share and Cite
Konorev, S.; Yanchuk, V.; Kruhlov, I.; Orlov, A.; Sidorenko, S.; Vladymyrskyi, I.; Prikhodko, S.; Voloshko, S. Effect of Graphene on Nickel Surface Relaxation: Molecular Dynamics Simulation. Lubricants 2023, 11, 405. https://doi.org/10.3390/lubricants11090405
Konorev S, Yanchuk V, Kruhlov I, Orlov A, Sidorenko S, Vladymyrskyi I, Prikhodko S, Voloshko S. Effect of Graphene on Nickel Surface Relaxation: Molecular Dynamics Simulation. Lubricants. 2023; 11(9):405. https://doi.org/10.3390/lubricants11090405
Chicago/Turabian StyleKonorev, Sergiy, Vitalii Yanchuk, Ivan Kruhlov, Andrii Orlov, Sergii Sidorenko, Igor Vladymyrskyi, Sergey Prikhodko, and Svitlana Voloshko. 2023. "Effect of Graphene on Nickel Surface Relaxation: Molecular Dynamics Simulation" Lubricants 11, no. 9: 405. https://doi.org/10.3390/lubricants11090405
APA StyleKonorev, S., Yanchuk, V., Kruhlov, I., Orlov, A., Sidorenko, S., Vladymyrskyi, I., Prikhodko, S., & Voloshko, S. (2023). Effect of Graphene on Nickel Surface Relaxation: Molecular Dynamics Simulation. Lubricants, 11(9), 405. https://doi.org/10.3390/lubricants11090405