Abstract
The exclusion of systems supplying the lubricant from the outside makes it necessary to replace traditional sliding pairs with materials containing a lubricant component. Such solutions are carried out to prevent the formation of material tacks and, consequently, of adhesive wear, which must be avoided. The article presents the influence of research factors and parameters of Al2O3 layer production on tribological and microstructural properties. The input variables for the tests were the admixture of WS2 to the electrolyte, the type of sputtering of the samples for SEM tests, and the load on the oxide coating—TG15 material friction node. The surface morphology and cross-section of the oxide coatings as well as the tribological properties of the rubbing pair have been studied. Interactions between the input variables and the obtained test results have been analyzed using DOE—a 2k factorial design with one repetition. Pareto charts and two-way ANOVA were used to determine the relationship. The analysis of variance shows the influence of sample preparation on the calculation values of the size of nanopores and Al2O3 walls on the SEM image. Statistical analyzes also show that both the load and the type of electrolyte affected the values of the coefficient of friction and wear of the TG15 material; those values are the result of appropriate adhesion of the sliding film to the surface of the layer.
1. Introduction
Aluminum alloys are used increasingly often in many fields of technology as construction materials. Excellent strength properties, low specific weight, and the possibility of recycling contribute to the increasing number of applications of aluminum and its alloys. Electrochemical oxidation of aluminum alloys leads to the formation of an oxide layer on the aluminum surface. As a result of anodizing, aluminum alloys gain mechanical, corrosion, and electrical insulation resistance. The properties of anodic oxide layers depend on many factors, in particular on the type of substrate, electrolyte, temperature, intensity, and type of current as well as on the duration of the process [1,2,3,4]. The most commonly used method of modifying aluminum alloy is DC anodizing [5,6,7]. The traditional DC anodizing method is believed to consume a lot of electricity, which leads to higher costs; it may also cause the rate of layer growth to drop at low temperatures. There are studies that propose the use of a two-stage method of obtaining oxides at constant cell voltage at higher temperatures. This method reduces the production time due to the high rate of growth of the porous oxides. Due to the elimination of cooling systems, it is an alternative that enables economic savings compared to the conventional anodizing process [7,8]. Another option that reduces the costs of the process and protects against the burnout of the oxide layer during anodizing is pulse anodizing. Pulse anodizing consists in a periodic change of current density. The change from high to low current density ensures the removal of heat generated on the surface of the anodized element. When applying a low current density, the dissolution of the Al2O3 predominates over the formation of this layer. The influence of the current density value, duty factor, and pulse frequency on the forming anode layer of Al2O3 has been presented, among other studies, in research [9,10,11]. The study of the pore composition and structure as well as the mechanical properties of anodic alumina layers obtained by the impulse method are presented in [12,13,14]. Research on a room temperature hybrid pulsed anodizing process that improves the limitations of the conventional low temperature process is shown in [15,16].
Anodic Al2O3 layers on aluminum and its alloys are often used for protection against wear and corrosion [17,18,19,20]. The optimal layer for sliding cooperation should ensure good adhesion to the substrate, appropriate hardness, and good tribological properties. The essence of the anodic oxidation process is that the formation of the coating takes place at the expense of dissolving the aluminum alloy substrate to form Al2O3. Such a process results in very good adhesion of the Al2O3 coating to the substrate, to the extent that it cannot be separated from the substrate by mechanical means without destroying it [21]. Oxide coatings produced by hard anodizing have additionally increased hardness, thanks to which they can be used for sliding connections in piston–cylinder systems [22,23]. One example of using this combination is oil-free pneumatic actuators and compressors [24,25]. The cylinders of actuators and compressors are made of aluminum alloys, internally hardened by hard anodizing, and the piston seals are polymer rings. During the sliding contact of the Al2O3–polymer coating, the wear of the plastic occurs, a process that is closely related to the formation of the polymer sliding film on the friction surface. As a result, the durability of the piston–cylinder devices decreases. In order to reduce this adverse effect, the oxide coating is modified with the help of solid lubricants in the form of graphite, MoS2, WS2, and ZnO [24,26]. These compounds are expected to reduce friction forces between the cooperating pair. The structure of the oxide coating is the basic factor that determines the coating’s properties and purpose. The walls of Al2O3 are arranged parallel to each other, which creates free spaces between them. These spaces are a migration channel that enables the connection of oxygen ions with the anode material in electrical processes [27,28]. The free space can also be used as reservoirs for polymer lubricants [21,29]. Both the dimensions of the Al2O3 walls and the dimensions of the space between the walls depend on the parameters used in the anodizing process. The parameters include, above all, current density, temperature, and the type of electrolyte. In order to properly analyze the dimensions of the Al2O3 walls as well as the dimensions of the space between the walls, cross-sections of the coatings should be subjected to SEM observation. For SEM imaging, the observed surface must be electrically conductive and the samples must be electrically grounded to prevent static buildup. Aluminum oxide layers are an amorphous and dielectric material. Therefore, when the electron beam scans the tested surface of aluminum oxide, the preparation is electrically charged, which makes correct observation difficult or practically impossible even at low magnifications. In order to enable proper observation of the aluminum oxide layer, its surface is first sputtered with a thin layer of electrically conductive material. Graphite or gold are commonly used for this purpose.
In their previous research, the authors of this article observed that the type of material used for sputtering the surface of the observed layers gives different imaging results [30]. That observation has suggested to them the idea of examining how the type of sputtered conductive material affects the results of imaging the surface morphology and the structure of oxide layers modified with 2H-WS2. The aim of our work has been to examine the microstructural and tribological properties of oxide layers on the EN AW-5251 alloy obtained as a result of anodizing with direct current using step changes in current intensity in a given unit of time. Statistical methods used in the design and analysis of the experiment (DOE) become useful in optimizing the process and in the search for relationships between input variables and measured parameters. The DOE methodology can be found in the literature on the subject, for example [31,32,33,34].
2. Materials and Methods
The anodizing process has been carried out on the aluminum alloy EN AW-5251, which is characterized by medium strength resistance and high resistance to wear and corrosion. Figure 1 shows the procedure of sample preparation. Test samples were cut to ±62.5 × 15 mm using a water jet cutting machine. The next stages of sample preparation for tribological tests included drilling, grinding, and securing with epoxy glue the part of the sample that was not oxidized. Details of the process of sample preparation can be found in [35]. The anodizing process of the samples was preceded by the etching of each sample for 40 min in a 5% potassium hydroxide (KOH; POCH, p.a., purity: 99.9–99.99%) solution; then, the sample was rinsed in distilled water and placed in a 10% solution of nitric acid (V) (HNO3; ChemPUR, 65% solution pure p.a.) for 10 min. After 10 min, the sample was rinsed again in distilled water.
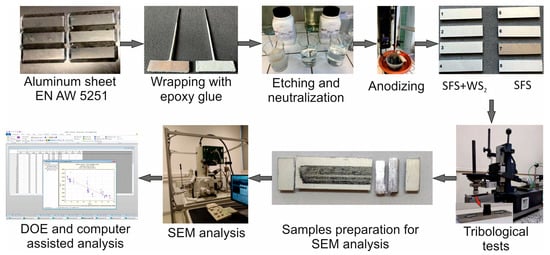
Figure 1.
A sample preparation and methods scheme.
Four samples (1, 2, 3, 4) were subjected to electrolysis in a three-component solution of sulfuric, phthalic, and oxalic acids, containing the addition of dry lubricant in the form of tungsten disulfide (WS2; Graphene Supermarket, Megantech grain size <0.4–1 µm, purity: 99%) in the amount of 30 g/L; the electrolyte was named SFS/WS2. Four samples (5, 6, 7, 8) were electrolyzed in a ternary SFS solution. A DC GPR-25H30D GW Instek (IET labs, Inc., New York, NY, USA) power supply was used for the hard anodizing process. For all the samples, a constant value of the surface charge density 106.25 A⋅min⋅dm−2 was applied. The anodizing process was carried out using a current density of 2.18 A⋅dm−2. Coatings were produced by the direct current method with step-like decreasing changes in the current over time. Based on the calculations, the time for the respective anodizing current values was determined, as presented in Table 1. The entire process took place at an electrolyte temperature of 303.15 K and a homogenizer speed of 155 rpm. The cathode of the process was a plate made of lead. After anodizing, the sample was rinsed again in distilled water and dried.

Table 1.
Anodizing time for a given current value.
The samples prepared in this way were subjected to tribological tests performed on the T17 tester (Łukasiewicz Research Network—Institute for Sustainable Technologies, Radom, Poland). Tests were performed on a pin-on-plate reciprocating motion at room temperature and 50% ± 10% humidity. An average sliding speed of 0.2 m/s was used for an operating frequency of 2.5 Hz. The tests were carried out under dry friction conditions. The friction distance was 15 km for each tribological pair. A ⌀9 mm diameter pin made of TG15 was used as a counter-sample. As a result of the tests, friction characteristics (friction force) were obtained. The average value of the friction coefficient was determined from the stabilized friction force ranges. Before each specimen was subjected to a dry friction tribological test, the TG15 pin was lapped with P1000 sandpaper for 5 min under a load of 3.242 kg. Using this process, the same surface roughness of the counter-sample was obtained, which allowed us to maintain the same initial conditions for each association. The degree of wear of the polymer pin was tested using an analytical balance WPA-60G (Radwag, Poland, Radom) with an accuracy of ±0.1 mg before and after each friction cycle. In tribological associations of kinematic machine parts, cooperating under technically dry friction conditions, the processes of the interaction of particles or even of the atoms of the lubricant on sliding surfaces play an important role. The lubricating material can be fed to the friction node, e.g., in the form of graphite particles of a sliding polymer (as in TG15). The use of a material without lubricating additives would result in the formation of a significant thickness of the sliding film (without lubricating properties), which is the effect of adhesive tacks, which in turn would result in the unacceptable wear of the material. The thickness of the oxide layers was measured with a Dualscope MP40 by Fischer (Helmut Fischer GmbH+Co.KG, Sindelfingen, Germany), using the eddy current method. Micrographs of the structure and morphology of the formed surface oxide layers were taken using a JEOL JSM-7100 TTL LV field emission scanning electron microscope (Jeol Ltd., Tokyo, Japan) and Hitachi S-4700 scanning electron microscope with the EDS Noran Vantage system. The samples for the measurements were sputtered with gold and carbon. To calculate the size of Al2O3 walls and nanopores, ImageJ software 1.50i (LOCI, University of Wisconsin, Madison, WI, USA) was used. The method of measuring Al2O3 walls from the cross-section and pores from the surface is shown in Figure 2.
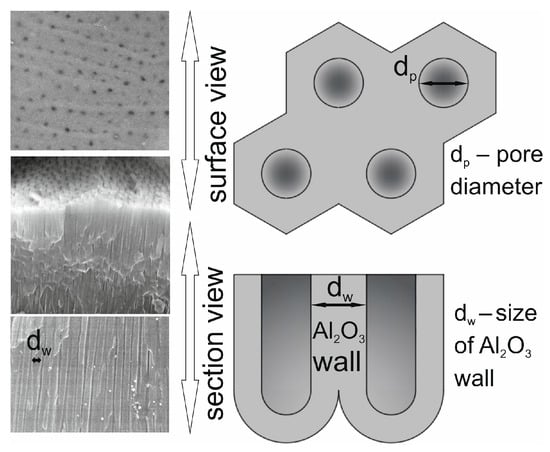
Figure 2.
A sample preparation and methods scheme.
The 2k factorial design (Statistica 13.0 software, TIBCO Software Inc., Palo Alto, CA, USA) with one repetition was implemented to analyze the influence of the WS2 admixture in the electrolyte and the load of the friction node on the tribological properties of the friction node. The two-level factorial design of the experiments was also used to analyze the influence of the WS2 admixture in the electrolyte and the type of sputtering on changes in the microstructure of the oxide layers. A comparative analysis of all dependent variables against the factorial design and the two-factor model with second-order interaction was performed. Pareto charts and two-way ANOVA were selected.
3. Results and Discussion
Figure 3 shows the graph of the dependence of the voltage versus time, read on the power supply for the current values assumed in Table 1. The samples obtained in the electrolyte with the addition of WS2 were characterized by a higher voltage. This is due to the increase in the resistance of the system resulting from the process of incorporation and flow of WS2 powder through the electrolyte.
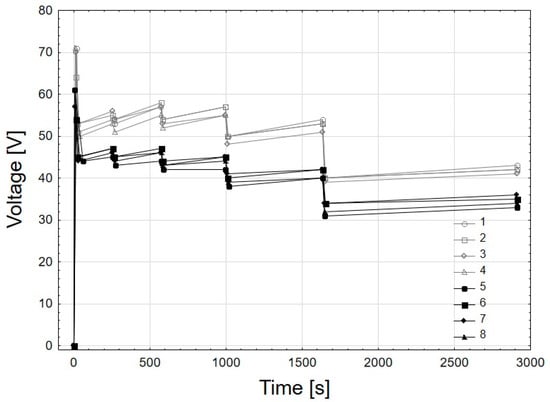
Figure 3.
Voltage versus time plot for samples 1–8.
Figure 4a shows the graph of the thickness of the oxide layers for all samples, while Figure 4b shows the graph of the average thickness of the samples with a 0.95 confidence interval. The graph also shows the results of the analysis of variance (ANOVA), Current effect: F(1, 78) = 24.096, p = 0.000005, which shows that the type of electrolyte affects the thickness of the obtained layers. ANOVA uses F-tests (the so-called Fisher or Fisher–Snedecor test) to statistically assess the equality of means. The F-test is the ratio of two independently estimated variances; F = variance of the group means/mean of the within-group variances. The notation F(1, 78) = 24.096, should be read as follow: 1 means the degree of freedom for between-group variance and 78 means the degree of freedom for within-group variance, 24.096 is the value of the F statistic, and p = 0.000005 means the value of the significance level. Differences in the thickness of the applied oxide coatings are caused by the time of obtaining the breakdown voltage and voltage stabilization in the next phase of the anodizing process. When analyzing the thicknesses of the obtained oxide coatings, we can see that sample 4 is slightly thicker than the other samples obtained in the SFS/WS2 electrolyte. This was due to the fact that the voltage stabilization for this sample took the longest time at the highest voltage. During the application of high voltage, the oxide layer grows at a faster rate, which contributed to obtaining a greater thickness of the layer on sample 4. In the case of samples 5–8, thicker layers of aluminum oxide were obtained. This is due to the fact that in the electrolyte without the addition of WS2, there are no factors affecting the exchange of oxygen-containing ions (O2− or OH−) from the electrolyte and Al3+ ions through the oxide layer.
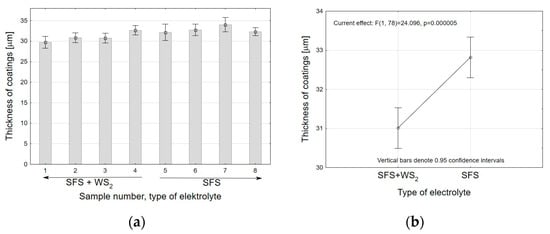
Figure 4.
(a) Thickness of coatings for each sample; (b) analysis of variance for samples obtained in different type of electrolyte.
The qualitative and quantitative analysis carried out on the SEM confirms the presence of WS2 powder in the microstructure of the Al2O3 layers obtained in the SFS/WS2 electrolyte, which is shown in Figure 5a,b.
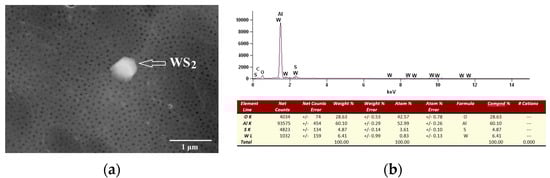
Figure 5.
(a) SEM image of the surface of the oxide layer obtained in the SFS/WS2 electrolyte; (b) quantitative and qualitative EDS analysis of the area indicated in Figure 5a.
To analyze the thickness of the aluminum oxide walls, a photo of the fresh fracture of the entire layer at ×1000 magnification and five photos at selected places at ×10,000 magnification were used. The method of selecting sites for analysis is shown in Figure 6.
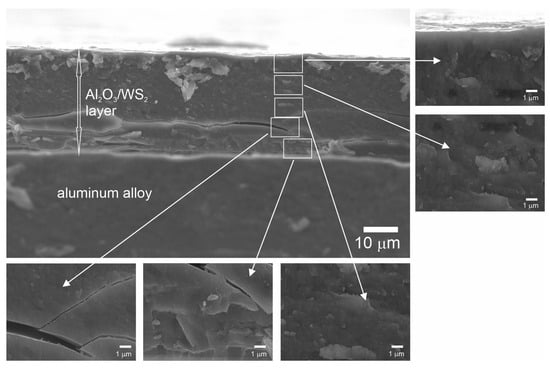
Figure 6.
Selection of places for calculating the size of aluminum oxide walls.
Measurements of the size of the Al2O3 walls show an increase in the diameter of the aluminum oxide walls depending on the increasing distance from the surface, as shown in Figure 7. In the figure, it can be also observed that for measurements made on the basis of SEM photos of carbon-sputtered layers, the measured walls size is larger than for gold-sputtered layers.
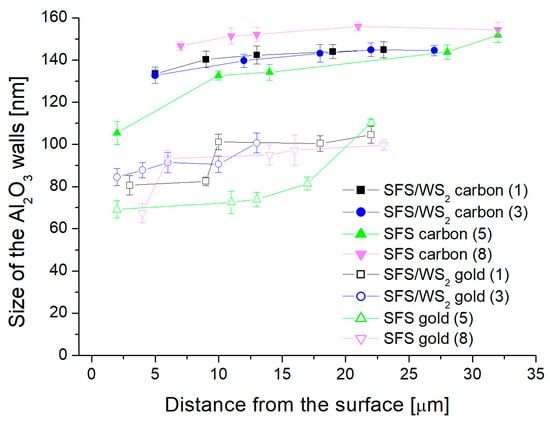
Figure 7.
Diagrams of the size of Al2O3 walls depending on the distance from the surface of the oxide.
In order to analyze the results of testing the size of Al2O3 walls and the size of nanopores on the surface of the produced layers, the DOE (Design of Experiment) module included in the Statistica program was used. Based on the 2k factorial design of experiment using two levels of two variables, a system was generated in a standard sequence with repetition. The plan assumes that one input variable relates to how the samples were prepared, with one level representing the samples produced in the SFS/WS2 electrolyte and the other in the SFS electrolyte. The second variable concerns the method of sputtering of the tested microstructures of the samples, and its levels refer to the sputtering of the samples with gold or carbon. The factorial design of experiments is primarily used for variable selection. In order to determine the effect of the sputtered material on the layers and the effect of the electrolyte on the measurement results of the Al2O3 walls, the size of the walls closest to the oxide surface were selected. The Pareto chart of standardized effects of the influence of the type of sputtering and the type of electrolyte on the thickness of the Al2O3 walls and nanopores are shown in Figure 8a,b, respectively. The graphs confirm the influence of the type of sputtering on the measurements of the size of the Al2O3 walls and nanopores. It is essential for measurements of this type that the researcher knows which method of sputtering to use in order to make correct measurements of nanopores and Al2O3 walls size.
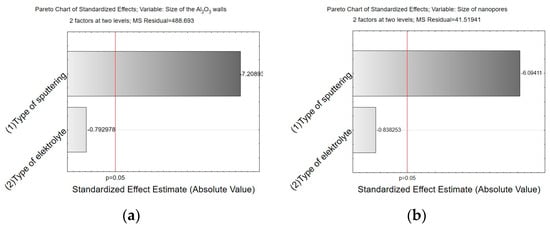
Figure 8.
Pareto charts of standardized effects of the influence of the type of sputtering and the type of electrolyte on the size of the Al2O3 walls (a) and nanopores (b).
Figure 9a,b show the graphs of the average dimension of the Al2O3 walls of the samples with a 0.95 confidence interval dependence on the type of electrolyte and the type of sputtering, respectively. Figure 10a,b show the graphs of the average dimension of the diameters of nanopores with a 0.95 confidence interval dependence on the type of electrolyte and the type of sputtering, respectively. Figure 9a shows the results of the ANOVA (Current effect: F(1, 78) = 0.70824, p = 0.40261). Since the probability p = 0.40261 is greater than the assumed significance level α = 0.05, the influence of the type of electrolyte is not statistically significant on the measurement of the size of the aluminum oxide walls. In the case of the influence of the type of sputtering, p < a indicates statistically significant results (Figure 9b). Similar dependencies are observed for the measurements of nanopores of the Al2O3 layer (Figure 10a,b). The type of sputtering on the samples influence the measurements of the size of the pores and walls of the Al2O3.
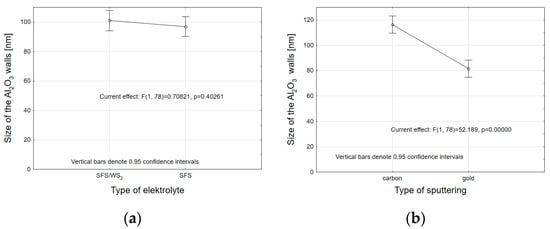
Figure 9.
Average size of the Al2O3 walls of the samples with a 0.95 confidence interval dependence on the type of electrolyte (a) and the type of sputtering (b) closest to the surface.
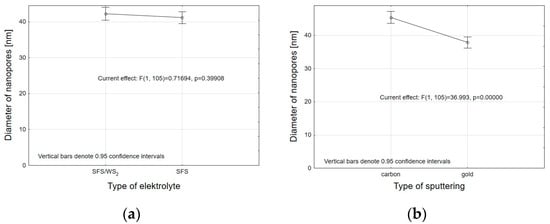
Figure 10.
Average dimension of the diameters of nanopores with a 0.95 confidence interval dependence on the type of electrolyte (a) and the type of sputtering (b).
In the 2k factorial design of experiment for tribological tests, it was assumed that one input variable concerns the method of sample preparation (SFS/WS2 and SFS). The second variable was the load during the test, and its levels corresponded to a load of 32 N and 64 N. Linear displacement of the friction node versus sliding distance for all samples is shown in Figure 11a, whereas Figure 11b shows the mass wear of the TG15 plastic for all samples. As the mass loss of the TG15 material increases, the linear shift also increases. The linear displacement applies to the entire friction node (layer–pin), while the measurement of mass wear applies only to the pin. Samples 4, 7, and 8 are characterized by the largest linear displacement of the friction node, which is associated with the highest values of mass wear of the TG15 plastic. In Figure 10a, we also observe a significant linear displacement for sample 3 to about 4 km of the measurement. After this distance, the stabilization of the displacement is observed. The high value of the linear displacement in the initial phase of the run is most likely caused by the removal of high individual roughness peaks of the oxide coating, and not of the polymer, which is confirmed by the low value of polymer consumption for the sample (Figure 10b).
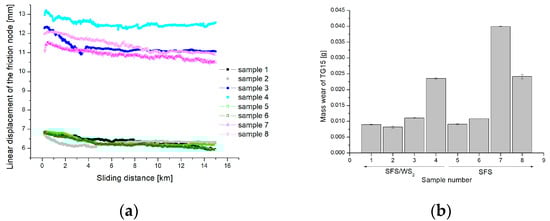
Figure 11.
(a) Linear displacement of the friction node versus sliding distance; (b) Mass wear of TG15 for each association.
Friction coefficient versus sliding distance for all samples is shown in Figure 12a whereas Figure 12b shows the Pareto charts of standardized effects of the influence of load and the type of electrolyte on the friction coefficient. As the Pareto diagram shows, both the load and the type of electrolyte have an impact on the obtained values of the friction coefficient. Moreover, an interaction between load and type of electrolyte is observed (marked as 1by2 in Figure 12b). This effect occurs when one variable depends on the value of another variable. Spearman’s rank coefficient correlation (Table 2) makes it possible to specify the existence of a strong negative correlation between the coefficient of friction, the load, and the type of electrolyte. We have established a very strong correlation of mass wear of TG15 plastic and load, and a moderate correlation of mass wear of TG15 and the electrolyte type.
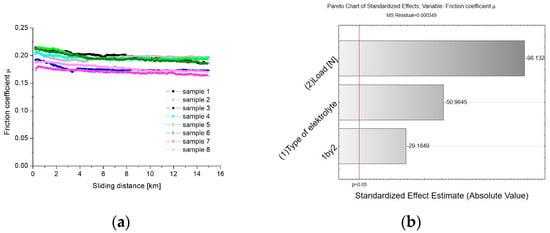
Figure 12.
(a) Friction coefficient versus sliding distance; (b) Pareto charts of standardized effects of the influence of load and the type of electrolyte on the friction coefficient.
Table 2.
Spearman Rank Order Correlations.
Figure 13 shows the average value of the friction coefficient and mass wear of TG15 with a 0.95 confidence interval dependence on the type of electrolyte for load 32 and 64 N. Figure 14a,b show surface of samples with wear debris of TG15 after tribological test and with applied sliding film, respectively. The average values of the coefficient of friction calculated for samples obtained in the same technological conditions indicate lower values of the coefficient of friction for samples obtained in the SFS electrolyte. The TG15 polymer pin was slightly more worn when tacked with the layers obtained in the SFS electrolyte. Figure 14b shows different ways of applying the sliding film with good adhesion to the surface of coatings. On samples 3, 7, and 8, we can see an evenly applied film. These samples showed the lowest coefficient of friction, because their surfaces cooperated with the entire surface of the pin, so the friction between them was evenly distributed over the entire surfaces of the elements working in contact with each other. Comparing the coefficients of friction and the macroscopic observations, we can conclude that it was the factor of uniform application of the sliding film that also influenced the differences between the values of the average coefficient of friction.
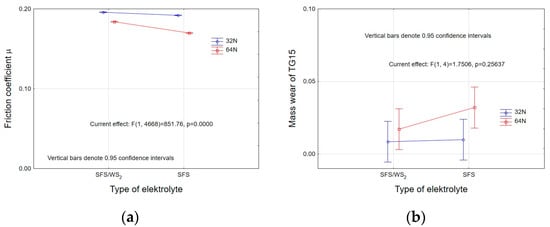
Figure 13.
Average dimension of the (a) friction coefficient; (b) mass wear of TG15 with a 0.95 confidence interval dependence on type of electrolyte for load 32 and 64 N.
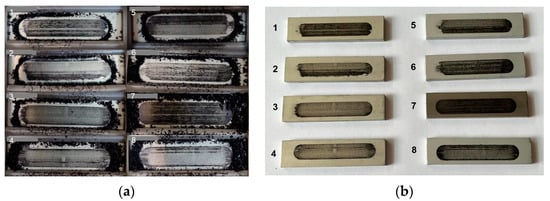
Figure 14.
(a) Wear debris of TG15 plastic after tribological test; (b) sliding film applied to the surfaces of the samples. The numbers correspond to the samples in the Figure 12a.
Tests of unmodified oxide layers of WS2, cooperating with TG15 plastic, show its higher consumption (Figure 11b). Such a phenomenon is probably the result of “plastic dusting” (Figure 14a), caused by the reduction of sorption of the material to the oxide layer and its worse adhesion. The use of WS2 layer modification in a tribological combination results in an increased adhesion of the sliding film and a faster change in the nature of the tribological cooperation from layer–plastic to plastic–plastic, which results in a lower intensity of the wear of the polymer stem at a later stage of the cooperation. This is particularly evident for samples 3 and 7.
4. Conclusions
The research presented in this article has consisted of examining the influence of the WS2 admixture in the electrolyte and the type of sputtering of the samples on the calculations of the size of the nanopores and the walls of the aluminum oxide. For this purpose, the DOE A 2k factorial design with one repetition has been used. The 2k factorial design has also been used to analyze the influence of the WS2 admixture in the electrolyte and the load on the tribological properties of the Al2O3-TG15 sliding node. Pareto charts and two-way ANOVA have been used to determine the relations of influence. The results show that DOE is an effective method of analysis due to the significant interaction between the input variables and the investigated properties.
- Analysis of variance has allowed us to establish that the material sputtered (carbon and gold) on the surface before SEM tests has a significant impact on the calculations related to the size of surface nanopores and Al2O3 walls. The carbon sputtering preparation was characterized by about 20% larger nanopore diameters and about 30% larger values of the size of Al2O3 walls in relation to the gold sputtering preparation. The DOE analysis has not shown a significant effect of WS2 doping to the electrolyte on the sizes of Al2O3 walls and nanopores.
- Analysis of variance and Pareto charts shows that both the load and the type of electrolyte have an impact on the values of friction coefficient. Spearman’s rank coefficient correlation shows a strong negative correlation between the coefficient of friction and the load (R = −0.67), and the coefficient of friction and the type of electrolyte (R = −0.51). A very strong positive correlation (R = 0.87) has been shown for the relationship between the mass wear of the TG15 compound and the load. A moderate positive correlation (R = 0.43) has been found between the mass wear parameter of TG15 and the type of electrolyte. The application of the WS2 admixture to the electrolyte slightly reduces the wear of the TG15 polymer pin and increases the coefficient of friction for the tested friction node. This result may be caused by an improved sorption of the material to the oxide layer and increased adhesion.
Author Contributions
Conceptualization, J.K.; data curation, J.K.; formal analysis, J.K., M.B. and M.N.; investigation, R.M., K.H., M.B., and D.B.; methodology, J.K.; supervision, J.K.; visualization, J.K. and M.N.; writing—original draft, J.K. and M.B.; writing—review & editing, J.K. All authors have read and agreed to the published version of the manuscript.
Funding
This research received no external funding.
Data Availability Statement
Data available on request from J.K.
Acknowledgments
We would like to express our immense appreciation to Anna Łatkiewicz for SEM/EDS analysis.
Conflicts of Interest
The authors declare no conflict of interest.
References
- Bruera, F.A.; Kramer, G.R.; Vera, L.; Ares, A.E. Low-Cost Nanostructured Coating of Anodic Aluminium Oxide Synthesized in Sulphuric Acid as Electrolyte. Coatings 2021, 11, 309. [Google Scholar] [CrossRef]
- Gombár, M.; Vagaská, A.; Harničárová, M.; Valíček, J.; Kušnerová, M.; Czán, A.; Kmec, J. Experimental analysis of the influence of factors acting on the layer thickness formed by anodic oxidation of aluminium. Coatings 2019, 9, 57. [Google Scholar] [CrossRef]
- Buczko, Z.; Olkowicz, K.; Krasucki, J.; Grabowiecki, K.; Osuchowska, E.; Tomassi, P. Superhydrophobic properties of aluminium produced by surface abrasive blasting, anodic oxidation and fatty acid impregnation. Trans. Inst. Met. Finish. 2021, 99, 73–79. [Google Scholar] [CrossRef]
- Bruera, F.A.; Kramer, G.R.; Vera, M.L.; Ares, A.E. Synthesis and morphological characterization of nanoporous aluminum oxide films by using a single anodization step. Coatings 2019, 9, 115. [Google Scholar] [CrossRef]
- Chung, C.K.; Liao, M.W.; Lee, C.T.; Chang, H.C. Anodization of nanoporous alumina on impurity-induced hemisphere curved surface of aluminum at room temperature. Nanoscale Res. Lett. 2011, 6, 596. [Google Scholar] [CrossRef]
- Skoneczny, W. Effect of the base material condition on the structure and properties of Al2O3 oxide layers. Indian J. Eng. Mater. Sci. 2020, 27, 128–132. [Google Scholar]
- Stȩpniowski, W.J.; Bojar, Z. Synthesis of anodic aluminum oxide (AAO) at relatively high temperatures. Study of the influence of anodization conditions on the alumina structural features. Surf. Coatings Technol. 2011, 206, 265–272. [Google Scholar] [CrossRef]
- Sulka, G.D.; Stepniowski, W.J. Structural features of self-organized nanopore arrays formed by anodization of aluminum in oxalic acid at relatively high temperatures. Electrochim. Acta 2009, 54, 3683–3691. [Google Scholar] [CrossRef]
- Kwolek, P.; Drapała, D.; Krupa, K.; Obłój, A.; Tokarski, T.; Sieniawski, J. Mechanical properties of a pulsed anodised 5005 aluminium alloy. Surf. Coatings Technol. 2020, 383, 125233. [Google Scholar] [CrossRef]
- Jensen, F.; Gudla, V.C.; Kongstad, I.; Ambat, R. High frequency pulse anodising of aluminium: Anodising kinetics and optical appearance. Surf. Coatings Technol. 2019, 360, 222–231. [Google Scholar] [CrossRef]
- Bononi, M.; Giovanardi, R.; Bozza, A. Pulsed current hard anodizing of heat treated aluminum alloys: Frequency and current amplitude influence. Surf. Coatings Technol. 2016, 307, 861–870. [Google Scholar] [CrossRef]
- Lee, W.; Schwirn, K.; Steinhart, M.; Pippel, E.; Scholz, R.; Gösele, U. Structural engineering of nanoporous anodic aluminium oxide by pulse anodization of aluminium. Nat. Nanotechnol. 2008, 3, 234–239. [Google Scholar] [CrossRef]
- Mohammadi, I.; Afshar, A. Modification of nanostructured anodized aluminum coatings by pulse current mode. Surf. Coatings Technol. 2015, 278, 48–55. [Google Scholar] [CrossRef]
- Mohammadi, I.; Ahmadi, S.; Afshar, A. Effect of pulse current parameters on the mechanical and corrosion properties of anodized nanoporous aluminum coatings. Mater. Chem. Phys. 2016, 183, 490–498. [Google Scholar] [CrossRef]
- Chung, C.K.; Zhou, R.X.; Liu, T.Y.; Chang, W.T. Hybrid pulse anodization for the fabrication of porous anodic alumina films from commercial purity (99%) aluminum at room temperature. Nanotechnology 2009, 20, 055301. [Google Scholar] [CrossRef] [PubMed]
- Chung, C.K.; Chang, W.T.; Liao, M.W.; Chang, H.C. Effect of pulse voltage and aluminum purity on the characteristics of anodic aluminum oxide using hybrid pulse anodization at room temperature. Thin Solid Films 2011, 519, 4754–4758. [Google Scholar] [CrossRef]
- Martínez-Viademonte, M.P.; Abrahami, S.T.; Hack, T.; Burchardt, M.; Terryn, H. A review on anodizing of aerospace aluminum alloys for corrosion protection. Coatings 2020, 10, 1106. [Google Scholar] [CrossRef]
- Kessentini, I.; Zouari, S.; Bakir, A.; Bargui, M. Comparative Study of Mechanical and Tribological Properties of Alumina Coatings Formed on 5754 Aluminium Alloy under Various Conditions. Surf. Eng. Appl. Electrochem. 2018, 54, 524–533. [Google Scholar] [CrossRef]
- Niedźwiedź, M.; Bara, M.; Barylski, A. Dependence of the Surface Morphology and Micromechanical and Sclerometric Properties of Al2O3 Layers on the Parameters of Anodizing Aluminum Alloy. Materials 2022, 15, 8482. [Google Scholar] [CrossRef]
- Kwolek, P.; Krupa, K.; Obłój, A.; Kocurek, P.; Wierzbińska, M.; Sieniawski, J. Tribological Properties of the Oxide Coatings Produced onto 6061-T6 Aluminum Alloy in the Hard Anodizing Process. J. Mater. Eng. Perform. 2018, 27, 3268–3275. [Google Scholar] [CrossRef]
- Wang, H.; Yi, H.; Wang, H. Analysis and self-lubricating treatment of porous anodic alumina film formed in a compound solution. Appl. Surf. Sci. 2005, 252, 1662–1667. [Google Scholar] [CrossRef]
- Azzi, A.; Maoui, A.; Fatu, A.; Fily, S.; Souchet, D. Experimental study of friction in pneumatic seals. Tribol. Int. 2019, 135, 432–443. [Google Scholar] [CrossRef]
- Chang, H.; Lan, C.W.; Chen, C.H.; Tsung, T.T.; Guo, J. Bin Measurement of frictional force characteristics of pneumatic cylinders under dry and lubricated conditions. Electr. Rev. 2012, 88, 261–264. [Google Scholar]
- Kmita, T.; Bara, M. Surface oxide layers with an increased carbon content for applications in oil-Less tribological systems. Chem. Process Eng. 2012, 33, 479–486. [Google Scholar] [CrossRef]
- Korzekwa, J.; Bara, M.; Kaptacz, S. Al2O3/WS2 Surface Layers Produced on the Basis of Aluminum Alloys for Applications in Oil-Free Kinematic Systems. Materials 2021, 14, 7738. [Google Scholar] [CrossRef]
- Omrani, E.; Moghadam, A.D.; Menezes, P.L.; Rohatgi, P.K. Influences of graphite reinforcement on the tribological properties of self-lubricating aluminum matrix composites for green tribology, sustainability, and energy efficiency—A review. Int. J. Adv. Manuf. Technol. 2016, 83, 325–346. [Google Scholar] [CrossRef]
- Fratila-Apachitei, L.E.; Tichelaar, F.D.; Thompson, G.E.; Terryn, H.; Skeldon, P.; Duszczyk, J.; Katgerman, L. A transmission electron microscopy study of hard anodic oxide layers on AlSi(Cu) alloys. Electrochim. Acta 2004, 49, 3169–3177. [Google Scholar] [CrossRef]
- Jia, Y.; Zhou, H.; Luo, P.; Luo, S.; Chen, J.; Kuang, Y. Preparation and characteristics of well-aligned macroporous films on aluminum by high voltage anodization in mixed acid. Surf. Coatings Technol. 2006, 201, 513–518. [Google Scholar] [CrossRef]
- Zhao, X.; Li, W. Morphology and hydrophobicity of a polyurethane film molded on a porous anodic alumina template. Surf. Coatings Technol. 2006, 200, 3492–3495. [Google Scholar] [CrossRef]
- Korzekwa, J.; Gądek-Moszczak, A.; Bara, M. The Influence of Sample Preparation on SEM Measurements of Anodic Oxide Layers. Pract. Metallogr. 2016, 53, 36–49. [Google Scholar] [CrossRef]
- Sulka, G.D.; Zaraska, L.; Stępniowski, W.J. Anodic porous alumina as a template for nanofabrication. Encycl. Nanosci. Nanotechnol. 2011, 11, 261–349. [Google Scholar]
- Pietraszek, J.; Radek, N.; Goroshko, A.V.; Jana, A.; Ii, P. Challenges for the DOE methodology related to the introduction of Industry 4.0. Prod. Eng. Arch. 2020, 26, 190–194. [Google Scholar] [CrossRef]
- Dudek, A.; Lisiecka, B.; Radek, N.; Orman, Ł.J.; Pietraszek, J. Laser Surface Alloying of Sintered Stainless Steel. Materials 2022, 15, 6061. [Google Scholar] [CrossRef] [PubMed]
- Radek, N.; Pietraszek, J.; Gadek-Moszczak, A.; Orman, Ł.J.; Szczotok, A. The morphology and mechanical properties of ESD coatings before and after laser beam machining. Materials 2020, 13, 2331. [Google Scholar] [CrossRef] [PubMed]
- Korzekwa, J.; Bara, M.; Karpisz, D. Sample preparation methodology of the Al2O3 surface layers for self-lubricating sliding pair. In Proceedings of the 14th World Congress in Computational Mechanics (WCCM), ECCOMAS Congress 2020, Virtual, 11–15 January 2021; Volume 1000, pp. 1–11. [Google Scholar] [CrossRef]


Disclaimer/Publisher’s Note: The statements, opinions and data contained in all publications are solely those of the individual author(s) and contributor(s) and not of MDPI and/or the editor(s). MDPI and/or the editor(s) disclaim responsibility for any injury to people or property resulting from any ideas, methods, instructions or products referred to in the content. |
© 2023 by the authors. Licensee MDPI, Basel, Switzerland. This article is an open access article distributed under the terms and conditions of the Creative Commons Attribution (CC BY) license (https://creativecommons.org/licenses/by/4.0/).