Abstract
We have studied photoluminescence (PL) properties of vacuum pump mineral oil as a function of the type and intensity of ionizing radiation exposure. The mineral oil has a simple aliphatic structure, which possesses no chromophore in the traditional sense. Unexpected PL in the mineral oil has characteristic features such as variation of the emission peak wavelength depending on the excitation wavelength and intensity dramatically increasing with radiation dose. The observed behavior can be understood in the framework of a previously suggested model introducing aggregation-induced PL and the formation of conjugated clusters comprising nontraditional chromophores. Our findings can be used for the development of optical sensors for real-time monitoring of oil utilized in vacuum pumps in nuclear fusion reactors.
1. Introduction
Practical realization of a nuclear fusion power plant of the tokamak design will need creation of a sustainable high-density plasma in its reaction chamber [1]. Considering the extremely high temperature (10 times hotter than the center of the sun) needed for running the fusion reaction, such conditions are best produced with magnetic confinement in high vacuum [2]. In this and other recently suggested fusion-reaction technical solutions, the vacuum system remains one of the most critical parts. The required large-scale, high-vacuum systems are traditionally based on diffusion pumps and mechanical roughing pumps. Both pump types use vacuum fluids such as oils with low vapor pressure and high thermal stability and chemical inertness [3]. However, the environment conditions in thermonuclear fusion applications are even harsher, which raise additional challenges for the materials being used in such applications [4]. In particular, the materials used in the reactor are exposed to a high flux of neutrons, gamma-ray and X-ray radiation, and products/byproducts of nuclear reaction, including tritium [5,6].
Mineral oils can be obtained from crude petroleum oil and are typically a mixture of large hydrocarbon compounds (composed of carbon and hydrogen only) and trace amounts of impurities containing—in addition to carbon and hydrogen—nitrogen, oxygen, sulfur, and some other elements [7]. There are two main classes of mineral oil used in industry: so-called paraffinic base oils, which have mainly C-C straight chains; and naphthenic base oils, which contain cyclic (aromatic) or linear (olefinic) non-saturated C=C double bonds [5]. Among the industrial applications of mineral oils, one should mention first of all their usage as lubricants (engines, bearings etc.), insulators (high voltage transformers), and coolant fluids (e.g., solar energy concentrators) [8]. High-purity mineral oils can be also used in the rotary or diffusion pumps of vacuum systems [9]. Therefore, physical properties such as viscosity, thermal stability, dielectric constant, specific heat and vapor pressure are of paramount importance.
Degradation of mineral oil (also known as aging) is defined as a slow irreversible change of the useful properties due to oxidation, hydrolysis or pyrolysis under the influence of the environment and thermocycling during their use [7]. Quantification of oil degradation is an important task related to various types of oils. Depending on the application, several monitoring methods were developed to control the stability and performance characteristics of the oil. Such physical and physicochemical methods as differential calorimetry (DSC), viscosity measurements, acidity index tests, breakdown voltage, loss factor, interfacial tension, particle size distribution analysis and some others were successfully applied [10,11,12,13,14]. However, the existing methods for monitoring oil degradation are rather complicated, time consuming and can be accomplished only by trained personnel. Additional drawbacks of current protocols include requirements of a relatively large amount of the oil (tens of milliliters), multistep sample preparations and rather complex experimental equipment [14]. Optical methods of oil characterization were suggested as an attractive alternative to other physical techniques [15,16,17,18]. Their obvious advantage is their non-destructiveness and the possibility of online control of the oil during operation. Thus, characteristics of oil degradation have been addressed for oils used as lubricants or insulators in electrical transformers [19,20]. Each of these studies had unique features. However, the main characteristic common to all applications was in the observation of color changes due to the exposure of the oil to an oxidative environment under high temperature [21]. The main conclusion of those studies was that the observed coloration of the oils was not necessarily representative of significant deterioration of their properties and that UV-Vis spectroscopy or even a simple colorimetric approach allows, in principle, monitoring of the oxidation process [22]. The PL technique was applied for oil quality monitoring in several recent publications [7,12,22]. The authors mentioned, among other things, extremely high sensitivity and relative simplicity of the method. However, despite these efforts, the development of a simple and reliable means to monitor oil degradation or contamination remains a critical need.
In our paper, we report on the studies of the PL of one of the most common vacuum pump oils, a pure mineral oil, induced as a result of two types of ionizing radiation exposure: gamma rays and neutrons. Photoemission spectroscopy is among the most sensitive spectroscopy techniques, allowing detection of 10−9 mole level of luminophores (such as radiation-imposed defects) [23]. Therefore, the suggested approach allows early detection of the degradation changes in oil not attainable by other techniques such as viscosity or colorimetrics [24]. Moreover, our studies have revealed an interesting effect of radiation-imposed PL in a fluid, which normally does not possess this property (nontraditional or aggregation-induced chromophores).
2. Experimental
Mineral oil (MO) (LVO 500) was purchased from Leybold USA and used as received [25]. Hexane, chloroform, toluene were purchased from Sigma-Aldrich and used as received. Irradiation of the oil samples was performed using a Foss Therapy Services Model 812 60Co gamma irradiator. This model features three special form 60Co pencil sources arrayed on one face of the irradiation chamber and utilizes an integrated turntable to deposit a uniform dose to loaded samples. Reported absorbed dose rates were determined from decay-corrected NIST traceable dose-rate maps provided by the vendor which have been verified using Fricke dosimetry. Absorbed dose rates during the experimental period ranged from 1.0 to 1.1 Mrad/h (10–11 kGy/h) ± 5% due to the natural decay of 60Co of the duration. All reported absorbed doses are reported at the water equivalence. Due to the gamma heating of the samples, air temperatures within the chamber were measured as high as 55 °C. The target absorbed doses given to the oils by the 60Co source were: 0.213 MGy, 1.5 MGy, 2 MGy, 4 MGy, 6 MGy, and 7.5 MGy.
The neutron dose was delivered by the 2 MW research reactor at the Rhode Island Nuclear Science Center (RINSC). The thermal, epithermal, and fast fluxes of 1.8 × 10¹³, 1.2 × 10¹², and 1.8 × 10¹² N/(cm2 s), corresponding to 0.025 eV, 0.26 eV, and 1 keV, respectively, were used to estimate the tissue equivalent absorbed doses. A neutron dose estimate was calculated using the three-group neutron fluences and the ANSI/HPS N.13.3 fluence to dose conversion factors to deliver the estimated neutron doses of 0.2 to 3.3 MGy [26]. Only the neutron doses are used to characterize these irradiations because the gamma-ray dose to the oil at the irradiation location is unknown. The term “neutron dose” used within the text should be understood as a mixed dose with some unknown contributions from the gamma component. As will be shown below, the effect of neutron irradiation on the physical properties of the oil significantly exceeded that of the pure gamma irradiation, thus giving a justification for such an approach.
3. Fluorescence Measurements
Fluorescence properties of irradiated oils were studied with a Quanta Master 60 double monochromator (Photon Technology International Inc) applied in the range of 250–700 nm. Oil samples were dissolved in hexane (5.5 mg/mL) and were put in 3 mL quartz cuvettes (1 × 1 cm2 square cross section). Insoluble solid samples were ground and then deposited as a powder on glass slides covered with a double-sided adhesive tape. These slides were then put inside the quartz cuvette at a 45 deg angle to the source of light and to the photodetector. Estimated thickness of the powder layer was 5 µm. The spectra were recorded in a photon-counting regime at various excitation wavelengths, which allowed us to find the emission maximum λmax (the peak position of the curve with the highest emission intensity) and the wavelength of excitation corresponding to the maximum of the emission. The integral intensity (area under the peak) was calculated using KaleidaGraph v. 4.1 (Synergy Software, Reading, PA, USA) software and used for computation of the relative integral intensity ratios.
4. Infrared and NMR Spectroscopy
Attenuated total reflection mode Fourier transform infrared spectroscopy (ATR-FTIR) was applied to study the chemical changes after irradiation. A drop of oil was put directly onto a Smart iTR single bounce diamond ATR crystal and analyzed using a Thermo Scientific 6700 FTIR equipped with a mercury–cadmium–telluride narrow band detector.
NMR spectroscopy was applied to detect chemical changes due to irradiation. Oil samples were dissolved in deuterated chloroform and studied with a Bruker 300 MHz spectrometer.
5. Viscosity Measurements
Viscosity was measured on a Brookfield DVT3 rheometer. All viscosities were measured at steady state at a shear rate of 100 s−1. Relative viscosity, as a ratio of irradiated oil viscosity to that of the original LVO500 oil, was then calculated. For small volume oil samples (~1 mL) this parameter was also found by application of a falling ball technique using a steel ball with a diameter of 2.36 mm and an NMR testing tube with an inner diameter of 4.12 mm (d/D ratio of 0.57) [27].
6. Results and Discussion
Exposure to ionizing radiation produces obvious changes in the color and physical state of the mineral oil. Figure 1 demonstrates that depending on the dose the external appearance of the oil changes to yellowish and then to deep brown. Color changes of the oil are attributed to increased oxidation. More dramatic changes are observed as a result of neutron irradiation. High doses cause solidification of the material and modification of its physical state from liquid to wax state and finally to a brittle solid. It is interesting to note that the resulting polymer is not soluble in organic solvents, thus giving evidence of its cross-linked state.
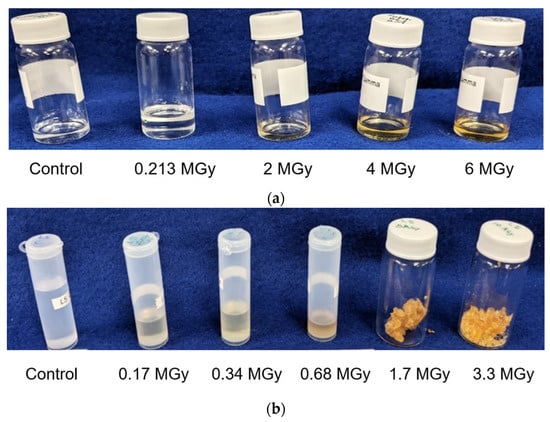
Figure 1.
External appearance of LVO 500 oil after (a) γ dose and (b) neutron dose at different total dose levels.
Figure 2 shows an increase of the PL intensity with gamma-ray dose. The original oil shows no fluorescence in the visible range and a very weak one in deep-UV, while after gamma irradiation the intensity dramatically increases and is shifted to near-UV, with the long wavelength slope of the fluorescence peak spreading to 600 nm. More detailed information about fluorescence properties can be revealed under excitation of the emission using different excitation wavelengths (Figure 3). It can be seen that the original oil shows traditional PL with some characteristic peaks of emission. There is one more intensive peak at 300 nm and several smaller peaks in the range of 320 to 370 nm corresponding to the vibronic structure of the first excited state on the energy diagram. Those spectral positions remain the same and the intensity goes through the maximum when the excitation wavelength is increased from 250 to 320 nm. It is worth noting that the emission of the control (unirradiated) oil is still an order of magnitude more intensive than the background emission from the solvent (Figure S1).
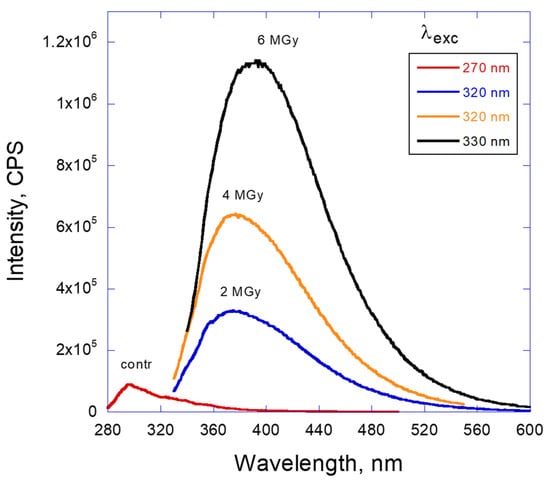
Figure 2.
Fluorescence spectra of LVO500 oil in hexane depending on the dose of gamma radiation.
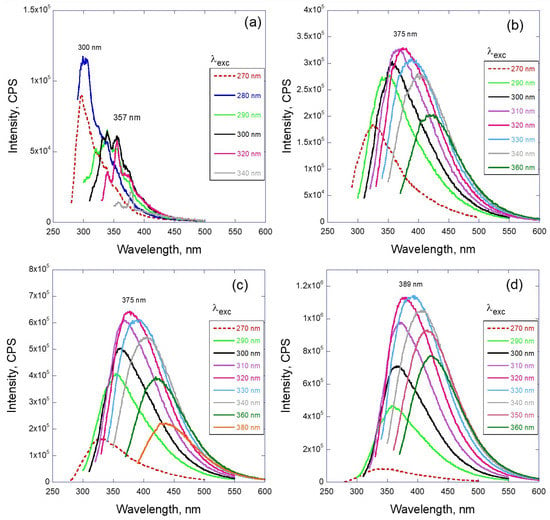
Figure 3.
Fluorescence spectra of LVO500 oil in hexane depending on the wavelength of excitation for (a) original oil and after gamma irradiation with the dose: (b) 2 MGy, (c) 4 MGy, and (d) 6 MGy.
The fluorescence emission peaks of the irradiated oil are quite different from those associated with the unirradiated oil. For the gamma-ray-irradiated oil, not only does the emission peak intensity go through a maximum, but also there is a spectral shift depending on the excitation wavelength. Figure 3 demonstrates this effect for irradiation doses up to 6 MGy. It can be seen that the intensity of the emission increases by at least one order of magnitude in comparison with the pristine oil and depends strongly on the dose. Simultaneously, the maximum of the emission peak moves from UV (350 nm) to visible light (400–500 nm). A family of emission curves recorded for varied excitation wavelengths form a broad “envelope” curve spreading over 250 nm in the spectral range. The position of the maximum of the envelope also moves to higher wavelengths with the dose of gamma radiation.
Similar, but even more dramatic behavior can be observed for LVO 500 oil samples exposed to neutrons. Figure 4 demonstrates the effect of radiation on this oil for relatively low doses up to ~0.7 MGy when the oil remains liquid (portion a) and for higher doses more than ~1.5 MGy corresponding to the solidified material. The intensity of the PL is difficult to compare in this case as the solid-state material was not soluble in hexane, or any other organic solvent that was tried, and therefore was studied as a solid film deposited on glass slide. Nevertheless, the qualitative comparison between portions a and b of this figure shows the main differences between two cases. For the doses below 6 MGy the PL peak position remains the same (λmax is at 372 nm) and represents a similar bell-like “envelope” distribution as the gamma-irradiated samples. High neutron-dose spectra are shifted to the visible range: 430 nm and 467 nm for 1.7 and 3.3 MGy doses, respectively. In this case the maximum of the emission is obviously dependent on the dose of neutron irradiation and has a complex shape with several overlapping, relatively sharp maxima. In addition, the overall position of the emission is shifted to the visible range (400–600 nm).
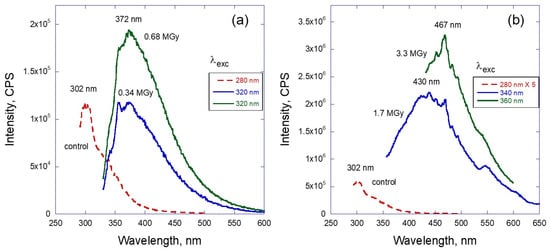
Figure 4.
Fluorescence spectra of LVO500 oil depending on the dose of neutron radiation: (a) samples which remain liquid (spectra in hexane solution), (b) solidified after irradiation (spectra in solid state).
Similar to the gamma irradiation analysis, the dependence of emission intensity on the excitation wavelength is presented in Figure 5. Representative curves are shown for two situations: low dose of radiation (0.17 and 0.34 MGy—Figure 5a,b) and high dose of radiation (1.7 and 3.3 MGy—Figure 5c,d). The low dose samples demonstrate the features similar to gamma-irradiated samples (compare with Figure 3), which are the bell-like shape of the envelope and excitation-dependent wavelength position of the peak maximum. Graphs (c) and (d) of this figure demonstrate the more traditional behavior of the PL, where the position of the emission maximum remains the same and just the intensity of the emission varies with the excitation wavelength.
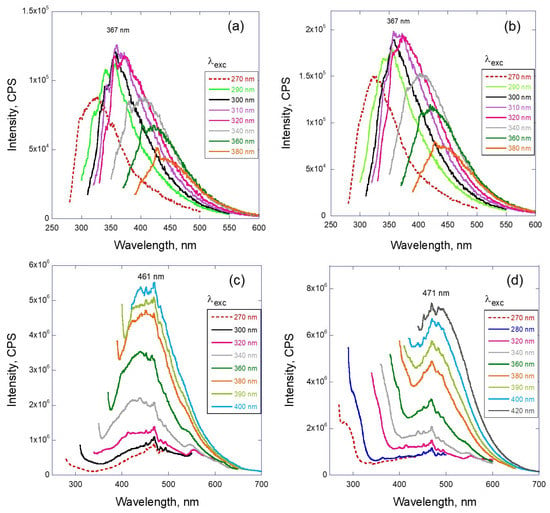
Figure 5.
Representative fluorescence spectra of LVO 500 after neutron irradiation with the dose: (a) 0.17 MGy, (b) 0.34 MGy (solutions in hexane) and (c) 1.7 MGy, (d) 3.3 MGy (solid state fluorescence) depending on the excitation wavelength λexc.
A comparison of the relative changes of the intensity depending on the dose of radiation is presented in Figure 6 for both gamma-ray and neutron-irradiated samples and characteristic features of the aggregate state, physical appearance and PL spectra of the samples are summarized in Table 1. Figure 6 demonstrates a good correlation between PL enhancement and increase of the relative viscosity of the oil as a result of radiation exposure. Interestingly, the same type of characteristic behavior of the PL integral intensity and viscosity versus the dose is observed for neutrons and gamma ray exposure (i.e., linear dependence for the former case and nonlinear exponential dependence for the latter case). Therefore, PL properties can be linked to physical properties of the system and can be used as a simple method for monitoring of the aging imposed by radiation.
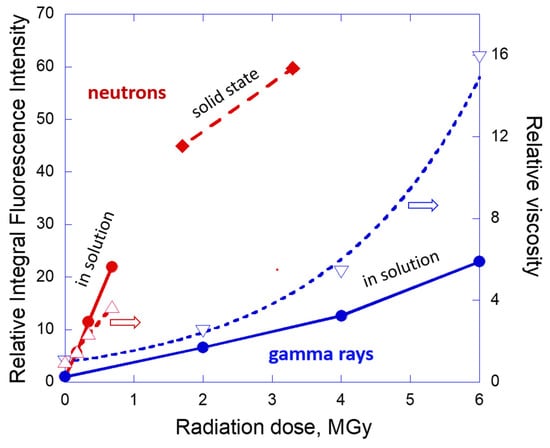
Figure 6.
Representative integral fluorescence intensity of LVO500 oil (solution in hexane or solid state) and variation of viscosity of the oil depending on the dose of radiation. Red color signs and lines correspond to neutron irradiated and blue ones to gamma irradiated samples. Solid circles or diamonds correspond to relative PL intensity and open triangles to relative viscosity values. Dashed lines correspond to a linear (neutrons) and exponential (gamma) fit of the viscosity data. Solid lines for PL data are a guide for the eye.

Table 1.
Characteristic optical and physical properties of LVO500 oil exposed to radiation.
Based on the observed changes of the color it would be natural to assume some oxidative degradation of the material under irradiation [28]. In order to understand chemical changes in the oil we have made a detailed spectroscopic study with 1H NMR and FTIR techniques. The digested NMR spectra are shown in Figure 7 and more detailed spectra in the supplementary file (see Figure S2). The survey spectrum in Figure 7 as well as the Insert (a) demonstrate high purity of the oil with almost 100% of the spectrum intensity corresponding to aliphatic chains (more intensive singlet peak of -CH2- groups at chemical shift δ = 1.28 and less intensive quartet at δ = 0.881 for -CH3 end groups) [29]. The peak at δ = 7.28 corresponds to a residual solvent (CHCl3) present in less than 0.1% quantity and can be used as a reference for estimation of the concentration of other chemical groups (impurities or generated under irradiation). The main changes observed in NMR spectra due to irradiation appear in three parts of the spectra: δ = 1.5–2.5 range (insert b), δ = 4–6 range (insert c), and δ 9.8 (insert d). The observed new features are similar for gamma- and neutron-irradiated samples. The first range (δ = 1.5–2.5) corresponds to oxygen-containing aliphatic groups (ketones), while the second one (δ = 4–6) gives evidence of generation of conjugated fragments in the aliphatic chains under irradiation. Comparison of the intensity of these new peaks with the residual CHCl3 peak intensity shows that the new groups in the range 1.5–2.5 are generated in millimolar quantity while other groups appear in ppm concentration (especially the peak at δ 9.8, which can be assigned to some aromatic structures).
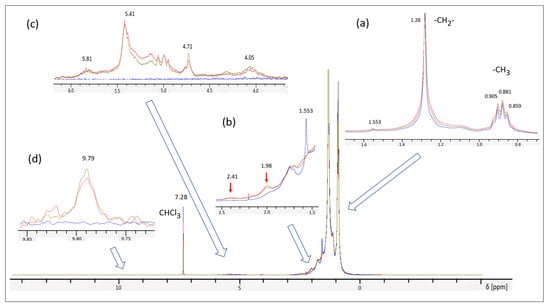
Figure 7.
1H NMR spectra of the original LVO500 oil sample (blue) and those after exposure to 6 MGy gamma radiation (red) and 1.7 MGy neutron radiation (olive). Spectra recorded for oil solutions in CDCl3 (20 mg/mL). The inserts show characteristic regions where changes are observed under radiation with blue arrows pointing to the corresponding parts of the survey spectrum. Red arrows point to two new peaks corresponding to oxygen-containing groups (aliphatic ketone), which are generated in higher concentration in comparison to other groups.
Infrared spectroscopy generally supports this conclusion (Figure 8). The ATR-FTIR spectra show the appearance of new peaks at 970 cm−1, which can be assigned either to conjugated fragments or to bending vibration of oxygen-containing groups [30]. Higher doses of radiation in the case of neutron exposure is accompanied with an additional peak at 1714 cm−1, which may belong to hydroxylic or ketone oxygen-containing groups in the aliphatic chains [31]. It should be mentioned that no significant oxidation could be found in the oil if the dose of radiation did not exceed 4 MGy (gamma) or 0.68 MGy (neutrons).
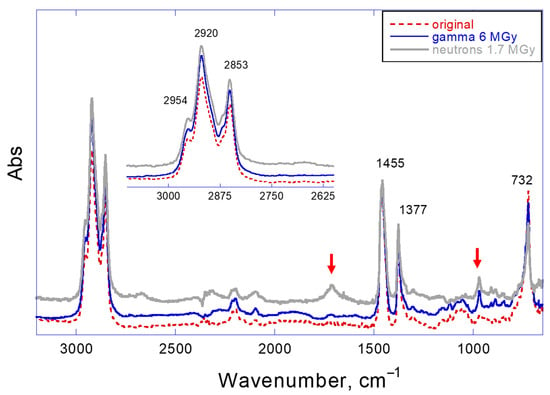
Figure 8.
FTIR spectra of original and irradiated LVO 500 oils (6 MGy gamma and 1.7 MGy neutron dose).
The PL of traditional organic dyes originates from conventional chromophores with 𝜋-conjugated systems (alternating single-double carbon bonds, aromatic rings). Such systems are characterized with a narrow energy gap (energy distance between the highest occupied and the lowest unoccupied molecular orbitals, HOMO and LUMO, correspondingly), which leads to optical absorption and emission in the visible range of light (red-shifted in comparison to similar molecules without conjugation). Typically, rigid or planar conformations of conjugated fragments (especially for aromatic compounds) restricts possible movements of the chromophores leading to their strong emissions both in solution and the solid state.
The mineral oil under study has a simple chemical structure without conjugation, which should not possess any PL properties. One possible explanation of the observed PL can be found when one refers to a concept of aggregation-induced emission (AIE) developed about 20 years ago [32,33].
Heteroatoms or unsaturated bonds, if present in the oil as impurities or as a result of radiation-induced degradation, are well-separated (especially when they are in dilute solutions) and PL is weak or absent. However, when the number of such defects increases, they may begin to cluster, producing an effect known as a clustering-triggered emission (CTE) [34].
In the CTE model, nonconventional chromophores aggregate into clusters, which leads to close contact of the chromophores and thus to sharing and/or overlap of their electron clouds. As a result, the conjugation is extended through intermolecular interactions (n–𝜋, 𝜋–𝜋, or n–n type) [35] and corresponding bandgap energies can be lower than in a non-aggregated state, which promotes strong, red-shifted PL in the system such as J-aggregate formation in traditional chromophores [36]. In addition, more robust conformation of the clusters and surrounding molecules creates physical confinement, which can suppress nonradiative decay routes of excitation and enhance light emission intensity. The term “cluster” in this context should not be confused with ordinary aggregates or nanocrystals of molecules or atoms. It rather refers to places of close location of some chemical groups with stronger intra- or inter-molecular interactions between them. Therefore, the clusters might be labile (i.e., be formed and then rearranged) and, also, might be of various sizes leading to unusual spectral behavior, such as variation of the emission peak maximum depending on the excitation wavelength.
The suggested model explaining the observed effects is presented in Figure 9. Radiation damage of oil molecules causes formation of conjugated fragments. In the presence of oxygen, some of such groups can be converted into oxygen-containing structural defects, which may be accelerated under high doses of ionizing radiation. Molecules with polar oxygen defects are then expelled from the rest of the material due to the microphase separation effect and form clusters kept together by hydrogen bonds or other types of intermolecular interaction, thus forming nontraditional chromophores as described above. It should be mentioned that such clusters simultaneously act as physical crosslinks, increasing viscosity into the system. The observed solidification and insolubility of mineral oil exposed to a high neutron dose in organic solvents demonstrates that clustering may also result in irreversible chemical crosslinking.
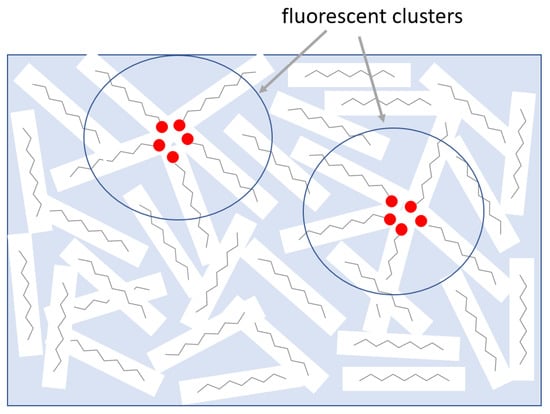
Figure 9.
Suggested model of aggregation-induced chromophores under the influence of radiation. Radiation damage of oil molecules causes formation of oxygen-containing groups. Molecules with polar oxygen defects are then expelled from the rest of the material due to microphase separation and form clusters kept together by hydrogen bonds. These clusters simultaneously act as physical crosslinks increasing viscosity and chromophores responsible for PL properties.
An alternative explanation of the observed unusual PL in the aliphatic oil could be suggested, based on radiation-induced formation of so-called polycyclic aromatic hydrocarbons (PAHs) in the system. Such structures, also known as carbon quantum dots, have attracted the attention of the scientific community as a simple way of production of fluorescent tags or tracers for biology, medicine, and other applications [37]. It should be mentioned that PAHs are synthesized under relatively harsh conditions of hydrothermal synthesis followed by pyrolysis [38]. In principle, such conditions can be generated locally in the material during the interaction of neutrons or gamma rays with the matter. However, our spectroscopy studies have demonstrated that aromatic structures, if present in the system, are in concentrations well below or near the detection limit of FT-IR or proton NMR techniques (ppm quantity). In accordance with the review papers, PAH chromophores do show similar optical behavior, i.e., an excitation wavelength dependent and red-shifted emission maxima [39]. However, the characteristics were reported only for systems with at least millimolar concentrations of PAHs [40]. Therefore, we consider such an explanation to be less probable for the radiation-induced PL effect presented in our paper.
Thermal oxidative degradation of oils was a subject of many previous studies [41]. In order to shed light on the exact type of clusters responsible for PL, two additional experiments were carried out: thermal treatment at 200 °C for one week in the presence of oxygen; or in an inert atmosphere of argon. In both cases the oil gained PL properties. Oxidative thermal degradation was accompanied by color changes while the oxygen-free environment resulted in a colorless, transparent material. PL spectra in both cases were similar to those observed for irradiated samples but with smaller intensity (Figure S3). Therefore, one can conclude that radiation exposure has a similar effect on the structure of the mineral oil to thermal treatment. However, the magnitude of the PL peak enhancement was in this case much smaller than in the case of the ionizing radiation exposure. Figure 10 demonstrates that even a short time (relatively low dose) gamma-ray or neutron beam exposure of the mineral oil brings significantly (3 to 5 times) higher PL peak integral intensity in comparison to a one-week thermal degradation process. The observed visual changes (coloration) of the oil are mainly due to an oxygen attack while the appearance of the PL properties is mainly due to conjugated fragments, which may or may not be directly related to oxygen-containing groups in the exposed oil.
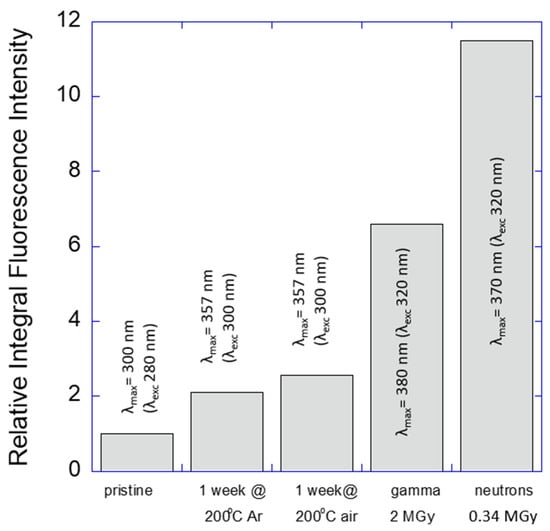
Figure 10.
Comparison of the relative integral intensity of emission for thermally degraded (in Ar atmosphere or in air) and radiation-degraded LVO500 mineral oil (0.34 MGy neutron or 2 MGy gamma dose). In accordance with the observed red-shifted emission maxima (λmax) different excitation wavelengths (λexc) were applied in each case as shown in the diagram.
Our studies also demonstrated the versatility of the fluorescence spectroscopy approach to assessment of the mechanism and degree of mineral oil degradation during radiative exposure. With proper calibration, this method may be used as a simple diagnostic tool for online monitoring of oil aging or for non-destructive optical diagnostics of condition/quality of various materials (or constructions) in some industrial processes as demonstrated in Nasieka et al. [42] and Sobrinho et al. [43]. Other methods such as colorimetric measurement, spectroscopy or viscometry are much less sensitive to chemical and especially physical changes in oil lubricants, require multiple sample preparation steps, are time consuming and/or require a larger volume of sample for such analyses.
7. Conclusions
Mineral oil exposed to various doses of ionizing radiation acquires PL properties with a broad fluorescence peak shifted to the visible range. The radiation-imposed PL has characteristic features of the intensity increasing with the obtained radiation dose and emission peak position changing with the excitation wavelength. Such unusual optical properties of an aliphatic compound with a simple saturated chemical structure agrees with the model of aggregation-induced fluorescence previously observed in nontraditional organic chromophores. We have demonstrated high sensitivity of the applied fluorescence method for quantification of the molecular changes induced by both heating and a radiation dose. The employed approach has good prospects for applications in sensors for real time or post factum monitoring of the extent of various forms of degradation in vacuum oils.
Supplementary Materials
The following supporting information can be downloaded at: https://www.mdpi.com/article/10.3390/lubricants11070287/s1, Figure S1: PL spectra of hexane under different excitation wavelength, Figure S2: H-1 NMR spectra of LVO500 oil original and after gamma or neutron irradiation, Figure S3: PL spectra of thermally degraded LVO500 oil Ar atmosphere or in air.
Author Contributions
Conceptualization, V.N.B.; methodology, V.N.B., T.A.D., C.V., K.M., T.G. and J.F.; formal analysis, T.A.D.; investigation, V.N.B. and J.S.; resources, T.A.D. and C.V.; data curation, T.A.D.; writing—original draft preparation, V.N.B. and J.S.; writing—review and editing, V.N.B., T.A.D. and G.L.; visualization, V.N.B.; supervision, T.A.D.; project administration, G.L. funding acquisition, G.L. All authors have read and agreed to the published version of the manuscript.
Funding
This research was funded under ARPA-E/Fusion Energy Sciences grant #DE-AR0001376 entitled “EM-enhanced HyPOR Loop for Fast Fusion Fuel Cycles”. SRNL is managed and operated by Battelle Savannah River Alliance, LLC under Contract No. 89303321CEM000080 with the U.S. Department of Energy.
Data Availability Statement
The data presented in this study are available on request from the corresponding author.
Acknowledgments
Authors thank George Chumanov (Clemson University) for giving access to PL spectrometer in his lab and to Carson Allen for viscosity measurements of neutron irradiated oil. Government license to provide public access under the DOE Public Access Plan (http://energy.gov/downloads/doe-public-access-plan (accessed on 6 July 2023)). The United States Government retains and the publisher, by accepting this article for publication, acknowledges that the United States Government retains a non-exclusive, paid-up, irrevocable, worldwide license to publish or reproduce the published form of this work, or allow others to do so, for United States Government purposes.
Conflicts of Interest
The authors declare no conflict of interest.
Abbreviations
The following abbreviations are used in this manuscript:
| ATR-FTIR | Attenuated total reflection Fourier transform infrared spectroscopy |
| CTE | clustering-triggered emission |
| HOMO | Highest occupied molecular orbital |
| LUMO | Lowest unoccupied molecular orbital |
| MO | Mineral oil |
| NMR | Nuclear Magnetic Resonance |
| PAH | polycyclic aromatic hydrocarbons |
| PL | photoluminescence |
| UV | ultraviolet |
References
- Krane, K.S. Introductory Nuclear Physics; John Wiley & Sons: Hoboken, NJ, USA, 1988; ISBN 978-0-471-80553-3. [Google Scholar]
- Momose, T.; Ishimaru, H. Radiation damages in TRISTAN vacuum systems. J. Vac. Sci. Technol. A 1991, 9, 2149–2157. [Google Scholar] [CrossRef]
- Vertes, M. Fluids for diffusion pumps. Vacuum 1993, 44, 769–781. [Google Scholar] [CrossRef]
- Pedroche, G.; Lopez-Revelles, A.J.; Kolsek, A.; Dremel, M.; Bansal, G.; Pearce, R.; Sanz, J.; Juarez, R. Nuclear analysis of the ITER torus cryopumps. Nucl. Fusion 2019, 59, 106045. [Google Scholar] [CrossRef]
- Nicholas, N.; Shaffer, B. All-metal scroll vacuum pumps for tritium processing systems. Fusion Sci. Technol. 2020, 76, 366–372. [Google Scholar] [CrossRef]
- Larsen, G.; Babineau, D. An evaluation of the global effects of tritium emissions from nuclear fusion power. Fusion Eng. Des. 2020, 158, 111690. [Google Scholar] [CrossRef]
- Thanua, N.; Kumbhar, G.B. Aging performance of transformer oil insulation—State of the art review. In Proceedings of the 2021 IEEE 5th International Conference on Condition Assessment Techniques in Electrical Systems (CATCON), Kozhikode, India, 3–5 December 2021; pp. 282–285. [Google Scholar]
- Gomna, A.; N’Tsoukpoe, K.E.; Le Pierrès, N.; Coulibaly, Y. Review of vegetable oils behaviour at high temperature for solar plants: Stability, properties and current applications. Sol. Energy Mater. Sol. Cells 2019, 200, 109956. [Google Scholar] [CrossRef]
- Guin, T.; McDonald, K.; Folkert, J.; Verst, C.; Gaillard, J.; DeVol, T.A.; Bliznyuk, V.N.; Larsen, G. Organic vacuum pump fluids for the vacuum pumping of fusion power plants. Fusion Sci. Technol. 2023. [Google Scholar]
- Dumitran, L.M.; Setnescu, R.; Notingher, P.V.; Badicu, L.V.; Setnescu, T. Method for lifetime estimation of power transformer mineral oil. Fuel 2014, 117, 756–762. [Google Scholar] [CrossRef]
- Degeratu, S.; Rotaru, P.; Rizescu, S.; Danoiu, S.; Bizdoaca, N.G.; Alboteanu, L.I.; Manolea, H.O. Condition monitoring of transformer oil using thermal analysis and other techniques. J. Therm. Anal. Calorim. 2015, 119, 1679–1692. [Google Scholar] [CrossRef]
- Alshehawy, A.M.; Mansour, D.-E.A.; Ghali, M.; Lehtonen, M.; Darwish, M.M.F. Photoluminescence Spectroscopy Measurements for Effective Condition Assessment of Transformer Insulating Oil. Processes 2021, 9, 732. [Google Scholar] [CrossRef]
- Perrier, C.; Beroual, A. Experimental investigations on insulating liquids for power transformers: Mineral, ester, and silicone oils. IEEE Electr. Insul. Mag. 2009, 25, 6–13. [Google Scholar] [CrossRef]
- Kaliappan, G.; Rengaraj, M. Aging assessment of transformer solid insulation: A review. Mater. Today Proc. 2021, 47, 272–277. [Google Scholar] [CrossRef]
- Kalathiripi, H.; Karmakar, S. Fault analysis of oil-filled power transformers using spectroscopy techniques. In Proceedings of the IEEE 19th International Conference on Dielectric Liquids (ICDL), Manchester, UK, 25–29 June 2017; pp. 1–5. [Google Scholar]
- Batista, D.A.; Patriarca, P.A.; Trindade, E.M.; Wilhelm, H.M. Colorimetric methodology for monitoring the cellulose insulating paper degradation in electrical equipments filled with mineral oil. Cellulose 2008, 15, 497–505. [Google Scholar] [CrossRef]
- Hadjadj, Y.; Fofana, I.; Sabau, J.; Briosso, E. Assessing insulating oil degradation by means of turbidity and UV/VIS spectrophotometry measurements. IEEE Trans. Dielectr. Electr. Insul. 2015, 22, 2653–2660. [Google Scholar] [CrossRef]
- Georgiev, A.; Karamancheva, I.; Topalova, L. Determination of oxidation products in transformer oils using FT-IR spectroscopy. J. Mol. Struct. 2008, 872, 18–23. [Google Scholar] [CrossRef]
- Santos, J.C.O.; Souza, A.G.; Santos, I.M.G.; Sobrinho, E.V.; Conceiçao, M.M. Thermodynamic and kinetic parameters on thermal degradation of automotive mineral lubricant oils determined using thermogravimetry. J. Therm. Anal. Cal. 2005, 79, 461–467. [Google Scholar] [CrossRef]
- Ganlim, C.D.; Dutta, N.K.; Roy Choudhury, N.; Kehoe, D.; Matisons, J. Evaluation of kinetic parameters of thermal oxidative decomposition of base oils by conventional, isothermal and modulated TGA, and pressure DSC. Thermochim. Acta 2002, 392, 357–369. [Google Scholar] [CrossRef]
- Wicaksono, B.; Kong, H.; Markova, L.V.; Han, H.-G. Application of fluorescence emission ratio technique for transformer oil monitoring. J. Int. Meas. Confed. 2013, 46, 4161–4165. [Google Scholar] [CrossRef]
- Alshehawy, A.M.; Mansour, D.-E.A.; Ghali, M. Condition assessment of aged transformer oil using photoluminescence-based features. In Proceedings of the IEEE 5th International Conference on Condition Assessment Techniques in Electrical Systems (CATCON), Kozhikode, India, 3–5 December 2021; pp. 282–285. [Google Scholar]
- Li, Q.; Wang, X.; Huang, Q.; Li, Z.; Tang, B.Z.; Mao, S. Molecular-level enhanced clusterization- triggered emission of nonconventional luminophores in dilute aqueous solution. Nat. Commun. 2023, 14, 409. [Google Scholar] [CrossRef]
- Leong, Y.S.; Ker, P.J.; Jamaludin, M.Z.; Nomanbhay, S.; Ismail, A.; Abdullah, F.; Looe, H.M.; Lo, C.K. UV-Vis Spectroscopy: A New Approach for Assessing the Color Index of Transformer Insulating Oil. Sensors 2018, 18, 2175. [Google Scholar] [CrossRef]
- Leybonol LVO 500; Product No. 3 00333299. Available online: https://www.leyboldproducts.us/products/oils-greases-lubricants/lubricant-leybonol/396/leybonol-lvo-500?c=1815 (accessed on 25 April 2023).
- Smith, J. The Effect of Radiation and Dose on Diffusion Pump Oils. Masters’ Thesis, Clemson University, Clemson, SC, USA, 2023. [Google Scholar]
- Tang, J.X. Measurements of fluid viscosity using a miniature ball drop device. Rev. Sci. Instrum. 2016, 87, 1–8. [Google Scholar] [CrossRef] [PubMed]
- Singh, A. Irradiation of polyethylene: Some aspects of crosslinking and oxidative degradation. Radiat. Phys. Chem. 1999, 56, 375–380. [Google Scholar] [CrossRef]
- Friebolin, H. Basic One- and Two-Dimensional NMR Spectroscopy; VCH Verlagsgesellschaft: Weinheim, Germany, 1991; pp. 37–72. [Google Scholar]
- Bley, T.; Pignanelli, E.; Schütze, A. Multi-channel IR sensor system for determination of oil degradation. J. Sens. Sens. Syst. 2014, 3, 121–132. [Google Scholar] [CrossRef]
- Macian, V.; Tormos, B.; Gomez, Y.A.; Salavert, J.M. Proposal of an FTIR methology to monitor oxidation level in used engine oils: Effects of thermal degradation and fuel dilution. Tribol. Trans. 2012, 55, 872–882. [Google Scholar] [CrossRef]
- Deng, J.; Jia, H.; Xie, W.; Wu, H.; Li, J.; Wang, H. Nontraditional organic/polymeric luminogens with red-shifted fluorescence emissions. Macromol. Chem. Phys. 2022, 223, 2100425. [Google Scholar] [CrossRef]
- Tang, S.; Yang, T.; Zhao, Z.; Zhu, T.; Zhang, Q.; Hou, W.; Yuan, W.Z. Nonconventional luminophores: Characteristics, advancements and perspectives. Chem. Soc. Rev. 2021, 50, 12616. [Google Scholar] [CrossRef]
- Liao, P.; Huang, J.; Yan, Y.; Tang, B.Z. Clusterization-triggered emission (CTE): One for all, all for one. Mater. Chem. Front. 2021, 5, 6693. [Google Scholar] [CrossRef]
- Jiang, N.; Zhu, D.; Su, Z.; Bryce, M.R. Recent advances in oligomers/polymers with unconventional chromophores. Mater. Chem. Front. 2021, 5, 60. [Google Scholar] [CrossRef]
- Würthner, F.; Kaiser, T.E.; Saha-Möller, C.R. J-Aggregates: From Serendipitous Discovery to Supramolecular Engineering of Functional Dye Materials. Angew. Chem. Int. Ed. 2011, 50, 3376–3410. [Google Scholar] [CrossRef]
- Lim, S.Y.; Shen, W.; Gao, Z. Carbon quantum dots and their applications. Chem. Soc. Rev. 2015, 44, 362–381. [Google Scholar] [CrossRef]
- Chen, Y.; Zhang, Q.; Willis, M.; Yao, Y.; Huang, J.; Wang, B.; Yu, Y.; Zhang, S. Simple method to supply organic nanoparticles with excitation- wavelength-dependent photoluminescence. Langmuir 2020, 36, 3193–3200. [Google Scholar] [CrossRef] [PubMed]
- Fu, M.; Ehrat, F.; Wang, Y.; Milowska, K.Z.; Reckmeier, C.; Rogach, A.L.; Stolarczyk, J.K.; Urban, A.S.; Feldmann, J. Carbon dots: A unique fluorescent cocktail of polycyclic aromatic hydrocarbons. Nano Lett. 2015, 15, 6030–6035. [Google Scholar] [CrossRef] [PubMed]
- Ehrat, F.; Bhattacharyya, S.; Schneider, J.; Löf, A.; Wyrwich, R.; Rogach, A.L.; Stolarczyk, J.K.; Urban, A.S.; Feldmann, J. Tracking the source of carbon dot photoluminescence: Aromatic domains versus molecular fluorophores. Nano Lett. 2017, 17, 7710–7716. [Google Scholar] [CrossRef] [PubMed]
- Shah, R.; Rizvi, S.Q.A.; Migdal, C.; DiNicola, K. Oxidation of Lubricants and Fuels. In Fuels and Lubricants Handbook: Technology, Properties, Performance, and Testing, 2nd ed.; Totten, G.E., Ed.; ASTM International Manual Series, MNL37-2ND; ASTM: West Conshohocken, PA, USA, 2019; pp. 1363–1403. [Google Scholar] [CrossRef]
- Nasieka, I.; Kovalenko, N.; Kutniy, V.; Rybka, A.; Nakonechnyj, D.; Sulima, S.; Strelchuk, V. Photoluminescence-based material quality diagnostics in the manufacturing of CdZnTe ionizing radiation sensors. Sens. Actuators A 2013, 203, 176–180. [Google Scholar] [CrossRef]
- Sobrinho, J.A.; Monteiro, J.H.K.S.; Davolos, M.R.; Cebim, M.A.; Pires, A.M. Photoluminescence and Scintillation Modulation Upon UV/X-ray-Induced Photochromism in Europium Tungstate Phosphors. Chem. Sel. 2017, 2, 3538–3548. [Google Scholar] [CrossRef]
Disclaimer/Publisher’s Note: The statements, opinions and data contained in all publications are solely those of the individual author(s) and contributor(s) and not of MDPI and/or the editor(s). MDPI and/or the editor(s) disclaim responsibility for any injury to people or property resulting from any ideas, methods, instructions or products referred to in the content. |
© 2023 by the authors. Licensee MDPI, Basel, Switzerland. This article is an open access article distributed under the terms and conditions of the Creative Commons Attribution (CC BY) license (https://creativecommons.org/licenses/by/4.0/).