Abstract
Reinforced polymers have recently gained interest because of their high stiffness associated with the classical features and cost-effectiveness of polymers. A further characteristic, suitable for several applications, is the possibility to provide high frictional and wear resistance. The frictional response of commercially available reinforced materials was here investigated in a wide range of contact boundary conditions. Experimental tests were performed on different test benches, to investigate the material frictional response under either quasistatic or fast-dynamic contact solicitations. While carbon-fiber-reinforced material exhibits a stable but low friction coefficient, the glass-fiber-reinforced material leads to the suitable combination of high friction and low wear. The PPS material, 40% (wt) glass-reinforced polymer, sliding against the Ti6Al4V titanium alloy, provided high static friction coefficients (>0.4). The same material pair was then tested in endurance under fast-dynamic contact solicitations, highlighting their resistance to wear.
1. Introduction
In recent years, the cost-effectiveness and suitability of plastic materials for different work environments (nonmagnetic behavior, radiation compatibility, etc.) led to their employment in several engineering applications. Plastics are polymeric materials with high molecular weight carbon and hydrogen chains, to which other molecular groups can be associated, conferring suitable mechanical and thermal properties for a large variety of industrial applications [1]. Their mechanical properties are generally characterized by low density, high toughness, and elongation at the break. Nevertheless, they are characterized as well by low strength, low hardness, and low thermal stability. Consequently, these mechanical limits reduce their spreading in all those applications where larger elastic moduli and yield resistance are required. As an example, whenever contact interfaces are required, the local high stresses at the contact and the needed dimensional stability of the surfaces in contact do not allow for an efficient employment of plastics.
In past decades, to increase the mechanical properties of plastics, polymers have been combined with other materials, bringing the development of a new class of reinforced polymers. Such composite materials are made up of a combination of the polymeric matrix and a hard strength filler, usually in the form of fibers or particles. In this way, it is possible to design a material conferring the desired characteristics, exploiting the best properties of the base polymers together with increased mechanical performances [2,3].
When considering the tribological applications of reinforced polymers, several works in the literature addressed their frictional and wear resistance. As an example, polyetheretherketone (PEEK) [4,5] is one of the most employed polymers in industrial applications. It is often used as bearing and sliding material, due to its excellent thermal stability, good friction, and wear resistance properties [6,7]. Recent works investigated the frictional and wear responses of PEEK and PEEK-based composites [8,9,10,11,12,13,14], highlighting the effect of reinforcements on the friction and wear responses under sliding contact.
The retrieved tribological responses of the different reinforced forms of the polymeric composites highlighted the large variability of their frictional and wear responses, as a function of the filler material (ceramics, glass, and carbon) and its form (size or length of particles/fibers) [7]. Effectively, the nature and form of the filler can affect both the physiochemical reactivity at the interface and the properties of the third body layer formed during the wear process [15,16,17]. The rheology of the third body within the interface can then drastically modify the accommodation mechanisms and the associated wear and frictional responses [15,18,19,20] and interface features such as contact stiffness and damping [21,22]. Thus, an overall generalization of tribological results to the different classes of reinforced material is basically impossible.
Within this context, this work is aimed towards the characterization of material pairs able to provide high static frictional resistance and low wear, under both quasistatic and fast-transient contact loading solicitations, under dry contact conditions. In fact, reinforced polymers are useful for several tribological applications where the loading can be either quasistatic (sliders, joints, clips, and switches) or oscillating [23,24] with fast variations of both normal and tangential contact solicitations (gear teeth, pillars [25,26,27], brake groan noise [28], stick–slip microdrives [29], acoustic motors, cams, and joints under fretting solicitations). When considering fast-transient variation of the contact status, the frictional resistance of polymeric materials can be affected as well by the time intercurred between successive sticking, sliding, or detachment phases [30,31], affecting the time for the establishment of adhesive joints between asperities at the interface. At this aim, two different experimental campaigns have been developed on specific test benches, recovering the tribological response of some commonly used reinforced polymers under both quasistatic and fast-transient contact loadings. The tested materials have been expressly selected between common composites, largely used in several industrial applications, allowing the tribological characterization of such materials for their perspective employment under different contact conditions. The experimental setup for the quasistatic test has been used to preliminary select the best materials, in terms of frictional response and wear behavior. Then, the selected materials were tested under fast-transient contact conditions. While many works in the literature deal with frictional tests of material pairs with classical tribometers, under quasistatic boundary conditions, the present approach allowed an investigation of the frictional response under fast-transient dry contact conditions as well, with a focus on the evolution of the friction coefficient as a function of imposed cycles.
2. Materials and Methods
The object of the work is the testing and identification of reinforced polymers for specific applications requiring high friction, both under quasistatic and fast-transient contact boundary conditions. Towards this aim, two different test benches and protocols have been developed. A first test campaign was developed on a linear tribometer, allowing for the selection of material pairs providing high frictional features under quasistatic loads. Then, the selected pairs were tested on a test bench specifically designed for simulating and monitoring fast-transient contact engagements, allowing for the characterization of the material responses with respect to their frictional and wear behavior.
2.1. Experimental Setup for Quasistatic Test
For quasistatic contact loadings, a linear tribometer has been employed (Figure 1). The tangential motion of the lower contact sample, with controlled velocity/displacement profiles, is imposed with a screw–nut system driven by a brushless motor with its control unit (Elmo Gold Dc-Whistle, Elmo Motion Control, Milano, and Italy). Four air bushing elements (NEW WAY S304002, IBS Precision Engineering, AD Eindhoven, and The Netherlands) guide the translation of the sample support, assuring the planarity of the motion and the support of the load. A linear optical encoder (MicroE OPS-200-1-1, MICRO-EPSILON, Villeurbanne, and France) is used for the monitoring and feedback control of the imposed velocity/displacement profile. The normal load is applied by means of dead weights, driven by a further set of four air bushings, ensuring a maximum normal load of 250 N. The air bushing ensures the precise vertical motion of the upper contact sample during the application of the normal load, providing tangential stiffness during the tribological experiments. In order to achieve larger normal loads (over 250 N and up to 1500 N) a hydraulic actuator is actioned by a hydraulic pump. The two sets of four air bushings, one along the vertical direction and one along the horizontal one, allow precise guiding and, thus, controlled boundary conditions during the tests.
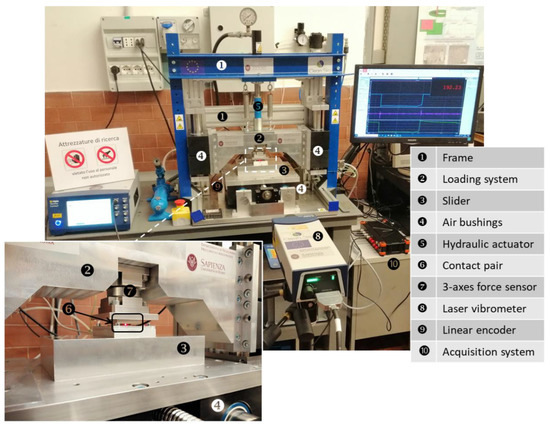
Figure 1.
Linear tribometer and instrumentation for quasistatic test.
The setup is equipped with a 3D piezoelectric force sensor to measure the normal and tangential contact forces over the time. The force sensor (KISTLER 9047C, Kistler Italia, Milano, and Italy) provides high stiffness and high sensitivity ensuring precision in measuring contact forces while maintaining the alignment at the contact interface. A laser vibrometer (POLYTEC VFX-BW-500, Polytec GmbH, Waldbronn, and Germany) is used to monitor the vibrational and frictional responses of the samples (i.e., switching between sticking and sliding contact conditions) during the experiments, as close as possible the contact interface (see Figure 1).
All signals coming from the sensors are acquired with an 8-channel isolated data acquisition system (Dewesoft SIRIUSi, Dewesoft, Roma, and Italy), allowing high resolution acquisition up to 200kHz sampling frequency.
2.2. Experimental Setup for Fast-Transient Test
In order to simulate fast-transient engagement of the contact pairs, a specific test bench was developed and equipped with high performance piezo actuators. The main structural components of the setup assembly are shown in Figure 2:
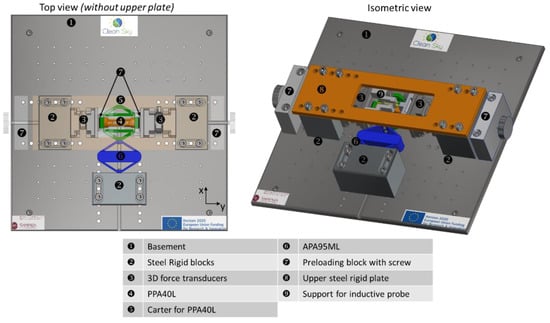
Figure 2.
Scheme of the test bench assembly for fast-transient contact test.
- Three rigid and massive blocks are fixed on a rigid plate (basement) and used for mounting the assemblies with the piezo actuators and 3-axes force transducers;
- Two identical frictional pads are mounted on the opposite sides of a compliant carter and can be pressed, by a PPA40L prestressed piezo actuator (from Cedrat Technologies, MEYLAN Cedex, and France, against their frictional counterparts;
- The frictional counterparts are mounted on two 3-axes force transducers, fixed on the respective rigid blocks, which measure normal and tangential contact forces at both contact pairs;
- An APA95ML-amplified piezo actuator (from Cedrat Technologies) is fixed by one side to the third rigid block and pushes the carter of the PPA40L piezo actuator at the other side, allowing for the imposition of the wished tangential force/displacement;
- In order to impose a preload in the normal direction to the contacts, two further supports, each one provided with a manoeuvring screw, have been added behind the transducer blocks and fixed to the basement. Such blocks allow for the application of a normal preload to the contacts. Once both the contact pairs are positioned and preloaded, the respective two steel blocks can be rigidly fixed to the basement. Moreover, a further plate is mounted between the two rigid blocks, in order to provide further stiffness to the structure.
The developed configuration (Figure 3), symmetric with respect to the two contact pairs, allows for the imposition and measurement of fast-transient normal and tangential forces, within a rigid frame. The normal load is driven by the prestressed PPA40L actuator, which is inserted in a compliant carter ensuring a high stiffness in the tangential direction and enabling the normal load by a compliant mechanism. The tangential load is driven by a APA95ML-amplified piezo actuator. The two actuators can be driven separately, by the associated voltage amplifiers (C-TECH LA75C). Two analogic signals are provided by two output channels from the DEWESoft SIRIUSi acquisition system in order to obtain the wished time evolution of the normal and tangential actuations. Simultaneously, the same acquisition system is used to acquire the signals from the different sensors at a sampling rate of 100kHz. The laser vibrometer is pointed to the side of one of the pads, in order to monitor the tangential velocity at the contact and identify sticking and sliding conditions. The force transducers measure normal and tangential forces for both the contact pairs separately, while an inductive probe is placed between the respective rigid blocks for monitoring the relative motion between the blocks (frame stiffness). Moreover, thermocouples are placed on the APA95ML actuator and on the pad to monitor the temperature of the piezo and the contact elements.
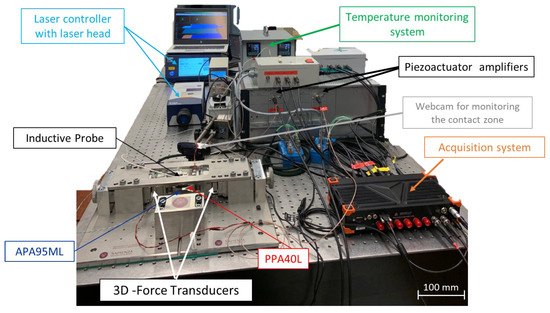
Figure 3.
Test bench for fast-transient contact simulations and its instrumentation.
2.3. Material Pair Samples
When considering contact applications, plastic and reinforced plastic materials are generally coupled with metallic counterparts. Here, commercial and commonly employed plastics and reinforced materials were tested on a spready-employed metallic counterpart (TI6Al4V). The choice to test materials commonly used in industry, and thus available and cost-effective, allows insights into their tribological behavior for their direct application as contact parts, either in structural joint components or power transmission elements. The following table presents the tested materials with the respective main properties.
The material samples were machined to obtain frictional pads with the following dimensions: 10 mm × 20 mm × 2 mm for the setup in Figure 1 and 20 mm × 20 mm × 2 mm for the setup in Figure 2. The metallic counterparts were machined to obtain either 30 mm × 30 mm × 2 mm square samples or circular samples with 30 mm of diameter and 2 mm of thickness. After machining, the contact surfaces were polished to get the wished surface finishing, with Ra ranging between 0.25 and 0.45 µm for the pad surface and 0.10–0.20 µm for the counterpart surface.
For the quasistatic frictional tests (Figure 1), the friction pad is mounted on the 3-axes force transducer, used to load the contact, while the metallic counterparts are fixed with the slider, guided in the direction tangential to the contact. For the fast-transient friction tests (Figure 2), two identical pads are fixed on the opposite sides of the carter of the PPA40L actuator, while the metallic counterparts are fixed to the 3-axes force transducers.
2.4. Test Protocol
2.4.1. Test Protocol for Quasistatic Frictional Tests
The material pairs (Table 1) were first characterized using quasistatic tribological tests on the linear tribometer. The following test protocol was applied for each contact pair to be tested:

Table 1.
Tested materials and respective material properties.
- i.
- The contact pairs were first cleaned using an ultrasound cleaner to remove all traces of contamination tightly adhering or embedded onto the solid surfaces. The cleaning process consisted of an ultrasound bath that was 10 min long. As a function of the material, plastic or metallic, either distilled water or ethanol was used as the solvent for the bath.
- ii.
- Each contact surface was processed using a profilometer in order to verify the roughness obtained by the polishing process. If the roughness did not respect the fixed interval (Section 2.2), the polishing protocol was repeated until achievement. Then, a digital microscope was used to recover the image of the overall surface after the cleaning and before performing the tribological test.
- iii.
- The material samples, PAD and counterpart, are fixed on the sample holders and, before the experimental tests, the planarity of the contact surfaces is checked by loading the system and introducing a pressure sheet (Fujifilm LLLW) to verify the contact area distribution.
- iv.
- The frictional tests were then performed. First the compressive normal force F, in order to obtain a desired initial average contact pressure, is applied; then, the specimens are put in relative motion, allowing for the measurement of static and dynamic friction. The trapezoidal-imposed velocity profile of the slider (counterpart sample) allows for a back–forward motion at constant velocity. The sequence and number of tests and the applied conditions (velocity, normal force) are detailed in the following.
- v.
- After the tests, images of the contact surfaces are recovered again using digital microscopy, in order to qualitatively analyze the status of the surfaces.
During the tests, the lower specimen (counterpart) is fixed to the mobile part of the setup and the translation displacement is imposed by means of the electromagnetic brushless motor. The upper specimen (PAD) is bonded to the loading system (fixed along the tangential direction).
For each pair of contact materials, a parametrical analysis was carried out as a function of the normal load. The normal load and, consequently, the average contact pressure (theoretical contact area of 200 mm2) was varied between 100 N (0.5 MPa) and 500 N (2.5 MPa), with intervals of 100 N (0.5 MPa).
Once the imposed normal force is reached, the following sequences of back and forward cycles are imposed: 3 cycles at 0.1 mm/s, 50 cycles at 5 mm/s, and again 3 cycles at 0.1 mm/s. The first set of cycles at 0.1 mm/s allows for the determination of the static and dynamic (at 0.1mm/s) friction coefficients at the beginning of the test. The following 50 cycles at 5 mm/s are performed to run-in the surface and determine the dynamic friction coefficient at 5mm/s. The last cycles at 0.1 mm/s allow for the verification of the stability of the measured friction coefficients after the running-in of the surfaces. The above sequence is applied for each normal load, varying the contact pressure from 0.5 MPa up to 2.5 MPa.
2.4.2. Test Protocol for Fast-Transient Frictional Tests
The material pairs were then tested under fast-transient loadings, in order to verify their frictional and wear responses under realistic boundary conditions, when intermittent transient loads are imposed by the application (piezo motors, pneumatics screw tightening, gear teethes, etc.). The same general protocol (polishing, cleaning, and imaging), reported in the previous section for the quasistatic tests, was applied. In addition, an analytical laboratory balance is used to measure the mass loss of the contact pairs after the endurance tests, which, in addition to the microscope images, allows for the comparison of the wear resistance of the different contact pairs.
In order to impose fast-transient dynamic loadings, the piezo actuators were driven with synchronized voltage signals, consisting of trapezoidal curves with an imposed time phase shift. Figure 4 shows an example of the trapezoidal signal cycles, allowing for the following sequence:
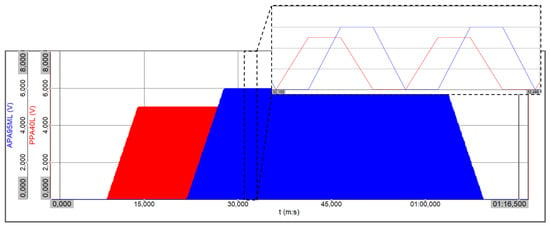
Figure 4.
Example of input voltage signals for the PPA40L (red curve, providing normal force) and APA95ML (blue curve, providing tangential force/motion) actuators.
- i.
- First, the PPA40L is actuated to impose the normal load; the maximum of the voltage signal is imposed to reach the wished normal contact force;
- ii.
- Once the normal load reaches the maximum value, it is maintained at a constant and the APA95ML actuator is activated to provide the tangential force, which increases up to the sliding of the pads on the counterparts;
- iii.
- Then, the contact is unloaded (decreasing ramp of the PPA40L voltage) and, successively, the pad moves back to its original position (decreasing ramp of the APA95ML voltage), until the next cycle starts.
The transient contact tests consisted of three different subsets:
2.4.3. Test Subset n.1
In the first subset, the cycle frequency of the driving signals for the piezo actuators is set to 6 Hz. The selected frequency allows the dynamic loadings, but with a frequency low enough to avoid a strong dynamic response in the overall setup structure. The aim of this subset is to determine the frictional response of the tested material pair at the beginning of its life.
Before starting the test, the pads are put in contact with the counterparts and a preload of 50 N is applied to each contact. Then, the desired voltage signals are used as inputs for the actuator amplifiers:
- The input voltage for the PPA40L amplifier is defined in order to ensure a maximum normal load of 250 N, including the preload (50 N);
- The maximum input voltage for the APA95ML extender amplifier is set at least at 4 V, in order to ensure the switching between stick and slip conditions, monitored by the laser vibrometer;
- The piezo actuators are activated for 60 s in order to perform a running-in, reach a stable contact response, and then measure the static and dynamic friction coefficients.
2.4.4. Test Subset n.2
In the second subset, the same voltage parameters, used in subset n.1, are imposed for a total time of 60 s, while the cycle frequency is increased up to 100 Hz in order to simulate faster transient loads. Static and dynamic friction coefficients are then recovered considering the normal and tangential force signals during the sticking and sliding phases, monitored with the laser vibrometer.
2.4.5. Test Subset n.3
The frictional pairs are finally subjected to endurance to evaluate the evolution of their frictional response and wear resistance. All the contact pairs were subjected to a preliminary endurance test of 106 cycles. The contact pair showing the best wear resistance and stable frictional response was then subjected to 20 × 106 cycles. For the endurance tests, in order to reproduce sliding contact cycles, the normal load was fixed to the preload, i.e., 50 N, while only the APA95ML actuator was driven to provide the back and forward relative motion. For each contact pair, at the end of the endurance test, the same tests performed in subsets 1 and 2 are repeated. The aim of these last tests is to recover the static and dynamic friction coefficients after the endurance tests, in order to verify the stability of the frictional response with wear.
3. Results and Discussion
3.1. Quasistatic Frictional Response
The contact pairs were preliminary investigated under quasistatic boundary conditions, imposing back and forward relative motion with an imposed constant normal load. Figure 5 shows an example of the main acquired signals. The black and orange curves show, respectively, the normal and tangential contact forces, recorded by the 3D force transducer. The red curve represents the imposed displacement that is required to have controlled translational velocity along the tangential direction. First, the normal load (400 N in the example) is applied. Then, three forward and backward cycles at a constant velocity of 0.1 mm/s are imposed, with a stroke of 4 mm. Then, maintaining the load, the velocity is increased and set to 5 mm/s for a further 50 cycles. For the last three sliding cycles, the imposed velocity is set again to 0.1 mm/s. After the last cycle, the load is removed and the test is stopped.
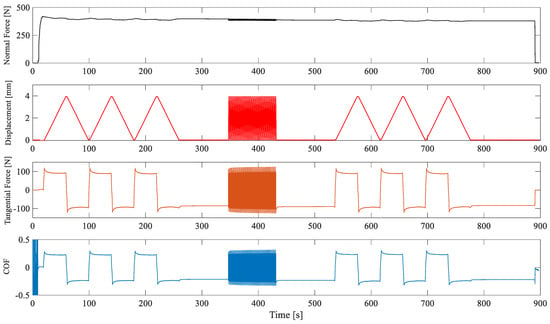
Figure 5.
Example of the recorded signals: normal force (black curve), imposed displacement (red curve), tangential force (orange curve), and friction coefficient (blue curve), as a function of time.
The recorded signals are used to compute the static and dynamic friction coefficients. The static friction coefficient during the reciprocating motion for an imposed velocity of v = 0.1 mm/s is computed as detailed in Figure 6. The friction curve obtained for cycles at 5 mm/s is used to evaluate the dynamic friction coefficient, accounting for the part of the signals where the imposed velocity is constant (no acceleration and deceleration phases are accounted for). Finally, the static friction is computed again to compare it with its initial value. The test is repeated for each contact load. The surface evolution, due to the overall test cycles, is qualitatively evaluated by observation of the surfaces before and after the tests. Figure 7 shows the results obtained for each contact pair at each contact load. The black bar is the static friction at the beginning of the test, the green bar is the static friction at the end of the tests, and the dashed blue bar is the dynamic friction. When considering the 56 back and forward cycles, for the 5 values of the load, each sample pair undergoes 280 cycles. Figure 8 presents the contact surfaces observed after the overall test cycles.
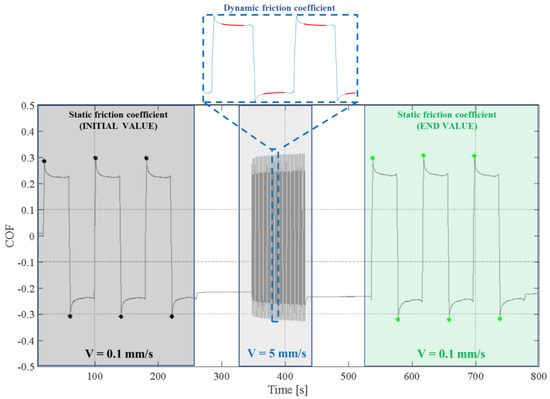
Figure 6.
Evolution of friction over time and computation of static and dynamic friction coefficients. Black points represent the initial value of the static friction coefficient. Green points represent the end value of the static friction coefficient.
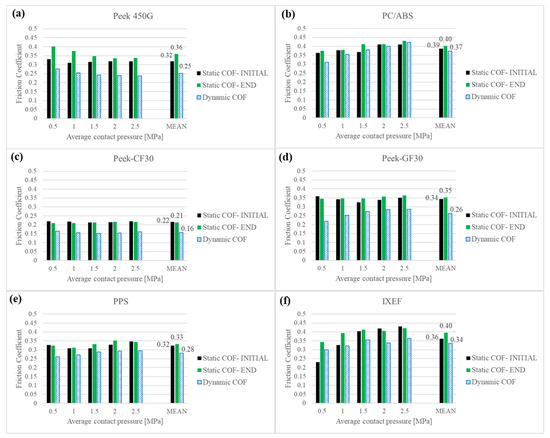
Figure 7.
Static and dynamic measured friction coefficients for the investigated materials in contact with TI6Al4V.
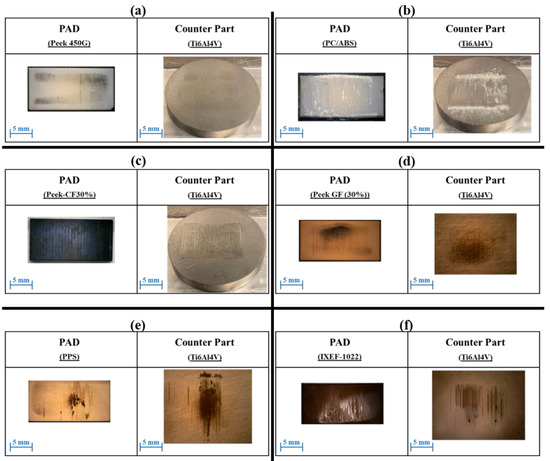
Figure 8.
Surface images of the contact pairs after the tribological tests.
The Peek 450G vs. Ti6Al4V pair (Figure 7a) shows an increase in the static friction coefficient at the end of the cycles, for each value of the tested contact pressures, probably due to a necessary running-in to stabilize the contact interface. The static and friction coefficients initially decrease with the load (i.e., as well with the number of cycles), and get stable at about 0.35 for the last values of the load (last sets of cycles). This decrease is probably due to the development, with the succession of the test cycling, of a third body layer at the frictional interface. Coherently, the dynamic friction coefficient decreases at the beginning, to stabilize at about 0.25. After the overall sliding cycles, the surfaces in contact do not show important traces of adhesion or material damage, and only mild wear is observed (see Figure 8a). PC/ABS vs. Ti6Al4V (Figure 7b) presented a high frictional resistance, both in terms of static (0.4) and dynamic friction (0.37) coefficients, for all the tested contact pressures. In this case, static and dynamic friction increase with the increase in the load (number of cycles). This behavior is promoted by both a stronger physiochemical reactivity with the increase in the contact pressure and by a rapid wear and material transfer from the polymer surface to the counterpart, leading to polymer-on-polymer contact, rather than a polymer-on-metal one. In fact, evident marks of severe wear and material transfer on the counterpart are observed from the images of the surfaces at the end of the tests (Figure 8b). An accumulation of third body particles is present on both the PAD and counterpart contact surfaces. Material detachment and material transfer highlight the high adhesion, in agreement with the recovered high friction coefficients.
The Peek carbon-fiber-reinforced material (Peek-CF30) on TI6Al4V exhibits a really stable frictional response (Figure 7c), for the whole range of tested contact pressures, both in terms of static and dynamic friction coefficients. Nevertheless, low values of average static and dynamic friction coefficient are recovered, 0.22 and 0.16, respectively. No evident traces of wear or large third body particles are present on the contact surface. Small third body particles are visible on the counterpart (Figure 8c). In this case, low and stable friction are achieved by the solid lubrication provided by the carbon particles, released by the reinforcement matrix. The decrease in dissipated energy (friction) at the interface, together with the reinforcement of the bulk material provided by the carbon fibers, explains the lower wear and damage of the surfaces as well. The direct contact between the polymer and the metallic counterpart is quickly intermediated by the interposition of the third body layer of carbon particles.
Figure 7d shows the frictional results obtained for the Peek glass-fiber-reinforced material (Peek-GF30) vs. Ti6Al4V, as a function of the average contact pressure. The static friction coefficient highlights a stable trend in the function of the contact pressure (and cycle number), with an average value of about 0.35. On the other hand, the dynamic friction coefficient increases with the increase in contact pressure (and number of cycles) required to stabilize itself, showing an average value of 0.26. The images of the contact surfaces, after the tribological tests (Figure 8d), show mild wear with traces along the sliding direction. Comparing the tribological results performed with carbon-fiber-reinforced material, the glass-fiber-reinforcement of the Peek material combines a higher static friction coefficient with a good wear resistance. In this case as well, the fiber reinforcement allows for a low wear of the surfaces. Nevertheless, the material transfer, observed as well for glass fibers, provides a stronger adhesive contribution leading to an increase in the friction coefficient, as observed for nonreinforced polymers.
PPS (fiberglass 40% reinforced material), sliding against TI6Al4V, presents a quite stable behavior in terms of static and dynamic friction coefficient (Figure 7e). For the highest contact pressures, the static coefficient reaches 0.35, while an overall mean of 0.33 is obtained. The dynamic friction coefficient is stable as well for the highest contact pressures. Again, the increase in and stabilization of friction with higher pressures could be due to the increase in and stabilization of the contact area and third body layer with the number of sliding cycles. The images of the worn surface, after the tribological tests, show an overall slight third body distribution with some local particle accumulation.
IXEF (fiberglass 50% reinforced material) sliding against TI6Al4V (Figure 7f) highlights an increase in the friction coefficients with the contact pressure, i.e., with the number of cycles. Again, the frictional behavior stabilizes, reaching high values of frictional resistance (more than 0.40) for the highest contact pressures (number of cycles). The images of the worn surfaces, after the tribological tests, show traces of sliding on the contact surface of the TI6Al4V with debris of IXEF material transferred on the TI6Al4V surface.
The obtained results highlight that the plastic materials (PC/ABS and Peek 450G), in contact with Ti6Al4V, present high static friction coefficients (higher than 0.40). Nevertheless, on the other hand, the surfaces are characterized by signs of adhesive wear and material transfer, even after relatively few cycles (about 280 back and forward). Moreover, their material properties (Table 1) show a low performance in terms of stiffness and mechanical resistance, which are not suitable for contact applications, where the deformation of the bodies in contact can largely modify the contact surfaces and the geometrical tolerances at the interface. When considering polymer reinforcements, even if the carbon-fiber-reinforced material (Peek-CF30) exhibits excellent wear response and mechanical properties, it shows the lowest friction coefficients, due to the lubrication role played by carbon particles. Thus, it is not suitable for applications where high and stable friction is a requirement. For all the tested pairs, dynamic friction results to be lower than the static ones. This is due to the time needed for the polymeric materials to react with the counterpart [30], increasing the adhesive components of the frictional resistance. This observation highlights the need to perform specific tests under fast-transient loading, where the effective contact time can play a key role in the frictional response of the material pair.
Among the whole set of tested contact pairs, the best results in terms of tribological response (high friction and low wear), accompanied by suitable mechanical properties, are obtained by the glass-reinforced materials sliding against Ti6Al4V. Such contact pairs have showed good behavior in terms of wear, high and stable friction, together with suitable mechanical properties. The reinforcement of material with glass fibers leads to an increase in the average stiffness maintaining an excellent tribological response, as highlighted in the case of Peek-GF30, PPS, and IXEF materials. These contact pairs were then tested on the second test bench (Section 2.1), in order to verify their frictional and wear responses under fast-transient contact loading solicitations.
3.2. Fast-Transient and Endurance Response
The material pairs having provided better tribological responses, in terms of friction coefficients and wear under quasistatic contact conditions, were tested under fast-transient loadings, representative of applications involving either vibrations or repetitive high-frequency kinematics. Figure 9 shows an example of the main signals acquired for a typical endurance test, using the developed test bench, described in Section 2.1. The curves show, respectively, the normal and tangential contact forces, recovered using the 3D force transducers; the signal of the tangential velocity of the PAD (green curve), recovered using the laser vibrometer; and the voltage profiles for driving the piezo actuators. First, the PPA40L actuator is activated and a first check is made to verify the maximum oscillating normal force (250 N in the example). Then, the APA95ML extender is activated and the oscillation of the tangential forces increase up to the sliding, monitored by the laser vibrometer focused close to the contact interface. After a specific time duration, the actuators, first along the tangential direction and then along the normal one, are finally turned off.
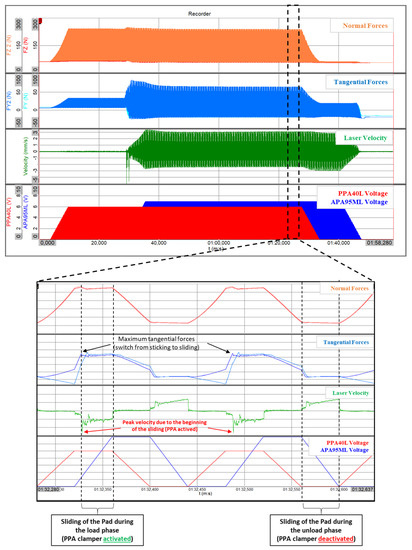
Figure 9.
Recorded signals used to perform the friction analysis of the investigated contact pair. Imposed cycle frequency of 6 Hz. Zoom referred to two cycles of the signals.
The recorded signals are used to compute the static and dynamic friction coefficients. The signals reported in the zoom of Figure 10 highlight that the input voltage of the PPA40L actuator linearly increases and, consequently, the normal load increases too, following the same behavior. Once the maximum normal load is reached, the motion is imposed by the APA95ML through its voltage profile (blue curve in Figure 10). The tangential force increases up to the maximum value (maximum friction resistance). Switching from the sticking phase to the sliding phase occurs and a peak in the velocity signal (laser spot focused close to the contact interface) is recovered. The laser velocity highlights the back and forward sliding phases between the pad and the counterpart. The peak in the tangential velocity, followed by a decreasing evolution at lower values, witnesses the elastic energy release occurring when the passage from higher static to lower dynamic friction takes place, as observed in the previous tests.
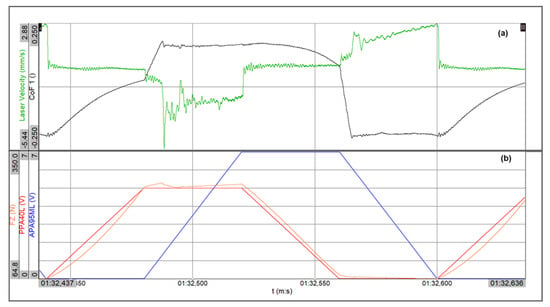
Figure 10.
(a) Friction coefficient (ratio between tangential and normal force) and laser velocity as a function of time. (b) Normal load and driving voltage for PPA clamper (red profile) and APA extender (blue profile) as a function of time. Imposed cycle frequency of 6 Hz.
Figure 10 shows the friction coefficient curve calculated for a single cycle. The processing allows for recovery of the static friction coefficient and the dynamic one for each investigated contact pair, when subjected to oscillating contact boundary conditions, for both the tested cycle frequencies, 6 Hz and 100 Hz. For each contact pair, an endurance test of 106 cycles was performed (see protocol in Section 2.2) to verify the wear response of the tested pairs. During the endurance tests, periodic signal acquisitions of 20s are repeated each 15 min in order to verify the stability of the measured signals and boundary conditions. After the endurance test, the same frictional test described above was repeated to verify the stability of the frictional response after the endurance test.
Figure 11 shows the static and dynamic friction coefficients obtained under fast-transient loadings, before and after the endurance tests. For all the tested contact pairs, the results highlight an initial static friction, recovered before the endurance test, slightly lower than the one recovered, for same the contact pressure in quasistatic loading conditions. As an example, for the PPS vs. Ti6Al4V contact pair, the static friction in quasistatic boundary conditions was 0.32 and decreased at 0.24 when fast-transient loadings are applied. The same trend is observed for all the material pairs for both static and dynamic friction. This trend is ascribable to the lower time for physiochemical reactions at the interface, already observed for plastic materials [30,32]. It is interesting to note that during tests with fast-transient loadings, the static and dynamic friction coefficients (Figure 11) were much closer to each other, with respect to the values observed during classical quasistatic tribological tests (Figure 7). This is justified by the reduction in the contact time in the sticking condition when physiochemical interaction in surfaces increases the frictional strength of the interface. These results highlight once more the need to reproduce representative contact conditions, including the fast kinematics at the interface typical of specific applications, that affects the time competitions between mechanical and physiochemical phenomena occurring at the interface.
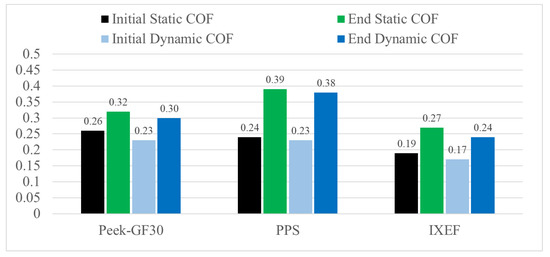
Figure 11.
Static and dynamic friction coefficients obtained during fast-transient loadings (with 250 N of maximum normal force), before and after the endurance tests.
Once the contact pair was subjected to 106 sliding cycles, the static and dynamic friction coefficients reached higher values than the ones recovered before the endurance test (the static fiction for the PPS reaches 0.39). This trend, confirmed for all the frictional pairs, is due to the wear of the localized contact areas, which culminates in an overall increase in the real contact area after the endurance cycling. Once the testing sequence has been completed, the worn surfaces were observed using a digital microscope (Figure 12). The analyzed surfaces show mild wear, small third body particles, and some third body accumulation, without any sign of adhesion or damage of the surfaces. The low level of wear, emerged from the images, is also confirmed from the measurements of the pad mass loss, lower than 1 mg for all the tested contact pairs.
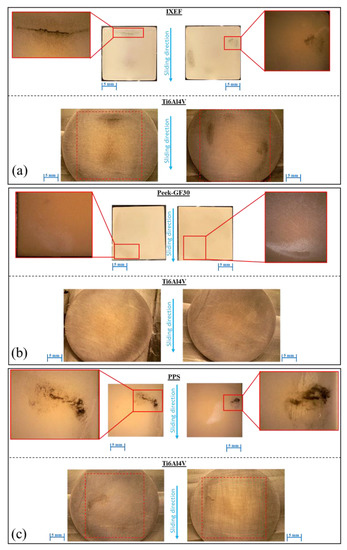
Figure 12.
Microscope images of the worn surfaces after 1 mln cycles: (a) IXEF vs. Ti6Al4V; (b) Peek-GF30 vs. Ti6Al4V; (c) PPS vs. Ti6Al4V.
The results, obtained by imposing fast-transient loadings, for the PPS-1140L4 glass-reinforced polymer against the Ti6Al4V counterpart resulted in the highest friction coefficients, associated with low wear. Further investigation was then developed, for this contact pair, performing a longer endurance test of 20 × 106 cycles. The frictional response was analyzed periodically, every 4 × 10⁶ cycles, in order to record the evolution of the friction coefficient with the contact pair evolution. Towards this aim, each 4x10⁶ cycles, the endurance test is interrupted and the friction coefficients are measured before unloading the contact and after unloading and reloading the contact. The choice to unload and reload the contact at each test interruption highlights the possible role of a stabilization of the interface due to the continuous evolution of the contact under the endurance cycles (stabilized contact area and third body layer). The evolution of the static and dynamic friction coefficients is reported in Figure 13. The static friction coefficient shows an increase as a function of the cycles, up to stabilization (at 16 × 106 cycles) at values higher than 0.4. The same behavior is observed for the dynamic friction coefficient. Again, this trend is attributable to the evolution of the real contact area, which increases with cycling. In fact, the high stiffness of reinforced plastic material, with respect to plastic ones, leads to a smaller elastic deformation and, thus, an initial localization of the real contact area. The localization of the contact brings higher local pressures, leading to local wear and production of a third body layer, which progressively increase the effective area and then the frictional resistance. The consequent decrease in the local pressure and the third body layer allow an equilibrium condition to be reached and the overall frictional behavior to stabilize with the test cycling. It should also be noticed that the friction resistance measured before and after the unloading and reloading of the contact are quite similar, with slight decreases after the unloading and reloading, due to the braking (unloading) and reassembling (reloading) of the contact interface.
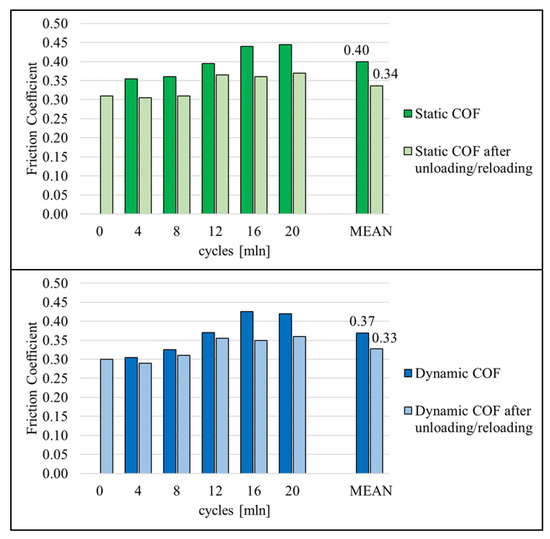
Figure 13.
Static and dynamic friction coefficients, measured each 4 × 10⁶ cycles, during the 20 × 106 cycles for the PPS-1140L4 vs. Ti6Al4V contact pair.
After the 20 × 106 cycles, mild wear is observed and the loss of material is always lower than 1 mg, highlighting again an excellent wear resistance (Figure 14). No adhesive wear or noticeable surface damages are observed, suggesting mild abrasive wear. The dark color of the third body particles observed on the PPS contact surfaces are in agreement with local oxidation of the third body particles [33,34]. The images from the SEM and the EDS maps highlighted a transfer of material from PPS to Ti6Al4V surfaces and vice versa. On one hand, the EDS map (Figure 15) of Ti6Al4V counterpart highlights an accumulation of third body (black zone in SEM image) detached from the PPS surface, which is characterized by the presence of sulfur. On the other hand, the glass fibers from the composite PPS GF40 exercise an abrasive action on the Ti6Al4V counterpart, as shown by the high value of the dynamic friction (see Figure 13) and the presence of Titanium in the EDS map of the PPS surface.
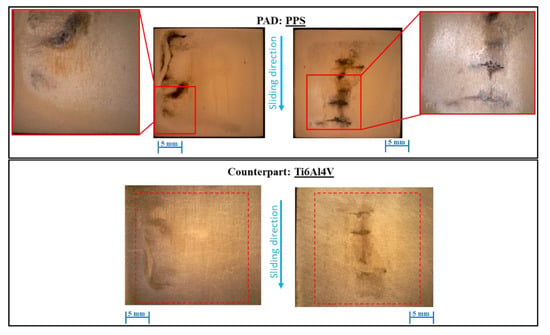
Figure 14.
Microscope images of the worn surfaces after 20 × 106 cycles: (up) Pad PPS and (down) Counterpart Ti6Al4V.
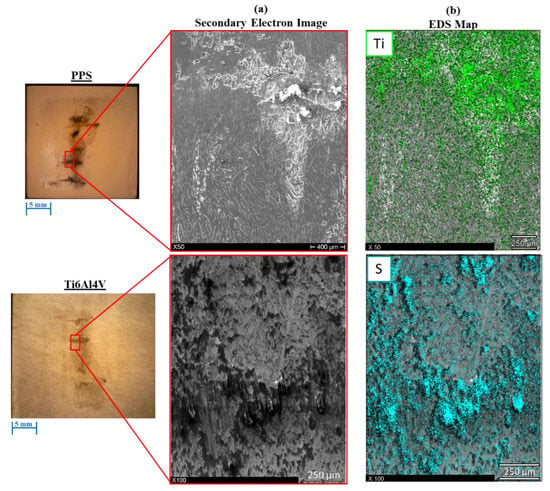
Figure 15.
(a) SEM images of PPS and Ti6Al4V (secondary electron mode). (b) EDS maps of the analyzed contact surface for PPS and Ti6Al4V.
4. Conclusions
The interest in reinforced polymers for structural components is mainly due to their economical and manufacturing advantages. Moreover, reinforced plastic materials are an attractive replacement for metals in different applications under dynamic loadings, providing advantages that include high strength, corrosion resistance, light weight, and thermal stability. In the field of automotive, aerospace, and machinery industries, reinforced materials are often subjected to fast-transient (oscillating) loading conditions.
In this work, the frictional and wear responses of commercial reinforced polymers under fast-transient solicitations, against a titanium alloy counterpart, have been investigated. The main outcomes are summarized as follows:
- Plastic materials showed a high friction coefficient but a low resistance to wear, even after a few loading cycles. On the other hand, while the carbon fiber reinforcement brought stable but low friction (0.22), the glass fiber reinforcements lead to the suitable combination of high friction and low wear;
- The tests, performed in fast-transient dry contact conditions, for the glass-reinforced materials presented an excellent resistance to wear and surface degradation with a low loss of material (<0.1 mg) even after 1 million cycles.
- Among the glass-reinforced materials, the IXEF material showed a lower static friction coefficient with respect to PPS and Peek-GF30 materials even though they showed a similar resistance to wear (material loss < 0.1 mg);
- The best performances in terms of high friction were found for PPS material against Ti6Al4V titanium alloy, with excellent wear resistance after 20 million loading cycles (material loss < 0.1 mg).
The results of this work provide useful information regarding the practical implementation of reinforced plastic materials in mechanical components working under fast-transient solicitations at the interface.
Author Contributions
Conceptualization, D.T. and F.M.; methodology, D.T. and F.M.; software, D.T.; validation, D.T., F.M., E.B. and A.P.; formal analysis, D.T., F.M., E.B. and A.P.; investigation, D.T. and F.M.; resources, D.T., F.M., E.B. and A.P.; data curation, D.T. and F.M.; writing—original draft preparation, D.T. and F.M.; writing—review and editing, D.T., F.M., E.B, and A.P.; visualization, D.T., F.M., E.B. and A.P.; supervision, F.M and A.P.; project administration, F.M and A.P.; funding acquisition, F.M and A.P. All authors have read and agreed to the published version of the manuscript.
Funding
The research was funded by the AUDACITY project, which has received funding from the European Union’s Horizon 2020 research and innovation program through CleanSky2-CFP08-2018-01 under grant agreement No 831795.
Data Availability Statement
The data presented in this study are available on request from the corresponding author.
Conflicts of Interest
The authors declare no conflict of interest.
References
- Kumar, R.; Ul Haq, M.I.; Raina, A.; Anand, A. Industrial applications of natural fibre-reinforced polymer composites—Challenges and opportunities. Int. J. Sustain. Eng. 2019, 12, 212–220. [Google Scholar] [CrossRef]
- Ozkan, D.; Gok, M.S.; Karaoglanli, A.C. Carbon Fiber Reinforced Polymer (CFRP) Composite Materials, Their Characteristic Properties, Industrial Application Areas and Their Machinability. In Engineering Design Applications III: Structures, Materials and Processes; Öchsner, A., Altenbach, H., Eds.; Springer International Publishing: Cham, Switerland, 2020; pp. 235–253. [Google Scholar] [CrossRef]
- Saeed, H.M.; Jassim, R.K. Characterization and Assessment of PEEK/Silicon Dioxide Composite. Int. J. Dent. 2023, 2023, 3343071. [Google Scholar] [CrossRef] [PubMed]
- Yu, X.Z.; Yao, S.; Chen, C.; Wang, J.; Li, Y.M.; Wang, Y.F.; Khademhosseini, A.; Wan, J.L.; Wu, Q.Z. Preparation of Poly(ether-ether-ketone)/Nanohydroxyapatite Composites with Improved Mechanical Performance and Biointerfacial Affinity. ACS OMEGA 2020, 5, 29398–29406. [Google Scholar] [CrossRef]
- Javaid, S.; Dey, M.; Matzke, C.; Gupta, S. Synthesis and characterization of engineered PEEK-based composites for enhanced tribological and mechanical performance. J. Appl. Polym. Sci. 2022, 139, e52886. [Google Scholar] [CrossRef]
- Zhang, G.; Liao, H.; Li, H.; Mateus, C.; Bordes, J.M.; Coddet, C. On dry sliding friction and wear behaviour of PEEK and PEEK/SiC-composite coatings. Wear 2006, 260, 594–600. [Google Scholar] [CrossRef]
- McCook, N.L.; Hamilton, M.A.; Burris, D.L.; Sawyer, W.G. Tribological results of PEEK nanocomposites in dry sliding against 440C in various gas environments. Wear 2007, 262, 1511–1515. [Google Scholar] [CrossRef]
- Kalin, M.; Zalaznik, M.; Novak, S. Wear and friction behaviour of poly-ether-ether-ketone (PEEK) filled with graphene, WS2 and CNT nanoparticles. Wear 2015, 332–333, 855–862. [Google Scholar] [CrossRef]
- Lu, Z.P.; Friedrich, K. On sliding friction and wear of PEEK and its composites. Wear 1995, 181–183, 624–631. [Google Scholar] [CrossRef]
- Wang, Q.; Xue, Q.; Liu, H.; Shen, W.; Xu, J. The effect of particle size of nanometer ZrO2 on the tribological behaviour of PEEK. Wear 1996, 198, 216–219. [Google Scholar] [CrossRef]
- Hanchi, J.; Eiss, N.S. Dry sliding friction and wear of short carbon-fiber-reinforced polyetheretherketone (PEEK) at elevated temperatures. Wear 1997, 203–204, 380–386. [Google Scholar] [CrossRef]
- Flöck, J.; Friedrich, K.; Yuan, Q. On the friction and wear behaviour of PAN- and pitch-carbon fiber reinforced PEEK composites. Wear 1999, 225–229, 304–311. [Google Scholar] [CrossRef]
- Yamamoto, Y.; Takashima, T. Friction and wear of water lubricated PEEK and PPS sliding contacts. Wear 2002, 253, 820–826. [Google Scholar] [CrossRef]
- Zhang, Z.; Breidt, C.; Chang, L.; Friedrich, K. Wear of PEEK composites related to their mechanical performances. Tribol. Int. 2004, 37, 271–277. [Google Scholar] [CrossRef]
- Berthier, Y. Background on Friction and Wear. In Handbook of Materials Behaviour Models; Lemaître Academic Press: Brunelles, France, 2001. [Google Scholar]
- Champagne, M.; Renouf, M.; Berthier, Y. Modeling Wear for Heterogeneous Bi-Phasic Materials Using Discrete Elements Approach. J. Tribol. 2014, 136, 21603. [Google Scholar] [CrossRef]
- Jain, A.; Somberg, J.; Emami, N. Development and Characterization of Multi-Scale Carbon Reinforced PPS Composites for Tribological Applications. Lubricants 2019, 7, 34. [Google Scholar] [CrossRef]
- Godet, M. The third-body approach: A mechanical view of wear. Wear 1984, 100, 437–452. [Google Scholar] [CrossRef]
- Denape, J.; Laraqi, N. Thermal aspect of friction: Experimental evidence and theoretical approaches. Mec. Et Ind. 2000, 1, 563–579. [Google Scholar] [CrossRef]
- Colas, G.; Saulot, A.; Berthier, Y.; Léonard, D. Driving influence of contamination on the rheological properties solid 3rd bodies. In Proceedings of the Society of Tribologists and Lubrication Engineers Annual Meeting and Exhibition, Lake Buena Vista, FL, USA, 18–22 May 2014; pp. 255–257. [Google Scholar]
- Tonazzi, D.; Massi, F.; Salipante, M.; Baillet, L.; Berthier, Y. Estimation of the normal contact stiffness for frictional interface in sticking and sliding conditions. Lubricants 2019, 7, 56. [Google Scholar] [CrossRef]
- Tonazzi, D.; Massi, F.; Culla, A.; Fregolent, A.; Berthier, Y. Role of damping on contact instability scenarios. In Proceedings of the 5th World Tribology Congress, WTC, Torino, Italy, 8–13 September 2013; pp. 755–758. [Google Scholar]
- Cavacece, F.; Frache, L.; Tonazzi, D.; Bouscharain, N.; Philippon, D.; Le Jeune, G.; Maheo, Y.; Massi, F. Roller bearing under high loaded oscillations: Life evolution and accommodation mechanisms. Tribol. Int. 2020, 147, 106278. [Google Scholar] [CrossRef]
- Putignano, C. Oscillating viscoelastic periodic contacts: A numerical approach. Int. J. Mech. Sci. 2021, 208, 106663. [Google Scholar] [CrossRef]
- Sümer, B.; Eray, T.; Koç, İ.M. Alteration of friction force of a harmonically excited elastomeric pillar. Tribol. Int. 2017, 113, 297–305. [Google Scholar] [CrossRef]
- Koç, İ.M.; Eray, T. Modeling frictional dynamics of a visco-elastic pillar rubbed on a smooth surface. Tribol. Int. 2018, 127, 187–199. [Google Scholar] [CrossRef]
- Eray, T.; Koç, İ.M.; Sümer, B. Investigation of adhesion and friction of an isotropic composite pillar. Proc. Inst. Mech. Eng. Part J J. Eng. Tribol. 2018, 233, 520–531. [Google Scholar] [CrossRef]
- Lazzari, A.; Tonazzi, D.; Conidi, G.; Malmassari, C.; Cerutti, A.; Massi, F. Experimental evaluation of brake pad material propensity to stick-slip and groan noise emission. Lubricants 2018, 6, 107. [Google Scholar] [CrossRef]
- Dubois, F.; Belly, C.; Saulot, A.; Berthier, Y. Stick-slip in stepping piezoelectric Inertia Drive Motors—Mechanism impact on a rubbing contact. Tribol. Int. 2016, 100, 371–379. [Google Scholar] [CrossRef]
- Tonazzi, D.; Massi, F.; Baillet, L.; Brunetti, J.; Berthier, Y. Interaction between contact behaviour and vibrational response for dry contact system. Mech. Syst. Signal Process. 2018, 110, 110–121. [Google Scholar] [CrossRef]
- Voyer, J.; Klien, S.; Velkavrh, I.; Ausserer, F.; Diem, A. Static and Dynamic Friction of Pure and Friction-Modified PA6 Polymers in Contact with Steel Surfaces: Influence of Surface Roughness and Environmental Conditions. Lubricants 2019, 7, 17. [Google Scholar] [CrossRef]
- Tonazzi, D.; Massi, F.; Baillet, L.; Culla, A.; Fregolent, A.; Regis, E.; Lambert, M. Experimental and numerical characterization of system response under dry frictional contact. In Proceedings of the ISMA 2014–International Conference on Noise and Vibration Engineering and USD 2014—International Conference on Uncertainty in Structural Dynamics, Leuven, Belgien, 15–17 September 2014; pp. 1931–1946. [Google Scholar]
- Xing, J.; Xu, Z.Z.; Li, D.W. Preparation and oxidation resistance of polyphenylene sulfide modified by high-temperature antioxidants. Mater. Res. Express 2021, 8, 45304. [Google Scholar] [CrossRef]
- Xing, J.; Xu, Z.; Deng, B. Enhanced Oxidation Resistance of Polyphenylene Sulfide Composites Based on Montmorillonite Modified by Benzimidazolium Salt. Polymers 2018, 10, 83. [Google Scholar] [CrossRef]
Disclaimer/Publisher’s Note: The statements, opinions and data contained in all publications are solely those of the individual author(s) and contributor(s) and not of MDPI and/or the editor(s). MDPI and/or the editor(s) disclaim responsibility for any injury to people or property resulting from any ideas, methods, instructions or products referred to in the content. |
© 2023 by the authors. Licensee MDPI, Basel, Switzerland. This article is an open access article distributed under the terms and conditions of the Creative Commons Attribution (CC BY) license (https://creativecommons.org/licenses/by/4.0/).