Article

Effect of Substrate Roughness and Contact Scale on the Tribological Performance of MoS2 Coatings

1
School of Mechanical & Automotive Engineering, Qingdao University of Technology, Qingdao 266033, China
2
State Key Laboratory of Solid Lubrication, Lanzhou Institute of Chemical Physics, Chinese Academy of Sciences, Lanzhou 730000, China
3
Shandong Laboratory of Yantai Advanced Materials and Green Manufacturing, Yantai 264000, China
4
Yantai Zhongke Research Institute of Advanced Materials and Green Chemical Engineering, Yantai 264000, China
5
School of Mechatronics and Energy Engineering, Ningbo Technology University, Ningbo 315199, China
*
Authors to whom correspondence should be addressed.
Lubricants 2023, 11(5), 191; https://doi.org/10.3390/lubricants11050191
Submission received: 7 February 2023 / Revised: 19 April 2023 / Accepted: 25 April 2023 / Published: 27 April 2023
(This article belongs to the Special Issue Friction and Wear of Coatings/Films)

Abstract

:
This present study aimed to clarify the effect of contact scale and surface topography of substrates with different roughnesses on the actual contact area, tangential stiffness, and tangential deformation of the substrate at micro- and macro-scales via finite element method (FEM) simulations, as well as the final tribological performances of MoS2 coatings by experiments. The MoS2 coatings were deposited on stainless steel (SS) substrates with different roughnesses, and the settings in the simulation models were based on the roughness of the SS substrates. The predicted tribological behavior of the simulation results was confirmed by the morphological and compositional analysis of the wear track using scanning electron microscopy (SEM), energy dispersive X-ray spectroscopy (EDS), 3D profilometer, and Raman spectroscopy. The results showed that the substrate with a surface roughness of Ra 600 nm (R600), coated by MoS2 nanosheets, exhibited excellent tribological properties at both micro- and macro-scales. At the micro-scale, the lubrication lifetime of R600 was as long as 930 cycles, while the substrates with surface roughnesses of Ra 60 nm (R60) and Ra 6 nm (R6) had a lubrication lifetime of 290 cycles and 47 cycles, respectively. At the macro-scale, the lifetime of the substrate R600 was 9509 cycles, which was nearly six times longer than the 1616 cycles of substrate R60. For the rough surface of substrate, the surface grooves could not only effectively preserve the lubricant but also continuously release them, ensuring that the lubricants with low shear strength were always present in the contact interface. It was further verified that the high surface roughness of the substrate reduced friction and wear by reducing the actual contact area and enhancing the tangential stiffness of asperities, thereby prolonging the lubrication lifetime. The wear mechanisms were discussed in terms of the morphology and chemical composition of the wear tracks.

1. Introduction

Over the past few decades, many successful commercial microdevices have been designed and widely used in automotive, aerospace, and medical devices owing to the advances in microdevices production [1]. Operational failure in microdevices was usually caused by the wear of moving components at the micro-scale. To improve the reliability of microdevices, it is crucial to study the tribological phenomena that occur at these microscopic scales. The friction of two surfaces in a relative motion is the inherently combined effect arising from many factors, such as contact mechanics, surface topography, adhesive forces, and the rubbing behavior of the third body during the sliding, to name but a few. These factors dominate the friction and wear behavior. A typical macro-scale sliding contact consists of millions of asperities. Amontons’ dry friction model on the macro-scale assumed that friction depended only on the load and not on the nominal contact area or value of the sliding velocity [2]. In contrast, there are only a few contact asperities in microtribology. Bowden and Tabor proposed that friction in dry contact originated from the plastic deformation created by the interlocking asperities [3]. The friction mainly depended on the real contact area and shear strength of the interface [4,5]. Therefore, surface roughness and real contact morphology would play a key role in micro-scale tribological performance.
The special application environment and unique integrated packaging technology limit the use of liquid lubricants in microdevices. Solid lubricants could overcome the shortcomings of liquid lubricants in microdevices [6,7,8]. Solid lubricant coatings were deposited on relatively hard substrates, in which most of the load was carried by the substrate, resulting in a small real contact area and high contact pressure. The low shear strength of solid lubricants could make them easy to wear out from the surface of the substrate, severely limiting their lifetime. This phenomenon could be exacerbated by the difference in the mechanical properties between the coating and the substrate [6]. It has been reported by many researchers that the combination of surface textures on the moving component surface and the coated solid lubricants was an effective method to improve tribological performance [9,10,11,12]. Moreover, compared with a flat surface, the surface texture could increase the contact area between the solid lubricant and the substrate, which improves the adhesion of the lubricant by the surface grooves and prolongs its lifetime [13]. Surface grooves could not only preserve the lubricants but also release them to the contact surface between the asperities driven by the friction, ensuring that the low shear strength material was always present [14,15,16,17,18,19]. Many researchers have presented many of views on optimizing texture parameters (e.g., width, depth, density) to ensure good tribological performance in the long term [20,21,22,23,24,25,26]. Moreover, Schäfer [27] and Maclucas [28] explored the effect of topographically designed surfaces on the release of lubricant to the contact area. They concluded that the deeper texture has a higher structural steepness, which prevents the effective supply of lubricant to the contact area.
Based on the above, it can be assumed that the continuous interaction of asperities at the sliding interface leads to the continuous change in the sliding surface, but the friction and wear mechanism of the material was not clearly revealed due to the lack of insight into the mechanical properties of the substrates with different surface morphologies. Few studies have explained the variation in the mechanical properties of the substrate arising different substrate roughness, which can significantly affect the tribological performance of the coatings. Among the surface characteristics, contact stiffness is a key factor influencing the dynamic instability of sliding components. Sherif [29] studied the effect of surface roughness on contact stiffness, and the results showed that the contact stiffness was significantly affected by the height distribution of the asperities. The results also determined that frictional instability was closely related to tangential contact stiffness. As the two nominally flat rough surfaces were bonded together, the surfaces were in discontinuous contact. The real contact area was the sum of the areas of the individual contact points, which was only a few percent of the apparent contact area for the sliding pairs under normal loads [30]. In some cases, it was quite difficult to track the evolution of tangential stiffness and real contact area via experiment methods during the sliding process. The finite element method (FEM) could often serve as an alternative method to indicate the possible effects of certain parameters because it could describe the local contact information during sliding and interfacial phenomena. Sellgren et al. [31] developed a finite element model of contact between two rough surfaces and investigated the effect of surface roughness on real contact area. Ripoll [32] estimated the influence of surface texturing on the coefficient of friction (COF) and evaluated the impact of grooves on friction under reciprocating sliding via FEM. The dependence of the COF on groove morphology or depth was clarified. Komvopolous et.al. [33] simulated the contact between an elastic half-space and multi-asperity rigid surfaces with finite elements and studied the influence of the asperity radius and spacing on contact deformation characteristics. Nevertheless, the real rough contact surfaces have sharp asperities, and the obtaining of contact mechanics information on these asperities through the FEM would lead to severe convergence problems due to the poor aspect ratio of elements or excessive deformation. Furthermore, under micro-scale contact conditions, the actual size of the asperities can decrease by several orders of magnitude compared to the dimensions of models for numerical simulation, leading to a high computational demand. Many numerical analysis methods are very useful in many contact mechanics and wear studies, but their application is limited due to their actual conditions. [34] Hertz assumed an idealized geometric shape and a smooth surface to solve the contact state between the smooth surface of an ideally shaped linear elastic body without friction, but it cannot be applied to a rough surface [35]. In contrast, the FEM can describe the state of objects with arbitrary shapes and is widely used for solving contact mechanics and friction and wear problems [31,36,37,38]. To quantify the differences in the capacity of substrates with different surface roughnesses to resist deformation during the dynamic sliding process and the real-time changing of the real contact area, the numerical simulations were performed through Ansys workbench 2021.
In the past, many models for predicting the state of the contact interface could only present the view of the contact mechanics without considering the dynamic sliding process [31,33,39,40,41]. Moreover, most prediction studies have not been compared with the actual experimental results. In this study, the evolution of the local contact tangential stiffness and deformation along the sliding direction during the dynamic sliding process were investigated by using FEM at the micro-scale and macro-scale. Compared with the smooth contact model, the influence of surface roughness on contact tangential stiffness and the deformation along the sliding direction was discussed. The actual working conditions simulated by the model were assessed through the tribotest. The wear tracks on the substrates with different roughnesses coated by MoS2 nanosheets were systemically characterized. The phenomenon of the tribotest was consistent with the prediction of the simulation results, and the influence mechanism of surface roughness on friction and wear was also discussed.

2. Experimental Details

2.1. Substrate Preparation

The size of 304 SS substrates with mirror surface was 20 mm × 20 mm × 4 mm. Sandpapers with different grit sizes (P2000, P100) were used to grind the substrate in the same direction to obtain different surface roughness values. Afterward, the substrates were ultrasonically cleaned with deionized water and ethanol for 30 min. The surface morphology and the roughness of the 304 SS substrates were measured with a 3D white light interferometry microscope (MicroXAM-800; KLA-Tencor, Milpitas, CA, USA).

2.2. FE model Description

To investigate the influence of tangential stiffness and contact area on the contact behavior of the substrate during the sliding process, a unidirectional dynamic sliding process with a displacement of 100 µm has been simulated via FEM. A prerequisite assumption needs to be emphasized before setting the FE model. Because the MoS2 layer deposited on the substrate surface does not bear any structural loads and only acts as a lubricant, all contact loads are assumed to be borne by the underlying SS surface and its asperities. It is difficult to reproduce a porous lubricant MoS2 layer randomly deposited by MoS2 nanosheets in the simulation process. Furthermore, the simulation focuses on the influence of the surface topography of the substrate on the tangential stiffness, contact area, and deformation along the sliding direction during the sliding process. Therefore, the model used in this study was composed of substrates with different surface roughnesses and smooth counter balls.
Making the surface configuration of the simulation model as consistent as possible with the sample surface in the tribotest is the key to ensuring the reliability of the simulation results. First, it is extremely critical to obtain the surface topography of the actual substrate sample. The 3D morphology of the substrate before or after grinding is presented in Figure 1. The roughness of the substrates polished by P100 and P2000 sandpaper was Ra 589.21 and 57.63 nm, respectively. In order to provide more reference information for the simulation model used to match the actual substrate surface topography, the 2D profile was measured for each substrate. As shown in Figure 1d, the commercial 304 SS substrate has a very smooth surface with a roughness of Ra 5.49 nm. Compared with the R60 and R600 samples, its 2D profile was almost a straight line. On rough surfaces, grooves and bulges can be clearly distinguished. Compared to the mirror substrate of R6, the ground substrates exhibit a linear structure of texture composed of grooves and bulges, as shown in Figure 1d.
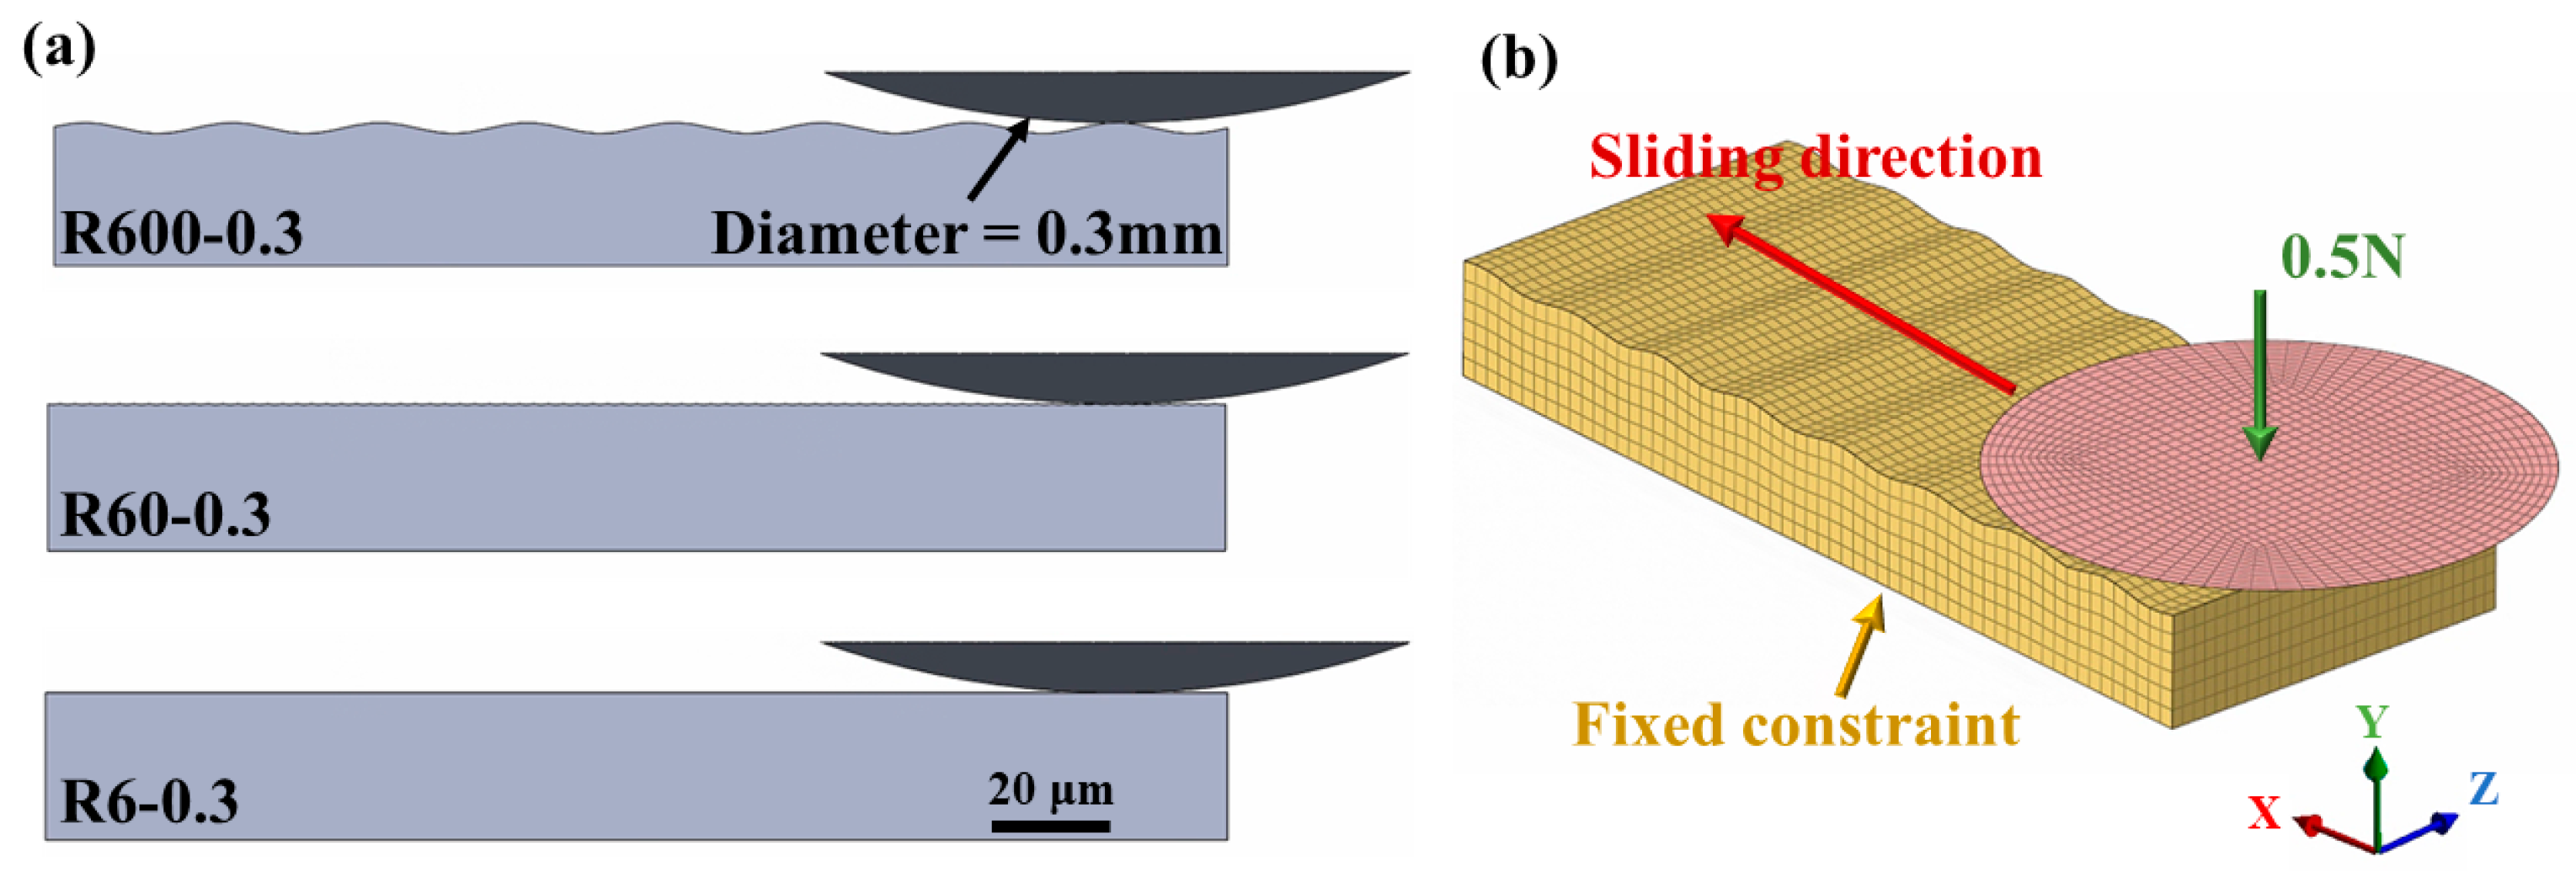
In order to ensure a match between the simulation and the actual sliding wear test, the sample grinding and preparation work was first carried out. However, it is difficult to control the Ra value and other surface roughness parameters simultaneously due to the limits of the grinding method and surface characterization method. As shown in Figure 1, the Ra of the substrate can be controlled at about 600, 60, and 6 nm through a simple grinding process. The actual topography consists of primary groove profile and secondary roughness. The primary groove profile dominates friction, wear, adhesion, and contact mechanics due to the huge difference between the secondary roughness and the primary groove profile. This study did not deeply consider the impact of secondary micro or nano-scale roughness in the simulation. In order to match the profile amplitude and wavelength of the simulation model with the profile of the actual topography of the substrate as closely as possible, two sine equations were used to generate the substrate surface profiles for models R600 and R60. The details of the sine equations used to generate the rough surface are listed in Table 1. In addition, the reproduction of the R6 substrate surface in the simulation model needs to be specified. The 3D topography and 2D profile of each substrate in Figure 1 demonstrate the huge difference between the surface topography of the smooth R6 substrate and the other two. It can be seen in Figure 1d that the 2D profile curve of the R6 substrate is almost a straight line, which cannot reveal more details of its morphology. Therefore, in order to simplify the model, the surface of the R6 substrate in the simulation model was a smooth plane. The cross-sectional 2D profile curves of the substrates R600, R60, and R6 used in the simulation model are shown in Figure 2. For simplicity, SS substrates were designated in this work according to different surface roughnesses.
The sliding models of substrates with three different roughness values were set up to rub a counter ball with the micro-scale and macro-scale, respectively. Specifically, a 0.3 mm diameter counter ball was slid on the substrate to define the micro-scale contact, whereas a 3.2 mm diameter counter ball was used to define the macro-scale contact. Therefore, six setups of different models were formed, and each group’s designations and specific parameter details are listed in Table 2. The specific configuration details of the models are shown in Figure 3. Figure 3a shows three models at the micro-contact scale, which consist of a simplified spherical cross-section and a cubic substrate with different surface profiles. To reduce the number of elements in the mesh and improve the solution efficiency, the top of the ball was simplified, and the bottom of the simplified spherical section maintained the original curved surface with a diameter of 0.3 mm. The mesh type for the substrates and counter balls was set as SOLID 186 element, and the mesh size of the counter balls and the substrates at the contact interface was set to 3 μm. The finite element mesh of R600-0.3 with boundary conditions and applied loads is shown in Figure 3b. Fixed support was applied on the bottom surface of the substrate to restrict the movements along and rotations around at the X-, Y-, and Z-axes. The source of the contact between the interfaces is the vertical normal concentrated force of 0.5 N applied to the center of the top surface of the simplified counter ball. Moreover, the top surface of the reverse sphere exerted a displacement of 100 μm along the X-axis, taking 12.5 ms, with an average velocity of 8 mm/s. The sliding direction of the counter ball was perpendicular to the grinding direction of the groove on the surface of the substrate. At the same time, the displacement of the top surface of the counter ball along the Z-axis and Y-axis was set to 0 and free, respectively. Through the constraints of these boundary conditions, the substrate was kept fixed, the hemisphere slid along the X-axis, and the top surface of the hemisphere was always parallel to the substrate.
The isotropic elastic parameters of the substrate and counter ball were set as the commonly used material parameters of 304 SS and 440C SS, respectively. The Young’s modulus, Poisson’s ratio, and density of the 304 SS substrate and the 440C SS counter ball were set to 194 and 200 GPa, 0.3 and 0.247, 7.93 and 7.8 g/cm3, respectively. The type of contact between the substrate and the counter ball was set to be frictional to allow tangential sliding. In general, the friction coefficient of MoS2 is around 0.1; therefore, the friction coefficient was adjusted to 0.1 to ensure the sliding between the two interfaces close to the state where the MoS2 layer exists. For the other three groups under the contact of the 3.2 mm-diameter counter ball, the same simplification method was used to simplify the counter ball, and the material properties, model details, and boundary conditions of each simulation model used the same configuration.
To explore the difference in the mechanical contact properties of substrates with different surface roughnesses at the micro-scale and macro-scales, changes in the state of the substrates during the sliding process were simulated. The calculation solvers for the actual contact area, tangential stiffness, and X-axis deformation in ANSYS Workbench 2021 were employed.

2.3. MoS2 Coating Deposition

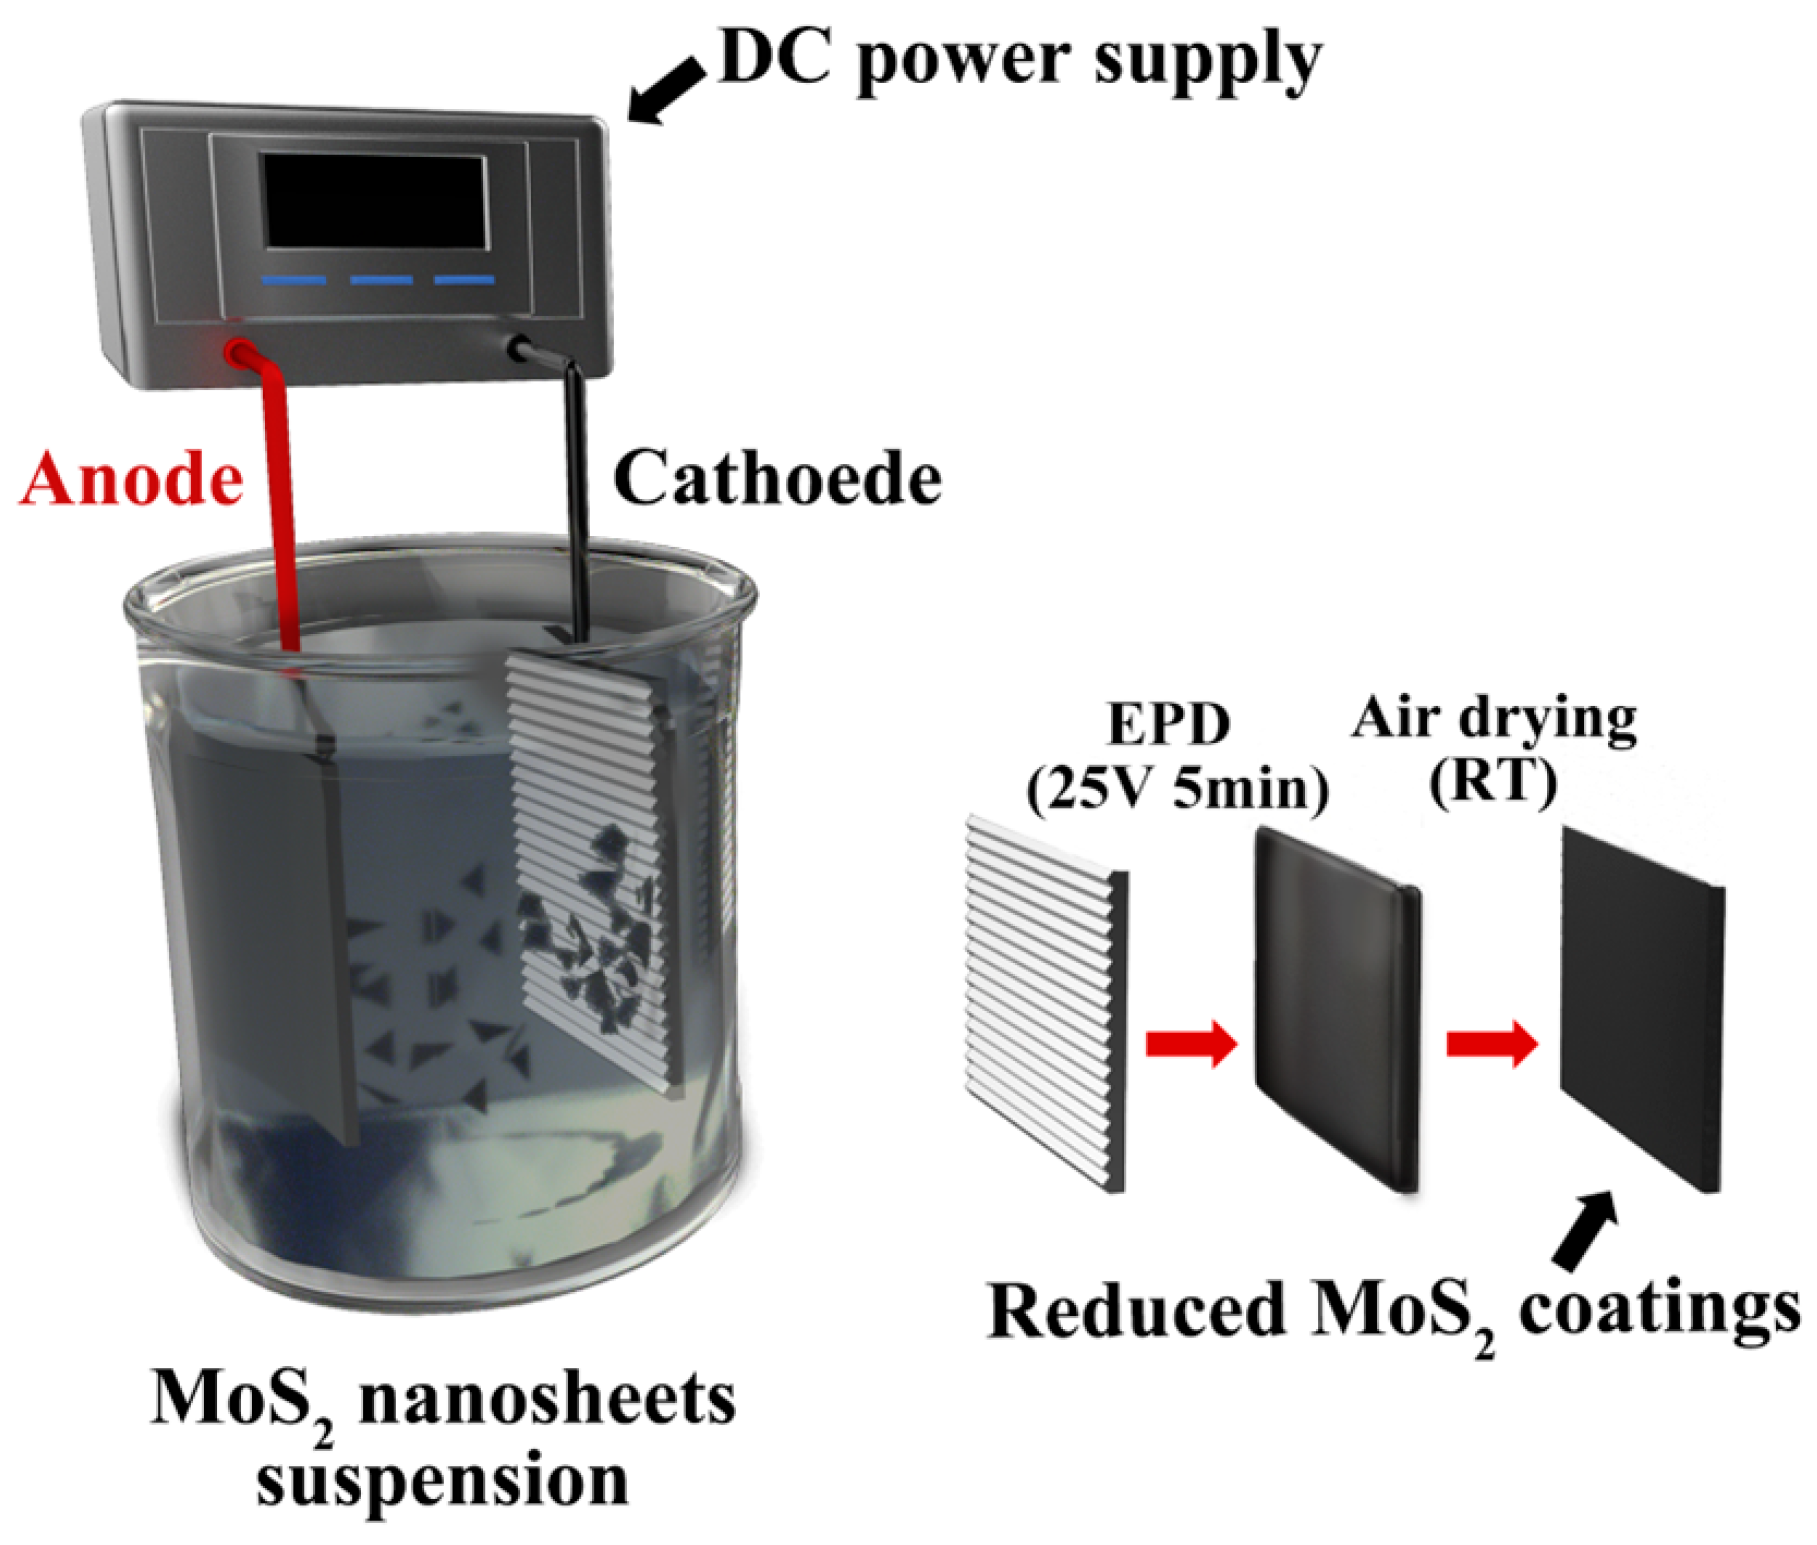
MoS2 coatings were deposited on the SS substrate using the MoS2 nanosheets via the electrophoretic deposition (EPD) method. Figure 4 shows the schematic diagram of the EPD process. Initially, the MoS2 nanosheets and the hexadecyl trimethyl ammonium bromide (CTAB) powder were dispersed in ultra-pure water and stirred for 5 min, followed by sonication for 30 min to obtain a suspension of MoS2 (2 g/L) and CTAB (0.5 g/L). The EPD process was carried out at 25 V for 5 min, and the distance between the cathode (304 SS substrate) and the anode (304 SS plate) was 20 mm. After the deposition, the fabricated MoS2 coatings were removed from the suspensions and dried for 2 h at room temperature. The crystallographic structure of the MoS2 nanosheets were investigated by X-ray diffraction (XRD; D8 ADVANCE; Bruker, Mannheim, Germany; Cu-Kα; λ = 1.5406 Å) at 40 kV, with 40 mA current and a scanning rate of 10°/min in a wide angle region with 2θ ranging from 10° to 70°. The structure and morphology of raw material MoS2 nanosheets and the deposited coatings were analyzed by SEM (FEI Quanta FEG 250).

2.4. Tribotest

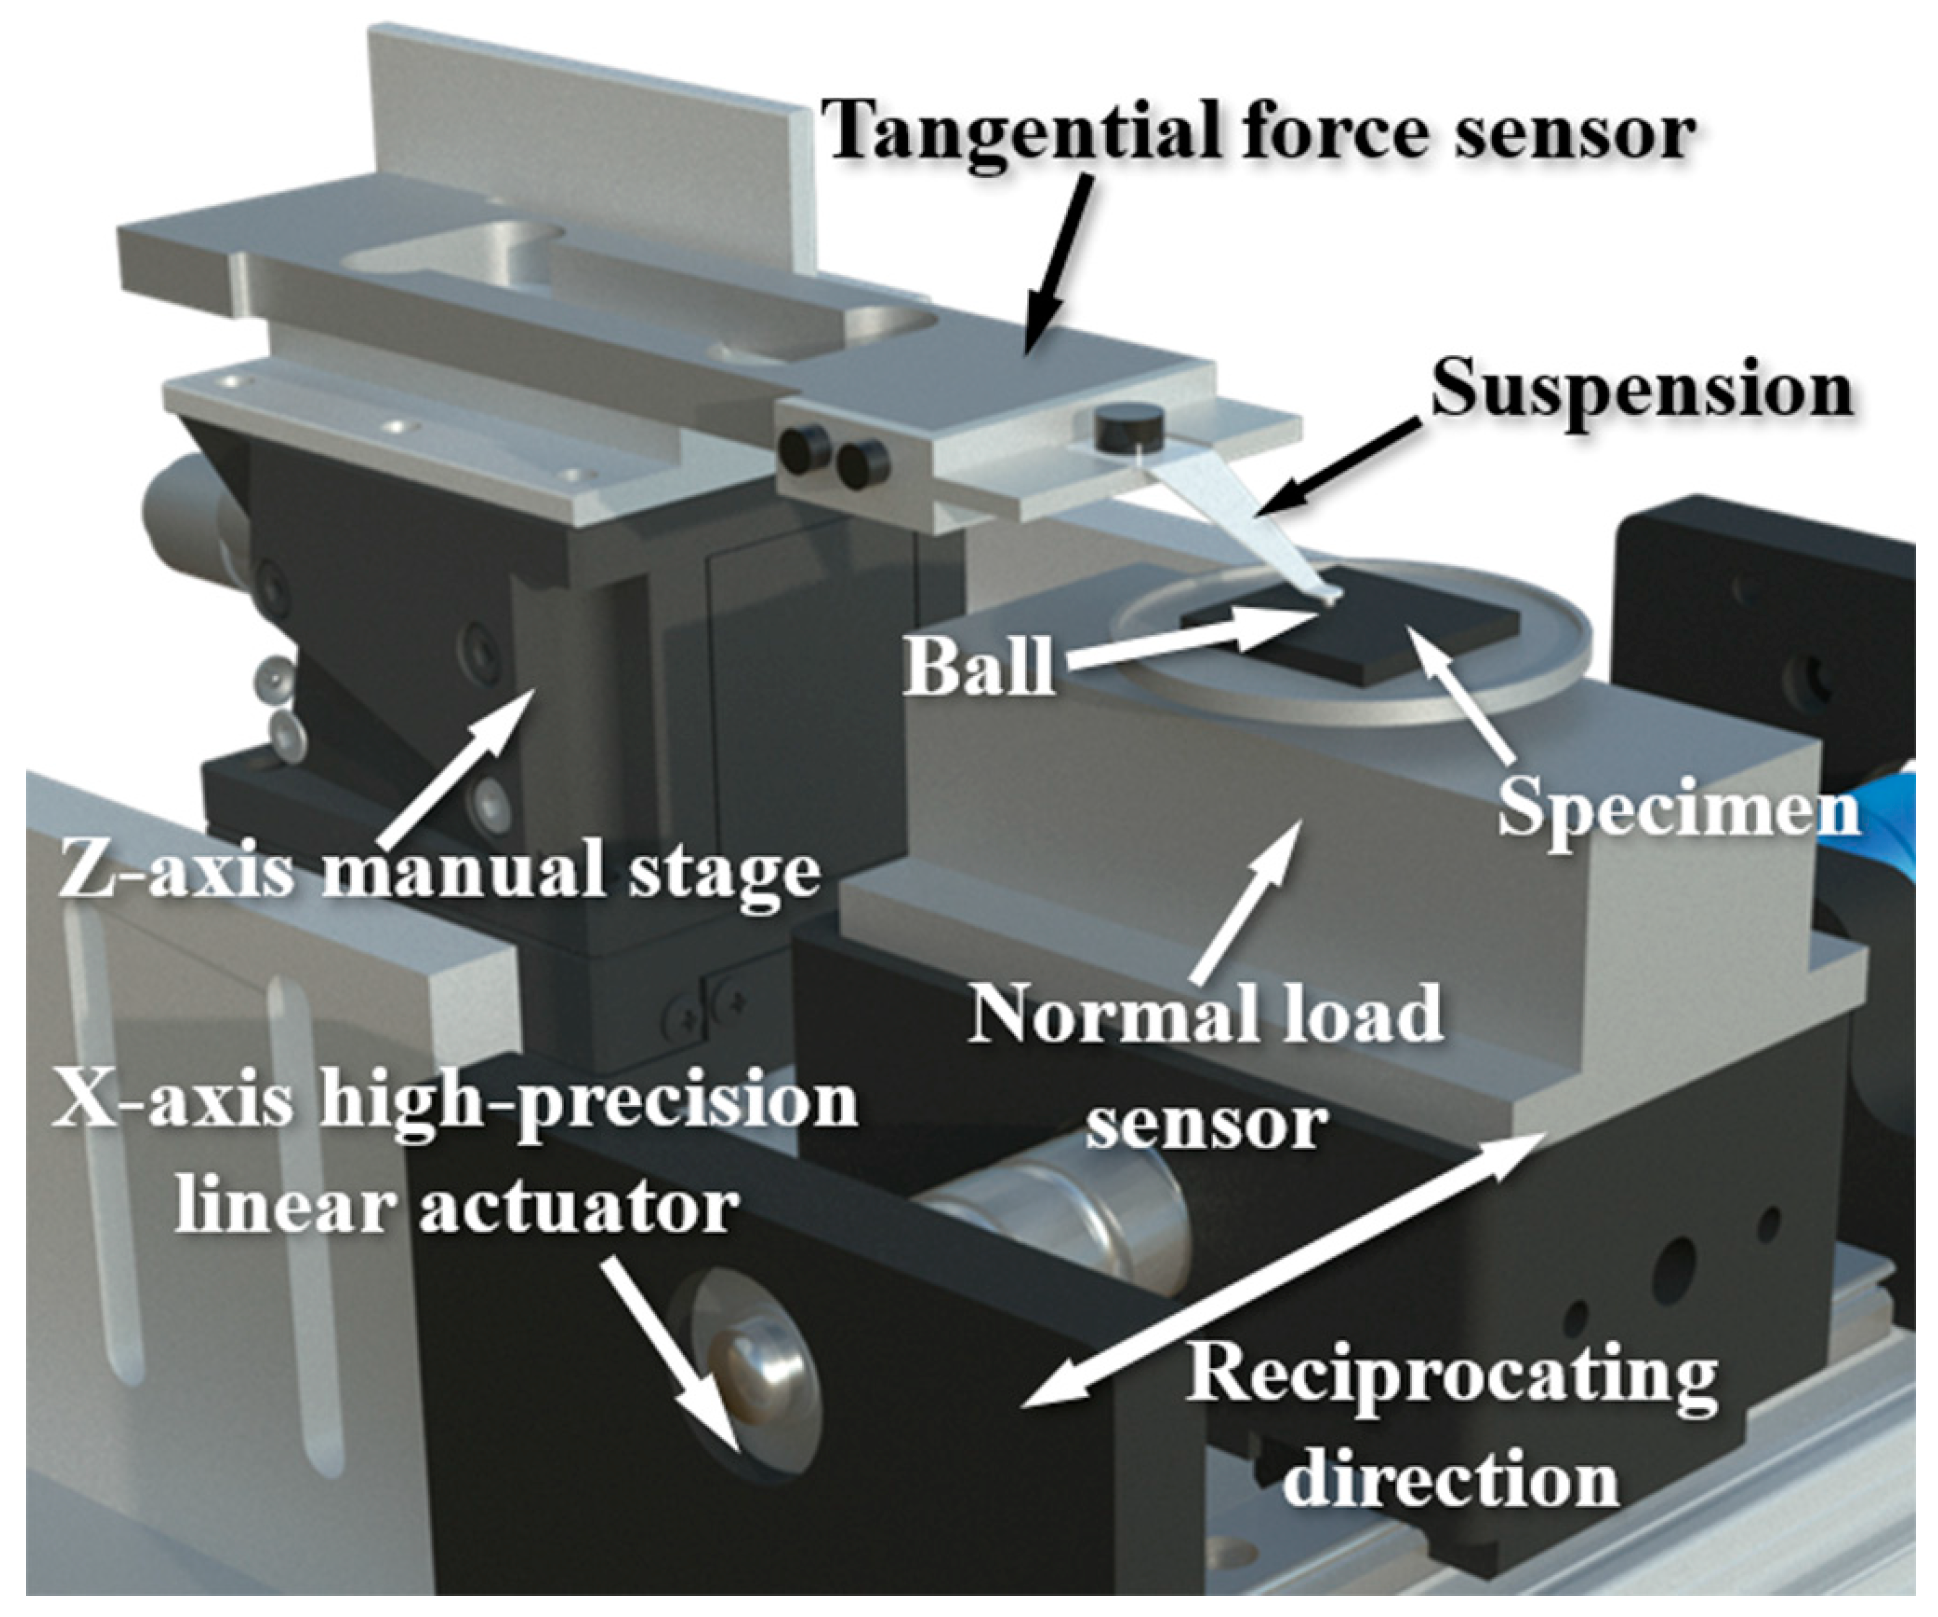
The tribotests of the MoS2 coatings on the substrate with different surface roughnesses were carried out on a homemade ball-on-disc reciprocating tribometer. The design and components of the tribometer are shown in Figure 5. The friction force sensor connected with a custom suspension, and the counter ball was fixed on the Z-axis manual stage. The normal load sensor connected with the specimen holder was fixed on the X-axis high-precision linear actuator. Before the tribotest, the tangential force sensor was driven downwards by the Z-axis manual stage. Due to the deformation of the suspension, the counter ball exerted pressure on the specimen and the normal load was measured by the normal load sensor. During the tribotest, the X-axis high-precision linear displacement stage drove the specimen stage in reciprocating motion. The relative displacement between the specimen and the fixed counter ball is generated by the movement of the X-axis stage. The sliding direction of the counter ball was perpendicular to the direction of the groove on the substrate. At the same time, the friction force measured by the tangential force sensor was input into the computer to calculate the COF in real time. In this work, the normal load was kept at 0.5 N during the reciprocating sliding process. Moreover, a reciprocating motion of 4 mm stroke and 2 Hz frequency was obtained by controlling the X-axis actuator. The average speed was 8 mm/s, which was the same as the setting in the simulation. The commercially available 440C SS balls with diameters of 0.3 and 3.2 mm were used as counterparts in the tribotest. The tribotest was run until the failure of the MoS2 coating, when moment the COF reached 0.6. All the tribotests were carried out in ambient air with relative humidity (RH) of ~25% and room temperature.
To further reveal the tribological mechanisms on the surfaces with different roughnesses, a test with 200 sliding cycles was carried out, and the wear track was observed by using SEM equipped with energy dispersive spectroscopy (EDS, Oxford XMax, Oxford, UK). The Raman spectra of the wear tracks were collected with a micro-Raman spectrometer (Thermo Scientific, Waltham, MA, USA, DRX, excitation wavelength 532 nm) using 0.5 mW at room temperature.

3. Results and Discussion

3.1. Simulation Result

During the sliding process, the SS ball is continuously in contact with the regularly alternating peaks and valleys of the sinusoidal curve. The real-time numerical curve of the tangential stiffness of the substrate, the deformation along the X-axis, and the contact area is a curve that fluctuates within a certain range. As shown in Figure 6 and Figure 7, the values of the tangential stiffness of the substrate, the displacements of the substrate surface along the X-axis, and the fluctuation of the contact area with the steady-state sliding process were calculated with mean values and standard deviations for comparison and discussion.
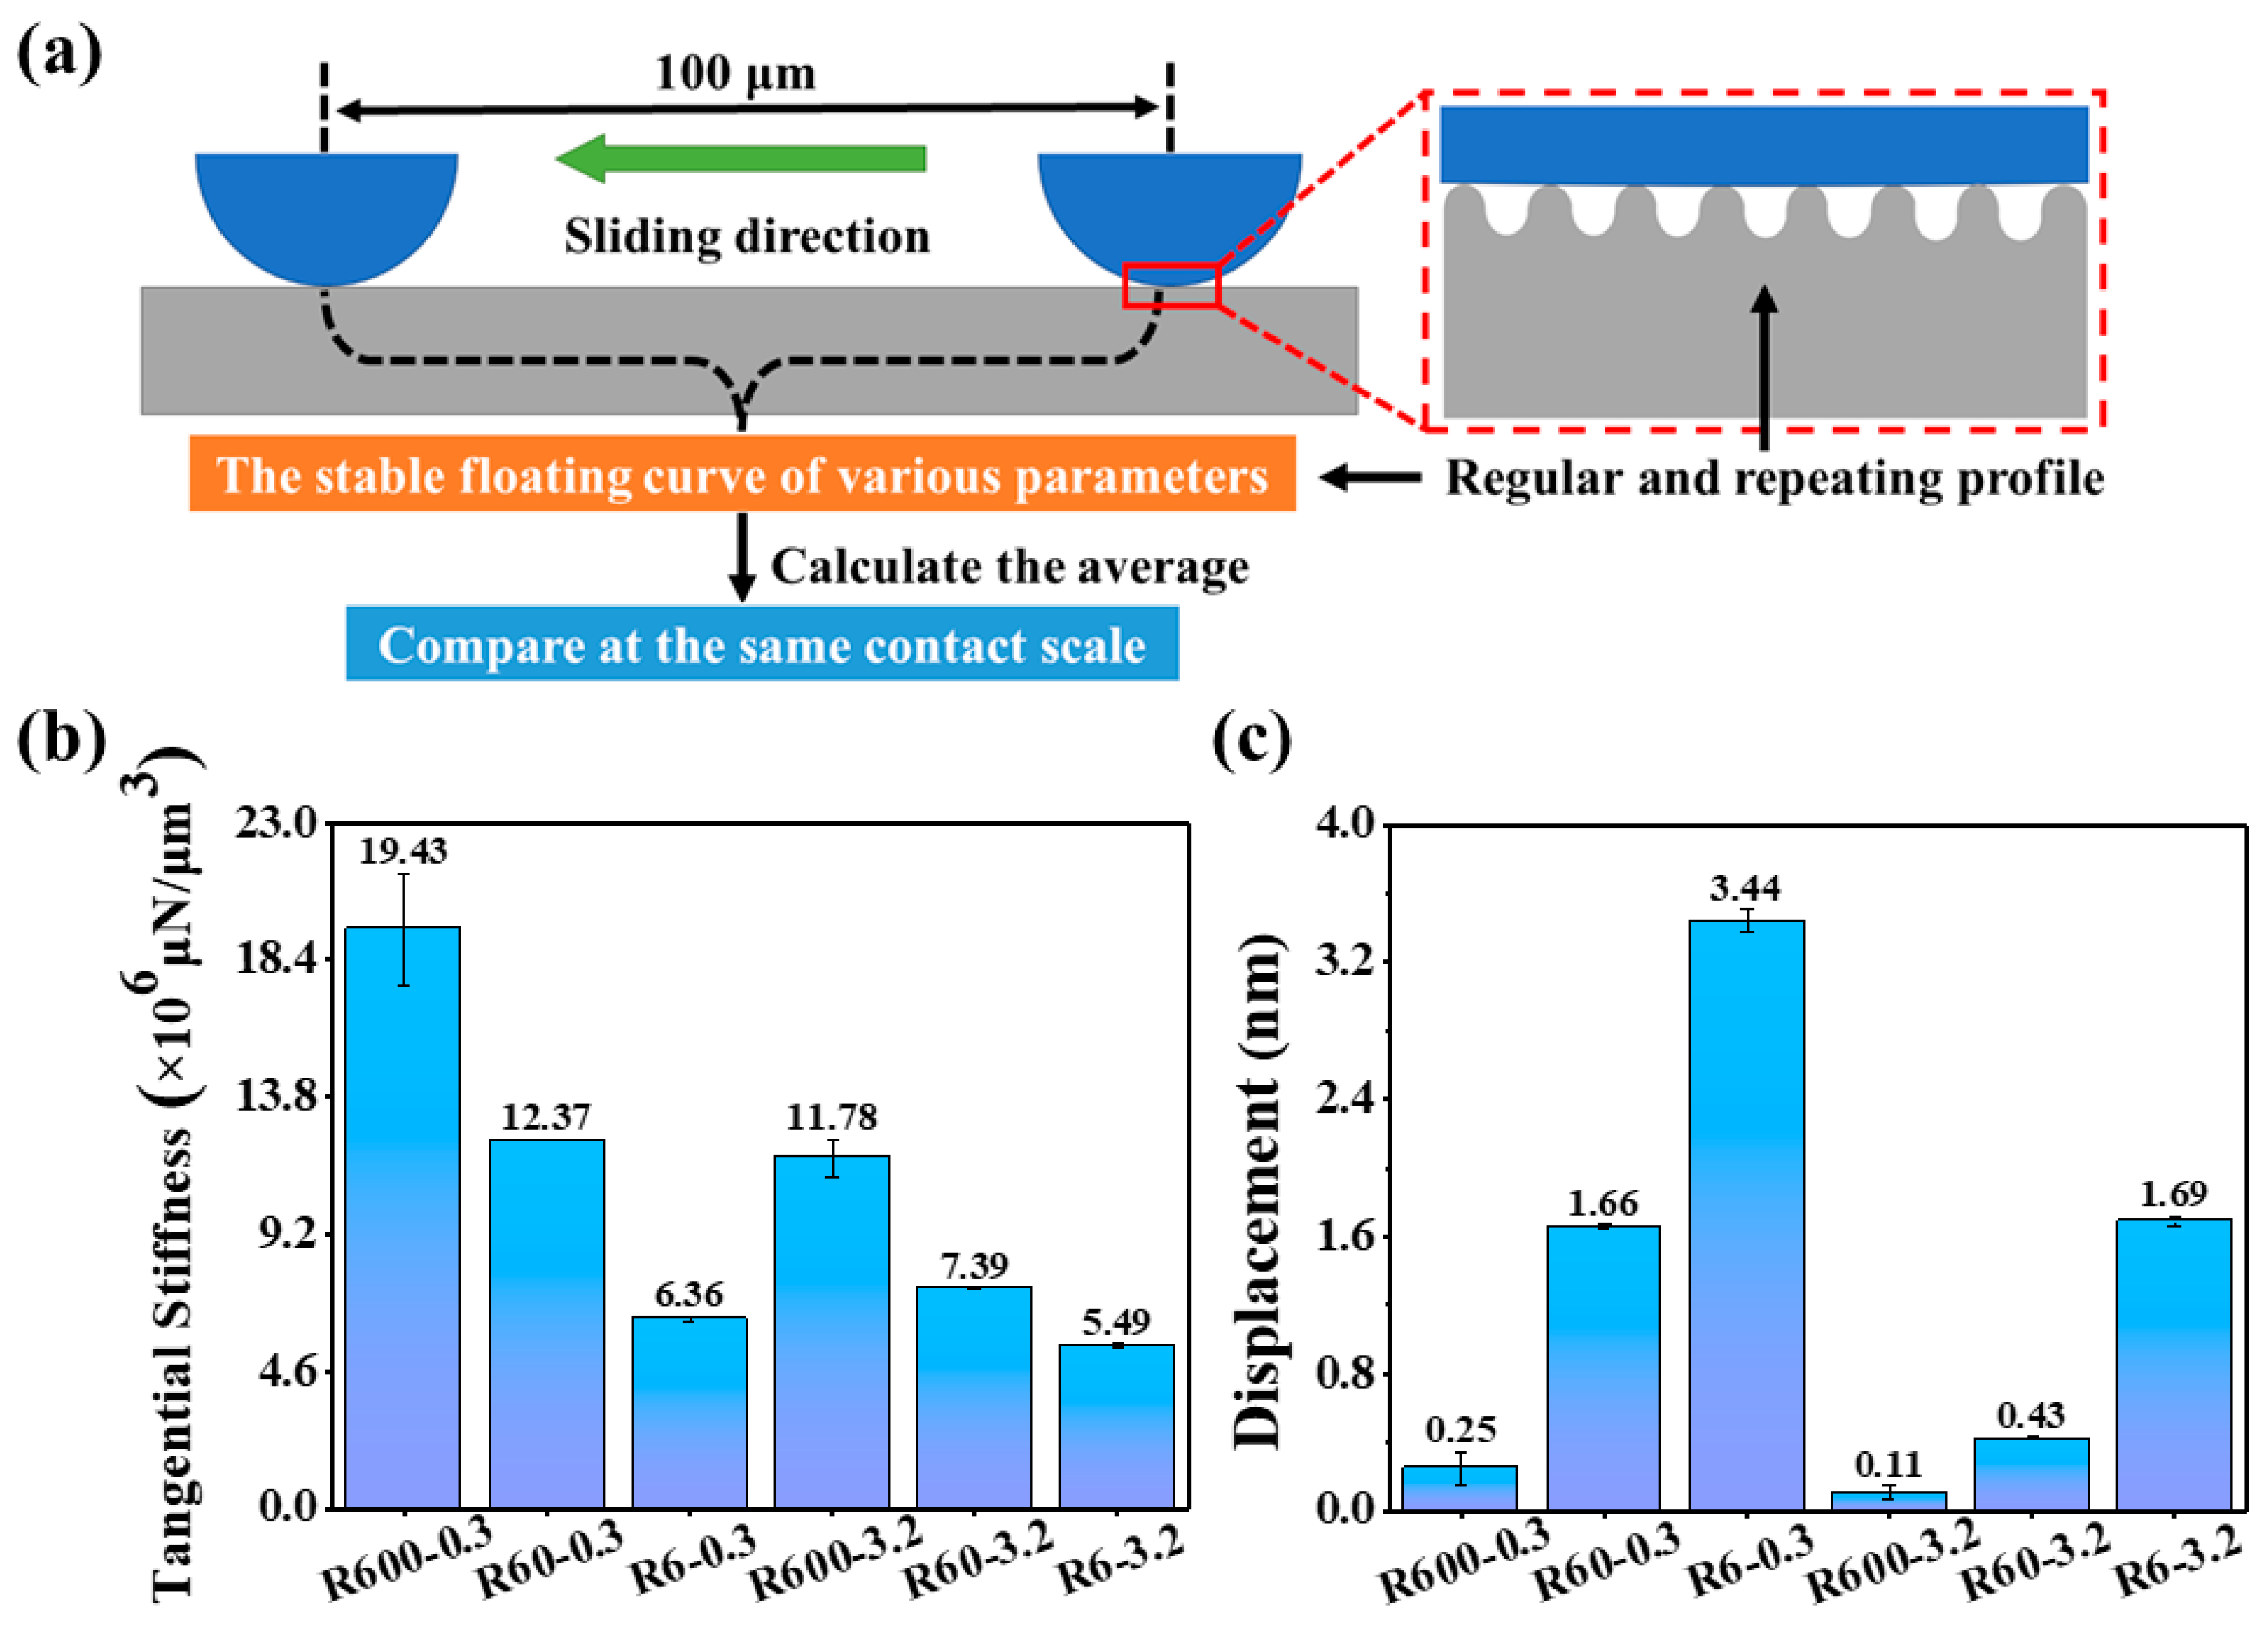
Figure 6b,c presents the maximum tangential stiffness and the deformation along the X-axis of the simulated contact substrates with different surface roughnesses at both micro- and macro-scales. As shown in Figure 6b, at the micro-scale contact condition, the tangential stiffness of R600-0.3 is 19.43 × 10⁶ μN/μm3, R60-0.3 is 12.37 × 10⁶ μN/μm3 and R6-0.3 is 6.36 × 10⁶ μN/μm3. Under the macro-scale contact condition, the value of tangential stiffness for the R600-3.2 is 11.78 × 10⁶ μN/μm3, which further declines to 7.39 × 10⁶ and 5.49 × 10⁶ μN/μm3 for the R60-3.2 and R6-3.2, respectively. The tangential stiffness values shown in Figure 6b are the translational stiffness per unit area along the sliding direction, which can be used to indicate the ability of an object to resist deformation. Therefore, the higher the tangential stiffness of the substrate, the better its resistance to deformation in the tangential direction during the sliding process. The tangential stiffness decreases with a decrease in the surface roughness under the same contact scale. In comparison, it is predictable that R600-0.3 and R600-3.2 with the highest roughness would have the smallest tangential deformation during sliding at the micro- and macro-scale, respectively.
The data processing method for the deformation along the X-axis during the dynamic sliding process can also be referred to in the flowchart in Figure 6a. The values shown in Figure 6c are the displacement values of the nodes of the substrate surface elements along the sliding X-axis during the sliding process. The difference in the degree of deformation of the substrate surface during sliding was indicated by comparing the values in Figure 6c. The average values of the displacement of R600, R60, and R6 at the micro- and macro-scale are illustrated in Figure 6c. The R600-0.3 and R600-3.2 have the lowest displacements along the X-axis at the micro- and macro-scale, which are 0.25 and 0.11 nm, respectively. The R60 and R6 with low roughness show large displacements along the X-axis. The displacements of R60 and R6 are 1.66 and 3.44 nm at the micro-scale. In addition, at macro-scale, the values are 0.43 and 1.69 nm, respectively. This is consistent with the results of the tangential stiffness evaluation. In comparison, the rough surface topography possesses outstanding performance in resisting the deformation along the rubbing direction at both micro- and macro-scales. The sliding process in the simulation is a short process with a load of 0.5 N at a distance of 100 μm. The whole sliding process was carried out in pure elastic mode, and the influence of plasticity was not considered. In general, the ability of the substrate to maintain the initial surface topography during sliding is a key factor affecting the wear resistance of lubricant coatings on the surfaces. It is therefore presumed that in tribotests of substrates coated by a solid lubricant, the rough surface of the substrate can better retain the original topography. Therefore, more MoS2 can be stored in the groove and continuously supplied to the contact interface, resulting in robust lubrication behavior.
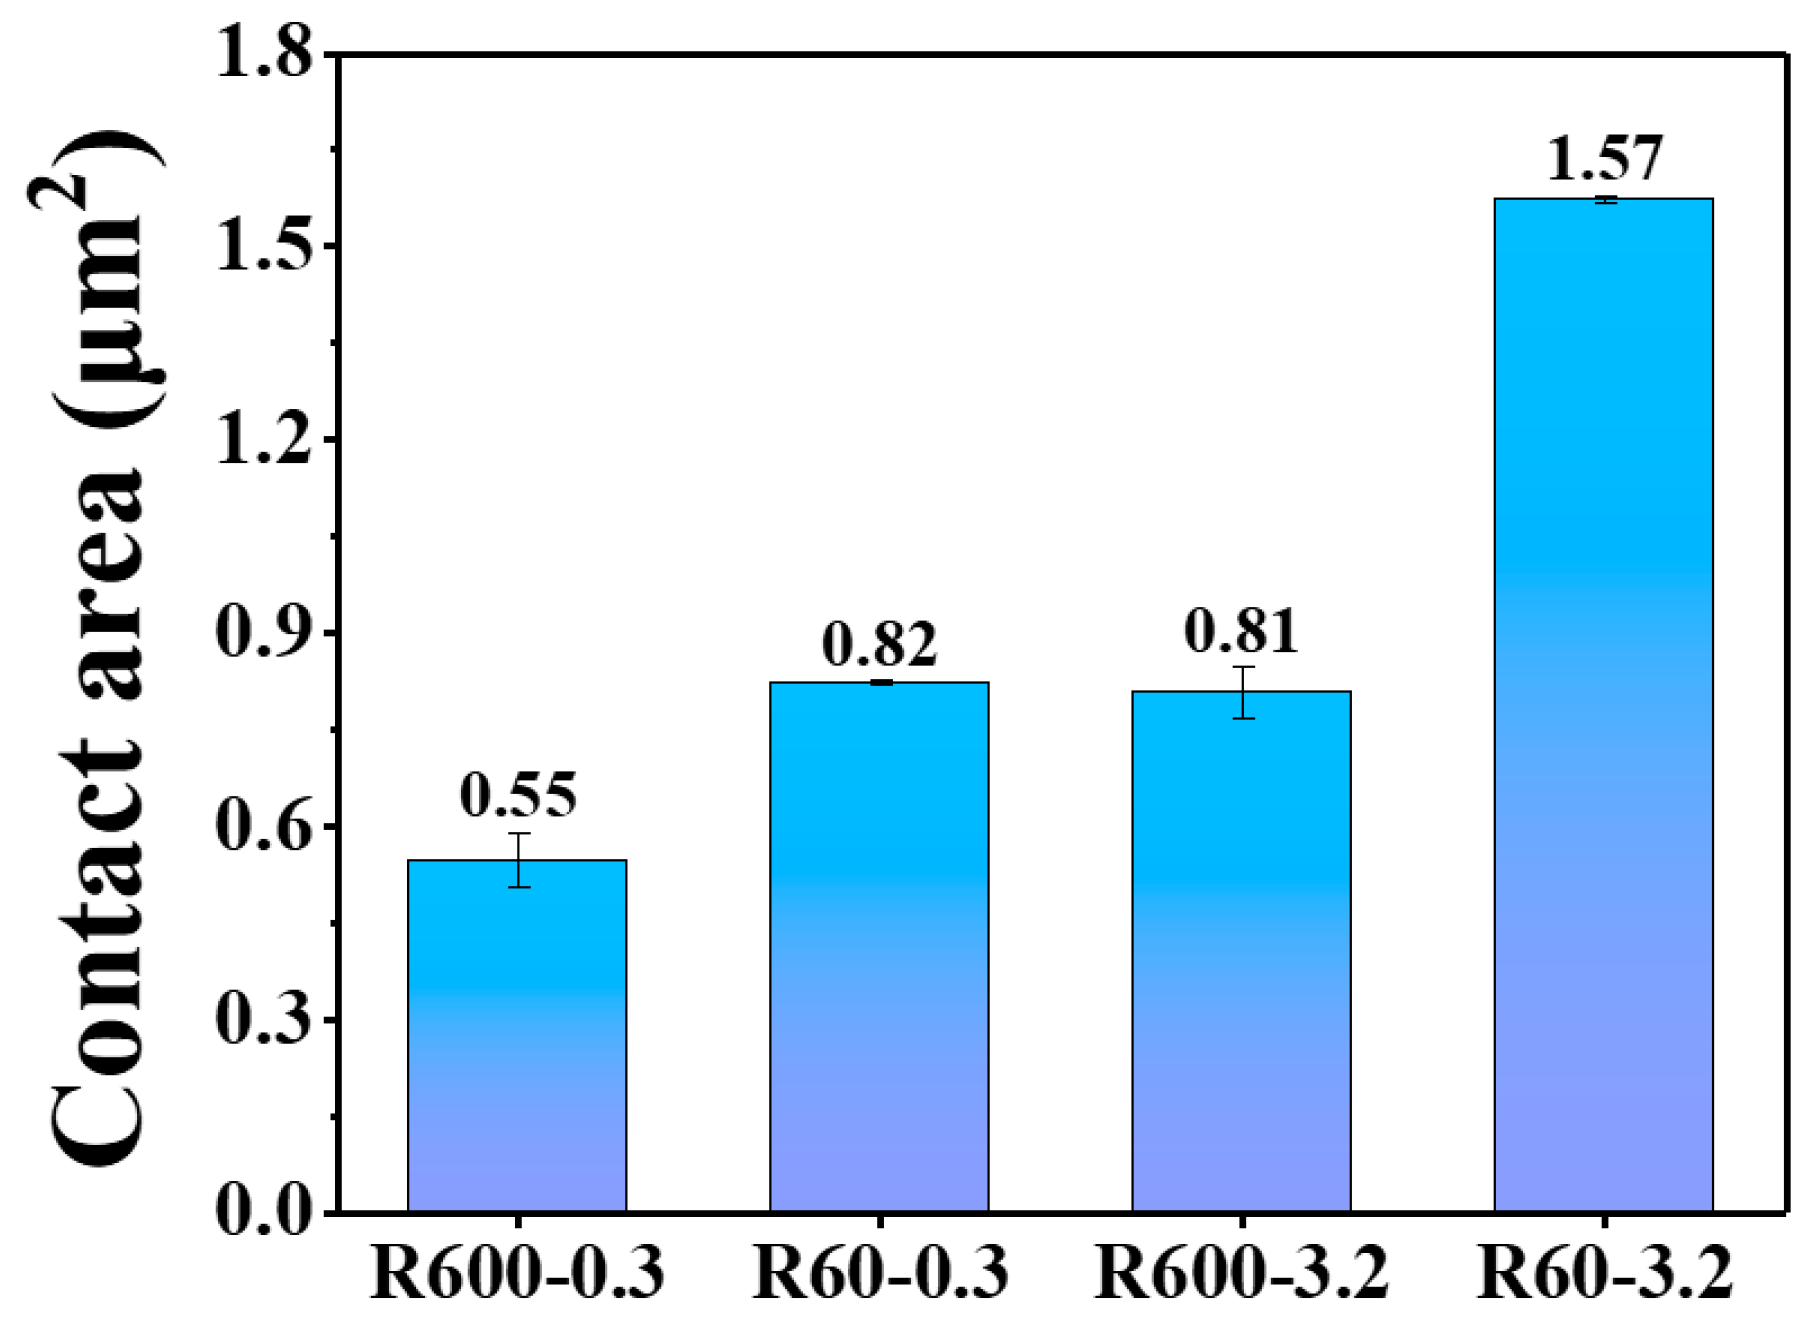
Since the rough surfaces are effectively in contact at the tips of the asperities, the entire actual contact area is made up of all the contact points. In addition, the actual contact area depends strongly on the roughness of the interacting surfaces [5,42]. The contact area is defined as the total area of the elements that are in contact during sliding, and the detailed raw data processing flow is shown in Figure 6a. The contact area of the rough surface during sliding is shown in Figure 7. At the micro-contact scale, the actual contact areas of R600-0.3 and R60-0.3 are 0.55 and 0.82 μm2, respectively. The higher the surface roughness, the smaller the contact area. The same trend of the actual contact area can also be observed from the macro-scale contact condition. The contact area of R60-3.2 is 1.57 μm2, about twice that of R600-3.2. The reduction of actual contact area due to surface texture can be regarded as the main effect that contributes to the improved tribological performance [14,43]. The low contact area can easily prevent sticking between the contact surfaces. Therefore, it can be anticipated that R600 should present lower COF values than R60 during dynamic sliding at the same contact scale.

3.2. Characteristics of the MoS2 Coatings

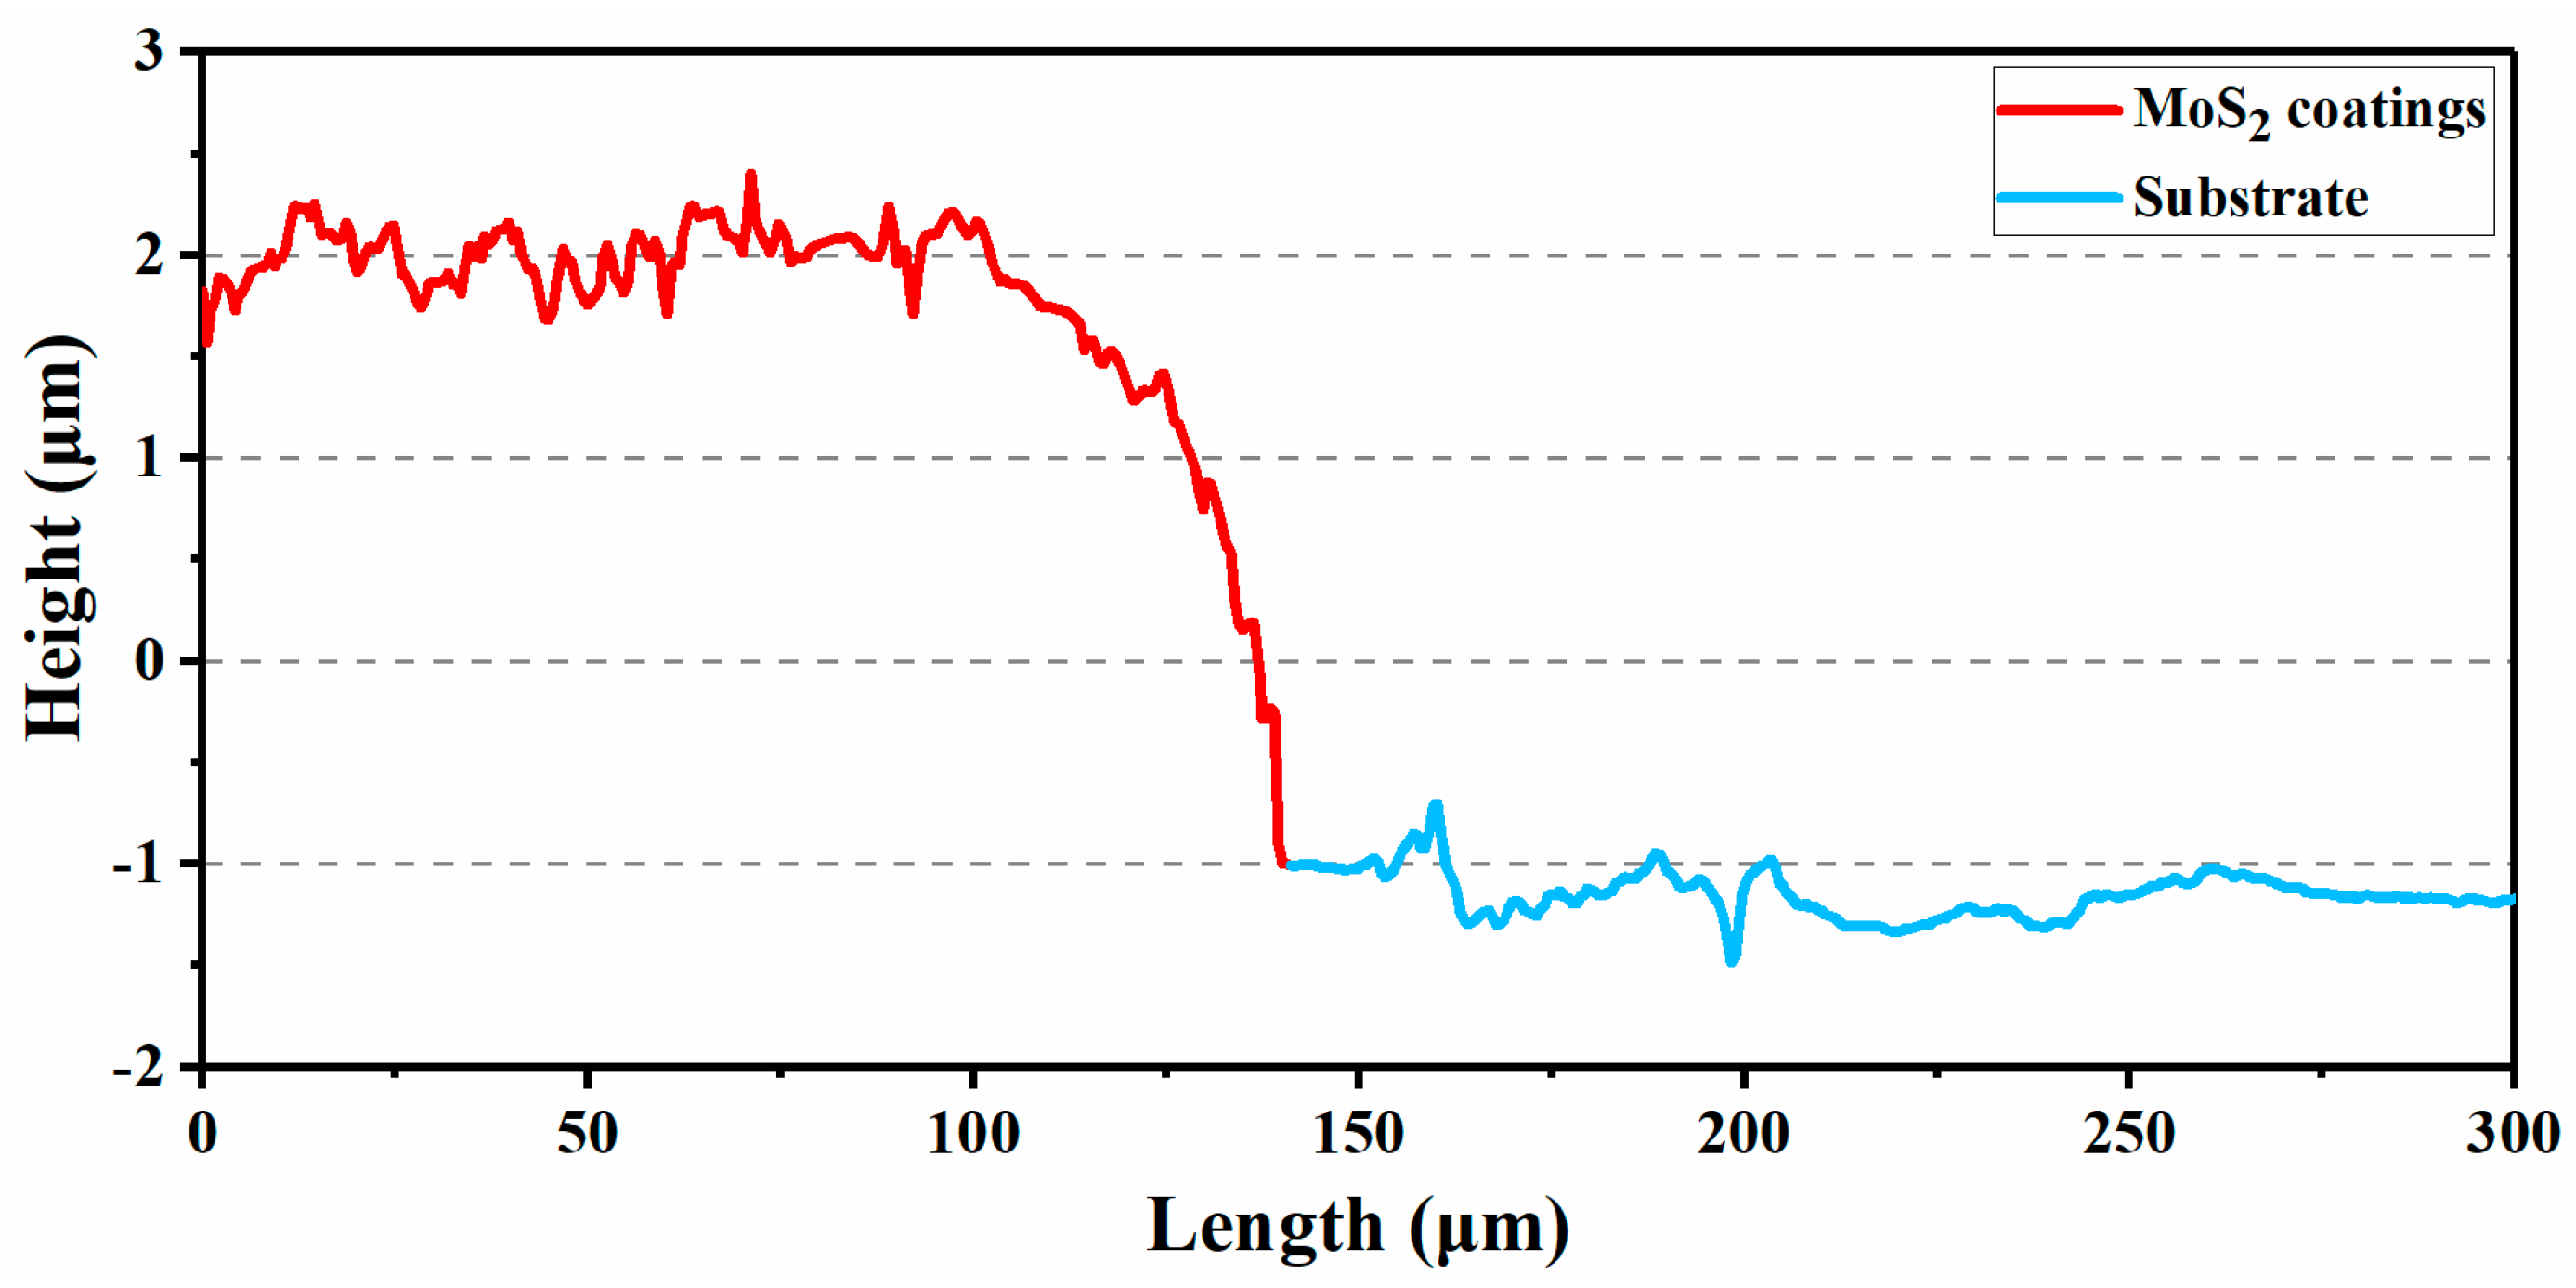
To clarify the characteristics of the raw material MoS2, it was examined by SEM, as shown in Figure 8a. The MoS2 presents the typical nanosheet structure without any apparent agglomeration. The sheets were deposited on the 304 SS substrate via the EPD method, and the coating was further analyzed by SEM. As illustrated in Figure 8b, the MoS2 coating on the SS substrate has a rough surface owing to the random orientation of the flat MoS2 nanosheets during the deposition process. In addition, the high-resolution SEM images in Figure 8b,c can prove that this led to the porous structure of MoS2 the coating. To evaluate the thickness of the MoS2 coatings on the SS substrate, 3D white light interference microscopy was employed. The 2D profile close to the edge of the MoS2 coating on the R60 substrate is shown in Figure 9. The thickness of the MoS2 coating is ~3.1 μm, and the cross-section of MoS2 coating in Figure 8c can also prove it.
The representative XRD pattern of the MoS2 coating on the R60 substrate was obtained, as illustrated in Figure 10. Most peaks in the pattern are consistent with the 2H-MoS2 (PDF card #37-1492). The peaks located at 14.37°, 29.02°, 32.67°, 33.50°, 35.87°, 39.53°, 44.15°, 49.78°, 55.97°, 58.33°, and 60.14° are indexed as the crystal planes of 2H-MoS2 (002), (004), (100), (101), (102), (103), (006), (105), (106), (110), and (008), respectively. Moreover, the other two peaks at 43.47° and 50.67° belong to the 304 SS substrate (PDF card #23-0298). This suggested that the inherent chemical composition and structure of the MoS2 nanosheets were not altered when they were transferred from the dispersive state in the solution to the solid coating state by the EPD (Figure 4). Furthermore, a relatively porous structure of the coating originated from the random assembly of MoS2 nanosheets, which cannot provide high hardness to bear the applied normal force. In this case, the effect of the surface roughness of the SS substrate on the mechanical properties would not be essentially influenced by the thin and porous MoS2 coating.

3.3. Effects of Surface Roughness on the Tribological Properties

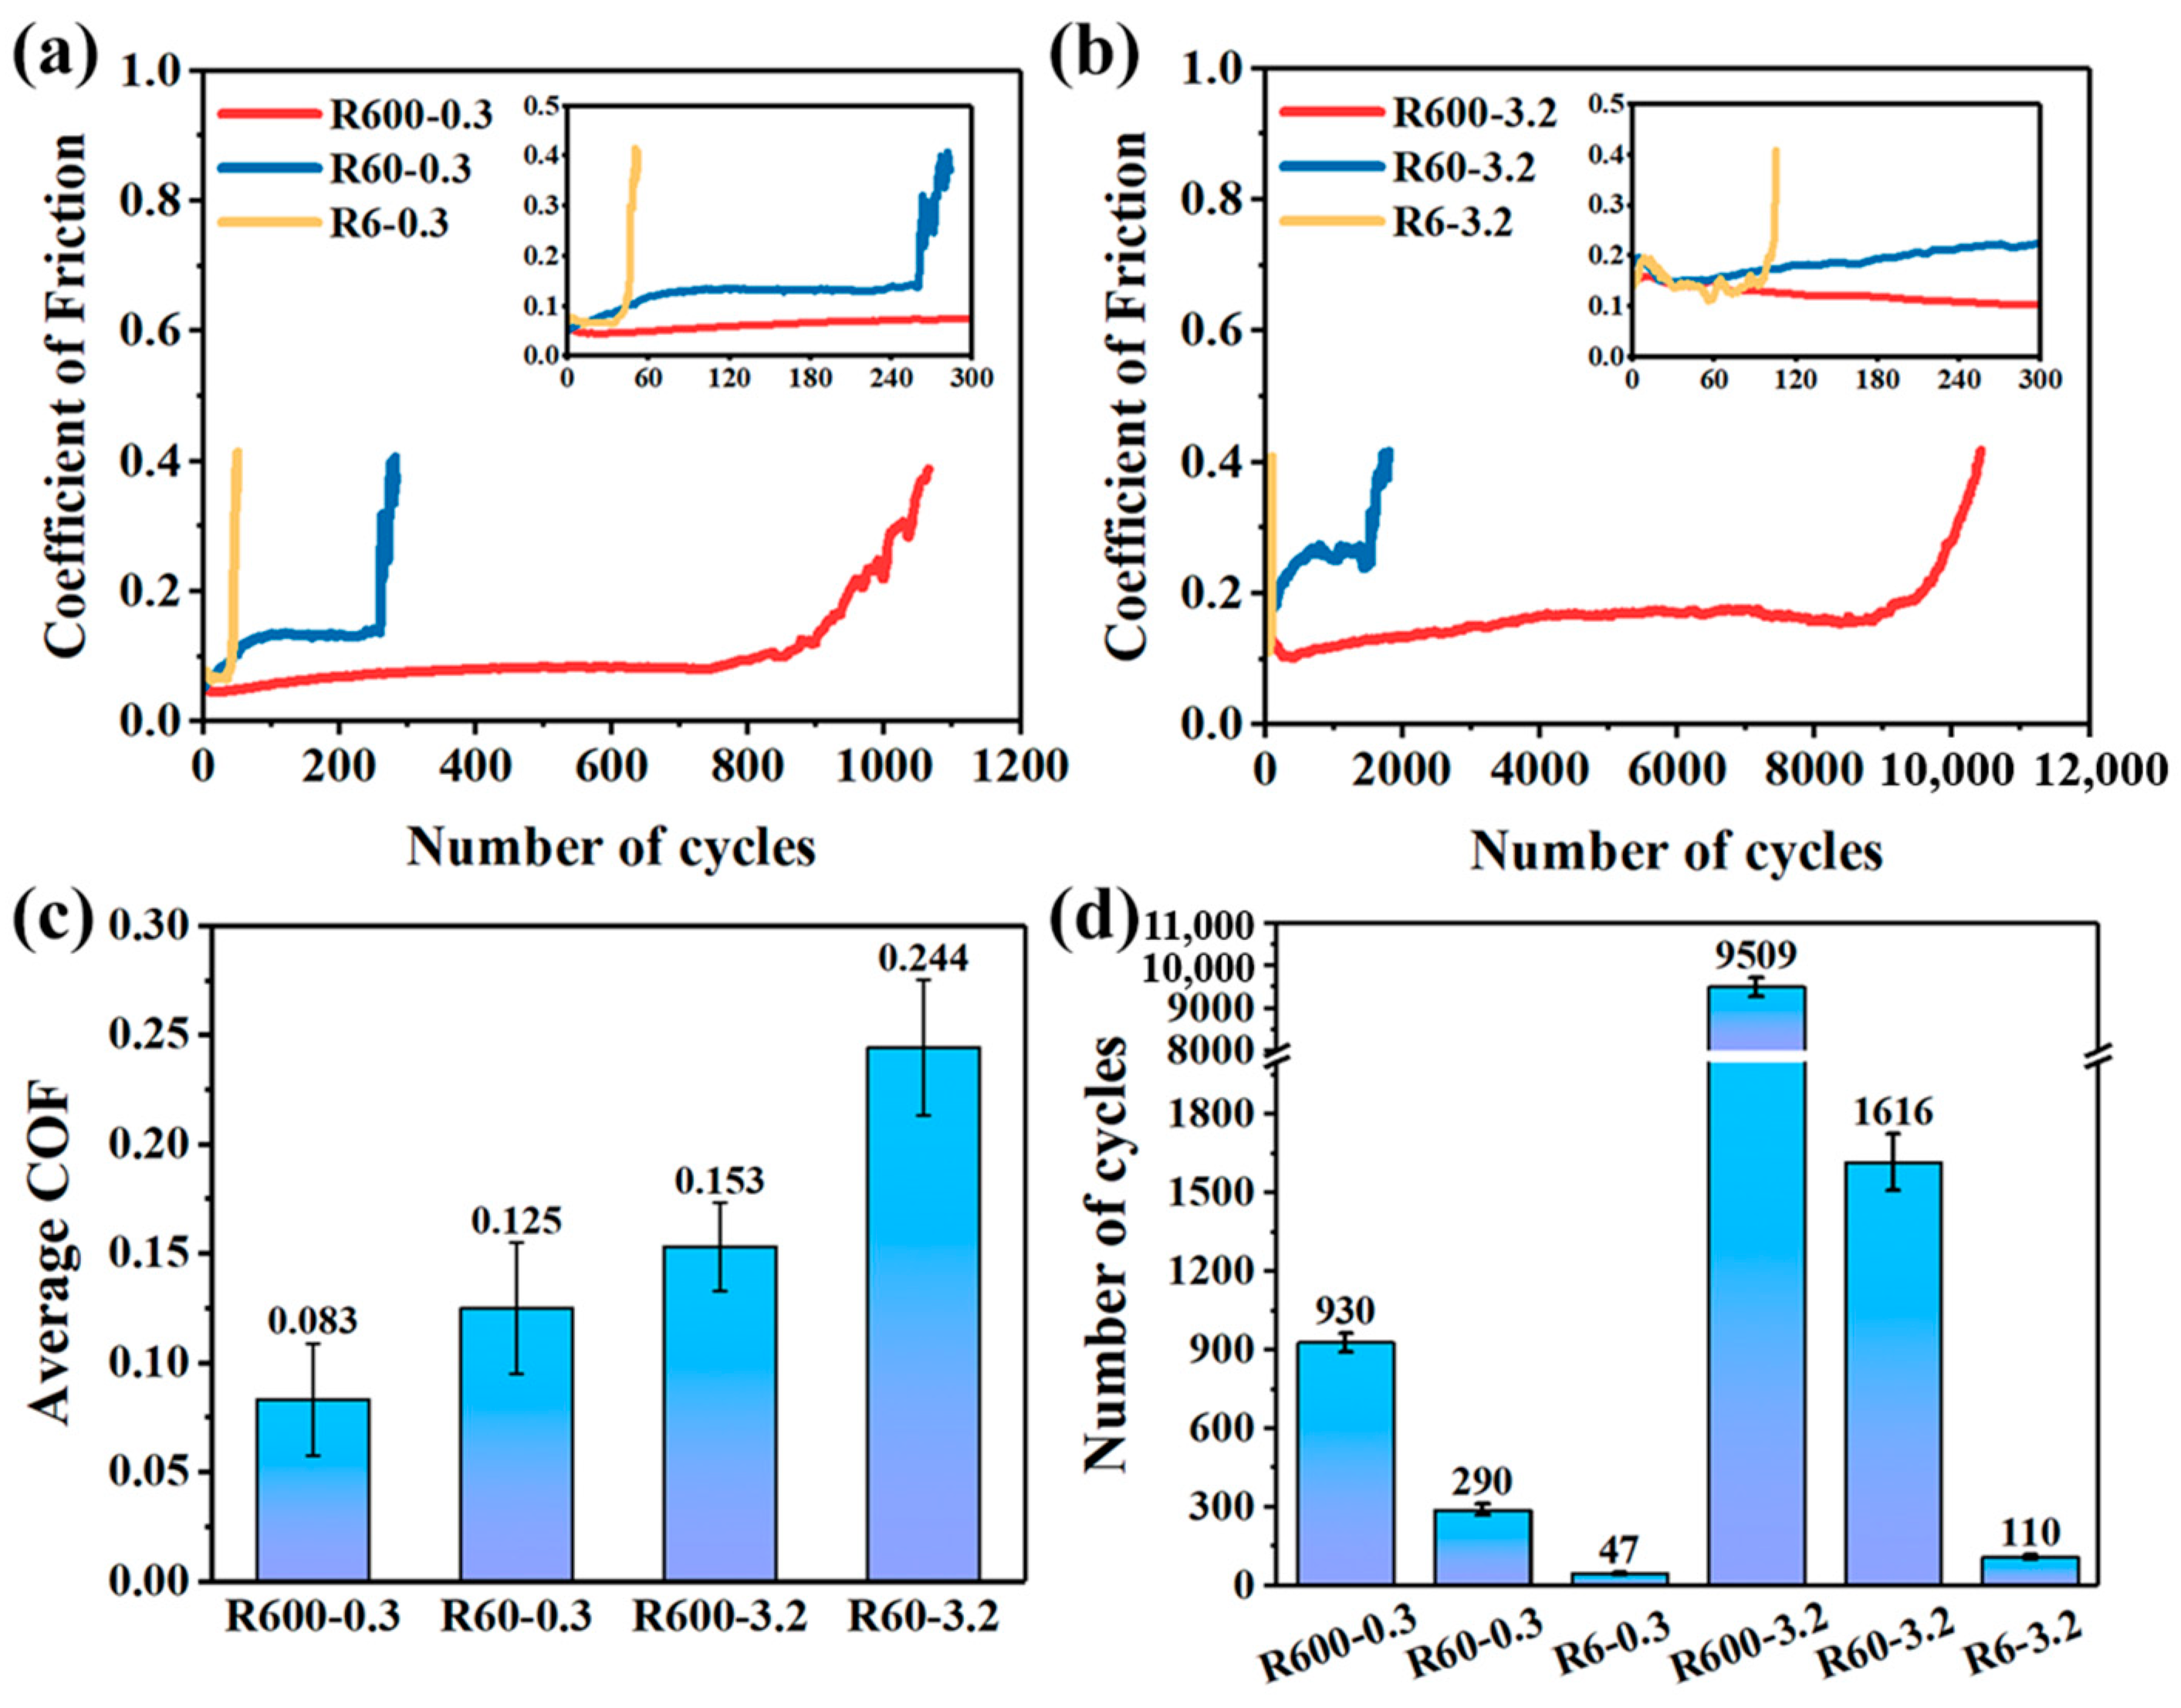
The curves of the COFs of the MoS2 coatings on SS substrates with different surface roughnesses are presented in Figure 11. The sharp increase in the COF indicated the failure of the MoS2 coating, the sliding time at which was considered as the lifetime of the coating. It can be found that the initial COFs are all below 0.1 under the micro-scale contact condition (Figure 11a). After that, for R6-0.3, the COF of the MoS2 coating rapidly fails, and the COF for the R60-0.3 gradually increases, while the R600-0.3 has a smooth and low COF of 0.083 in the stable sliding stage (Figure 11c). At micro-contact conditions, the lifetimes of R60-0.3 and R6-0.3 are 290 cycles and 47 cycles, respectively. In comparison, the R600-0.3 lubricated by MoS2 coating possesses long-term micro-scale lubrication of 930 cycles that is ~19.8 and 3.2 times longer than those of R6-0.3 and R60-0.3, respectively (Figure 11a,d). At the macro-scale contact condition, the COFs of the R6-3.2, R60-3.2, and R600-3.2 substrates coated by MoS2 are ~0.16 in the initial sliding stage (Figure 11b). At macro-scale contact conditions, the lifetimes of R60-3.2 and R6-3.2 are 1616 cycles and 110 cycles, respectively. R600-3.2 coated by MoS2 with a relatively low COF of 0.153 shows the long-term macro-scale lubrication of 9509 cycles, which is ~86.4 and 5.9 times longer than those of R6-3.2 and R60-3.2, respectively (Figure 11b,d). The low friction for all the samples in the initial stage is attributed to the enriched MoS2 nanosheet lubricant in the contact interface. In comparison, the lubrication of the mirror-finished SS substrates without grooves and bulges failed sharply, even though they were coated by MoS2 nanosheets. The synergistic effect of solid lubricants and a textured surface can effectively improve the lifetime of lubricants [44]. The high wear resistance and low friction of the MoS2 coating could be enabled by rationally tailoring the surface roughness of the substrate [20,45,46]. The R600 substrate with the roughest surface is critical for better lubrication performance under either micro- or macro-scale contact conditions.
Overall, the precisely fabricated grooves and bulges of the rough surface play a vital role in the anti-wear performance of the MoS2 lubricant coated on its surface. As simulated in Section 3.1, the rough surface benefits from reducing the actual contact area and enhancing the tangential stiffness at the interface between the SS substrate and counterpart. Low friction can be achieved by combining the mitigation of adhesive wear by the MoS2 nanosheets with the reduced interface contact area. Furthermore, it can be predicted that, assisted by the significant lowering of the tangential deformation of the rough surface along the siding direction, the MoS2 nanosheets would not be easily removed during sliding, resulting in extending the low friction life. However, some previous studies have revealed that the deeper texture of the structure is not conducive to lubricant release in certain situations, resulting in poor lubrication lifetime [27,28]. Therefore, it is necessary to further explore the mechanism of long-term lubrication. To further understand the improved performance of the MoS2 coating on surfaces with different roughnesses, the topographical and chemical composition of the wear tracks on the coatings were characterized by SEM, EDS, 3D white light interferometry microscope, and Raman spectroscopy.

3.4. Compositional and Morphological Analysis of the Wear Tracks

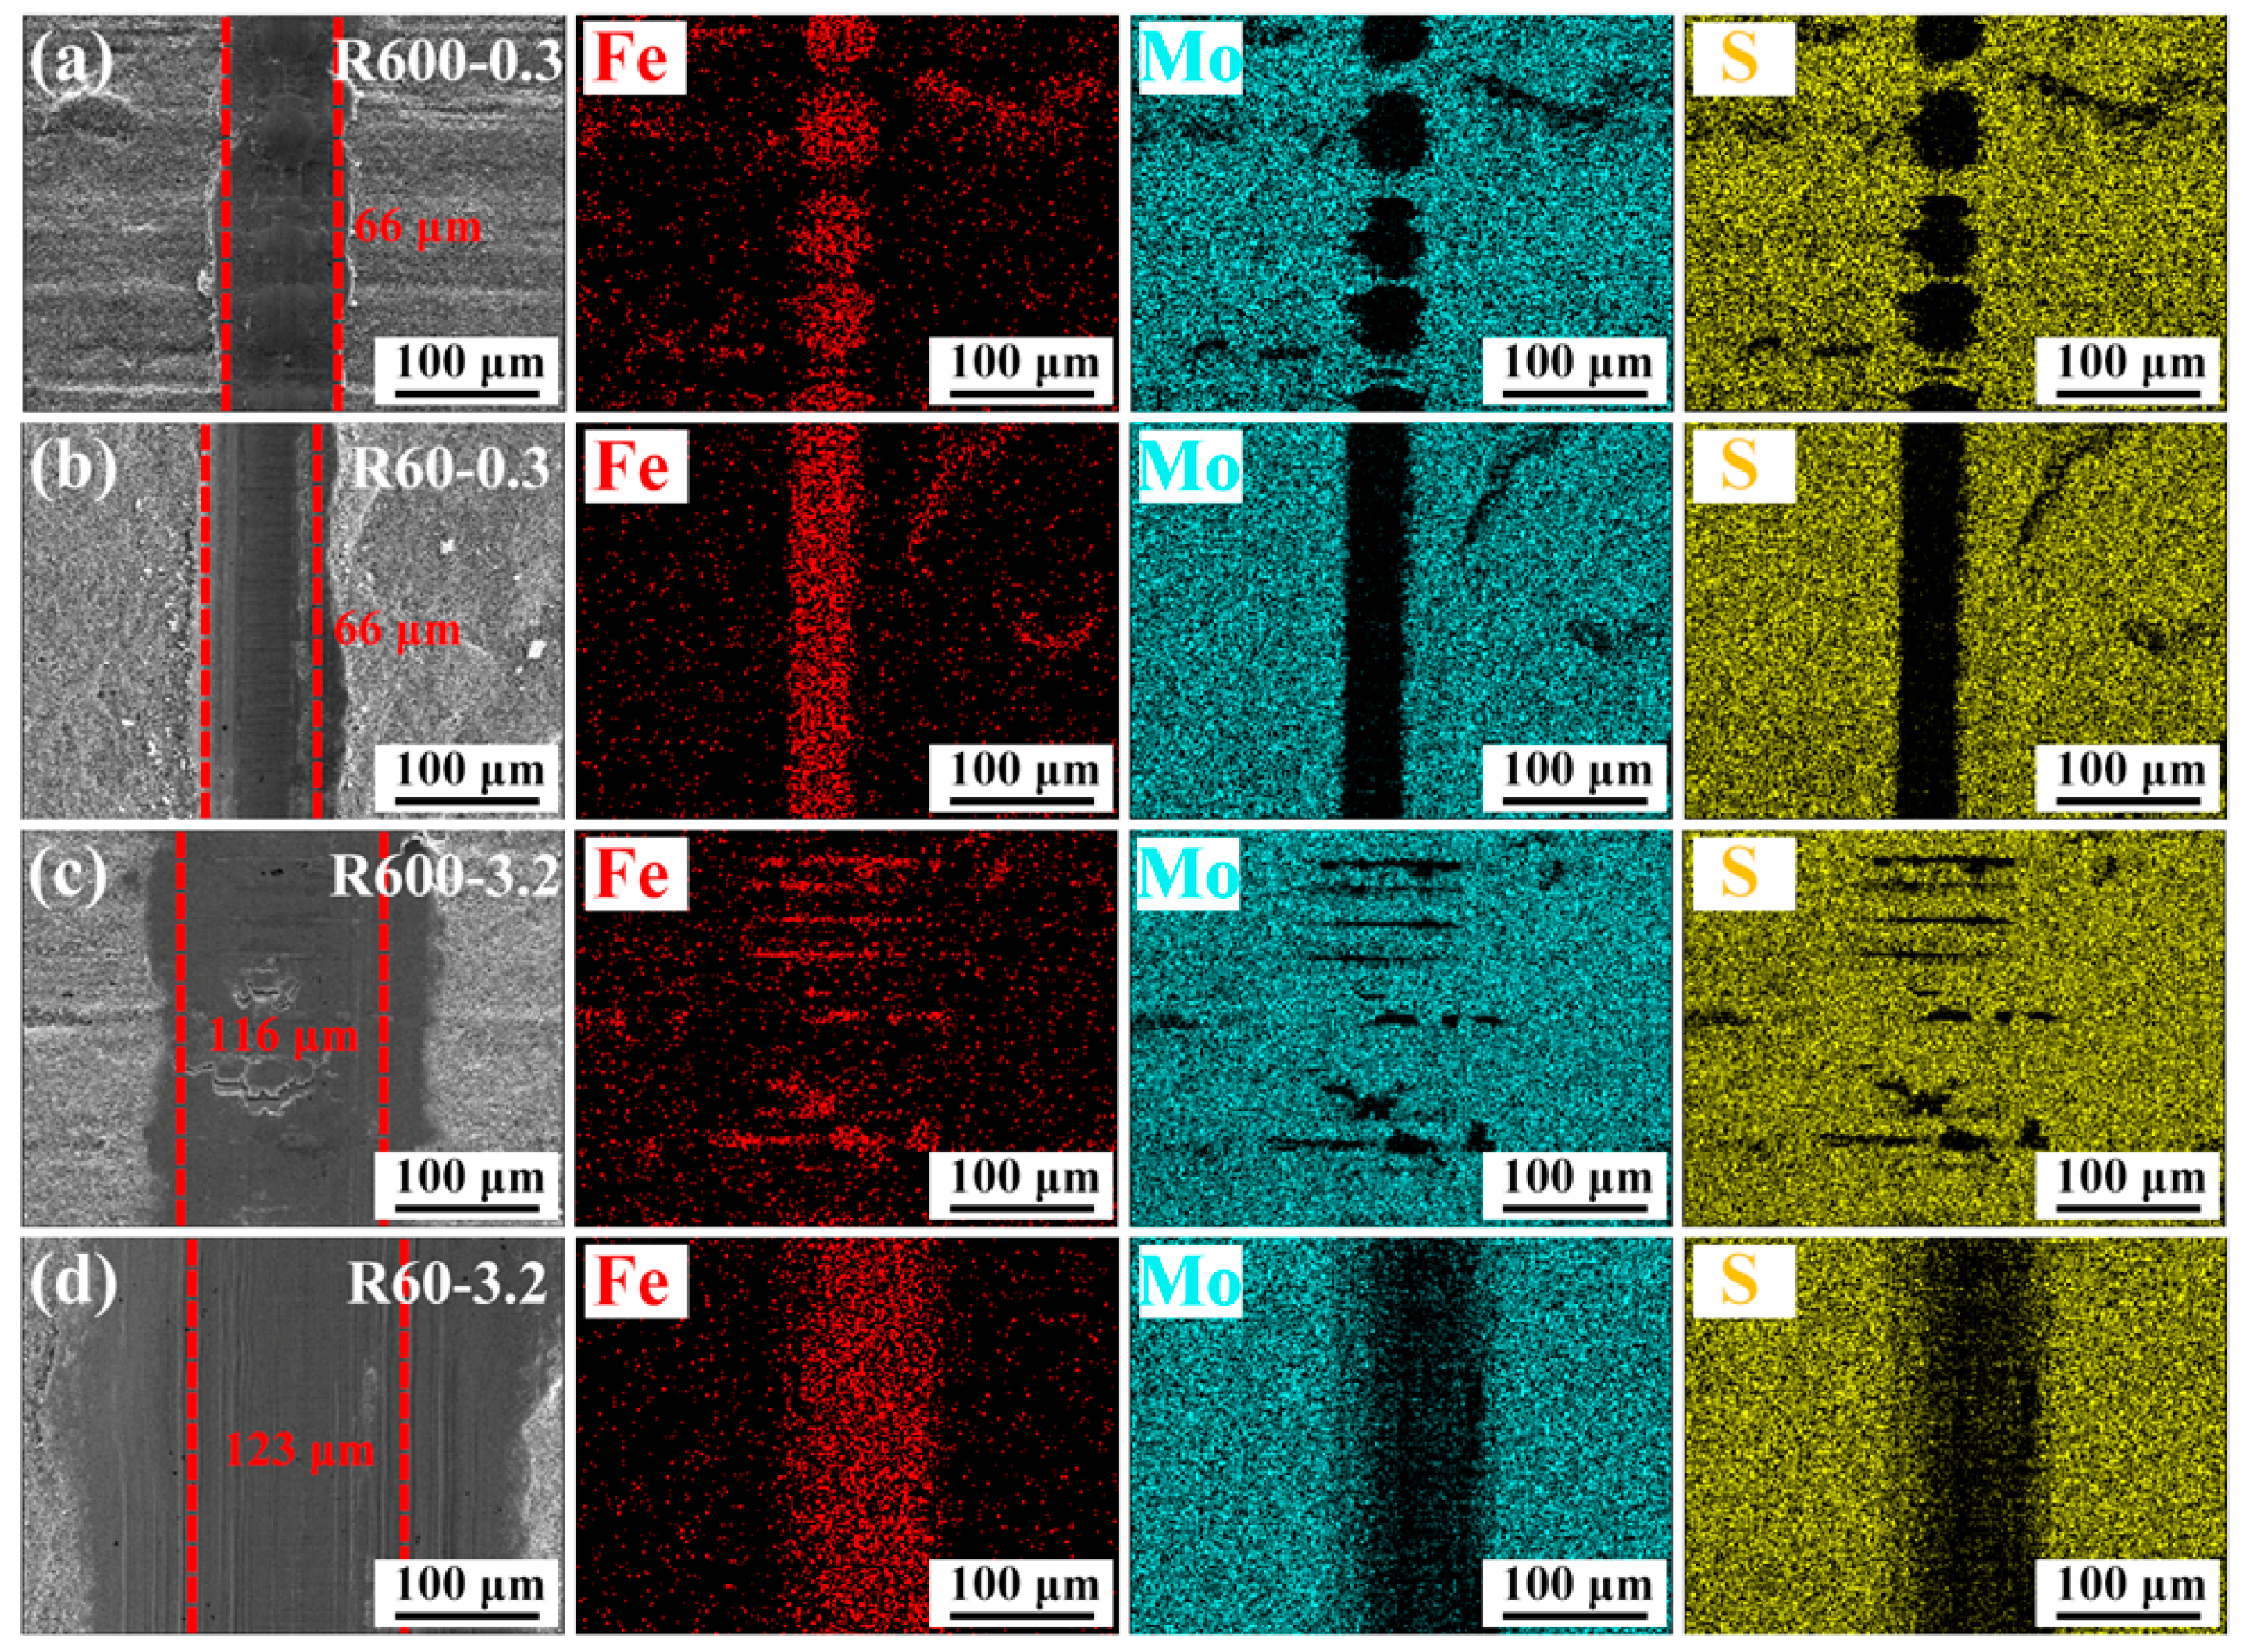
The SEM micrographs and EDS mapping images of wear tracks on the MoS2 coatings after 200 cycles of the tribotest are shown in Figure 12. Due to the small contact area of R600-0.3 and R60-0.3, the width (~66 μm) of the wear track is significantly smaller than those of the R600-3.2 (~116 μm) and R60-3.2 (~123 μm) after sliding for 200 cycles under the same test conditions. In the wear track of R600-0.3, the EDS maps of elements Fe, Mo, and S are all patch-like. In contrast to the rough surface of the SS substrate, the EDS map of the element Fe in the wear track of R60-0.3 is continuous along the sliding direction, and its signal is significantly more intense than those of Mo and S. It indicates that the coated porous MoS2 nanosheets on the relatively low-roughness SS substrate surface were easily removed along the sliding direction. The substrate with a rougher surface also preserves more lubricants in the grooves as illustrated in the wear track, which could enable long-term lubrication performance. Compared with the wear track of R600-0.3, the area of residual MoS2 in the wear track of R600-3.2 is much larger, and little SS substrate is exposed, which can allow long-term lubricating behaviors. Generally, as the size of the counterpart ball was switched from micro-scale to macro-scale to slide against a substrate with a rough surface (Figure 6b,c), the tangential stiffness and tangential deformation along the sliding direction declined significantly, even if the actual contact area was enlarged. It can be stated that the low deformation degree of the rough surface also plays a critical role in extending the wear life of the substrate coated by MoS2 nanosheets.
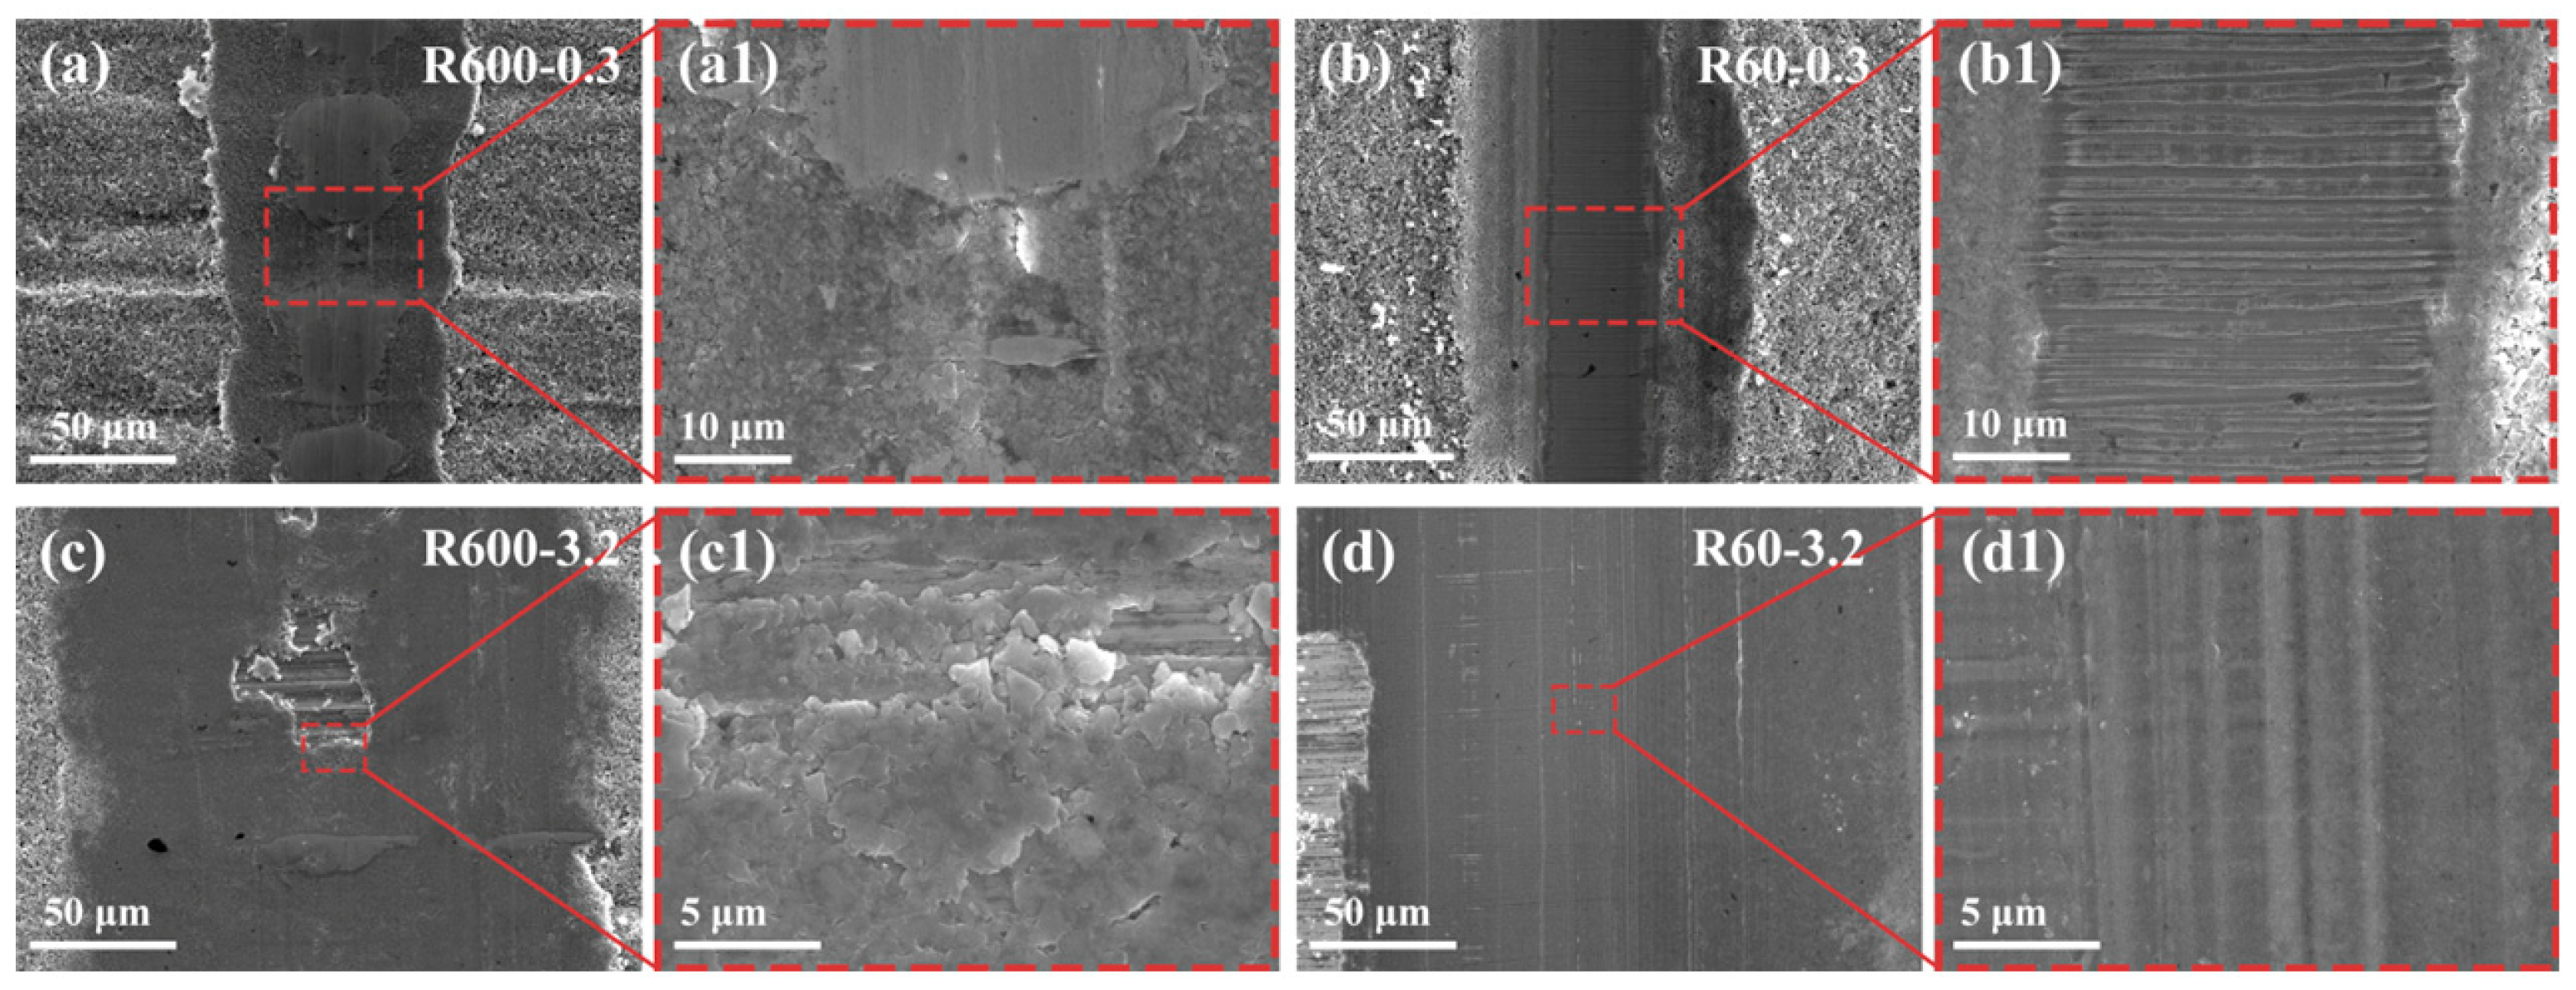
To characterize the distribution of residual MoS2, the wear tracks were further analyzed by high-resolution SEM and Raman spectroscopy. Figure 13 presents the high-resolution SEM images of the wear tracks of R600-0.3, R60-0.3, R600-3.2, and R60-3.2 after sliding 200 cycles. For the R600-0.3 (Figure 13a,a1) and R600-3.2 (Figure 13c,c1) samples, the wear tracks appear to be relatively rough and partly coated by the compact patch-like MoS2. In comparison, the wear tracks of R60-0.3 (Figure 13b,b1) and R60-3.2 (Figure 13d,d1) are characterized by a smooth and burnished morphology, demonstrating that the wear track was polished by the rubbing contact as most lubricants were absent. On the rough surface, the porous MoS2 nanosheets were rearranged into compact patch-like layers by the rubbing contact in the initial running-in stage; these layers are well suited to achieve low friction and low wear.
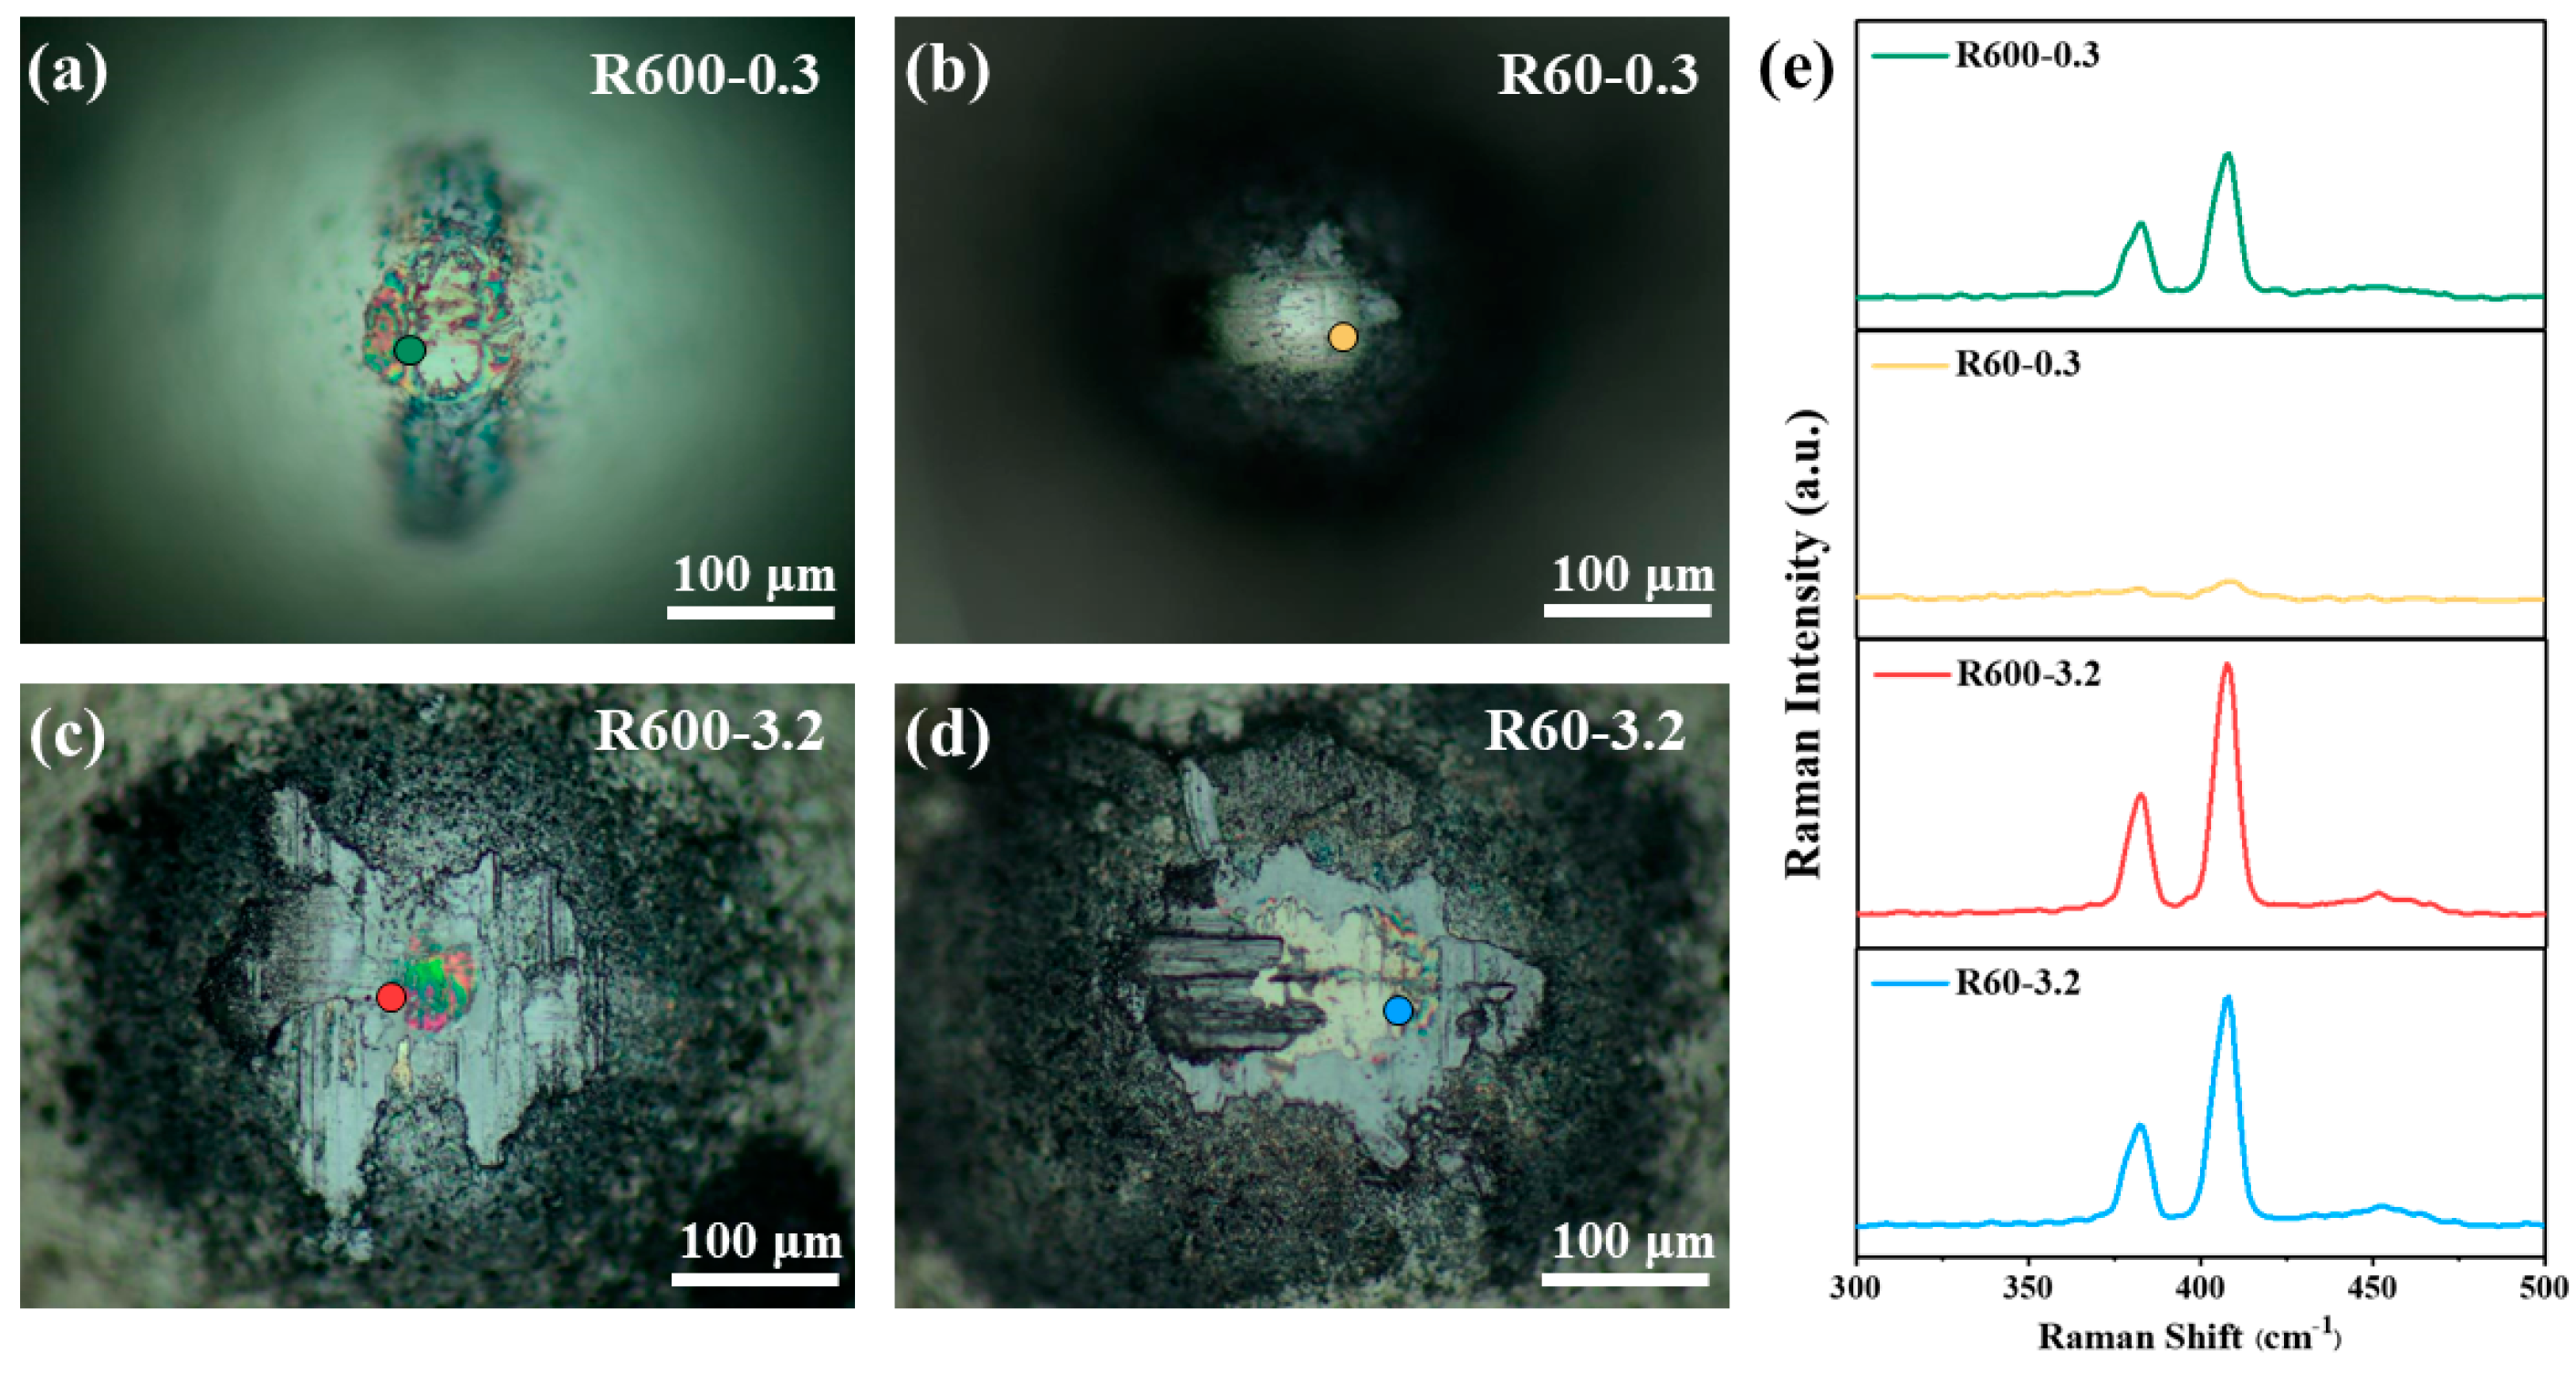
Furthermore, the worn MoS2 lubricant could be readily transferred to the ball surface to form the tribofilm [47]. Optical microscope images and Raman spectra of the counter balls after 200 reciprocating cycles are shown in Figure 14. In addition, it can be seen from the Raman spectra of the ball surface (Figure 14e) that the transfer component was mainly MoS2. The presence of transfer films can clearly be found on the spherical surfaces (Figure 14a,c,d). However, only the bare smooth metal surface was shown in Figure 14b, whilst the Raman signal intensity of MoS2 on its surface was also weak. This is due to the 200-cycle duration being close to the lifetime of the coating (290 cycles) tested on R60-0.3 sample. At this stage, the lubricant at the contact interface was mostly depleted.
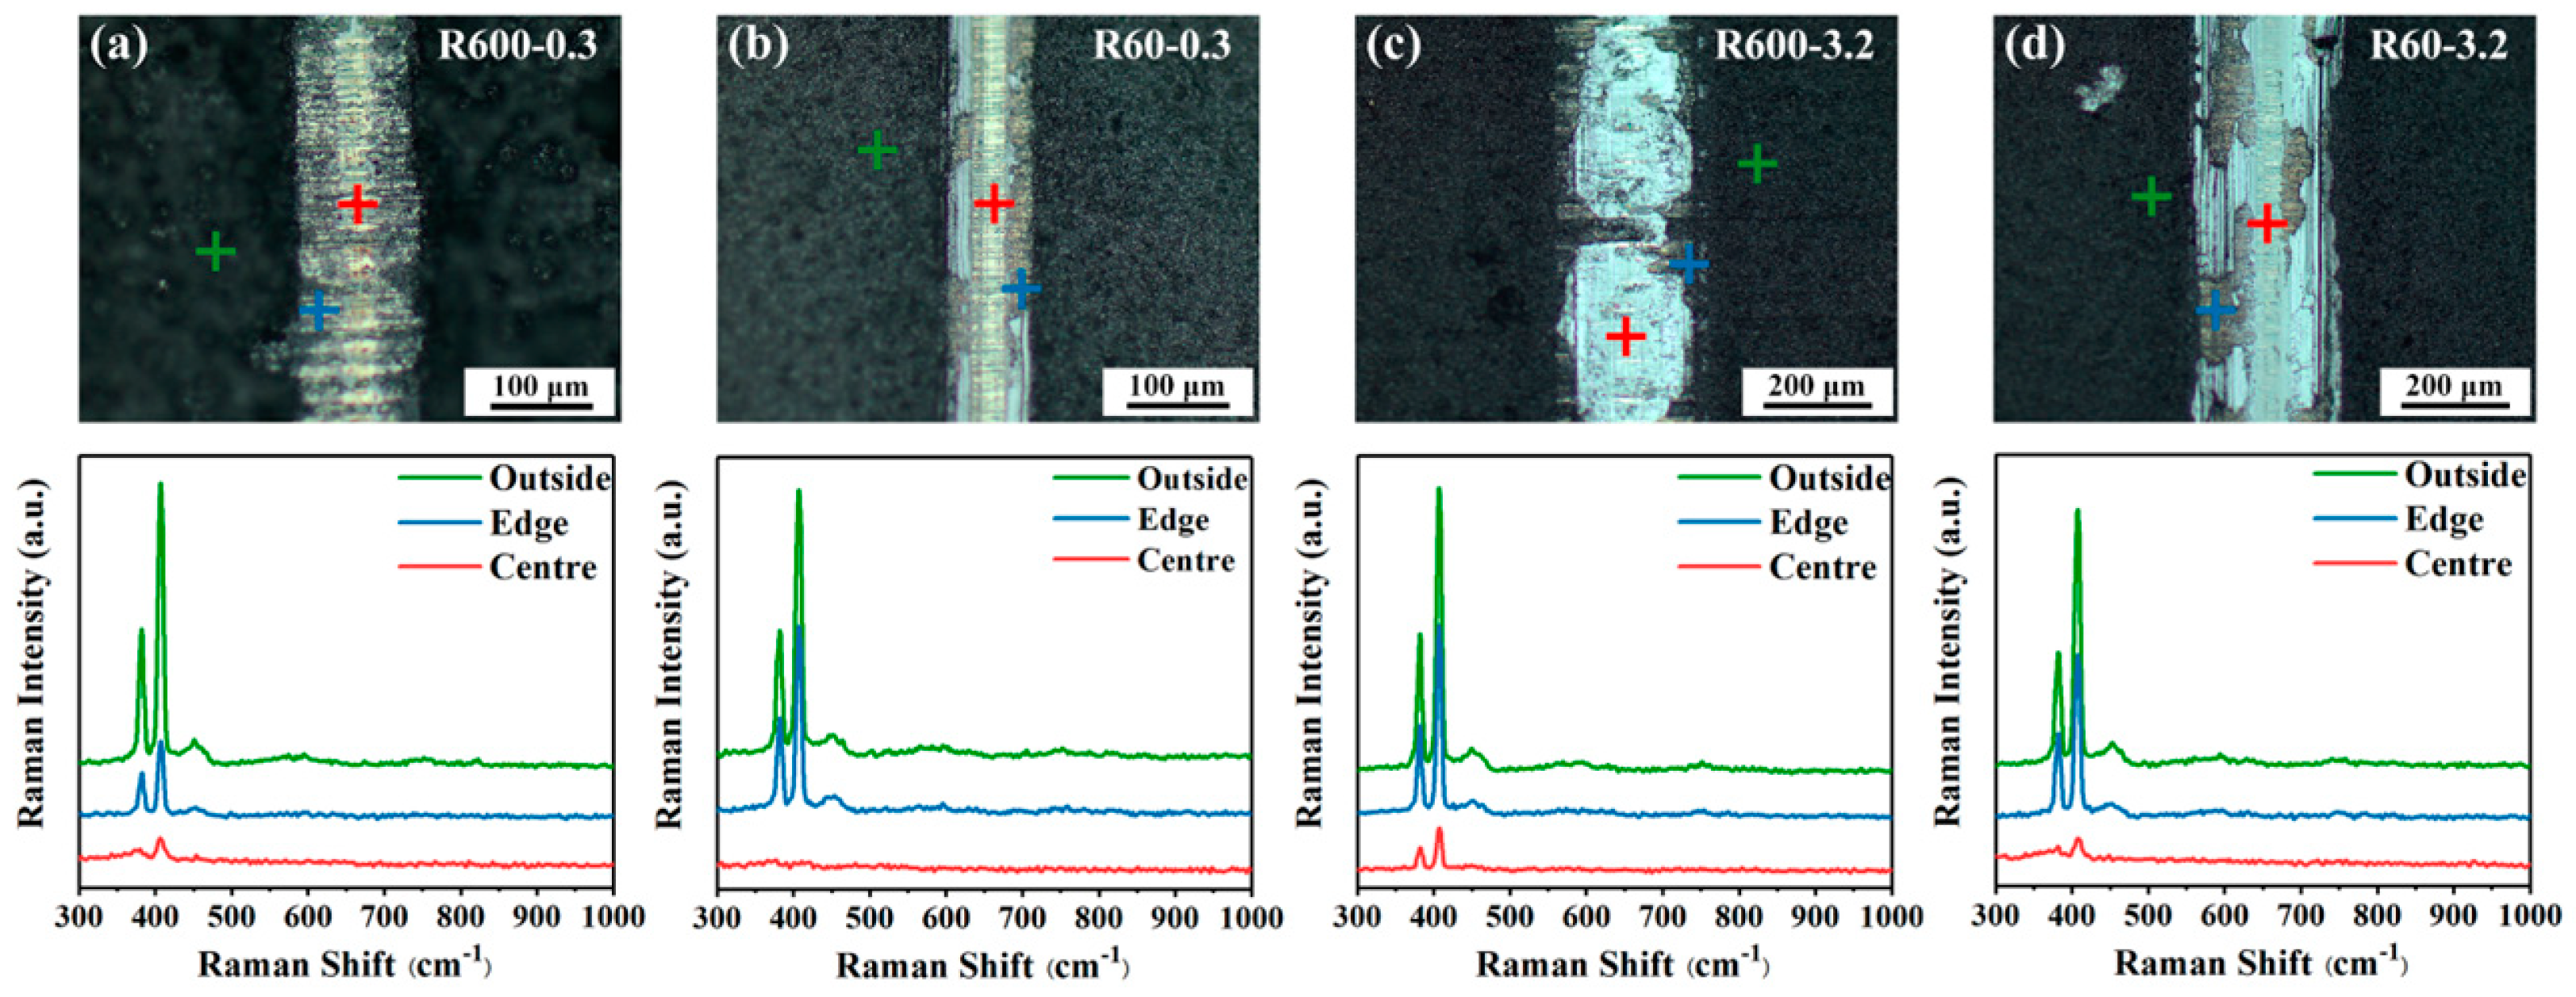
The optical microscope images of wear tracks and the Raman spectra acquired on typically selected positions after sliding for 200 cycles are illustrated in Figure 15. All the wear tracks in the optical images were characterized by a bright and straight morphology. Based on the morphology observations, the presented surfaces can be categorized into three regions: the original coating, the wear track, and the edge between the two. The Raman signals were collected from the three typical zones to evaluate the chemical composition and structure of the lubricants after the 200-cycle sliding process. As illustrated by the Raman spectra in green curves, all the as-deposited coatings on the different surfaces are dominated by MoS2 without any fraction of the oxidation product MoO3, even after having been exposed to air. However, the intensity of MoS2 Raman signals (red curves) at the center of the wear track is much weaker as compared with that of the track edge (blue curves) and the original coating (green curve). It indicated that the wear tracks are dominated by MoS2, and there was no oxidation during the sliding process. Wear of the MoS2 coating can mainly be attributed to removal by the counterpart, rather than tribochemical decomposition. Furthermore, the MoS2 signal intensities in the Raman spectra on R600 substrates (R600-0.3 and R600-3.2) are stronger than those on R60 (R60-0.3 and R60-3.2). Noticeably, the tailored surface topography plays a critical role in the wear resistance and friction reduction of the porous lubricant coatings.
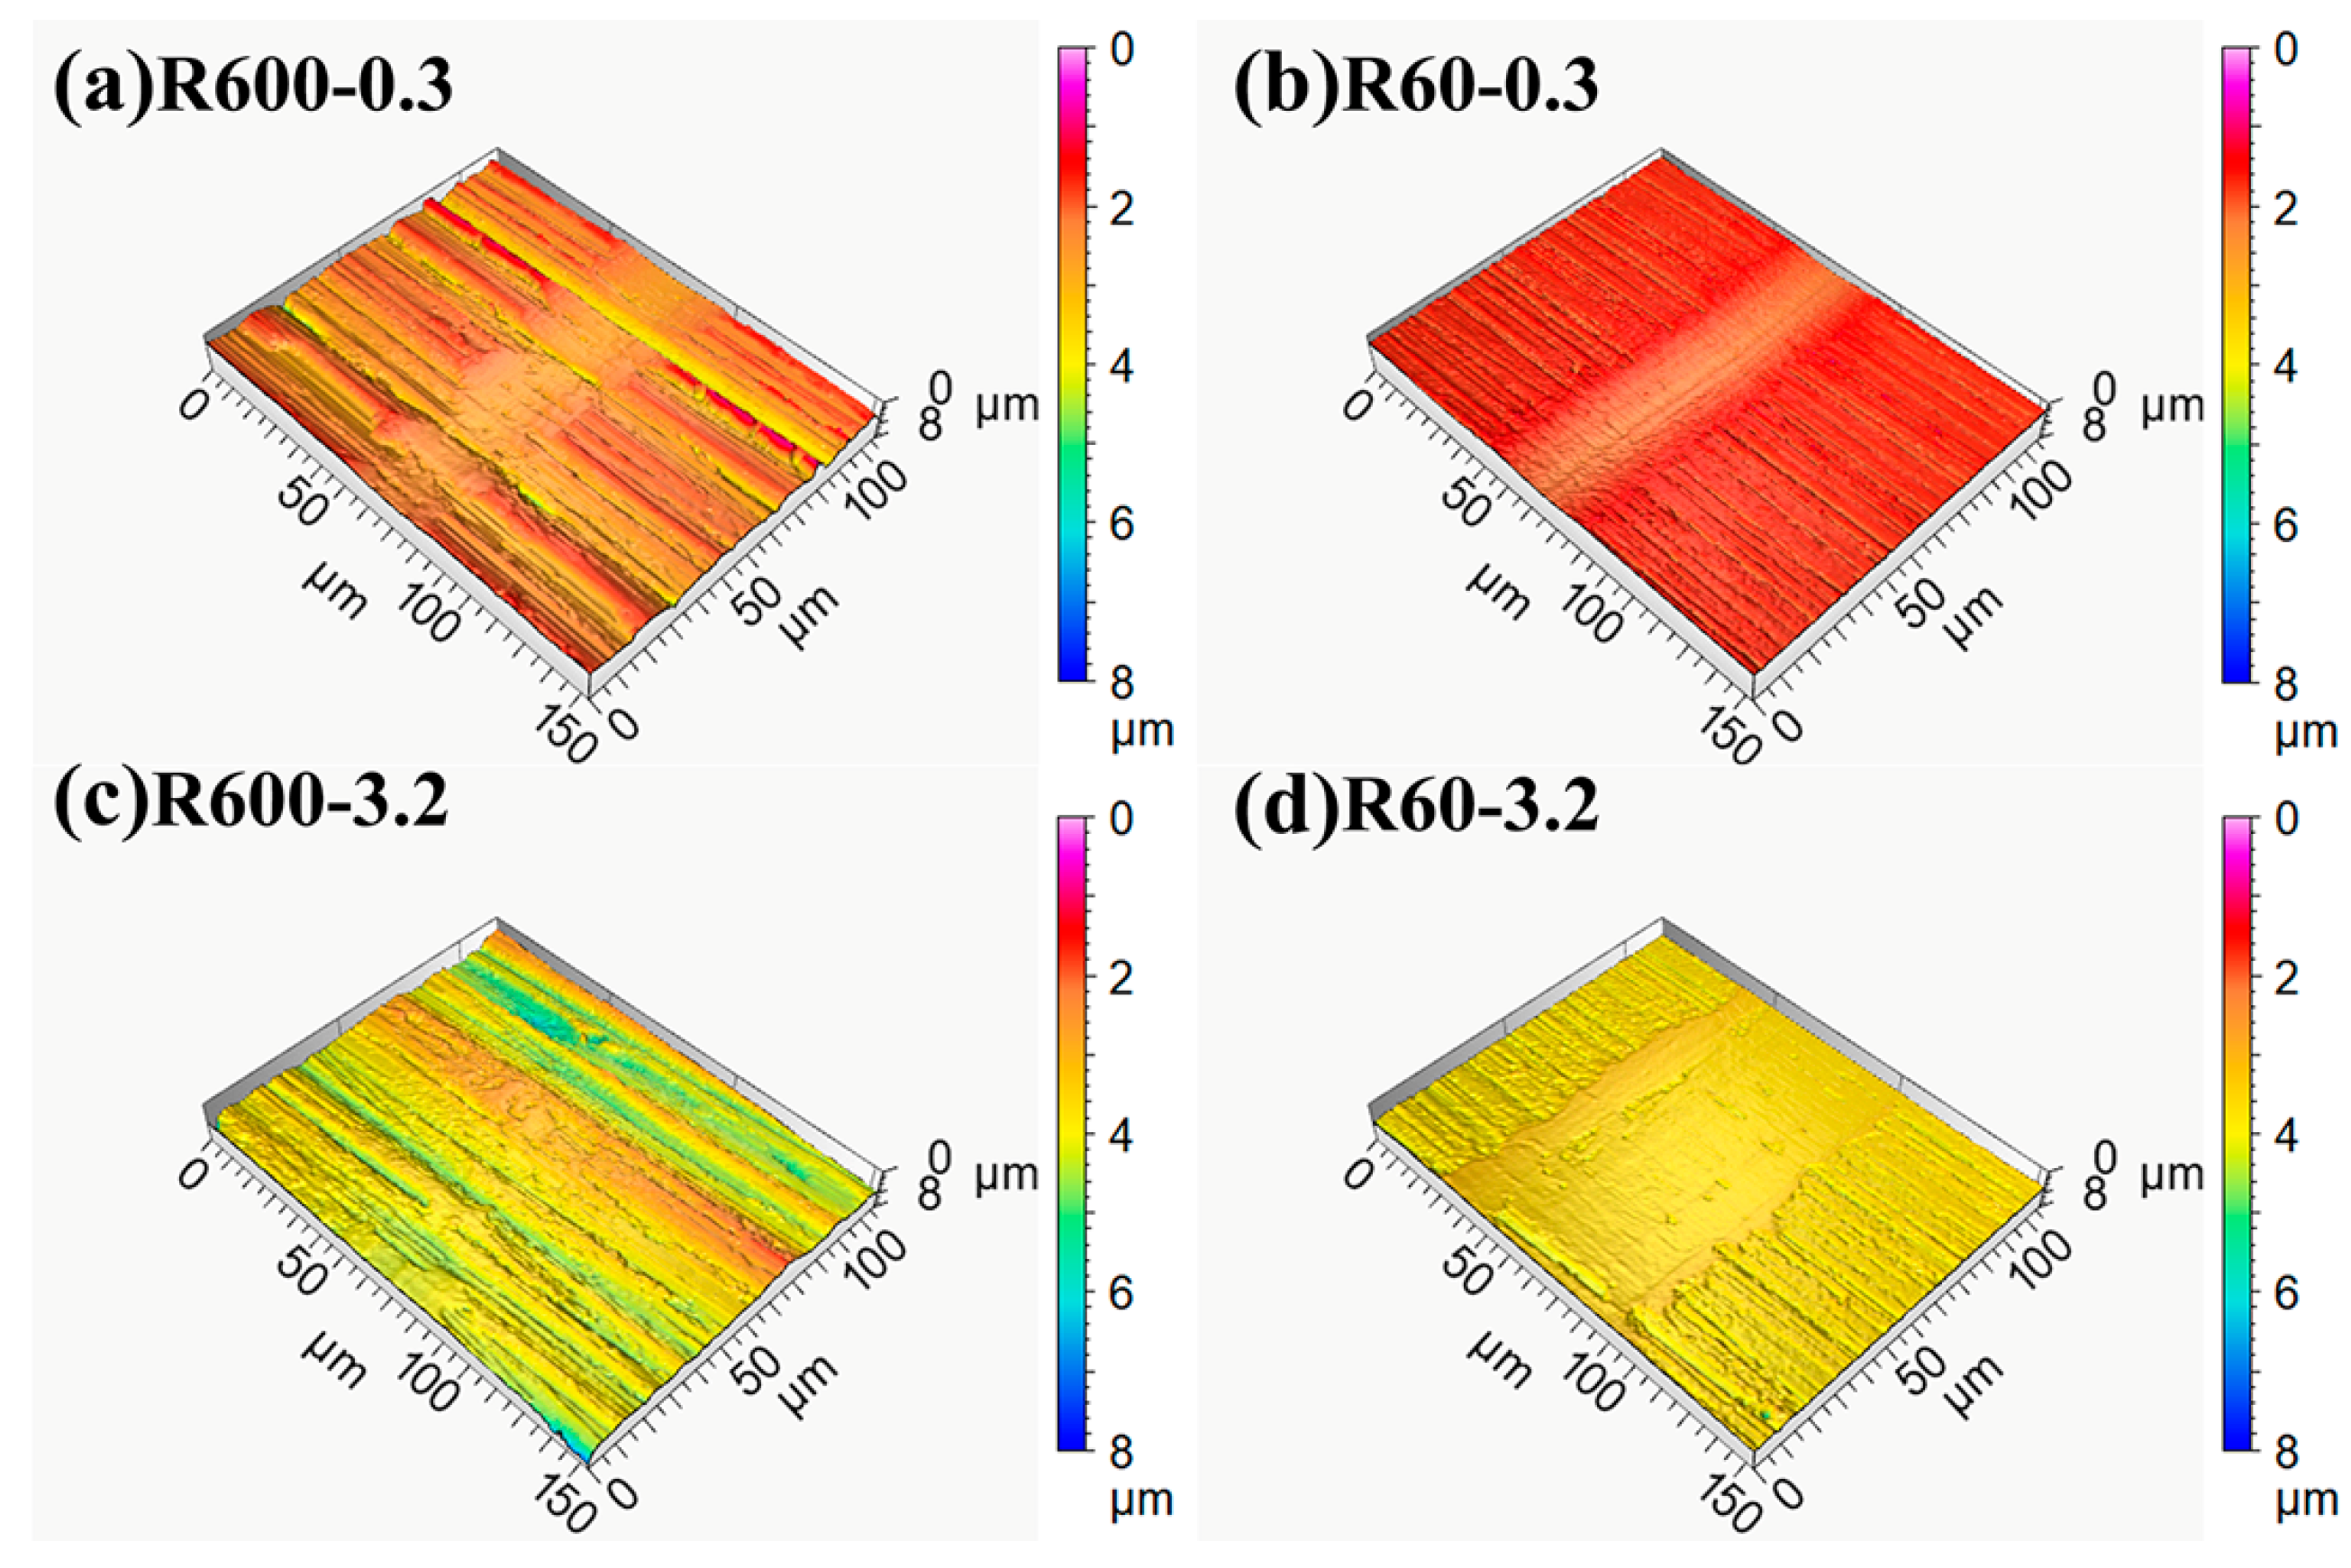
All the MoS2 coatings and wear debris were cleaned after the 200-cycle sliding tribotest to further elucidate the wear tracks on the SS substrates with different roughnesses. The 3D topographies of the wear track on SS substrates are presented in Figure 16. As the 0.3 mm ball slid against the SS substrate coated by MoS2, the wear track depth of the R600-0.3 sample is lower than that of R60-0.3, as shown in Figure 16a,b. In comparison, under the macro-scale contact condition, the distinction of the wear degree of surfaces with different roughnesses becomes much more significant (Figure 16c,d). It is almost impossible to measure the R600-3.2 wear track after 200 cycles of sliding due to the slight wear. This is consistent with the simulation results in Figure 6, which indicate that the rough surface topography possesses better resistance against deformation along the rubbing direction to minimize wear. Generally, aided by the massive bulges with high tangential stiffness on the rough surface, the lubricant MoS2 nanosheets can be trapped in the grooves. Driven by friction, the lubricant can be slowly released to the contact area, enabling low friction and high anti-wear resistance.
According to the above analysis and discussion, the reason for the lubrication failure of MoS2 on different substrates was that the MoS2 lubricant was removed and consumed as the reciprocating sliding progressed. The smooth surface with a sharply increasing COF curve (Figure 11) indicates that the MoS2 on the surface was quickly removed, resulting in complete exposure of the substrate. However, the rougher substrate can significantly alleviate this and achieve a long lifetime.
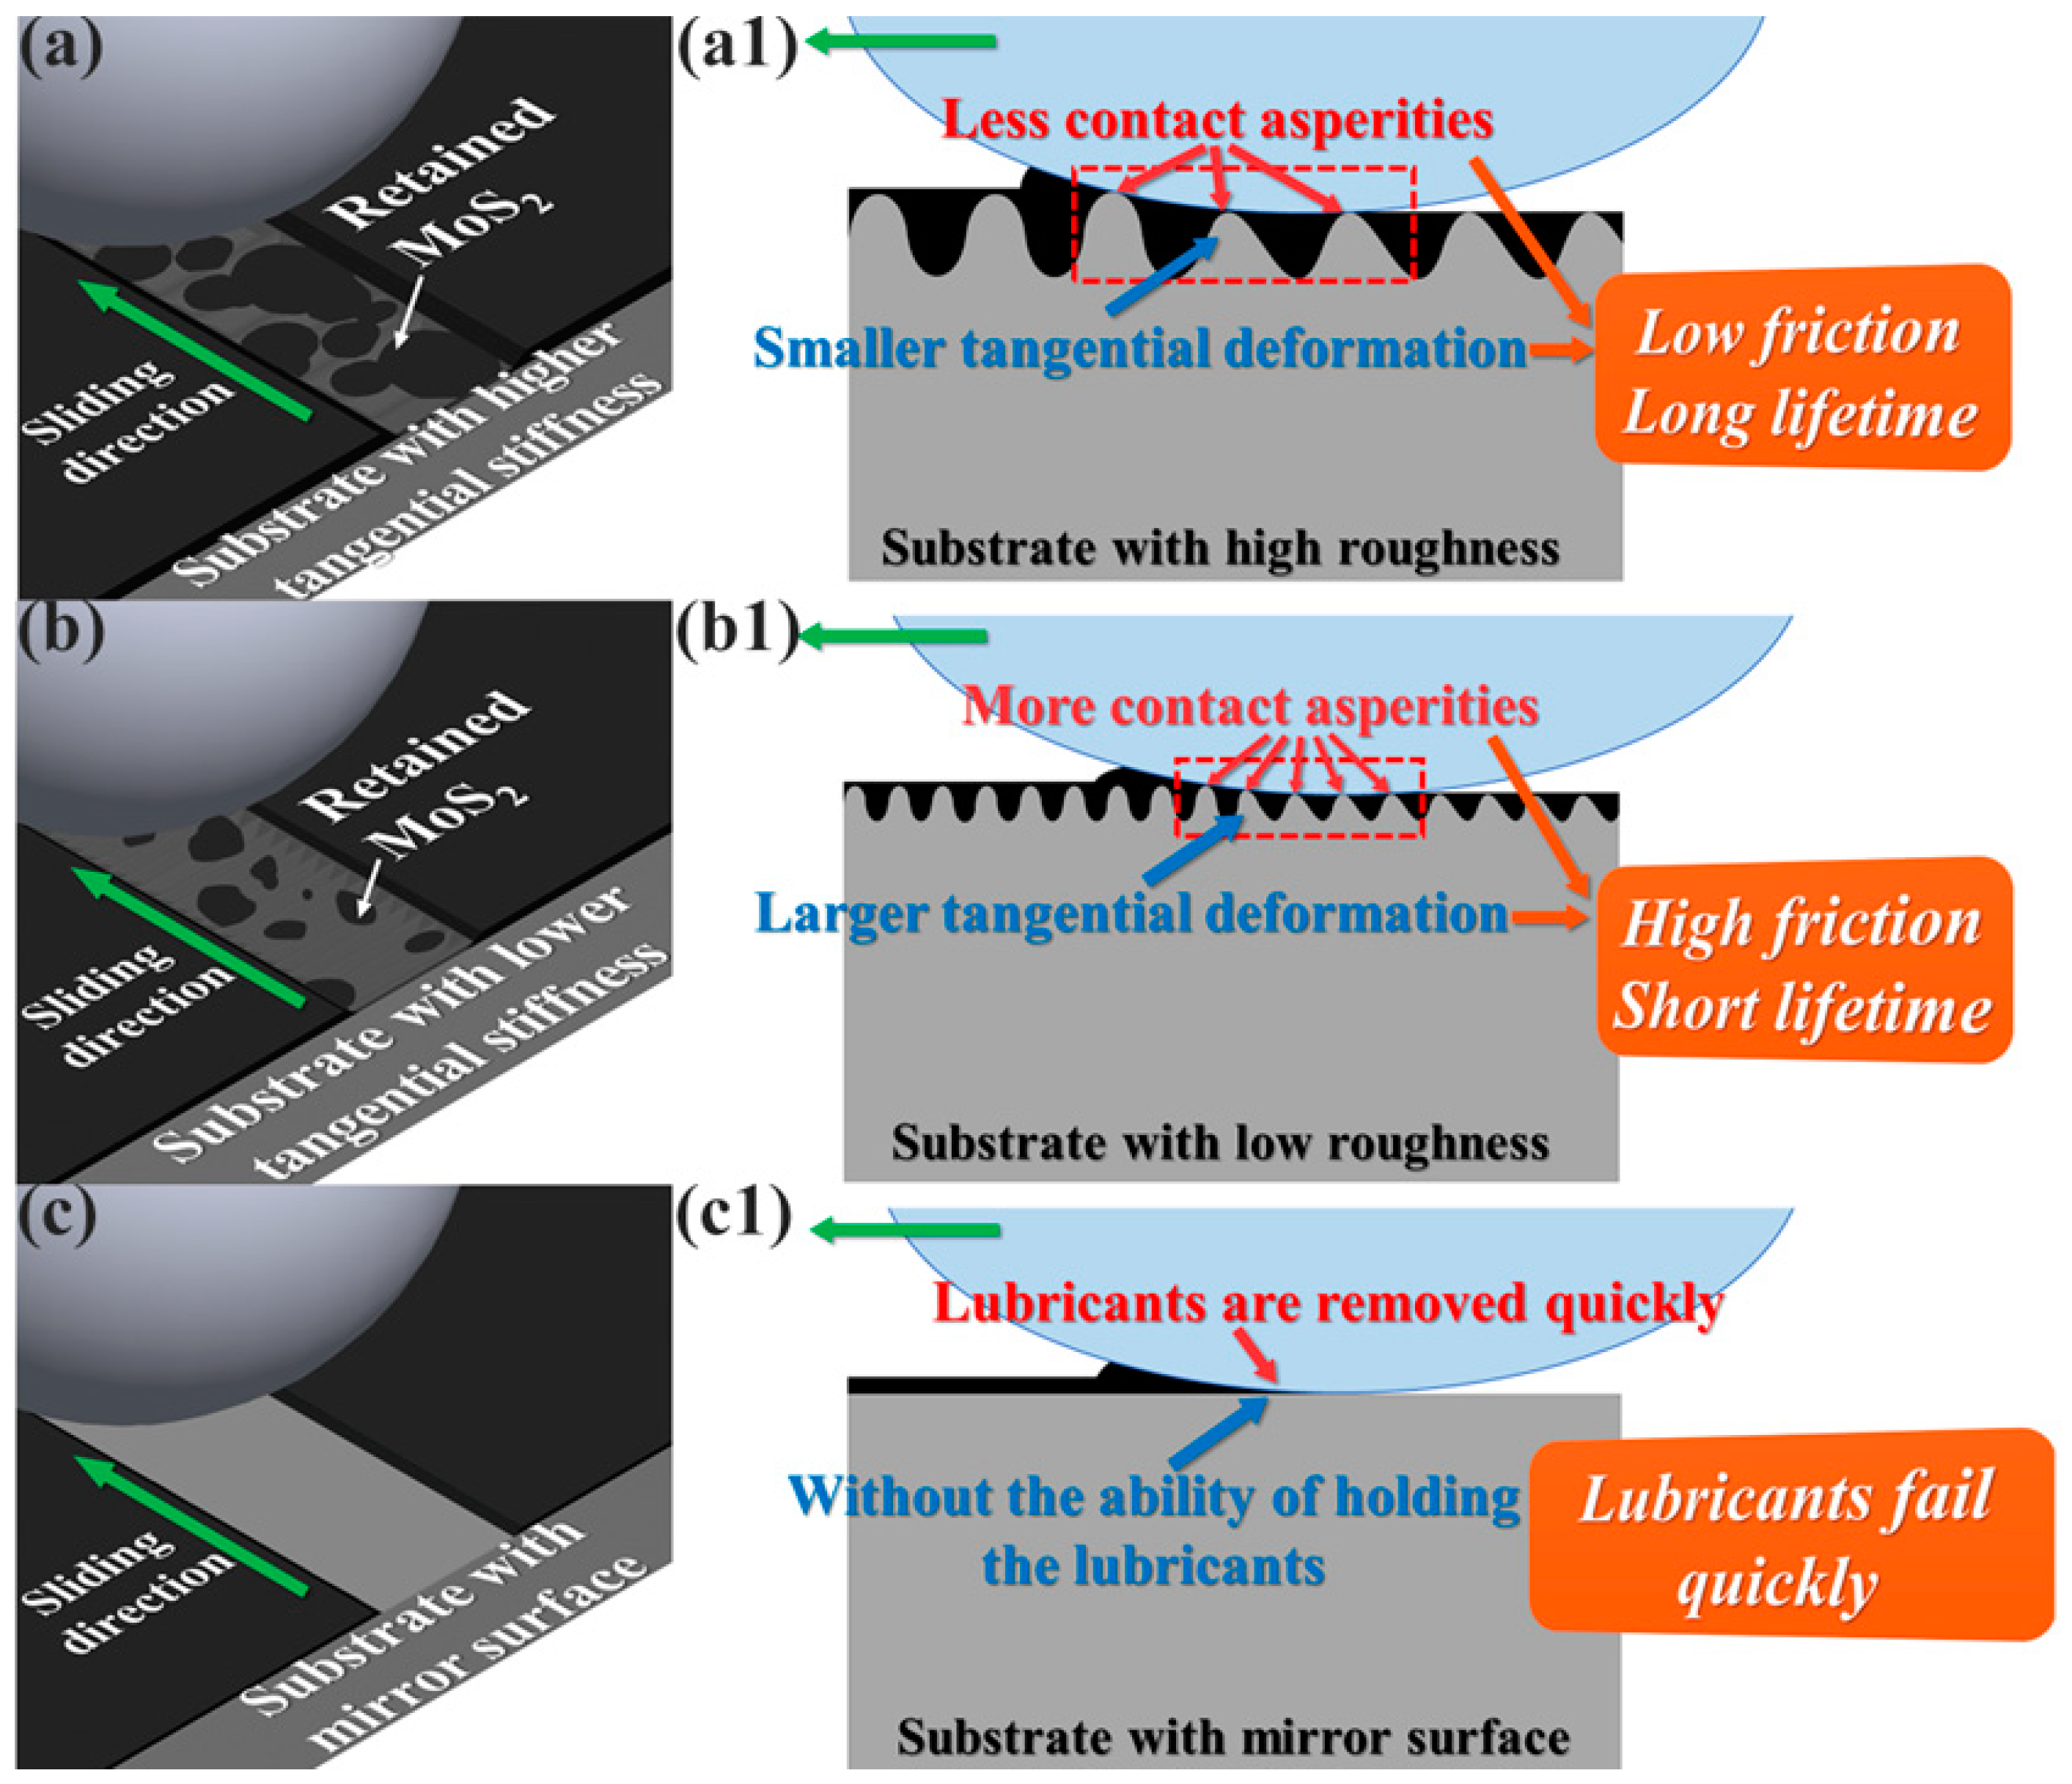
The friction and wear mechanisms of the substrate coated by MoS2 lubricant were well clarified via FEM simulation, actual verification through sliding experiments, and chemical composition and morphology analyses. On the basis of the aforementioned results, the surface roughness of the substrate and the counterpart ball size determines the contact area, tangential stiffness, and the directional deformation of the substrate along the sliding direction. Schematic illustrations of the wear mechanisms for different rough surfaces coated by an MoS2 layer are given in Figure 17. The residual MoS2 nanosheet on the rough surface could rearrange to form compact patch-like layers due to the rubbing action behavior in the initial running-in stage (Figure 17a,b). The rougher substrate surfaces have less actual contact area during sliding, resulting in lower friction. From the analysis in Section 3.3 and Section 3.4, the substrate with rough surface topography has a long lifetime, and the worn surface maintains more original topography with less wear. At the same contact scale, the coarse bulges would not be easily worn due to their relatively high tangential stiffness and small tangential deformation. The numerical comparisons of tangential stiffness and surface displacement presented in Figure 6 can confirm the occurrence of this phenomenon. The reason for the rapid failure of the smooth surface is that the smooth surface has no ability to preserve the MoS2 lubricant, resulting in complete removal of the MoS2 coating. The long-term lubrication performance of the MoS2 coating can be enabled as the substrate surface roughness was rationally tailored, and the continuous lubricant layer was constructed on the wear track.

4. Conclusions

In the work, FEM simulations were first carried out to evaluate the effect of substrate roughness on sliding behavior at the micro- and macro-scale. The high surface roughness of the substrate led to a small contact area between the counterpart and the substrate. Furthermore, for surfaces with the same roughness, the actual contact area was smaller in the micro-scale contact, with a counterpart ball having a diameter of 0.3 mm, than in the macro-scale contact, with a counterpart ball having a diameter of 3.2 mm. In this regard, this was suited for low friction behavior due to its relieving of the sticking at the interface. The simulations revealed that the rough surface possessed high tangential stiffness at both the micro- and macro-scale conditions, which facilitated resistance to the deformation along the sliding direction. The friction and wear behavior of the SS substrates coated by the MoS2 nanosheets were assessed based on the results of the chemical composition and morphology of the wear tracks. The experiment’s findings demonstrated that the predicted tribological performances were proven in practice. On the rough surface, the residual MoS2 nanosheet in the initial running-in stage could be rearranged to form compact patch-like layers by the rubbing behavior that was suited for low friction performance. Eventually, the porous MoS2 coating on the SS substrate with a surface roughness of Ra 600 nm had a long wear life under micro-scale contact conditions (ball with diameter of 0.3 mm), which was ~19.8 and 3.2 times longer than those of the MoS2 coatings deposited on substrates with roughnesses of Ra 6 nm and Ra 60 nm, respectively. The effect of surface roughness on the tribological performance became much more remarkable under the macro-scale contact condition (ball with diameter of 3.2 mm). The wear life of the coating on the roughest substrate of Ra 600 nm was ~86.4 and ~5.9 times longer than those of the coatings on the mirror-like surface of Ra 6 nm and on the low-roughness surface of Ra 60 nm, respectively. Such a unique design can be easily carried out to lubricate, robustly, the moving components in real engineering applications.

Author Contributions

Conceptualization and methodology, K.L., S.X., and W.L.; formal analysis and investigation, J.Z., Q.C., and S.X.; software, Y.N. and Y.L.; validation, C.W.; writing—original draft preparation, C.W.; writing—review and editing, K.L., Q.C., X.G., and S.X.; All authors have read and agreed to the published version of the manuscript.

Funding

This research was financially supported by China National Natural Science Foundation (Grants No. 52075521, 51975555 and U2030201), the fund of LICP Cooperation Foundation for Young Scholars (Grant No. HZJJ22-03), Natural Science Foundation of Shandong Province (ZR2022ME200), and the fund of Yantai Zhongke Research Institute of Advanced Materials and Green Chemical Engineering (Grant No. AMGCE010).

Data Availability Statement

Not applicable.

Conflicts of Interest

The authors declare no conflict of interest.

References

  1. Van Kessel, P.; Hornbeck, L.J.; Meier, R.E.; Douglass, M.R. A MEMS-based projection display. Proc. IEEE 1998, 86, 1687–1704. [Google Scholar] [CrossRef]
  2. Amontons, G. De la résistance causée dans les machines. In Mémoires de l’Académie Royale A; Chez Gerard Kuyper: Amsterdam, The Netherlands, 1699; pp. 257–282. [Google Scholar]
  3. Bowden, E.; Tabor, D. The Friction and Lubrication of Solids; Oxford University Press: London, UK, 1954. [Google Scholar]
  4. Gao, J.; Luedtke, W.D.; Gourdon, D.; Ruths, M.; Israelachvili, J.N.; Landman, U. Frictional Forces and Amontons’ Law: From the Molecular to the Macroscopic Scale. J. Phys. Chem. B 2004, 108, 3410–3425. [Google Scholar] [CrossRef]
  5. Archard, J.F. Contact and Rubbing of Flat Surfaces. J. Appl. Phys. 1953, 24, 981–988. [Google Scholar] [CrossRef]
  6. Rosenkranz, A.; Costa, H.L.; Baykara, M.Z.; Martini, A. Synergetic effects of surface texturing and solid lubricants to tailor friction and wear—A review. Tribol. Int. 2021, 155, 106792. [Google Scholar] [CrossRef]
  7. Scharf, T.W.; Prasad, S.V. Solid lubricants: A review. J. Mater. Sci. 2012, 48, 511–531. [Google Scholar] [CrossRef]
  8. Donnet, C.; Erdemir, A. Historical developments and new trends in tribological and solid lubricant coatings. Surf. Coat. Technol. 2004, 180–181, 76–84. [Google Scholar] [CrossRef]
  9. Xing, Y.; Deng, J.; Wang, X.; Meng, R. Effect of laser surface textures combined with multi-solid lubricant coatings on the tribological properties of Al2O3/TiC ceramic. Wear 2015, 342–343, 1–12. [Google Scholar] [CrossRef]
  10. Wang, C.; Li, Z.; Zhao, H.; Zhang, G.; Ren, T.; Zhang, Y. Enhanced anticorrosion and antiwear properties of Ti–6Al–4V alloys with laser texture and graphene oxide coatings. Tribol. Int. 2020, 152, 106475. [Google Scholar] [CrossRef]
  11. Xue, P.; Huang, Z.; Chen, C. Effect of Substrate Roughness on the Friction and Wear Behaviors of Laser-Induced Graphene Film. Lubricants 2022, 10, 239. [Google Scholar] [CrossRef]
  12. Wei, Y.; Li, S.; Huang, H.; Ding, C.; Wang, X. Experimental Investigation on Synergetic Effects of Micro Grooves and WSe2 in Sliding Contact. Lubricants 2022, 10, 208. [Google Scholar] [CrossRef]
  13. Luster, B.; Stone, D.; Singh, D.P.; to Baben, M.; Schneider, J.M.; Polychronopoulou, K.; Rebholz, C.; Kohli, P.; Aouadi, S.M. Textured VN coatings with Ag3VO4 solid lubricant reservoirs. Surf. Coat. Technol. 2011, 206, 1932–1935. [Google Scholar] [CrossRef]
  14. Erdemir, A. Review of engineered tribological interfaces for improved boundary lubrication. Tribol. Int. 2005, 38, 249–256. [Google Scholar] [CrossRef]
  15. Pettersson, U.; Jacobson, S. Influence of surface texture on boundary lubricated sliding contacts. Tribol. Int. 2003, 36, 857–864. [Google Scholar] [CrossRef]
  16. Zhang, K.; Liu, K.; Gao, T.; Qiao, Y.; Zhang, Y.; Liu, X.; Wang, W.; Ye, J. The unrecognized importance of roughness directionality to polymer wear. Wear 2021, 486–487, 204084. [Google Scholar] [CrossRef]
  17. Dawari, C.K.; Haq, I.; Mönkkönen, K.; Suvanto, M.; Saarinen, J.J. Reduced sliding friction on flat and microstructured metal injection molded (MIM) WC-Co hard metals with MoS2 composite lubricants. Tribol. Int. 2021, 160, 107020. [Google Scholar] [CrossRef]
  18. Li, P.; Ju, P.; Ji, L.; Li, H.; Liu, X.; Chen, L.; Zhou, H.; Chen, J. Toward Robust Macroscale Superlubricity on Engineering Steel Substrate. Adv. Mater. 2020, 32, e2002039. [Google Scholar] [CrossRef]
  19. Bijani, D.; Deladi, E.L.; Akchurin, A.; De Rooij, M.B.; Schipper, D.J. The Influence of Surface Texturing on the Frictional Behaviour of Parallel Sliding Lubricated Surfaces under Conditions of Mixed Lubrication. Lubricants 2018, 6, 91. [Google Scholar] [CrossRef]
  20. Arenas, M.A.; Ahuir-Torres, J.I.; García, I.; Carvajal, H.; de Damborenea, J. Tribological behaviour of laser textured Ti6Al4V alloy coated with MoS2 and graphene. Tribol. Int. 2018, 128, 240–247. [Google Scholar] [CrossRef]
  21. Singh, A.; Patel, D.S.; Ramkumar, J.; Balani, K. Single step laser surface texturing for enhancing contact angle and tribological properties. Int. J. Adv. Manuf. Technol. 2018, 100, 1253–1267. [Google Scholar] [CrossRef]
  22. Huang, J.; Guan, Y.; Ramakrishna, S. Tribological behavior of femtosecond laser-textured leaded brass. Tribol. Int. 2021, 162, 107115. [Google Scholar] [CrossRef]
  23. Grützmacher, P.G.; Profito, F.J.; Rosenkranz, A. Multi-Scale Surface Texturing in Tribology—Current Knowledge and Future Perspectives. Lubricants 2019, 7, 95. [Google Scholar] [CrossRef]
  24. Suh, M.-S.; Chae, Y.-H.; Kim, S.-S.; Hinoki, T.; Kohyama, A. Effect of geometrical parameters in micro-grooved crosshatch pattern under lubricated sliding friction. Tribol. Int. 2010, 43, 1508–1517. [Google Scholar] [CrossRef]
  25. Schneider, J.; Braun, D.; Greiner, C. Laser Textured Surfaces for Mixed Lubrication: Influence of Aspect Ratio, Textured Area and Dimple Arrangement. Lubricants 2017, 5, 32. [Google Scholar] [CrossRef]
  26. Liu, S.; Sai, Q.; Wang, S.; Williams, J. Effects of Laser Surface Texturing and Lubrication on the Vibrational and Tribological Performance of Sliding Contact. Lubricants 2022, 10, 10. [Google Scholar] [CrossRef]
  27. Schäfer, C.; Reinert, L.; MacLucas, T.; Grützmacher, P.; Merz, R.; Mücklich, F.; Suarez, S. Influence of Surface Design on the Solid Lubricity of Carbon Nanotubes-Coated Steel Surfaces. Tribol. Lett. 2018, 66, 89. [Google Scholar] [CrossRef]
  28. Maclucas, T.; Daut, L.; Grützmacher, P.; Guitar, M.A.; Presser, V.; Gachot, C.; Suarez, S.; Mücklich, F. Influence of structural depth of laser-patterned steel surfaces on the solid lubricity of carbon nanoparticle coatings. Friction 2023, 11, 1276–1291. [Google Scholar] [CrossRef]
  29. Sherif, H.A.; Kossa, S. Relationship between normal and tangential contact stiffness of nominally flat surfaces. Wear 1991, 151, 49–62. [Google Scholar] [CrossRef]
  30. Zahouani, H.; Mezghani, S.; Pailler-Mattei, C.; Elmansori, M. Effect of roughness scale on contact stiffness between solids. Wear 2009, 266, 589–591. [Google Scholar] [CrossRef]
  31. Sellgren, U.; Björklund, S.; Andersson, S. A finite element-based model of normal contact between rough surfaces. Wear 2003, 254, 1180–1188. [Google Scholar] [CrossRef]
  32. Ripoll, M.R.; Podgornik, B.; Vižintin, J. Finite element analysis of textured surfaces under reciprocating sliding. Wear 2011, 271, 952–959. [Google Scholar] [CrossRef]
  33. Komvopoulos, K.; Choi, D.-H. Elastic Finite Element Analysis of Multi-Asperity Contacts. J. Tribol. 1992, 114, 823–831. [Google Scholar] [CrossRef]
  34. Kasarekar, A.T.; Bolander, N.W.; Sadeghi, F.; Tseregounis, S. Modeling of fretting wear evolution in rough circular contacts in partial slip. Int. J. Mech. Sci. 2007, 49, 690–703. [Google Scholar] [CrossRef]
  35. Ghosh, A.; Sadeghi, F. A novel approach to model effects of surface roughness parameters on wear. Wear 2015, 338–339, 73–94. [Google Scholar] [CrossRef]
  36. Wang, D.; Li, F.; Chen, X.; Li, H.; Chen, W.; Zhang, P. Effect of Two Graphene Coatings on the Friction and Wear of Sliding Electrical Contact Interface. Lubricants 2022, 10, 305. [Google Scholar] [CrossRef]
  37. Orgeldinger, C.; Tremmel, S. Understanding Friction in Cam–Tappet Contacts—An Application-Oriented Time-Dependent Simulation Approach Considering Surface Asperities and Edge Effects. Lubricants 2021, 9, 106. [Google Scholar] [CrossRef]
  38. Reichert, S.; Lorentz, B.; Albers, A. Influence of flattening of rough surface profiles on the friction behaviour of mixed lubricated contacts. Tribol. Int. 2016, 93, 614–619. [Google Scholar] [CrossRef]
  39. Qin, W.; Jin, X.; Kirk, A.; Shipway, P.; Sun, W. Effects of surface roughness on local friction and temperature distributions in a steel-on-steel fretting contact. Tribol. Int. 2018, 120, 350–357. [Google Scholar] [CrossRef]
  40. Pei, L.; Hyun, S.; Molinari, J.; Robbins, M.O. Finite element modeling of elasto-plastic contact between rough surfaces. J. Mech. Phys. Solids 2005, 53, 2385–2409. [Google Scholar] [CrossRef]
  41. Juettner, M.; Bartz, M.; Tremmel, S.; Correns, M.; Wartzack, S. Edge Pressures Obtained Using FEM and Half-Space: A Study of Truncated Contact Ellipses. Lubricants 2022, 10, 107. [Google Scholar] [CrossRef]
  42. Greenwood, J.A.; Williamson, J.B.P. Contact of nominally flat surfaces. Proc. R. Soc. Lund. Ser. A Math. Phys. Sci. 1966, 295, 300–319. [Google Scholar] [CrossRef]
  43. Rosenkranz, A.; Heib, T.; Gachot, C.; Mücklich, F. Oil film lifetime and wear particle analysis of laser-patterned stainless steel surfaces. Wear 2015, 334–335, 1–12. [Google Scholar] [CrossRef]
  44. Reinert, L.; Lasserre, F.; Gachot, C.; Grützmacher, P.; MacLucas, T.; Souza, N.; Mücklich, F.; Suarez, S. Long-lasting solid lubrication by CNT-coated patterned surfaces. Sci. Rep. 2017, 7, 42873. [Google Scholar] [CrossRef] [PubMed]
  45. Rapoport, L.; Moshkovich, A.; Perfilyev, V.; Lapsker, I.; Halperin, G.; Itovich, Y.; Etsion, I. Friction and wear of MoS2 films on laser textured steel surfaces. Surf. Coat. Technol. 2008, 202, 3332–3340. [Google Scholar] [CrossRef]
  46. Liu, Y.; Han, J.-H.; Wang, T.; Hwang, Y.-H.; Xu, S.; Liu, W.; Kim, D.-E. Tribochemical reaction and wear mechanism of MoDTC based friction modifier. Tribol. Int. 2022, 165, 107302. [Google Scholar] [CrossRef]
  47. Liu, Y.; Shin, D.-G.; Xu, S.; Kim, C.-L.; Kim, D.-E. Understanding of the lubrication mechanism of reduced graphene oxide coating via dual in-situ monitoring of the chemical and topographic structural evolution. Carbon 2021, 173, 941–952. [Google Scholar] [CrossRef]
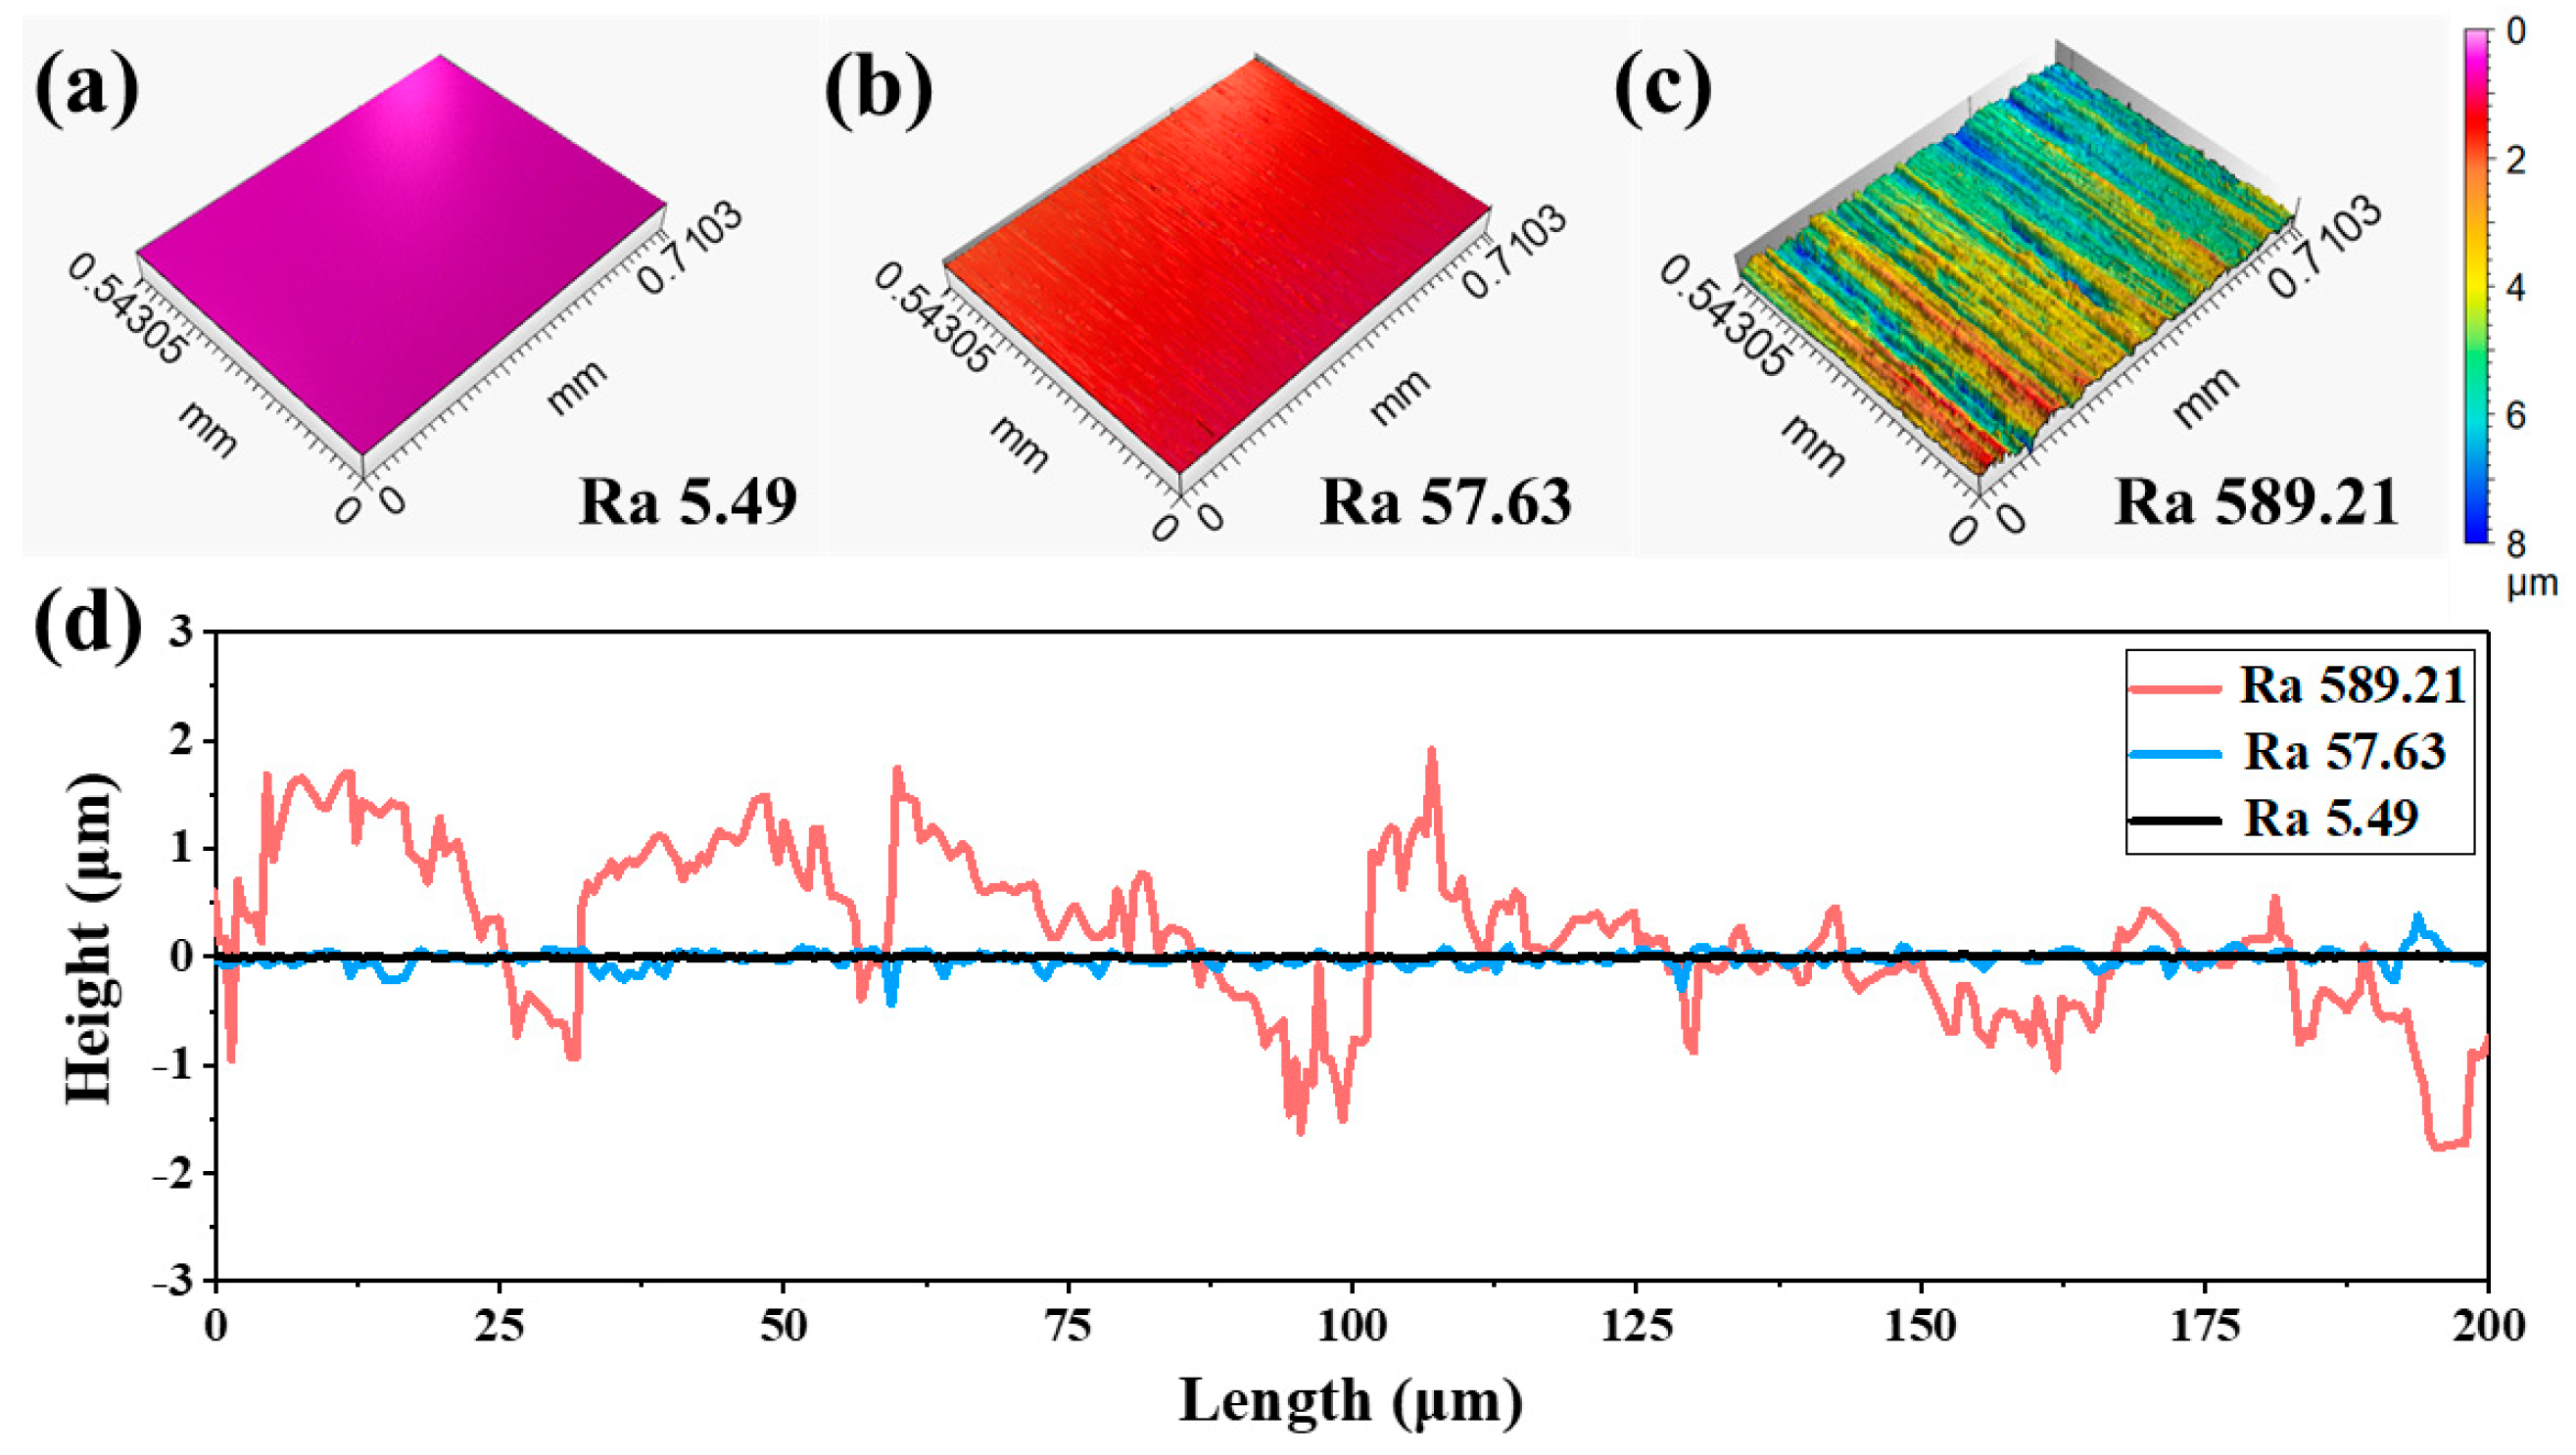
Figure 1. 3D surface topographies of 304 SS substrates: (a) mirror -like surface with Ra 5.49 nm; (b) surface with Ra 57.63 nm after ground by P2000 sandpaper; and (c) surface with Ra 589.21 nm ground by P100 sandpaper. (d) 2D profile of the cross-section perpendicular to the grinding direction of the substrate.
Lubricants 11 00191 g001
Figure 2. Comparison of the 2D surface topographies of the R600, R60, and R6 substrates surface topography 2D curves in the simulation model.
Lubricants 11 00191 g002
Figure 3. (a)The side view of the models of the R600-0.3, R60-0.3, and R6-0.3; (b) the element model of the R600-0.3 and the corresponding boundary.
Lubricants 11 00191 g003
Figure 4. Schematic diagram of the EPD process.
Lubricants 11 00191 g004
Figure 5. Schematic illustration of the reciprocating tribometer.
Lubricants 11 00191 g005
Figure 6. (a) Flowchart of the post-processing of simulation results; (b) the maximum tangential stiffness; and (c) the directional displacements of the substrate surface along the X-axis during the dynamic sliding process.
Lubricants 11 00191 g006
Figure 7. The contact area of the rough surface during sliding.
Lubricants 11 00191 g007
Figure 8. The SEM images of (a) raw material MoS2; (b) MoS2 coating surface; and (c) cross-section of MoS2 coating.
Lubricants 11 00191 g008
Figure 9. The 2D height profile of the edge of the MoS2 coatings on R60 substrate.
Lubricants 11 00191 g009
Figure 10. The XRD pattern of the MoS2 coating on SS substrate.
Lubricants 11 00191 g010
Figure 11. COF curves of MoS2 coating on SS substrates with different surface roughness at (a) micro- and (b) macro-scale contact conditions; (c) the average value of the COF of samples in the stable stage of sliding process; and (d) the wear life of samples.
Lubricants 11 00191 g011
Figure 12. SEM micrographs and the EDS mappings of element Fe, Mo and S in the wear tracks of (a) R600-0.3, (b) R60-0.3, (c) R600-3.2, and (d) R60-3.2 coated by MoS2 nanosheets after 200-cycle sliding test.
Lubricants 11 00191 g012
Figure 13. High resolution SEM images of the wear tracks of (a) R600-0.3, (b) R60-0.3, (c) R600-3.2, and (d) R60-3.2 coated by MoS2 nanosheets after the 200-cycle sliding process.
Lubricants 11 00191 g013
Figure 14. Optical microscope images of the counter balls of group (a) R600-0.3, (b) R60-0.3, (c) R600-3.2, (d) R60-3.2, and (e) the corresponding Raman spectra after 200 reciprocating cycles.
Lubricants 11 00191 g014
Figure 15. The optical microscope images and Raman spectra of the wear tracks of (a) R600-0.3, (b) R60-0.3, (c) R600-3.2, and (d) R60-3.2 coated by MoS2 nanosheets after 200-cycle sliding test.
Lubricants 11 00191 g015
Figure 16. 3D topography of wear track on SS substrates as the MoS2 coatings were cleaned after 200-cycle sliding test: (a) R600-0.3, (b) R60-0.3, (c) R600-3.2, and (d) R60-3.2.
Lubricants 11 00191 g016
Figure 17. Schematic of the tribological mechanisms of the SS substrates with different roughnesses: SS substrate with (a,a1) high roughness, (b,b1) low roughness, and (c,c1) mirror surface.
Lubricants 11 00191 g017
Table 1. Sine equations for generating rough surfaces.
SubstrateSine Curve Equation (μm)Ra (μm)Amplitude (μm)Wavelength (μm)
R6000.942*sin (0.25*x)0.60.94225
R600.094*sin (2.5*x)0.060.0942.5
Table 2. The group designations and configuration details of simulation experiments.
DesignationsR600-0.3R60-0.3R6-0.3R600-3.2R60-3.2R6-3.2
RoughnessRa 600.46 nmRa 59.82 nm/Ra 600.46 nmRa 59.82 nm/
Counter ball diameter0.3 mm0.3 mm0.3 mm3.2 mm3.2 mm3.2 mm
Normal load0.5 N0.5 N0.5 N0.5 N0.5 N0.5 N
Disclaimer/Publisher’s Note: The statements, opinions and data contained in all publications are solely those of the individual author(s) and contributor(s) and not of MDPI and/or the editor(s). MDPI and/or the editor(s) disclaim responsibility for any injury to people or property resulting from any ideas, methods, instructions or products referred to in the content.