Dry and MQL Milling of AISI 1045 Steel with Vegetable and Mineral-Based Fluids †

 ,
,  ,
,  ,
, 

Abstract
1. Introduction
2. Experimental Procedure
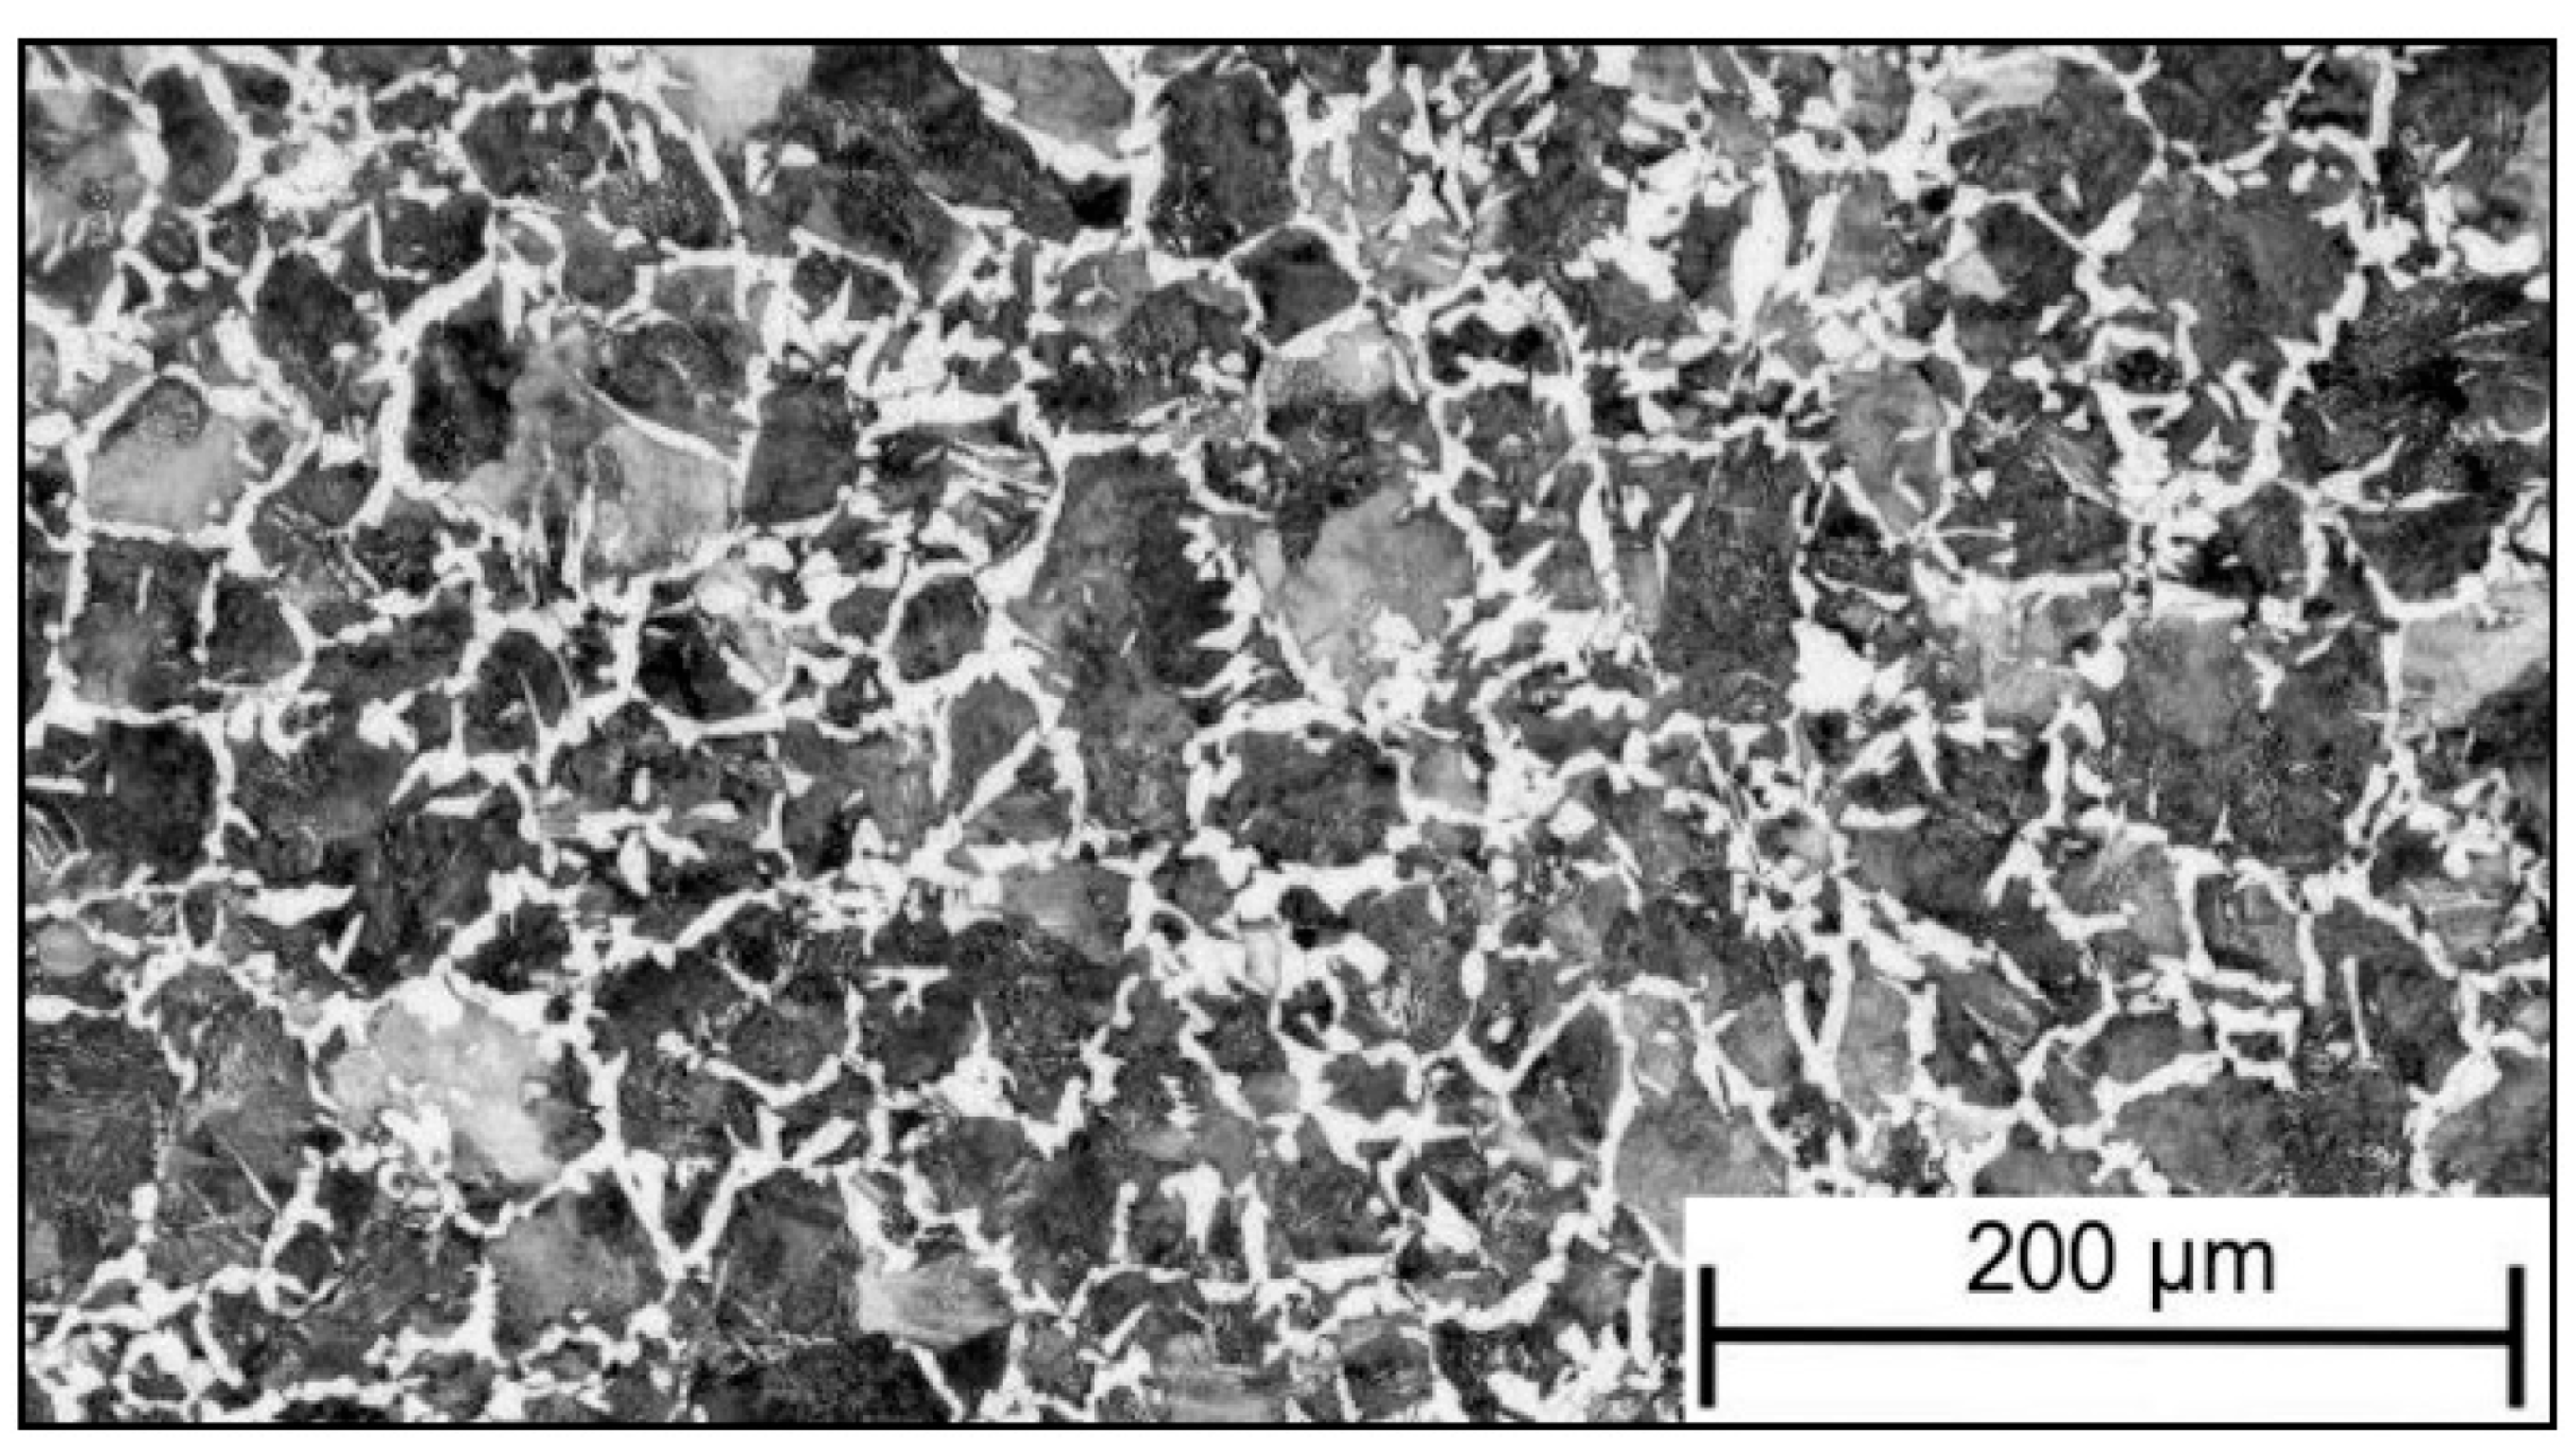
2.1. Materials Characterization
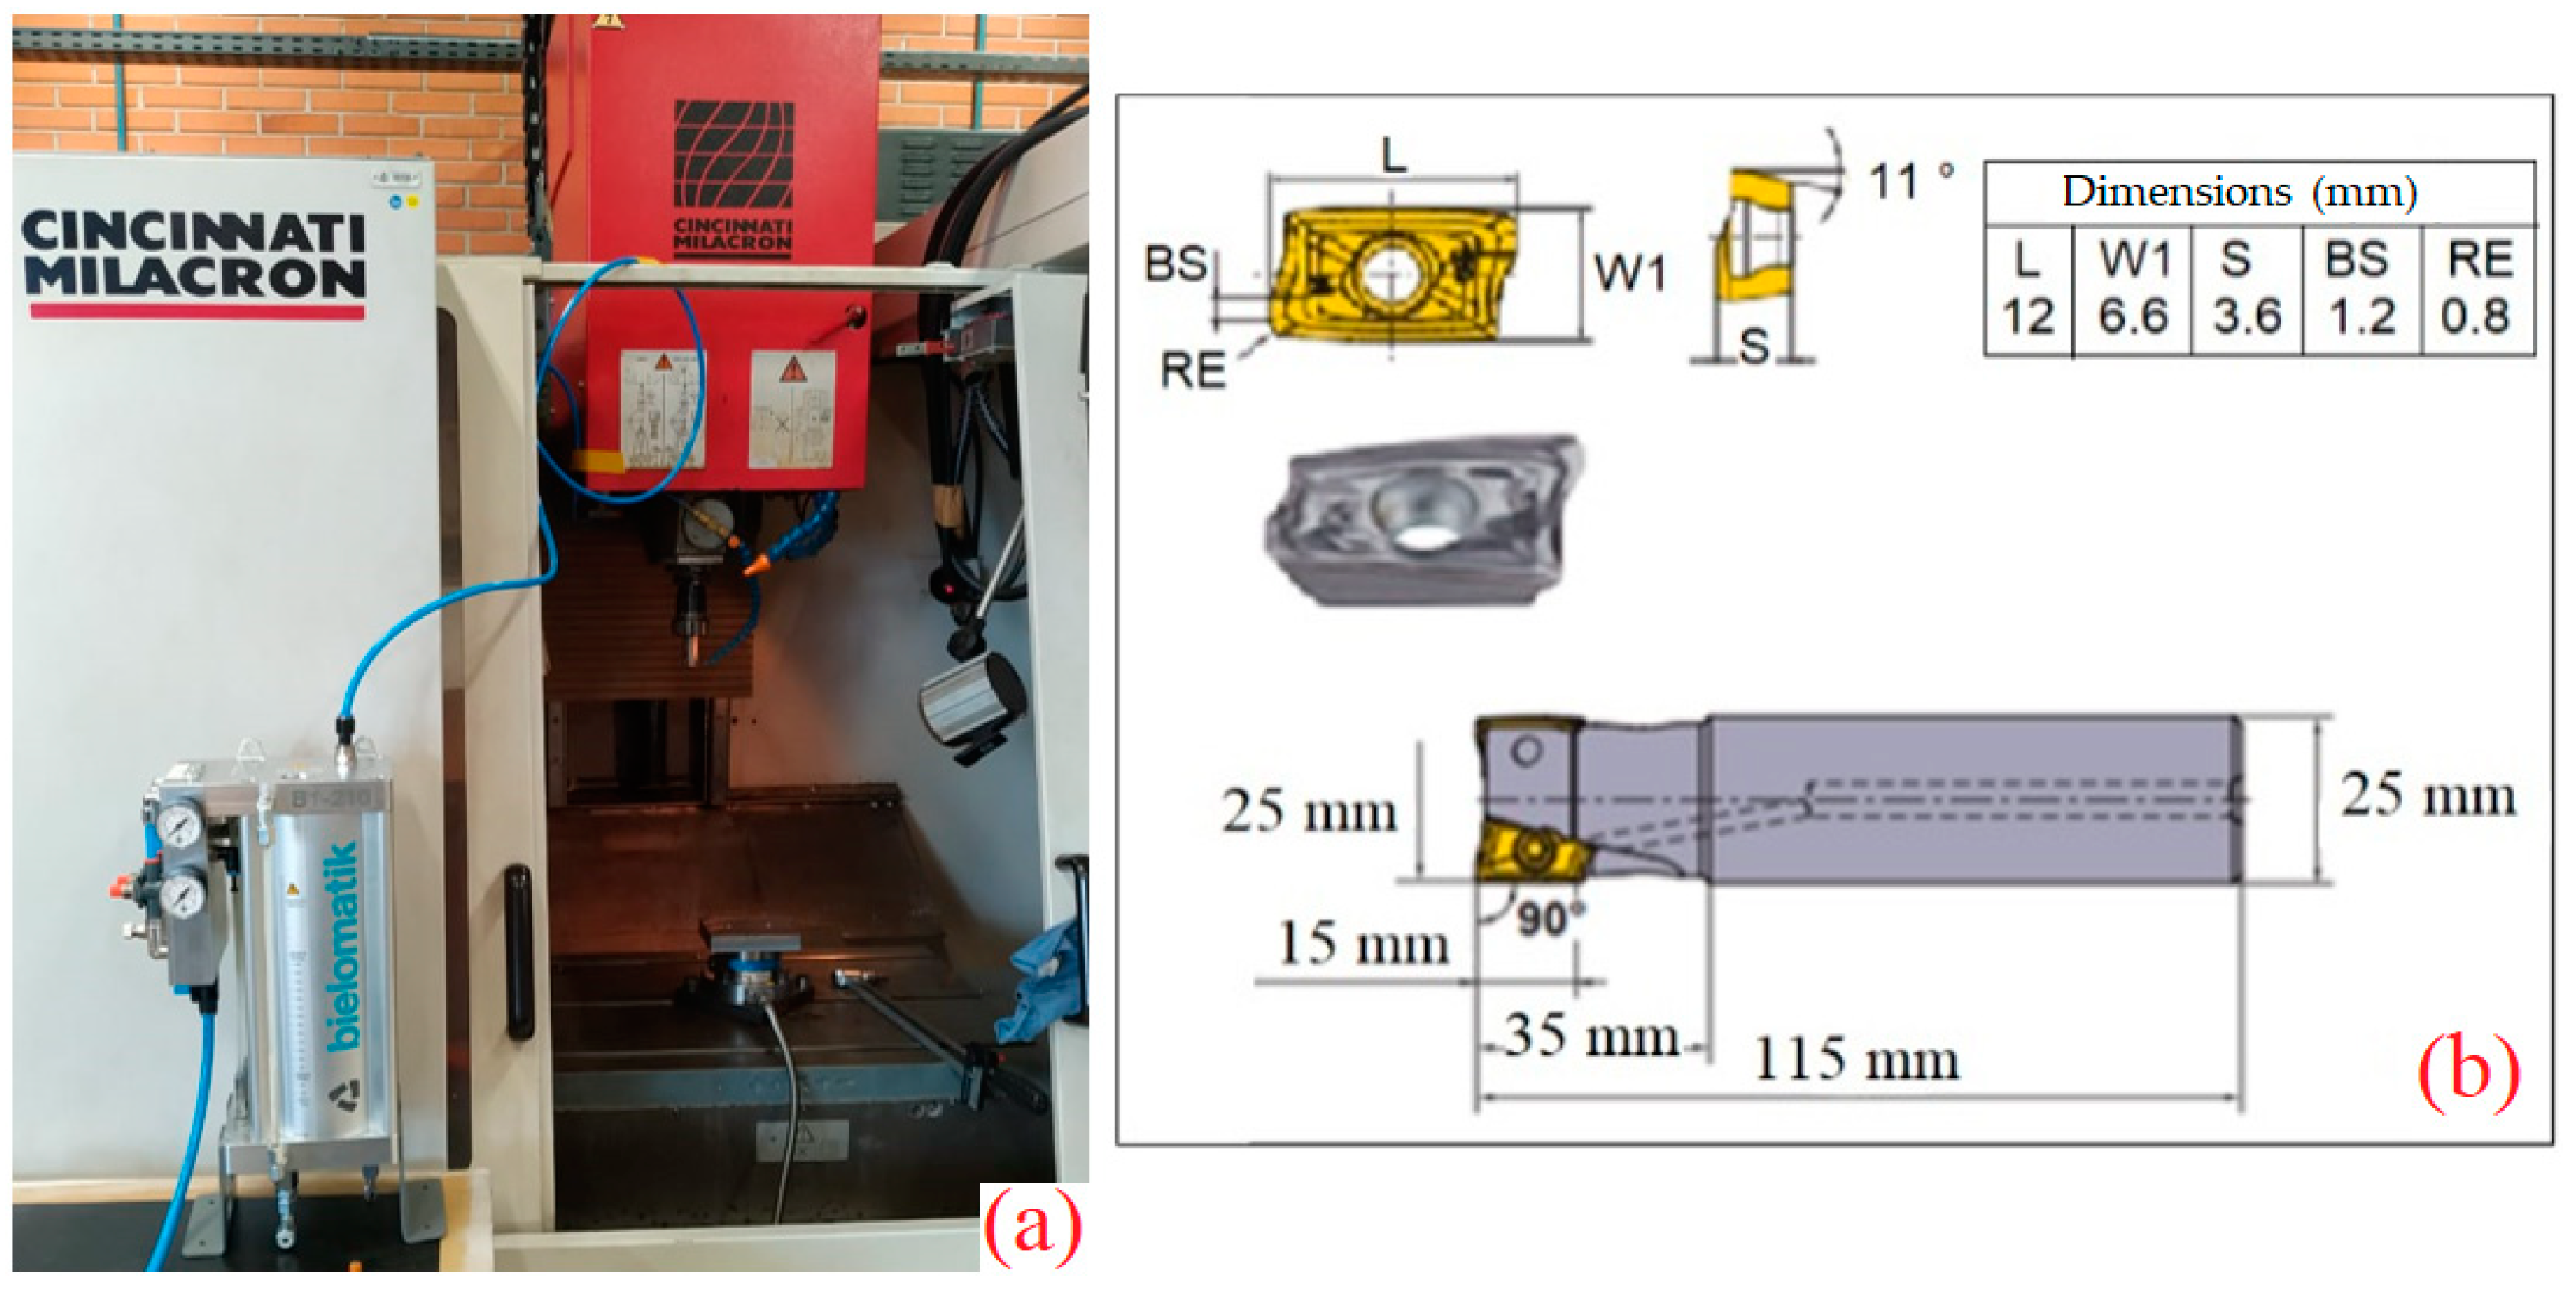
2.2. Experimental Conditions
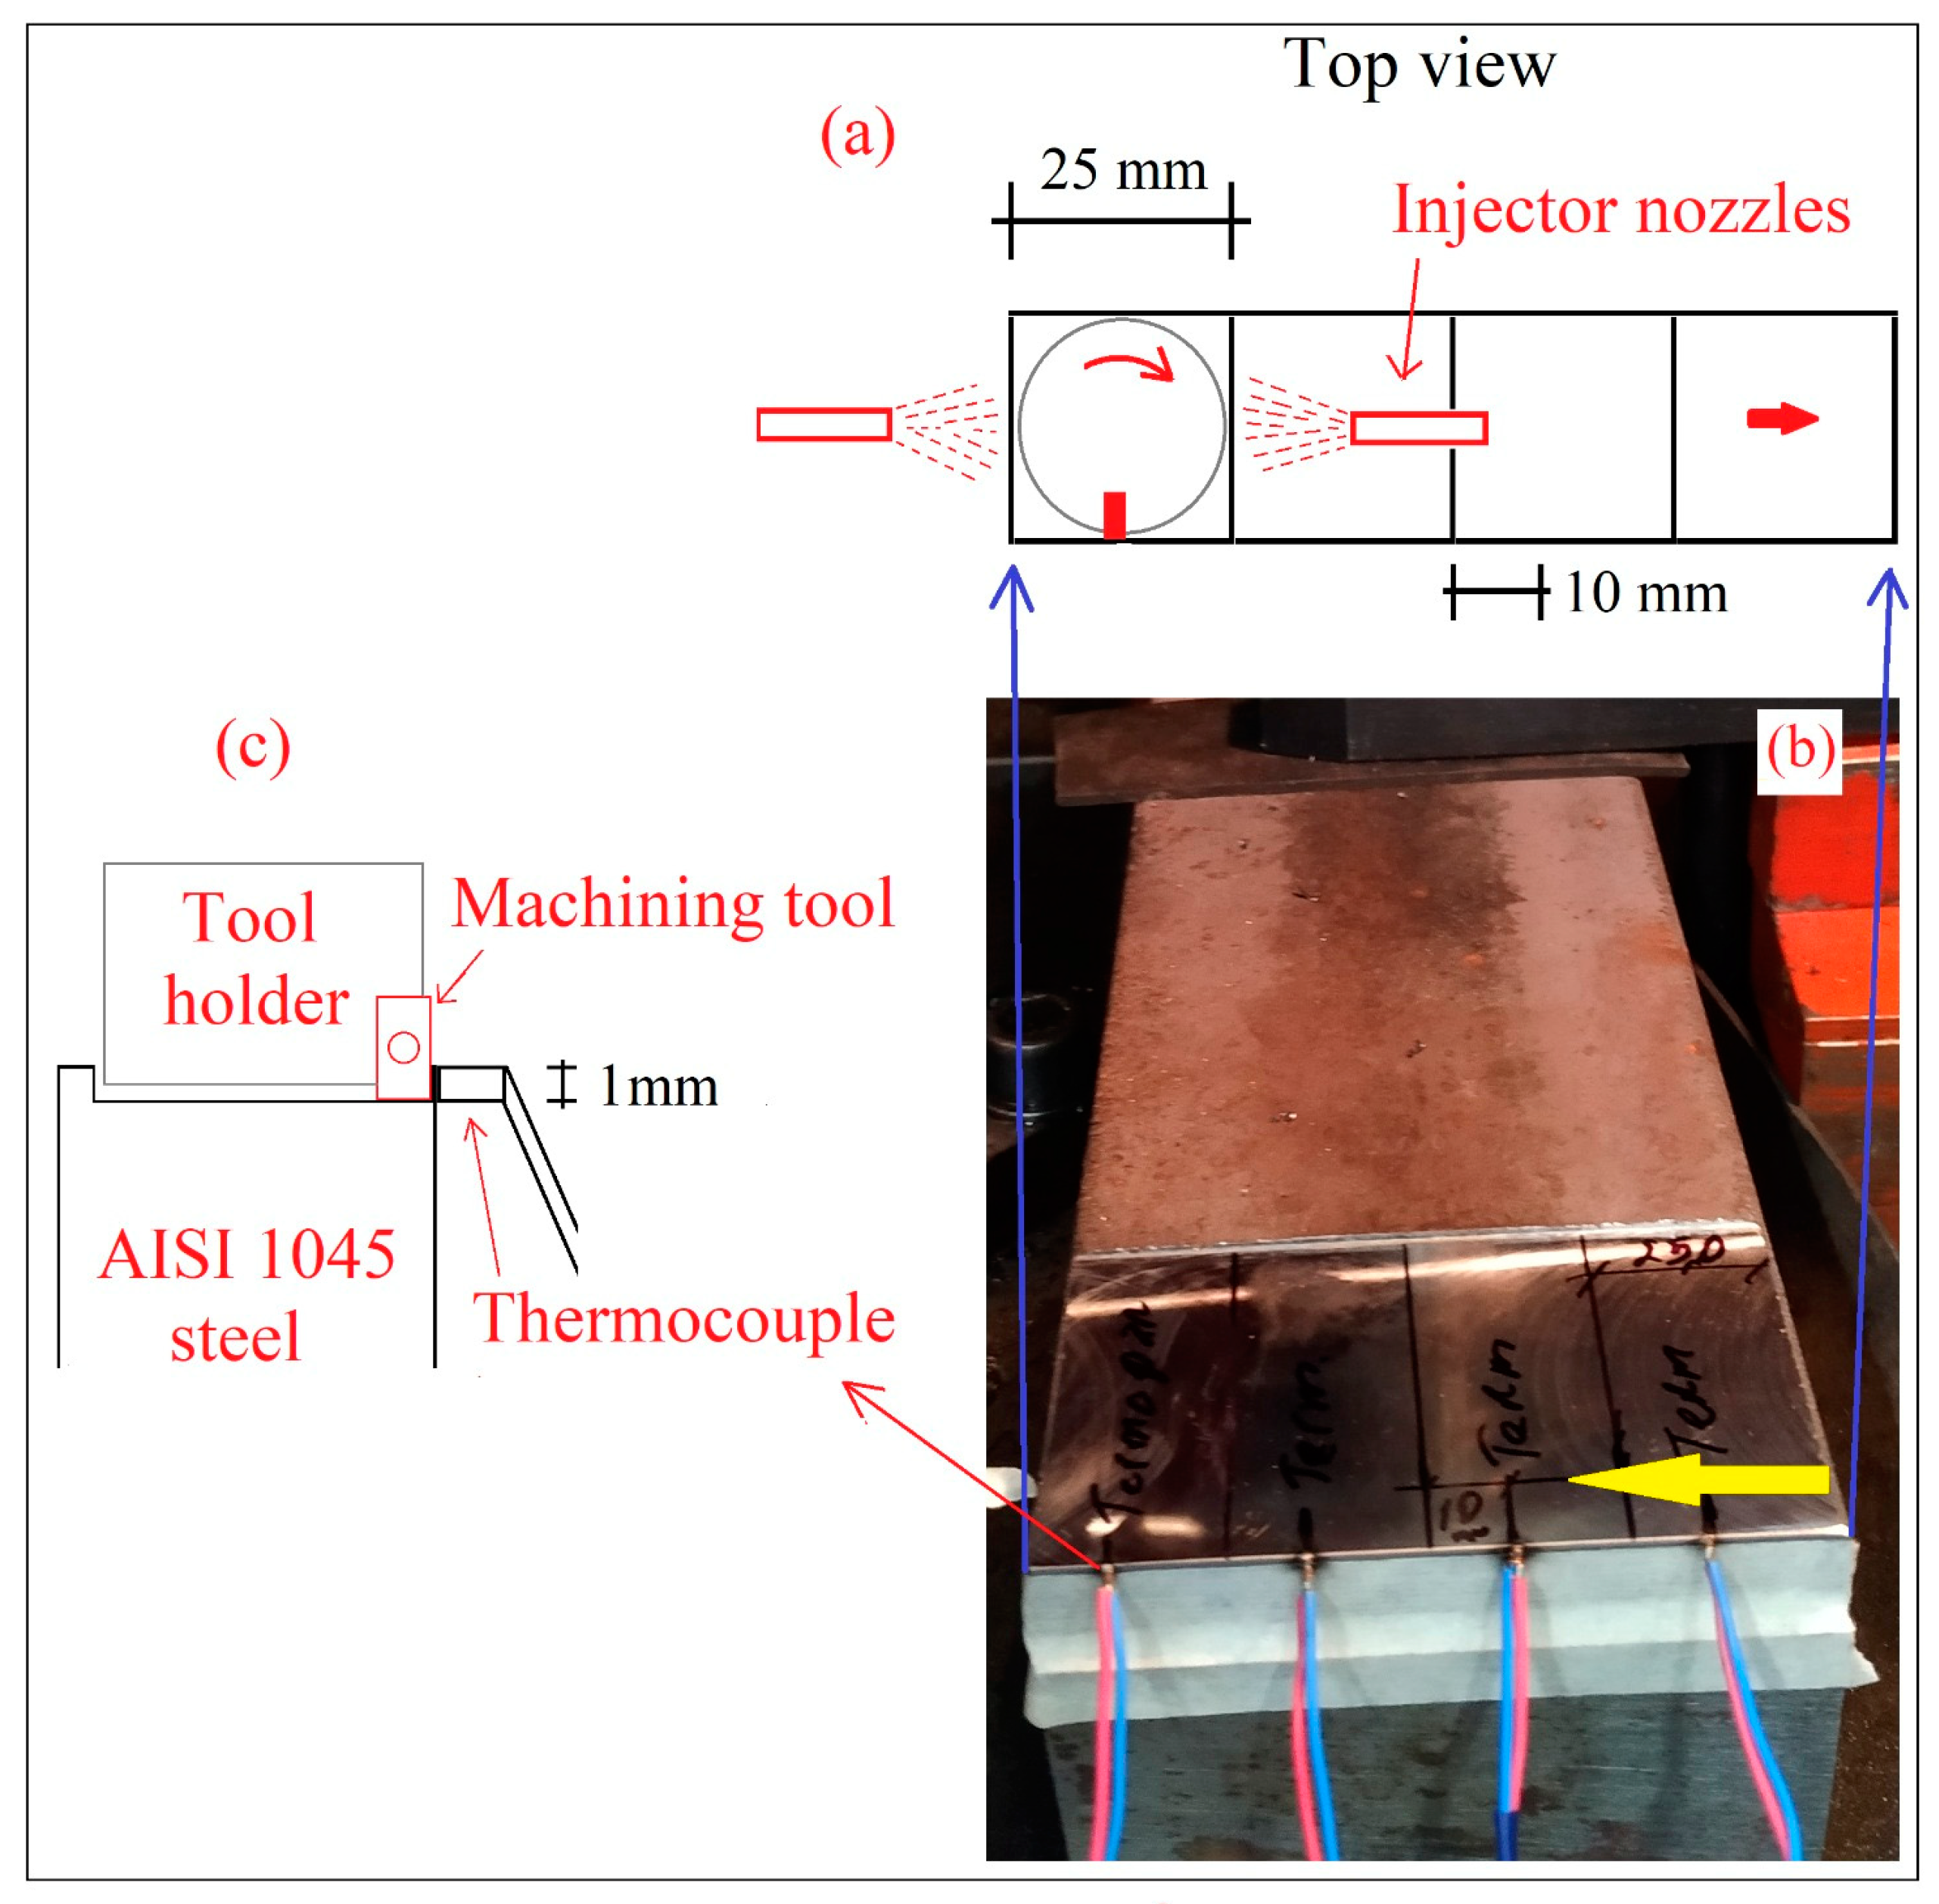
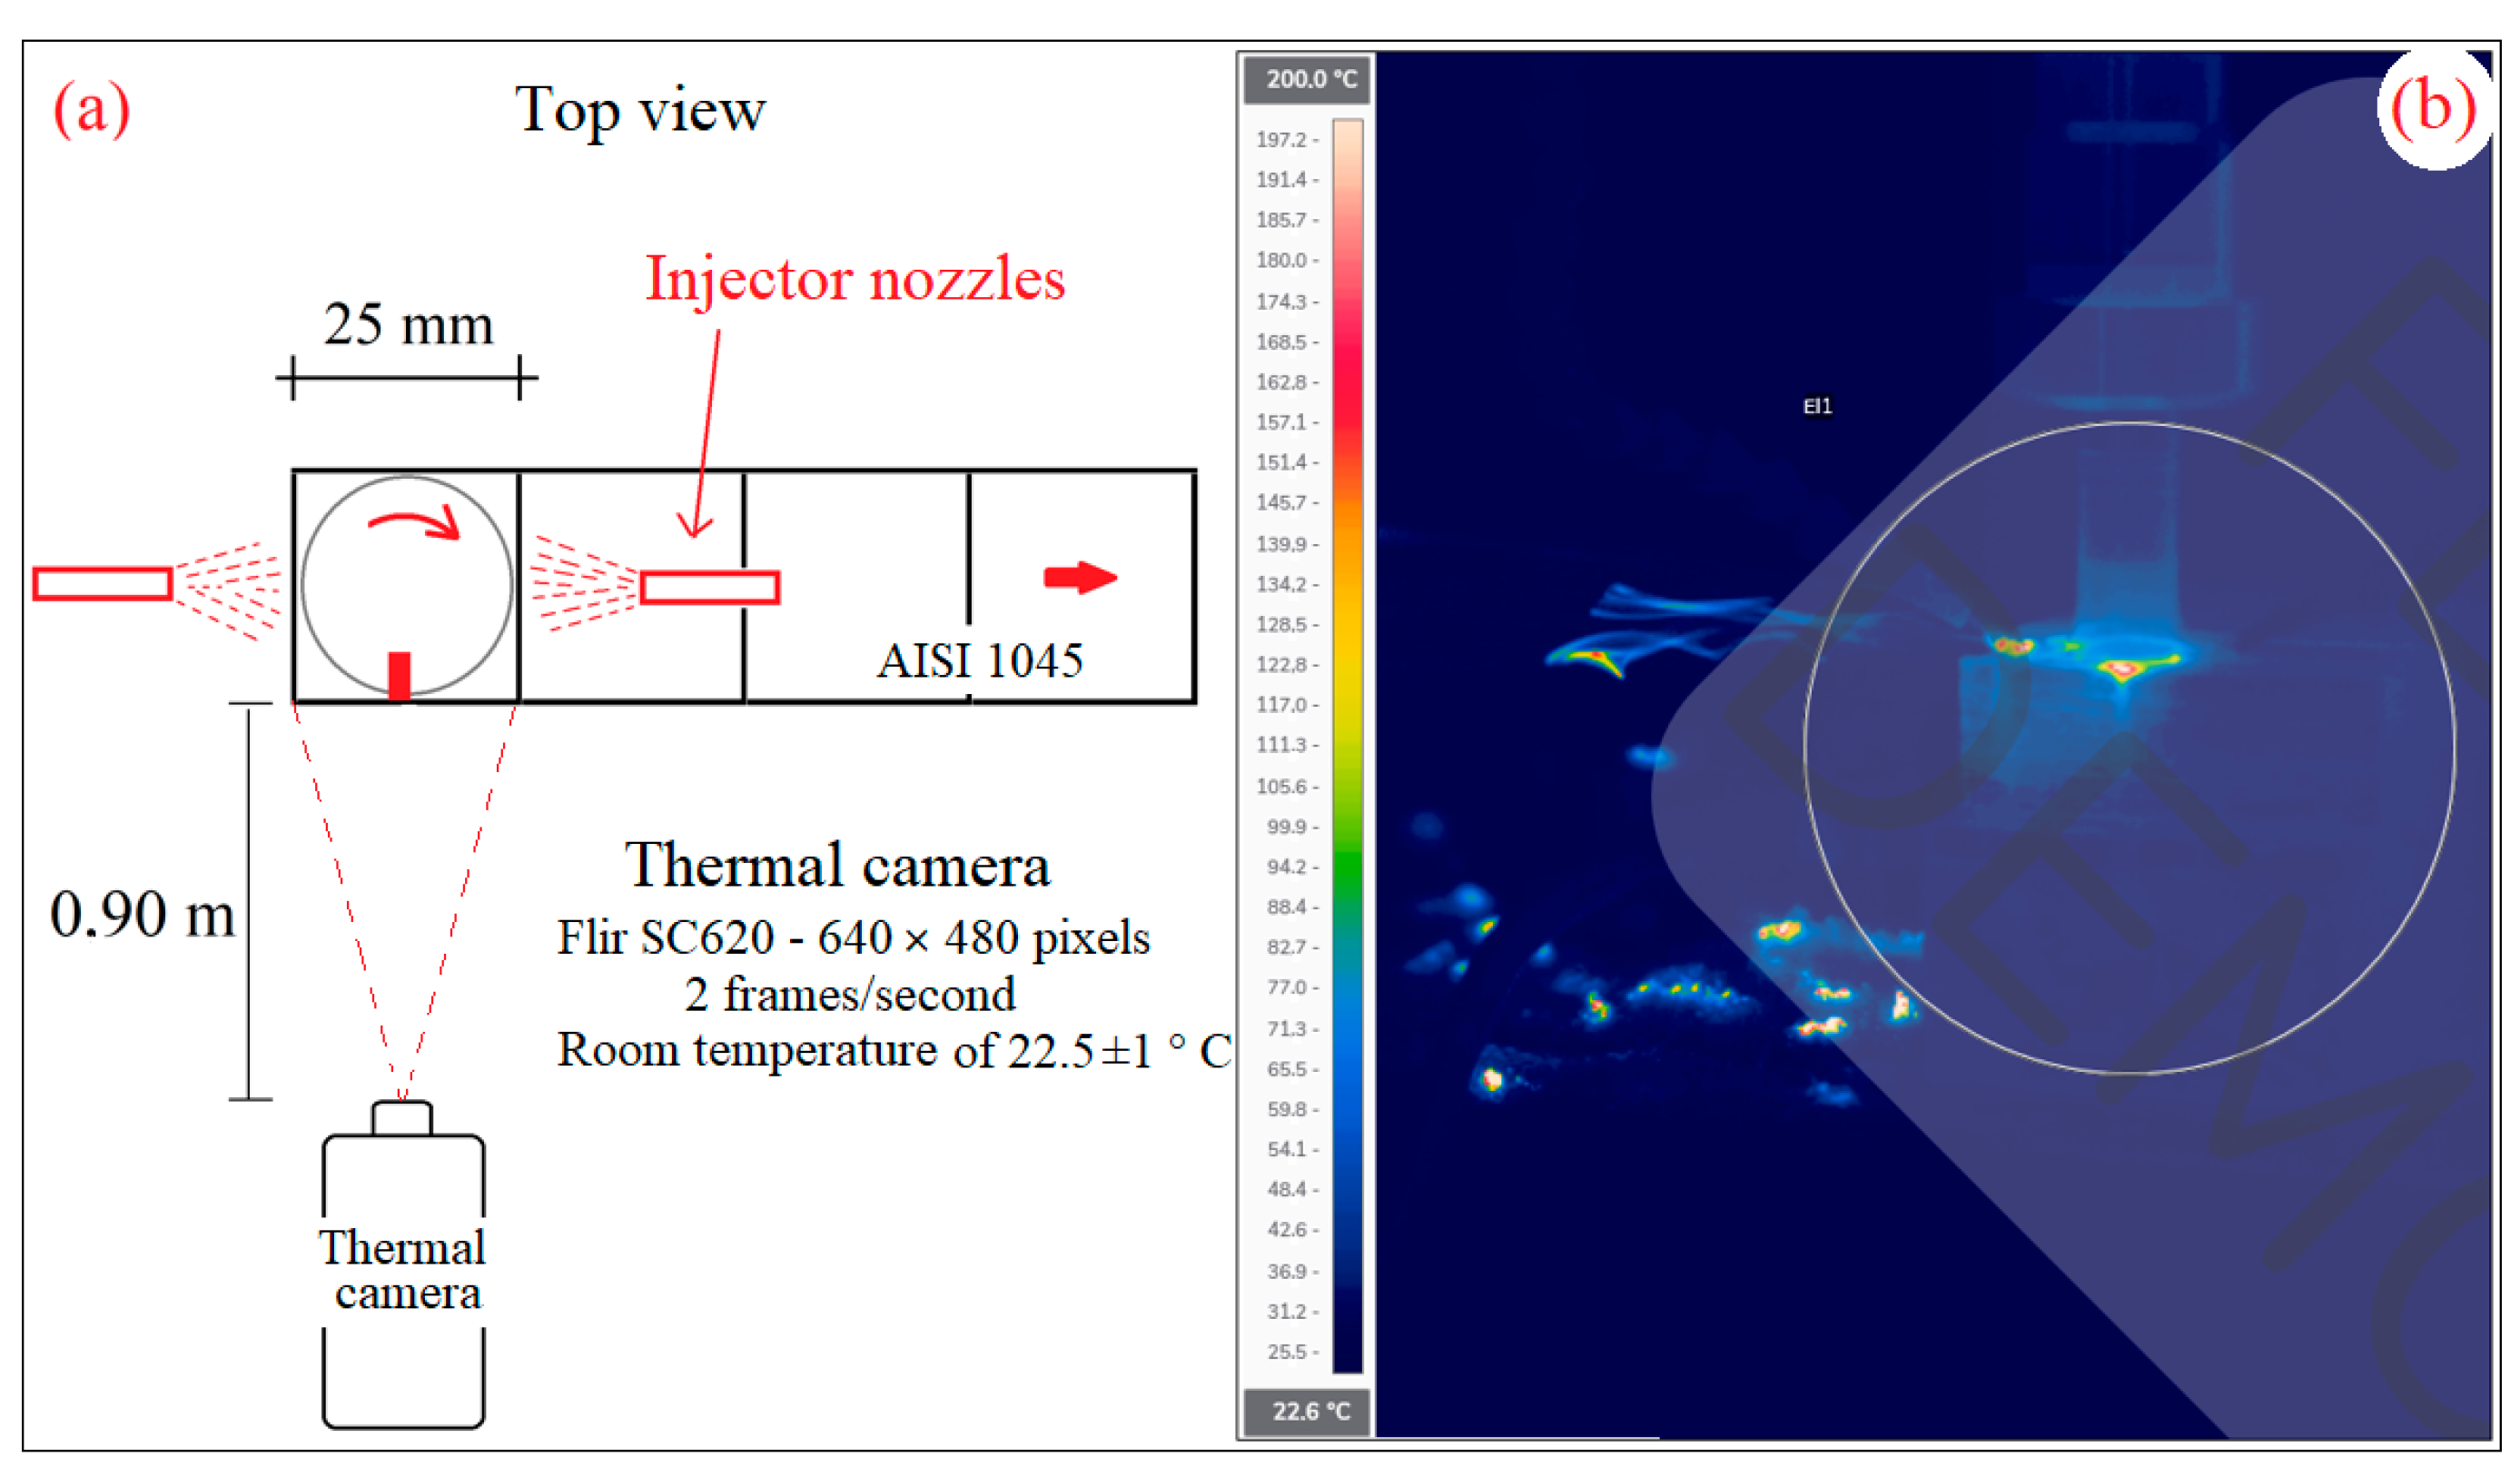
2.3. Temperature Measurement
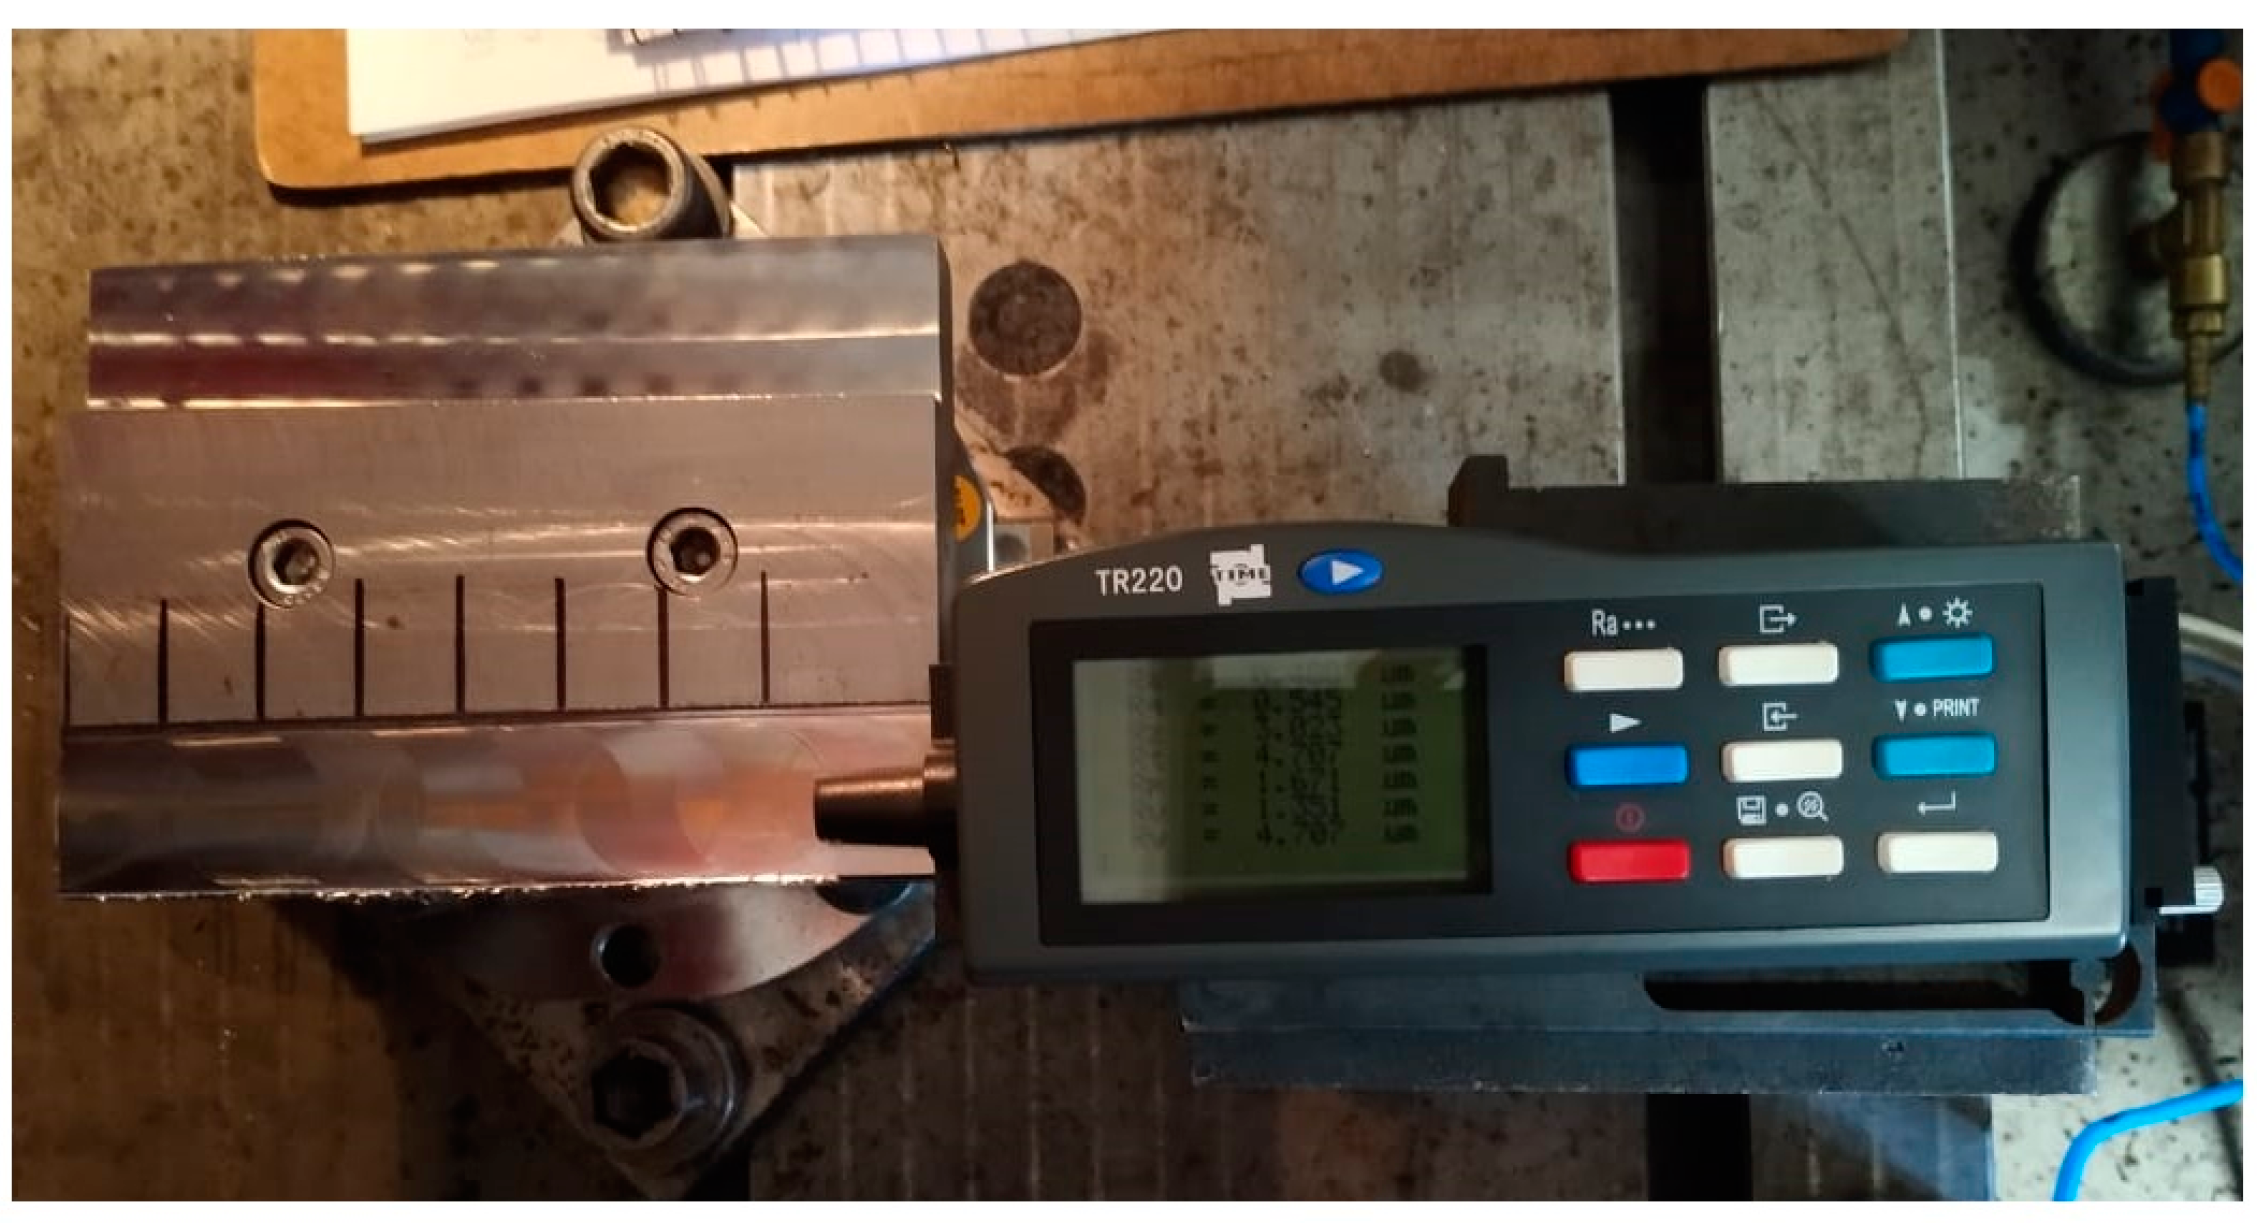
2.4. Measurement of Power Consumption, Cutting Forces, and Surface Roughness
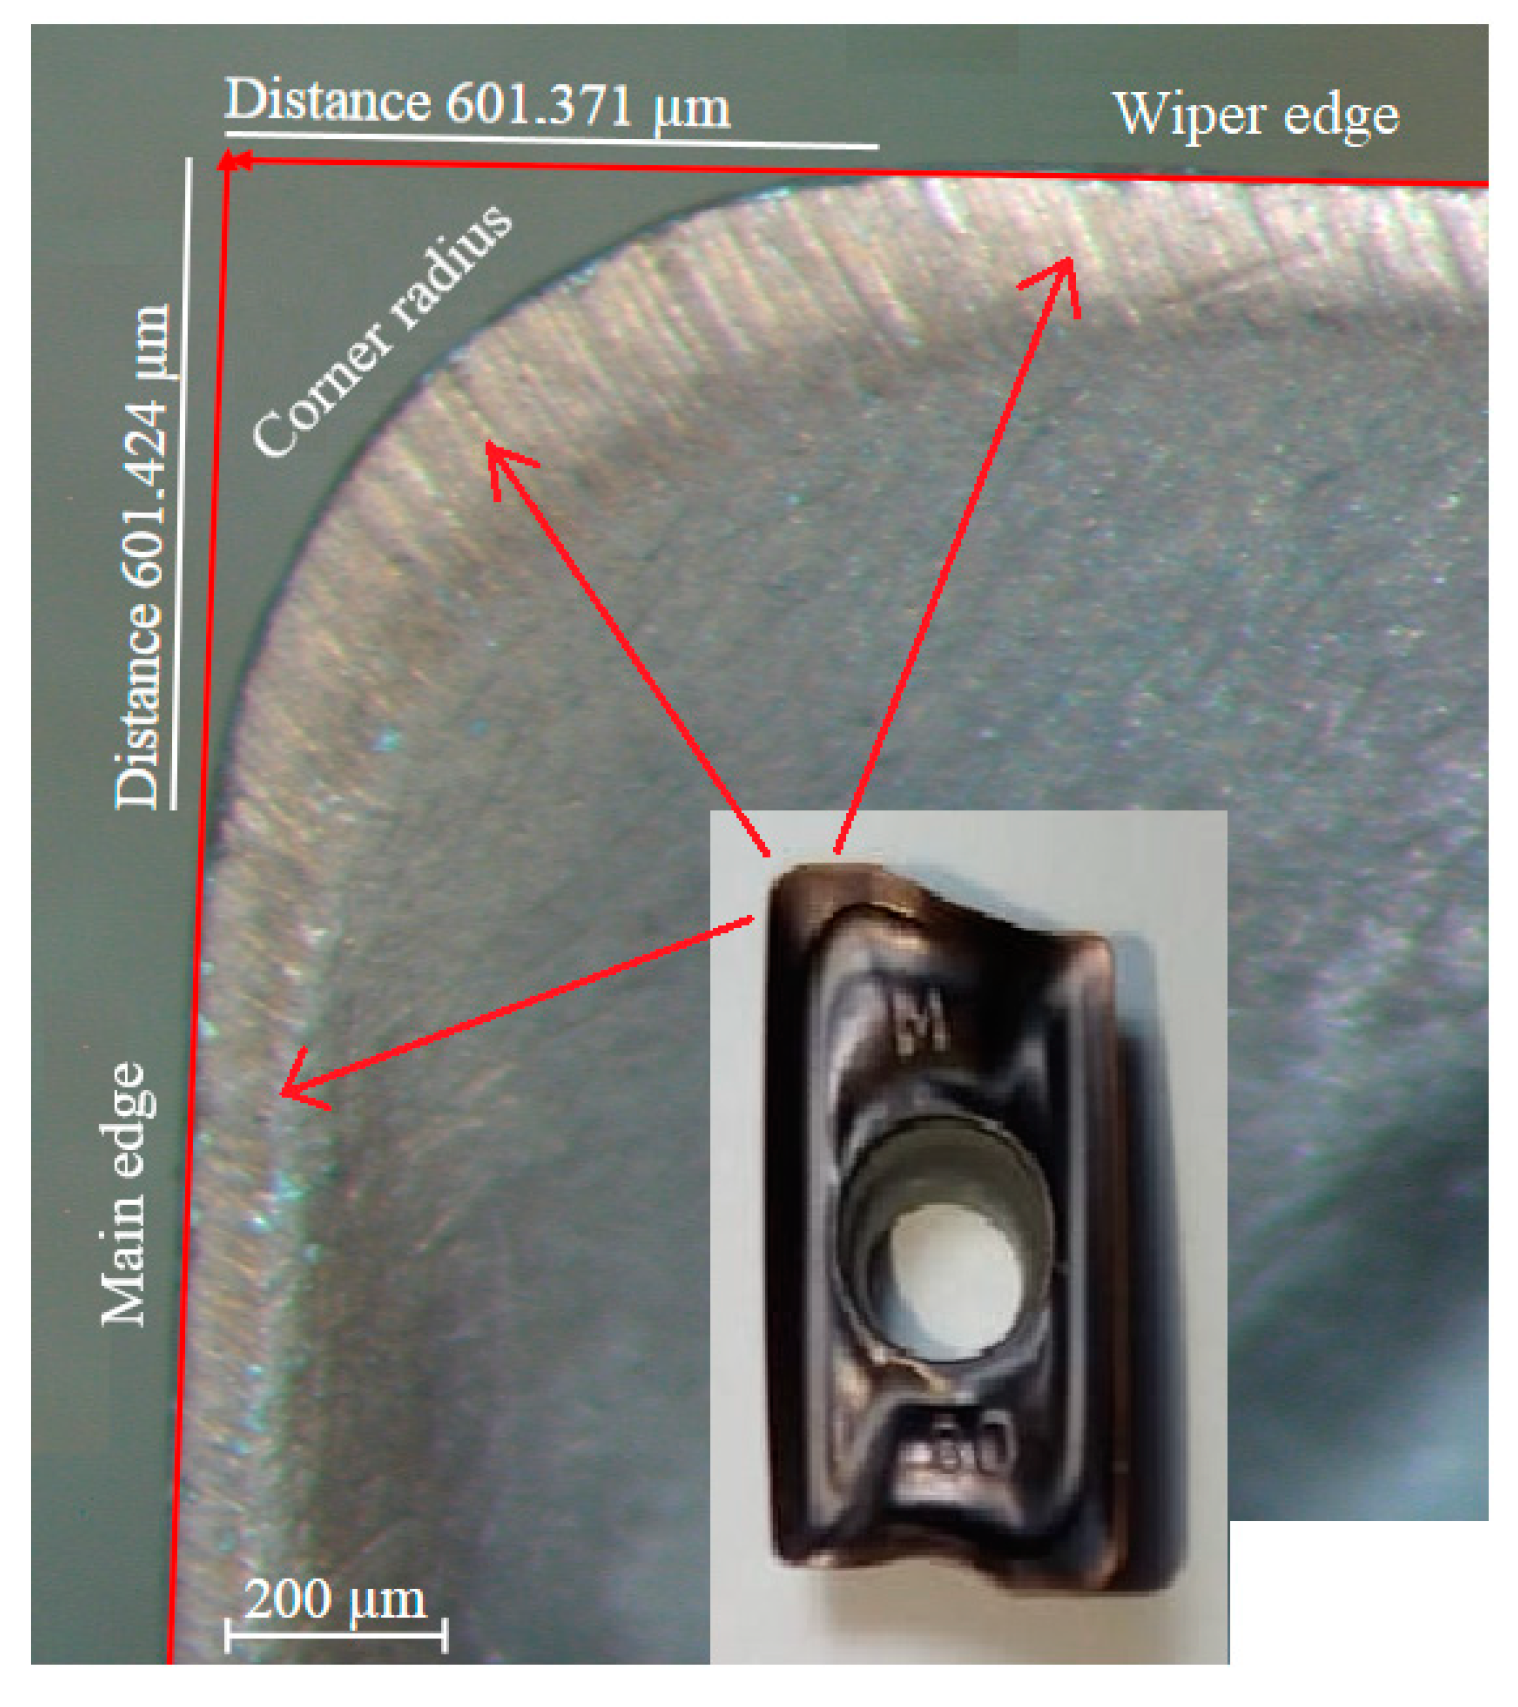
2.5. Tool Wear Measurements
3. Results and Discussions
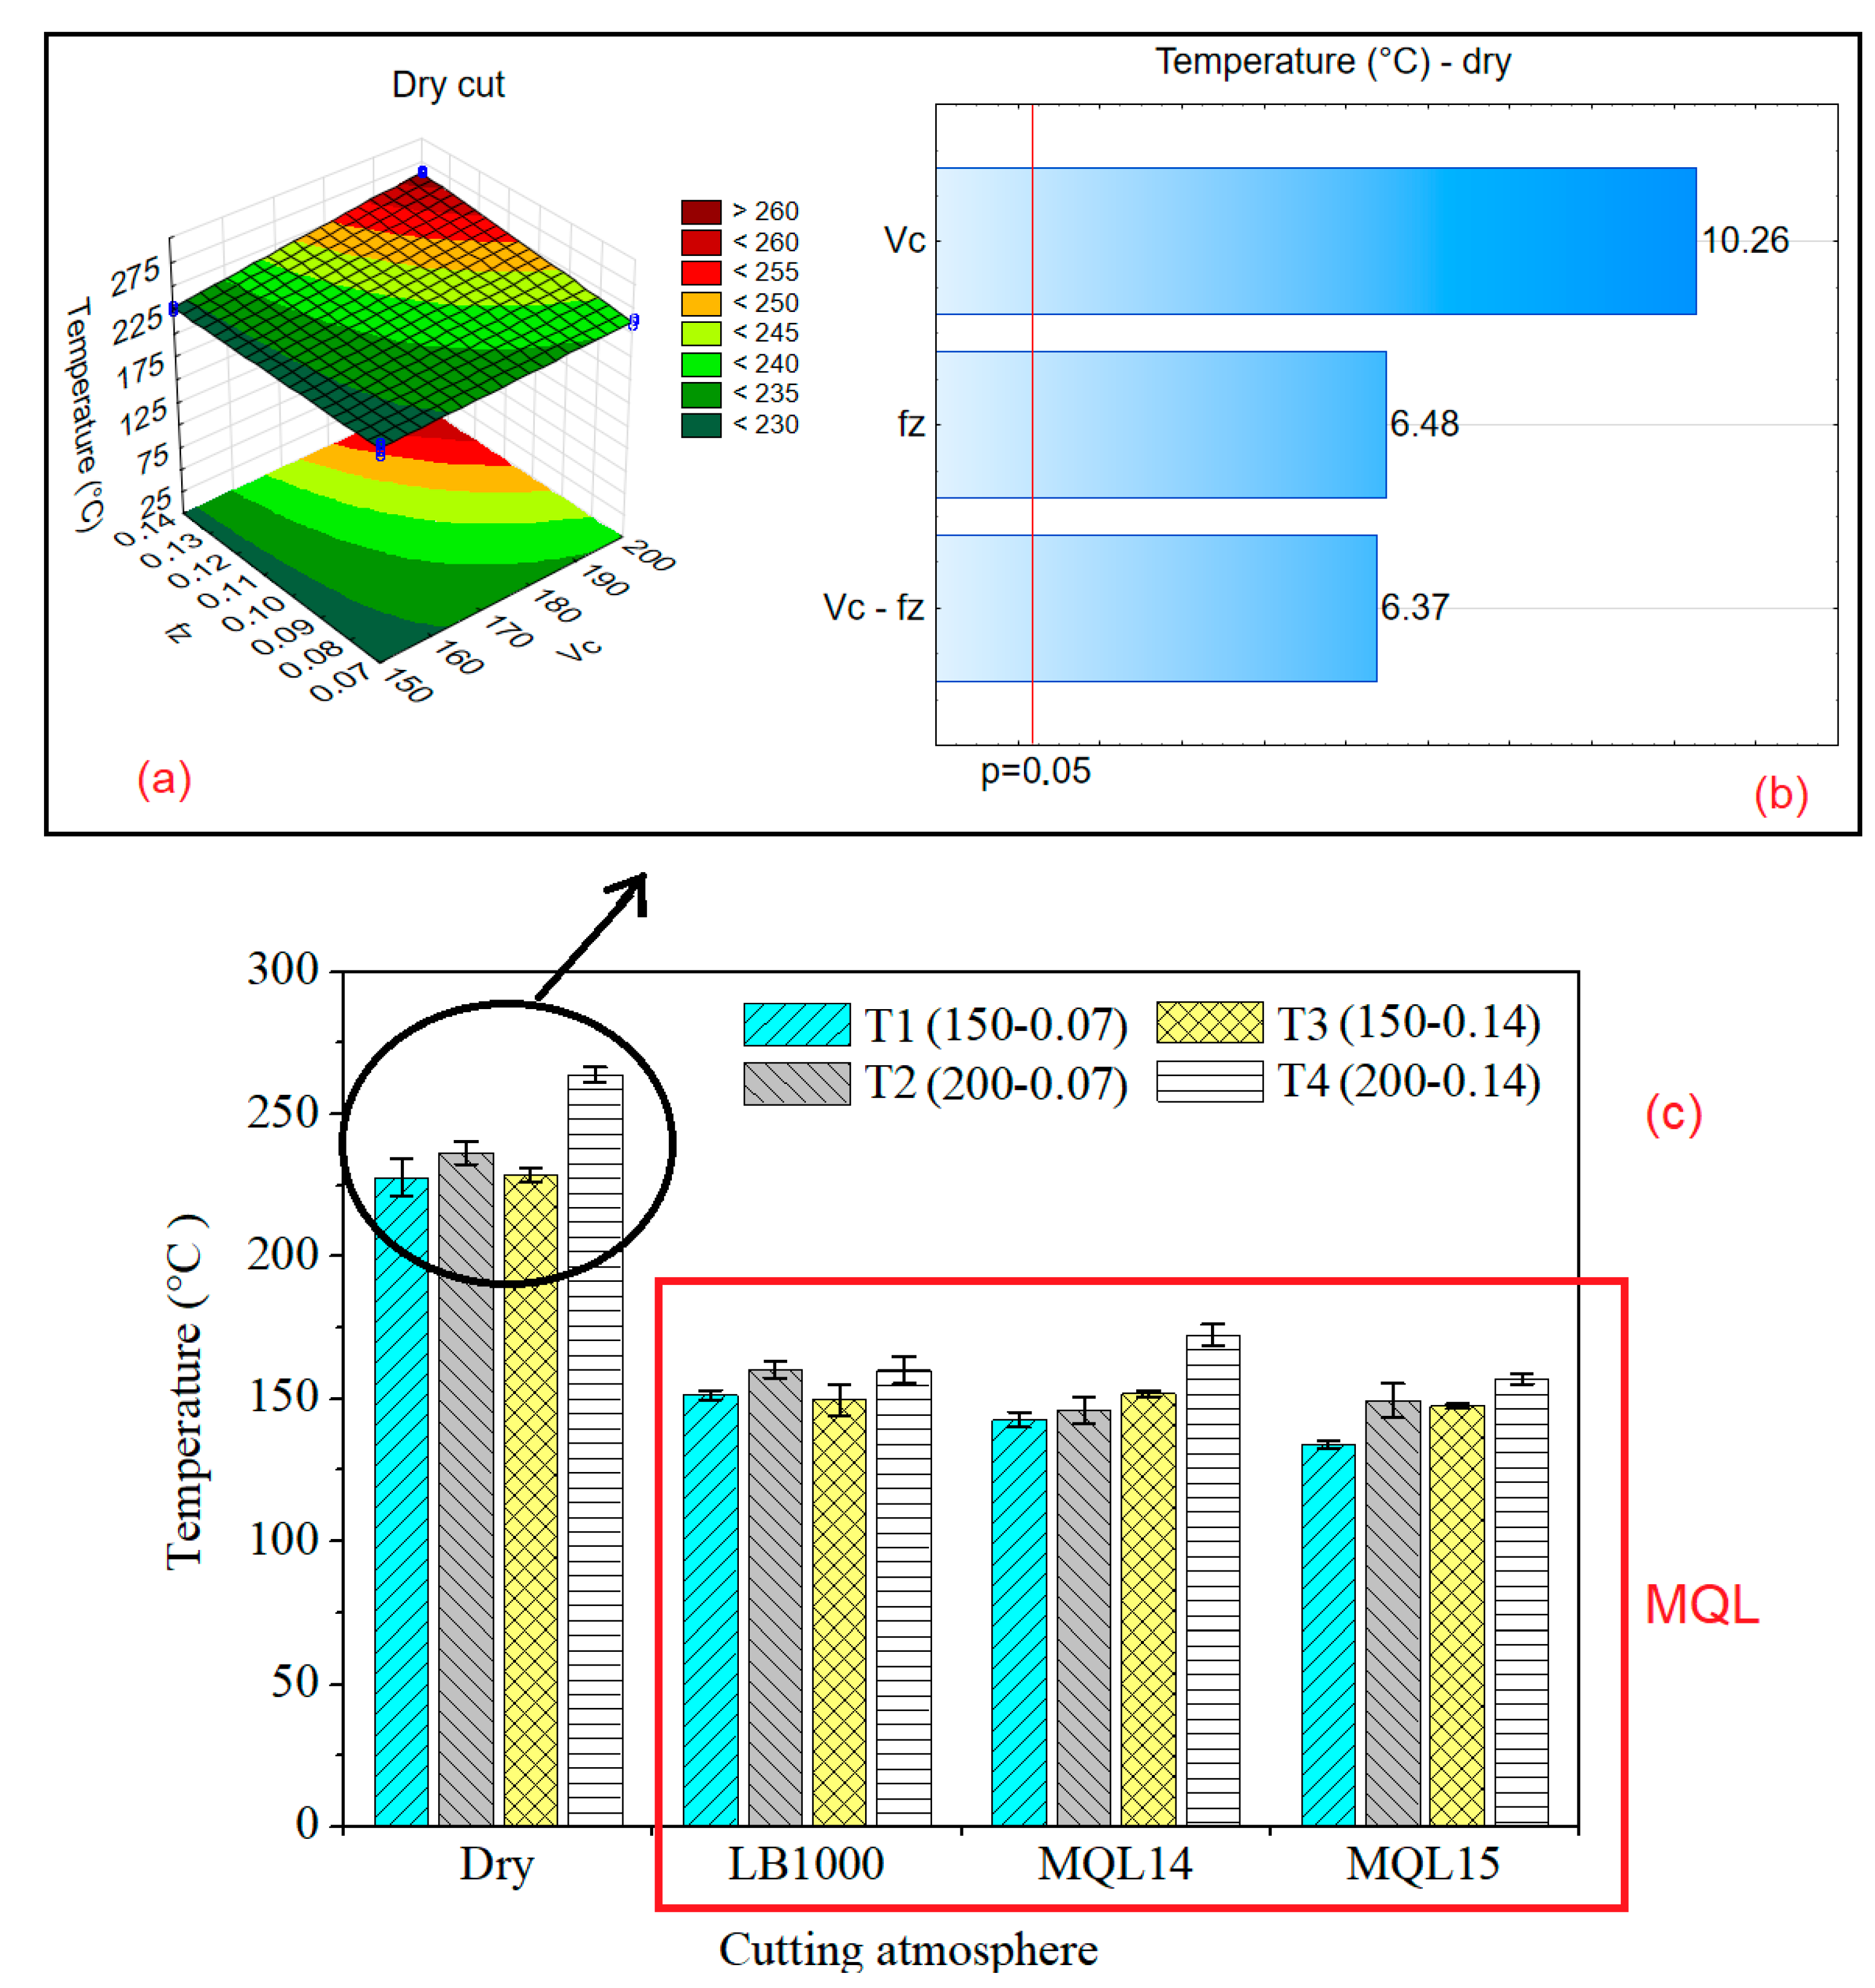
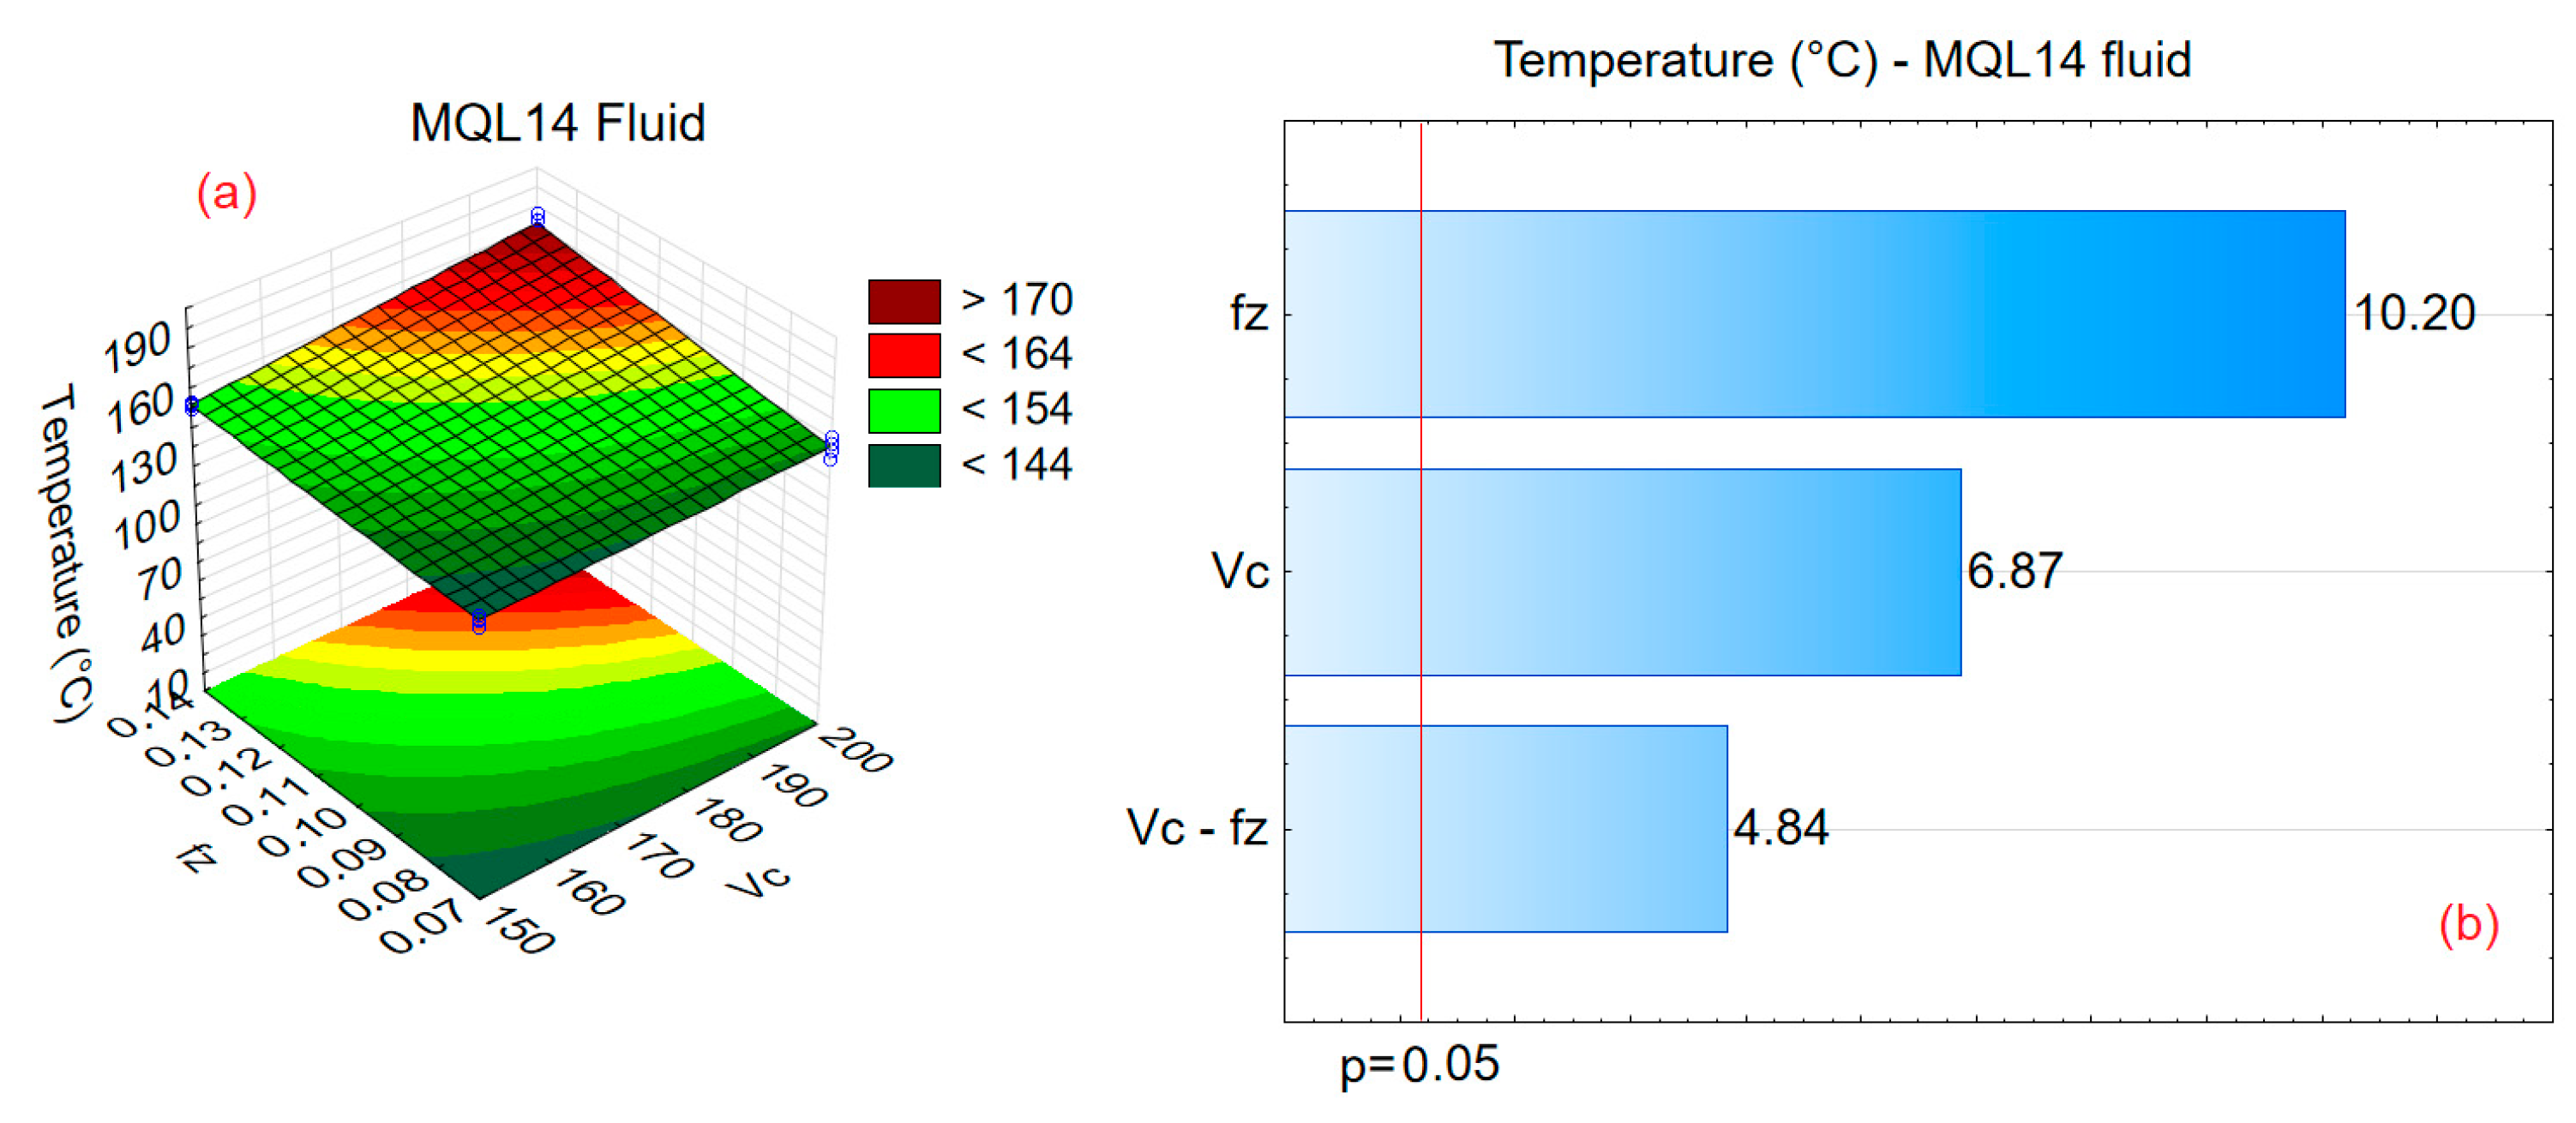
3.1. Cutting Temperature Measured by the Welded Thermocouples
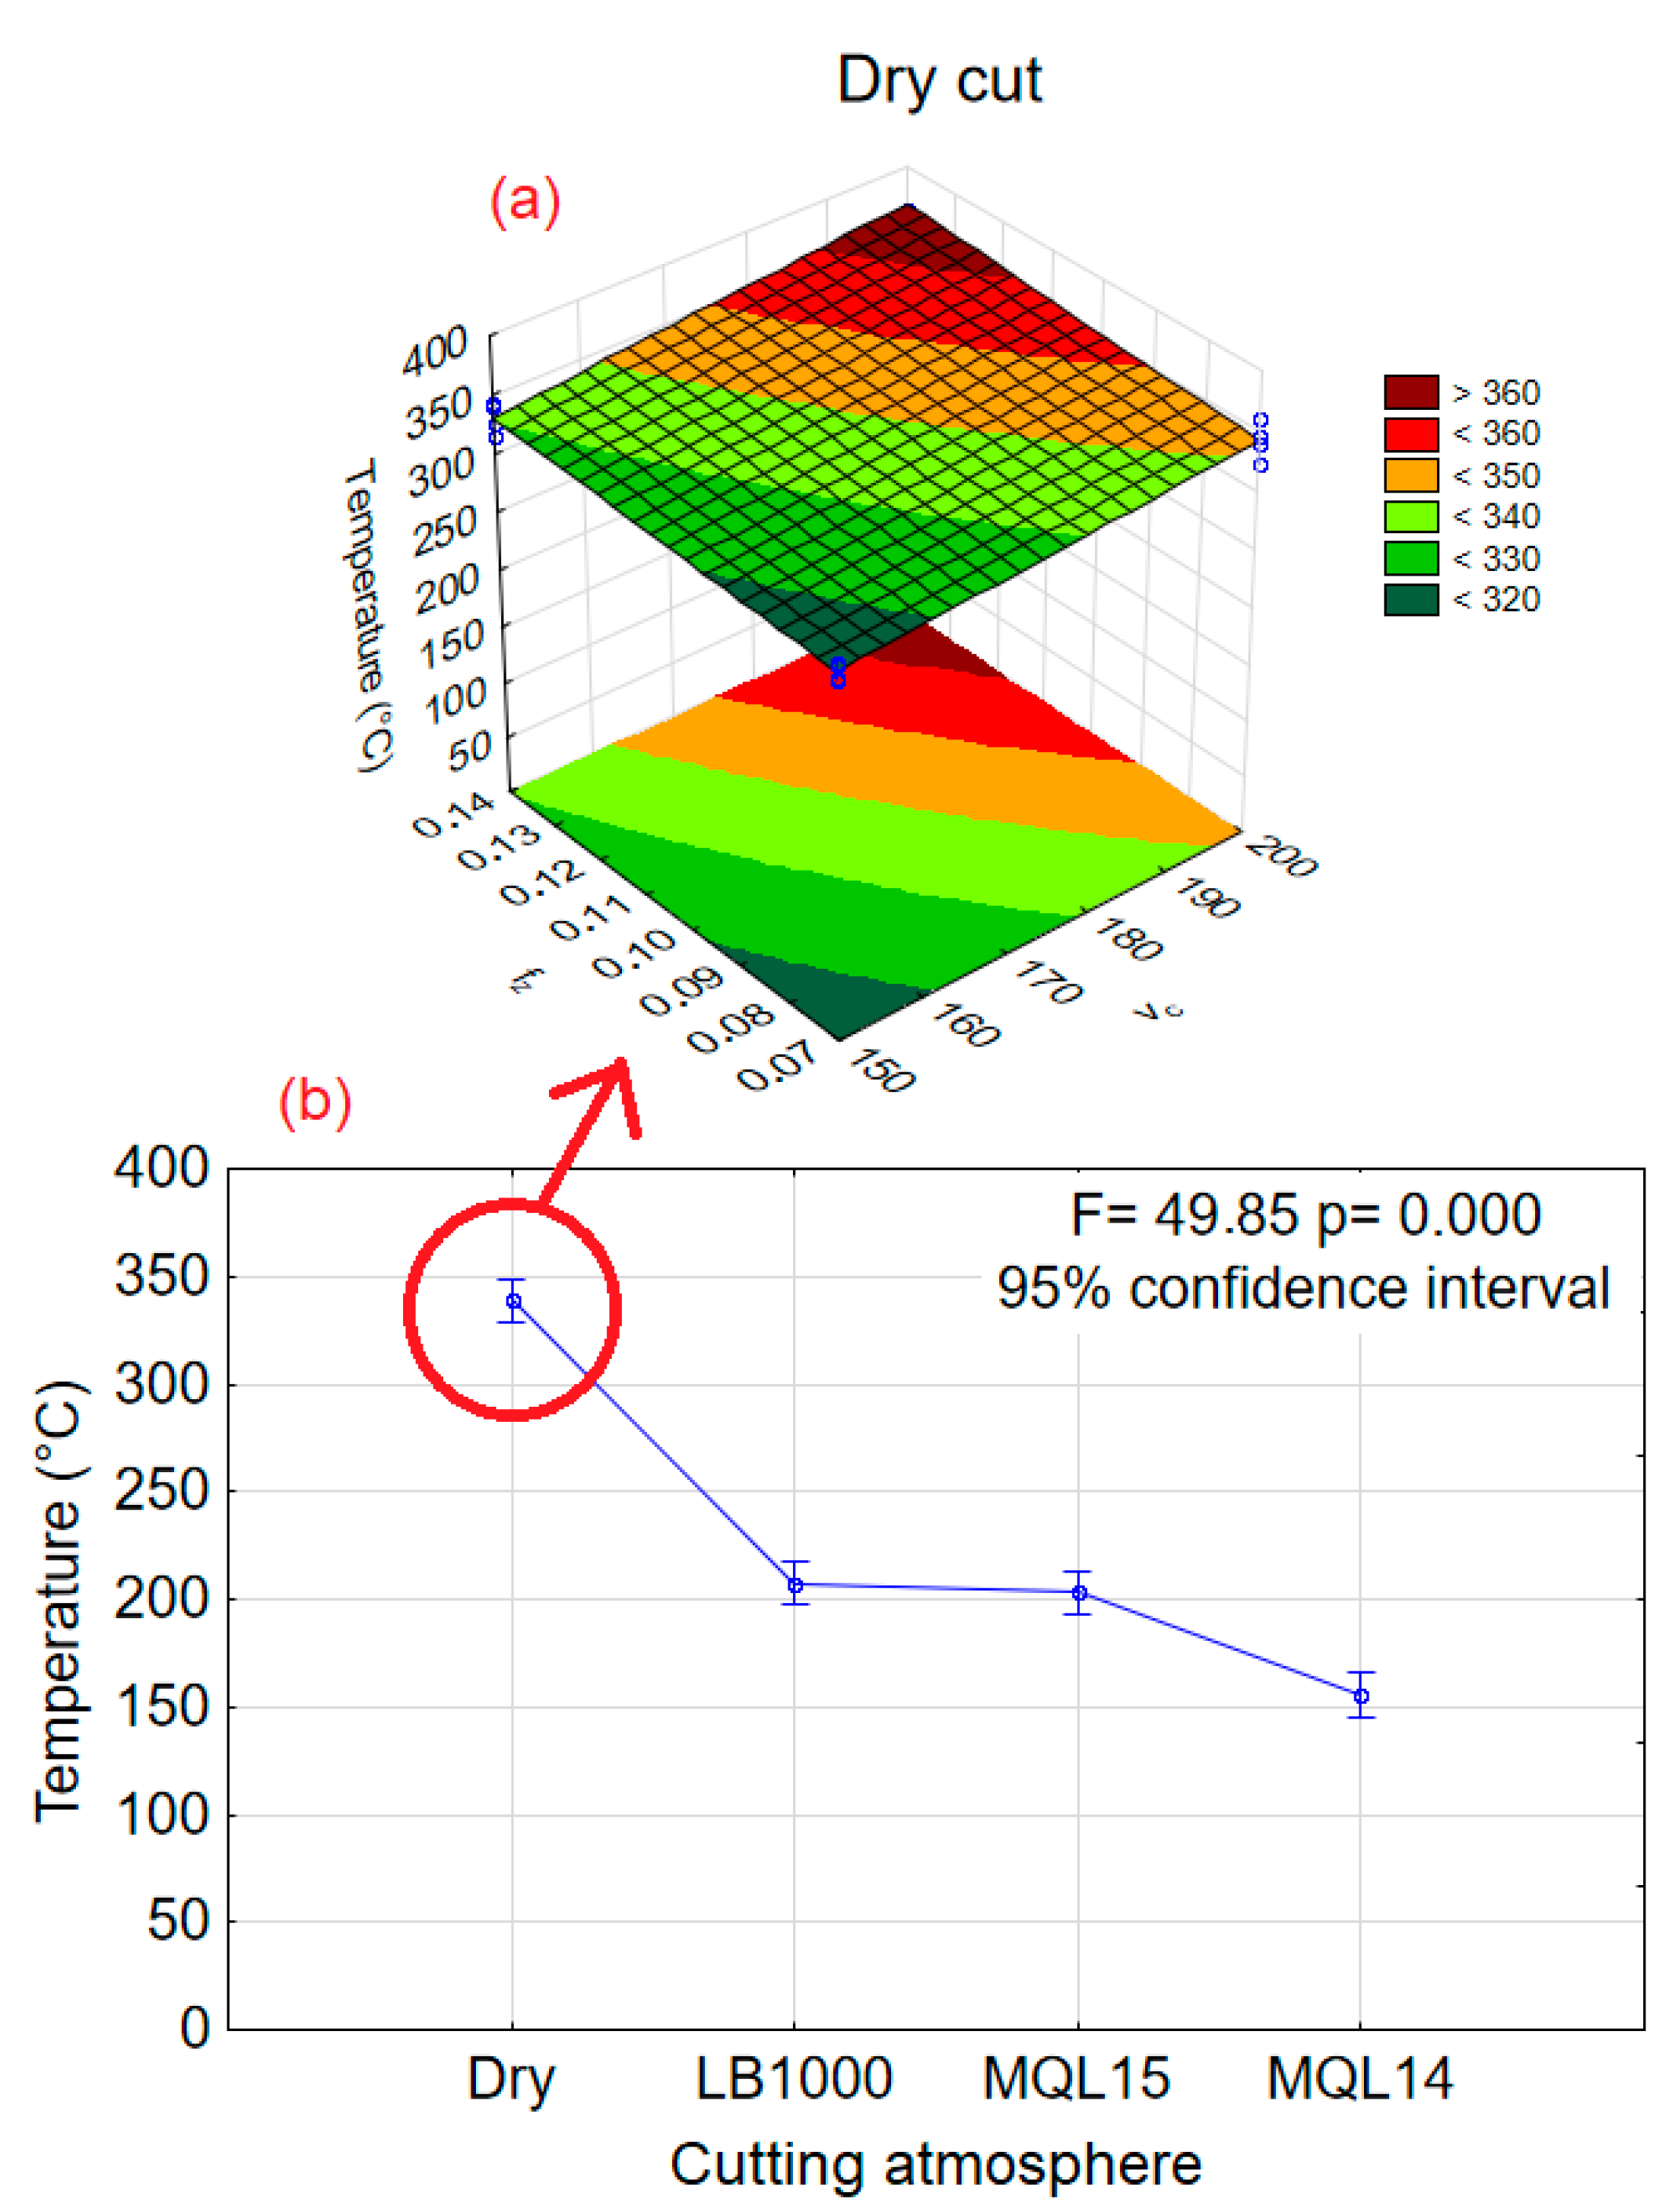
3.1.1. Cutting Temperature Measured by the Infrared Camera
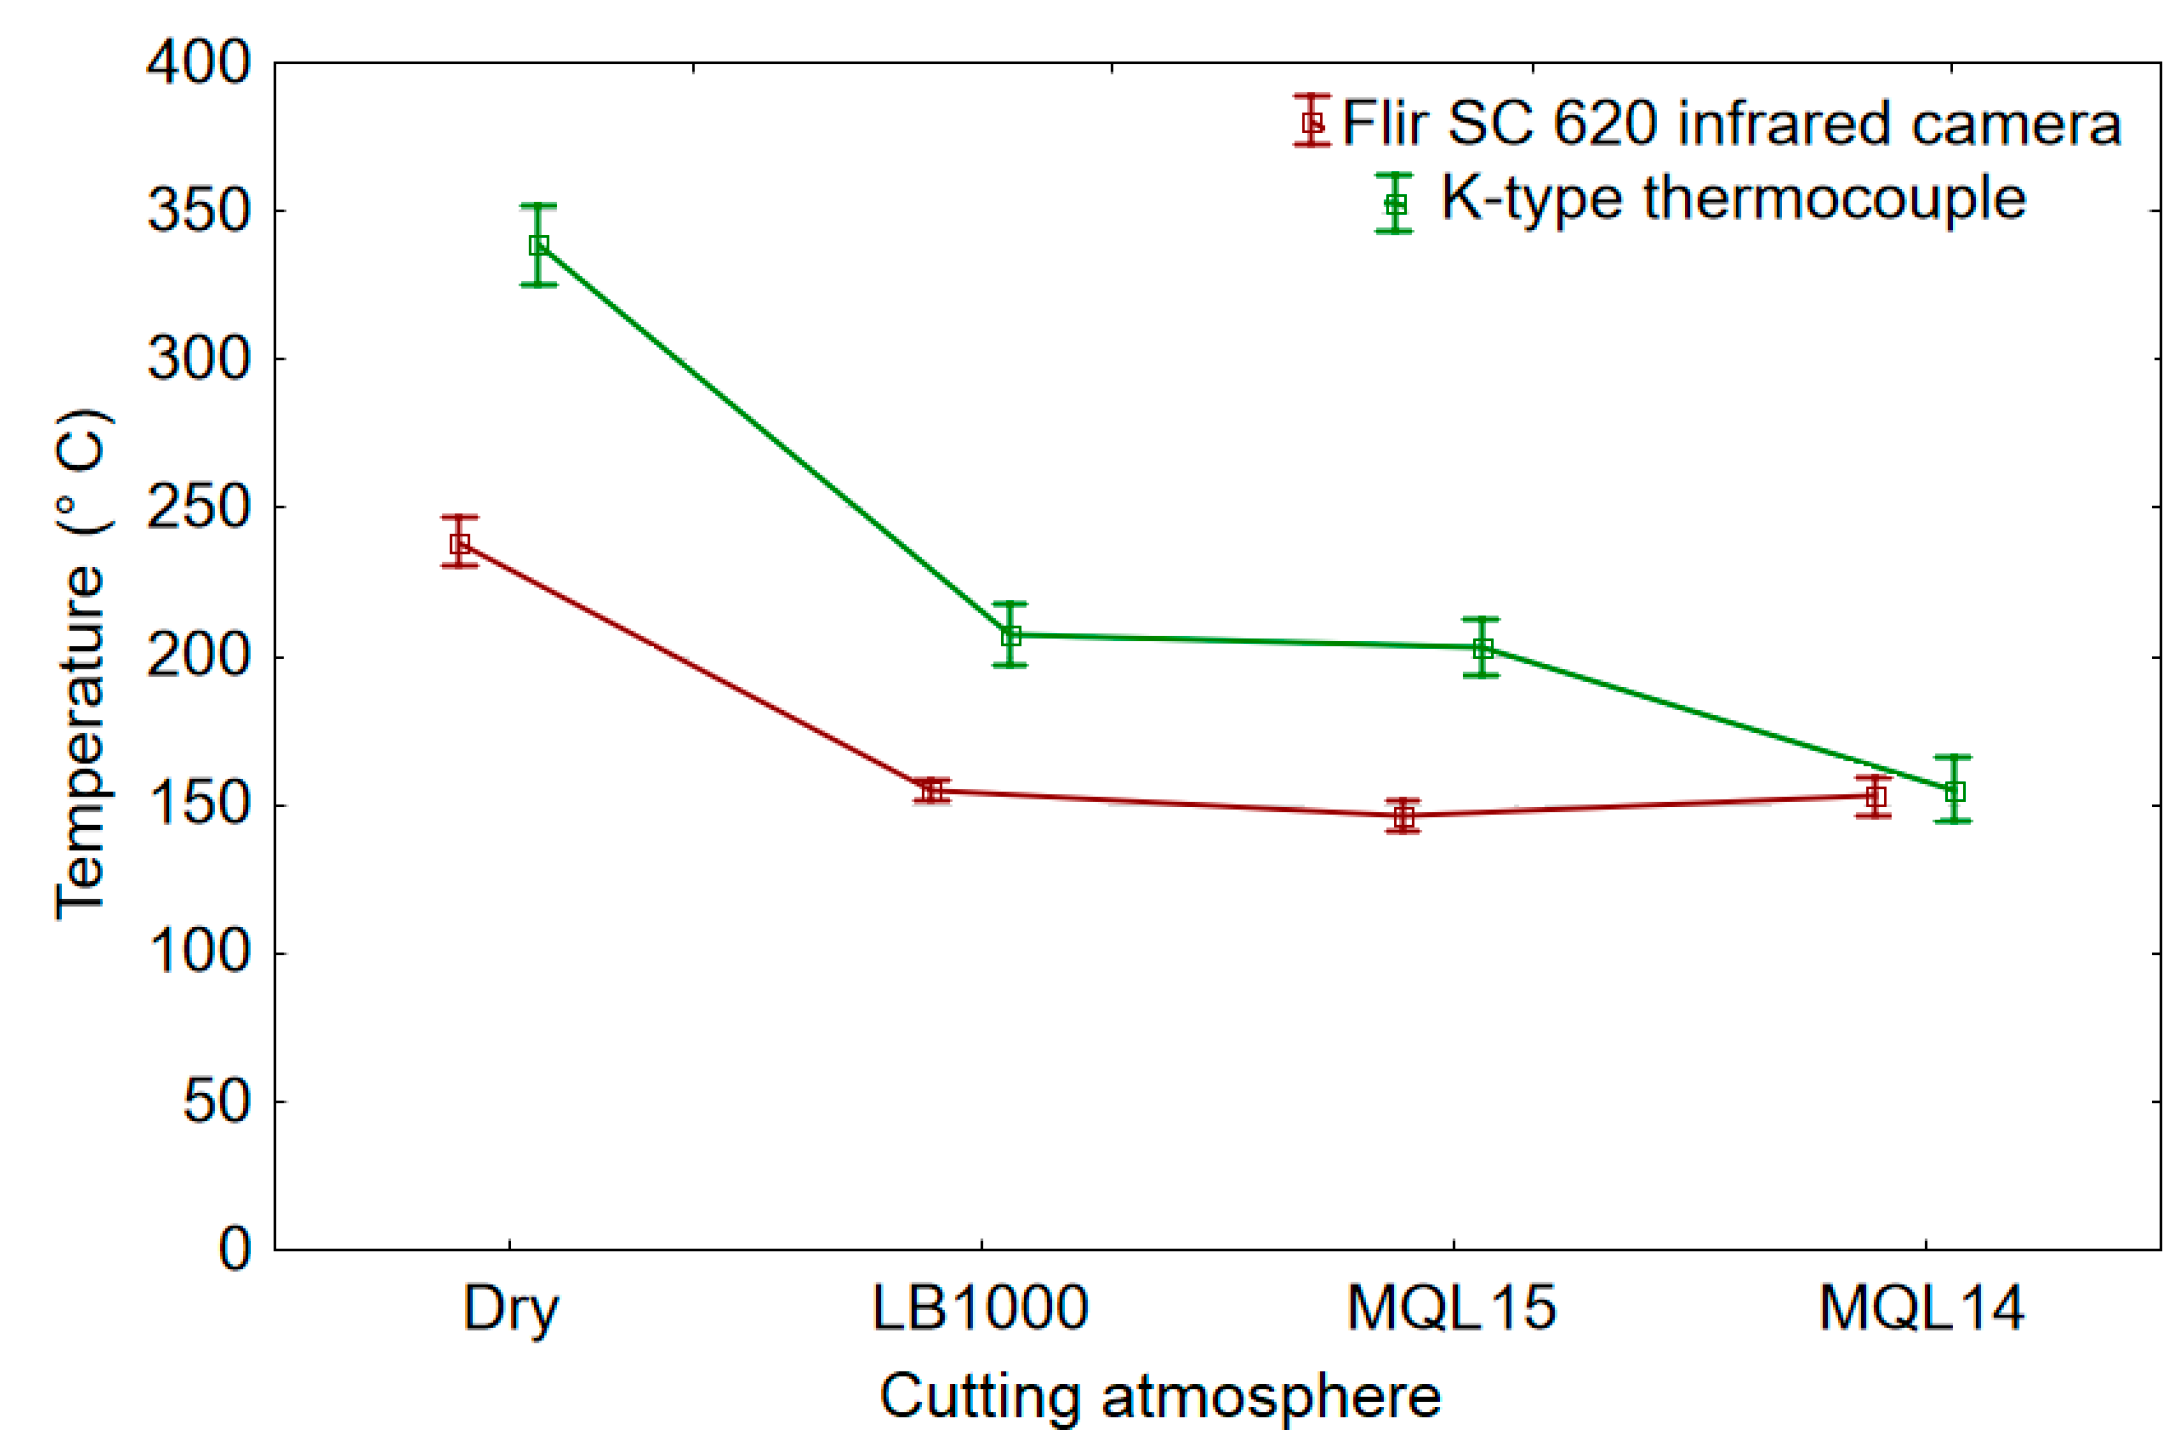
3.1.2. Comparison of the Two Temperature Measurement Methods
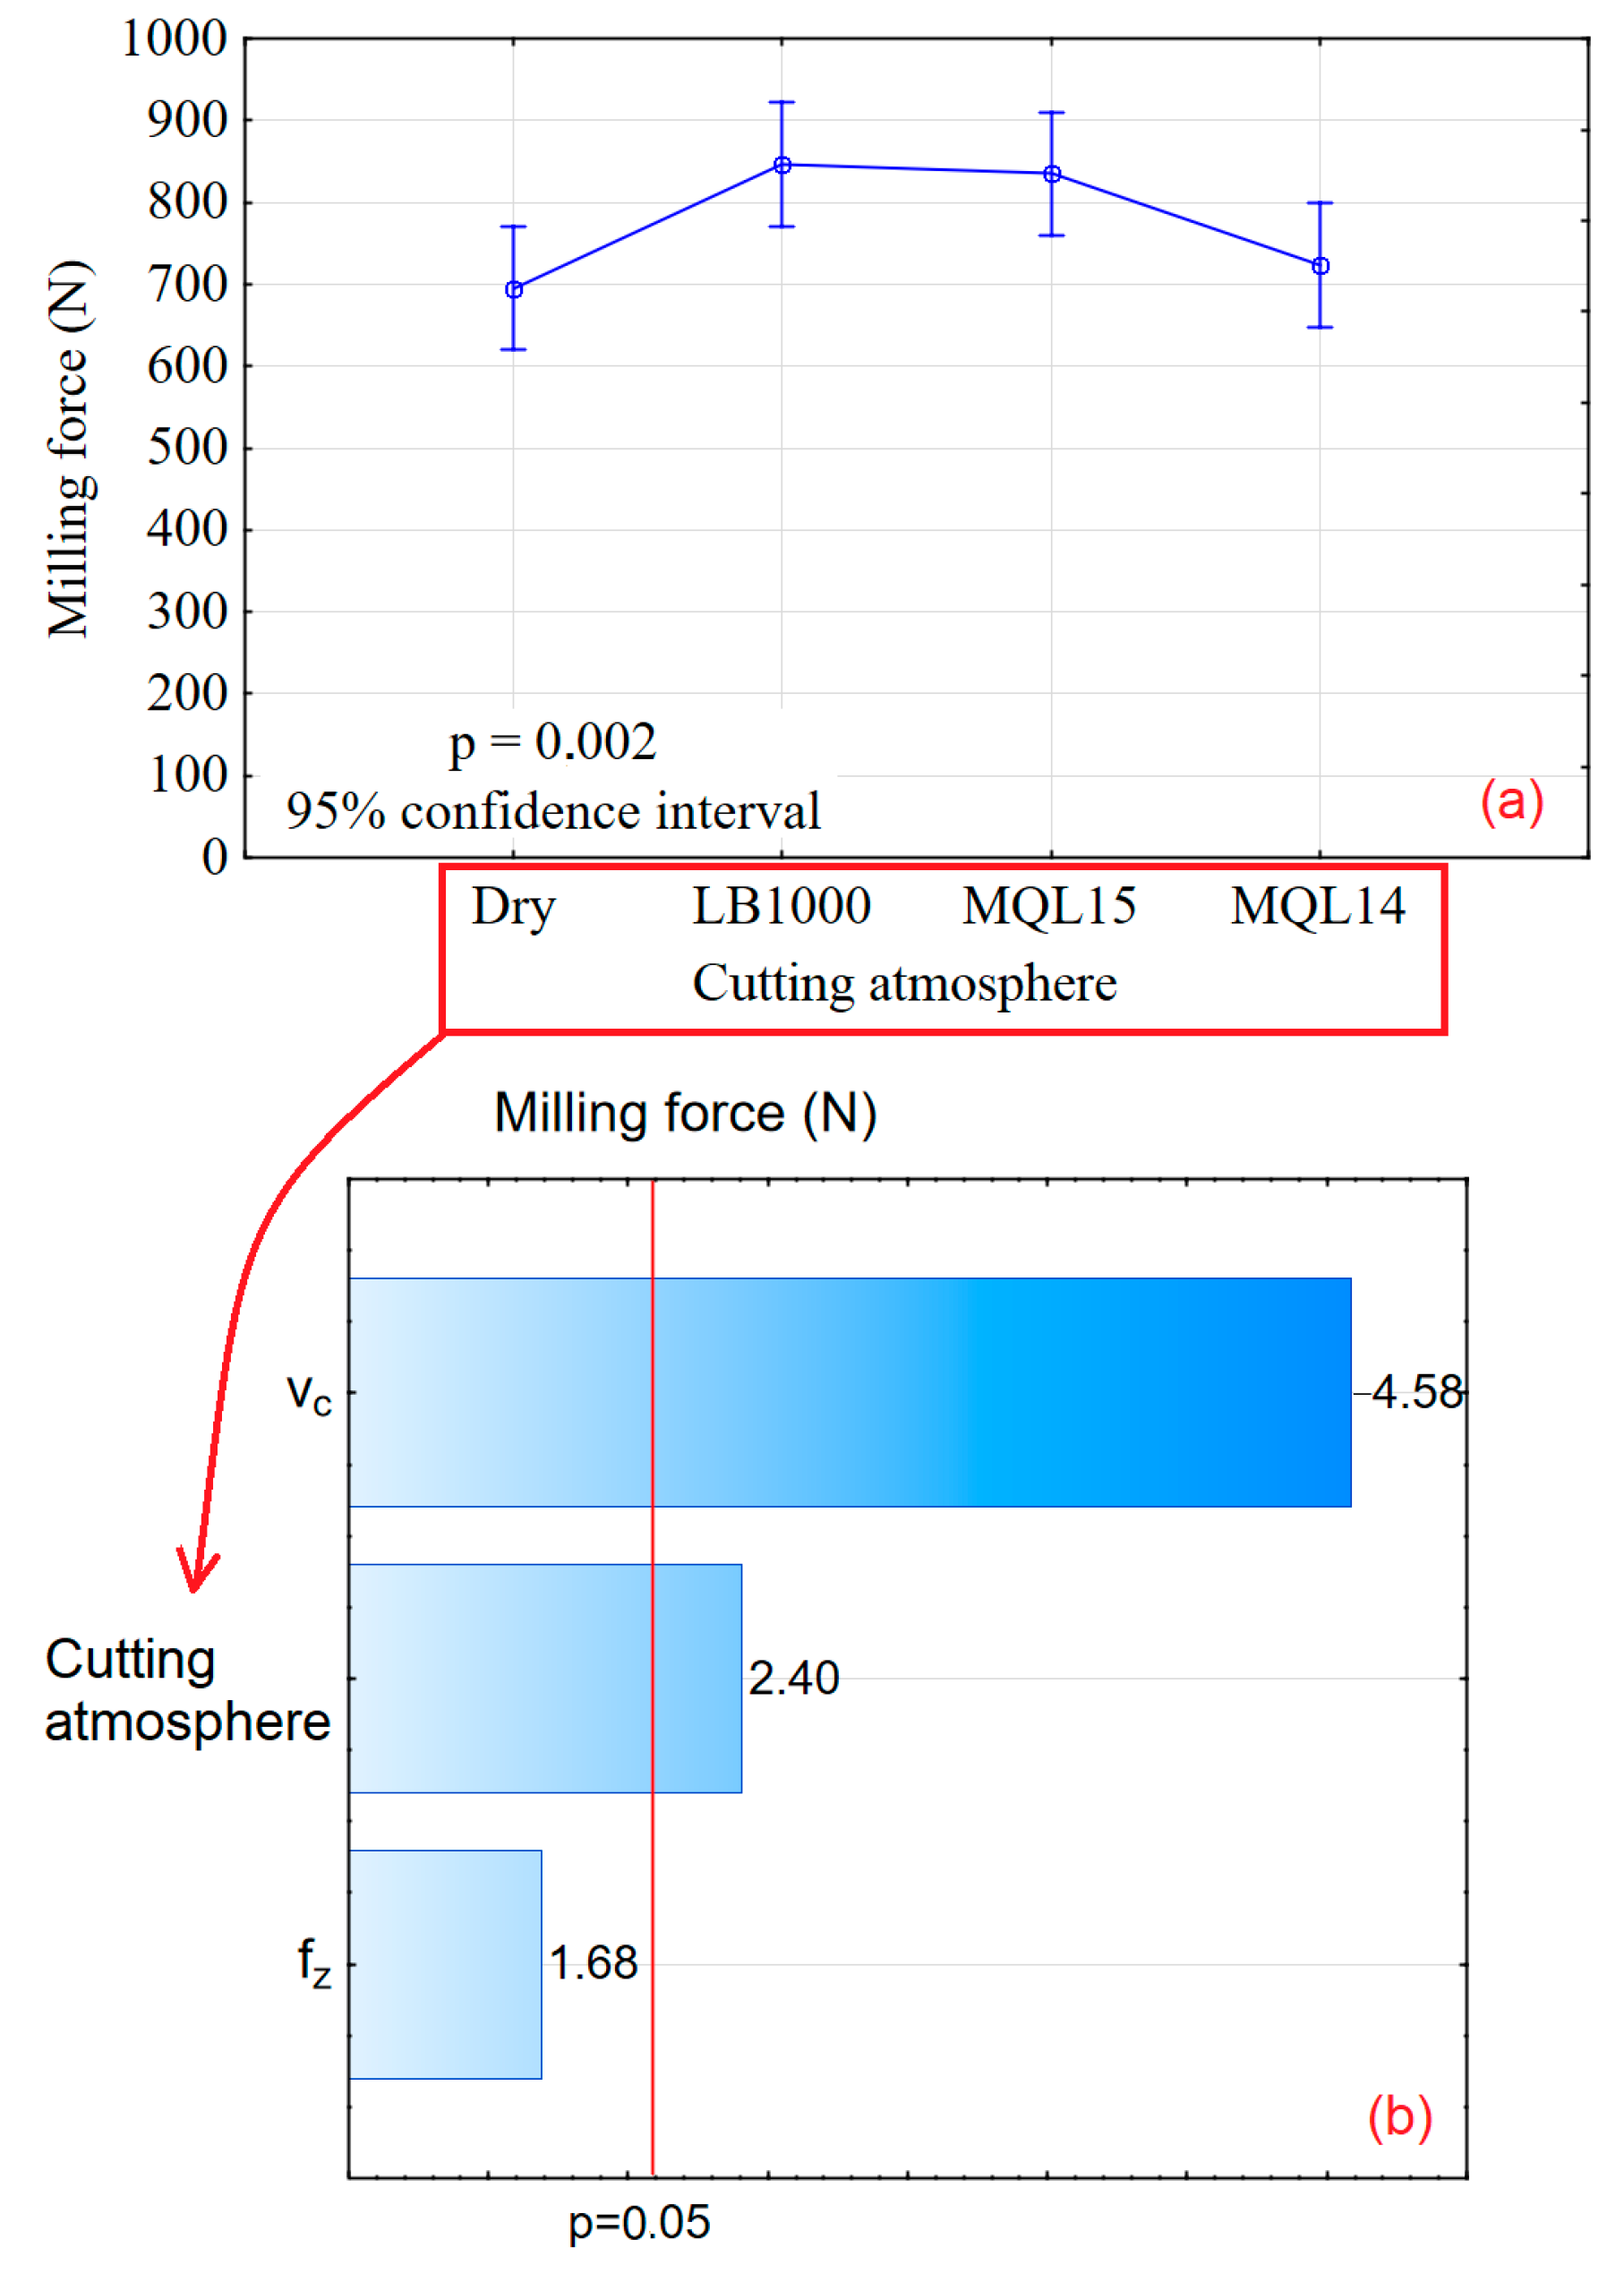
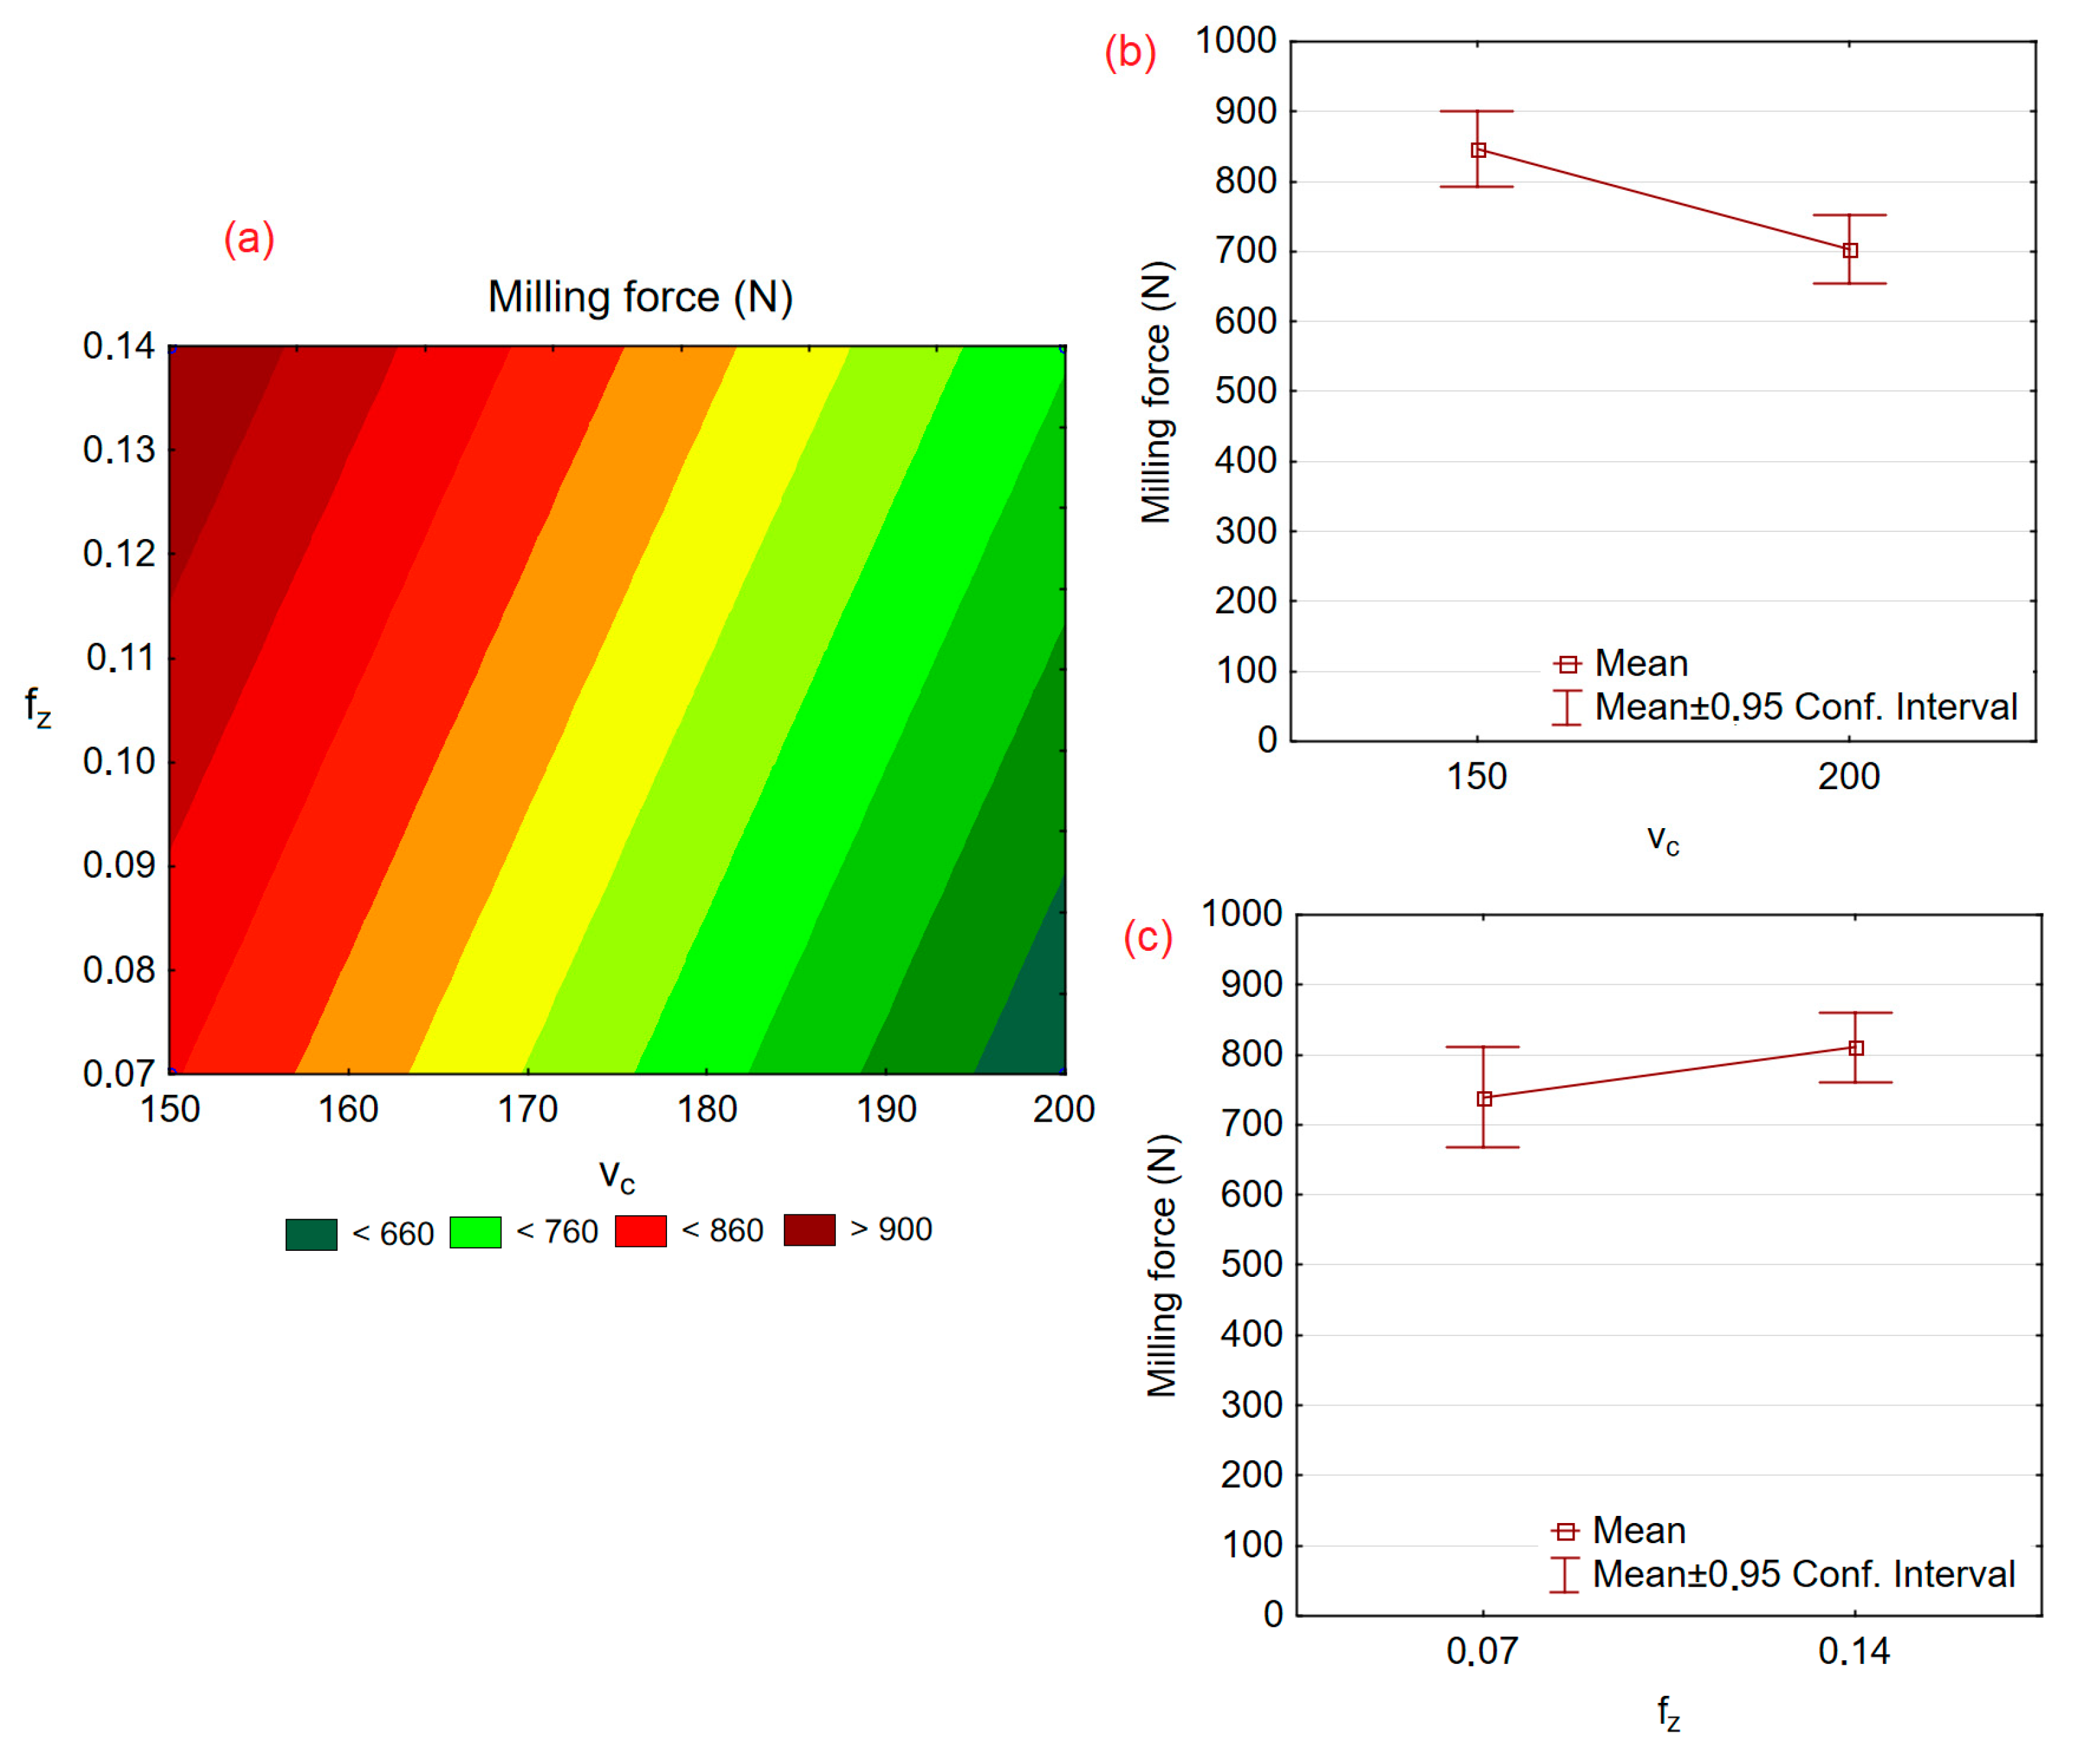
3.2. Machining Force
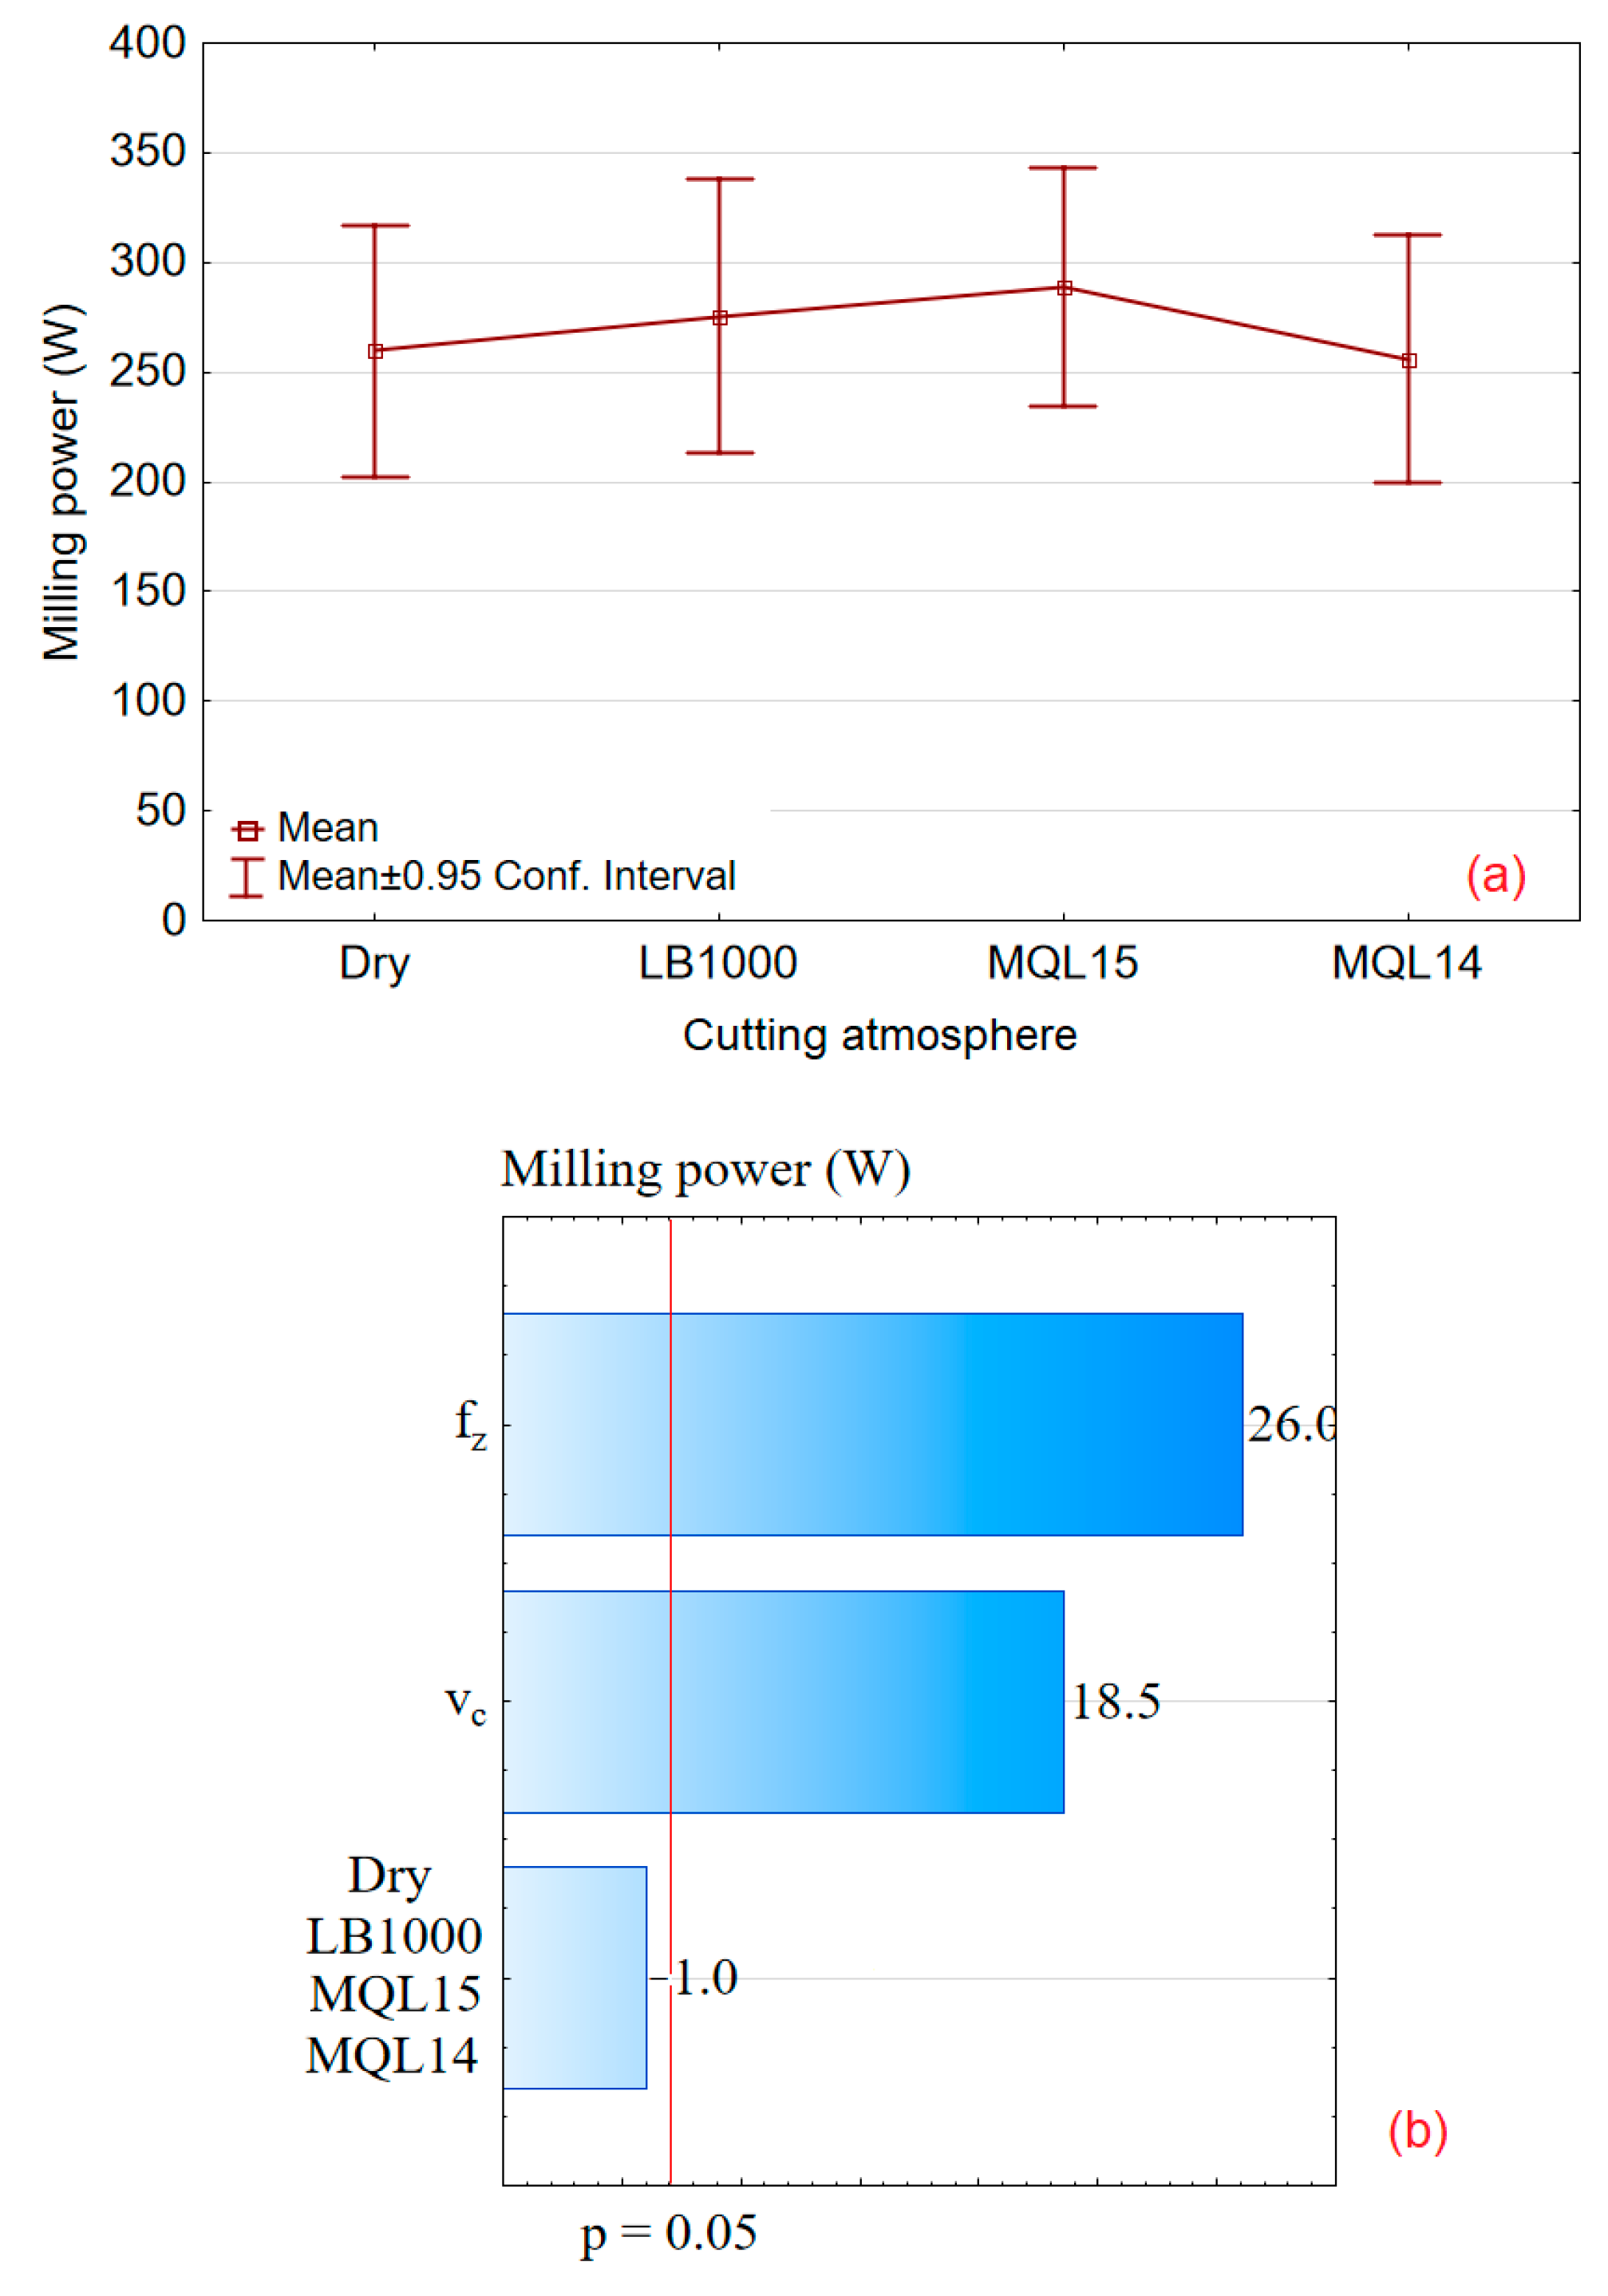
3.3. Machining Power
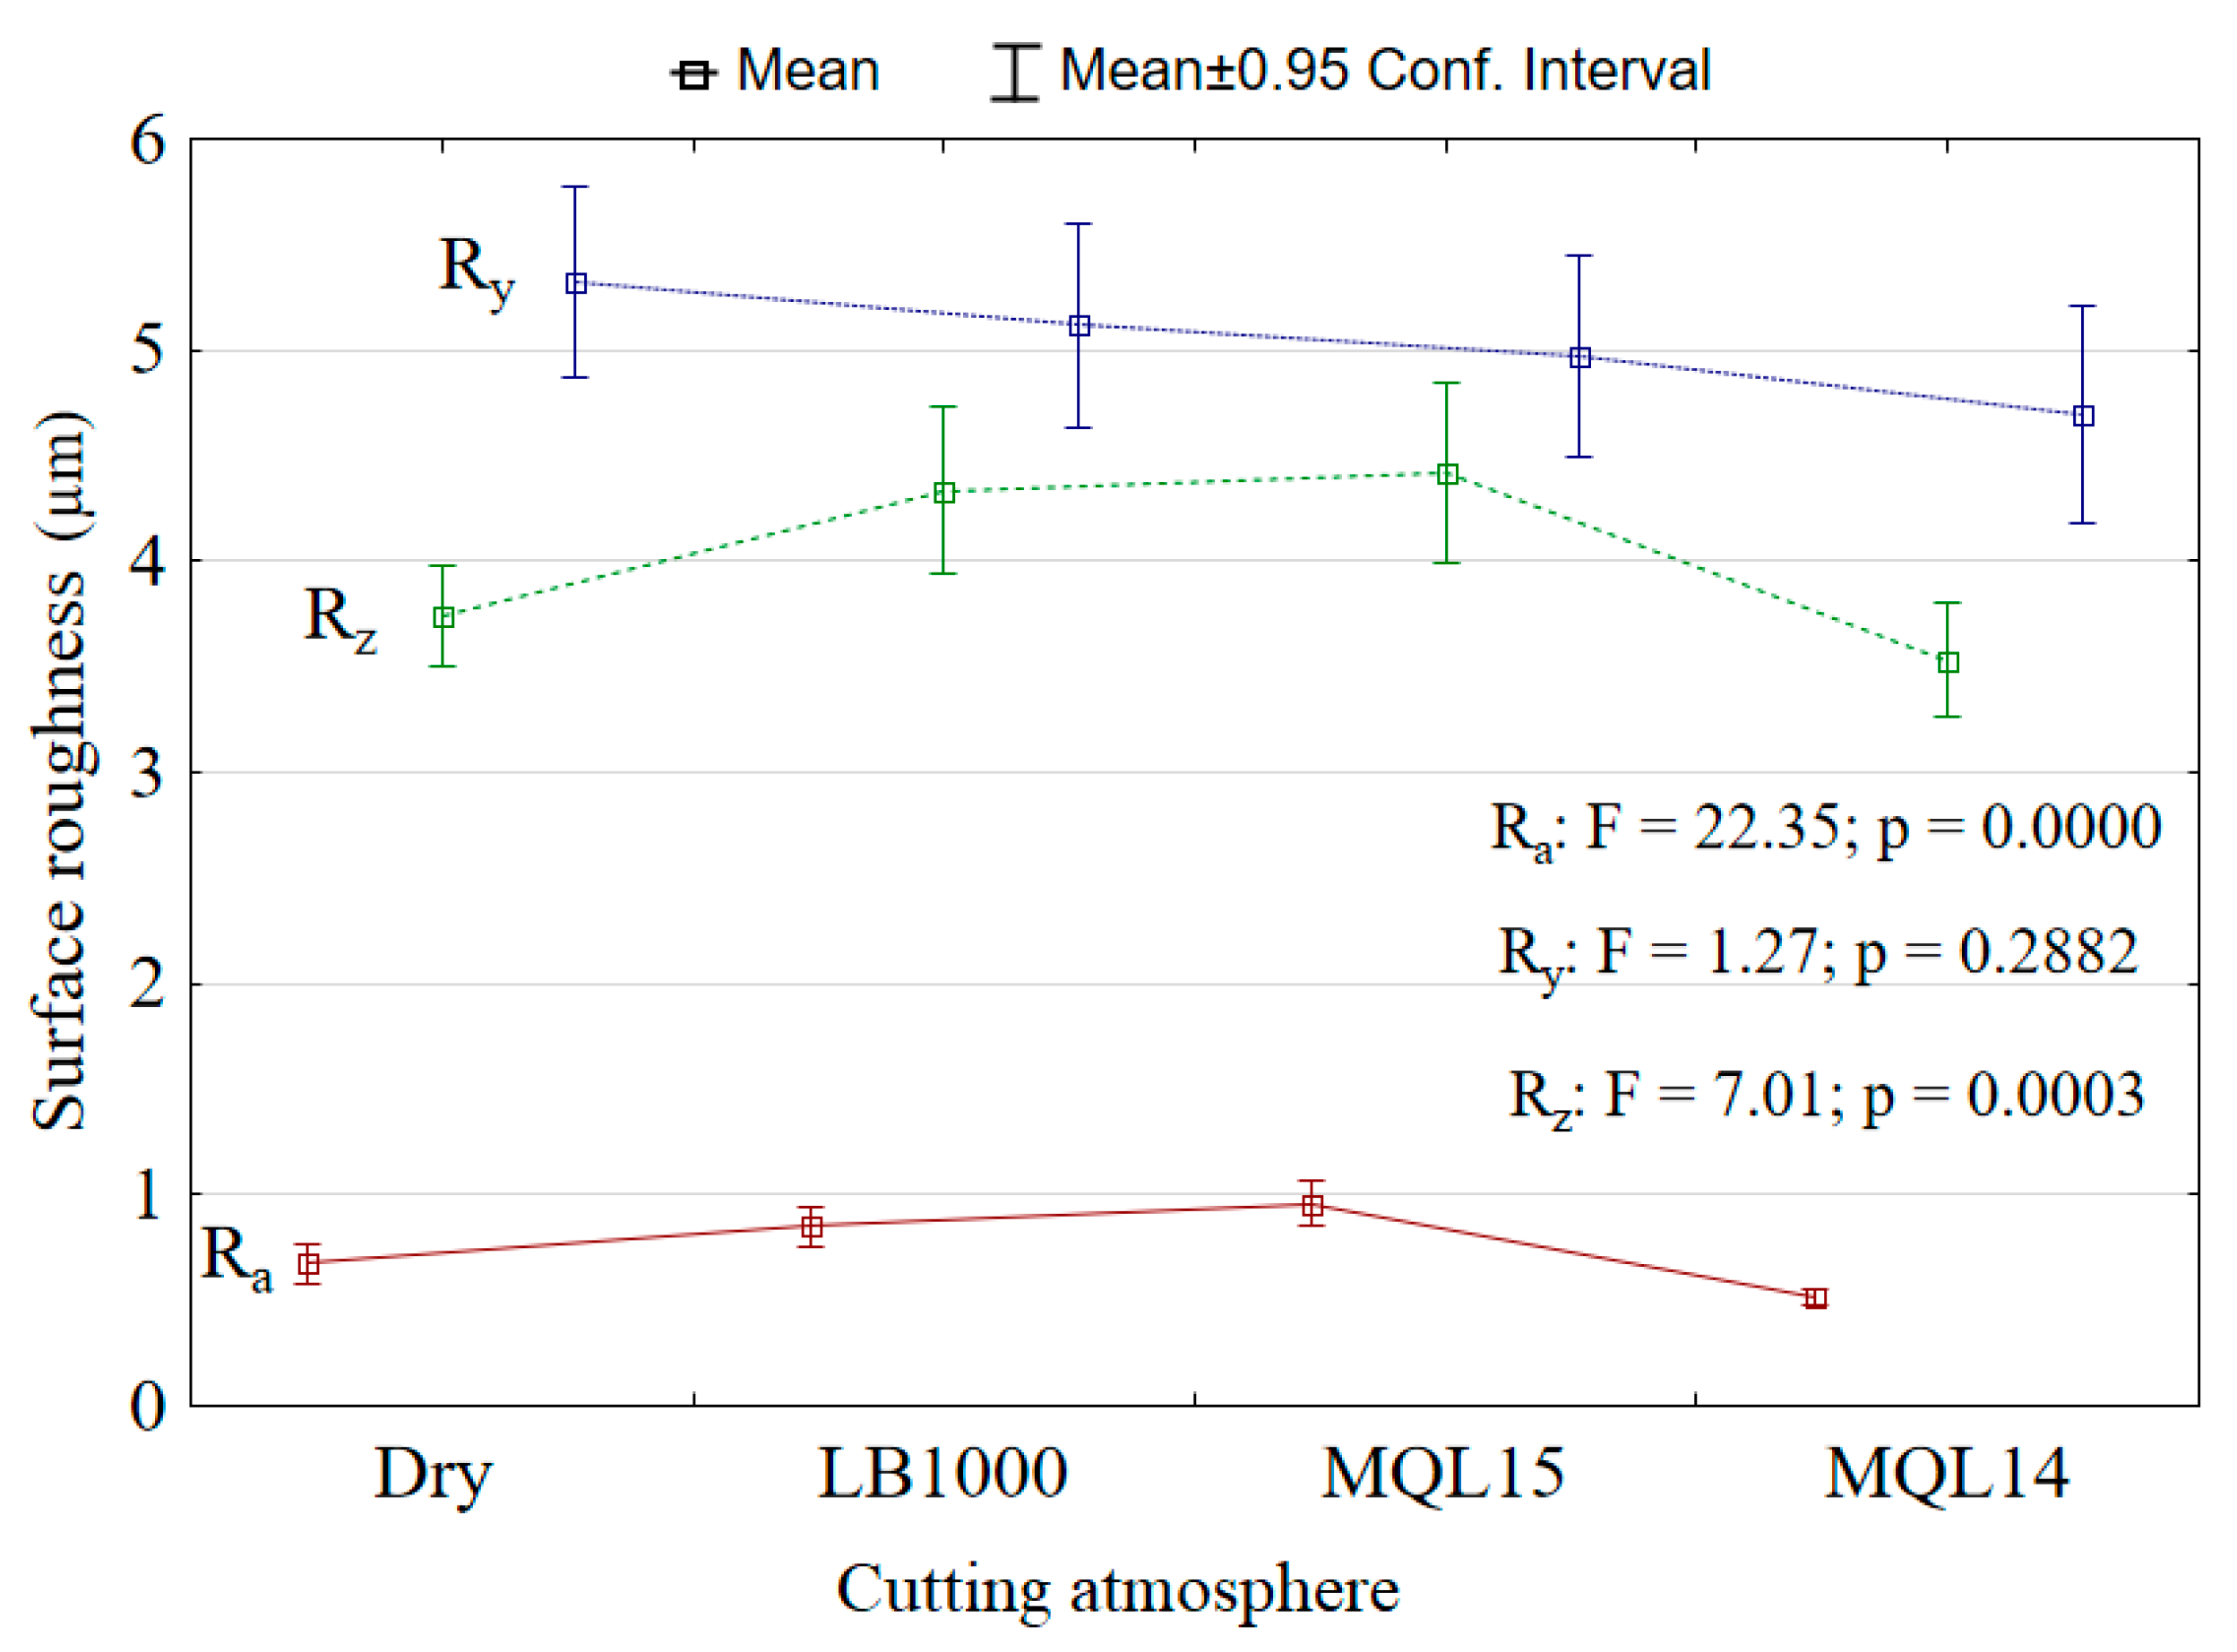
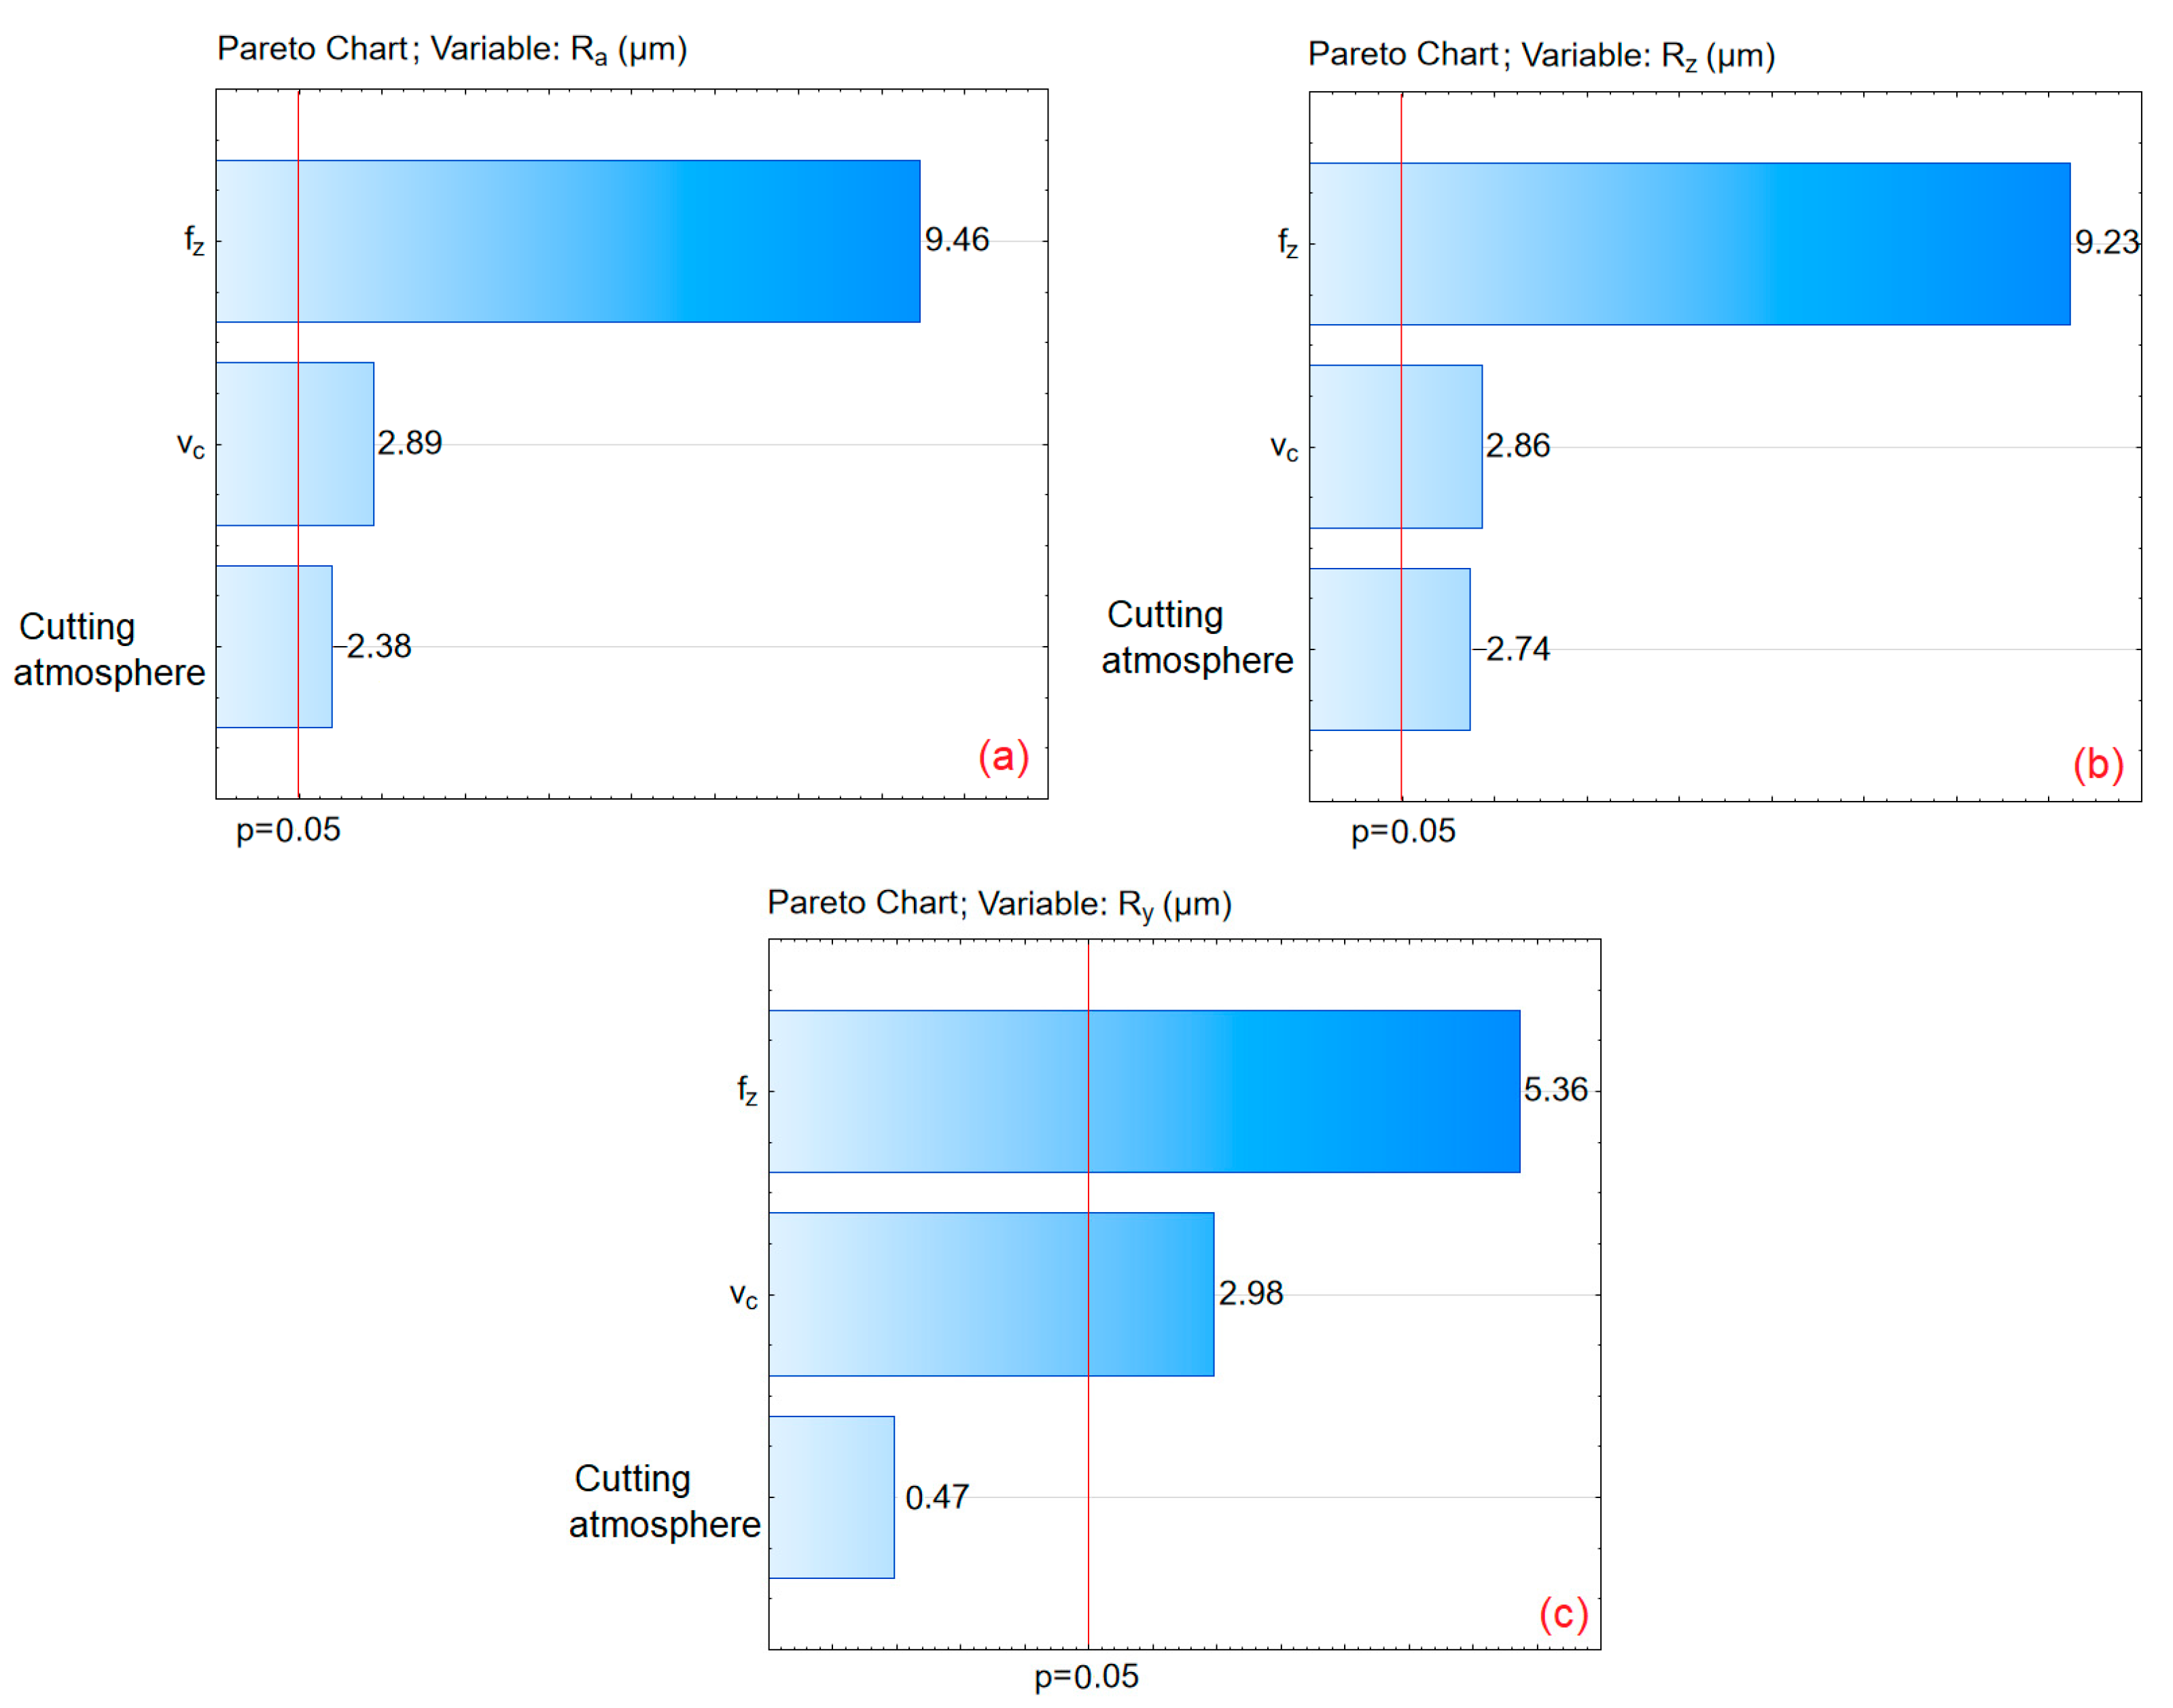
3.4. Surface Roughness
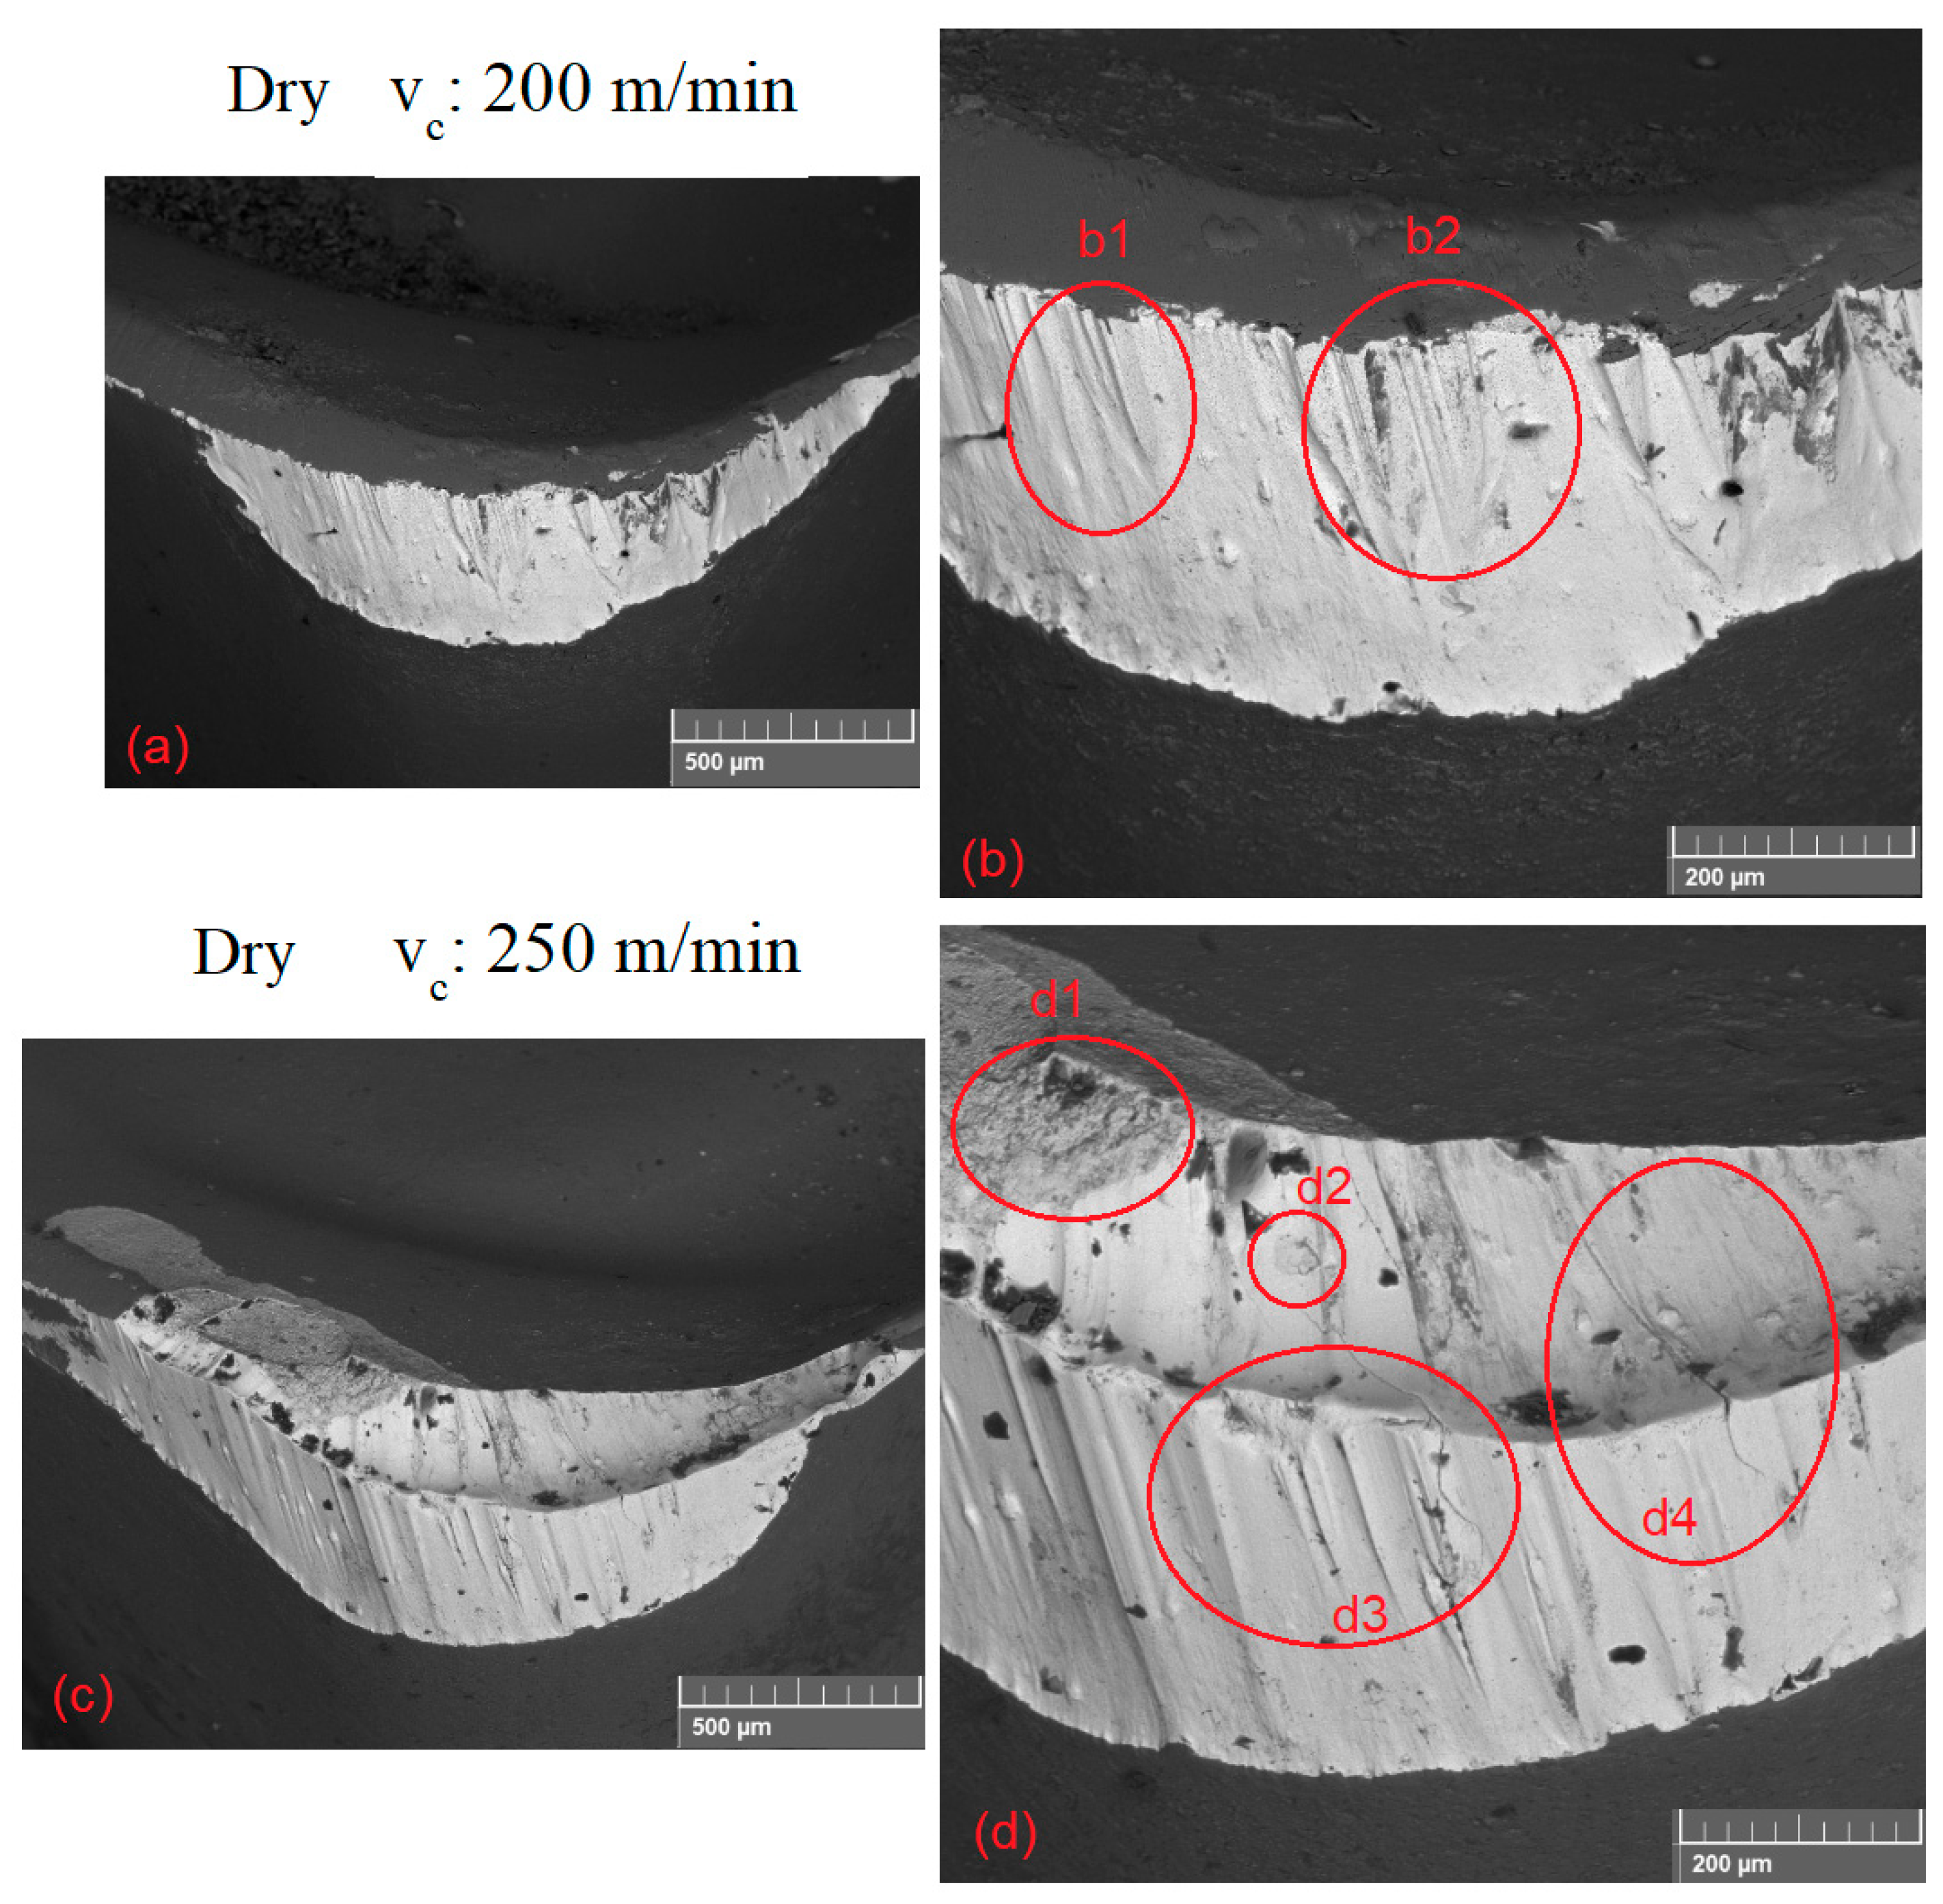
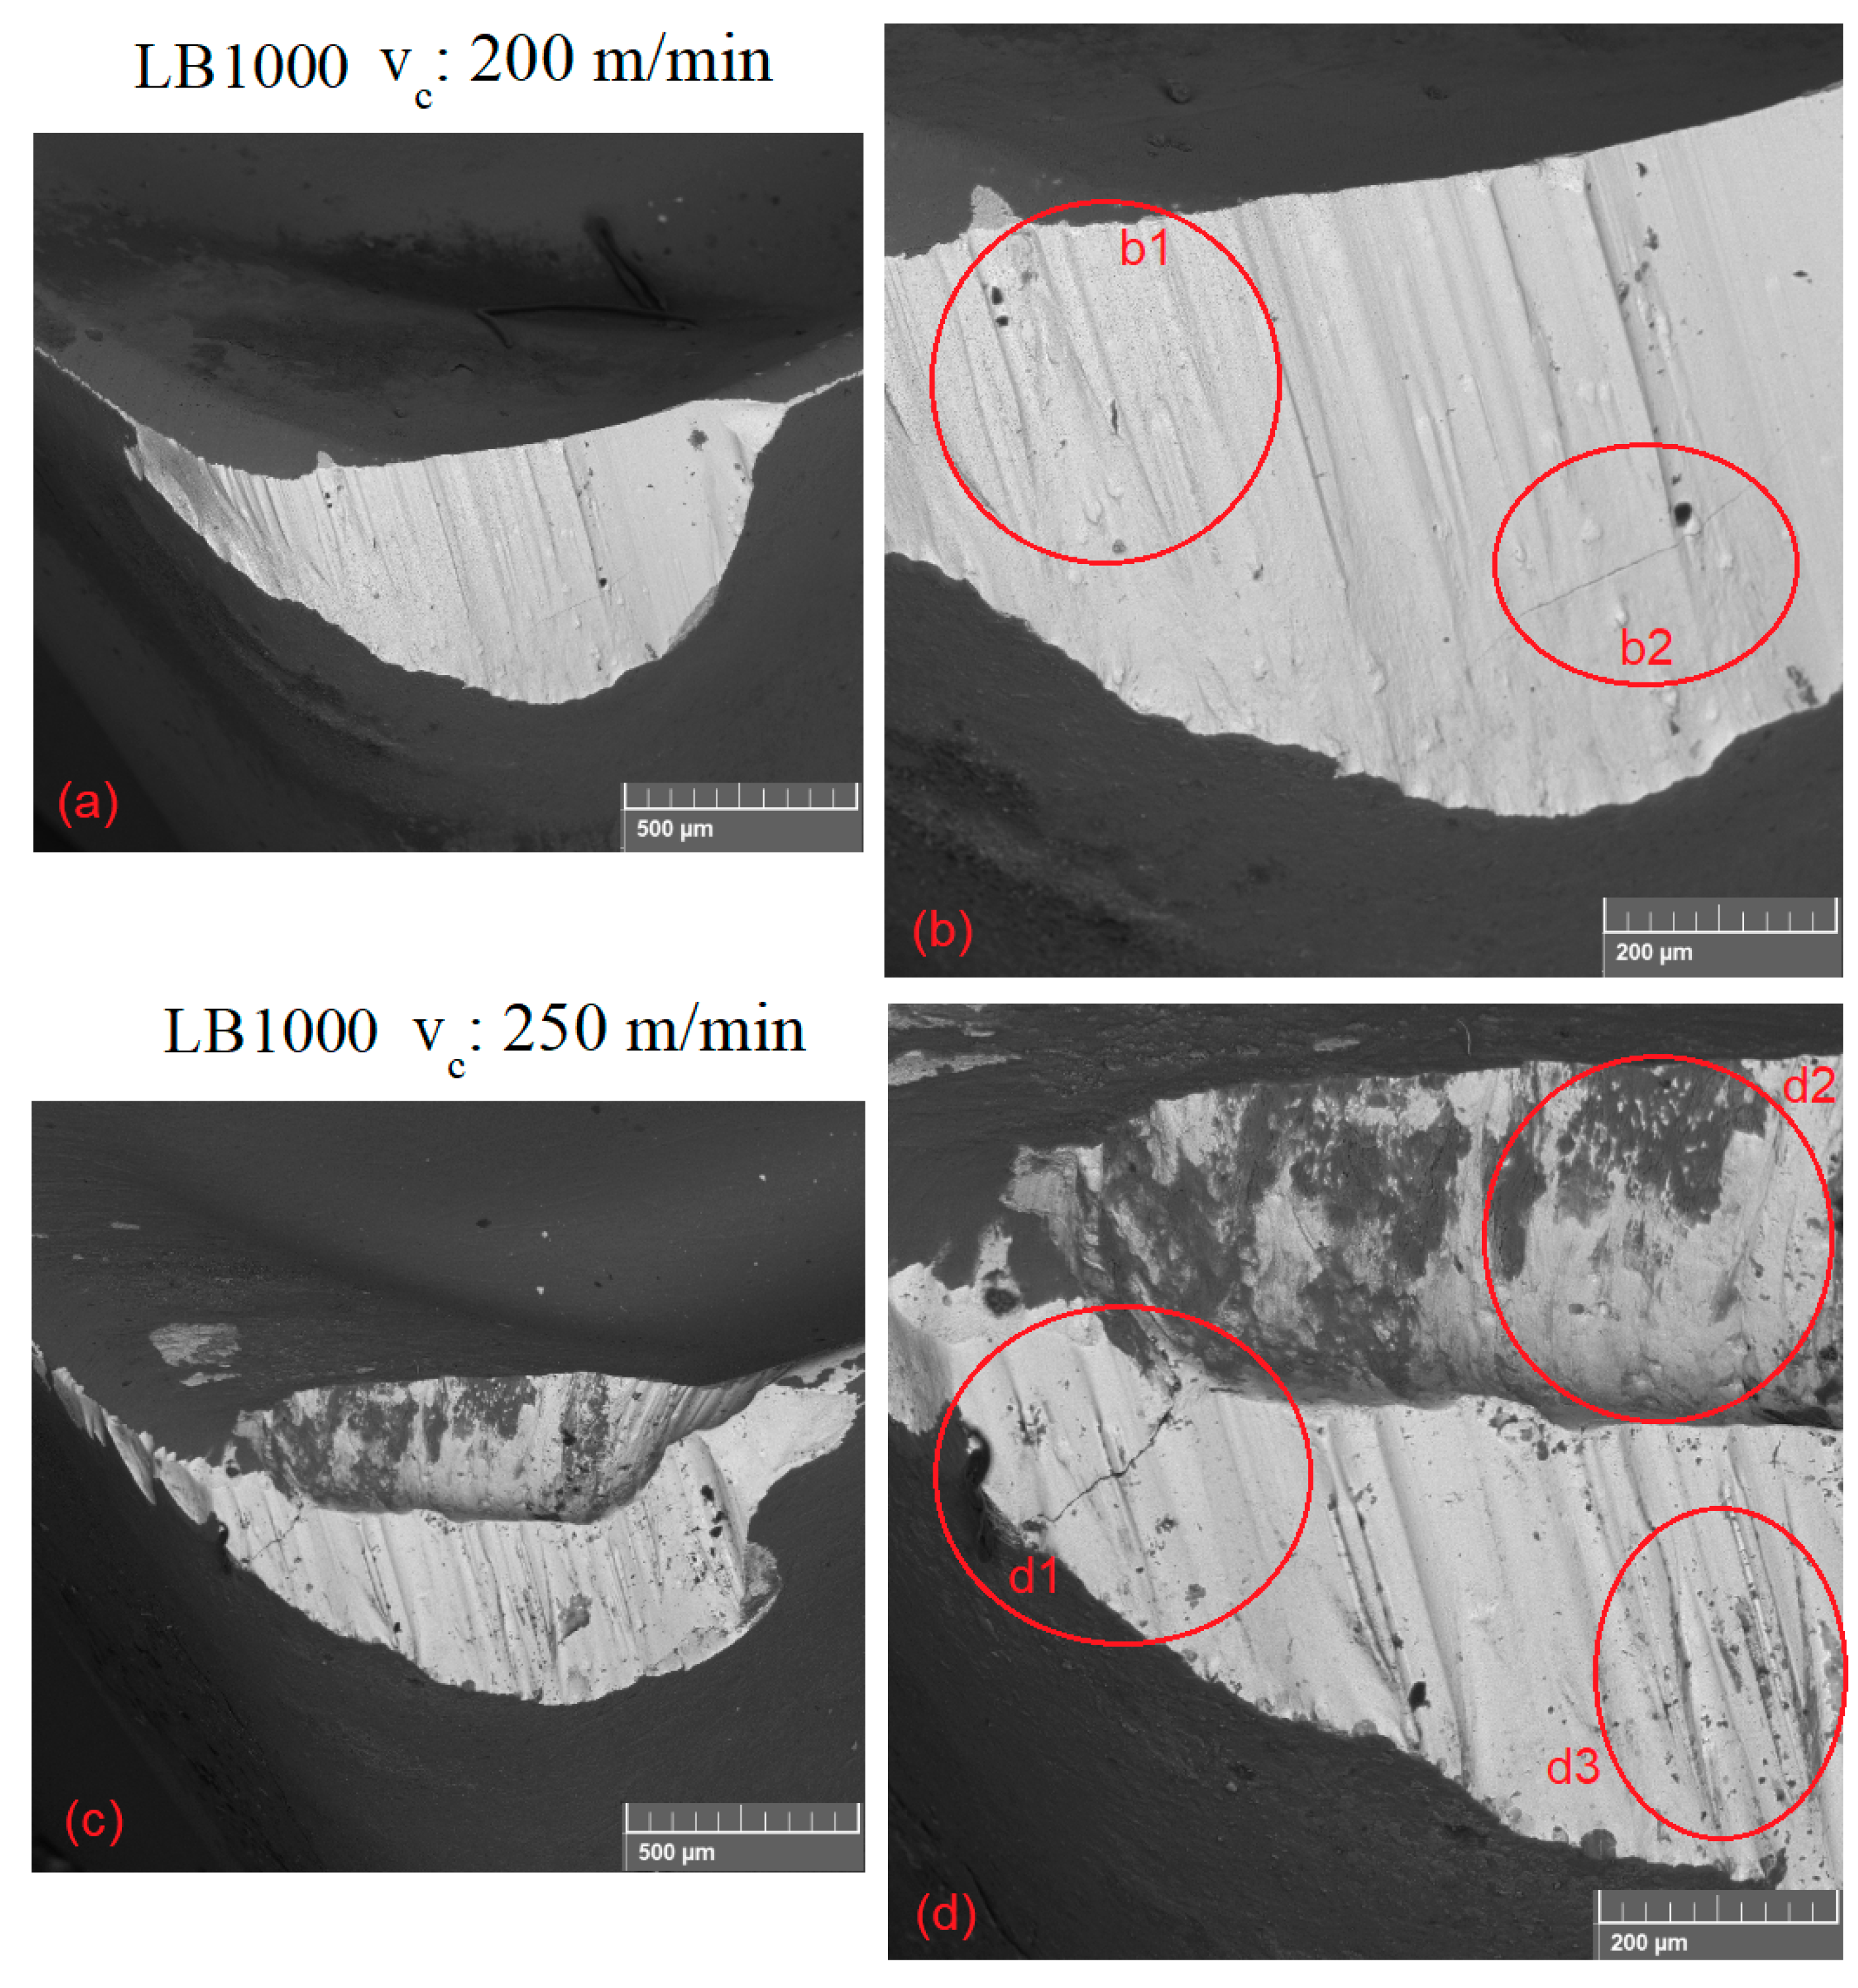
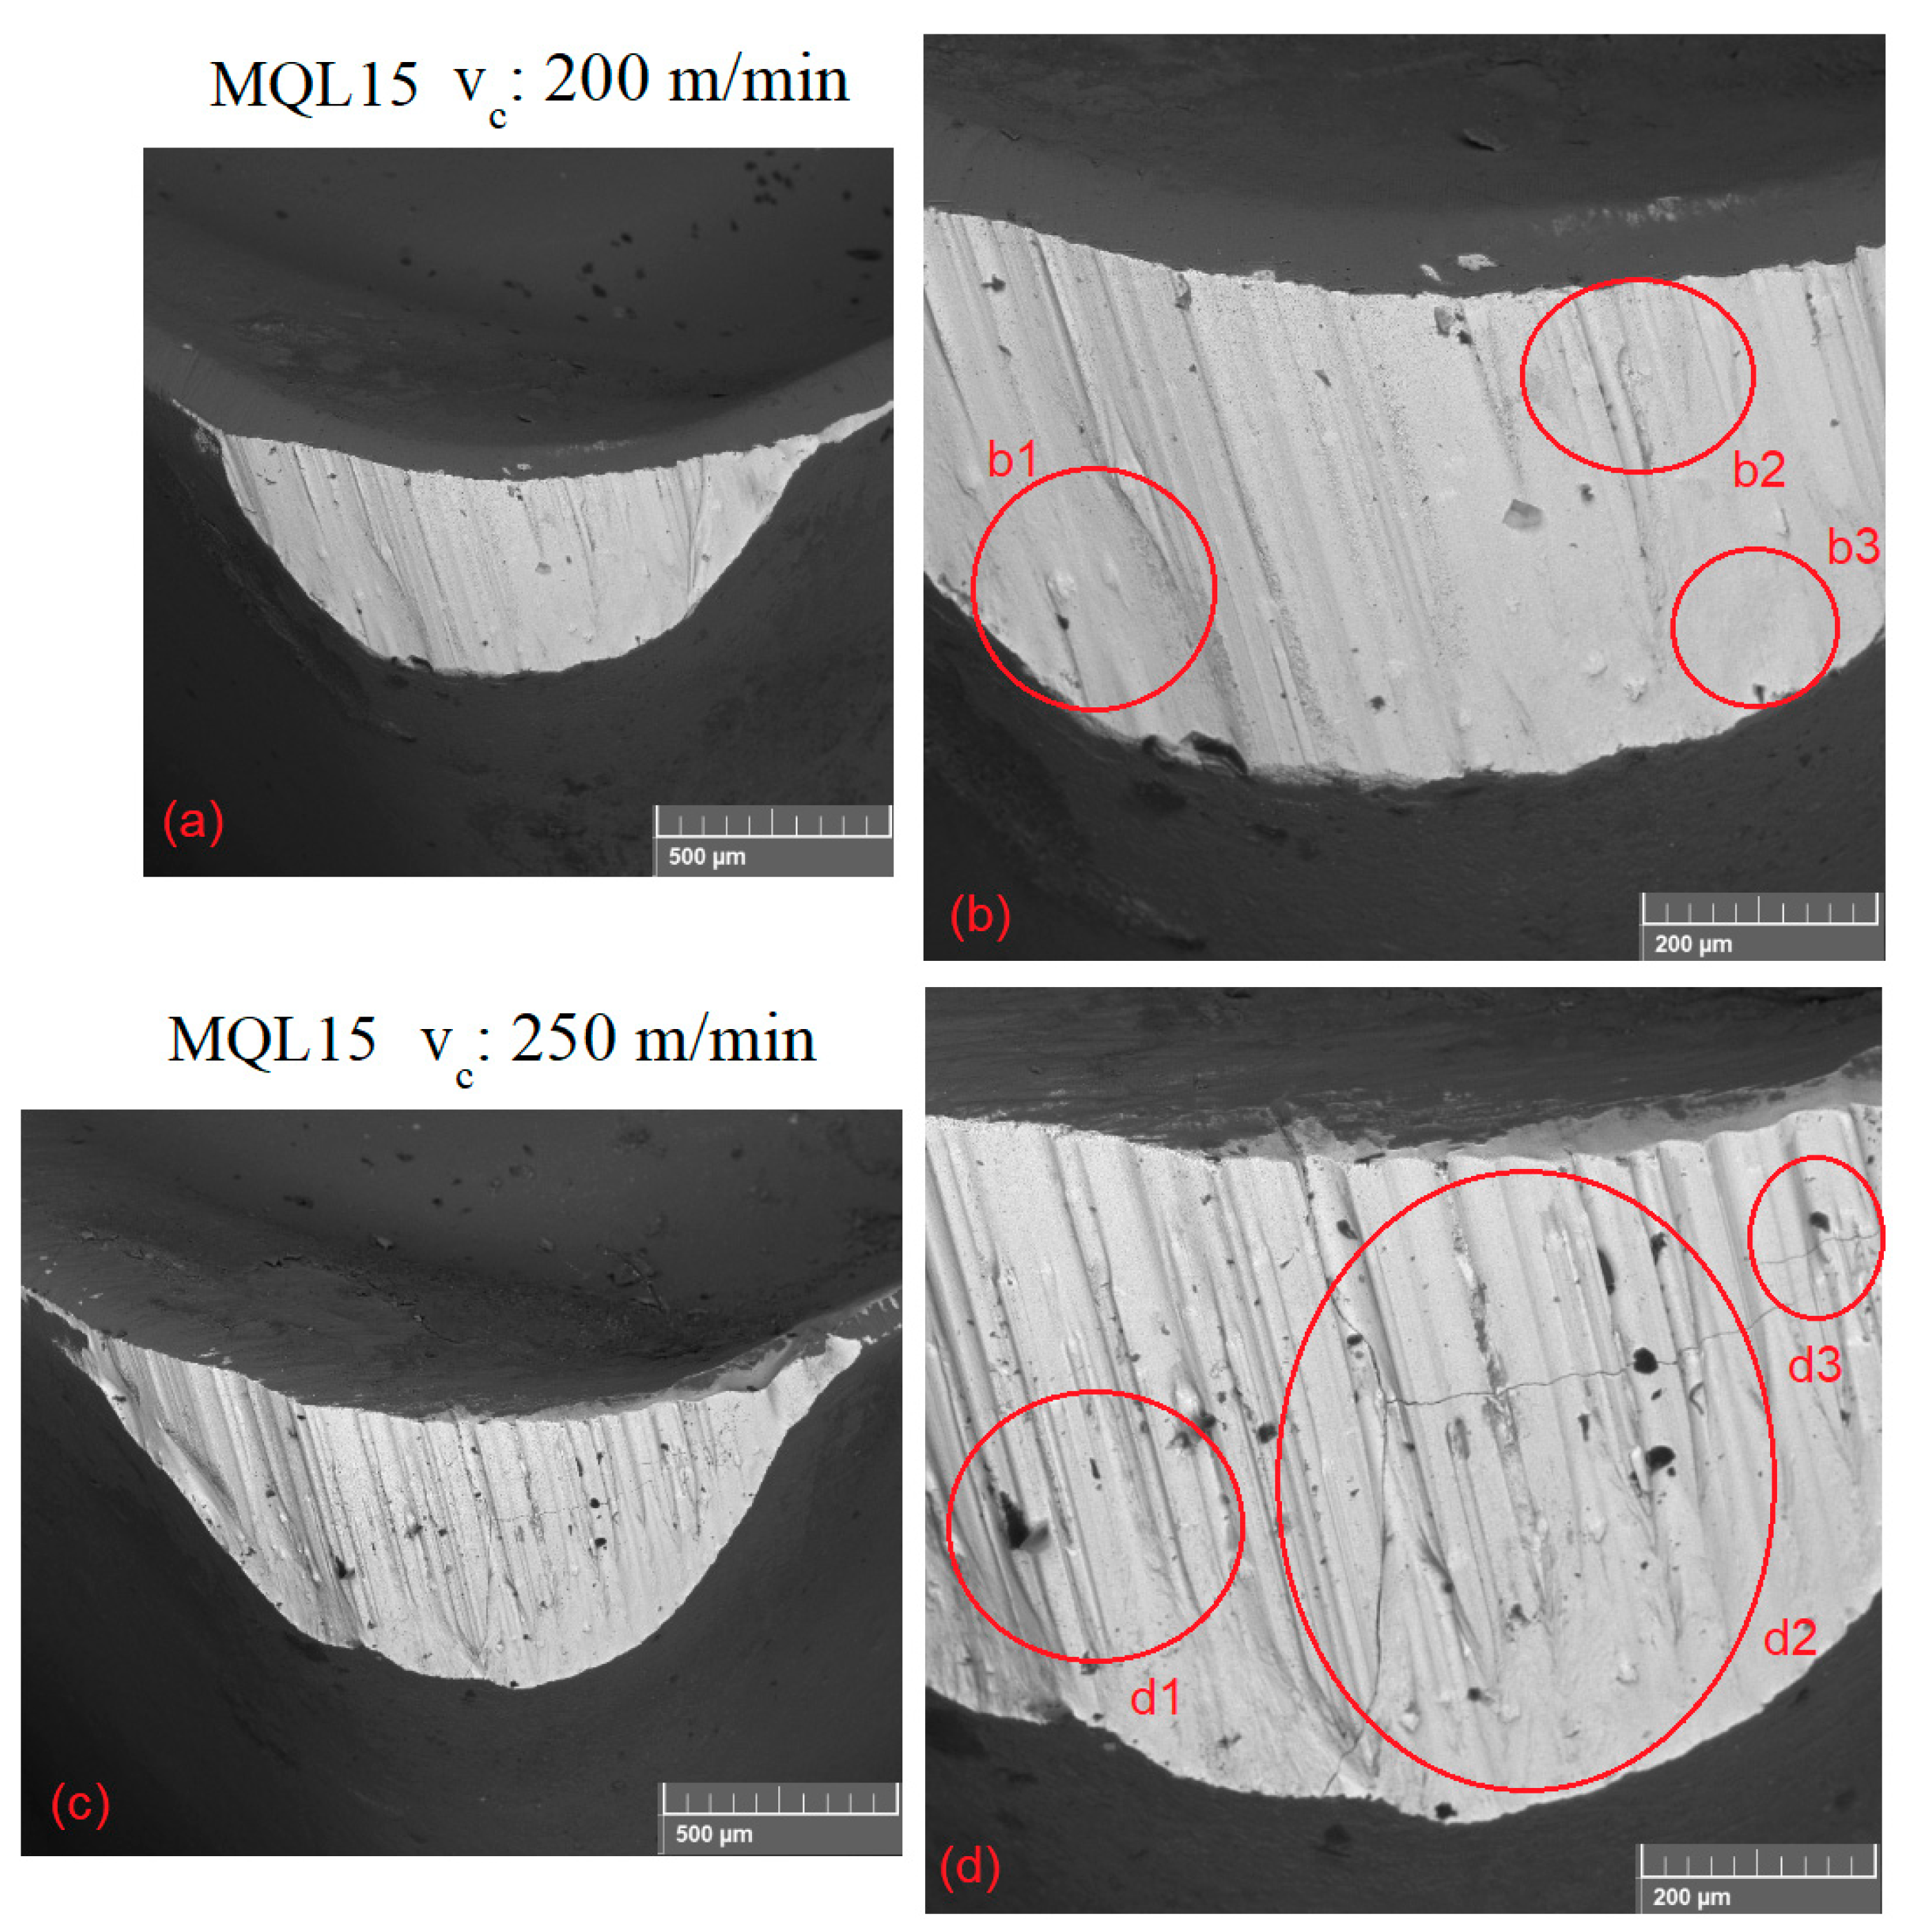
3.5. Tool Life and Wear Mechanisms
4. Conclusions
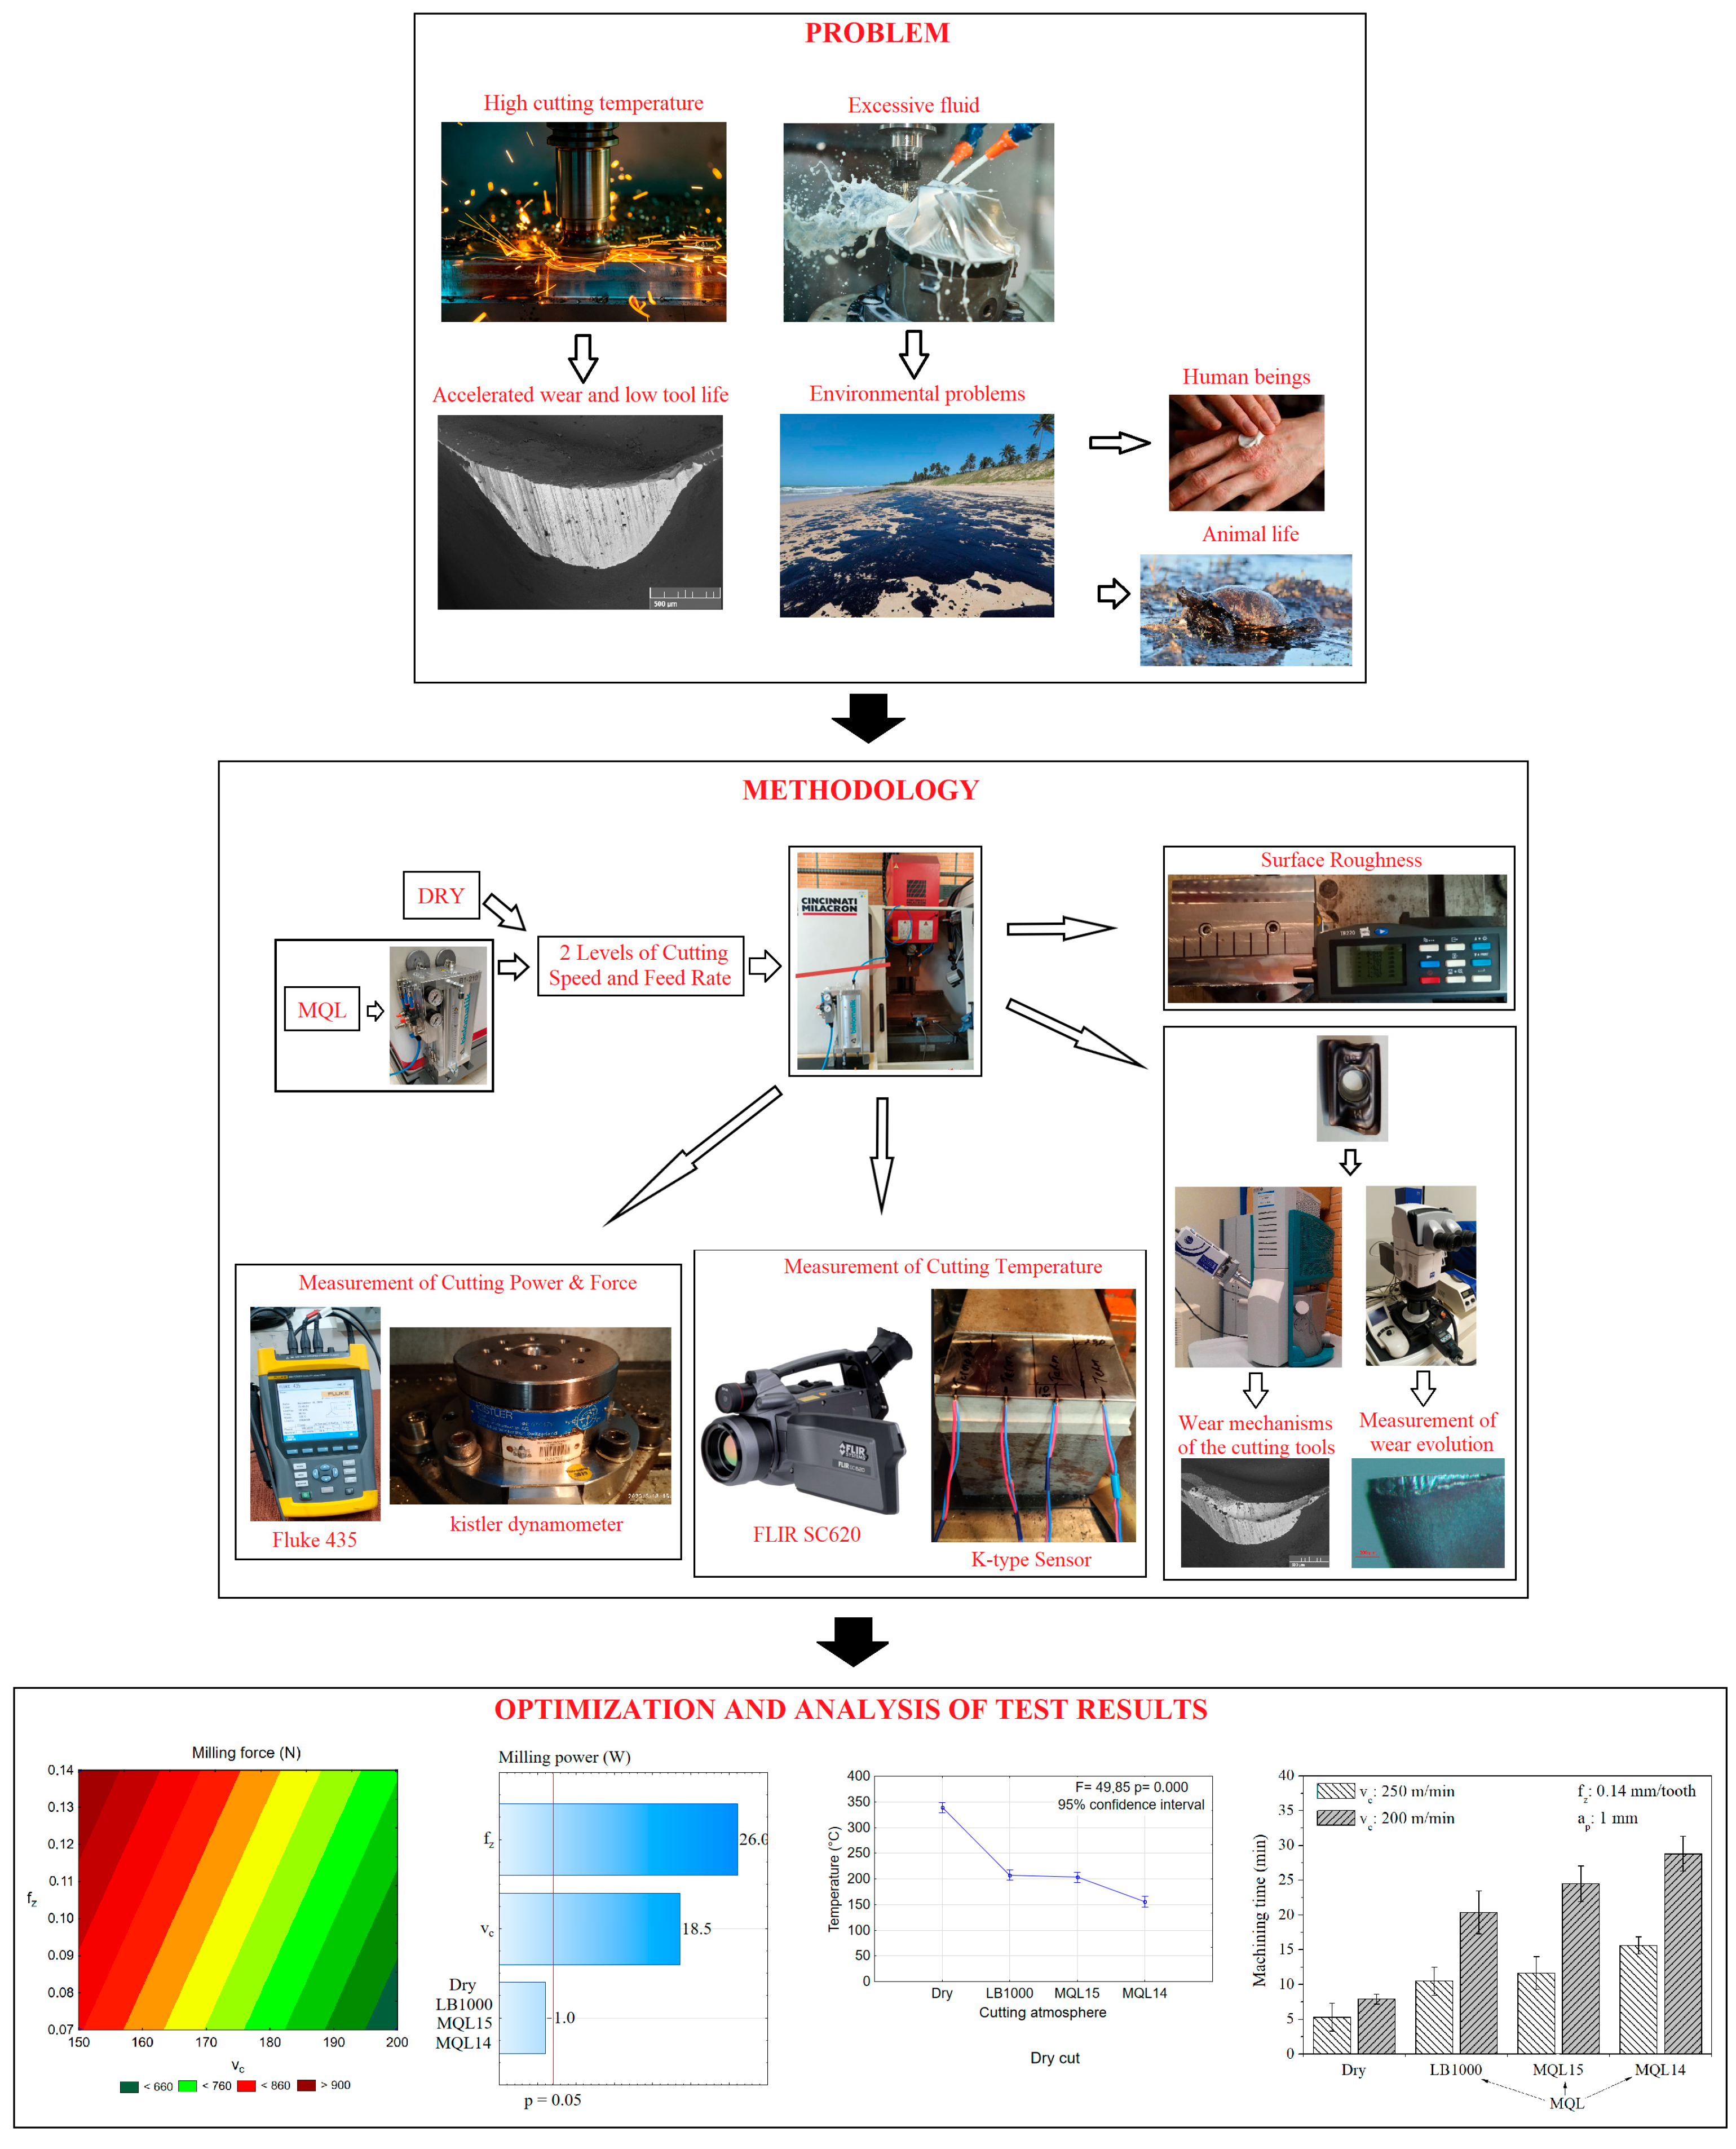
- Regardless of the measurement method, the milling temperatures exhibited lower values during the application of MQL fluids compared to dry cutting. This finding highlights that the application of MQL fluids can remarkably promote lubri-cooling of the chip–tool–workpiece interfaces, leading to a reduction of the generation of heat and friction considerably.
- MQL application of vegetable-based oils LB1000 and MQL15 showed equivalent machining forces and powers and were slightly higher than the dry cutting. This behavior was noticed due to the coolant effect of the MQL application and atomization of the cutting fluid. Consequently, the temperatures’ influence on the material’s mechanical strength was observed to be lower.
- Among the cutting parameters, feed per tooth had the most significant influence on the surface roughness for all the evaluated lubri-coolant conditions, as expected.
- The mineral-based MQL14 oil was noted to provide the best machining force and surface roughness results. These results could be justified by its high wettability, low viscosity, conductivity, thermal diffusivity, and best tribological results, characterizing it as the oil with the highest lubricity.
- End milling under the higher cutting speed of 250 m/min decreased the tool lives substantially, regardless of the cutting atmosphere condition used.
- The vegetable-based oil MQL15 showed similar tool life results to those presented by the mineral-based oil MQL14. Therefore, this vegetable oil might be preferred in similar industrial applications because of its higher sustainability.
- The tool wear mechanism analyses indicated that abrasion predominated, regardless of the cutting atmosphere and speed used. It was also confirmed by the several parallel microgrooves in the direction of the material flow (observed on the worn areas of the tools). Mechanical and thermal cracks were also noticed, and regions with rough and smooth aspects indicated the presence of adhesive and diffusive wear mechanisms on the cutting tools’ surfaces.
- The wear mechanisms did not change amid the application of an oil by MQL. However, under dry machining, the wear was accelerated.
Author Contributions
Funding
Data Availability Statement
Acknowledgments
Conflicts of Interest
References
- Da Silva, R.B.; Vieira, J.M.; Cardoso, R.N.; Carvalho, H.C.; Costa, E.S.; Machado, A.R.; De Ávila, R.F. Tool Wear Analysis in Milling of Medium Carbon Steel with Coated Cemented Carbide Inserts Using Different Machining Lubrication/Cooling Systems. Wear 2011, 271, 2459–2465. [Google Scholar] [CrossRef]
- da Silva, L.R.R.; Souza, F.C.R.; Guesser, W.L.; Jackson, M.J.; Machado, A.R. Critical Assessment of Compacted Graphite Cast Iron Machinability in the Milling Process. J. Manuf. Process. 2020, 56, 63–74. [Google Scholar] [CrossRef]
- Goindi, G.S.; Sarkar, P. Dry Machining: A Step towards Sustainable Machining – Challenges and Future Directions. J. Clean. Prod. 2017, 165, 1557–1571. [Google Scholar] [CrossRef]
- Da Silva, L.R.R.R.; Del Claro, V.T.S.S.; Andrade, C.L.F.F.; Guesser, W.L.; Jackson, M.J.; Machado, A.R. Tool Wear Monitoring in Drilling of High-Strength Compacted Graphite Cast Irons. Proc. Inst. Mech. Eng. B J. Eng. Manuf. 2021, 235, 207–218. [Google Scholar] [CrossRef]
- Pimenov, D.Y.; Mia, M.; Gupta, M.K.; Machado, Á.R.; Pintaude, G.; Unune, D.R.; Khanna, N.; Khan, A.M.; Tomaz, Í.; Wojciechowski, S.; et al. Resource Saving by Optimization and Machining Environments for Sustainable Manufacturing: A Review and Future Prospects. Renew. Sustain. Energy Rev. 2022, 166, 112660. [Google Scholar] [CrossRef]
- Saleem, M.Q.; Mehmood, A. Eco-Friendly Precision Turning of Superalloy Inconel 718 Using MQL Based Vegetable Oils: Tool Wear and Surface Integrity Evaluation. J. Manuf. Process. 2022, 73, 112–127. [Google Scholar] [CrossRef]
- da Silva, L.R.R.; Favero Filho, A.; Costa, E.S.; Pico, D.F.M.; Sales, W.F.; Guesser, W.L.; Machado, A.R.; Filho, A.F.; Costa, E.S.; Marcucci Pico, D.F.; et al. Cutting Temperatures in End Milling of Compacted Graphite Irons; Elsevier: Amsterdam, The Netherlands, 2018; Volume 26, pp. 474–484. [Google Scholar] [CrossRef]
- Baldin, V.; da Silva, L.R.R.; Machado, A.R.; Houck, C.F. State of the Art of Biodegradable Nanofluids Application in Machining Processes. Int. J. Precis. Eng. Manuf.-Green. Technol. 2022, 1–38. [Google Scholar] [CrossRef]
- Cyprowski, M.; Piotrowska, M.; Zakowska, Z.; Szadkowska-Stańczyk, I. Microbial and Endotoxin Contamination of Water-Soluble Metalworking Fluids. Int. J. Occup. Med. Environ. Environ. Health 2007, 20, 365–371. [Google Scholar] [CrossRef]
- Mannekote, J.K.; Kailas, S.V.; Venkatesh, K.; Kathyayini, N. Environmentally Friendly Functional Fluids from Renewable and Sustainable Sources-A Review. Renew. Sustain. Energy Rev. 2018, 81, 1787–1801. [Google Scholar] [CrossRef]
- Sen, B.; Mia, M.; Krolczyk, G.M.; Mandal, U.K.; Mondal, S.P. Eco-Friendly Cutting Fluids in Minimum Quantity Lubrication Assisted Machining: A Review on the Perception of Sustainable Manufacturing. Int. J. Precis. Eng. Manuf.-Green Technol. 2019, 8, 249–280. [Google Scholar] [CrossRef]
- Dhar, N.R.; Ahmed, M.T.; Islam, S. An Experimental Investigation on Effect of Minimum Quantity Lubrication in Machining AISI 1040 Steel. Int. J. Mach. Tools Manuf. 2007, 47, 748–753. [Google Scholar] [CrossRef]
- Machado, Á.R.; Wallbank, J. The Effect of Extremely Low Lubricant Volumes in Machining. Wear 1997, 210, 76–82. [Google Scholar] [CrossRef]
- da Silva, L.R.R.; Ruzzi, R.S.; Teles, V.C.; Sales, W.F.; Guesser, W.L.; Machado, A.R. Analysis of the Coefficient of Friction at the Workpiece-Tool Interface in Milling of High Strength Compacted Graphite Cast Irons. Wear 2019, 426–427, 1646–1657. [Google Scholar] [CrossRef]
- Ezugwu, E.O.; da Silva, R.B.; Bonney, J.; Costa, E.S.; Sales, W.F.; Machado, A.R. Evaluation of Performance of Various Coolant Grades When Turning Ti-6Al-4V Alloy with Uncoated Carbide Tools under High-Pressure Coolant Supplies. J. Manuf. Sci. Eng. 2019, 141, 014503. [Google Scholar] [CrossRef]
- Hoon, S.; Won, S.; Han, S.; Kim, S. Numerical Investigation of Thermal Characteristics of Spray Cooling with Minimum Quantity Lubrication in Milling Process. Appl. Math. Model. 2019, 65, 137–147. [Google Scholar] [CrossRef]
- Patole, P.B.; Kulkarni, V.V.; Bhatwadekar, S.G. MQL Machining with Nano Fluid: A Review. Manuf. Rev. 2021, 8, 13. [Google Scholar] [CrossRef]
- ASTM E8/E8M; Standard Test Methods for Tension Testing of Metallic Materials. Astm International: West Conshohocken, PA, USA, 2013.
- Baldin, V.; da Silva, L.R.R.; Gelamo, R.V.; Iglesias, A.B.; da Silva, R.B.; Khanna, N.; Rocha Machado, A. Influence of Graphene Nanosheets on Thermo-Physical and Tribological Properties of Sustainable Cutting Fluids for MQL Application in Machining Processes. Lubricants 2022, 10, 193. [Google Scholar] [CrossRef]
- ABNT NBR NM 87; Aço Carbono e Ligados Para Construção Mecânica—Designação e Composição Química. Associação Brasileira de Normas Técnicas: São Paulo, Brazil, 2000.
- ABNT NBR 14725; Produtos Químicos—Informações Sobre Segurança, Saúde e Meio Ambiente: Ficha de Informações de Segurança de Produtos Químicos (FISPQ). Associação Brasileira de Normas Técnicas: São Paulo, Brazil, 2019.
- Baldin, V.; da Silva, L.R.R.; Houck, C.F.; Gelamo, R.V.; Machado, Á.R. Effect of Graphene Addition in Cutting Fluids Applied by Mql in End Milling of Aisi 1045 Steel. Lubricants 2021, 9, 70. [Google Scholar] [CrossRef]
- Richetti, A.; Machado, Á.R.; Da Silva, M.B.; Ezugwu, E.O.; Bonney, J. Influence of the Number of Inserts for Tool Life Evaluation in Face Milling of Steels. Int. J. Mach. Tools Manuf. 2004, 44, 695–700. [Google Scholar] [CrossRef]
- Davoodi, B.; Hosseinzadeh, H. A New Method for Heat Measurement during High Speed Machining. Measurement 2012, 45, 2135–2140. [Google Scholar] [CrossRef]
- Soler, D.; Aristimuño, P.X.; Saez-de-Buruaga, M.; Garay, A.; Arrazola, P.J. New Calibration Method to Measure Rake Face Temperature of the Tool during Dry Orthogonal Cutting Using Thermography. Appl. Therm. Eng. 2018, 137, 74–82. [Google Scholar] [CrossRef]
- Umbrello, D.; Filice, L.; Rizzuti, S.; Micari, F. On the Evaluation of the Global Heat Transfer Coefficient in Cutting. Int. J. Mach. Tools Manuf. 2007, 47, 1738–1743. [Google Scholar] [CrossRef]
- Machado, A.R.; Abrão, A.M.; Coelho, R.T.; Silva, M.B. Da Teoria da Usinagem dos Materiais, 3rd ed.; Editora Edgard Blucher: São Paulo, Brazil, 2015; ISBN 978-85-212-0452-7. [Google Scholar]
- Carvalho, D.O.A.; da Silva, L.R.R.; Sopchenski, L.; Jackson, M.J.; Machado, Á.R. Performance Evaluation of Vegetable-Based Cutting Fluids in Turning of AISI 1050 Steel. Int. J. Adv. Manuf. Technol. 2019, 103, 1603–1619. [Google Scholar] [CrossRef]
- Bashir, M.A.; Mia, M.; Dhar, N.R. Investigations on Surface Milling of Hardened AISI 4140 Steel with Pulse Jet MQL Applicator. J. Inst. Eng. Ser. C 2018, 99, 301–314. [Google Scholar] [CrossRef]


| Element | AISI 1045 Steel (%) |
|---|---|
| C | 0.045 |
| Mn | 0.69–0.83 |
| Si | 0.19–0.29 |
| P | 0.008–0.039 |
| S | 0.015–0.02 |
| Fe | balance |
| Characteristic | MQL14 | MQL15 | LB1000 |
|---|---|---|---|
| Viscosity centistokes (cSt) to 40 °C | 9.5 to 10.5 | 60 to 70 | 39 |
| Flash point (ASTM D92) (°C) | >250 | At least 180 | More than 204 °C |
| Freezing point (°C) | −10 | −10 | −15 |
| Boiling point | More than 270 °C and 760 mm/Hg | More than 270 °C and 760 mm/Hg | More than 279 °C |
| Density (20/4 °C) (kg/L) | 0.902 | 0.920 | 0.93 |
| Chemistry nature | |||
| MQL14: Paraffinic oil, EP additives, inactive sulfo-chlorinated fatty additive, wear inhibitors, antioxidant, defoamer, and holds 1–4% zinc alkyl dithiophosphate. | |||
| MQL15: Vegetable oils, fatty acid esters, EP additives, wear inhibitors, antioxidants, defoamer, and contains 1–4% zinc alkyl dithiophosphate. | |||
| LB1000: Vegetable oils, extreme pressure chlorinated additives (EP), chlorine, wear inhibitors, antioxidants, and defoamer. | |||
| ap = 1.0 mm; ae = 25 mm | ||
|---|---|---|
| Test Number | Cutting Speed [m/min] | Feed Rate [mm/tooth] |
| T1 | 150 | 0.07 |
| T2 | 200 | 0.07 |
| T3 | 150 | 0.14 |
| T4 | 200 | 0.14 |
| Lubri-Coolant | Average Temperature | Comparisons | ||
|---|---|---|---|---|
| MQL14 | 155.35 | X | ||
| MQL15 | 203.18 | X | ||
| LB1000 | 207.43 | X | ||
| Dry | 338.75 | X | ||
| Machining with LB1000, MQL15, MQL14, and Dry Fluids | |||||
|---|---|---|---|---|---|
| SS | Df | MS | F | p | |
| Lubri-Coolant Conditions | 296 | 1 | 296 | 1.11 | 0.299 |
| vc | 91,506.2 | 1 | 91,506.2 | 343.61 | 0.000 |
| fz | 180,766.7 | 1 | 180,766.7 | 678.79 | 0.000 |
| Error | 8521.8 | 32 | 266.3 | ||
| Total SS | 281,090.7 | 35 | |||
| Lubricant-Coolant Conditions | Average Ra | Comparisons | ||
| MQL14 | 0.516 | X | ||
| Dry | 0.673 | X | ||
| LB1000 | 0.849 | X | ||
| MQL15 | 0.959 | X | ||
| Lubricant-coolant conditions | Average Rz | Comparisons | ||
| MQL14 | 3.530 | X | ||
| Dry | 3.740 | X | X | |
| LB1000 | 4.334 | X | ||
| MQL15 | 4.419 | X | ||
Disclaimer/Publisher’s Note: The statements, opinions and data contained in all publications are solely those of the individual author(s) and contributor(s) and not of MDPI and/or the editor(s). MDPI and/or the editor(s) disclaim responsibility for any injury to people or property resulting from any ideas, methods, instructions or products referred to in the content. |
© 2023 by the authors. Licensee MDPI, Basel, Switzerland. This article is an open access article distributed under the terms and conditions of the Creative Commons Attribution (CC BY) license (https://creativecommons.org/licenses/by/4.0/).
Share and Cite
Baldin, V.; da Silva, L.R.R.; Davis, R.; Jackson, M.J.; Amorim, F.L.; Houck, C.F.; Machado, Á.R. Dry and MQL Milling of AISI 1045 Steel with Vegetable and Mineral-Based Fluids. Lubricants 2023, 11, 175. https://doi.org/10.3390/lubricants11040175
Baldin V, da Silva LRR, Davis R, Jackson MJ, Amorim FL, Houck CF, Machado ÁR. Dry and MQL Milling of AISI 1045 Steel with Vegetable and Mineral-Based Fluids. Lubricants. 2023; 11(4):175. https://doi.org/10.3390/lubricants11040175
Chicago/Turabian StyleBaldin, Vitor, Leonardo Rosa Ribeiro da Silva, Rahul Davis, Mark James Jackson, Fred Lacerda Amorim, Celso Ferraz Houck, and Álisson Rocha Machado. 2023. "Dry and MQL Milling of AISI 1045 Steel with Vegetable and Mineral-Based Fluids" Lubricants 11, no. 4: 175. https://doi.org/10.3390/lubricants11040175
APA StyleBaldin, V., da Silva, L. R. R., Davis, R., Jackson, M. J., Amorim, F. L., Houck, C. F., & Machado, Á. R. (2023). Dry and MQL Milling of AISI 1045 Steel with Vegetable and Mineral-Based Fluids. Lubricants, 11(4), 175. https://doi.org/10.3390/lubricants11040175