Article

Research on an Intelligent Classification Algorithm of Ferrography Wear Particles Based on Integrated ResNet50 and SepViT

Merchant Marine College, Shanghai Maritime University, Shanghai 201306, China
*
Author to whom correspondence should be addressed.
Lubricants 2023, 11(12), 530; https://doi.org/10.3390/lubricants11120530
Submission received: 22 October 2023 / Revised: 1 December 2023 / Accepted: 8 December 2023 / Published: 13 December 2023
(This article belongs to the Special Issue Tribology and Machine Learning: New Perspectives and Challenges)

Abstract

:
The wear particle classification algorithm proposed is based on an integrated ResNet50 and Vision Transformer, aiming to address the problems of a complex background, overlapping and similar characteristics of wear particles, low classification accuracy, and the difficult identification of small target wear particles in the region. Firstly, an ESRGAN algorithm is used to improve image resolution, and then the Separable Vision Transformer (SepViT) is introduced to replace ViT. The ResNet50-SepViT model (SV-ERnet) is integrated by combining the ResNet50 network with SepViT through weighted soft voting, enabling the intelligent identification of wear particles through transfer learning. Finally, in order to reveal the action mechanism of SepViT, the different abrasive characteristics extracted by the SepViT model are visually explained using the Grad-CAM visualization method. The experimental results show that the proposed integrated SV-ERnet has a high recognition rate and robustness, with an accuracy of 94.1% on the test set. This accuracy is 1.8%, 6.5%, 4.7%, 4.4%, and 6.8% higher than that of ResNet101, VGG16, MobileNetV2, AlexNet, and EfficientV1, respectively; furthermore, it was found that the optimal weighting factors are 0.5 and 0.5.

1. Introduction

Mechanical equipment condition monitoring is a technology to collect, process, and analyze the information of mechanical operation status, which has been widely used in the maintenance of auxiliary equipment [1]. The mature application of this technology can reduce equipment damage, reduce maintenance costs, reduce productivity loss, and avoid catastrophic accidents, thus saving a lot of resources for society. The main application fields include precision and complex mechanical equipment such as aircraft or ship engines, large machinery with poor operating conditions such as large hydraulic presses, and offshore drilling platform equipment. Realizing real-time online condition monitoring is of great significance to ensure the safe and reliable operation of important mechanical equipment, especially the safe and reliable operation of large ships and aircraft [2].
Many scholars have conducted extensive research on the intelligent recognition of wear particle images. Fan et al. put forward an online multilabel classification model WPC-SS for wear particles based on semantic segmentation, which solved the problem that it is difficult to distinguish tiny wear particles from the background in online images, but the recognition and classification accuracy of tiny wear particles by WPC-SS needs to be further improved [3]. Gu Daqiang and others put forward the pattern recognition of ferrography wear particle analysis based on SVM, which provided an effective method for the classification of wear particles [4]. This method has high requirements for data preprocessing and feature extraction and needs to be optimized and improved for each specific type of wear particle. However, the application process involves a large amount of data processing and model training, which takes a long time and a large amount of computational resources. These studies have carried out the classification and identification of the manual feature selection of individual particles, but the accuracy is low, the effect is not obvious, and the result of the algorithm or method is relatively simple. The image content of the ferrography analysis of wear particles is complex, and different types of images may have high similarities, such as fatigue wear particles and severe sliding wear particles [5].
The classification of wear particles involves categorization based on the morphology, size, chemical composition, and mechanical properties of the wear particles. However, the complexity of wear particle classification arises from the fact that wear outcomes often stem from a combination of different wear mechanisms, making the classification process highly intricate [6]. To gain a comprehensive understanding of wear results, it is essential to employ a comprehensive approach that integrates multifeature fusion, feature selection and dimensionality reduction, and an ensemble of multiple classifiers, as well as deep learning strategies [7]. These methods effectively address the combined effects of different wear mechanisms, thereby improving the accuracy and robustness of wear particle classification systems, and are of significant importance for research into wear-related issues.
With the application of CNN in the intelligent identification and classification of ferrography wear particle images, this method has gradually become a substitute for manual and traditional machine learning identification. Scholars have solved many problems in the traditional wear particle classification method by applying CNN to the wear particle classification task through research. Wang et al. linked an image recognition model based on a convolutional neural network with wear particle analysis and proposed a two-stage wear particle recognition model [8]. Based on the above research results, using CNN to identify and classify wear particle images can greatly improve work efficiency. However, it is still necessary to further study and speed up the real-time model identification and classification, reduce computational complexity and improve accuracy, and solve the problems of large-scale data training, superparameter adjustment, and data imbalance under actual conditions.
Wear particle image classification plays an important role in the field of mechanical equipment fault diagnosis and early warning. Classical deep learning models such as ResNet101 [9], VGG16 [10], MobileNetV2 [11], EfficientNetV1 [12], and AlexNet [13] have achieved significant success in other image classification tasks. ResNet101 is a deep residual network that solves the problem of gradient vanishing by introducing residual connections, but it has high model complexity. The VGG16 model uses multiple 3 × 3 convolution layers for feature extraction and exhibits excellent performance in terms of classification accuracy, but it consumes significant computational resources. The MobileNetV2 model improves the lightweight nature of the model by using depthwise separable convolution, making it suitable for applications on mobile devices, but it falls short of 70% accuracy in wear particle recognition. The EfficientNetV1 balances the width, depth, and resolution of the network to achieve a better trade-off between performance and computational cost related to wear particle recognition. However, it still fails to address the issue of low wear particle recognition accuracy. AlexNet is one of the earliest deep learning models applied to image classification, combining the advantages of convolutional neural networks and SVM classifiers, but it cannot recognize similar and overlapping wear particles.
Additionally, new algorithms have been developed to improve the task of mechanical equipment fault diagnosis and early warning. Yeping Peng et al. integrated transfer learning and SVM into a convolutional neural network model, successfully establishing a model for identifying different types of faults [14]. However, this model cannot recognize new class wear particles that were not encountered during training. Given the limitations of existing algorithms in mechanical equipment fault diagnosis and early warning tasks, this paper proposes a novel deep learning algorithm called SV-ERnet. This algorithm combines the characteristics of ResNet50 and SepViT models and introduces the XAI Grad-CAM method to explain the reasoning process of the model. Through comparative experiments and result analysis, we will demonstrate the superiority of SV-ERnet over traditional models in the field of mechanical equipment fault diagnosis and early warning, providing new ideas and methods for research and application in this domain.
In recent years, Vision Transformer (ViT) has been widely used in the field of computer vision by using a pure transformer structure and has achieved great success in the traditional visual classification task by using its self-attention mechanism and strong global modeling ability [15]. More and more scholars have made improvements on this basis. For example, Hao Xu and others put forward a fine-grained classification algorithm based on a compact Vision Transformer [16], which reduces the dependence on data volume, cancels the use of classification tokens, and reduces the computational complexity; Jiang Lei and others put forward a fine-grained classification algorithm of a visual Transformer based on a circular structure [17], which can greatly improve the performance of the visual Transformer without changing the parameters. Yuan Yuan and others put forward the research of fundus image classification based on an integrated convolutional neural network and ViT [18] and obtained better classification results by using two completely different methods to extract the features of fundus images. The above research provides multiangle contributions to the field of image classification, but its application in the ferrography image classification of wear particles needs further study. According to the principle analysis, ViT may perform better in wear particle classification tasks than CNN. For small wear particle images, the traditional convolutional neural network needs to reduce the resolution to keep the information, but this may lead to the loss of information and the decline of classification accuracy. ViT does not need to subsample or crop the image but can pay attention to the whole image, thus making full use of the image information. For large wear particle images, CNN may encounter memory limitations, but ViT is not subject to this restriction. It divides the image into several sub-blocks for processing, and the results are finally summarized. This method improves the efficiency of processing large images without losing information. When designing CNN, it pays attention to the spatial locality of images and ignores the correlation between different regions. ViT adopts self-attention mechanism to learn the correlation between different regions in the image, thus improving the classification accuracy.
To sum up, ViT has superior image processing efficiency, comprehensive information utilization ability, and strong relevance learning ability when dealing with the classification of wear particles. These characteristics make it possible to use ViT to achieve a better performance in wear particle classification. Therefore, further research is needed. On the basis of ViT, this paper takes into account efficiency, accuracy, and learning ability. SepViT: Separable Vision Transformer has made the following contributions:
(1)
To solve the problem of the low resolution of wear particle images, an ESRGAN is applied to generate high-resolution images [19].
(2)
Combined with the depth, separable convolution [20] has the characteristics of separating parameter parameters and reducing parameters and parameters. The depth SepViT [21] is applied to the classification of wear particles.
(3)
Combined with the convolutional neural network, the strong ability to capture local features can solve the problems of sparse wear particle images and inconspicuous features, so this paper proposes to apply ResNet50 to wear particle classification.
(4)
The optimal weight is calculated by an adaptive weighted fusion algorithm [22], and the SV-ERnet model is integrated using the weighted soft voting method [23]. The model can extract the features of ferrography wear particle images in two completely different ways, so as to achieve a better classification effect and effectively solve the problems of the complex background, irregular shape, different sizes, and high similarity of wear particle images.

2. SV-ERnet Algorithm Structure

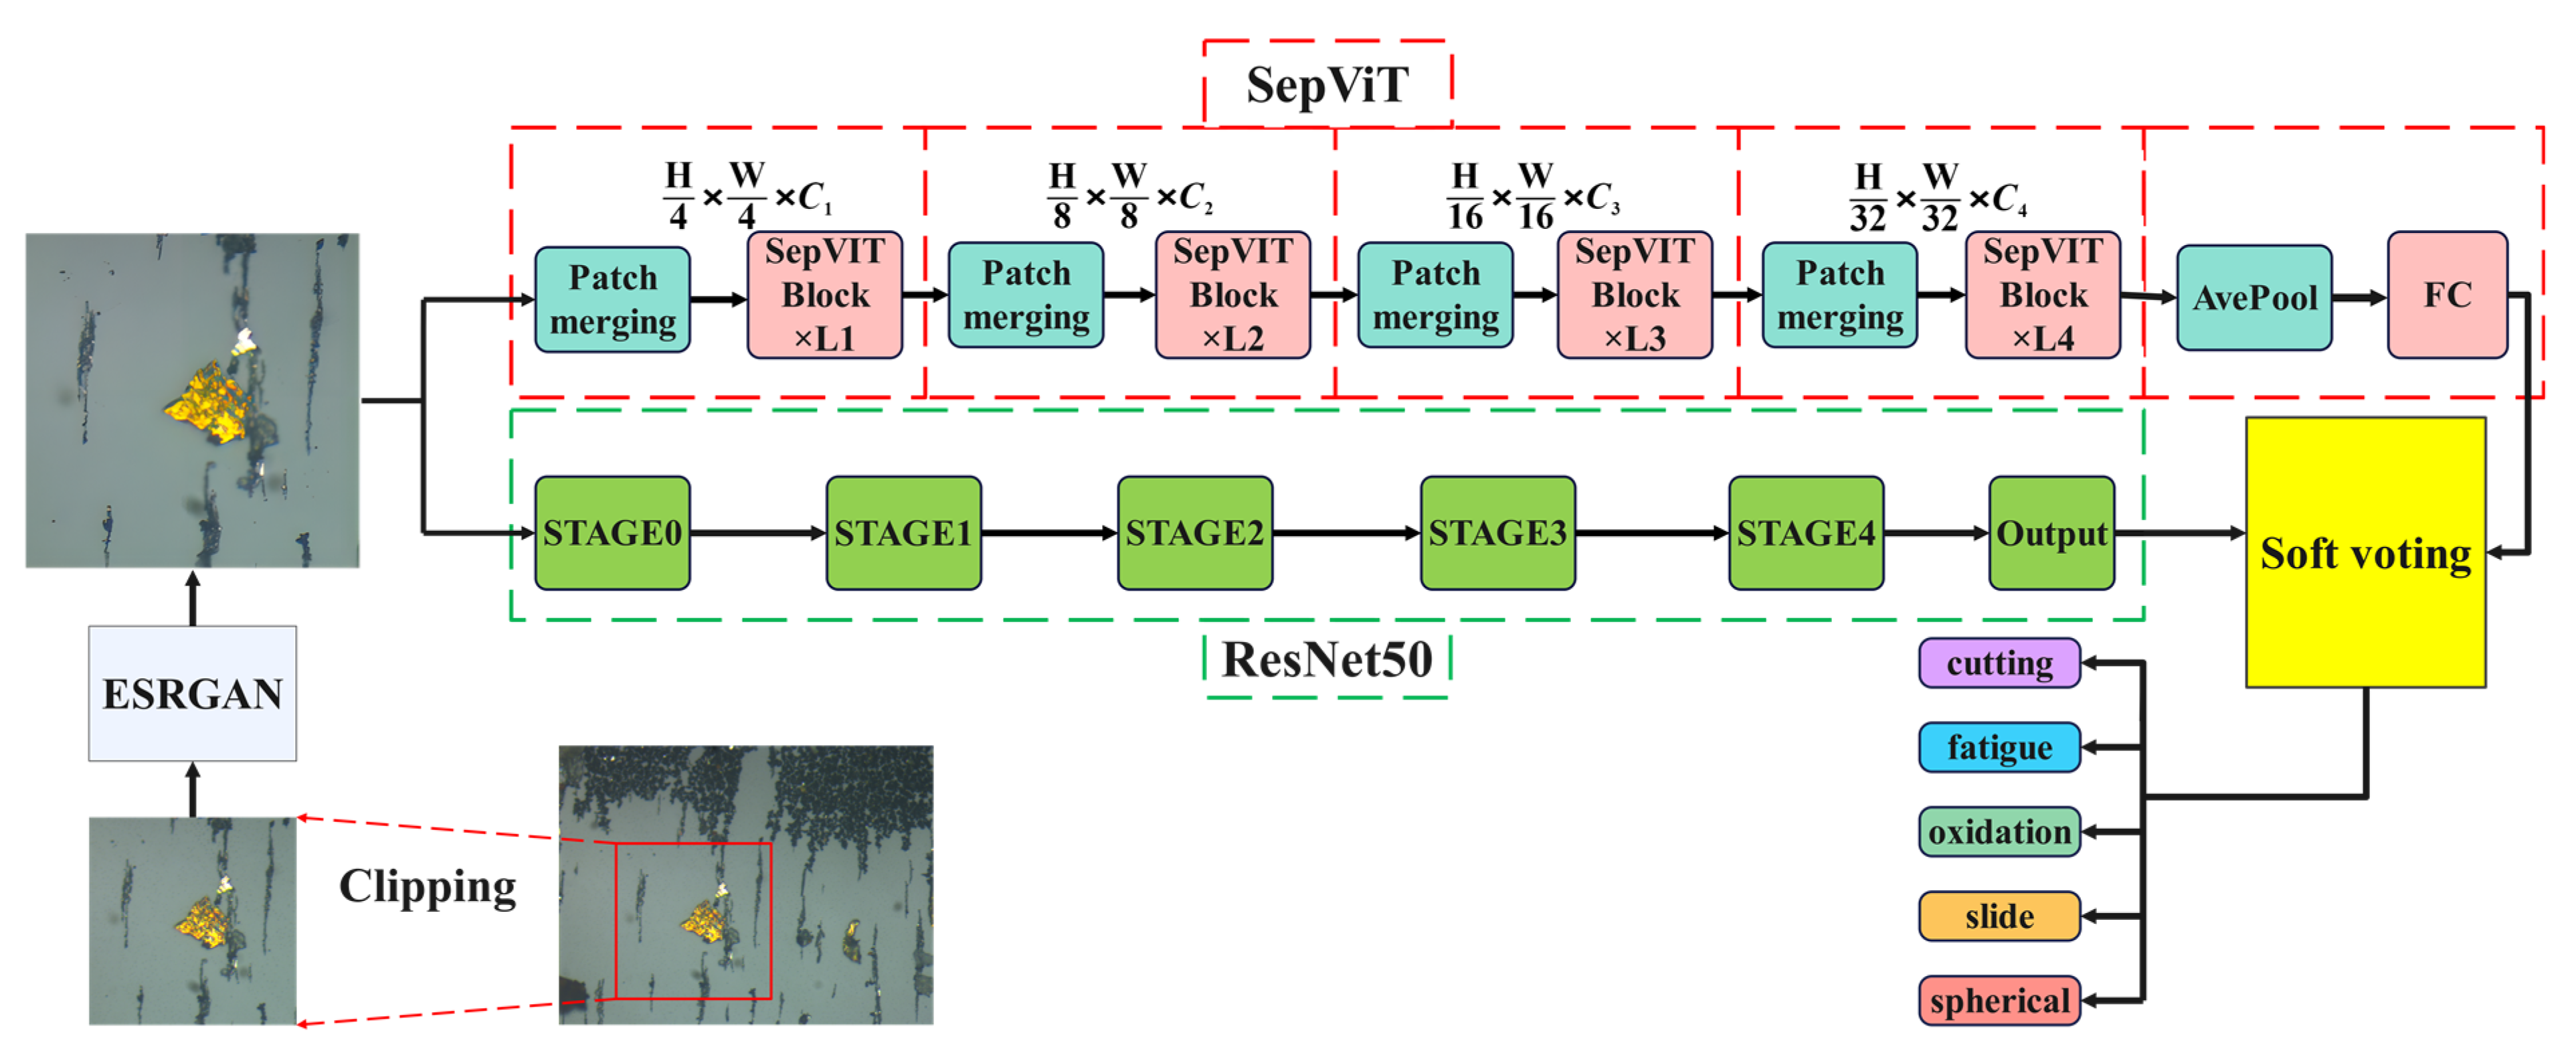
The SV-ERnet image classification method studied in this paper mainly includes the following three steps. First, the resolution of the image is improved by ESRGAN. Then, the SepViT and ResNet50 models are trained, respectively, and the optimal weighting factor is calculated by the adaptive weighting algorithm and integrates these two models together to form a more powerful model-Resnet50-SepViT (SV-ERnet) model. Finally, the trained SV-ERnet model is used to classify the wear particle images, and the performance of the model is tested to evaluate its classification accuracy and reliability. The schematic diagram of the overall algorithm structure is shown in Figure 1. The function of each module and the principle of the algorithm structure is introduced in detail from Section 2.1 to Section 2.4 below.

2.1. Image Enhancement Algorithm ESRGAN

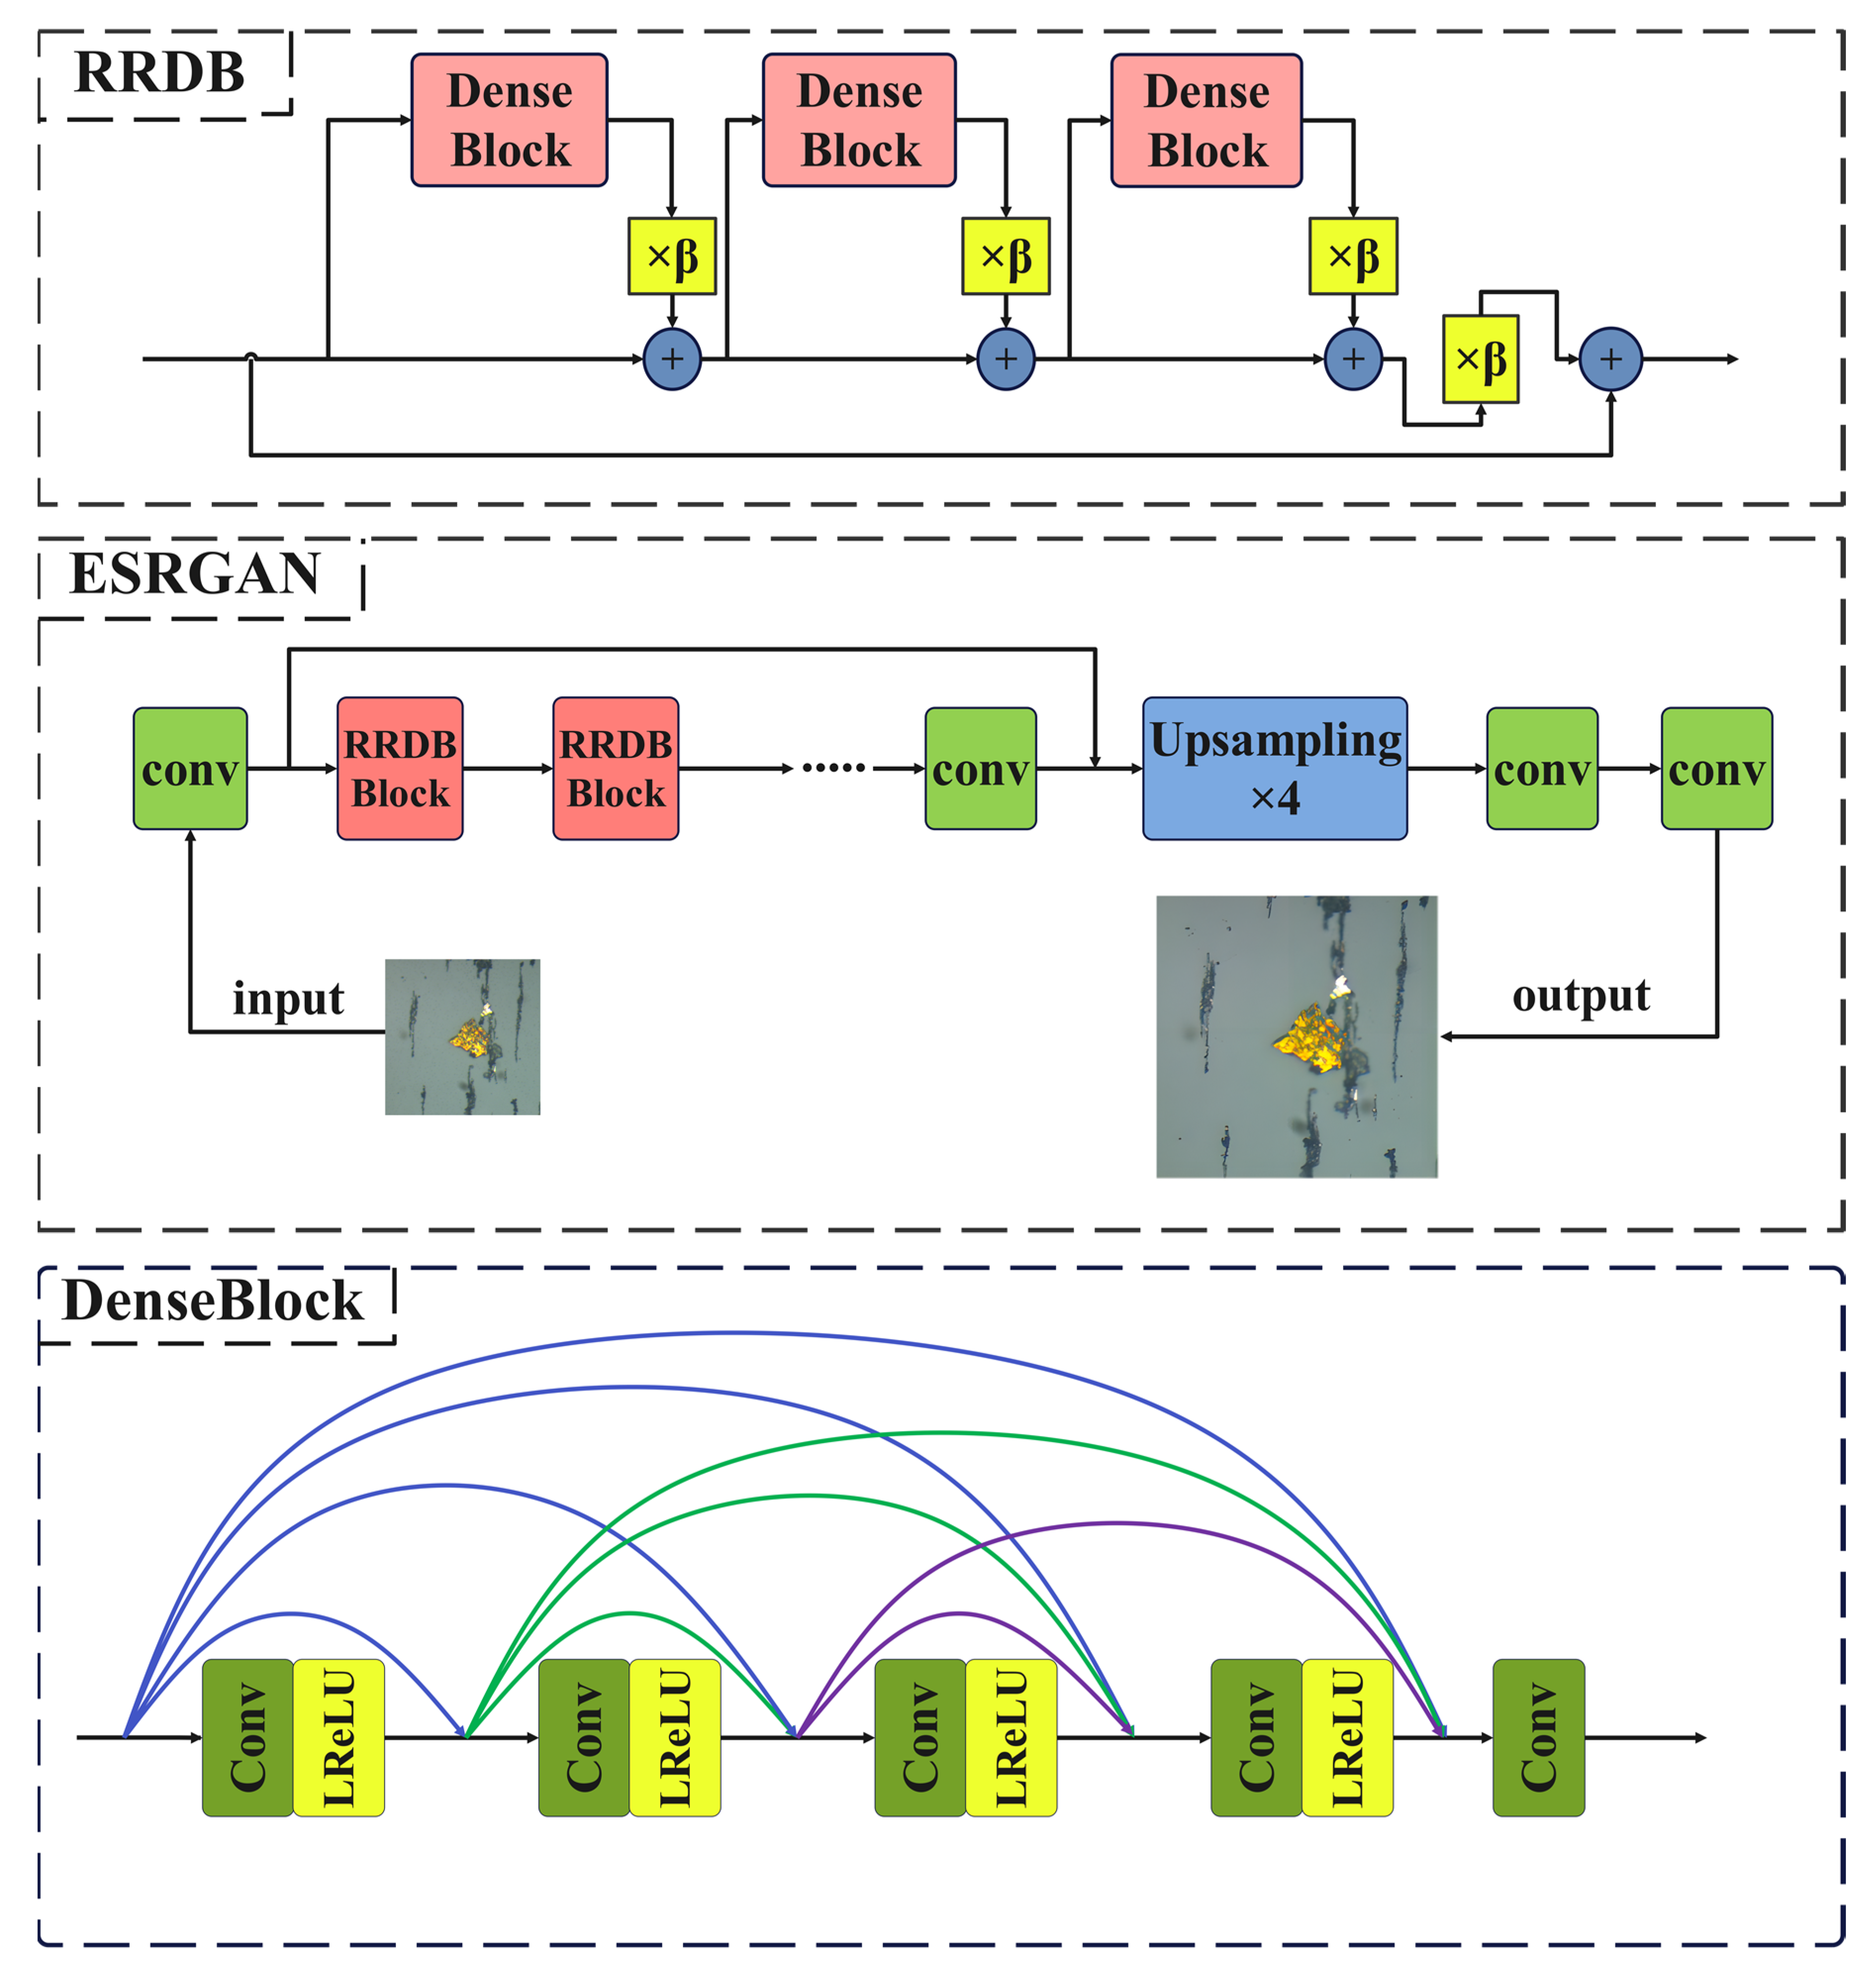
ESRGAN is a super-resolution algorithm based on GAN, which realizes the super-resolution of images by learning the mapping from low-resolution images to high-resolution images. It uses the confrontational learning characteristics of GAN to continuously optimize the super-resolution effect of the generator in the confrontation between the generator and the discriminator. Compared with traditional interpolation algorithms, ESRGAN can generate more detailed high-resolution images. The schematic diagram of ESRGAN is shown in Figure 2, and its function is to generate high-resolution pictures by inputting a low-resolution picture. The network is mainly composed of three parts: (1) a shallow feature extraction network, which is used to extract shallow features. Low-resolution pictures will go through a convolution +RELU function to adjust the number of input channels to 64; (2) an RRDB (residual in residual dense block) network architecture comprising n sets of RDB (residual dense block) dense residual blocks and one residual edge. Each set of RDB blocks includes five groups of convolutional layers followed by rectified linear unit (ReLU) activations; and (3) an upsampling network, whose function is to increase the height and width of the original image by four times and improve the resolution.

2.2. Deep Separable Vision Transformer (SepViT)

2.2.1. Parameter Operation Analysis of Depthwise Convolution Parameters

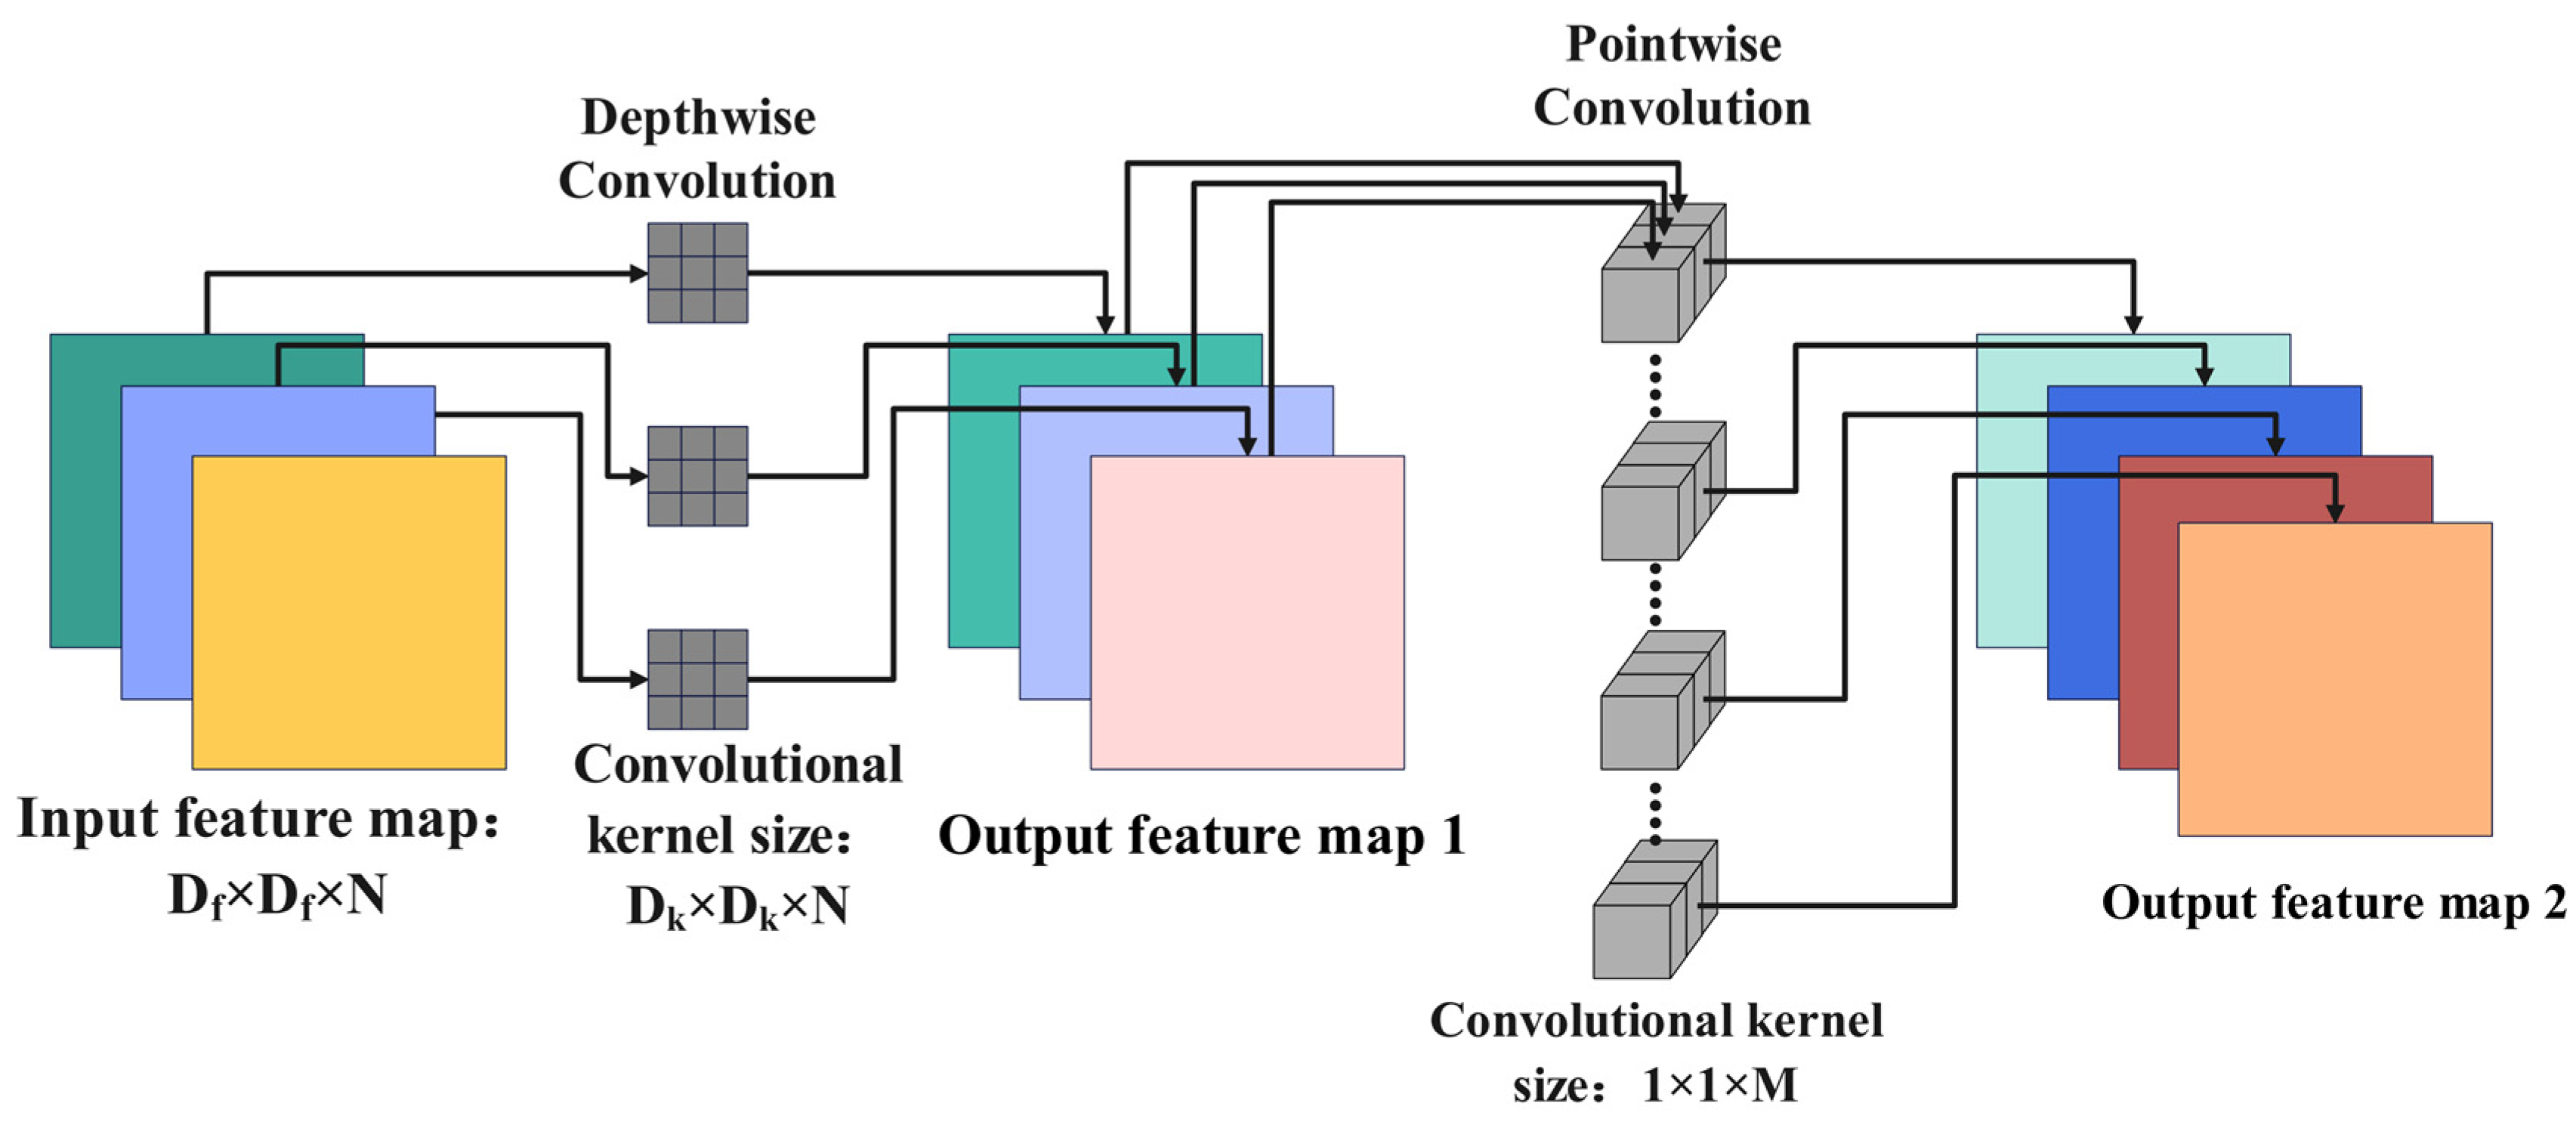
Depthwise convolution can be divided into two parts, as shown in Figure 3, namely, depthwise convolution and pointwise convolution, respectively [24]. Different from the conventional convolution operation, depth separable in the convolution process, one channel of the feature map is convolved by only one convolution kernel, and the number of convolution kernels is equal to the number of channels. Therefore, the expression of depthwise convolution is as shown in Equation (1):
G i , j , m = w = 1 , h = 1 w , h K w , h , m g X i + w , j + h , m
where G is the output feature graph, K is the convolution kernel with width w and height h, X is the input feature graph, m is the m-th channel of the feature graph, i,j are the (i,j) coordinates of the output feature graph on the m-th channel, and w and h are the convolution kernel weight element coordinates of the m-th channel.
Point-by-point convolution is basically the same as ordinary convolution, except that the size of the convolution kernel is set to 1 × 1. The schematic diagram of depth separable convolution is shown in Figure 3. Firstly, the features of each channel are extracted by the depth convolution, and then the features are correlated by point-by-point convolution. In the figure, Df and N are the side length and channel number of the input feature graph, Dk is the side length of the Dw convolution kernel, and M is the channel number of the Pw convolution. The depthwise convolution replaces the standard convolution with less parameters and computation, which is compared with the computation of the standard convolution, as shown in Equation (2):
P 1 P 2 = D f 2 D k 2 M + D f 2 M N D f 2 D k 2 M N = 1 N + 1 D k 2
where P1 and P2 are the calculation quantities of depthwise convolution and standard convolution, respectively.
In the process of feature extraction, the size of the convolution kernel is usually 3 × 3. Therefore, the amount of calculation and parameters of the depthwise convolution is about 1/9 of that of the conventional convolution. From the comparison of calculation amount, SepViT, which uses the idea of depthwise convolution, is smaller than the parameters and parameter operations of ViT, thus learning more deeply.

2.2.2. SepViT Algorithm Principle

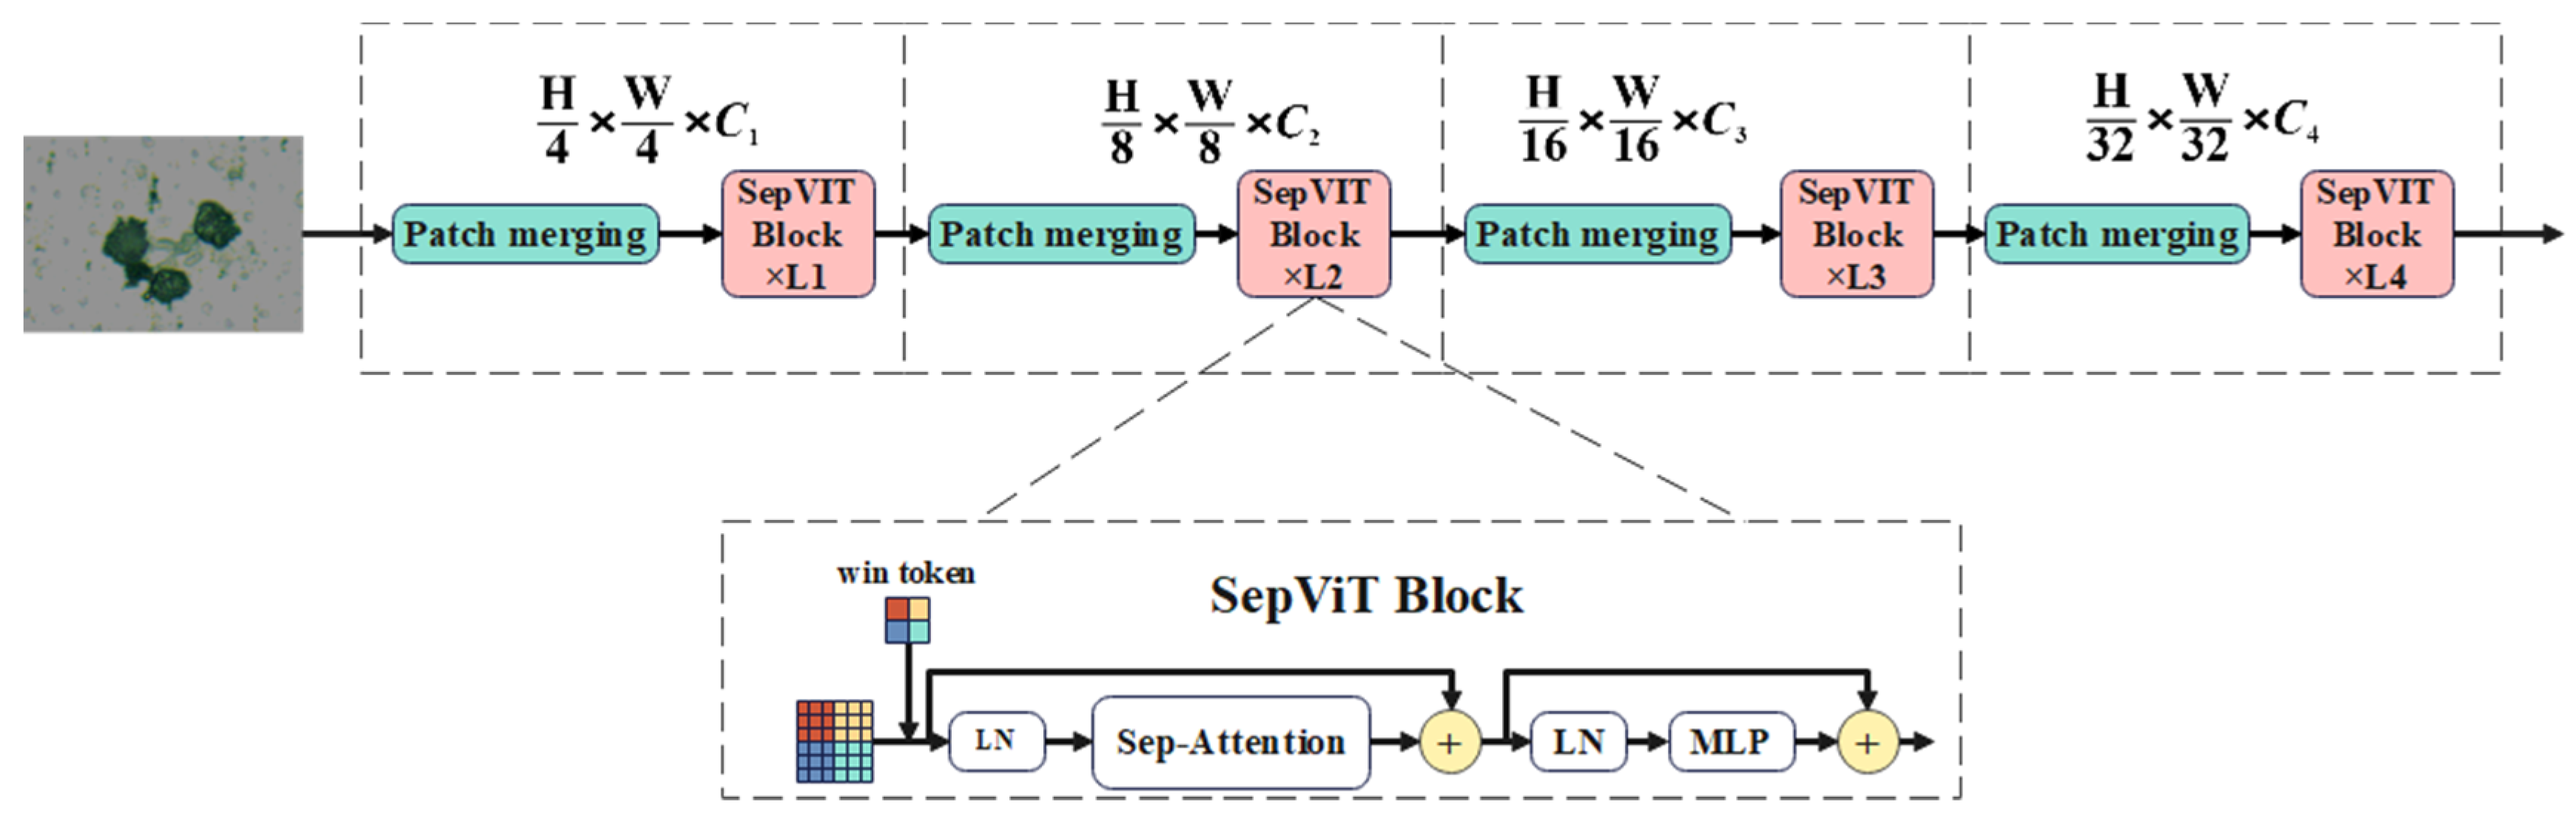
SepViT uses conditional position coding. SepViT at each stage has an overlapping patch merging layer for feature image downsampling, followed by a series of SepViT blocks. The spatial resolution is downsampled step by step with stride = 4 or stride = 2, reaching 32 times downsampling, and the channel size is gradually doubled. This operation comes from PVT(Pyramid Vision Transformer). Compared with ViT, PVT introduces a pyramid structure similar to CNN. Compared with the traditional ViT, the core optimization of SepViT lies in the calculation of attention. The internal self-attention mechanism is redesigned mainly through depthwise convolution, in which Sep-attention consists of two parts: depthwise convolution self-attention and pointwise convolution self-attention, and the depth convolution self-attention is mainly used for feature map extraction. The principle structure diagram of SepViT is shown in Figure 4.
SepViT 
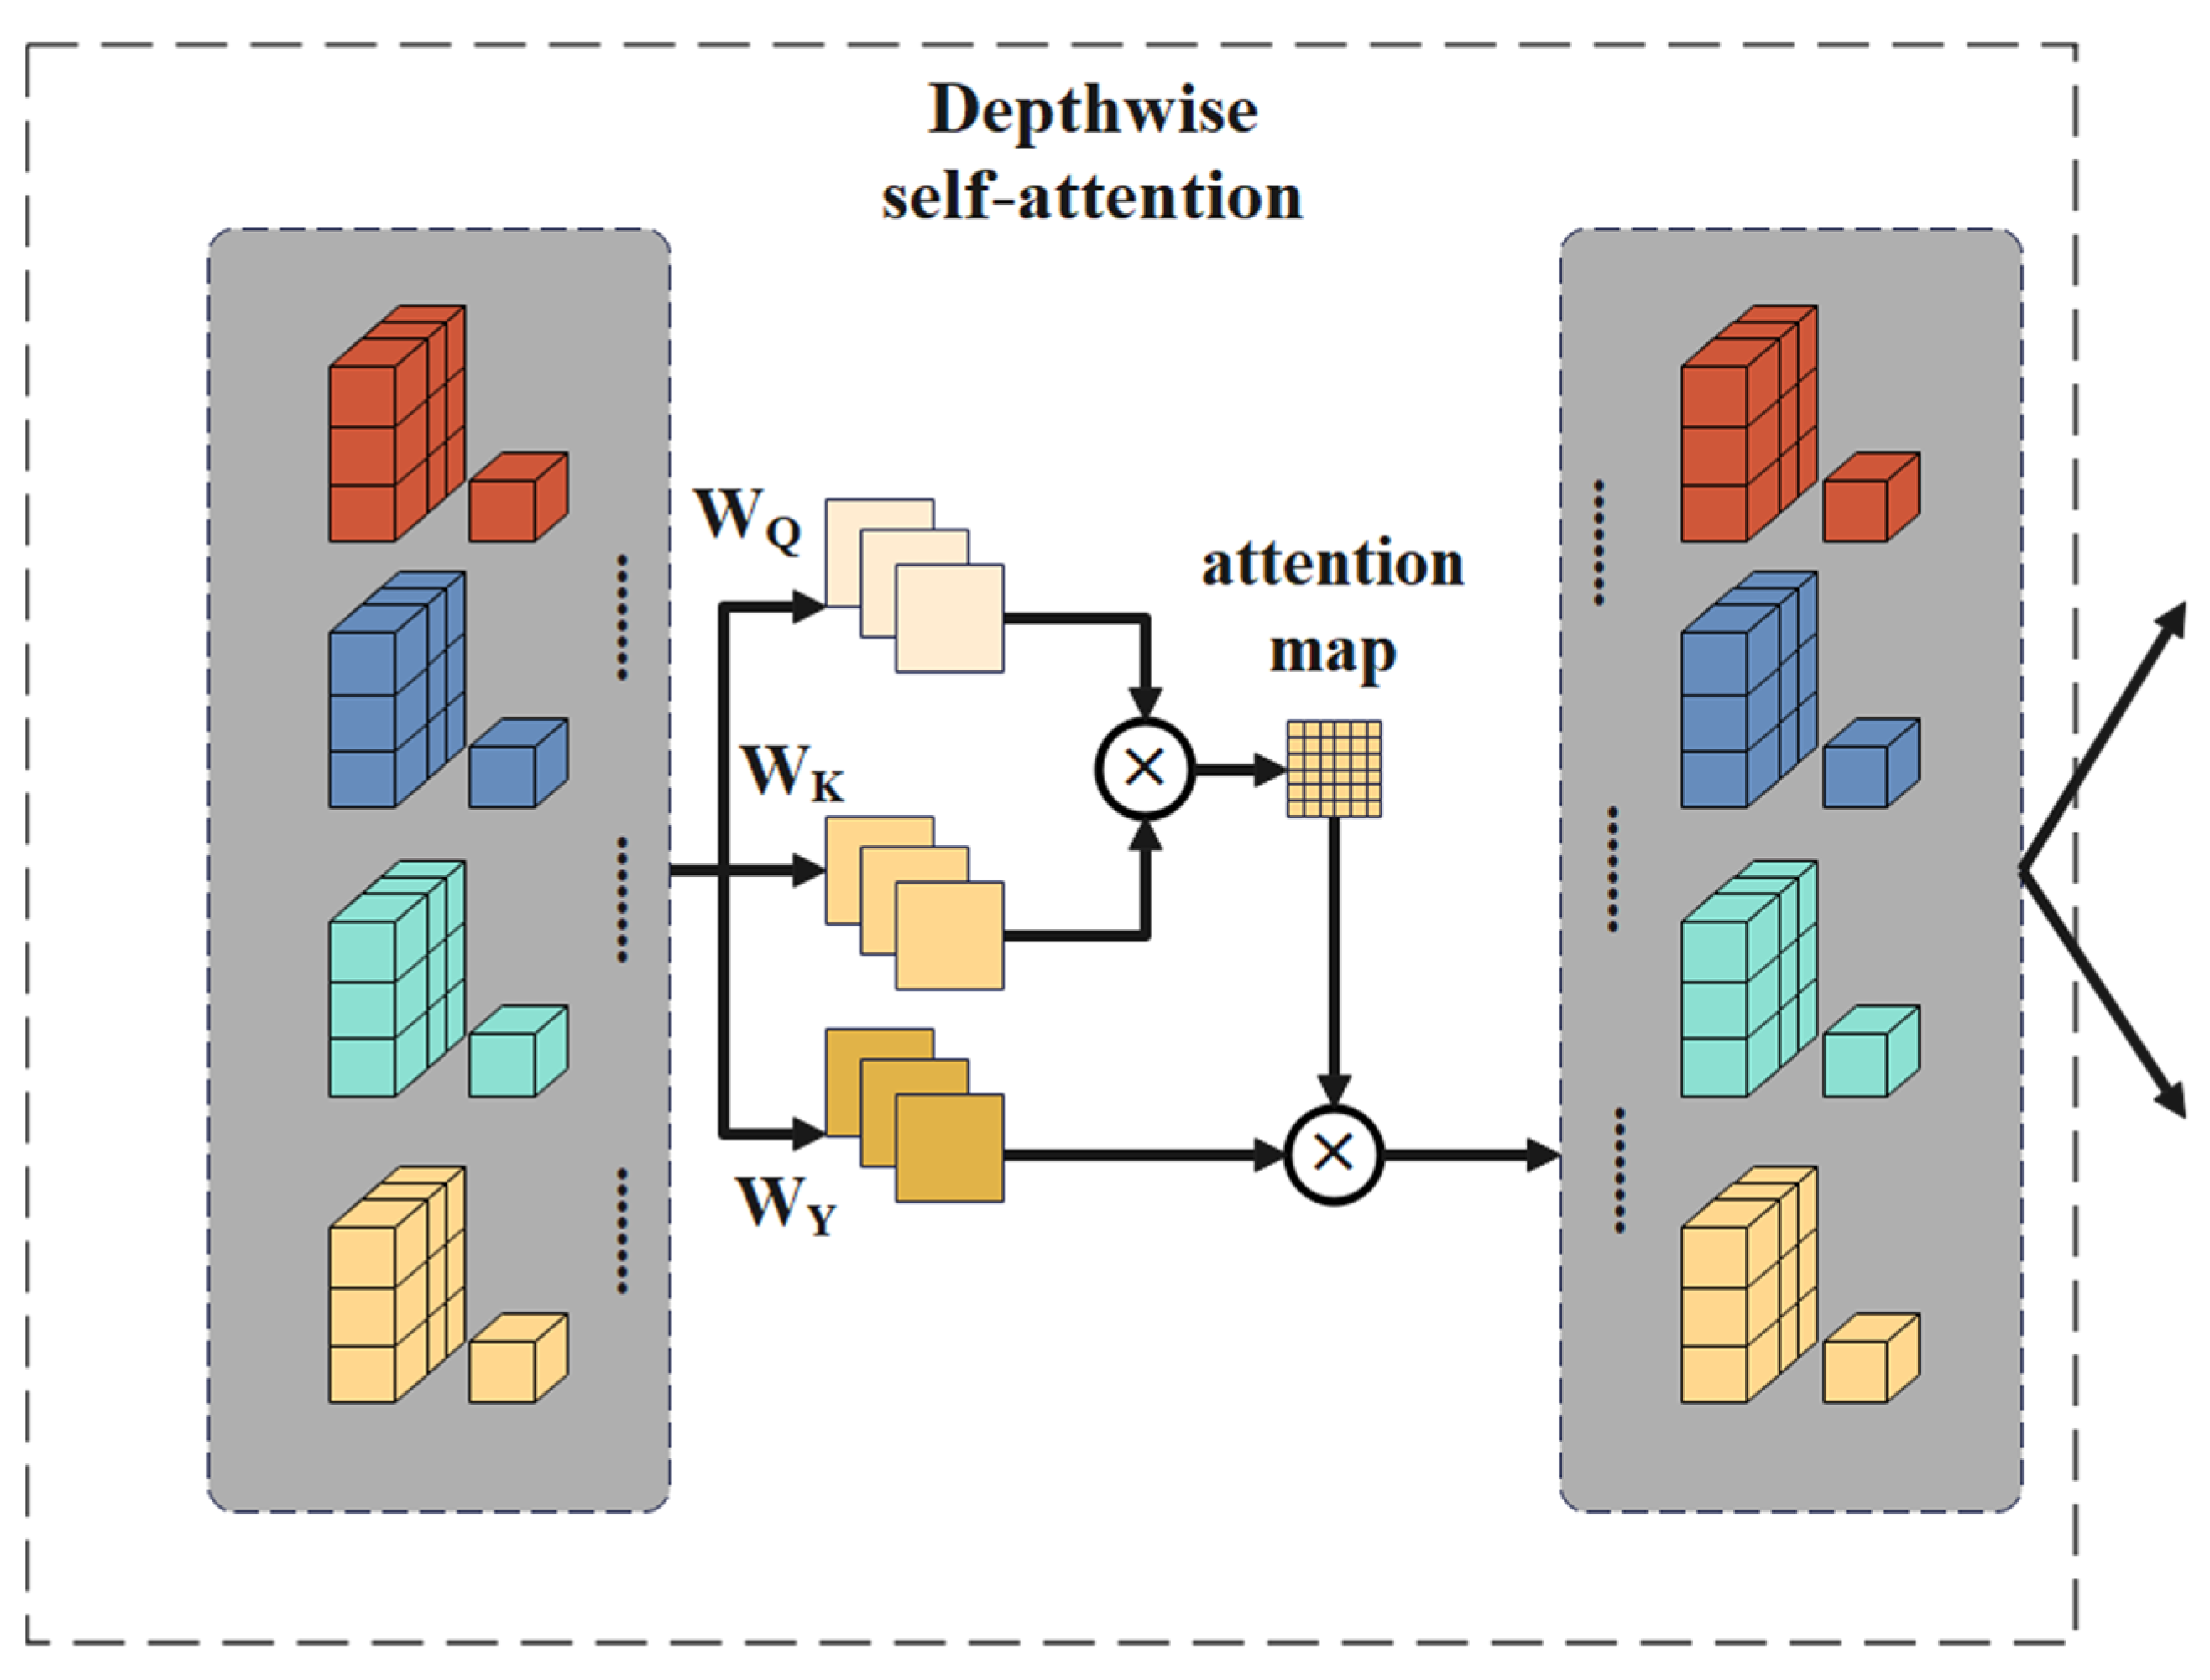
DWA (depthwise self-attention) is a self-attention scheme based on windows, which simplifies interactive calculation computing between windows by introducing an independent window token. The token can be initialized to a fixed vector or a learnable vector. Experiments show that the learnable vector is better than the strategy based on average pooling and depthwise convolution. Through DWA, the interaction between the window token and pixel token in the window is realized, so it can be used as the global representation of the window and perform an attention operation on the sequence set of all pixel tokens in the window and the corresponding window token and process the information in a separate window. This operation can regard them as a channel for inputting the feature map, and these windows contain different information. Therefore, the window-wise operation here is similar to the depthwise convolution layer, which aims at fusing the spatial information in each channel. The principle diagram of the deep convolution self-attention convolution operation is shown in Figure 5.
The implementation of DWA can be summarized as in Equation (3):
D W A ( z ) = A t t e n t i o n ( z g W Q , z g W K , z g W V )
where z is a feature token, which consists of pixels and a window token. WQ, WK, and WV represent three linear layers, which are used for the general self-attention of query, key, and value calculation, respectively. Attention refers to the standard self-attention operator that works on the local window.
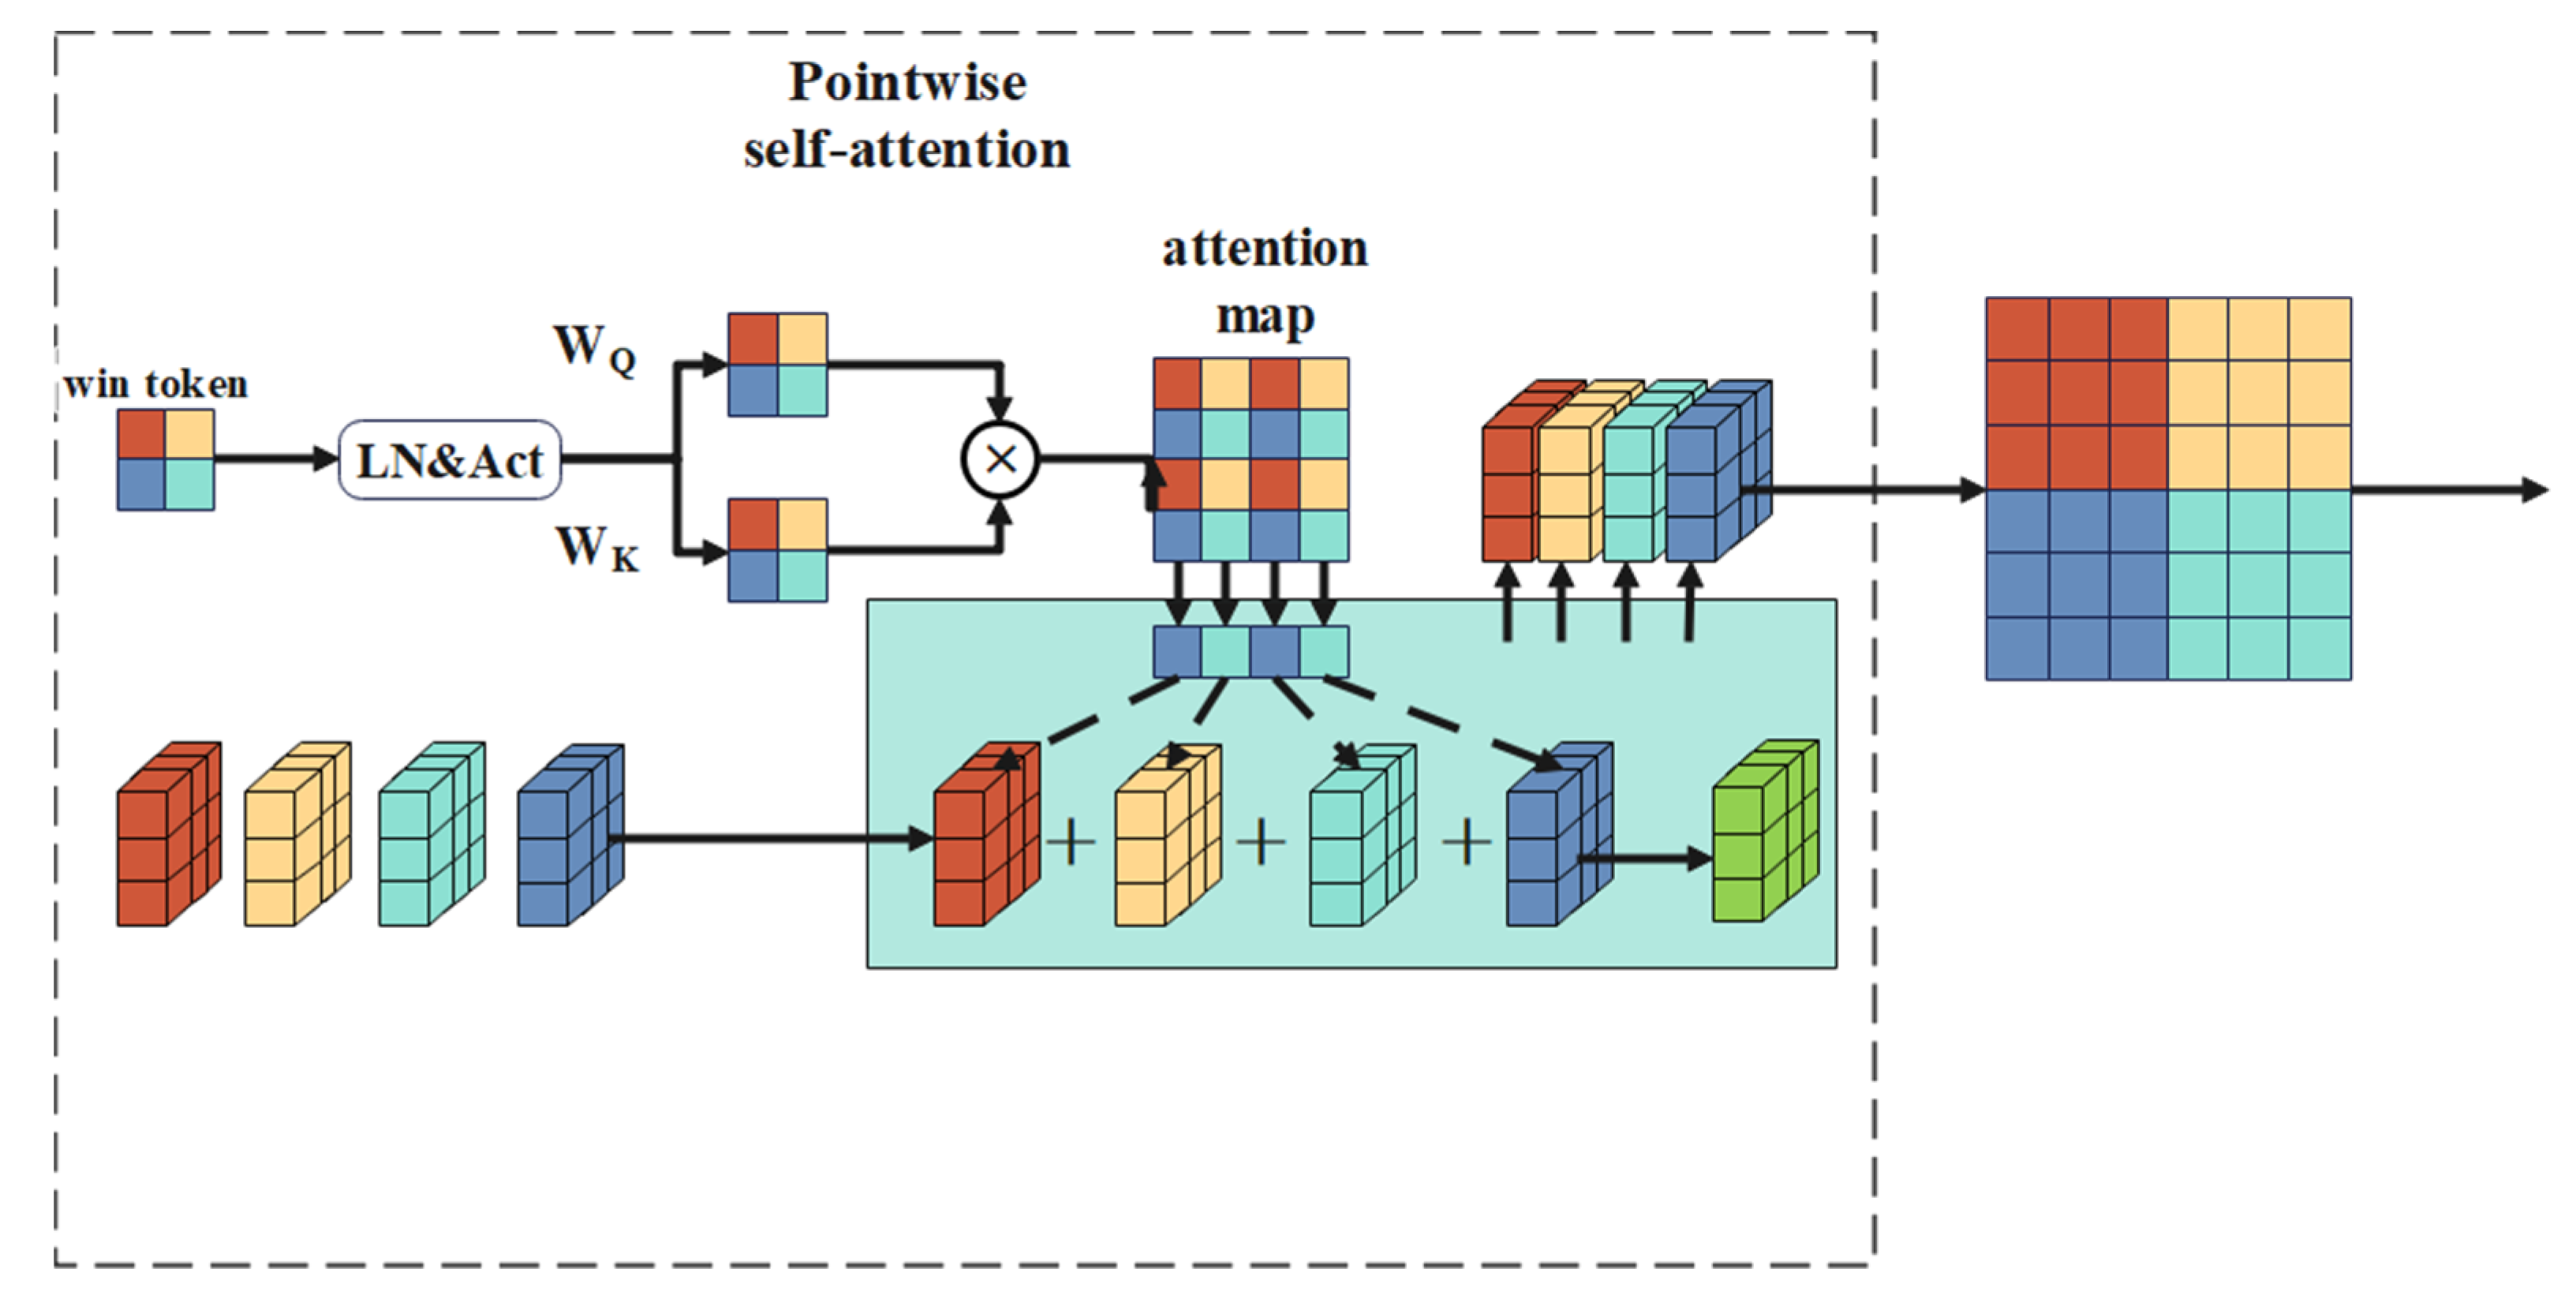
PWA builds a cross-window interaction by simulating pointwise convolution for associated channels, so as to obtain the final feature map. Firstly, the feature map and window tokens are extracted from DWA, and then the window tokens are used to model the attention relationship between windows. After LN (layer normalization) and Gelu (activation function), Q and K are obtained by two independent linear mappings, and an attention map between windows is generated. At the same time, the previous feature map is directly regarded as the V of PWA (without additional processing), and the window dimension is globally weighted to calculate the final output. The schematic diagram of the point-by-point convolution self-attention operation is shown in Figure 6.
Formally, the implementation of PWA can be described as in Equation (4):
P W A ( z , w t ) = A t t e n t i o n ( G e l u ( L N ( w t ) ) g W Q , G e l u ( L N ( w t ) ) g W K , z )

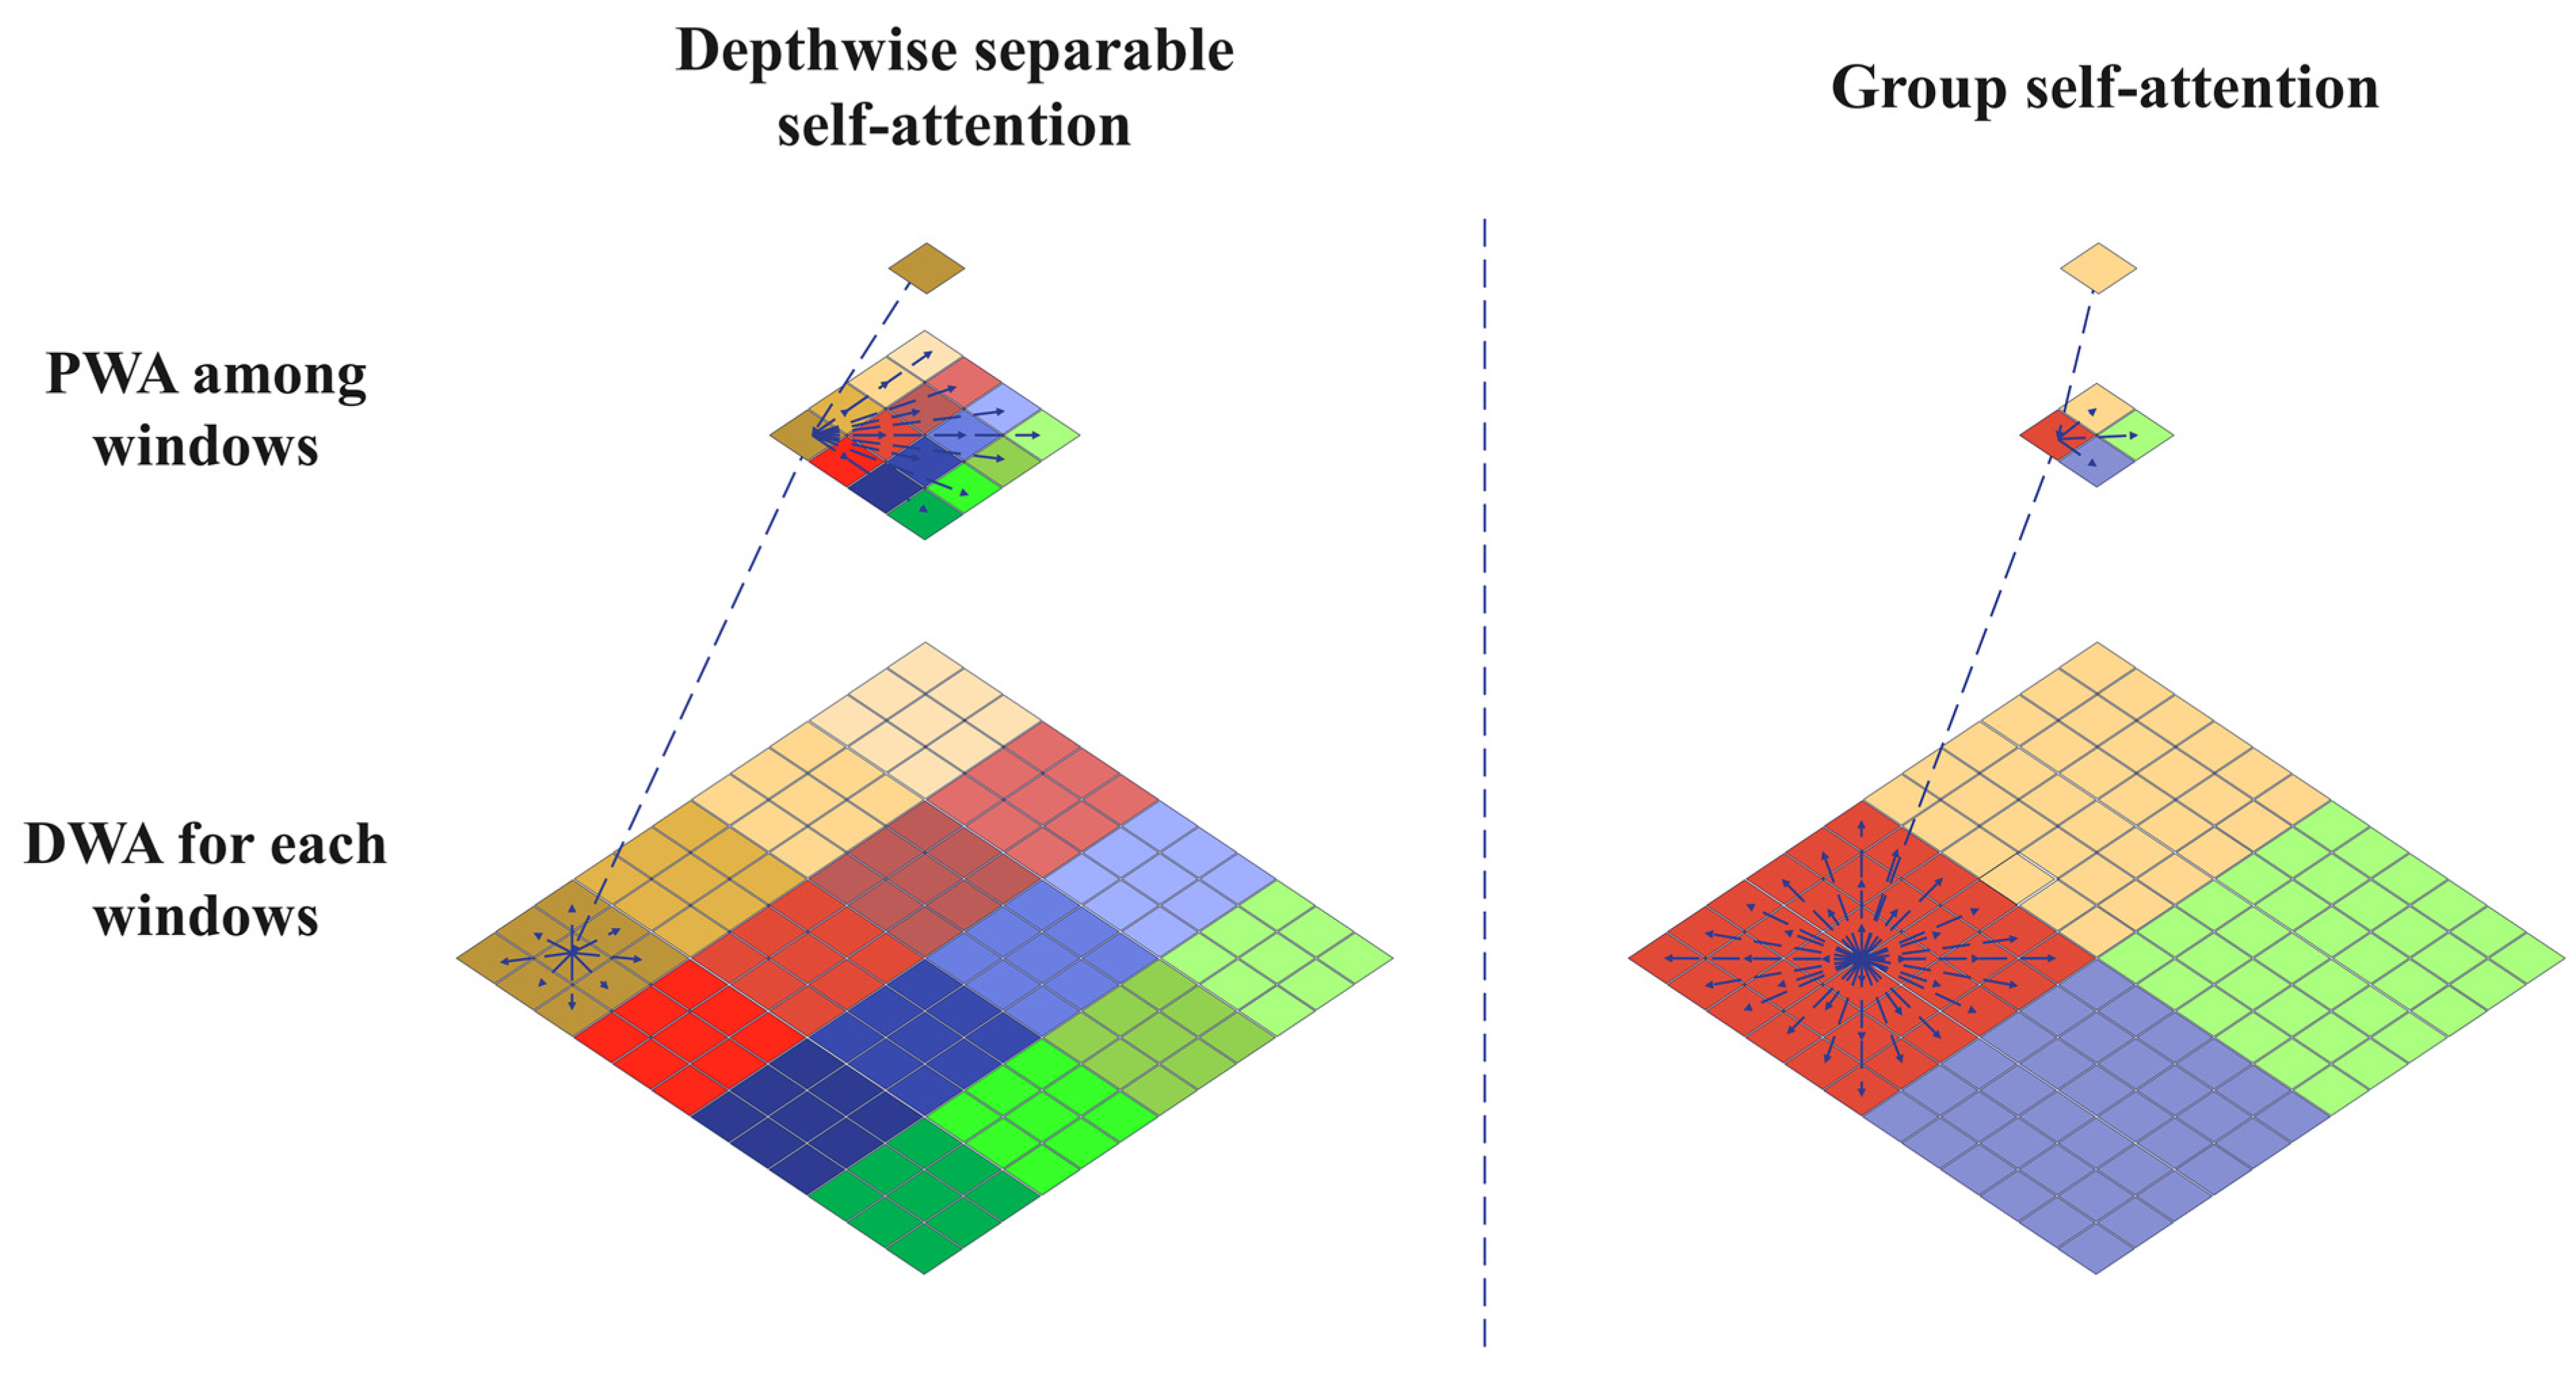
Group Self-Attention (GSA)

In addition to DWA and PWA, the SepViT’s depth separation from the attention mechanism also introduces the idea of the grouping convolution of AlexNet [25]. As shown in Figure 7, the grouping self-attention mechanism splices adjacent subwindows into larger windows, which is similar to dividing windows into group. Using DWA in a group of windows, GSA can capture the long-term visual dependence of multiple windows. In terms of calculation cost and performance gain, GSA has additional cost to DSSA (depthwise separable self-attention), but it also has better performance. Finally, the block with GSA is applied to SepViT and runs alternately with DSSA in the later stage of the network.

2.3. ResNet50 Algorithm Principle

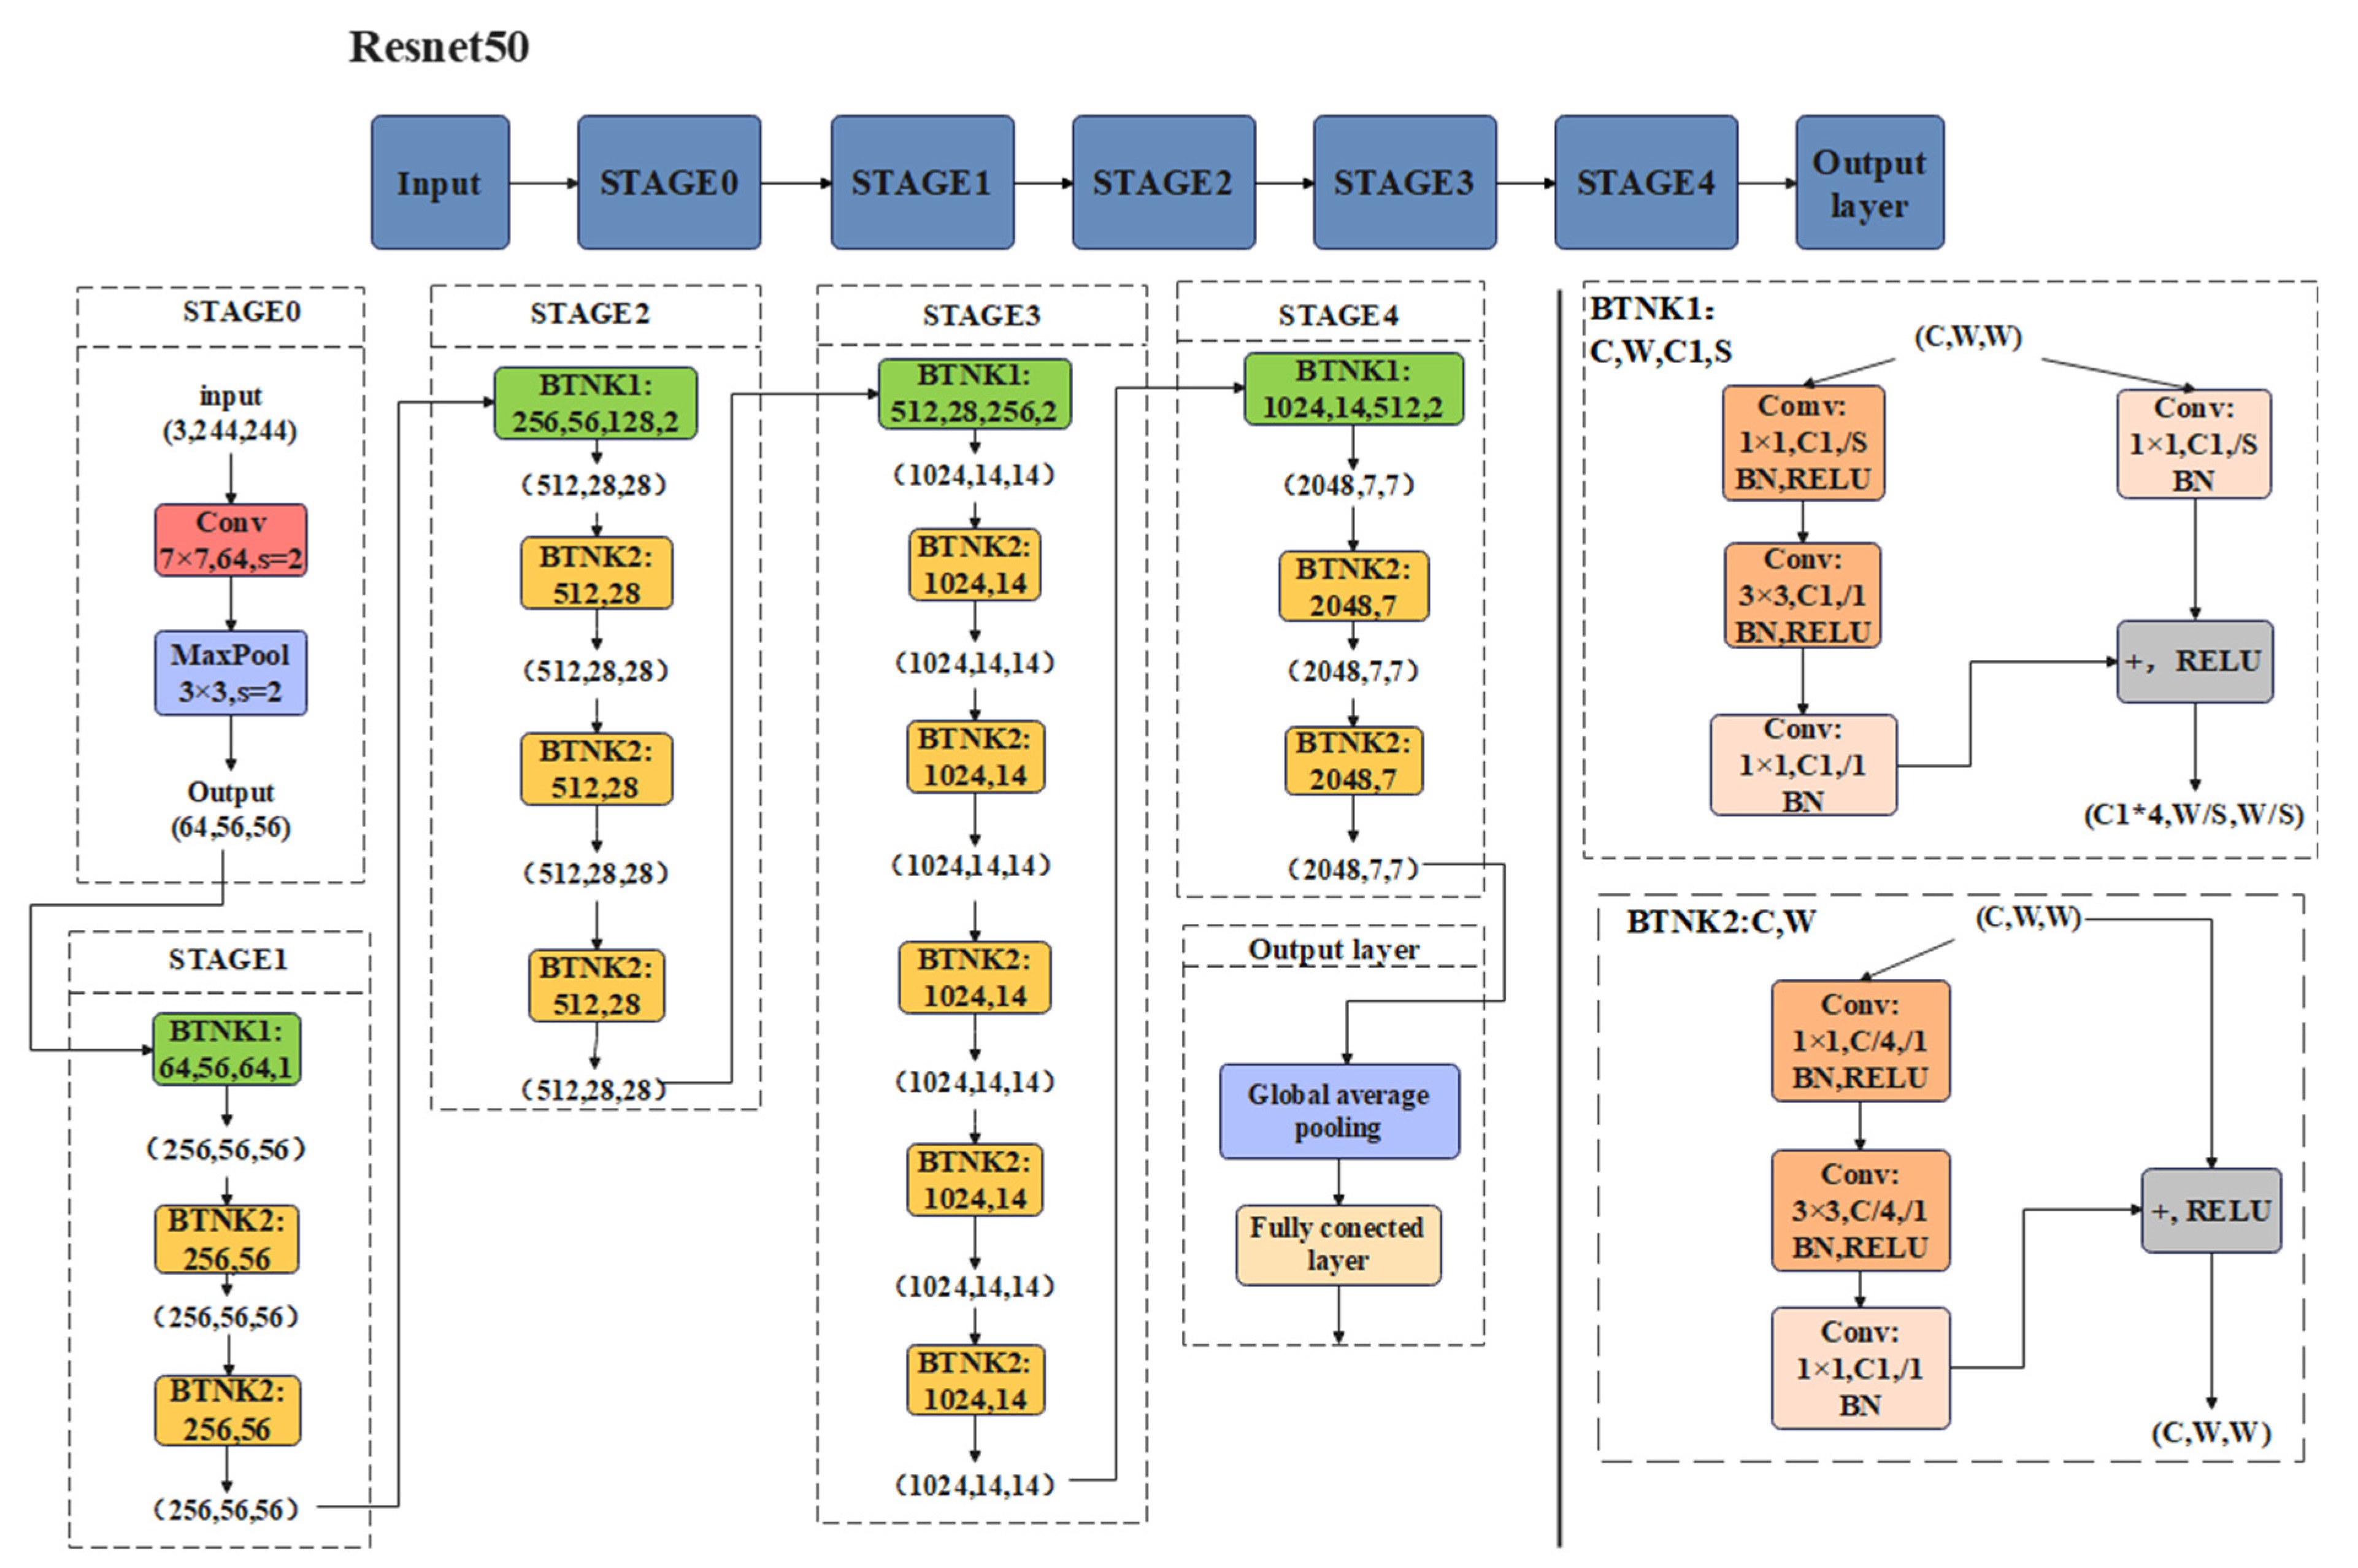
ResNet50 is a deep convolution neural network, which extracts image features through multiple convolution layers and pooling layers and inputs these features into the fully connected layer for classification. The whole network structure is divided into five stages and an output layer. Stage0 includes a convolution layer and a maximum pooling layer for adjusting image input; Output layer is composed of global average pooling layer and fully connected layer, which is used to output the classification results of images. Except Stage0 and Output layer, the other four stages adopt residual network structure. The schematic structure diagram of the ResNet50 network is shown in Figure 8.
In ResNet50, a bottleneck is widely used in the residual network, which is mainly used to solve the problem of different channels. The bottleneck includes two modes: when the number of input and output channels is the same, the BTNK2 mode is adopted; when the number of input and output channels is different, the BTNK1 mode is adopted. The BTNK2 mode has two variable parameters, C and W, which, respectively, represent the number and width of channels in the input shape (C, W, W). Let x be input with the shape of (C, W, W) and let the three convolution blocks on the left side of BTNK2 (and related BN and ReLU) be the function F(x), then the output of BTNK2 is F(x) + x, and the output shape is still (C, W, W) after a ReLU activation function. The BTNK1 mode includes a convolution layer on the right, which turns the input x into G(x) to match the difference in the number of input and output channels and then performs the summation operation F(x) + G(x).
Specifically, each residual block in ResNet50 includes two paths: one is to directly transfer the input data to the output, and the other is to perform convolution and activation function processing on the input data and then add the processed result with the original input to obtain the output. This design can avoid the problems of gradient disappearance or explosion during training and help the network learn more complex features. Finally, ResNet50 can classify the input images efficiently and accurately, so it is widely used in various image-related tasks.

2.4. Fusion Integration Model

In this study, an integrated model of prediction results is used to improve the classification accuracy. The research shows that the greater the difference among the models, the better the integrated model performance [26]. SepViT is a new type of ViT, which has the ability of mining long-distance dependencies and powerful parallel computing, but like ViT, it lacks the inductive bias of convolutional neural networks, such as translation invariance and local correlation. On the other hand, ResNet50 is a powerful convolutional neural network, but its core convolution operation lacks the global understanding of the image, cannot build dependency between features, cannot make full use of context information and convolution fixed weights, and cannot dynamically adapt to the changes of input.
In order to solve the problem of abrasive image classification, this paper combines SepViT and ResNet50 models to distinguish the image differences comprehensively by using two different feature extraction methods to obtain better classification results. Through the adaptive weighting algorithm, the optimal weighting factor is determined after testing, and the improved soft voting method is used to integrate the model. In the process of classification, an adaptive weighted fusion algorithm is adopted, the core idea of which is to adaptively find the optimal weighting factor corresponding to each classification model based on the accuracy of all classifications in order to obtain the optimal fusion result. There are two classification models in this study, so let the variance of the two classification models be σ 1 2 and σ 2 2 , respectively, and the true value to be estimated is S. The classification accuracy of each classification model is X1 and X2, which are unbiased estimates of S and independent of each other. The weighting factors of each classification model are W1 and W2, respectively, so the fused X ^ value and each weighting factor satisfy the following conditions:
{ X ^ = W 1 X 1 + W 2 X 2 W 1 + W 2 = 1
Population variance is
σ 2 = E [ W 1 ( S X 1 ) 2 + W 2 ( S X 2 ) 2 ] = W 1 2 σ 1 2 + W 2 2 σ 2 2
According to Equation (6), E represents the expected value, population variance σ 2 is a multivariate quadratic function about each weighting factor W1 and W2 of the classification model, and there must be a minimum value, and its minimum population variance is
σ min 2 = 1 1 σ 1 2 + 1 σ 2 2
The corresponding optimal weighting factors are
W 1 = 1 σ 1 2 ( 1 σ 1 2 + 1 σ 2 2 )
W 2 = 1 σ 2 2 ( 1 σ 1 2 + 1 σ 2 2 )
After calculating the variance and adaptive optimal weighting factor of each classification model by using Equations (6)–(9), and then carrying out adaptive weighted fusion on the data of each classification model, the calculated value after fusion is
X ¯ ^ = P = 1 2 W P X ¯ P ( k )
In Equation (10), W P represents the weighting factor corresponding to the P-th model, X ¯ P is the average of multiple prediction results from the P-th model, and k denotes the number of predictions.
{ σ ¯ 2 = 1 k ( W 1 2 σ 1 2 + W 2 2 σ 2 2 ) σ min 2 = 1 k ( 1 σ 1 2 + 1 σ 2 2 )
Equation (11) can be used to calculate the fused population variance and minimum population variance and evaluate the accuracy after fusion. The calculated weighting factors are 0.4 and 0.6, and each sample xmn is subjected to binary soft voting under each category label. The classification probability of each sample xmn under two models of each category label is
p m n = ( p 0 m n , p 1 m n , p 2 m n , p 3 m n , p 4 m n )
where P0mn represents the probability that the m-th sample is judged as a positive example class under the 0-th category label of the n-th model and P1mn, P2mn, P3mn, P4mn, and so on. After finding Pmn, the output of the SepViT model is the probability of the tag multiplied by the weighting factor W1, and the output of the CNN model is multiplied by the weighting factor W2. After adding the two, the predicted output of the sample is the probability of this label, that is
P m = n = 1 2 p m n · W n
Find the final classification probability Pm of the sample xmn under the five categories of labels, and output the label with the highest probability of the sample under Pm.

3. Experiment

3.1. Experimental Dataset Making

This experiment uses BRUKER’s latest testing machine UMT Tribo Lab to adjust the type of friction pair, friction distance, and reciprocating frequency and speed by changing the form of friction [27]. Table 1 lists the main parameters of the reciprocating module of the BRUKER testing machine. After many experiments and comparisons, the conditions for generating different wear particles were found, such as severe sliding wear particles under the condition of boundary lubrication for 5 h and fatigue wear particles under the condition of boundary lubrication for 20 h. In addition, serious sliding and fatigue wear particles can be generated in the rotary pin experiment under the conditions of a pressure of 260 N and a wear time of 10 h, and cutting wear particles can be generated in the four-ball experiment under the conditions of a pressure of 500 N and a wear time of 1 h. Through these experiments, we obtained all kinds of images of wear particles and formed a dataset. As shown in Figure 9, this is a schematic diagram of the experimental process in this paper.
This article explores wear particles’ varied shapes from different observation angles and employs 3D reconstruction techniques to capture topological images and the morphological features of their surfaces [29]. We also consider the influence of texture types on the particles’ surface characteristics by extracting and analyzing texture information, thereby enhancing the reliability of wear particle classification.
After high-temperature testing, wear particles may adhere to the worn surface [30]. To address this, we utilize scanning electron microscopy (SEM) to directly collect and observe the morphology and composition of these particles. The high-resolution imaging capability of SEM enables the accurate classification and identification of different types of wear particles based on characteristics such as morphology, size, color, and composition [31].
The present study classifies and identifies various types of wear particles, including cutting wear particles, severe sliding wear particles, fatigue wear particles, oxidation wear particles, and spherical wear particles, as shown in Figure 10. A total of 4435 images of these wear particles was captured using experimental equipment with dimensions of 2568 × 1912 pixels. The dataset was processed and enhanced using the image enhancement algorithm ESRGAN. Subsequently, the images were resized to a dimension of 640 × 640 pixels to create a comprehensive dataset for further analysis. The image data were appropriately organized into corresponding folders based on their classification. Detailed information regarding the dataset can be found in Table 2 below.
The SV-ERnet integrated model is employed in this study for the classification and recognition of wear particle images. The collected dataset is divided into a training set, verification set, and test set with proportions of 60%, 20%, and 20% respectively. Ten separate experiments are conducted while keeping the training set, verification set, and test set unchanged, with the average value from these experiments considered as the final result.

3.2. Experimental Parameter Setting

In this paper, the experimental environment uses an Intel (R) Core (TM) i7-9700k CPU @ 3.60 GHz, with 32.0 GB of memory and GPU NVIDIA Geforce RTX3090. The open source pytorch framework is adopted in the software environment to build the network model and carry out experiments. Because there are few samples collected, this paper uses the Augmentor data enhancement method in Python to enhance the dataset and improve the generalization of the training model.

3.3. Evaluation Indicators

The test set is divided into five categories, which can be defined as t = (t1, t2, t3, t4, t5). In the test set, the prediction class p = (p1, p2, p3, p4, p5) is obtained. In order to compare the performance with other models, this study uses five indicators as evaluation criteria: A (accuracy), P (precision), R (recall), S (specificity), and F1-Score. Firstly, TP, FP, TN, and FN are defined. TP is defined as the number of pictures that the predicted tag matches the target tag, as shown in Equation (14):
N T P , i = | P i T i | , i = 1 , 2 , 3 , 4 , 5
FP is defined as the number of pictures that the predicted tags do not match the real target tags, as shown in Equation (15):
N F P , i = | P i \ T i | , i = 1 , 2 , 3 , 4 , 5 ,
FN is defined as the number of pictures that do not belong to the target tag but are wrongly predicted, as shown in Equation (16):
N F N , i = | T i \ P i | , i = 1 , 2 , 3 , 4 , 5 ;
TN is defined as the number of pictures that do not belong to the target label and are predicted correctly and are not classified, as shown in Equation (17):
N T N , i = d C , d c | T d |
Therefore, the calculation equations of A, P, R, S, and F1-Score are as follows:
A = i = 1 5 N T P , i i = 1 5 ( N T P , i + N F P , i + N F N , i + N T N , i ) , i = 1 , 2 , 3 , 4 , 5
P = N T P , i N T P , i + N F P , i , i = 1 , 2 , 3 , 4 , 5
R = N T P , i N T P , i + N F N , i , i = 1 , 2 , 3 , 4 , 5
S = N F P , i N T N , i + N F P , i , i = 1 , 2 , 3 , 4 , 5
F 1 S c o r e = 2 × P × R P + R
In Equations (18)–(22), i represents the sample label category. If the accuracy and precision are closer to 1, the model is more reliable.

4. Results Analysis

4.1. Visual Interpretation of Intelligent Classification Results and Models

Through the analysis of experimental data, it can be seen that the two subnetwork models have a high accuracy improvement speed in the first 20 rounds of iteration. At 20 rounds, the accuracy of both models can be improved to about 80%. With the increase in iteration times, the training accuracy of SepViT gradually exceeds that of ResNet50, and the verification accuracy is similar. As shown in Figure 11b and Figure 12b, during the first 20 iterations of the two models, both the training loss and the verification loss showed a rapid downward trend. With the increase in iteration times, the training loss and verification loss of ResNet50 decreased almost synchronously, while the loss gap of SepViT became wider and wider. The training loss was lower than that of ResNet50, and the verification loss was higher than that of ResNet50, as shown in Figure 11a and Figure 12a.
Through the analysis of experimental data, it can be seen that the trained model draws the confusion matrix on the test set. From the results of confusion matrix, it can be seen that compared with ResNet50, the SepViT model is better than ResNet50 in identifying cutting wear particles, fatigue wear particles, oxidized wear particles, and spherical wear particles. However, SepViT did not perform well in feature recognition between severe sliding wear particles and fatigue wear particles, with 41 misjudgments, the data indicated by the two red arrows in Figure 13b. In contrast, ResNet50’s residual convolution neural network enables it to better understand and classify the characteristic differences between severe sliding wear particles and fatigue wear particles. ResNet50 has only 25 misjudgments of severe sliding and fatigue wear particles, the data indicated by the two red arrows in Figure 13a. This shows the advantages of SepViT in global feature capture wear particle analysis and the defects in local feature capture. Therefore, in terms of feature capture, it can be analyzed that the processing methods of ResNet50 and SepViT will have an important impact on the results, as shown in Figure 13a,b.
In addition, we compared the integration model SV-ERnet proposed in this paper with other deep learning methods such as ResNet101 [32], VGG16 [33], MobileNetV2 [34], EfficientV1 [35], and AlexNet. Table 3 shows the recognition results of the different models on the datasets. The results show that our method is superior to other methods in recognition accuracy and has achieved a competitive performance. Specifically, the depth separable Vision Transformer (SepViT) we use improves the recognition accuracy by 1.8–6.8% compared with some conventional networks.
In order to further understand the advantages of the integrated model in this paper, the proposed SV-ERnet and other models evaluated the classification effect of each kind of wear particle in detail. The specific details are shown in Figure 14a–d, which, respectively, correspond to the performance indices of each model for identifying different wear particles, namely, precision, recall, specificity, and F1-Score. From the histogram results, it can be seen that SV-ERnet has more comprehensive advantages than other models and has the best effect in the task of wear classification.

4.2. Ablation Experiment

In order to better explore the performance data of each network category in model fusion, we designed the following steps of an ablation experiment:
(1)
Select SepViT as the experimental model and record its experimental results.
(2)
Select ResNet50 as the experimental model and record its experimental results.
(3)
Conduct a model fusion experiment with the trained ResNet50 and the trained SepViT and record the experimental results.
The confusion matrix diagram shows the test results of the integration model on the test set, as shown in Figure 15. Compared with the test results in Figure 13a,b, the total number of mistakes for severe sliding wear particles and fatigue wear particles is 29, the data indicated by the two red arrows in Figure 15. The comparison results show that the integrated model SV-ERnet is more stable than ResNet50 and SepViT, and the data prediction results are more uniform and reliable. This perfectly takes into account the advantages of the residual convolutional neural network and Vision Transformer.
In order to better analyze the differences of classification effects among ResNet50, SepViT, and SV-ERnet for different wear particles, we recorded Table 4, Table 5 and Table 6 for the test set, which, respectively, correspond to the classification and identification performance indices of ResNet50, SepViT, and SV-ERnet for different wear particles. These tables provide the identification A, R, F1 score, and other indicators of each model on various types of wear particles.
From the analysis of the results, although the model SV-ERnet is not superior to ResNet50 or SepViT in the recognition accuracy of some specific wear particles, on the whole, the overall performance of the integrated model SV-ERnet is stable and powerful, and it can always maintain a high accuracy and stable performance for complex multiclass wear particle classification tasks. This shows that model fusion can improve the comprehensive performance while maintaining the advantages of each individual model.
In the above experiments, the analysis shows that the integrated model SV-ERnet has the best effect, but considering different weighting factors may further improve the performance of the model, so a radar chart is used to compare the accuracy of the integrated model under different weighting factors. The results show that the best effect is 94.1% when the weight of ResNet50 is set to 0.5 and the weight of SepViT is set to 0.5, the data indicated by the red box and arrows in Figure 16 is optimal. After analysis, it is found that the accuracy of the integrated model is even lower than that of the submodel in the case of a large difference in weight setting. Therefore, it is analyzed that the recognition weight of the low-weight model will cause some interference to the recognition and classification of another high-weight model in the case of a large difference in weight.

4.3. The Visualization and Analysis of Grad-CAM Results

Interpretability is very important for the task of wear particle image classification. Therefore, in this paper, the weighted gradient-like activation thermography (Grad-CAM) method is adopted to analyze the feature importance of wear particle image features [36]. The interpretability of the model allows classifiers to locate feature regions more efficiently and make effective judgments. As shown in Figure 17, two important types of abnormal wear particles, fatigue and severe sliding wear particles, were selected. The darker color in the activated heatmap indicates that the integrated model SV-ERnet, due to the utilization of depthwise separable convolutions and self-attention mechanisms, focuses more accurately on the regions during feature extraction and recognition compared to ViT and SepViT. It exhibits higher attention and learns more deeply than ViT and SepViT, leading to higher accuracy in recognition and classification.

4.4. t-SNE Clustering Results

In order to analyze the distribution of the training set data more clearly and intuitively, we use the trained ResNet50, SepViT, and SV-ERnet to analyze the clustering results of the training set image data through the t-SNE algorithm, and the clustering results are shown in Figure 18a,b. In the figure, each color represents different kinds of wear particles, and there are five kinds. The distribution positions of the characteristic clusters of the same kind of wear particle are different, mainly because the characteristic shapes of different wear particles are different, and the background complexity is also different. The classification in the three pictures is different, which shows that there are great differences between the three models in their understanding of the same wear characteristics. From the overall clustering results, the SV-ERnet model proposed in this paper has strong robustness for the identification of wear particles with different characteristics under different background conditions. This shows that the SV-ERnet model has extracted the features conducive to wear particle identification and classification in the training set. Therefore, the effectiveness of the ResNet50, SepViT, and SV-ERnet models in the multifeature recognition and classification of different wear particles in a complex background has been verified.

5. Conclusions

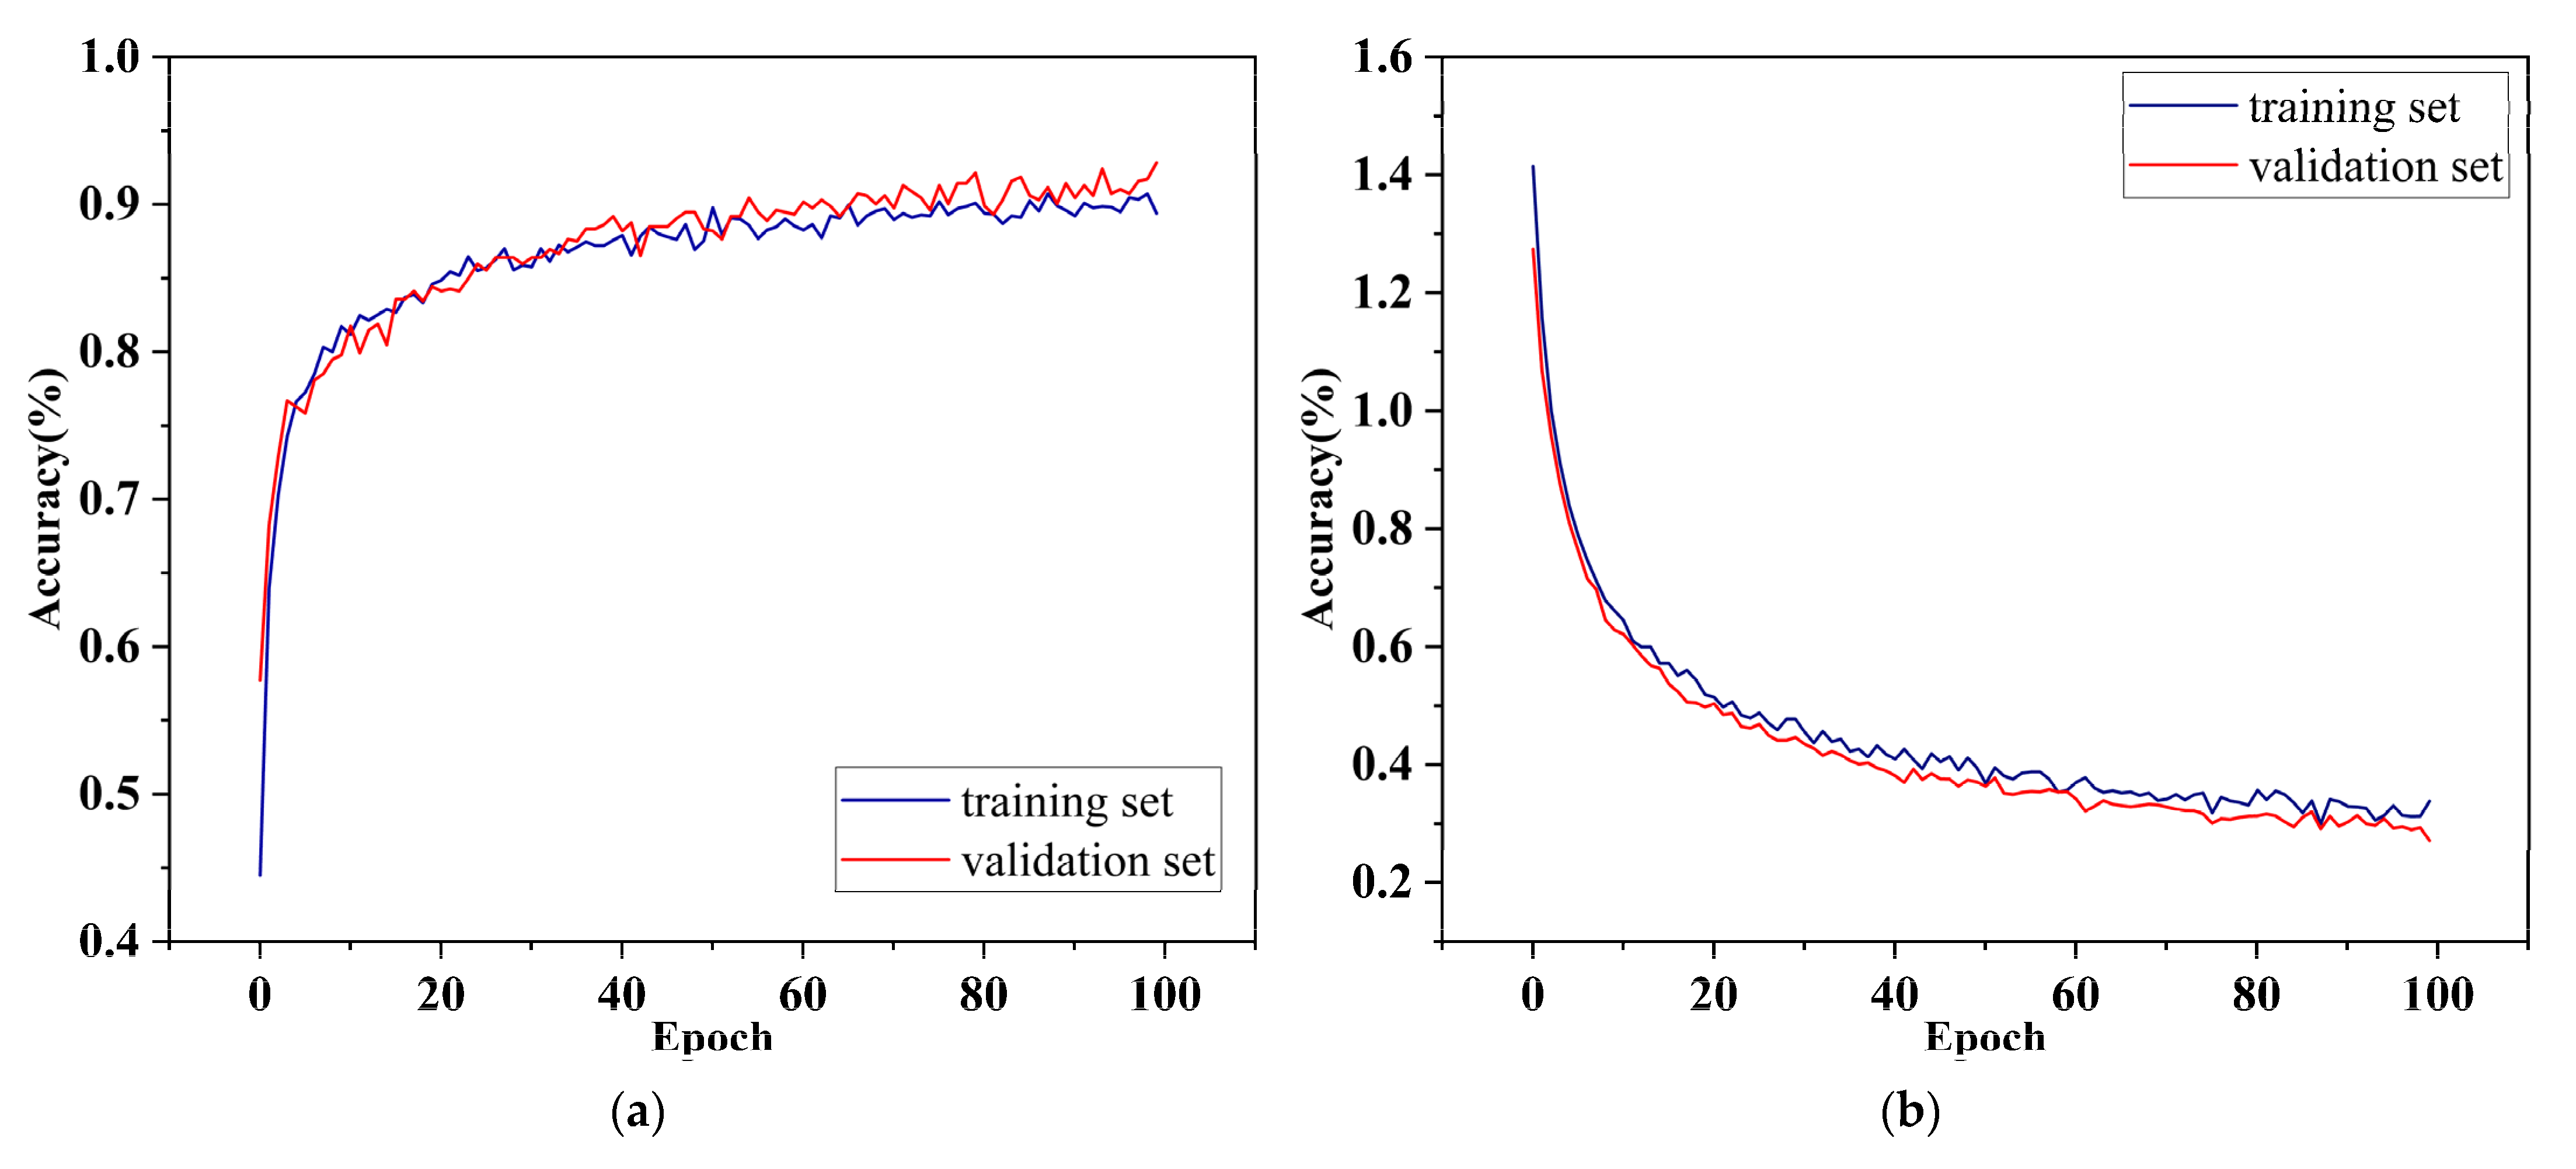
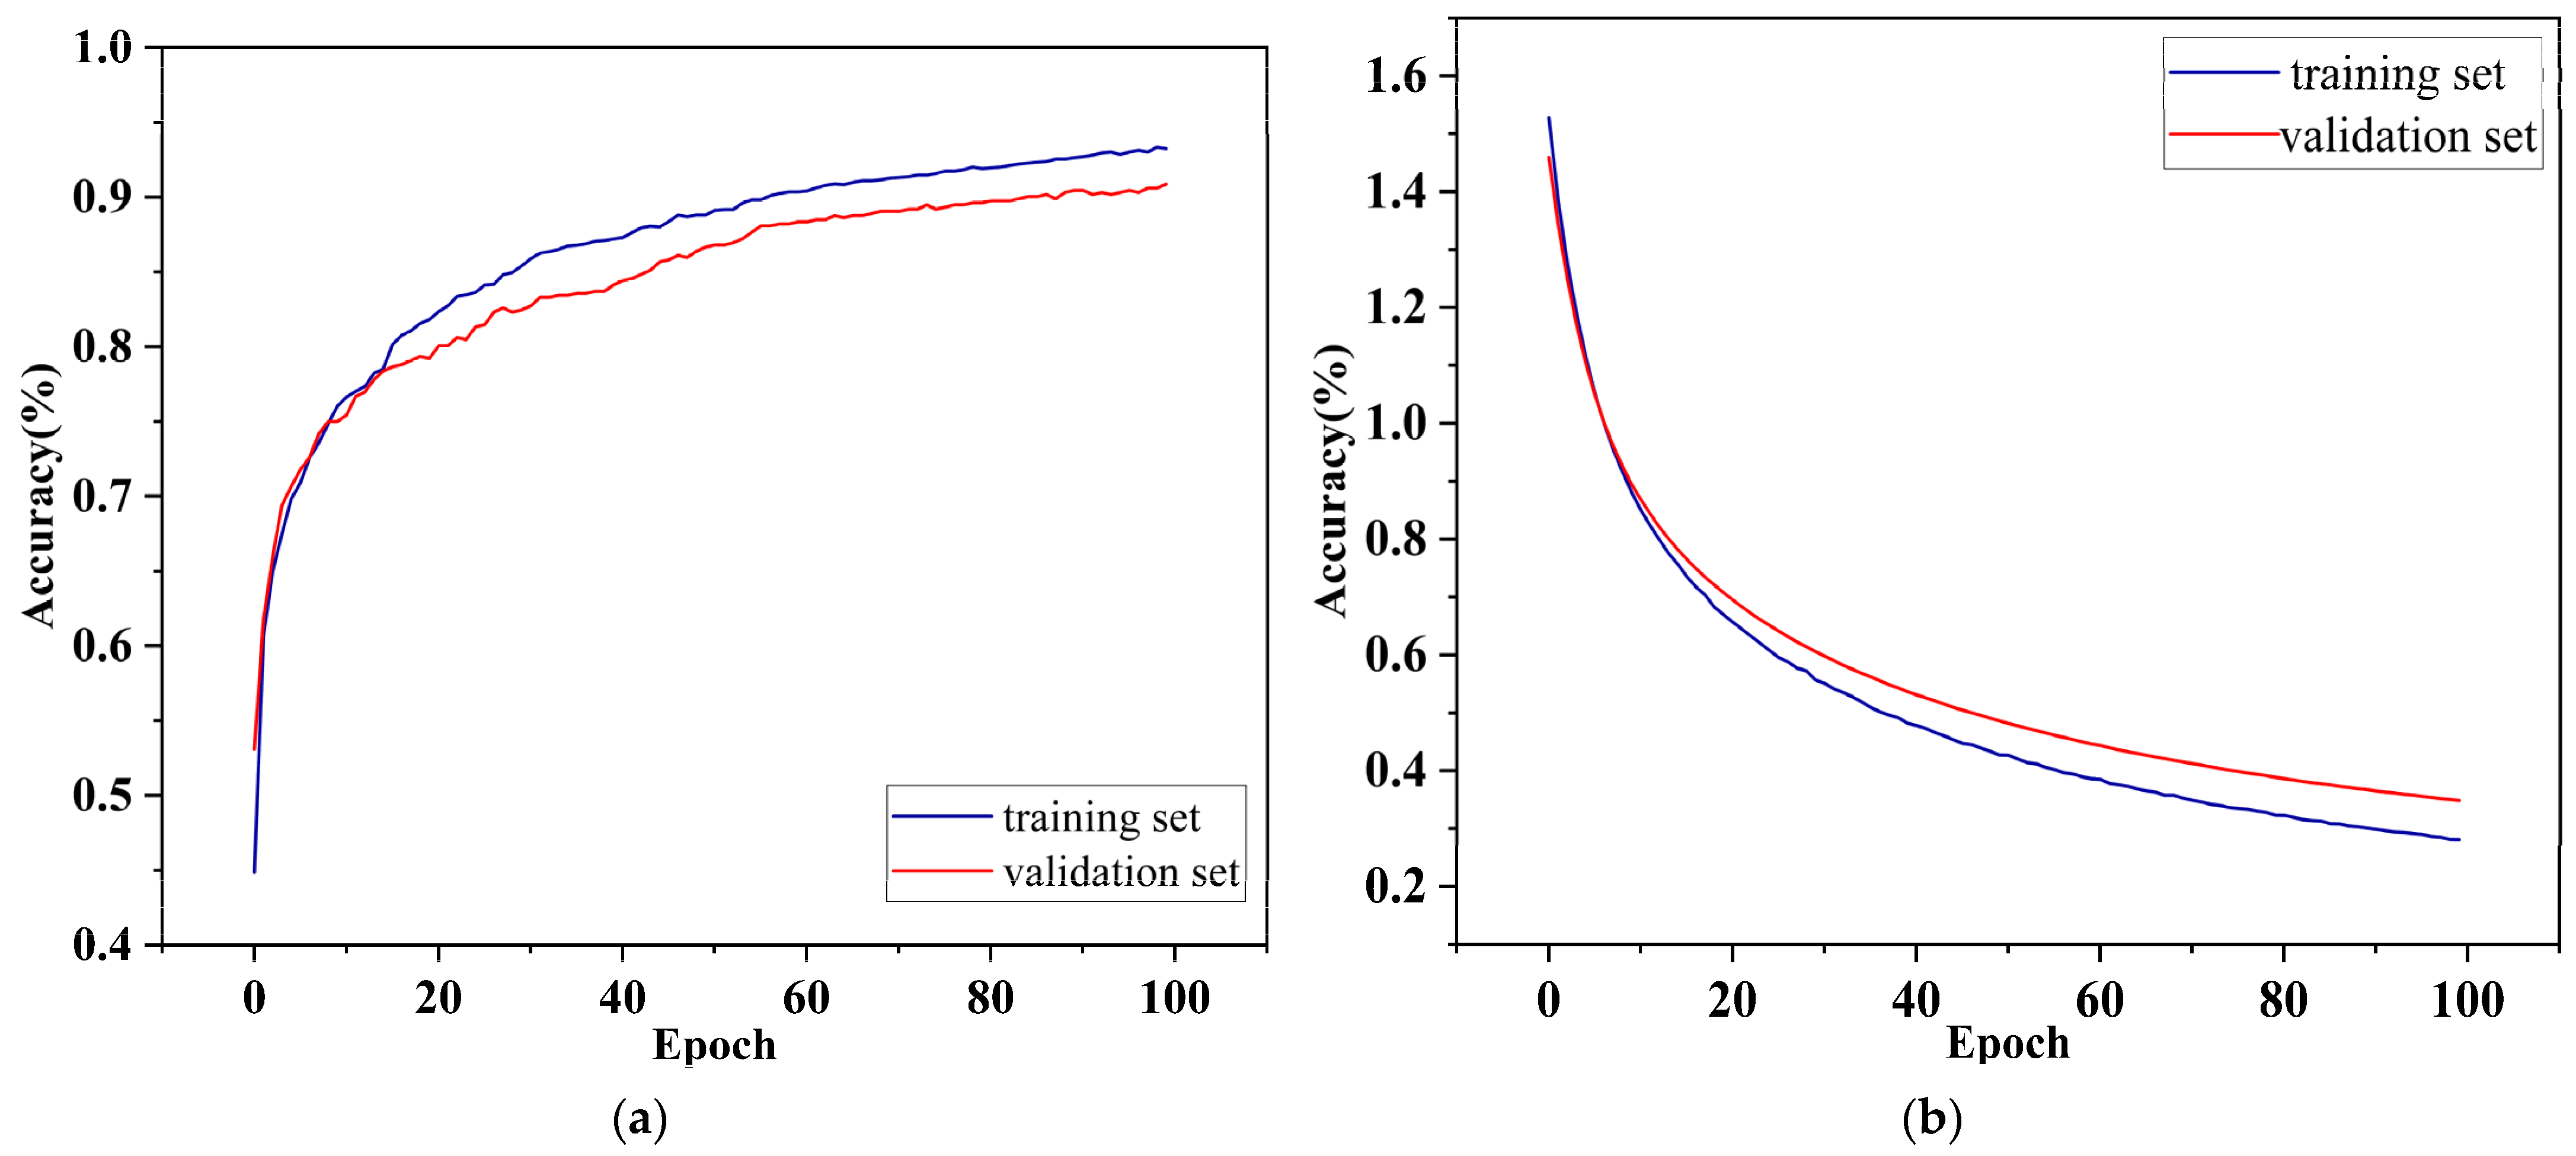
The proposed SV-ERnet integration model combines the optimized network structure of ResNet50 and SepViT. A convolutional neural network (CNN) takes a convolution kernel as its core and has inductive bias characteristics such as translation invariance and local sensitivity. It can capture local spatiotemporal information, but it lacks a global understanding of images. Compared with CNN, the Transformer’s self-attention mechanism is not limited by local interaction, which cannot only mine long-distance dependencies but also calculate in parallel. In this study, ResNet50 is selected as the CNN model and SepViT as the main model. The optimal weighting factor is calculated by an adaptive weighted fusion method, and the model is integrated by the weighted soft voting method. Experiments show that the two models are integrated, and applied to wear particle image classification, the accuracy of the integrated model is improved by 2.0 and 1.8%, the accuracy is improved by 1.7% and 2.0%, and the specificity is improved by 0.5%. From the curve results, it can be seen that the training accuracy of SepViT always shows an upward trend, which indicates that the effect of the model will be further improved if more time and cost are invested. If the model is applied to the fault diagnosis of mechanical equipment, it can improve the working efficiency of inspectors, effectively alleviate the problems of a long waiting time and the difficult classification of wear particles, and obtain better results in the online analysis and fault diagnosis of oil.
The proposed SV-ERnet model, combined with the XAI Grad-CAM visualization method, has broad potential for industrial applications. In the future, it can play a positive role in fields such as diagnosing and the early warning of faults in the maritime and aviation industries, medical image analysis, and industrial product defect detection.

Author Contributions

Conceptualization, L.H. and H.W.; methodology, L.H.; software, L.H.; validation, L.H. and H.W.; formal analysis, L.H.; investigation, L.H.; resources, L.H.; data curation, L.H.; writing—original draft preparation, L.H. and W.G.; writing—review and editing, L.H.; visualization, L.H.; supervision, L.H.; project administration, L.H.; funding acquisition, H.W. All authors have read and agreed to the published version of the manuscript.

Funding

This research was funded by the Shanghai Engineering Research Center of Intelligent Ship Operation and Energy Efficiency Monitoring, Shanghai Science and Technology Program, grant number 20DZ2252300, and the Key Project of Natural Science Foundation of Anhui Province (KJ2020A1180).

Data Availability Statement

The data that support the findings of this study are available from the corresponding author upon reasonable request.

Conflicts of Interest

The authors declare no conflict of interest.

Abbreviations

The following abbreviations are used in this manuscript:
ESRGANEnhanced Super-Resolution Generative Adversarial Network
SepViTSeparable Vision Transformer
SVMSupport Vector Machine
ViTVision Transformer
ResNet50Residual Network 50
DWADepthwise Self-Attention
PWAPointwise Self-Attention
GSAGroup Self-Attention
t-SNEt-Distributed Stochastic Neighbor Embedding

References

  1. Peng, Z.; Kirk, T.B. Automatic wear-particle classification using neural networks. Tribol. Lett. 1998, 5, 249–257. [Google Scholar] [CrossRef]
  2. Ebersbach, S.; Peng, Z.; Kessissoglou, N.J. The investigation of the condition and faults of a spur gearbox using vibration and wear debris analysis techniques. Wear 2006, 260, 16–24. [Google Scholar] [CrossRef]
  3. Fan, S.; Zhang, T.; Guo, X.; Zhang, Y.; Wulamu, A. WPC-SS: Multi-label wear particle classification based on semantic segmentation. Mach. Vis. Appl. 2022, 33, 43. [Google Scholar] [CrossRef]
  4. Gu, D.; Zhou, L.; Wang, J. Ferrography Wear Particle Pattern Recognition Based on Support Vector Machine. China Mech. Eng. 2006, 17, 4. [Google Scholar]
  5. Chang, J.; Fu, X.; Zhan, K.; Zhao, X.; Dong, J.; Wu, J. Target Detection Method Based on Adaptive Step-Size SAMP Combining Off-Grid Correction for Coherent Frequency-Agile Radar. Remote Sens. 2023, 15, 4921. [Google Scholar] [CrossRef]
  6. Scherge, M.; Shakhvorostov, D.; Pöhlmann, K. Fundamental wear mechanism of metals. Wear 2003, 255, 395–400. [Google Scholar] [CrossRef]
  7. Zhang, L.; Tanaka, H. Atomic scale deformation in silicon mono crystals induced by two-body and three-body contact sliding. Trichology Int. 1998, 31, 425–433. [Google Scholar] [CrossRef]
  8. Wang, S.; Wu, T.H.; Shad, T.; Peng, Z.X. Integrated model of BP neural network and CNN algorithm for automatic wear debris classification. Wear 2019, 426, 1761–1770. [Google Scholar] [CrossRef]
  9. Lin, S.L. Application Combining VMD and ResNet101 in Intelligent Diagnosis of Motor Faults. Sensors 2021, 21, 6065. [Google Scholar] [CrossRef]
  10. Calamari, A. Construction of VGG16 Convolution Neural Network (VGG16_CNN) Classifier with Nest Net-Based Segmentation Paradigm for Brain Metastasis Classification. Sensors 2022, 22, 8076. [Google Scholar]
  11. Nagrath, P.A.; Jain, R.; Madan, A.; Arora, R.; Kataria, P.; Hemanth, J. SSDMNV2: A real time DNN-based face mask detection system using single shot multibox detector and MobileNetV2-ScienceDirect. Sustain. Cities Soc. 2021, 66, 102692. [Google Scholar] [CrossRef] [PubMed]
  12. Qu, R.; Huang, S.; Zhou, J.; Fan, C.; Yan, Z. The Vehicle Trajectory Prediction Based on ResNet and EfficientNet Model. arXiv 2022. [Google Scholar] [CrossRef]
  13. Alzubaidi, L.; Zhang, J.; Humaidi, A.J.; Al-Dujaili, A.; Duan, Y.; Al-Shamma, O.; Santamaría, J.; Fadhel, M.A.; Al-Amidie, M.; Farhan, L. Review of deep learning: Concepts, CNN architectures, challenges, applications, future directions. J. Big Data 2021, 8, 1. [Google Scholar]
  14. Peng, Y.; Cai, J.; Wu, T.; Cao, G.; Kwok, N.; Peng, Z. WP-DRnet: A novel wear particle detection and recognition network for automatic ferrograph image analysis. Trichology Int. 2020, 151, 106379. [Google Scholar] [CrossRef]
  15. Dosovitskiy, A.; Beyer, L.; Kolesnikov, A.; Weissenborn, D.; Zhai, X.; Unterthiner, T.; Dehghani, M.; Minderer, M.; Heigold, G.; Gelly, S.; et al. An Image is Worth 16x16 Words: Transformers for Image Recognition at Scale, Computer Vision and Pattern Recognition. arXiv 2021. [Google Scholar] [CrossRef]
  16. Xu, H.; Guo, L.; Li, R.-Z. Research on Fine-Grained Visual Classification Based on Compact Vision Transformer. Control Decis. 2022, in press.
  17. Jiang, L.; Wang, Z.; Cui, Z.; Chang, Z.; Shi, X. Visual Transformer based on a recurrent structure. J. Jilin Univ. (Eng. Technol. Ed.), 2023; in press. [Google Scholar]
  18. Yuan, Y.; Chen, M.; Ke, S. Fundus Image Classification Research Based on Ensemble Convolutional Neural Network and Visin Transformer. Chin. J. Lasers 2022, 49, 108–116. [Google Scholar]
  19. Alwakid, G.; Gouda, W.; Humayun, M. Deep Learning-Based Prediction of Diabetic Retinopathy Using CLAHE and ESRGAN for Enhancement. Healthcare 2023, 11, 863. [Google Scholar] [CrossRef]
  20. Chollet, F. Xception: Deep Learning with Depthwise Separable Convolutions. In Proceedings of the 2017 IEEE Conference on Computer Vision and Pattern Recognition (CVPR), Honolulu, HI, USA, 21–26 July 2017; pp. 1251–1258. [Google Scholar]
  21. Li, W.; Wang, X.; Xia, X.; Wu, J.; Xiao, X.; Zheng, M.; Wen, S. SepViT: Separable Vision Transformer. arXiv 2022. [Google Scholar] [CrossRef]
  22. Sharma, A.K.; Nandal, A.; Dhaka, A.; Polat, K.; Alwadie, R.; Alenezi, F.; Alhudhaif, A. HOG transformation based feature extraction framework in modified Resnet50 model for brain tumor detection. Biomed. Signal Process. Control 2023, 84, 104737. [Google Scholar] [CrossRef]
  23. Sun, W.T.; Chen, J.H.; Hsiao, C.L. Data fusion for PT100 temperature sensing system heating control model. Measurement 2014, 11, 94–101. [Google Scholar]
  24. Chen, Z.; Jiao, H.; Yang, J.; Zeng, H. Garbage image classification algorithm based on improved MobileNet v2. J. Zhejiang Univ. (Eng. Sci.) 2021, 11, 1490–1499. [Google Scholar]
  25. Sarkar, A.; Maniruzzaman, M.; Alahe, M.A.; Ahmad, M. An Effective and Novel Approach for Brain Tumor Classification Using AlexNet CNN Feature Extractor and Multiple Eminent Machine Learning Classifiers in MRIs. J. Sens. 2023, 11, 1224619. [Google Scholar] [CrossRef]
  26. Jiang, Z.; Dong, Z.; Wang, L.; Jiang, W. Method for Diagnosis of Acute Lymphoblastic Leukemia Based on ViT-CNN Ensemble Model. Comput. Intell. Neurosci. 2021, 2021, 7529893. [Google Scholar] [CrossRef] [PubMed]
  27. He, L.; Wei, H. CBAM-YOLOv5: A Promising Network Model for Wear Particle. Wirel. Commun. Mob. Comput. 2023, 2023, 2520933. [Google Scholar] [CrossRef]
  28. He, L.; Wei, H.; Wang, Q. A New Target Detection Method of Ferrography Wear Particle Images Based on ECAM-YOLOv5-BiFPN Network. Sensors 2023, 23, 6477. [Google Scholar] [CrossRef] [PubMed]
  29. Laghari, M.S. Recognition of texture types of wear particles. Neural Comput. Appl. 2003, 12, 18–25. [Google Scholar] [CrossRef]
  30. Li, W.; Zhang, L.C.; Wu, C.H.; Cui, Z.X.; Niu, C.; Wang, Y. Debris effect on the surface wear and damage evolution of counterpart materials subjected to contact sliding. Adv. Manuf. 2022, 10, 72–86. [Google Scholar] [CrossRef]
  31. Wang, Y.; Wu, C.; Zhang, L.; Qu, P.; Li, S.; Jiang, Z. Thermal oxidation and its effect on the wear of Mg alloy AZ31B. Wear 2021, 476, 203673. [Google Scholar] [CrossRef]
  32. Nawaz, S.; Rasheed, S.; Sami, W.; Hussain, L.; Aldweesh, A.; Salaria, U.A.; Khan, M.S. Deep Learning ResNet101 Deep Features of Portable Chest X-ray Accurately Classify COVID-19 Lung Infection. Comput. Mater. Contin. 2023, 75, 5213–5228. [Google Scholar] [CrossRef]
  33. Sarker, S.; Tushar SN, B.; Chen, H. High accuracy keyway angle identification using VGG16-based learning method. J. Manuf. Process. 2023, 98, 223–233. [Google Scholar] [CrossRef]
  34. Sandler, M.; Howard, A.; Zhu, M.; Zhmoginov, A.; Chen, L.C. MobileNetV2: Inverted residuals and linear bottlenecks. In Proceedings of the IEEE Conference on Computer Vision and Pattern Recognition, Salt Lake City, UT, USA, 18–23 June 2018; pp. 4510–4520. [Google Scholar]
  35. Tan, M.X.; Le, Q.V. Efficient Net: Rethinking mod elscaling for convolution alneuralnet works. In Proceedings of the 36th International Conference on Machine Learning, Long Beach, CA, USA, 9–15 June 2019; pp. 6105–6114. [Google Scholar]
  36. Selvaraju, R.R.; Cogswell, M.; Das, A.; Vedantam, R.; Parikh, D.; Batra, D. Grad-cam: Visual explanations from deep networks via gradient-based localization. In Proceedings of the IEEE International Conference on Computer Vision, Venice, Italy, 22–29 October 2017; pp. 618–626. [Google Scholar]
Figure 1. Overall technical schematic diagram of the SV-ERnet model.
Lubricants 11 00530 g001
Figure 2. Schematic diagram of ESRGAN. In the figure, the same convolutional blocks and function operations are depicted in the same color, and the convolution operation arrows starting at the same step are also in the same color.
Lubricants 11 00530 g002
Figure 3. Depth separable convolution algorithm schematic diagram. In the figure, different colors are used to represent feature maps of different channels.
Lubricants 11 00530 g003
Figure 4. SepViT principle structure diagram. In the figure, identical convolution operations and function operations are represented by frames of the same color.
Lubricants 11 00530 g004
Figure 5. Depthwise convolution self-attention. In the figure, different colors are used to differentiate between different feature maps.
Lubricants 11 00530 g005
Figure 6. Pointwise convolution self-attention. In the figure, different colors are used to differentiate between different feature maps.
Lubricants 11 00530 g006
Figure 7. Depthwise separable self-attention and group self-attention. In the figure, different colors are used to distinguish between the convolutions and feature maps of different groups.
Lubricants 11 00530 g007
Figure 8. ResNet50 network principle structure diagram. In the figure, identical convolution operations and function operations are represented by frames of the same color.
Lubricants 11 00530 g008
Figure 9. Experimental flow chart.
Lubricants 11 00530 g009
Figure 10. Images of all kinds of detected wear particles.
Lubricants 11 00530 g010
Figure 11. (a) Variation curve of the training accuracy and verification accuracy of ResNet50. (b) Change curve of the training loss and verification loss of ResNet50.
Lubricants 11 00530 g011
Figure 12. (a) Variation curve of the training accuracy and verification accuracy of SepViT. (b) Variation curve of the training loss and verification loss of SepViT.
Lubricants 11 00530 g012
Figure 13. (a) ResNet50 confusion matrix. (b) SepViT confusion matrix.
Lubricants 11 00530 g013
Figure 14. (a) Comparison of the precision in wear particle identification for each model. (b) Comparison of recall in the wear particle identification for each model. (c) F1-Score comparison of the wear particle identification of each model. (d) Comparison of the specificity in identifying wear particles for each model.
Lubricants 11 00530 g014aLubricants 11 00530 g014b
Figure 15. Confusion matrix for the test set of the integrated model SV-ERnet.
Lubricants 11 00530 g015
Figure 16. Comparison of the performance indicators of the model under different weighting factors.
Lubricants 11 00530 g016
Figure 17. Comparison of the Grad-CAM visualization results for the three algorithms.
Lubricants 11 00530 g017
Figure 18. (a) Training set feature clustering results of ResNet50. (b) Training set feature clustering results of SepViT. (c) Training set feature clustering results of SV-ERnet.
Lubricants 11 00530 g018
Table 1. Main parameters of the BRUKER testing machine reciprocating module [28].
ParameterControl Range
Loading force range0.1 mN~1000 N
Loading force accuracy<0.1% maximum range
Maximal friction500 N
Reverse module rangeMaximum of 120 mm
The rate of reciprocating motion0.001~100 mm/s
Temperature control range−35~1000 °C
Temperature control accuracy<0.1 °C
Table 2. Wear particle dataset.
Type of Wear ParticlesNumber of Training SetNumber of Validation Set Number of
Test Set
Total Number of Images
Cutting537179179895
Fatigue6842282281140
Oxidation462154154770
Slide552184184920
Spherical426142142710
Table 3. Comparison of the test accuracy of different models.
ModelAccuracy/%
ResNet10192.3
VGG1687.6
MobileNetV289.4
EfficientNetV189.7
AlexNet87.3
SV-ERnet94.1
Table 4. ResNet50 test set results (accuracy = 92.1%).
Precision/%Recall/%Specificity/%F1-Score/%
Cutting93.393.998.393.6
Fatigue93.087.797.790.3
Oxidation94.29.4898.894.5
Slide84.494.095.488.9
Spherical98.591.599.794.9
Average92.792.498.092.4
Table 5. SepViT test set results (accuracy = 92.3%).
Precision/%Recall/%Specificity/%F1-Score/%
Cutting95.798.398.997
Fatigue86.892.195.189.4
Oxidation96.189.699.296.1
Slide89.982.197.685.8
Spherical96.494.499.395.4
Average93.092.698.092.7
Table 6. Test set results of SV-ERnet (accuracy = 94.1%).
Precision/%Recall/%Specificity/%F1-Score/%
Cutting97.897.899.497.8
Fatigue92.192.197.191.9
Oxidation96.297.499.296.8
Slide88.591.896.990.1
Spherical99.291.599.995.6
Average94.792.498.594.4
Disclaimer/Publisher’s Note: The statements, opinions and data contained in all publications are solely those of the individual author(s) and contributor(s) and not of MDPI and/or the editor(s). MDPI and/or the editor(s) disclaim responsibility for any injury to people or property resulting from any ideas, methods, instructions or products referred to in the content.

