Abstract
The surface preparation of shiny stainless steels is a must for applying esthetic paints, effective functional plasma spray coating, laser cladding, welding, etc., applications. The current work aims for effective surface roughening and erosion MRR of SS 304 work surface using SiC abrasive jet erosion and optimization of the process parameters. The response surface approach is used to design and conduct the studies using the Box–Behnken design method. The surface topography of the eroded surfaces is examined by a 2D profilometer, 3D profilometer, and scanning electron microscope (SEM). The abrasive grit size and working gas pressure greatly affect the surface roughness of SS 304 samples. The influence of the process parameters on the variation of these topographical features is analyzed and confirmed. The working jet pressure is seen to significantly impact erosion MRR. The lower working gas pressure shows a typical influence on Ra (surface preparation) and as pressure increases, erosion MRR rises, and the surface preparation mode shifts to the erosion metal removal/cutting zone. The quality of SS 304 surface prepared from SiC abrasive jet impact is characterized by 3D profilometry.
1. Introduction
The abrasive jet blasting is effectively used in surface cleaning and surface preparation simultaneously for mechanical interlocking with a coating material. Moreover, the abrasive jet has multipurpose applications in pre-processing (surface preparation, cleaning, dry etching, etc.), main processing (drilling, cutting operations, surface hardening, etc.), and post-processing (hard surface removal of casting surface, dry polishing, deburring). The material removal using an abrasive jet is caused by erosion [1,2] and provides several benefits, such as the ability to produce roughly smoothened surface finishes and cut ductile to brittle and heat-sensitive delicate materials safely. An abrasive jet is mostly used to machine brittle materials more effectively since it is flexible and produces less heat. Additionally, the abrasive jet system carries out various distinctive tasks including micro-machining and polishing the surface of micro-channels and holes.
Surface preparation is a prerequisite to different processes like cladding, thermally spraying, brazing, painting, etc. In an experiment involving vacuum brazing of stainless steel, Hebda et al. [2] concluded that surfaces needed to be prepared with a roughness value (Ra) ranging from 0.24 µm to 0.68 µm before brazing. Surface preparations of Inconel 625 and 718 for improved wettability were studied by Lankiewicz et al. [3] using SiC of sizes 120 µm and 220 µm. They recorded Ra values of 0.96 µm and 0.98 µm. Another classic application of the abrasive jet process is the removal of damaged paint and simultaneously preparing the surface for the re-painting of bridges, ships, automobiles, etc. Surface area and surface energy both rise as roughness rises after the impingement of abrasive particles on the substrate surface. For an improved bonding between the substrate surface and the coating material during coating application, a rough surface is required for a larger gripping area and bonding contact points [4]. According to Melentiev et al. [5], the abrasive jet system shifted from a macro- to a micro-zone after continuous development. An abrasive jet was used to clean the rusty and greasy surface of the substrate before welding since it is quicker and more effective than other surface cleaning procedures like grinding, filing, etching, and so on [1]. Additionally, AJM was carried out using an effective dust-collecting system, which allows for smooth operation and the elimination of environmental loading issues [1,2,3,4,5]. In contrast to AWJM, which cannot successfully operate at low pressure as indicated by Akkurt et al. [6], the abrasive jet can perform under low pressure on thinner materials. To find out the present status and research gaps, the search and review of present investigators on surface preparation using abrasive jet and allied processes are tabulated in Table 1.

Table 1.
Surface preparation on various engineering materials using abrasive erosion jets.
In this present search and review on abrasive jet surface preparation, it was observed that SiC and Al2O3 are mostly used as abrasives for the surface preparation of various metal surfaces. SiO2 is also used, which is cheaper, but easily broken into pieces on impact. For multiple-times usage and cost-effectiveness, SiC is one of the best choices for surface preparation and abrasive machining, eventually providing hard sharp edges with long service life. In most of the surface preparation studies, prepared roughness Ra values vary from 0.5 to 4 µm, and in some cases, it was observed around 10 µm, and more than 50 µm. Generally, micro-roughening (etching) would be good for precision applications like wetting of the surface, mechanical interlocking in PVD, CVD coatings, and painting applications. A highly rough surface would be effective in plasma spray coating, laser cladding, bulk coating, etc.
Stainless steel (SS) is the second most useful alloy after steel [29], and among all grades of SS, SS 304 is mostly used (58% of total use of SS in 2004) [30] in industries. It has huge applications in machinery, sheet metal working, medical, food production, automotive, tank, vessel, etc., and manufacturing industries. Therefore, there is a huge demand for machining, surface preparation, joining, forming, and processing of SS 304. Search and review (Table 1) show that surface preparation of SS/SS 304 might be rarely practiced using an abrasive jet process.
The present study aims to investigate abrasive jet surface preparation in the roughening mechanism and the influence of process parameters on both surface topography/characteristics of SS 304 and erosion MRR. The experiments were conducted by an in-house developed abrasive jet system which has unique characteristics like abrasive flow and mixing ratio (career gas: abrasive) control ability. The air pressure, stand-off distance, abrasive grain size, and abrasive flow rate are chosen as input parameters and responses are mainly observed in roughness (Ra) and material removal rate. The Box–Behnken design approach is adopted for the experiment design, analysis, optimization, and validation. In addition, response surface methodology (ANOVA) is applied to understand the interrelationship between the process parameters and the responses. Furthermore, important surface characteristics like sharpness and density of peaks present on the prepared surface are investigated and discussed thoroughly for surface characterization.
2. Materials and Methods
An indigenously designed and made abrasive jet system, as shown in Figure 1a insert of the main machining unit and Figure 1b workpiece adjustment with the nozzle, was utilized for surface preparation on 1 mm thick SS 304 sheets of surface ~(6 × 3) mm2. The chemical composition (revealed by laser spectroscopy) of the used SS 304 samples is given in Table 2 below.

Figure 1.
The insert photography of (a) the main machining unit, and (b) workpiece adjustment with the nozzle.

Table 2.
Chemical composition of used SS 304.
The setup was fabricated in the Manufacturing Technology Laboratory of Kalyani Government Engineering College, West Bengal, India, with the help of Asian Drilling Industries, a Kolkata-based company. Silicon carbide (SiC) grits of 100, 150, and 200 µm sizes (Figure 2a, Figure 2b and Figure 2c, respectively) are used for the experiment. A commercial stainless-steel nozzle with a 4 mm opening diameter was used for the present investigation. Mild steel stand pieces measuring 24, 28, and 30 mm were used for the accurate measurement of stand-off distances. The design of the parameters table was created using Minitab 17’s Box–Behnken Design method based on the four-factor three-level parameters utilized for the experiment. Table 3 lists the four parameters and the levels of each parameter used in the experiment, along with observed responses. The parameter combinations of all the experiments designed using the Box–Behnken method are listed in Table 4.

Figure 2.
Microscopic view of SiC abrasive grits (a) 100 µm, (b) 150 µm, and (c) 200 µm size.

Table 3.
Process parameters and their levels.

Table 4.
Experimental results of MRR and arithmetic average Ra obtained on SS 304 sheet.
Measurements of surface roughness were conducted using a surface roughness tester SURTRONIC 3+. In addition, a 3D surface profilometer (Taylor Hobson) was also utilized to analyze the topographic features of the surfaces. The morphology of the prepared surfaces was observed using an SEM (Evo 18 Research, Zeiss, Germany).
3. Results and Discussion
The photographs of the prepared SS 304 work pieces ~(6 × 3) mm2 surfaces are shown in Figure 3. The dark areas at the centers of the specimen are the regions roughened using the abrasive particles.
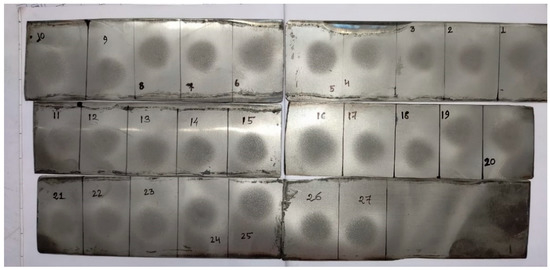
Figure 3.
Inset photographs of the SS 304 specimens after surface roughening.
3.1. Surface Characterization by SEM Analysis
The morphology of the SS 304 surface before and after abrasive jet bombardment is shown in Figure 4a and Figure 4b, respectively. A rough topography with traces of micro-indentations and shearing was observed on the workpiece after the impact of abrasive particles under high pressure. The random abrasive particles with sharp edges (Figure 2) cut through the surface, resulting in shearing off the material from the substrate surface (Figure 4a). In addition, the sharp edges of the abrasive particles penetrate the surface after the impingement and produce micro-indents, as revealed in Figure 4b. Hence, micro-shearing and micro-indentations are the predominant modes of material erosion from the surface of ductile material SS 304 under the action of abrasive particles. Similar observations were also made by Ghara et al. [8] and Rodriguez et al. [26] on some other metals.
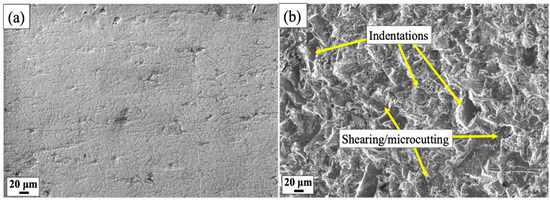
Figure 4.
SEM micrographs of the SS 304 surface: (a) prior to and (b) after surface preparation at 8 kg/cm2 pressure, 200 μm grit, 28 mm SOD, and 130 g/min abrasive flow rate.
3.2. Process Parameters Optimization
Table 4 lists the material removal rate (MRR) and average surface roughness of the specimens at different parameter combinations. The influence of individual and combined influence of process parameters on MRR is investigated using the analysis of variance (ANOVA) as presented in Table 5. The statistical analysis program Minitab 17 was used to tabulate the outcomes of the experiment.

Table 5.
Analysis of variance (ANOVA) table for MRR.
The tests that were run are frequently summarized using an ANOVA table. It can be shown from Table 5 and Table 6 that all of the terms related to the responses MRR and Ra in Equations (1) and (2) are significant because the p-values for these terms are less than 0.05. Table 6 shows the ANOVA table for the response surface quadratic model for material removal rate (MRR). The resulting models are regarded to be statistically significant, which is desired since it shows that the terms in the model have a substantial impact on the responses when the values of ‘p’ (Prob. > F) in Table 6 for the term of models are less than 0.05 (i.e., =0.05, or 95% confidence). The other significant statistic, R2, which is referred to as determination coefficients in the final ANOVA table, is a measure of the degree of fit and is defined as the proportion of explained variance to total variation. The more closely the response model matches the real data, the more R2 becomes close to unity. The obtained R2 value (0.993) for MRR approaches to unity, suggesting that the experimental and predicted values are well-correlated. In Table 6, the calculated values of the F-ratio for lack of fit are compared with the standard values of the F-ratio corresponding to their degrees of freedom. The standard percentage point of F distribution for 95% confidence level is 3.74. However, the F value (3.14) for lack of fit is smaller than the standard value indicating that the model is adequate. Similarly, results from Table 6 indicate that the model is also significant, and it also displays that the test of lack-of-fit is insignificant. Because F = 3.04 < 3.74 (F0.05,2,14 = 3.74), a null hypothesis cannot be rejected, which means the model is adequate. It is also seen that there is a good correlation between the experimental and the predicted values due to the high R2 value (0.965).

Table 6.
Analysis of variance (ANOVA) table for Ra.
The final quadratic models of the response equation are presented as follows. The Regression Equation for MRR is given as:
MRR = −1.87 + 0.0872 p + 0.00258 GS + 0.0283 SOD + 0.0199 Q − 0.00603 p2 − 0.000003 GS2 − 0.000547 SOD2
− 0.000069 Q2 − 0.043 pGS + 0.00208 pSOD + 0.0057 pQ
− 0.000069 Q2 − 0.043 pGS + 0.00208 pSOD + 0.0057 pQ
Ra = 0.95 − 0.279 p + 0.01136 GS + 0.1 SOD − 0.0756 Q + 0.01817 p2 − 0.00023 GS2 − 0.00229 SOD2 + 0.000255
Q2 + 0.000437 pGS + 0.00162 pSOD + 0.00046 pQ
Q2 + 0.000437 pGS + 0.00162 pSOD + 0.00046 pQ
The normal probability plots of the residuals and the plots of the residuals vs. the predicted response for MRR and Ra are shown in Figure 5 and Figure 6, respectively. According to a review of the plots in Figure 5a and Figure 6b, the residuals typically fall on a straight line, indicating that the errors are distributed regularly. Additionally, Figure 5b and Figure 6b reveal that they have no obvious pattern or unusual structure. This suggests that the offered models are suitable and that the assumptions of independence and constant variance have not been violated. The plots of main effects (Figure 7 and Figure 8) are made to examine the impacts of the parameters on the MRR and Ra respectively. As may be seen from Figure 7, pressure is the most significant factor in MRR, and grain size is the most significant factor for Ra.

Figure 5.
(a) Normal probability plot of residuals for MRR (b). Plot of residuals vs. predicted response for MRR.

Figure 6.
(a) Normal probability plot of residuals for Ra. (b) Plot of residuals vs. predicted response for Ra.
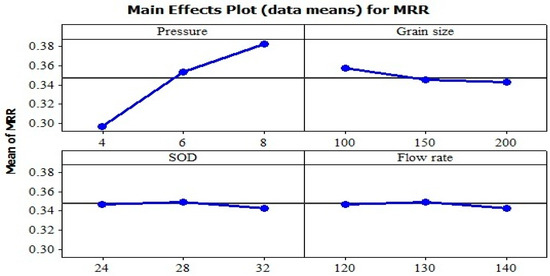
Figure 7.
Mean effects plots of MRR.
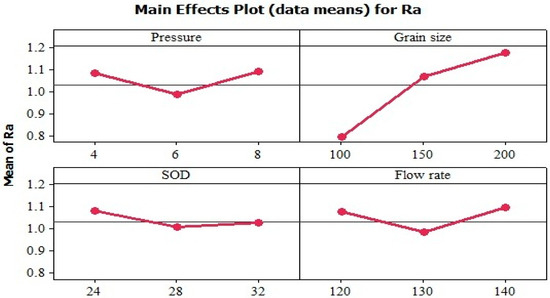
Figure 8.
Mean effects plots of Ra.
Figure 9a–c indicate that MRR is highly influenced by working gas pressure, which is quite normal as high pressure enhances high kinetic energy to the abrasive jet stream and causes propionate MRR. Figure 9d–f show the effect of SiC abrasive grain size, flow rate, and SOD on MRR. In this range of study, lower grain size at intermediate SOD and flow rate provides higher MRR.


Figure 9.
Surface plots (a–f) of MRR versus input parameters.
Figure 10a–c indicate that Ra values decrease and then increase with increasing working pressure. Roughening at low gas pressure might be due to the impingement of abrasive sharp edges in the SS 304 surface that might cause higher surface roughness with lower metal removal. The SiC grain sizes show a major impact on Ra/roughening as in Figure 10d,e. In this range of study, the effect of SOD and flow rate has less significance on Ra.
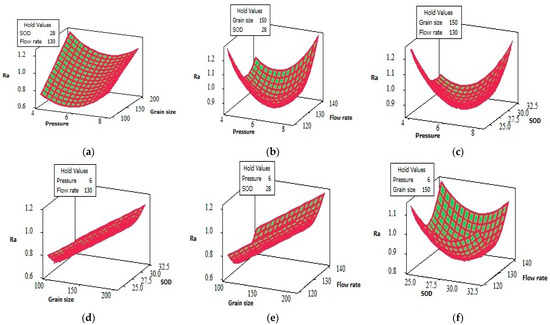
Figure 10.
Surface plots (a–f) of Ra versus input parameters.
Here, an RSM-based desirability technique was used to optimize the input parameters (pressure, grain size, SOD, and flow rate). Utilizing the desirability function, multiple response optimizations were carried out to optimize the performance parameter, surface roughness (weight age-2), and reduce MRR (weight age-1). This method involves converting the response model (R) into d, which was then again aggregated to a composite desirability function (D), as shown in Figure 11. It has been noted that the desirability function for composites (0.99711) is very near to one. This indicates that the parameters seem to have been set for favorable results for each response.

Figure 11.
Desirability plot.
Good surface preparation is desirable without or with minimum MRR. To validate the optimization results, confirmation experiments were carried out using the following input parameters: pressure = 4 kg/cm2, grain size = 100 µm, SOD = 24 mm, and flow rate = 120 g/min. Measurements were made of the corresponding responses (MRR and Ra). For a variety of responses, the RSM predictions agreed with the experimental average of 3 runs as shown in Table 7, which is shown numerically.

Table 7.
Confirmation of optimization results.
The predicted value of Ra and MRR are very close to the experimental values. Therefore, the design of experiments, the experimental data analysis, and their trained/predicted value are very close to the real value. This model can be utilized for predicting any real Ra and MRR further within this range of experiments.
3.3. Confirmation Test
The variation between experimental and predicted responses (Ra and MRR) are shown in Figure 12a and Figure 12b (respectively).
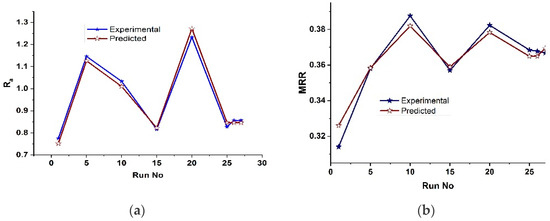
Figure 12.
Comparison between experimental and predicted values for the (a) Ra and (b) MRR.
The result shows both the figures that predict values of the MRR and Ra close to recorded experimental values with a 95% confidence interval.
3.4. Sensitivity Analysis
To compare the estimated output to the measured data, model validation heavily relies on sensitivity analysis, a technique to determine essential factors and rank them according to importance. Mathematically, the sensitivity of a design objective function with respect to a design variable is the partial derivative of that function with respect to its variables. To obtain the sensitivity equations for MRR and Ra, Equations (1) and (2) are differentiated with respect to pressure. The sensitivity Equations (3)–(6) and Equations (7)–(10) represent the sensitivity of MRR and Ra for pressure, particle size, SOD, and flow rate, respectively.
This study aimed to predict the tendency of MRR and Ra due to changes in process parameters for surface preparation. Sensitivity of MRR and Ra to pressure, grain size, SOD, and flow rate, as calculated from Equations (3)–(6) and Equations (7)–(10), are reflected in Figure 13, respectively.

Figure 13.
Sensitivity analysis result on MRR: (a) pressure, (b) grain size (c) SOD, and (d) flow rate.
The MRR was found (Figure 13a–d) to be more sensitive with respect to pressure, grain size, and SOD with a little variation in pressure. Rather, Ra was found (Figure 14a–d) to be more sensitive with respect to pressure and grain size with little pressure variation. From the overall observations, the pressure and grain size were found to be two main factors in the erosion MRR of SS 304. Ramachandran, C.S. et al., 2012 [31] recognized that
Erosion = {K × (velocity)n}

Figure 14.
Sensitivity analysis result of Ra (a) pressure, (b) grain size, (c) SOD, and (d) flow rate.
‘n’ is a velocity exponent and ‘K’ is a constant that depends upon impact angle and particle size. To form an abrasive jet, the gas pressure head was converted to the velocity head which moves the gas-suspended abrasives. The kinetic energy of the abrasive erodes the material body if it is being impacted. Therefore, Equation (11) supports the findings of the present study.
The expert’s studies [31,32] are based on the air-jet erosion tester which can possibly measure the particle velocity before erosion impact which has made the explanation of erosion easier. In general, industrial air-jet systems are used in various applications without such instruments to reduce additional costs. The air-jet process parameters like pressure, nozzle diameter, SOD, etc., could be synchronized with erosion–velocity empirical relation (Equation (5)), which may give more benefits for industrial users.
3.5. 3D Profilometry Analysis for Surface Quality Characterization
A rough surface consists of multiple peaks, valleys, and flats. Therefore, the topography of the surface can be characterized based on two important parameters, namely the sharpness of the peaks (Sku) (Kurtosis) and the density of peaks (Spd) on a particle surface. Sku is a measure of the sharpness of the peaks present on a rough surface. Figure 15 schematically depicts different types of peaks and corresponding Sku values [33]. When Sku < 3, the height distribution, is skewed and the peak is represented as a hump, at Sku = 3, the height distribution above the mean plane followed a normal distribution. A sharply spiked height distribution is assumed for a Sku > 3. On the other hand, the quantity of peaks per unit area is represented as Spd (density of peaks). Another parameter that represents the sharpness of the peaks is the Arithmetic mean peak curvature (Spc). A larger value of Spc means the curvature of the peaks are smaller, i.e., the peaks are sharper. A smaller value of Spc indicates wider curvature of the peaks.

Figure 15.
Schematic representation of the profiles of peaks indicating sharpness parameter (Sku), related to surface preparation and erosion material removal.
For the detailed analysis of the surface topography characteristics (Sku,Spd), eight specimens (sl.no. 2, 6, 19, 20, 24, and 28 * from Table 3) are selected. The measured values of Sku, Spd of the selected specimens are presented in Table 8.

Table 8.
Surface topography parameters (Sku, Spd, Spc) measured using 3D profilometer.
The 3D images of the surface topography corresponding to sl. no. 1 to 6* (in Table 8), obtained using the 3D profilometer, are shown in Figure 16a–f, respectively. It is clear from Figure 16a,b that at higher pressure (8 kg/cm2), the prepared surface peaks are relatively flat and a few higher peaks are observed. It might be due to material removal being the main mood of abrasion instead of surface roughening.
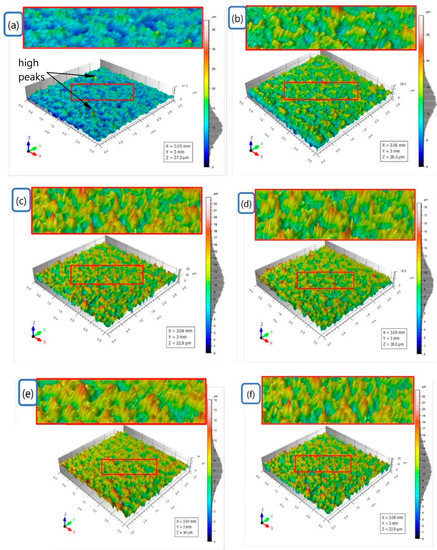
Figure 16.
3D surface topography obtained at (a–e) as per designed experimental input parameters, and (f) as per predicted process parameters.
The surface topography at medium pressure (6 kg/cm2) in Figure 16c indicates an intermediate level of surface preparation. Figure 16d–f exhibit peaks that are relatively more prominent and sharper, indicating that the surface topography is better at minimum gas pressure (4 kg/cm2). It indicates that the indention of sharp SiC grits is the main mechanism to create sharp peaks on the SS 304 work surface.
4. Conclusions
The effects of process parameters on both abrasive jet surface preparation and erosion material removal were investigated, analyzed, and the observations are concluded as follows:
- In the surface preparation of SS 304, abrasive (SiC) grain size was one of the significant process parameters. The working gas pressure plays a typical role in surface preparation at a minimum pressure (4 kg/cm2). The roughness profile peaks were found to be very sharp (Sku > 3) and higher in density (Skpd) in this condition.
- In erosion material removal, the maximum MRR was found at maximum working gas pressure (8 kg/cm2).
- The regression coefficient was used to develop the mathematical (quadratic) models of two responses (MRR and Ra), and ANOVA was used to determine their statistical significance for each output response. The model has been determined to be statistically significant because the values of p were less than 0.05.
- The operating conditions were optimized as pressure 4kg/cm2, grain size ~100 µm, SOD 24 mm, and flow rate 120 g/min, where maximum surface roughness at minimum MRR was obtained using D-optimal test with composites desirability of 0.9971.
- SEM view, 3D profilometry view, and analysis proved that the material deformation, indention, erosion, etc., were the main mechanisms in SiC air jet bombardment on SS 304.
- The sensitivity analysis revealed that gas pressure was the most significant factor in influencing the responses.
Author Contributions
Conceptualization, S.D. and B.H.; methodology, V.P. and D.K.A.; software, H.J.; validation, V.P., H.J. and B.H.; formal analysis, V.P. and D.K.A.; investigation, V.P., D.K.A., S.D. and T.G.; resources, S.D. and T.G.; data curation, V.P.; writing—original draft preparation, V.P., T.G., B.H. and H.J.; writing—review and editing, B.H., S.D., H.J. and T.G.; visualization, B.H., S.D., H.J., N.A. and T.G.; supervision, B.H. and S.D.; project administration, B.H. and S.D.; funding acquisition (for internal expenditure), B.H. and N.A. All authors have read and agreed to the published version of the manuscript.
Funding
This research received no external funding.
Data Availability Statement
Data may be available upon request to the corresponding author.
Acknowledgments
The authors are thankful to Kalyani Government Engineering College, Kalyani, India for providing all sorts of support needed for carrying out the experimental investigation. They also thank the Dean of Scientific Research, Imam Mohammad Ibn Saud Islamic University (IMSIU), Riyadh, Saudi Arabia for extended support in this investigation.
Conflicts of Interest
The authors declare no conflict of interest.
Nomenclature
| MRR | Material removal rate in (g/min) |
| SEM | Scanning electron microscope |
| SiC | Silicon carbide |
| AJM | Abrasive jet machining |
| AWJM | Abrasive water jet machining |
| p | Pressure (kg/cm2) |
| GS | Grain size (μm) |
| SOD | Stand-off distance (mm) |
| Q | Flow rate (g/min) |
| ANOVA | Analysis of variance |
| Ra | Surface roughness in µm |
| RSM | Response surface method |
| Spd | Density of peaks |
| Sku | Sharpness of the peaks |
References
- Haldar, B.; Adak, D.K.; Ghosh, D.; Karmakar, A.; Habtamu, E.; Ahmed, A.; Das, S. Present status and some critical issues of abrasive jet materials processing: A review. Procedia Manuf. 2018, 20, 523–529. [Google Scholar] [CrossRef]
- Hebda, M.; Kaczor, P.; Miernik, K. Vacuum brazing of stainless steel depending on the surface preparation method and temperature of the process. Arch. Metall. Mater. 2019, 64, 5–11. [Google Scholar] [CrossRef]
- Lankiewicz, K.; Babul, T.; Baranowski, M.; Kowalski, S. The study of the impact of surface preparation methods of Inconel 625 and 718 nickel-base alloys on wettability by BNi-2 and BNi-3 brazing filler metals. Arch. Metall. Mater. 2015, 60, 739–745. [Google Scholar] [CrossRef]
- Thakare, G.J.; Pandey, C.; Mulik, S.R.; Mahapatra, M.M.; Narang, K.H. Effect of grit blasting and thermal spraying on microstructure evolution of P91 weldment. Arch. Metall. Mater. 2018, 63, 1725–1734. [Google Scholar] [CrossRef]
- Melentiev, R.; Fang, F. Recent advances and challenges of abrasive jet machining. CIRP J. Manuf. Sci. Technol. 2018, 22, 1–20. [Google Scholar] [CrossRef]
- Adnan, A.; Kulekci, K.M.; Seker, U.; Ercan, F. Effect of feed rate on surface roughness in abrasive water jet cutting applications. J. Mater. Process. Technol. 2004, 147, 389–396. [Google Scholar] [CrossRef]
- Ghara, T.; Paul, S.; Bandyopadhyay, P.P. Influence of grit blasting on residual stress depth profile and dislocation density in different metallic substrates. Metall. Mater. Trans. 2020, 52, 65–81. [Google Scholar] [CrossRef]
- Ghara, T.; Paul, S.; Bandyopadhyay, P.P. Effect of grit blasting parameters on surface and near-surface properties of different metal alloys. J. Therm. Spray Technol. 2020, 30, 251–269. [Google Scholar] [CrossRef]
- Parikshit, D.A.; Dubey, S.; Yogesh, D.V.; Abul, A.B.; Purushottam, B.S. Modelling and multi-objective optimization of surface roughness and kerf taper angle in abrasive water jet machining of steel. J. Braz. Soc. Mech. Sci. Eng. 2018, 40, 259. [Google Scholar] [CrossRef]
- Chaitanya, K.A.; Kishore, D.B.; Girish, K.K. Experimental study on surface roughness by using abrasive jet machine. Mater. Today Proc. 2020, 23, 453–457. [Google Scholar] [CrossRef]
- Tsai, C.F.; Yan, H.B.; Kuan, Y.C.; Huang, Y.F. A taguchi and experimental investigation into the optimal processing conditions for the abrasive jet polishing of SKD61 mold steel. Int. J. Mach. Tools Manuf. 2008, 48, 932–945. [Google Scholar] [CrossRef]
- Kim, A.; Kainuma, S.; Yang, M. Surface characteristics and corrosion behavior of carbon steel treated by abrasive blasting. Metals 2021, 11. [Google Scholar] [CrossRef]
- Chander, P.K.; Vashista, M.; Sabiruddin, K.; Paul, S.; Bandyopadhyay, P.P. Effects of grit blasting on surface properties of steel substrates. Mater. Des. 2009, 30, 2895–2902. [Google Scholar] [CrossRef]
- Bañon, F.; Sambruno, A.; Batista, M.; Simonet, B.; Salguero, J. Surface quality and free energy evaluation of s275 steel by shot blasting, Abrasive Water Jet Texturing and Laser Surface Texturing. Metals 2020, 10, 290. [Google Scholar] [CrossRef]
- Miturska-Barańska, I.; Rudawska, A.; Doluk, E. The influence of sandblasting process parameters of aerospace aluminium alloy sheets on adhesive joints strength. Materials 2021, 14, 6626. [Google Scholar] [CrossRef]
- Jagannatha, N.; Hiremath, S.S.; Sadashivappa, K. Analysis and parametric optimization of abrasive hot air jet machining for glass using taguchi method and utility concept. Int. J. Mech. Mater. Eng. 2012, 7, 9–15. [Google Scholar]
- Pradhan, S.; Das, R.S.; Nanda, K.B.; Jana, C.P.; Dhupal, D. Experimental investigation on machining of hardstone quartz with modified ajm using hot silicon carbide abrasives. J. Braz. Soc. Mech. Sci. Eng. 2020, 42, 559. [Google Scholar] [CrossRef]
- Jafar, R.; Mohammad, H.; Spelt, J.K.; Papini, M. Surface roughness and erosion rate of abrasive jet micro-machined channels: Experiments and analytical model. Wear 2013, 303, 138–145. [Google Scholar] [CrossRef]
- Nayak, B.B.; Kumar, A.; Mahapatra, S.S.; Das, D. Application of wpca based taguchi method for multi-response optimization of abrasive jet machining process. Mater. Today Proc. 2018, 5, 5138–5244. [Google Scholar] [CrossRef]
- Made, S.; Balasubramanian, M. Impact of nozzle design on surface roughness of abrasive jet machined glass fibre reinforced polymer composites. Silicon 2018, 10, 2453–2462. [Google Scholar] [CrossRef]
- Wakuda, M.; Yamauchi, Y.; Kanzaki, S. Surface finishing of alumina ceramics by means of abrasive jet machining. J. Am. Ceram. Soc. 2002, 85, 1306–1308. [Google Scholar] [CrossRef]
- Ke, J.H.; Tsai, F.C.; Hung, J.C.; Yan, B.H. Characteristics study of flexible magnetic abrasive in abrasive jet machining. Procedia CIRP 2012, 1, 679–680. [Google Scholar] [CrossRef]
- Slatineanu, L.; Dodun, O.; Nagit, G.; Coteata, M.; Coteata, L.; Tabacaru, L.; Bancescu, B. Evaluation of the surface profile obtained by abrasive jet machining. IOP Conf. Ser. Mater. Sci. Eng. 2018, 444, 032005. [Google Scholar] [CrossRef]
- Kwon, D.K.; Lee, J.H. Performance Improvement of micro-abrasive jet blasting process for Al 6061. Processes 2022, 10, 2247. [Google Scholar] [CrossRef]
- Sanghani, S.; Chirag, R.; Korat, M.M. Performance analysis of abrasive water jet machining process for AISI 304 stainless steel. J. Exp. Appl. Mech. 2017, 8, 53–55. [Google Scholar]
- Wang, W.; Biermann, D.; Almuth, R.; Arif, M.F.A.; Veldhuis, C.S. Effects on tool performance of cutting edge prepared by pressurized air wet abrasive jet machining (PAWAJM). J. Mater. Process. Technol. 2020, 227, 116–456. [Google Scholar] [CrossRef]
- Ficko, M.; Begic-Hajdarevic, D.; Husic, M.C.; Berus, L.; Cekic, A.; Klancnik, S. Prediction of surface roughness of an abrasive water jet cut using an artificial neural network. Materials 2021, 14, 3108. [Google Scholar] [CrossRef]
- Hlaváčová, I.M.; Sadílek, M.; Váňová, P.; Szumilo, Š.; Tyč, M. Influence of steel structure on machinability by abrasive water jet. Materials 2020, 13, 4424. [Google Scholar] [CrossRef]
- Steel, S.; Graphs, M. Machinability of Stainless Steel. Available online: https://www.machiningdoctor.com/machinability/stainless-steel-2/ (accessed on 17 October 2022).
- Charles, J. Past, Present and Future of the Duplex Stainless Steels. Available online: https://www.worldstainless.org/Files/issf/non-image-files/PDF/Pastpresentandfutureoftheduplexstainlesssteels.pdf (accessed on 10 October 2022).
- Ramachandran, C.S.; Balasubramanian, V.; Ananthapadmanabhan, P.V. Erosion of atmospheric plasma sprayed rare earth oxide coatings air-suspended corundum particles. Ceram. Int. 2013, 39, 649–672. [Google Scholar] [CrossRef]
- Mahade, S.; Venkat, A.; Curry, N.; Leitner, M.; Joshi, S. Erosion performance of atmospheric plasma sprayed thermal barrier coatings with diverse porosity levels. Coatings 2021, 11, 86. [Google Scholar] [CrossRef]
- Keyence Corporation. Area Roughness Parameters. Available online: https://www.keyence.com/ss/products/microscope/roughness/surface/sku-kurtosis.jsp (accessed on 10 October 2022).
Disclaimer/Publisher’s Note: The statements, opinions and data contained in all publications are solely those of the individual author(s) and contributor(s) and not of MDPI and/or the editor(s). MDPI and/or the editor(s) disclaim responsibility for any injury to people or property resulting from any ideas, methods, instructions or products referred to in the content. |
© 2022 by the authors. Licensee MDPI, Basel, Switzerland. This article is an open access article distributed under the terms and conditions of the Creative Commons Attribution (CC BY) license (https://creativecommons.org/licenses/by/4.0/).