Article

Three-Body Abrasive Wear Performance of High Chromium White Cast Iron with Different Ti and C Content

by
Mohammad Jobayer Huq
1,
Kazumichi Shimizu
1,
Kenta Kusumoto
1,* and
Riki Hendra Purba
1,2
1
Muroran Institute of Technology, 27-1 Mizumoto, Muroran City 050-8585, Japan
2
Department of Mechanical Engineering, University of Sumatera Utara, Medan 20155, Indonesia
*
Author to whom correspondence should be addressed.
Lubricants 2022, 10(12), 348; https://doi.org/10.3390/lubricants10120348
Submission received: 28 October 2022 / Revised: 28 November 2022 / Accepted: 1 December 2022 / Published: 4 December 2022
(This article belongs to the Special Issue Assessment of Abrasive Wear)

Abstract

:
The need for better wear-resistant materials to reduce cost and save the environment is noteworthy. The striking wear resistance of high chromium white cast iron (HCCI) has made it industry’s predominant choice. The three-body abrasive wear resistance performance of HCCI was investigated based on combined Ti and C. The Ti and C content varied in different percentages. The addition of Ti resulted in refined M7C3 carbides and TiC crystallization. The hardness was significantly affected by the addition of Ti. The increment in Ti content resulted in a decrease in the hardness, leading to a higher wear rate. However, the individual contribution of C led to higher hardness and, hence, better wear resistance, which is contrary to Ti. Out of the three specimens with 3, 3.5, and 4 wt.% C content, the 4 wt.% C series showed the highest hardness but the lowest wear rate and depth. This study found that the combination of a lower percentage of Ti with a higher percentage of C in HCCI can have a worthwhile result in abrasive wear.

1. Introduction

Abrasive wear is the phenomenon in materials that takes place between two contact surfaces of different hardness levels [1], where the material surface is scraped off by particles of high hardness [2]. Abrasive wear is one of the most significant occurrences that cause mass loss, damage, and component failure in industry [3,4]. Industrialized nations spend an estimated 1–4% of their gross national product due to abrasive wear loss. Hence, a study for atypical and effective abrasive-wear-resistant materials is highly expected [5,6].
Due to their exceptional wear resistance, high-chromium white cast irons (HCCIs) are extensively used in places that are susceptible to wear [7]. HCCIs are ferrous alloys with chromium content ranging from 12–30 wt.% to 1.6–3.6 wt.% [8]. A significant number of researchers have investigated the contributions of transitional materials to upgrade the wear resistance of cast irons. It has been well articulated in previous research that transitional materials play a remarkable role in modifying their stoichiometry and forming carbides that have an important influence on the wear characteristics of HCCI. These additions target reshaping the eutectic carbide to enhance hardness, upgrading the hardenability of the matrix, and suppressing the pearlite formation in areas with these alloying elements between the eutectic carbides and the matrix [9,10]. The C concentration in the matrix has enormous significance on the carbide volume fraction (CVF). In addition, the CVF, which is increased by higher C content, leads to enhanced hardness and wear resistance [11]. In as-cast conditions, these alloys consist of a mainly metastable austenitic matrix with M7C3 carbide [12], which can be transformed into martensite by heat treatment [13]. High hardness and wear resistance of these alloys can be achieved with an abundance of M7C3 eutectic carbides. A high percentage of C and Cr results in a high volume of eutectic carbides, leading to superior hardness and wear resistance; however, it is detrimental to fracture toughness [14]. HCCIs solidify as primary austenite dendrites with a network of interdendritic eutectic carbides. Mostly, the austenite matrix will be transformed into martensite during the destabilization heat treatment process [8,15,16,17,18]. Austenitic irons have hardness in the range of 500–520 HV, and this type of cast iron can be used in a few areas. However, heat-treated irons are essential for broader applications. Heat treatment at 920–1060 °C for 1–6 h, which may vary due to different alloy contents, and air quenching at room temperature destabilize the austenite through precipitations of Cr-rich secondary carbides; the purpose of this heat treatment is hardening [19]. The formation of MC carbides with excellent hardness and spherical morphology is expected to toughen the HCCI. In addition, the formation of primary MC carbides is generally seen at the beginning of the solidification, along with being finely distributed in the iron matrix. The addition of Ti, Nb, and V can significantly assist in the production of MC primary carbides, which has been studied by a significant number of researchers. Bedolla et al. [12,13,20] found that NbC and TiC carbide formation was the result of Nb and Ti additions. Xiaojun et al. found that TiC can contribute to generating primary M7C3 carbides, which leads to the remarkable refinement of the final grain size without clustering in the matrix [21]. The toughness of the matrix is also an important factor for wear resistance [22]. Methods such as semi-solid forming [23] and rare earth processing [24,25] have been employed to increase the toughness of HCCI by improving the size of the primary M7C3 carbides, though these methods have had limited success.
Several studies have been carried out on the erosive wear or abrasive wear of HCCI to find the effect of transition metals. However, papers focused on the combined effect of Ti and C content on the three-body abrasive wear of HCCI are still inadequate. This paper thoroughly investigates the three-body abrasive wear performance of HCCI with different Ti and C contents.

2. Experimental Procedures

2.1. Materials Preparation

In this current study, high-Cr white cast iron, with 27% Cr used as the base metal, was mixed with varied C contents of 3, 3.5, and 4 wt.% and Ti contents of 0, 1, and 2 wt.%. A total of nine specimens were prepared. The manufacturing process of the materials can be explained briefly. A total of 50 kg of raw materials was melted in a high-induction furnace followed by pouring into a sand mold of 53 mm × 250 mm × 15 mm. Second, each material was cut in dimensions of 50 mm × 10 mm × 10 mm using a high-speed precision cutting machine (Refinetech Co., Ltd., RCA-234, Kanagawa, Japan). The material composition is given in Table 1; SPECTROLAB (AMETEK, Inc., Berwyn, PA, USA) was employed to measure this composition. Scanning electron microscopy combined with energy dispersive X-ray spectroscopy (SEM + EDS; JSM-6510A, JEOL, Tokyo, Japan) and X-ray diffraction (XRD; Ultima IV, RIGAKU, Tokyo, Japan) were used to analyze the microstructure before and after etching in 5% nitro-hydrochloric acid. The carbide volume fraction (CVF) was evaluated by ImageJ software [26]. A grinding machine (GS52PF; Kuroda Seiko Co., Ltd., Kanagawa, Japan) was used to clean the surface of the test materials to make sure that the roughness of each specimen was uniform (approximately 0.21 µm).
Conventionally, HCCI is quenched after heating in the temperature range of 1173–1423 K, followed by tempering after heating at 693–813 K to transform the austenite to martensite and precipitate the secondary carbide [11,19,27,28]. However, Purba et al. found that high-chromium-based multi-component white cast iron shows the best erosive wear resistance with quenching only [29]. Many research papers show that the superior wear resistance of the material is the result of increased hardness, even though the toughness needs to be controlled in particular instances by keeping a small portion of austenite in the microstructure after heat treatment [26,30]. As a result, materials with the highest hardness will be chosen that may have a minimal quantity of retained austinite (RA) in the microstructure after destabilization heat treatment within a suitable temperature range. On the other hand, extended research can be conducted on the effect of the heat-treatment temperature on the wear characteristics of specimens. Therefore, the specimens in this research were heated in the temperature range of 1273–1323 K, followed by air force cooling. The phase of the microstructure of the material was identified by using X-ray diffraction (Ultima IV, Rigaku, Japan, with a Cu-K source). The following formula was utilized to evaluate the volume fraction of RA,   ( f R A ):
f R A = 100 % 1 + G ( I I γ )
where I and I γ are the peak intensities of -Fe (200), (211) and γ -Fe (200), (220), (311), and G is the coefficient proportionate to the distinct composition as suggested in [31].

2.2. Three-Body Abrasive Wear Testing

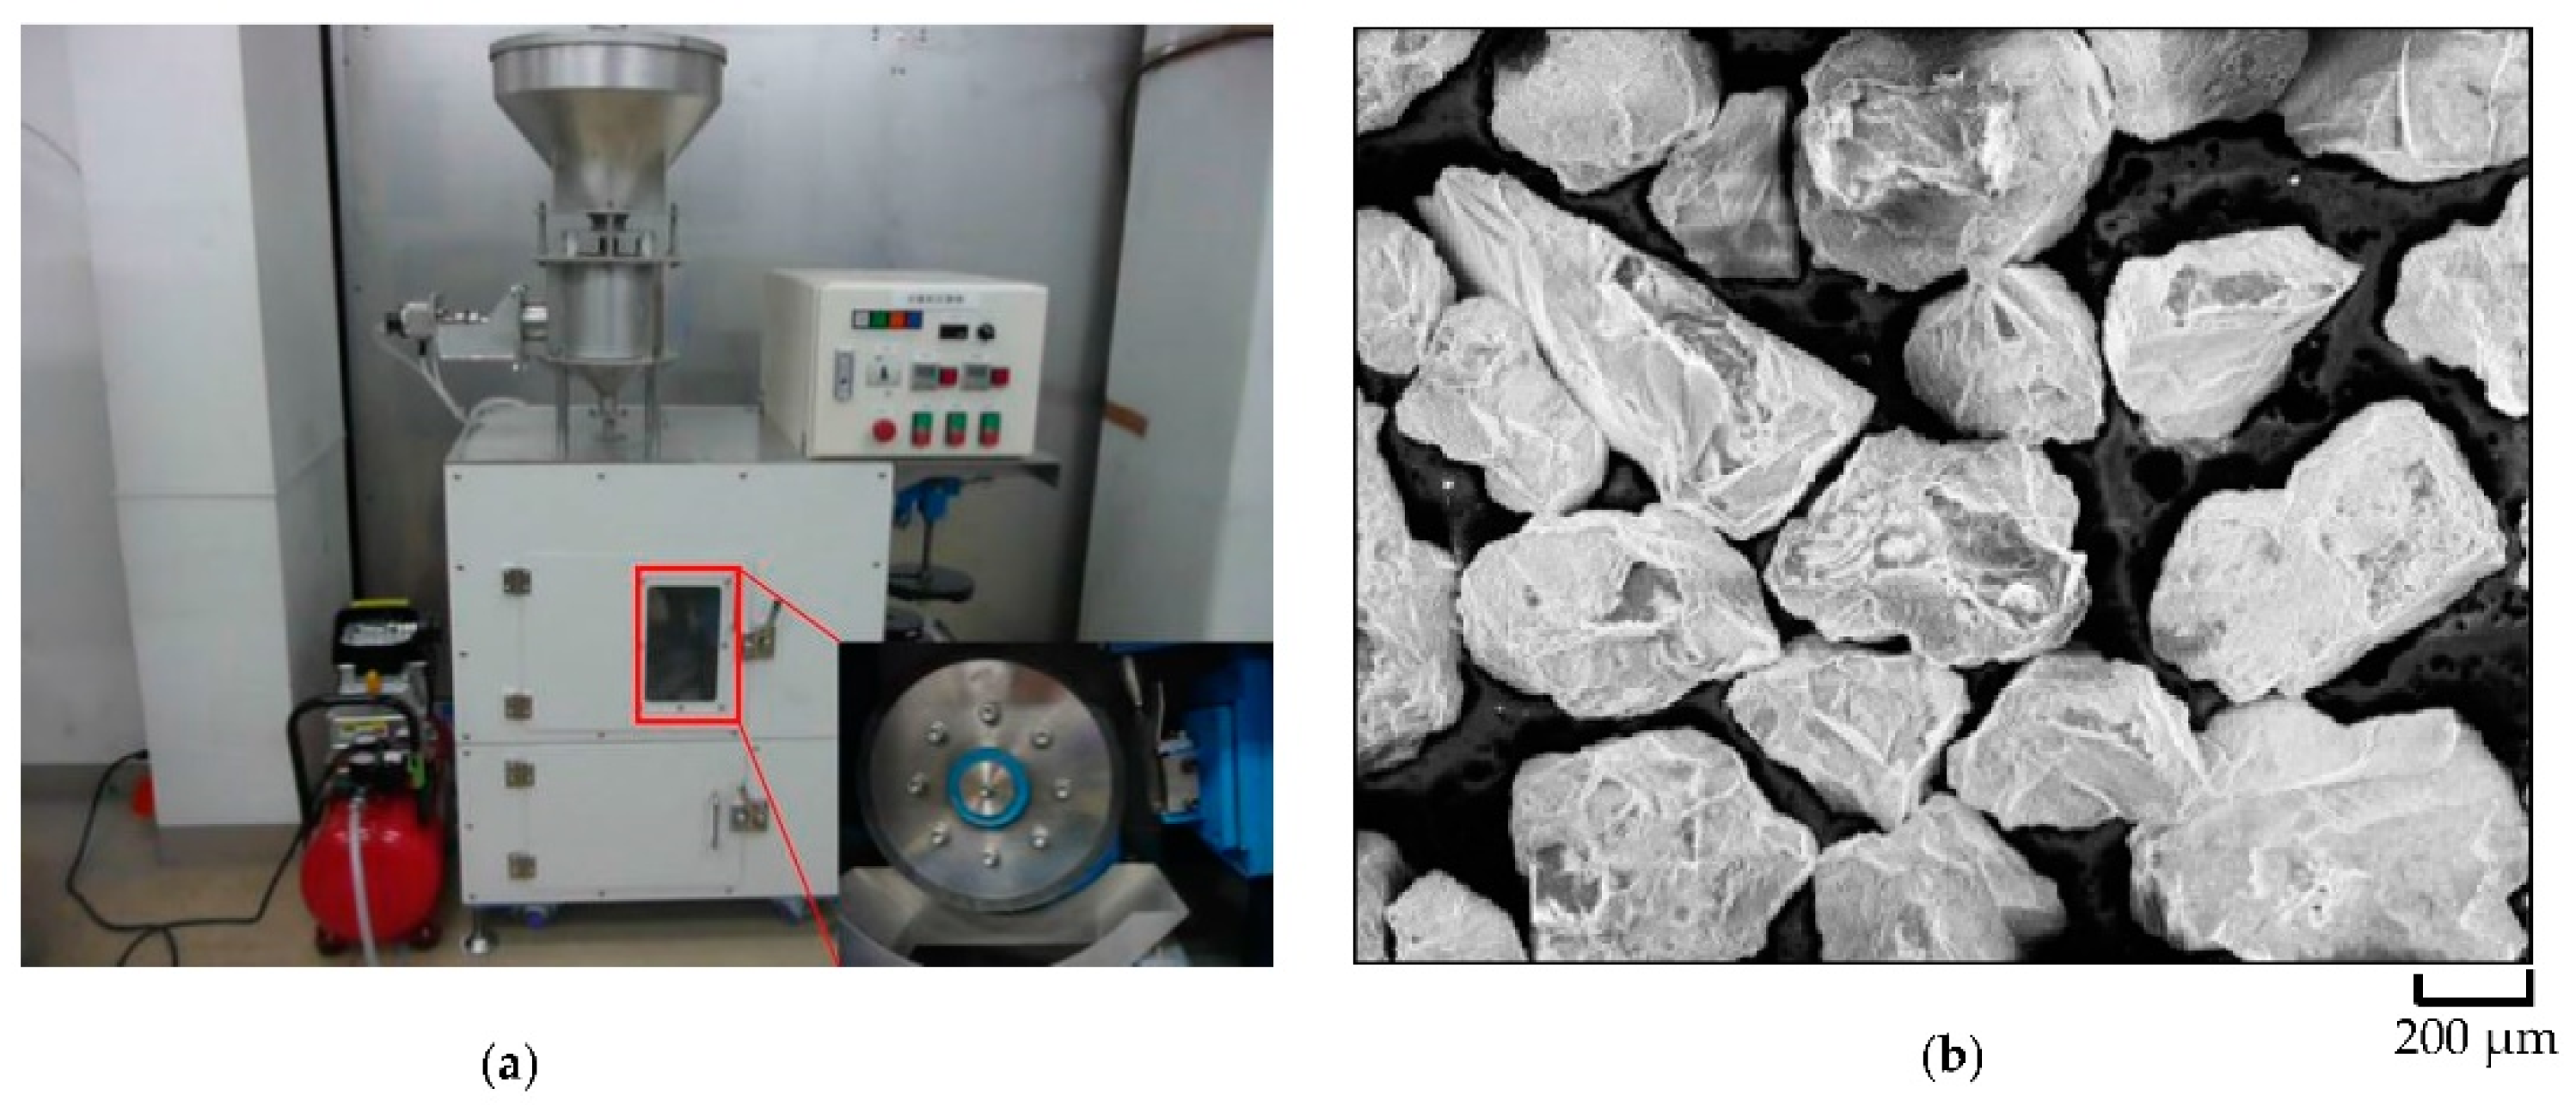
A rubber wheel three-body abrasive wear machine (KOS21 Co., Ltd., Ehime, Japan) under ASTM G65 was employed to evaluate the abrasion characteristics of each material, as shown in Figure 1a. The applied load was 196 N during the test. The sliding distance was about 430 m, with a sliding speed of 1.2 m/s. For abrasive particles, number 6 silica sand (Figure 1b) with a hardness of 1100 HV and size of 300 µm was used. In each test, about 2.5 kg of particles was poured into the sand-supply hopper. At the time of the experiment, the abrasive particles were poured spontaneously on the surface of the test material. The following equation was utilized to calculate the wear rate of the specimens:
    Wear   Rate = Δ m π d t n
where Δ m is the material weight loss, d is the diameter of the wheel, t is the time, and n is the rotating speed.

2.3. Vickers Hardness Test

Each material was cut with dimensions of 10 mm × 10 mm × 10 mm and polished afterward. To evaluate the micro-hardness and macro-hardness (applied load HV 0.1 Kgf and 30 Kgf, respectively) of the materials, Future-Tech Co., Ltd.: FV-800, Kanagawa, Japan Vickers hardness testers were utilized. The micro-hardness signifies the matrix hardness, and the macro-hardness signifies the hardness of the entire material (both matrix and carbide).

3. Results and Discussion

3.1. Microstructural Characterization

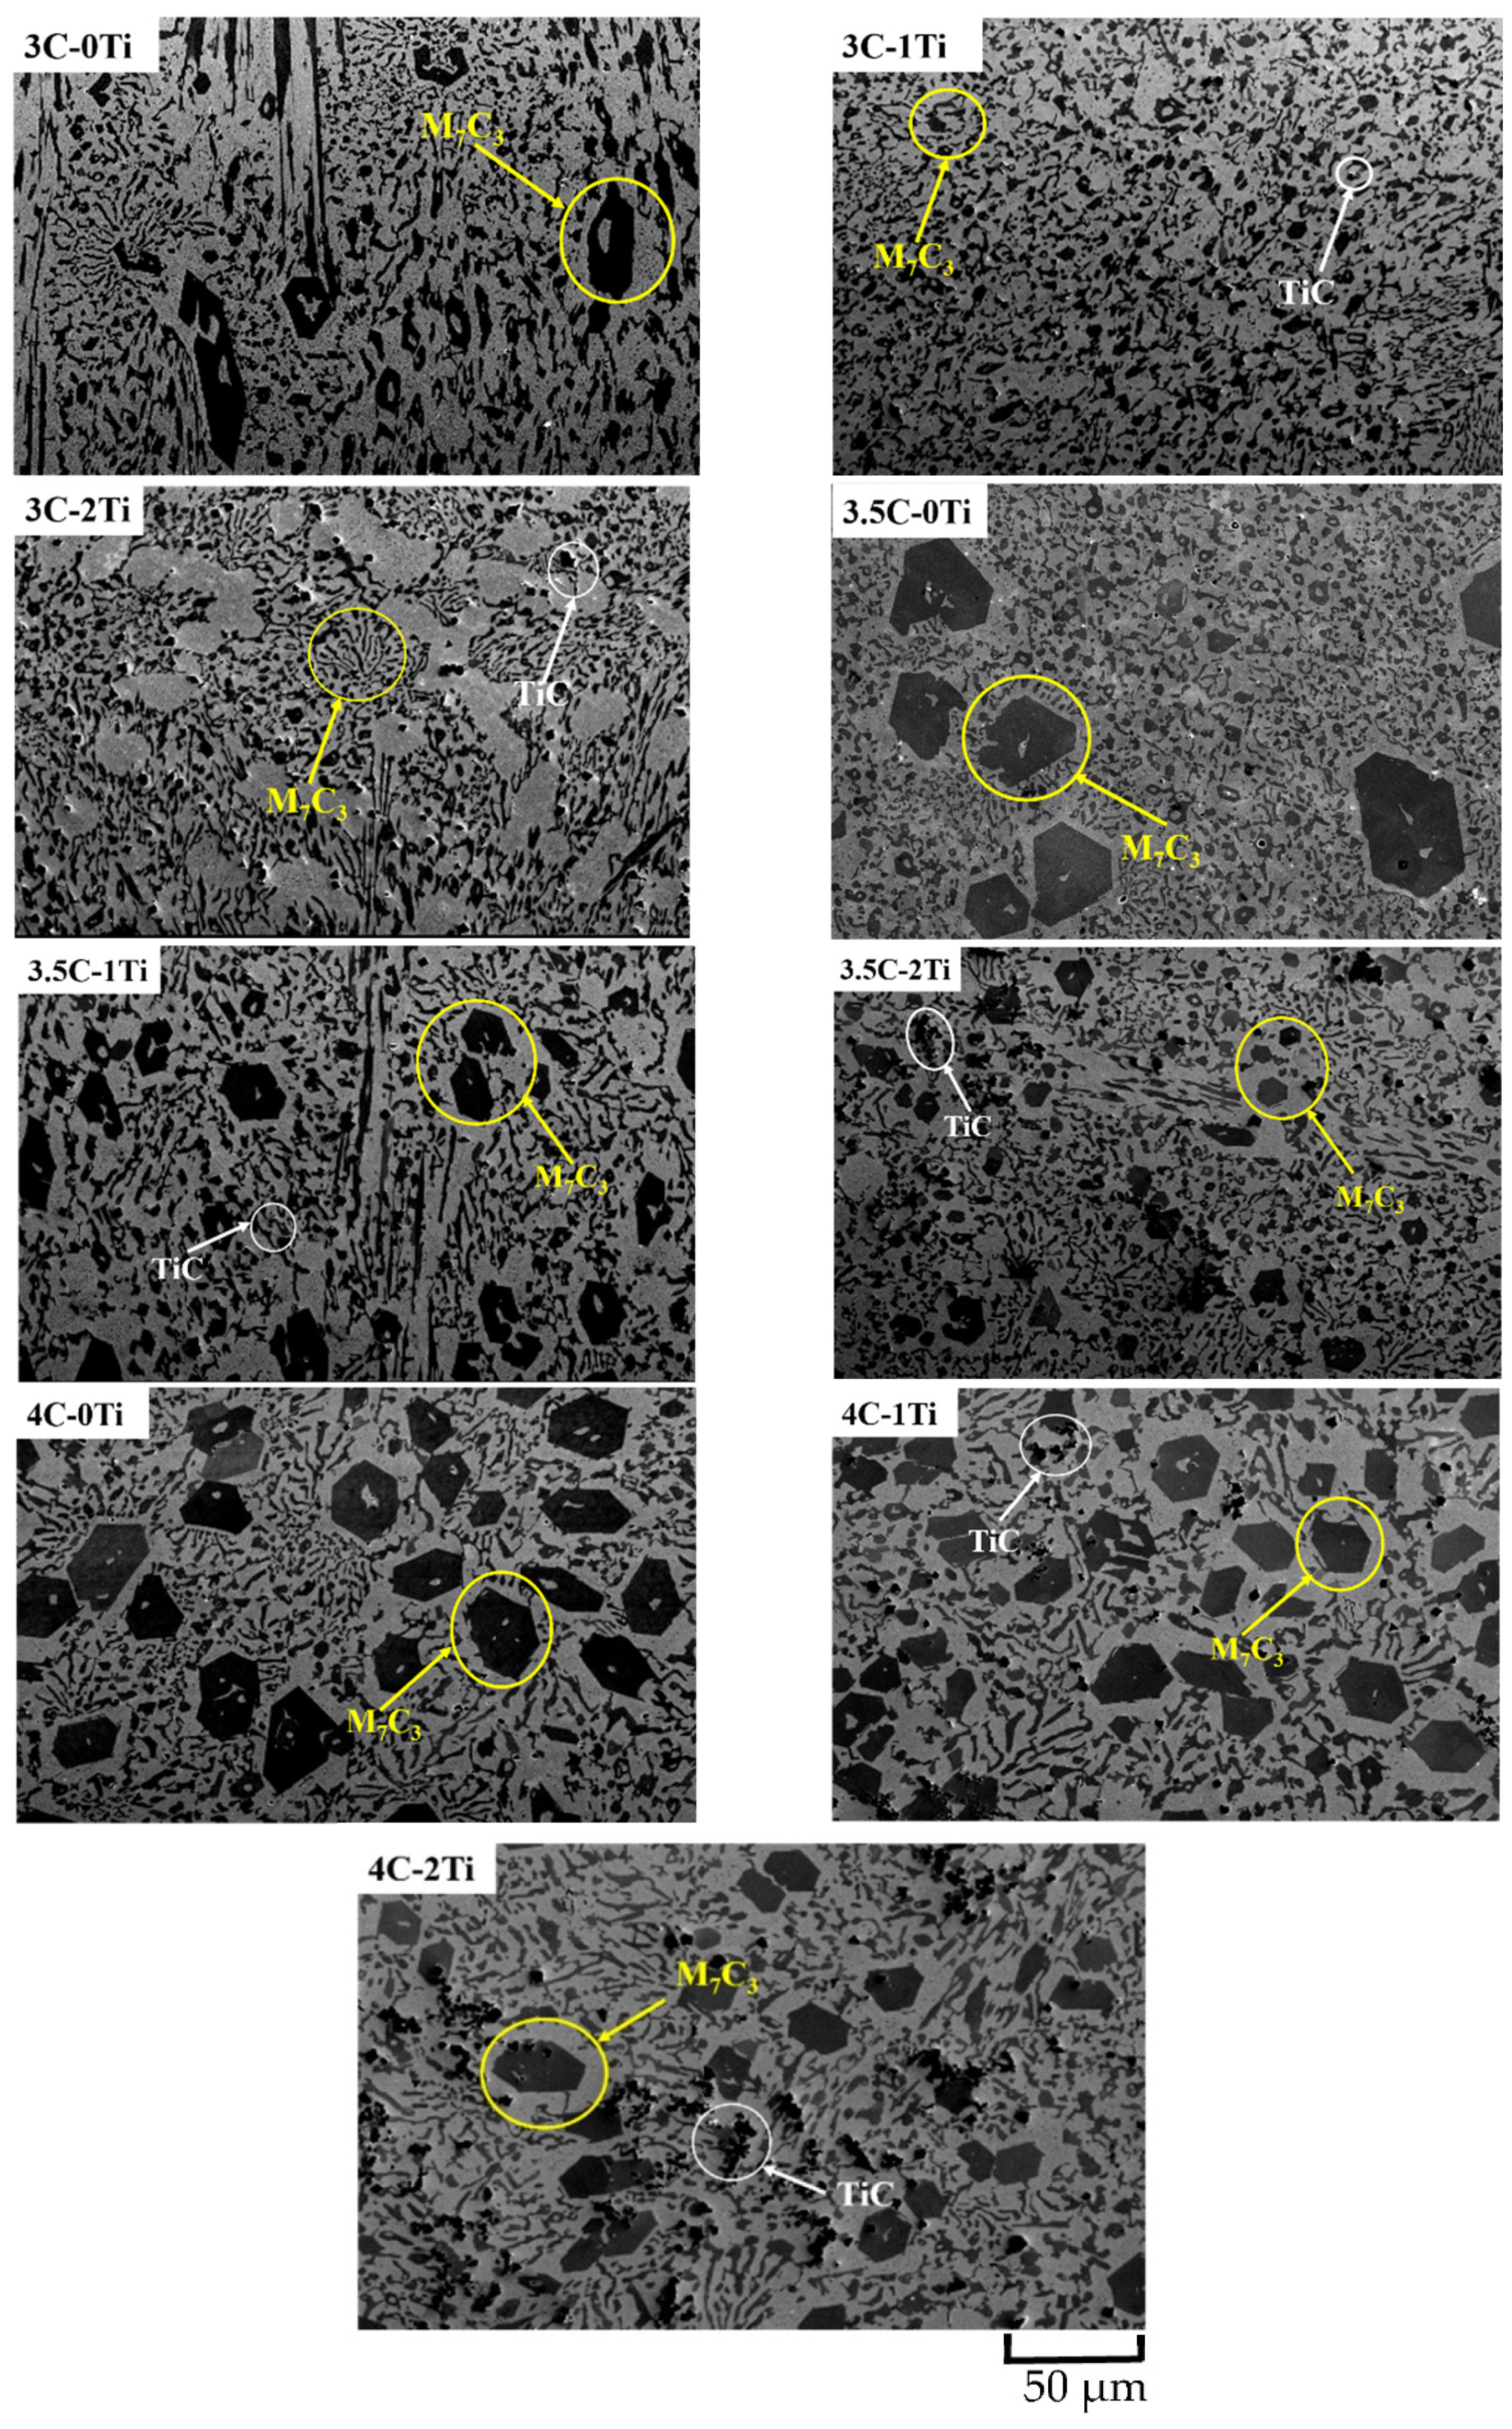
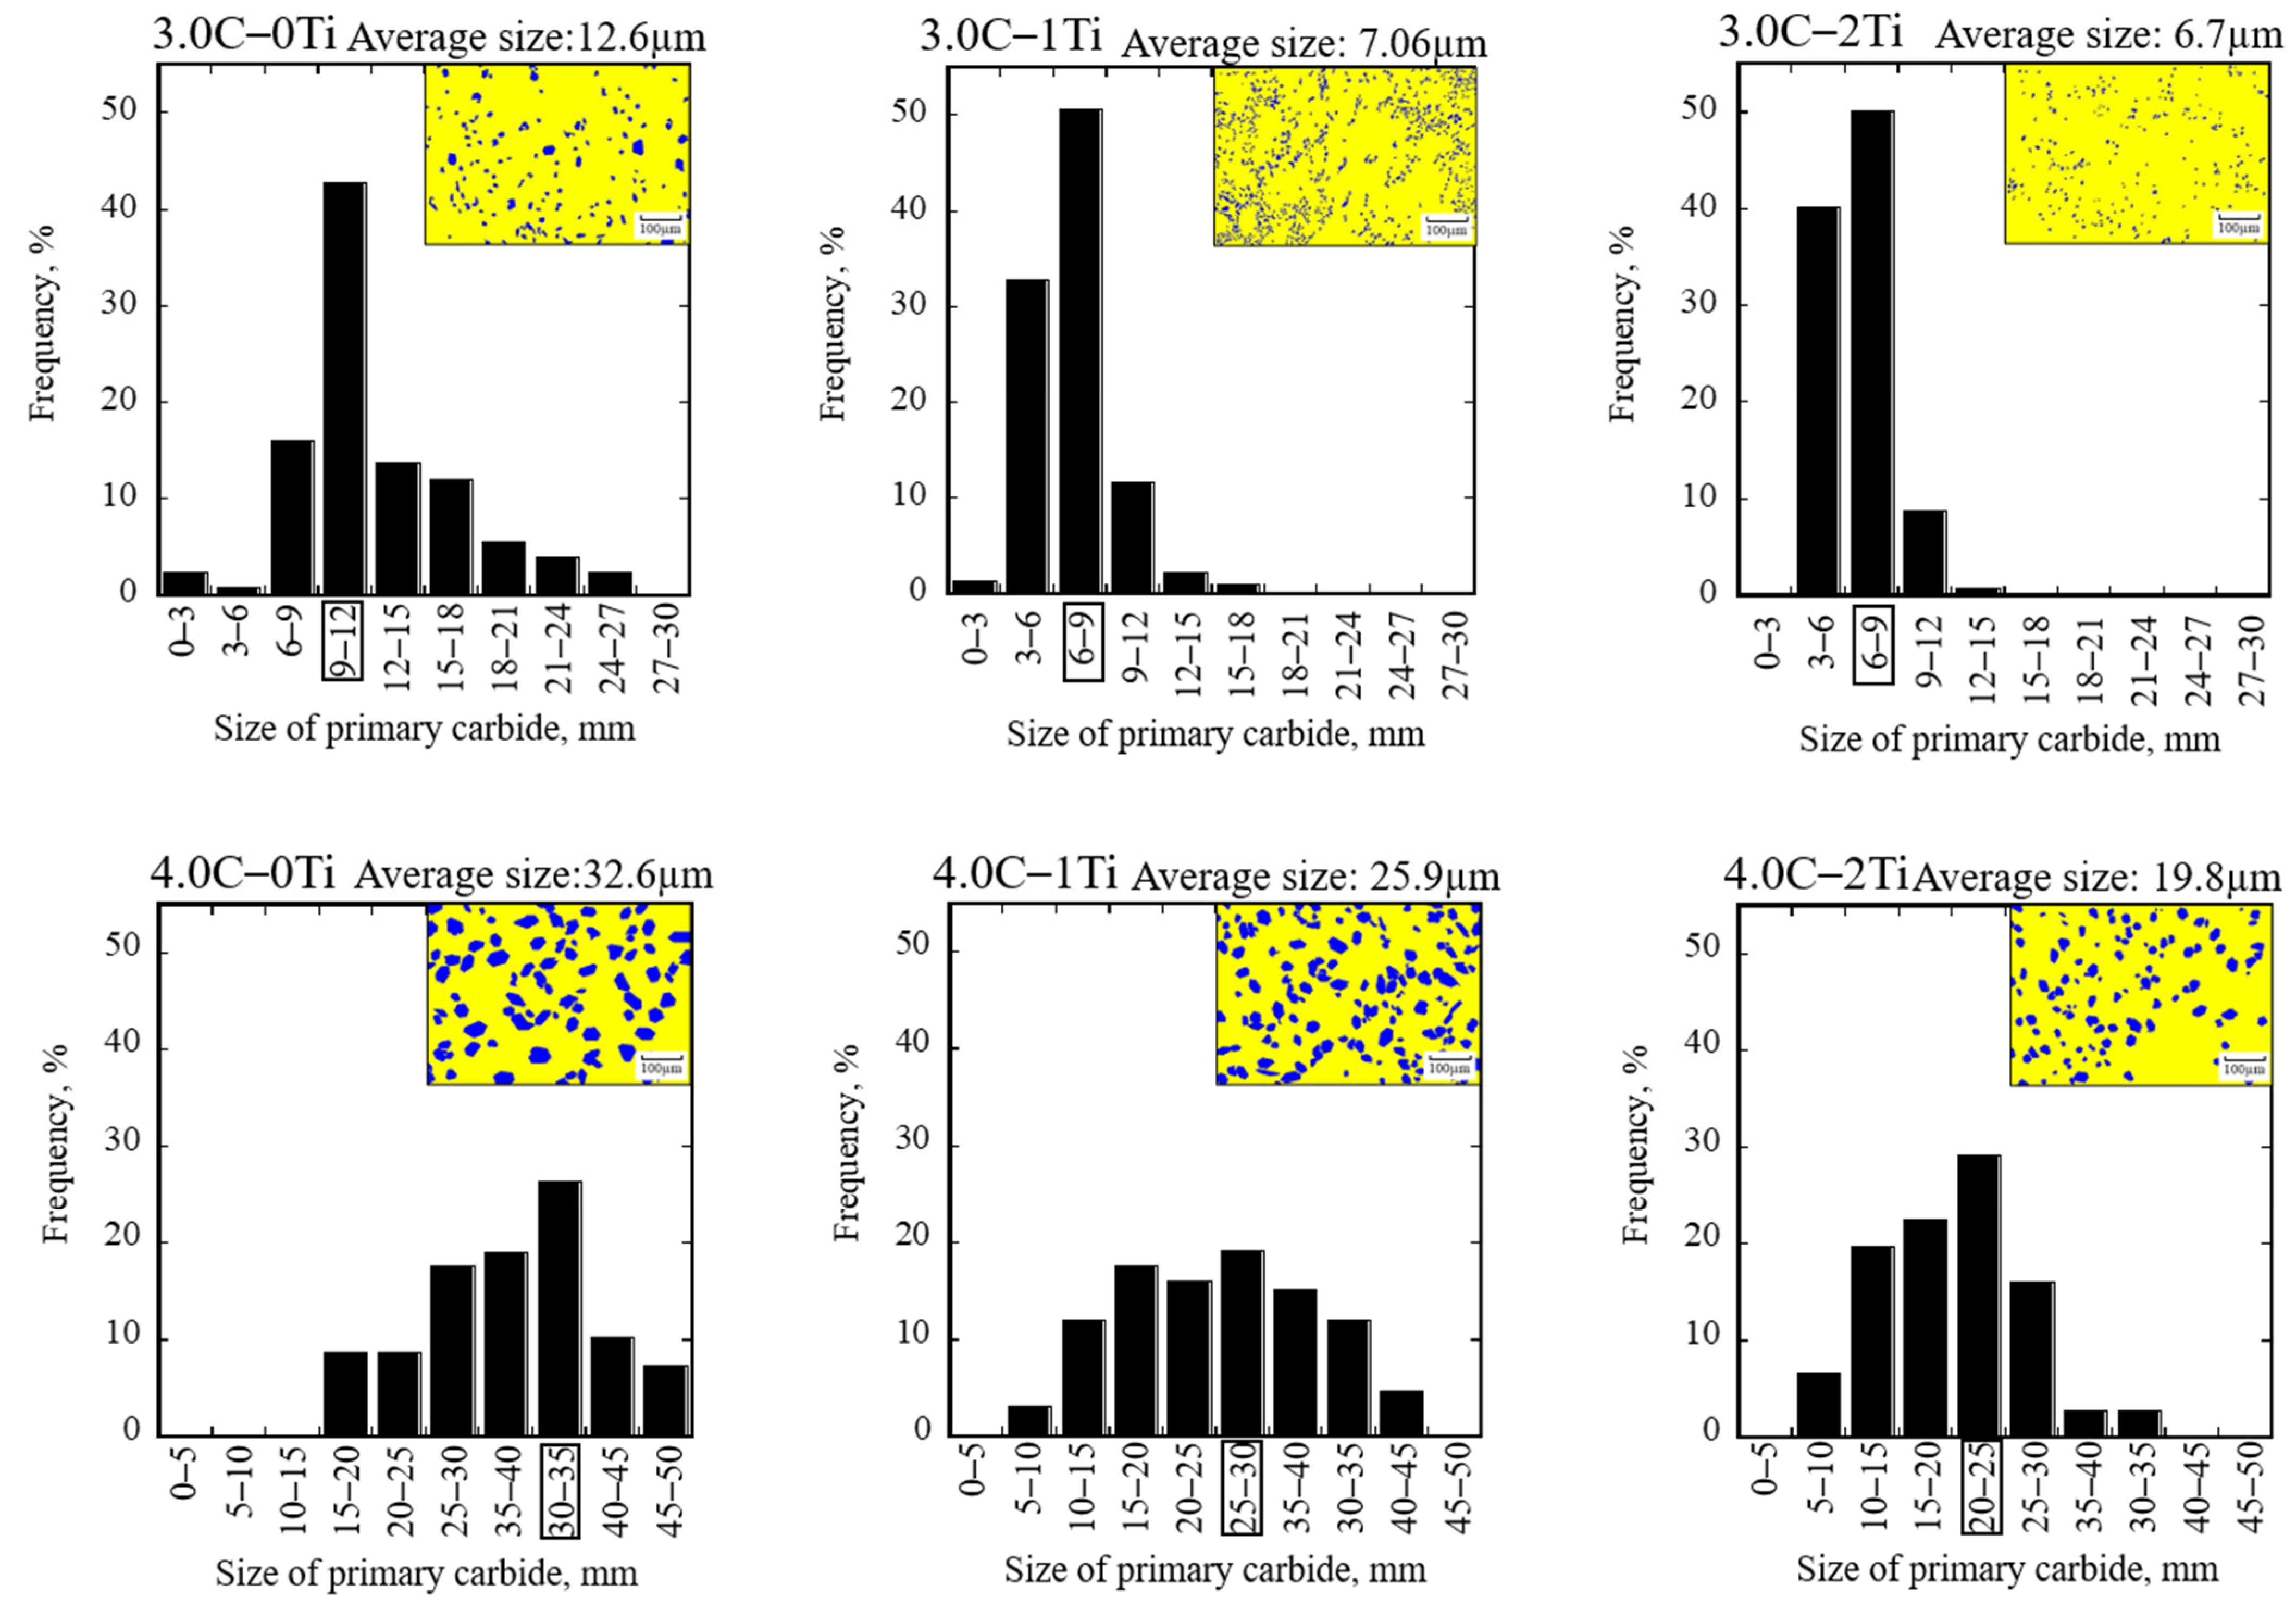
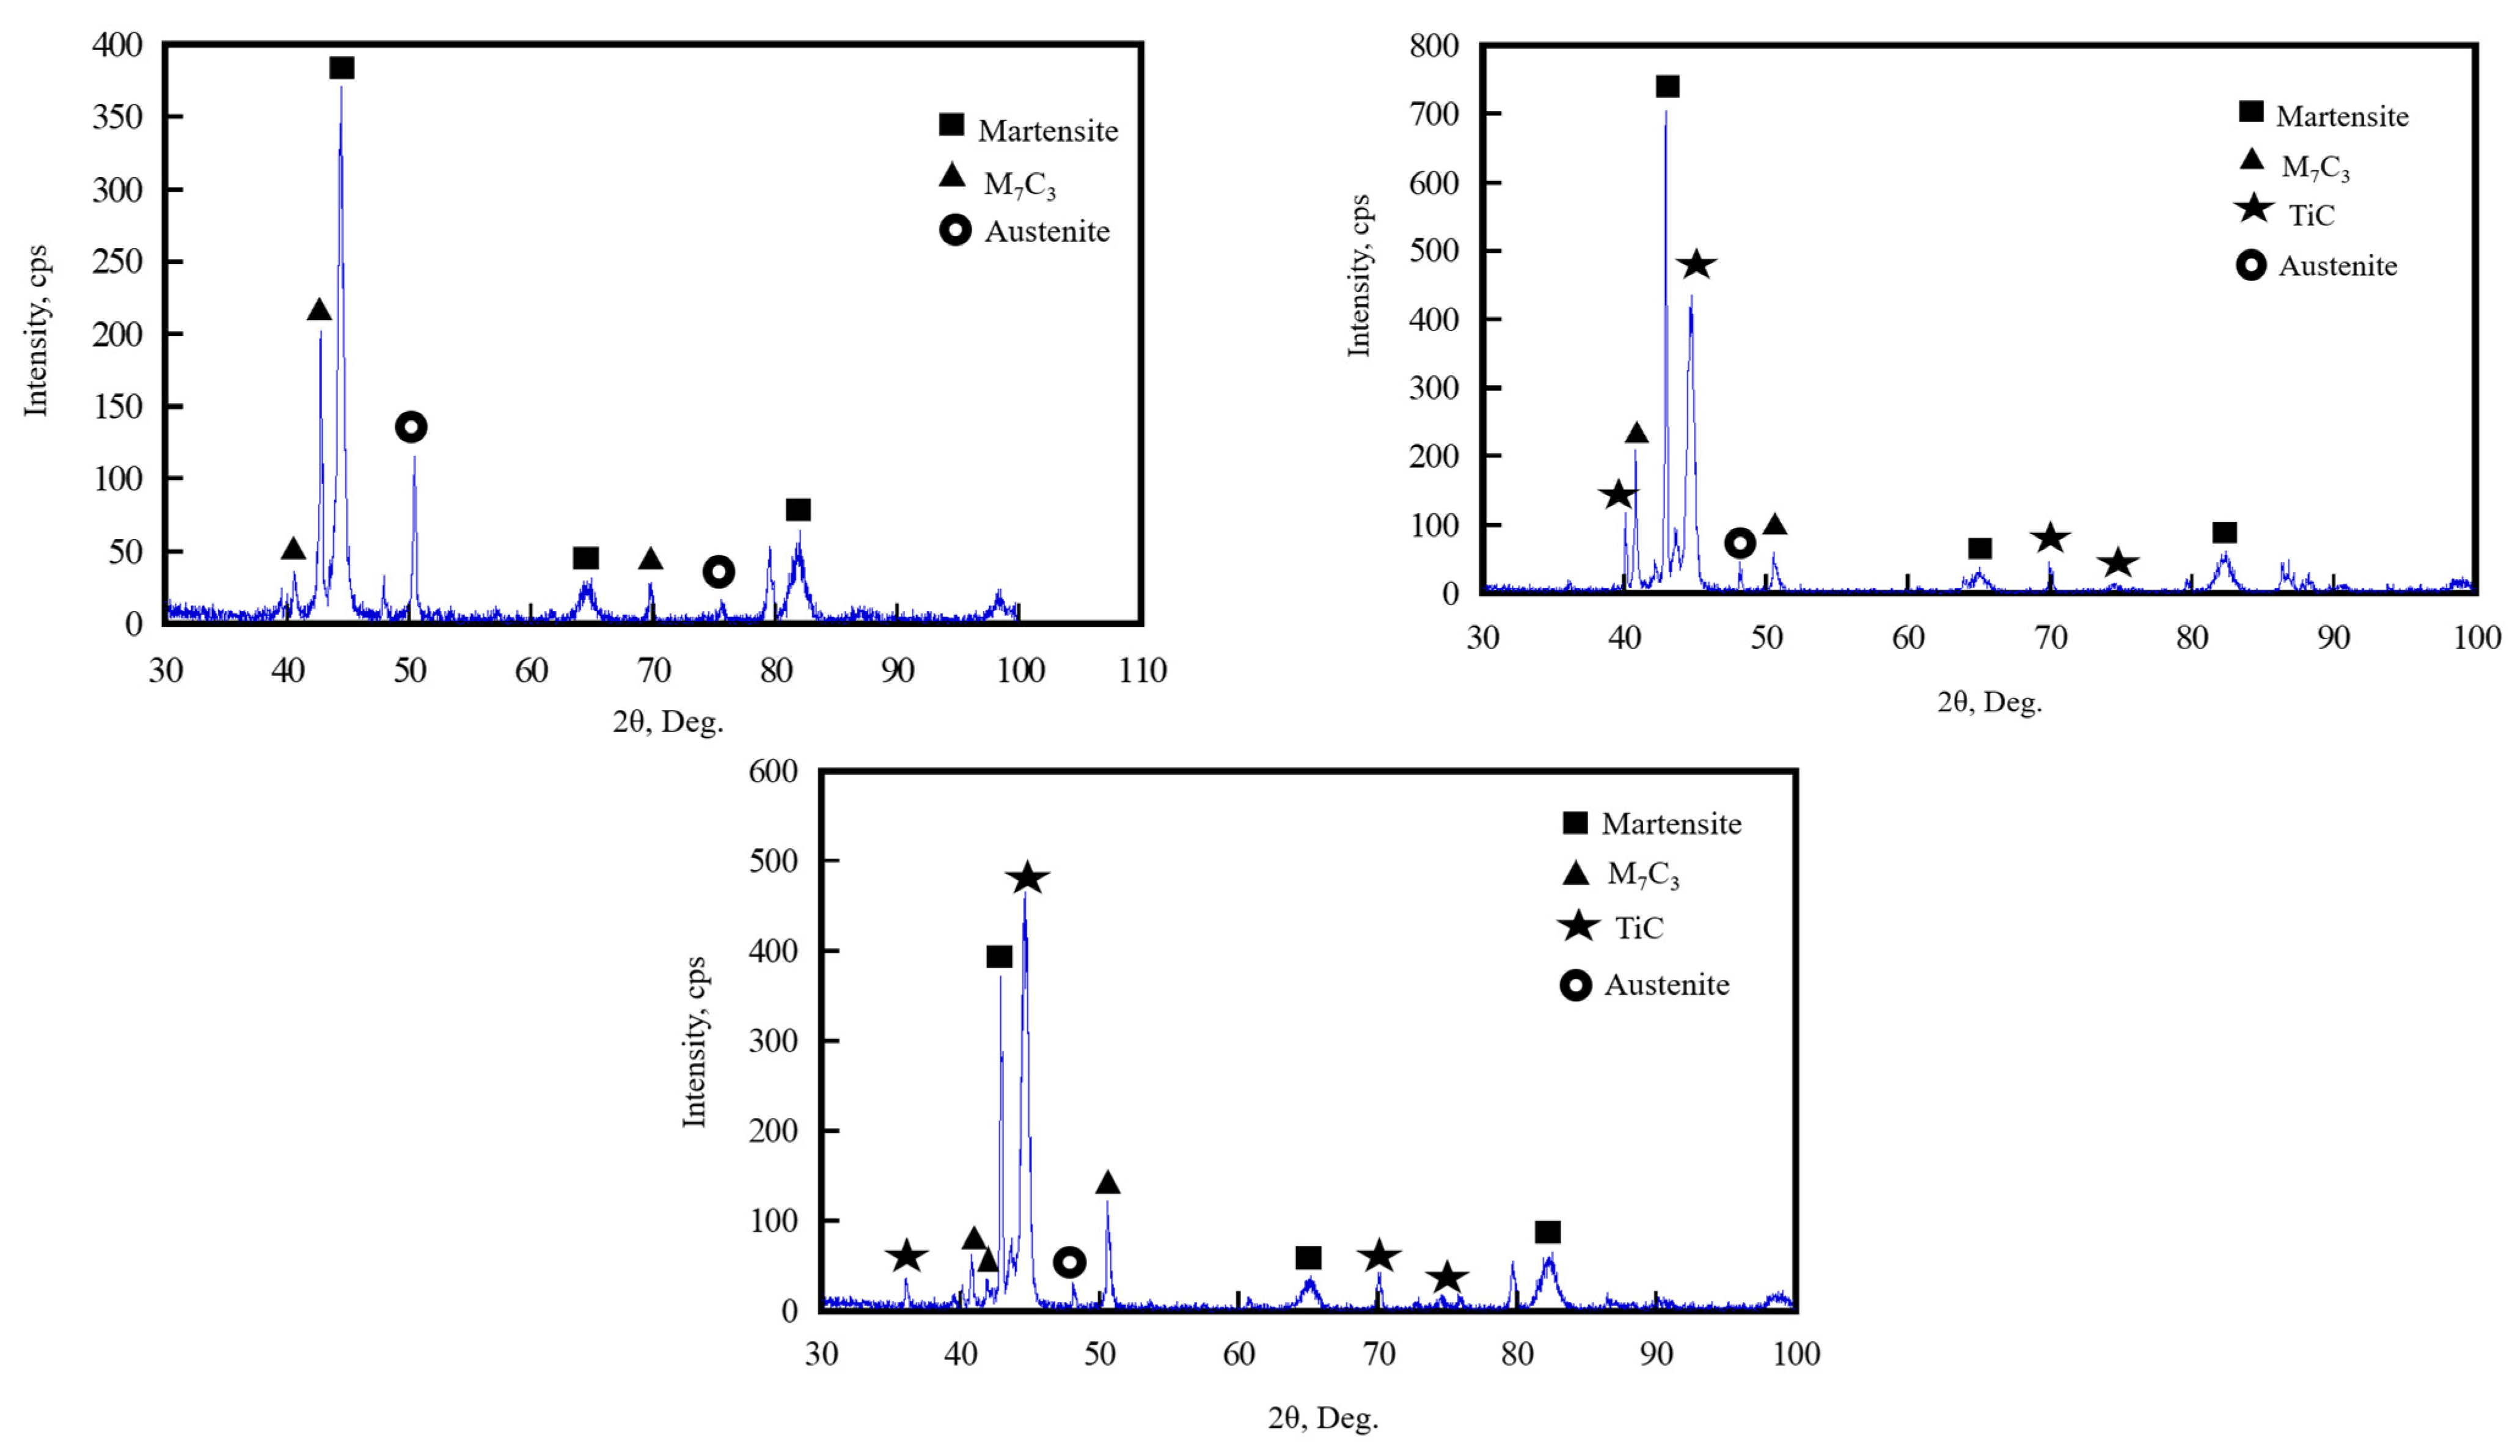
The microstructure of materials such as HCCI is one of the most significant factors in analyzing the wear properties of the material. On that account, the test materials were individually etched in 5% nitro-hydrochloric acid for 6 min, followed by observation using the scanning electron microscope. The microstructures of all nine specimens are displayed in Figure 2. It is illustrated by the images that a substantial number of carbides are precipitated in the microstructure. It is shown that irrespective of the percentage of C or Ti, primary eutectic carbide M7C3 precipitates in all the specimens. Previously, several studies [32,33,34,35] have been carried out to demonstrate the shape of the M7C3 carbide. It has been found that the M7C3 carbide comprises a hexagonal bravais lattice owing to its hexagonal shape; however, in particular instances, an orthogonal crystal structure can be noticed. With the addition of Ti, TiC starts to appear. The precipitation of TiC has an apparent impact on M7C3 carbide. The amount of M7C3 carbides begins to decline as a consequence of the rising percentage of Ti. The cause behind the falling amount of M7C3 carbide is the behavior of Ti to precipitate ahead of M7C3; hence, Ti consumes C in the first instance. The deficiency of C to form M7C3 leads to the shortfall of M7C3. The amount of M7C3 starts to decrease with the precipitation of TiC, and the size of the M7C3 carbide shrinks as well. Figure 3 shows the carbide size distribution. It illustrates a downward trend in the average particle size, with values of 12.6, 7.06, and 6.7 µm for the Ti contents of 0, 1, and 2 wt.%, respectively, in the case of 3wt.% C. The same trend is also observed for 3.5 and 4 wt.% C. The possible phenomenon to shrink or refine M7C3 carbide is that when the Ti starts to consume the C, the affability of the C content in the iron melt is low for chromium carbide, resulting in the refinement of M7C3. A previous study is in good agreement with this present study [11]. However, a reverse occurrence is observed when the test materials are enriched with a higher percentage of C. With an enhancement of the C content, the number of M7C3 carbides starts to escalate. The amount of M7C3 starts to increase with an increase in the C content, and the size of the M7C3 carbide increases as well. A trend in the size enhancement of M7C3 is observed. The average particle size is 12.6 and 32.6 µm for the C content of 3 and 4 wt.%, respectively, in the case of 0 wt.% Ti. A similar trend is also observed for 1 and 2 wt.% Ti specimens. A plausible explanation for this occurrence is the strong carbide-forming behavior of Cr. A higher percentage of C is segregated by the higher amount of Cr. In addition, the stoichiometry of M7C3 might adequately increase the amount of M7C3 and increase the size. Figure 4 shows the X-ray diffraction (XRD) pattern of 3.5 wt.% C specimens.
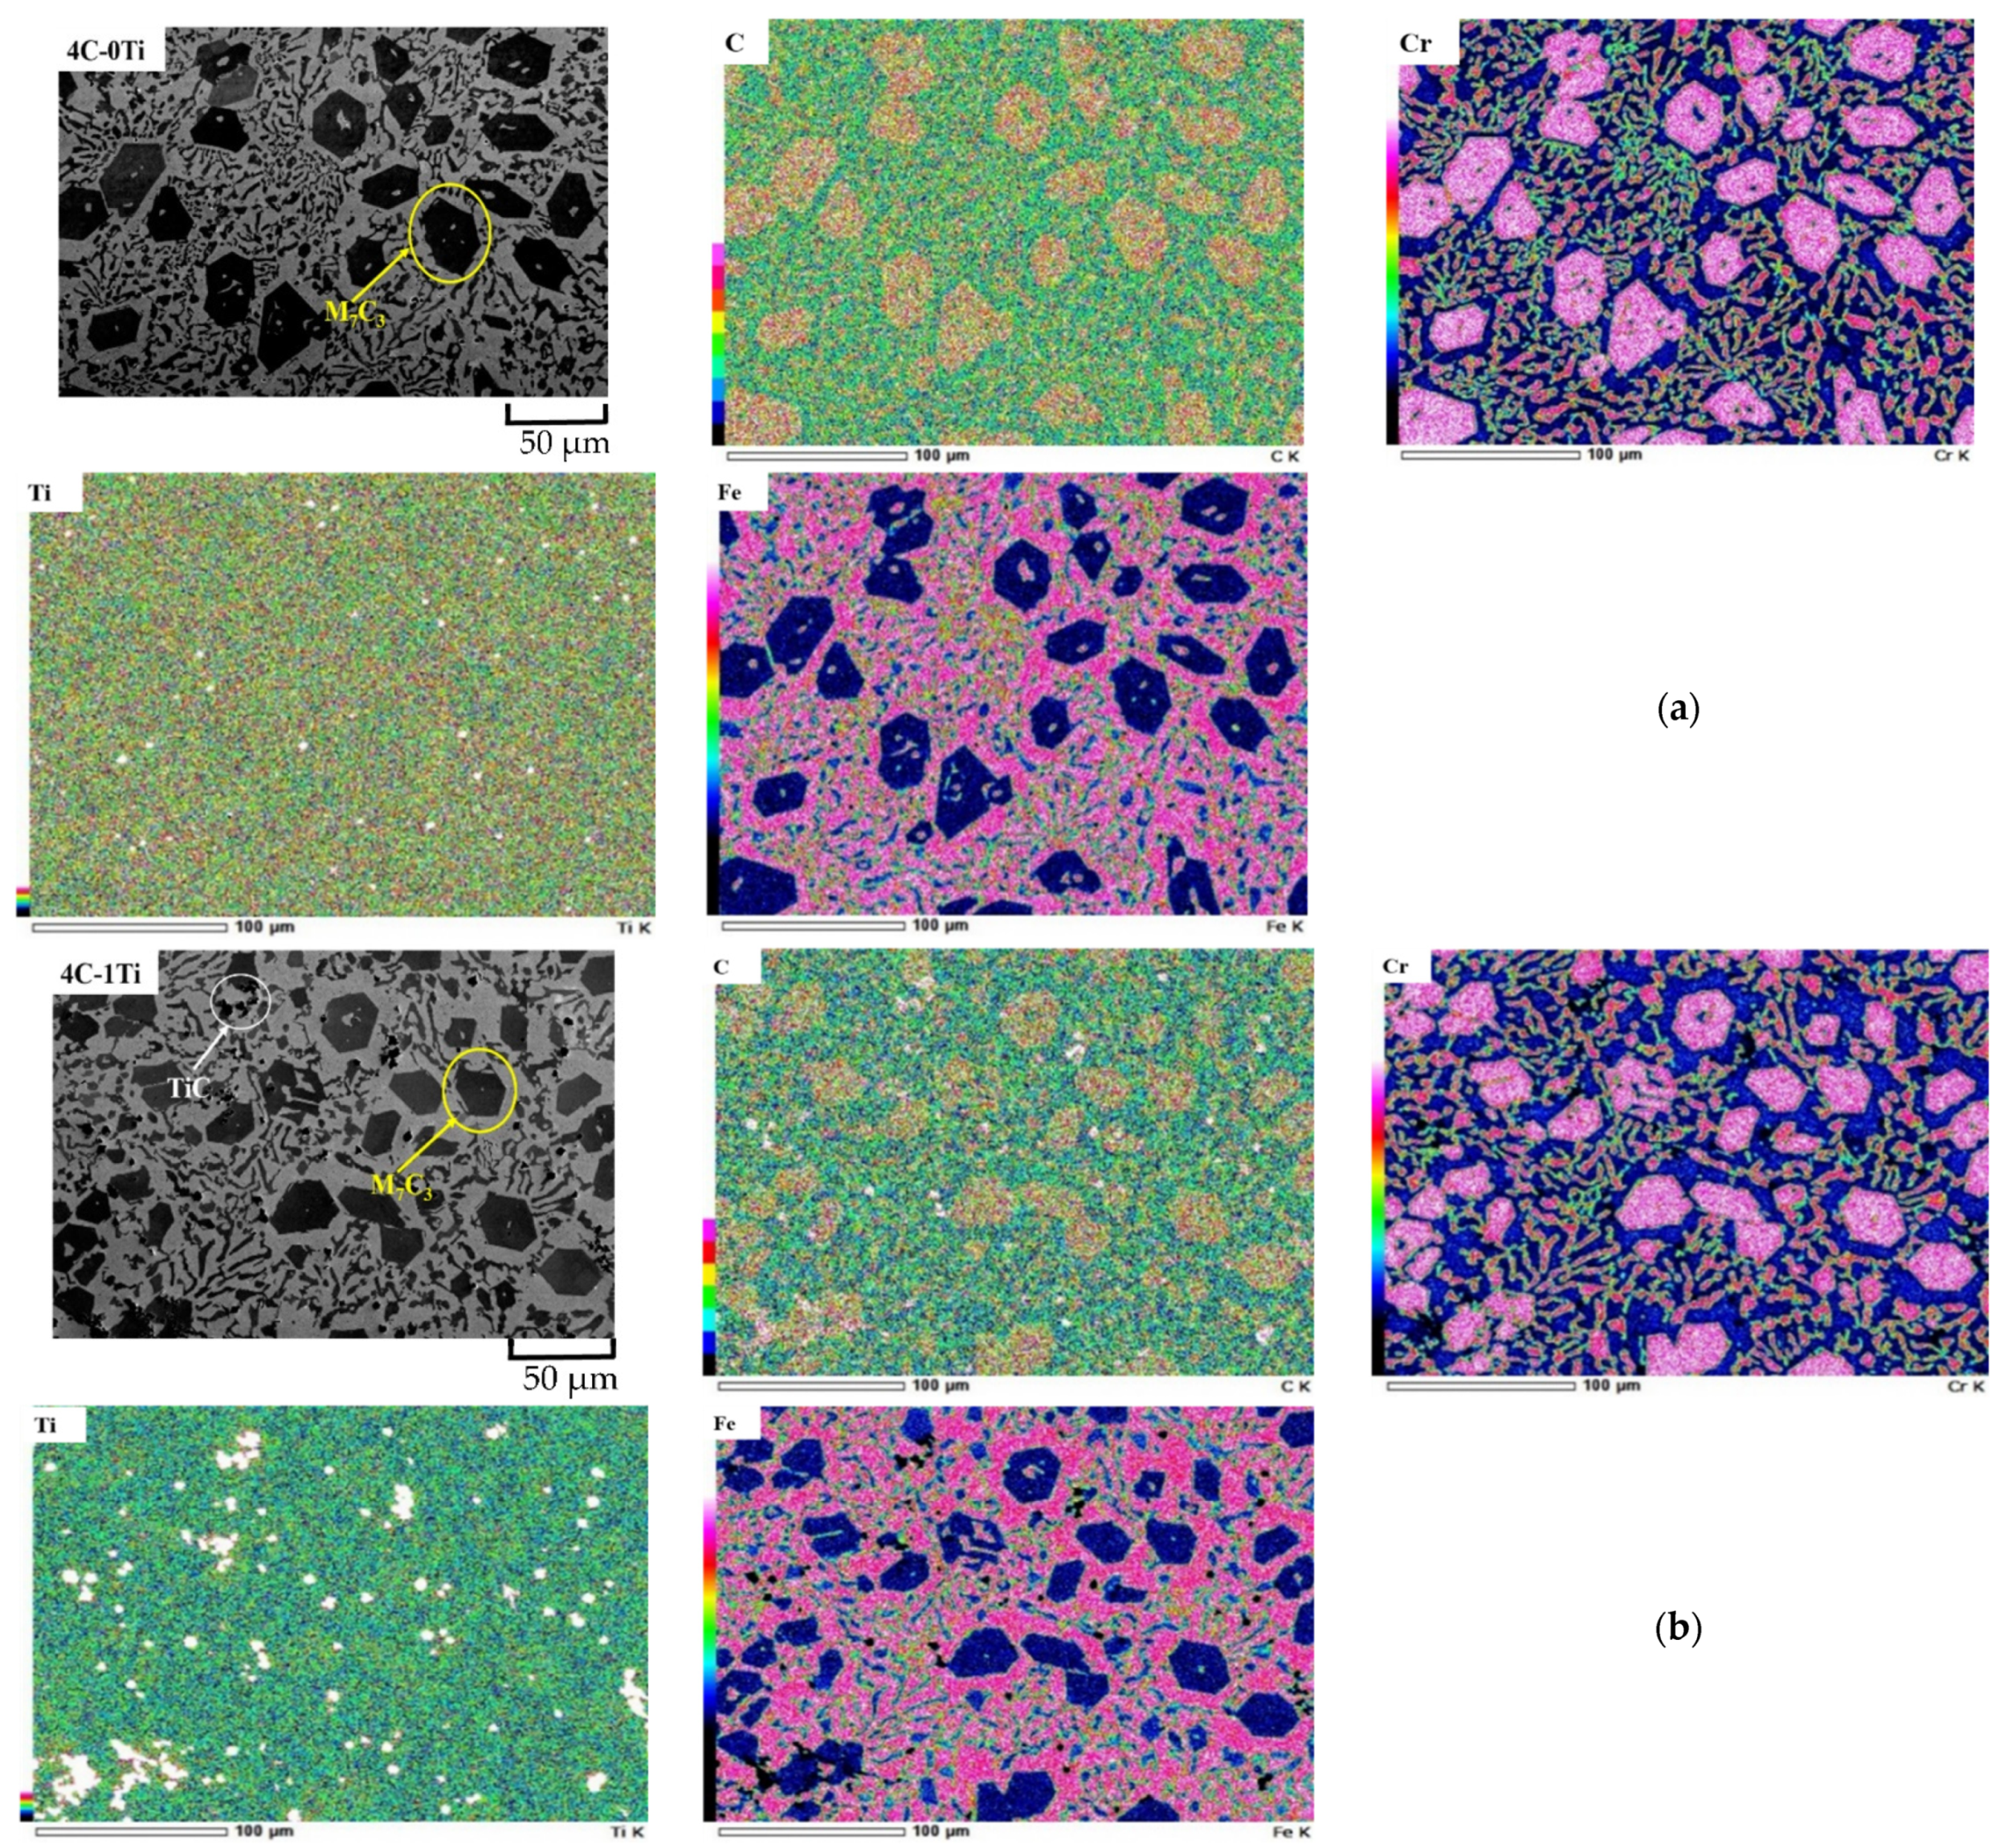
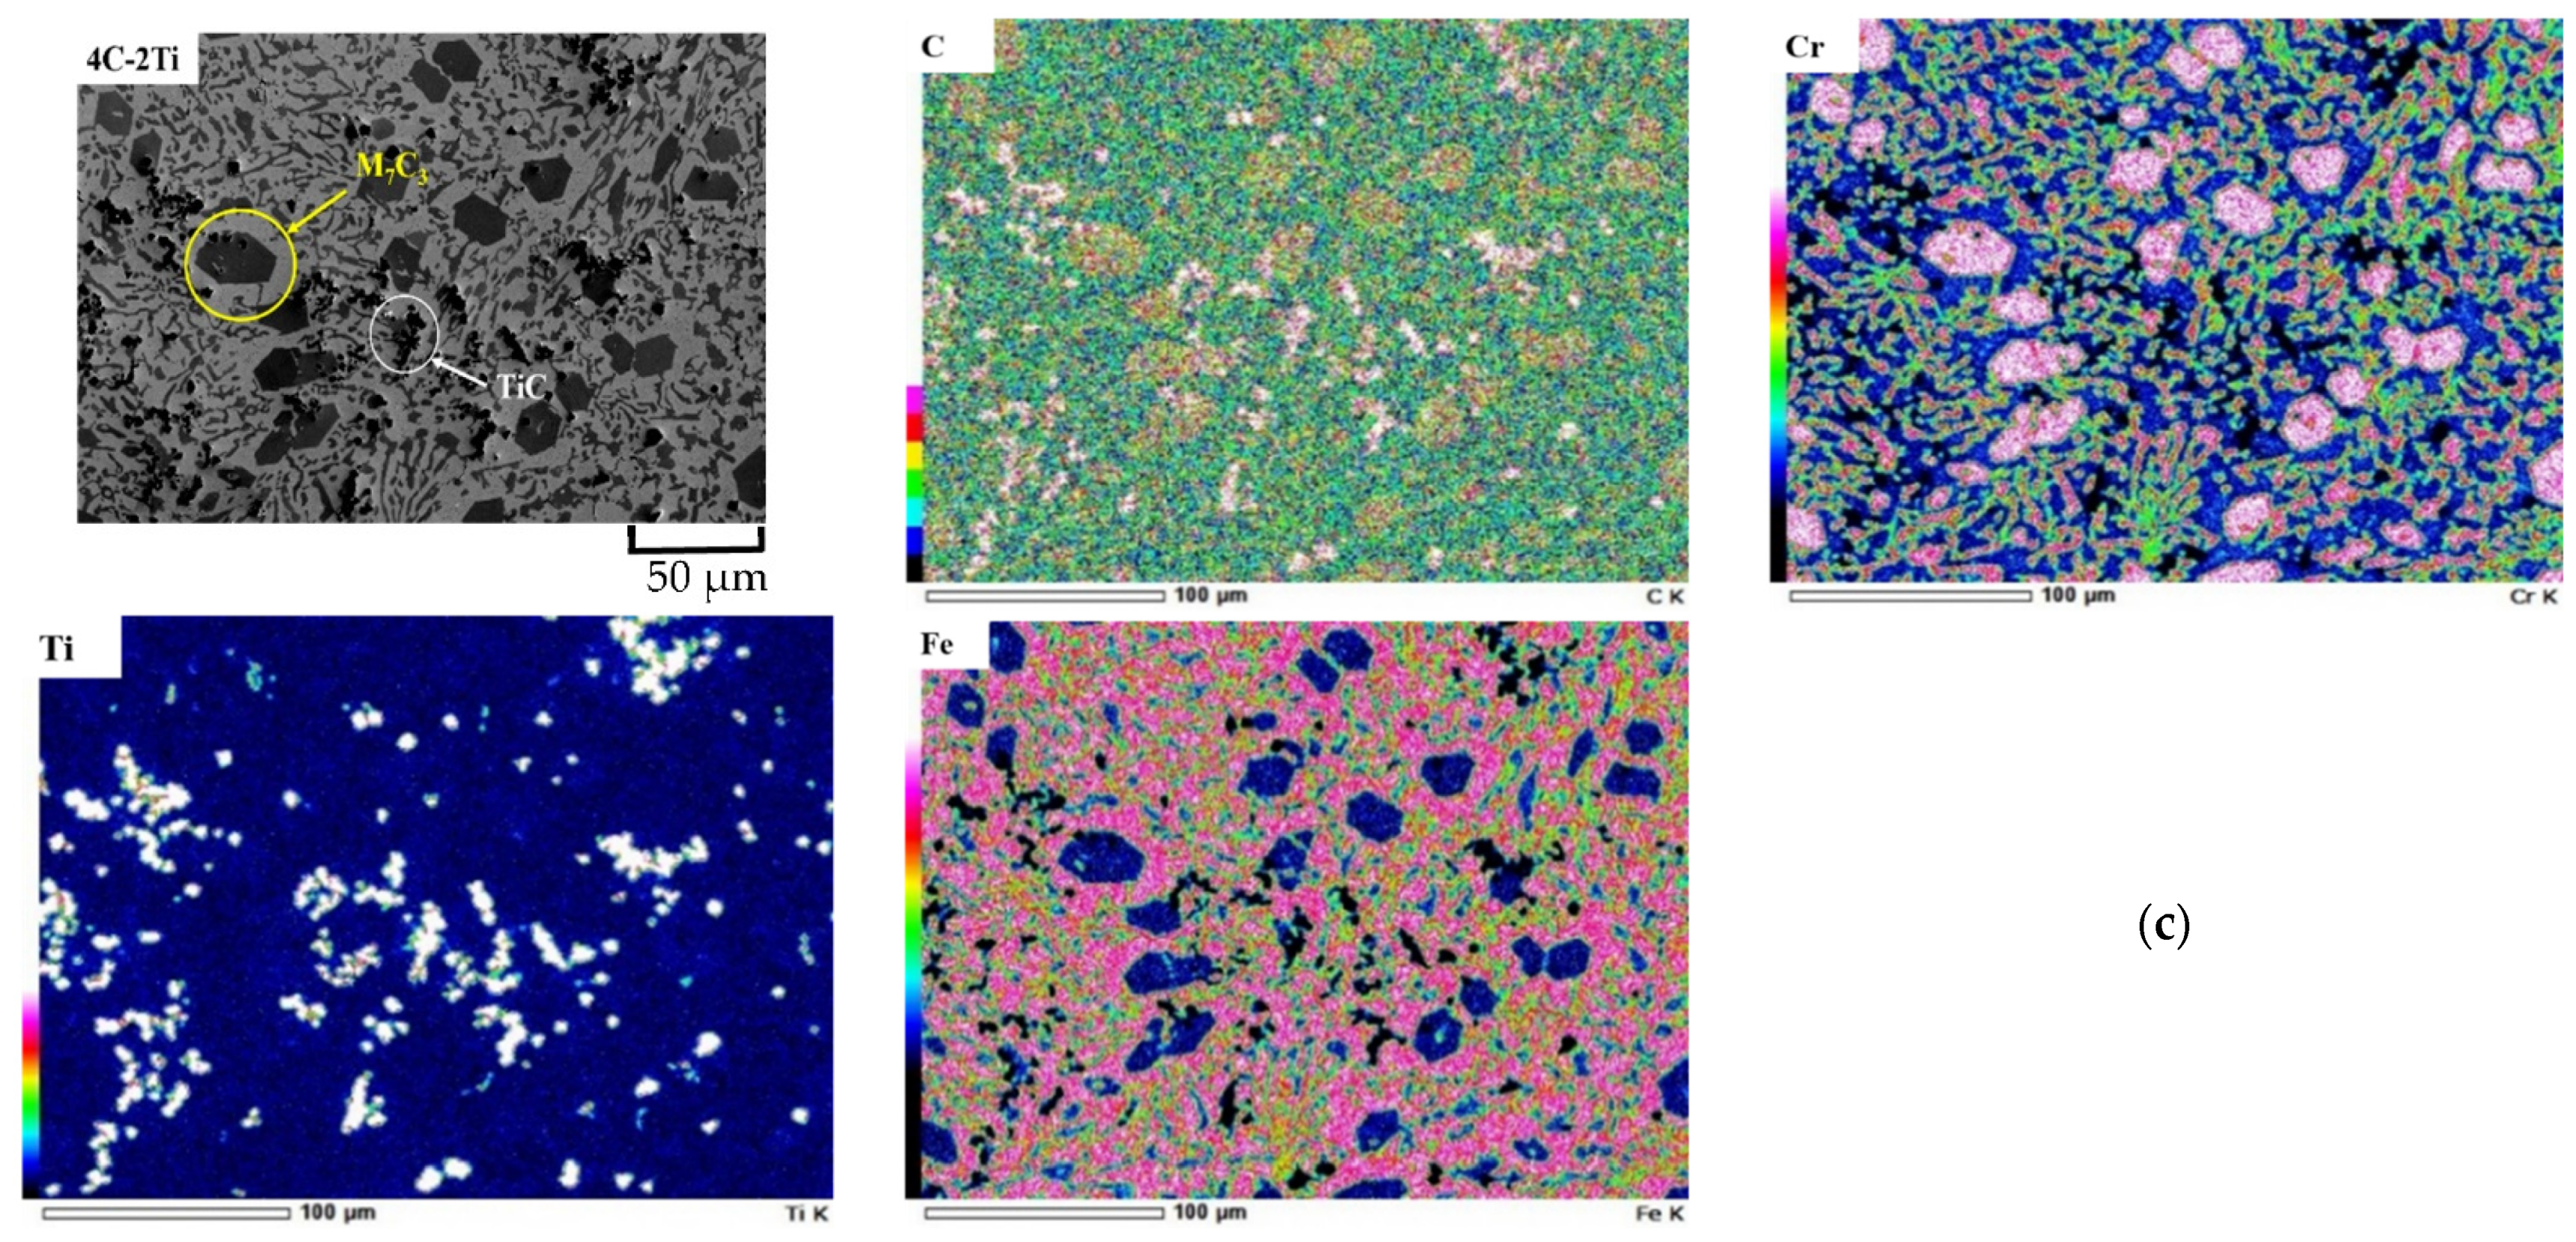
The carbide precipitation characteristics of 27 Cr appear to be compactly dispersed. The dispersion of the supplemented transition metal in the microstructure is challenging to identify. That being so, the 4 wt.% C test specimens with 0, 1, and 2 wt.% Ti were analyzed by EDS mapping. The results are illustrated in Figure 5a–c. It can be found from the microphotographs of the SEM-EDS images that the dark carbides are predominantly inhabited by Cr. A dense distribution approach of M7C3 increases with the increase in C content. However, the reverse behavior is noticed with the increase in Ti content. The inadequacy of M7C3 is because of the advanced precipitation of TiC. The higher percentage of C and Ti results in the agglomeration of TiC due to the greater affability of C.

3.2. Hardness of Materials

Conventionally, the abrasive wear property of HCCI is significantly influenced by the hardness of the material. However, toughness also plays a major role [36,37,38]. Because of this issue, the hardness analysis was performed on all the test materials. Table 2 represents the macro-hardness (the overall hardness of the test materials, including the matrix and carbide together), micro-hardness (matrix alone), and carbide volume fraction (CVF). It was ascertained that the increase in Ti content results in a decrease in C due to the formation of TiC that decreases both the macro- and micro-hardness for all the specimens. C reduction causes the refinement of the M7C3 carbide, which has been mentioned before as a reason for hardness mitigation. However, a previous study showed that the hardness of HCCI increases with the increase in Ti content in as-cast conditions [39]. On the other hand, in this study, the increase in C content led to superior hardness (both macro-hardness and micro-hardness) for all the specimens. The reason behind the higher hardness might be the enhanced number of M7C3 carbides. According to the result, the 4C-0Ti specimen showed the highest values in both macro-hardness and micro-hardness. Regarding the CVF, all the specimens exhibited around 40% CVF with a negligible difference. It seems that the hardness of the material is not vastly dependent on the CVF. This finding is in good agreement with a former study [40].

3.3. Three-Body Abrasive Wear Characteristics

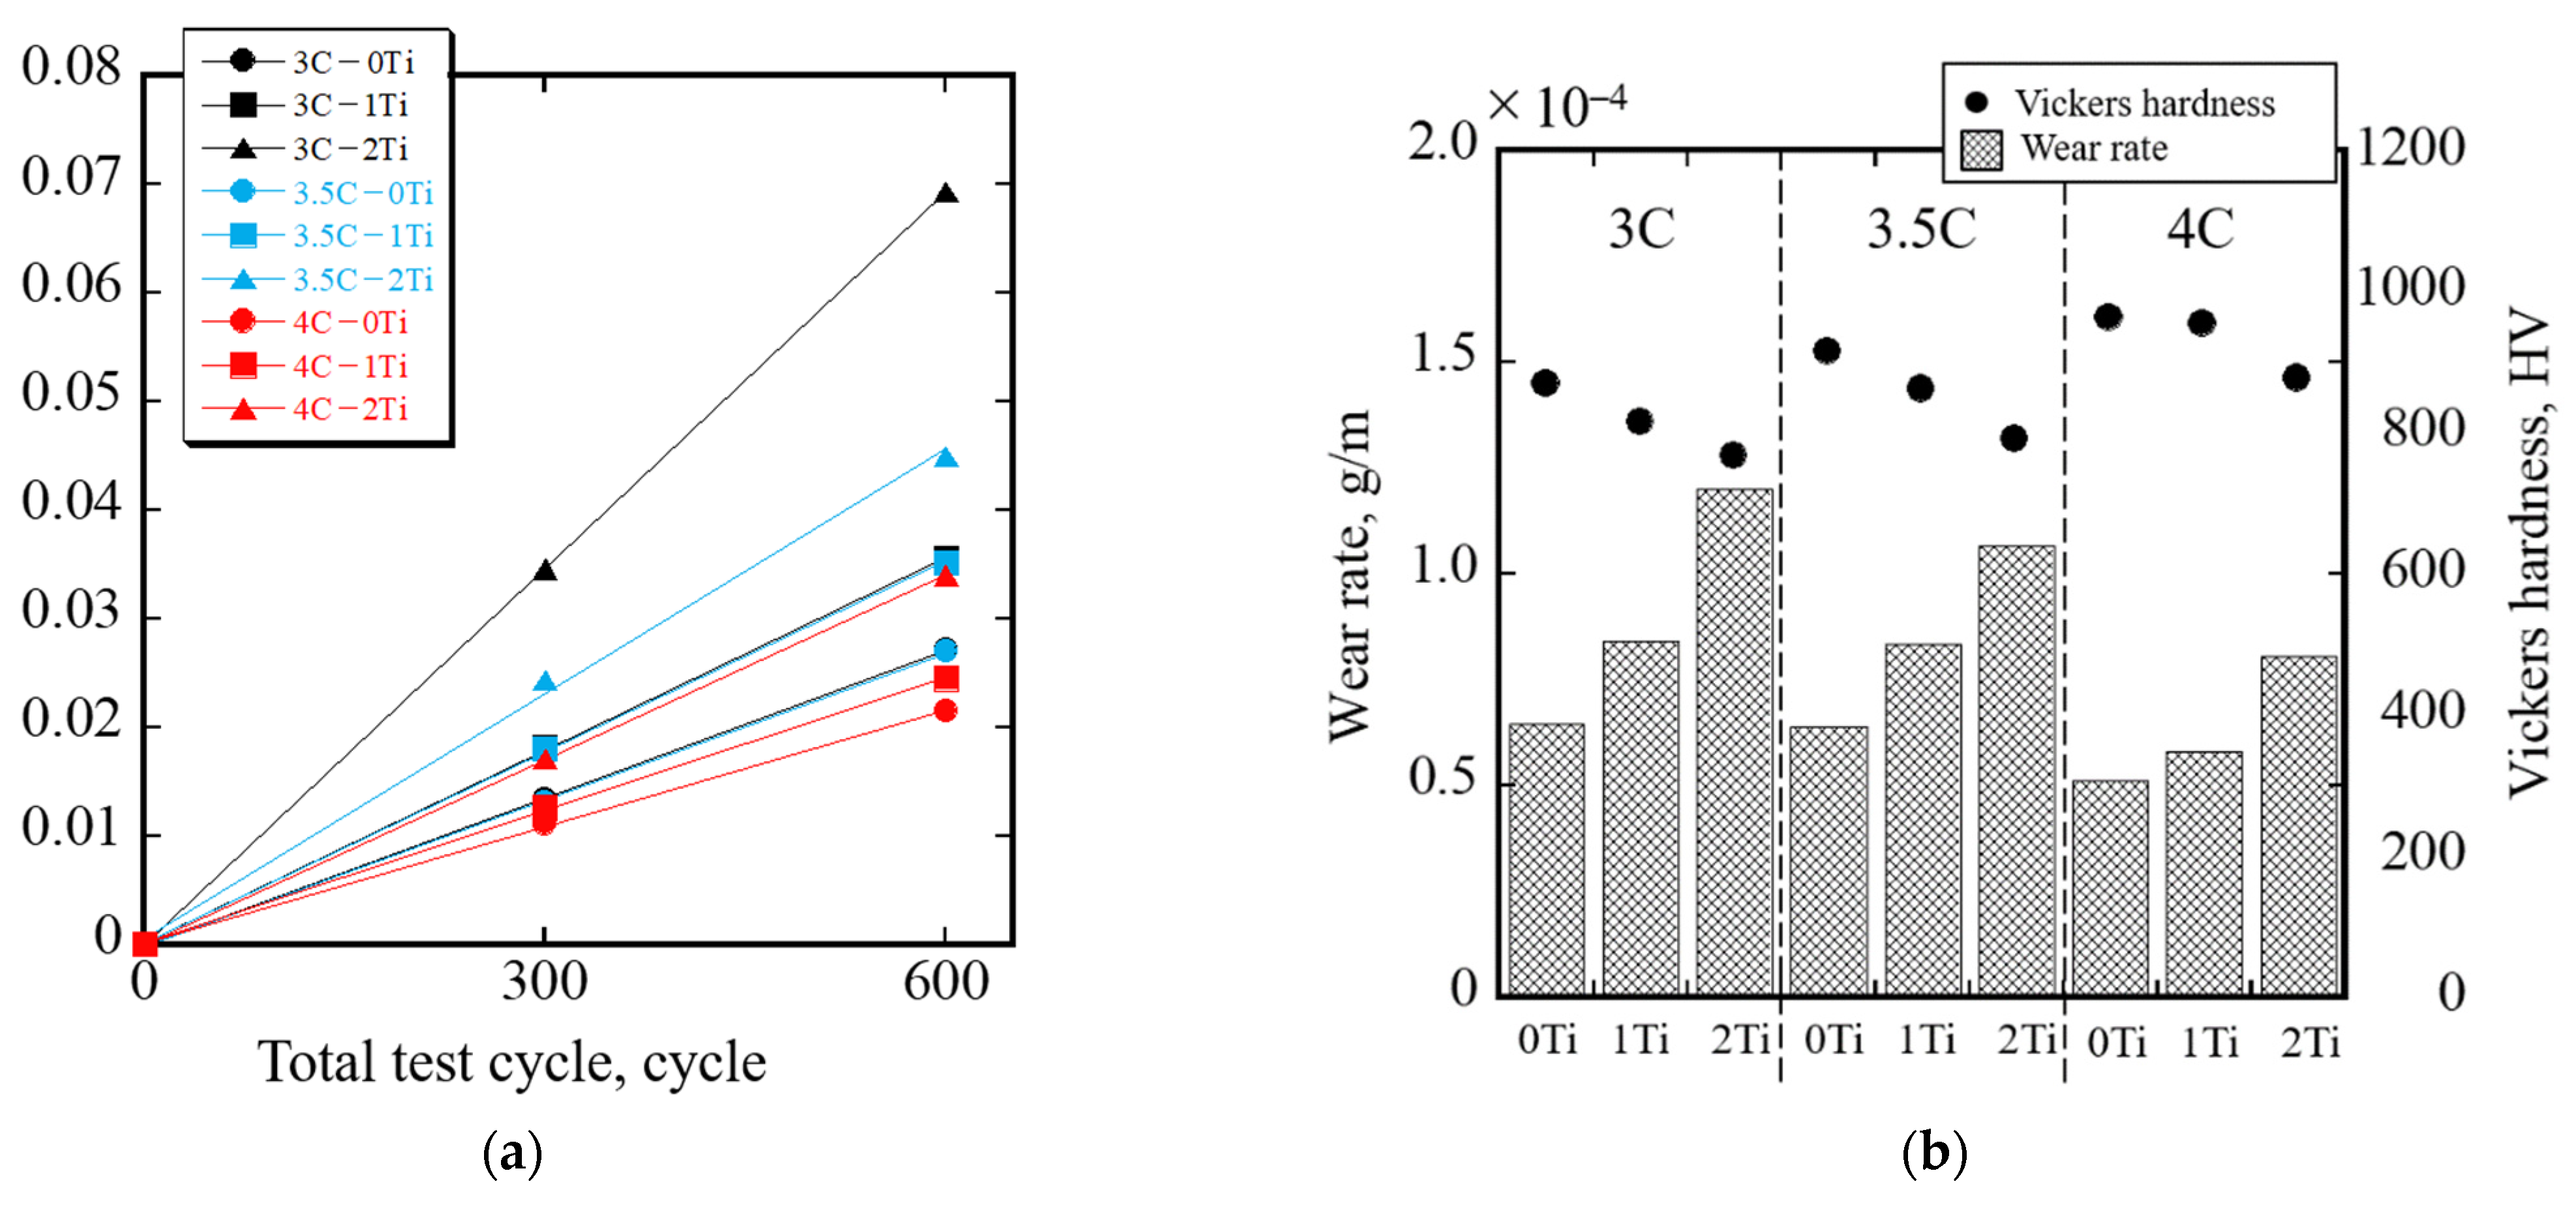
To investigate abrasive wear characteristics, three-body abrasive wear tests were performed. Figure 6a illustrates the abrasive wear performance as a function of wheel rotation, where the X-axis indicates the total test cycle, and the Y-axis indicates the amount of wear loss. The results show that each of the test specimens undergoes a similar wear loss tendency where the material loss escalates with the increase in the wheel cycles. Among all the specimens, the 4C-0Ti exhibited the lowest wear loss; however, with the increase in Ti content and the decrease in C content, the amount of wear loss increases. The basis behind the remarkable wear resistance performance of 4C-0Ti is thought to be its higher hardness. Figure 6b depicts the relationship between the wear rate and the hardness of each specimen. The dot plot illustrates the hardness, and the bar graph shows the wear rate. It can be seen that the amount of wear decreases as the hardness of each specimen increases. The C content plays a major role in influencing the Vickers hardness value, hence minimizing the wear rate, according to the graph. The specimens with 4 wt.%C demonstrated the lowest wear rate in comparison with each C content. However, the wear rate of the 4C specimens increased with increasing Ti content. The specimens with lower C content and higher Ti content led to a lower Vickers hardness, resulting in poor wear resistance. This finding is in good agreement with a previous study [41].
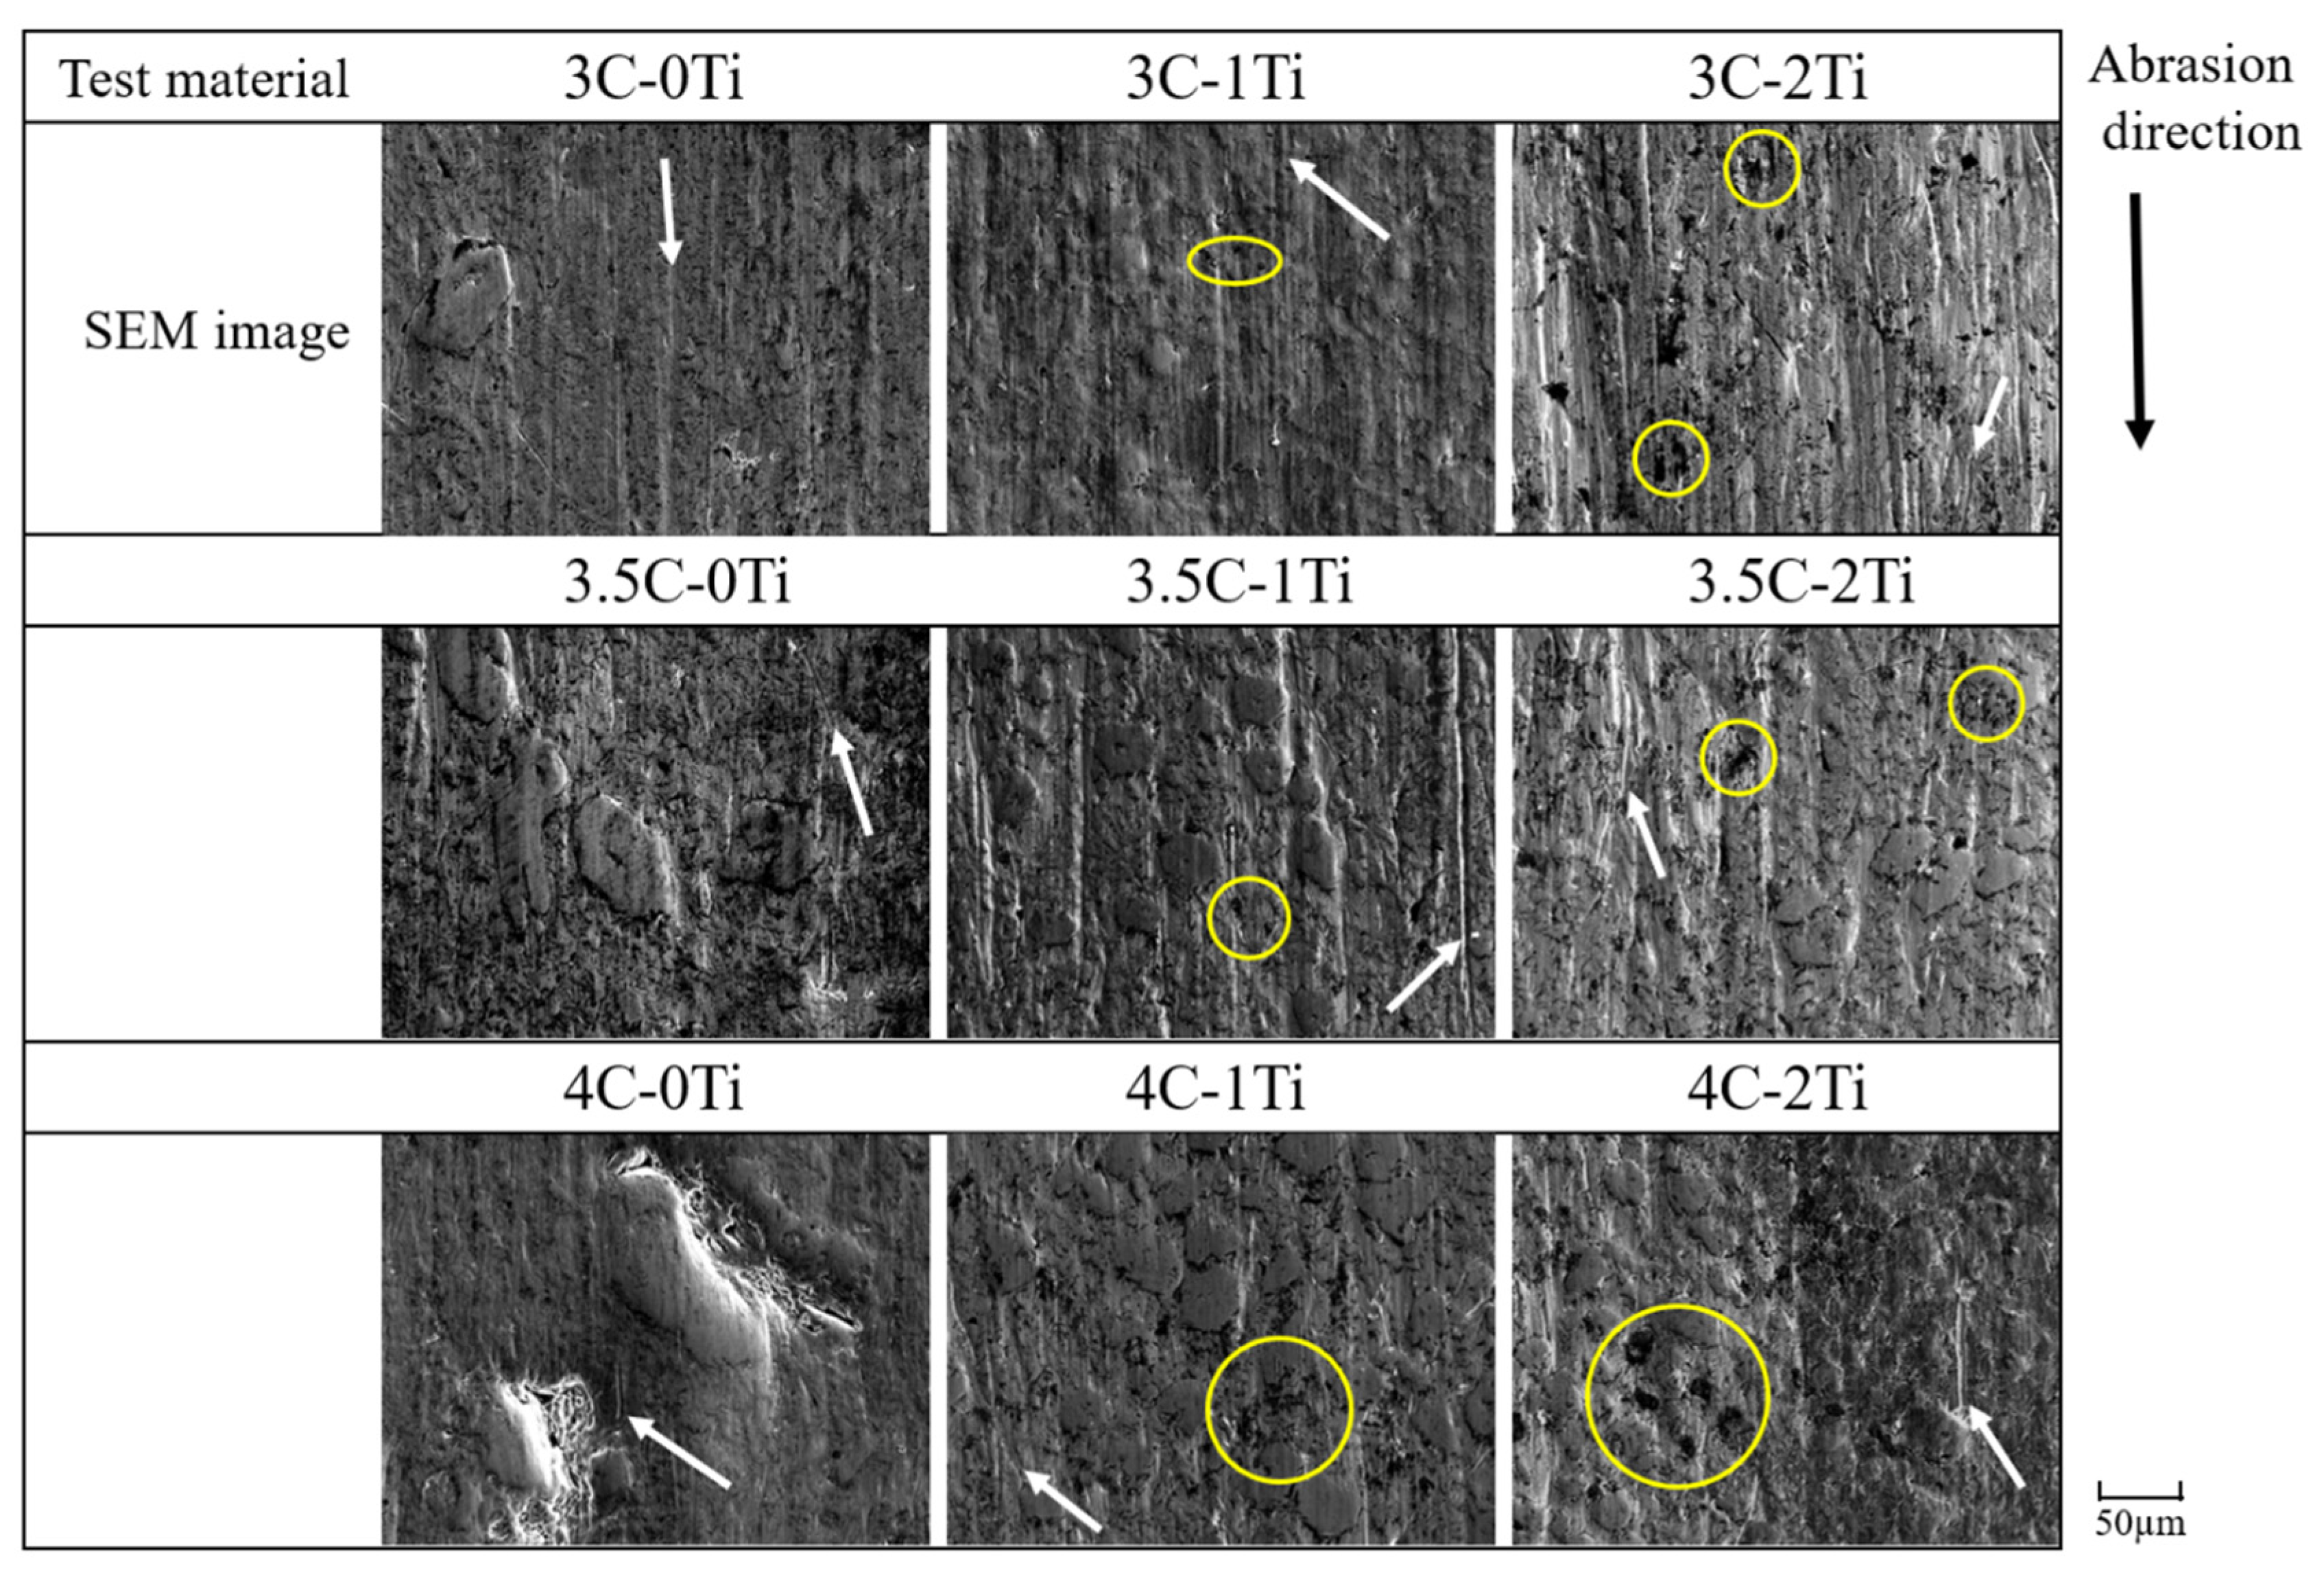
Worn surface observation is significant for analyzing wear behavior. From the worn surface observation results in Figure 7, it can be seen that all the test materials show the wear mark characteristics of abrasive wear, as denoted by the white arrows. Following the microstructural characterization that has been discussed before, these SEM images illustrate that the unevenness of the carbide becomes larger with the enlargement of the carbide’s average grain size. This trend is firmly observed with the increase in hardness. It can be stated that the wear mechanism preferentially scrapes away the matrix structure. As a consequence, the unevenness of the carbide is confirmed. In addition, as represented by the yellow circles, several areas of localized wear were noticed in the Ti-added specimens.
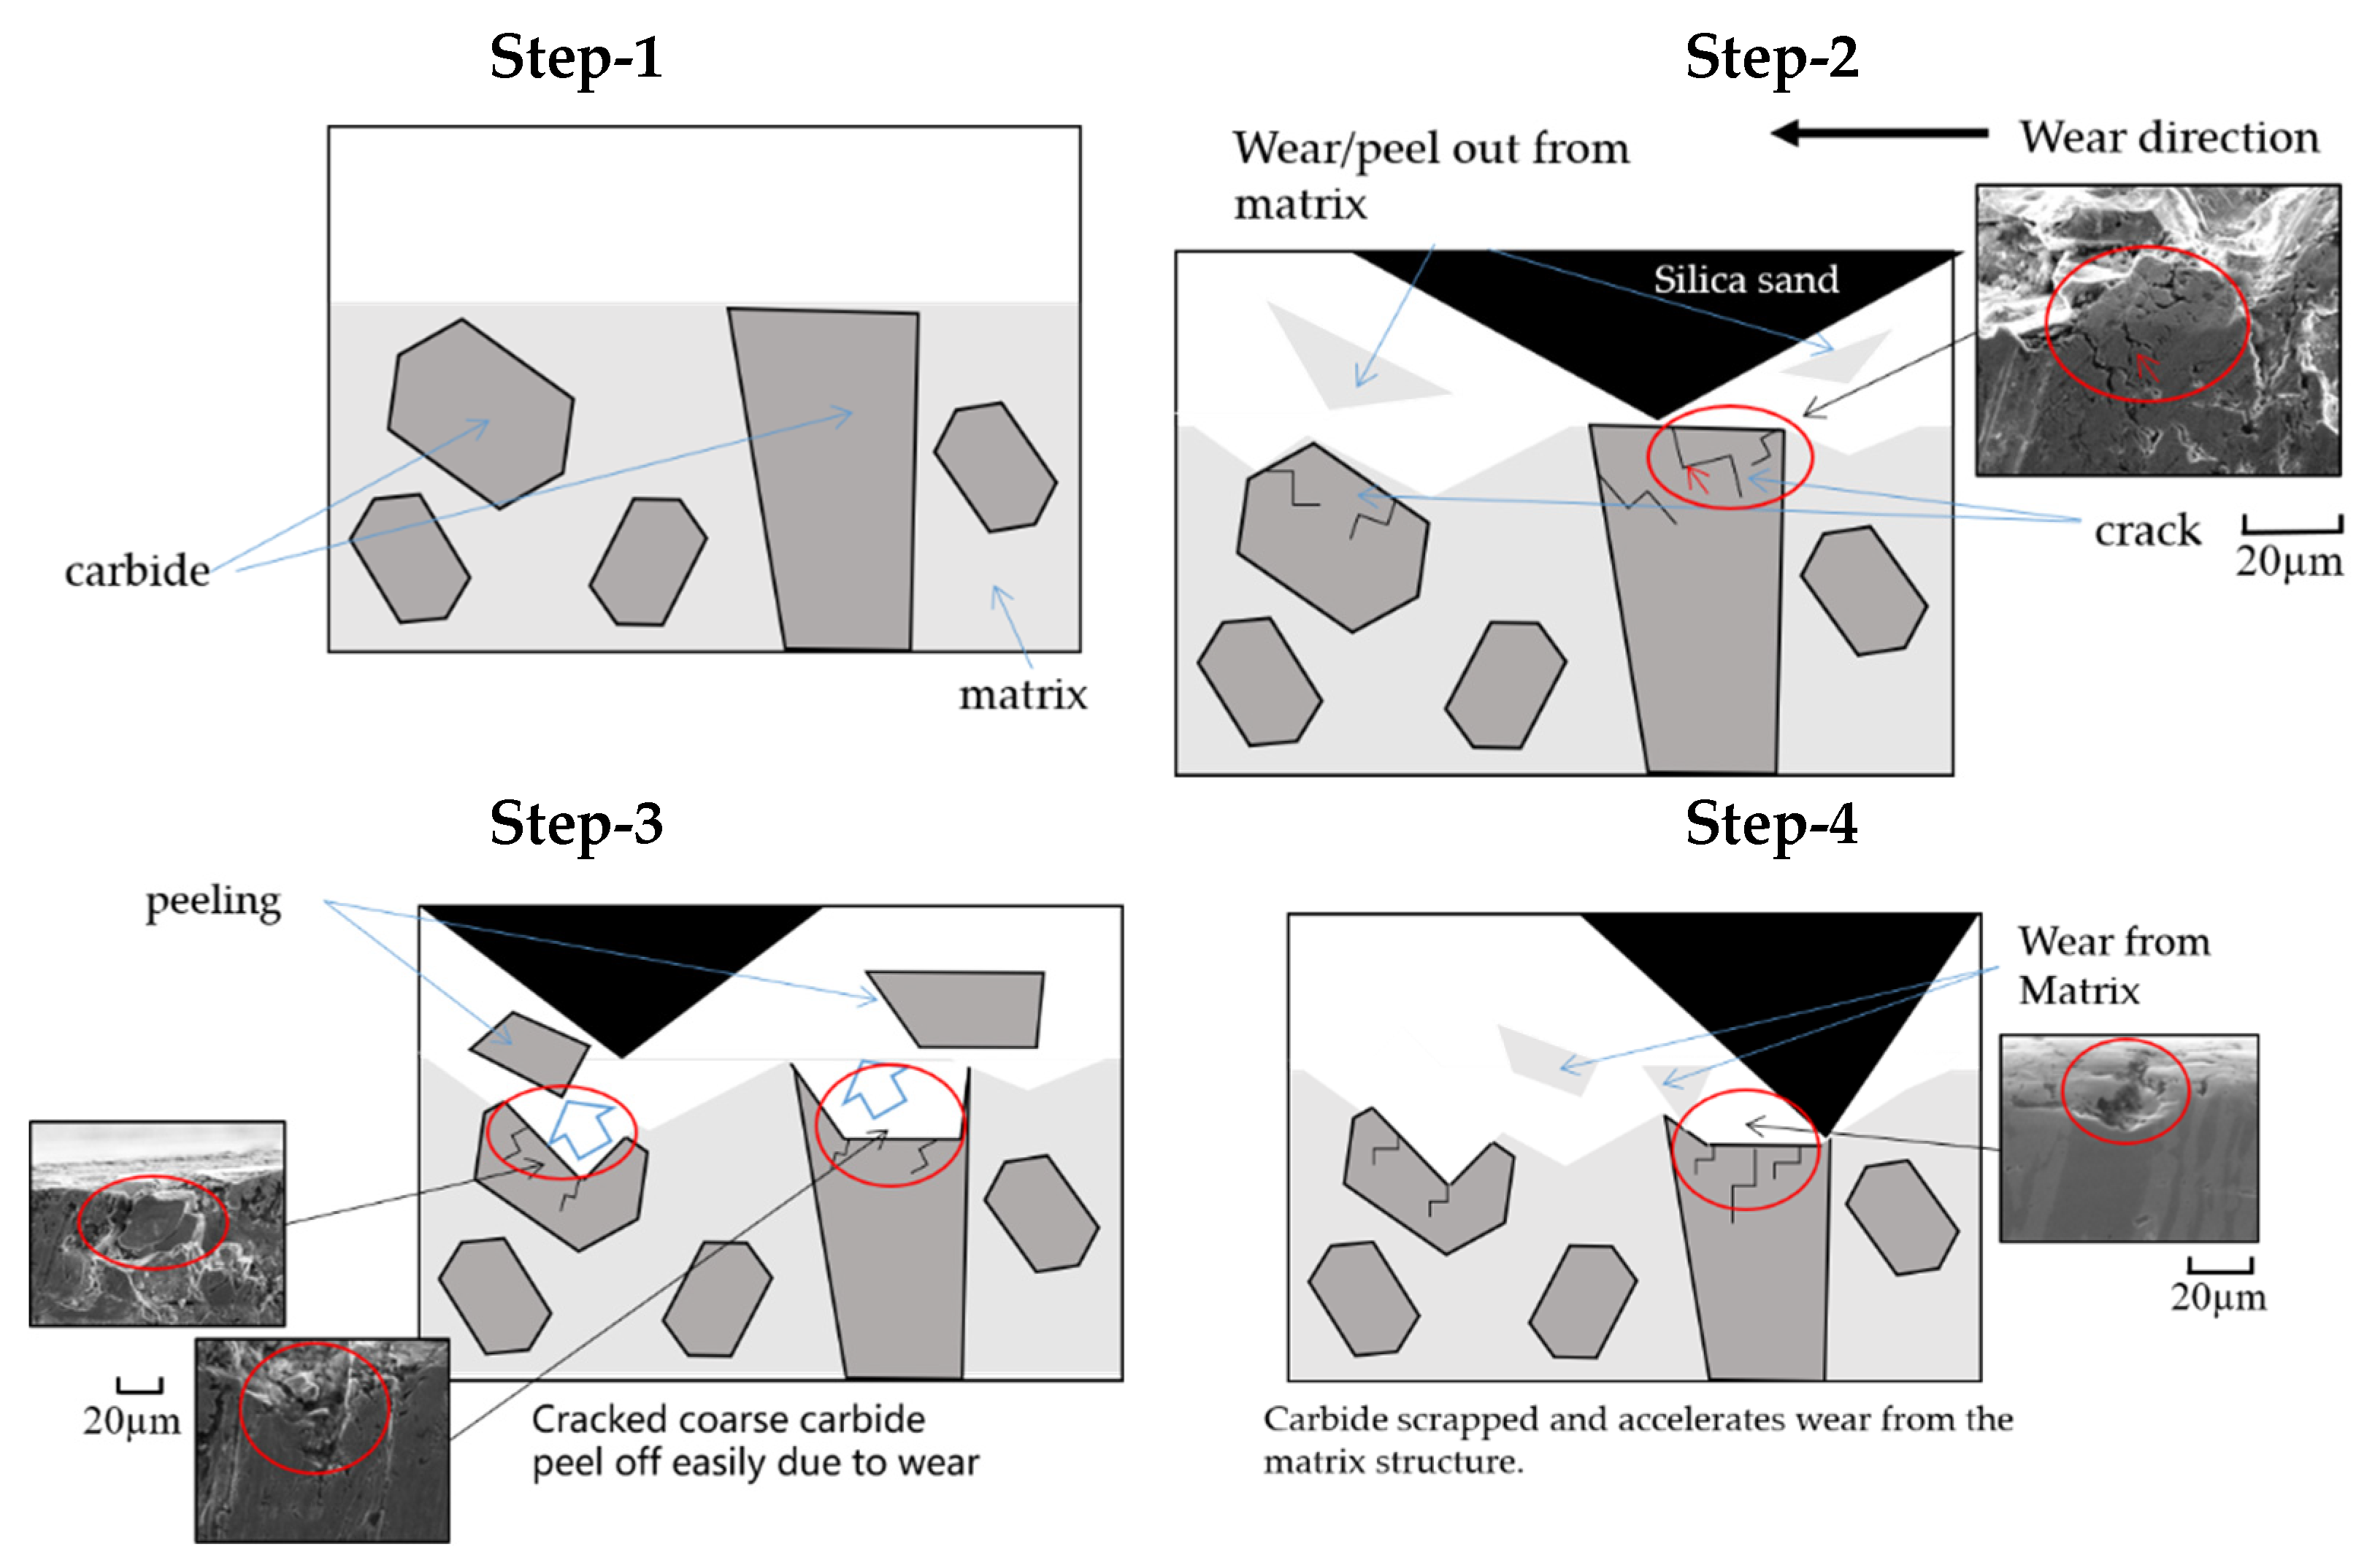
Figure 8 shows the wear mechanism schematic of the 4C-0Ti worn specimen in four steps. In Step 1, crystallized M7C3 is observed in the matrix structure. In Step 2, the dispersed sand particles during the abrasive wear test strike the matrix structure, resulting in wear in the matrix that eventually leads to peeling in the matrix. During this process, the M7C3 carbides experience several cracks. Furthermore, the wear accelerates, and the M7C3 carbide cracks, making it easier to peel off, which is shown in Step 3. As a result, the carbide falls off, and the wear from the matrix accelerates, which is shown in Step 4. The specimens with added Ti show a severe wear phenomenon to the contrary. With the supplement of Ti, the TiC is crystallized in the matrix. Further addition of Ti, such as 2 wt.%, promotes TiC to precipitate densely, making the M7C3 carbides finer. During this process, the agglomeration of TiC happens. During the time of the abrasive test, the TiC clusters severely collide with the sand particles, which results in the falling out of TiC. It is considered that TiC falling out of the microstructure promotes wear from the falling traces and causes localized wear. During this period, the localized wear of a single TiC is limited. However, with dense TiC, carbides fall off in large numbers, which leads to greater localized wear. Thus, the hardness of the Ti-added specimens is reduced. The wear rate of the 2 wt.% Ti specimens, in particular, is thought to be increased due to this local wear.
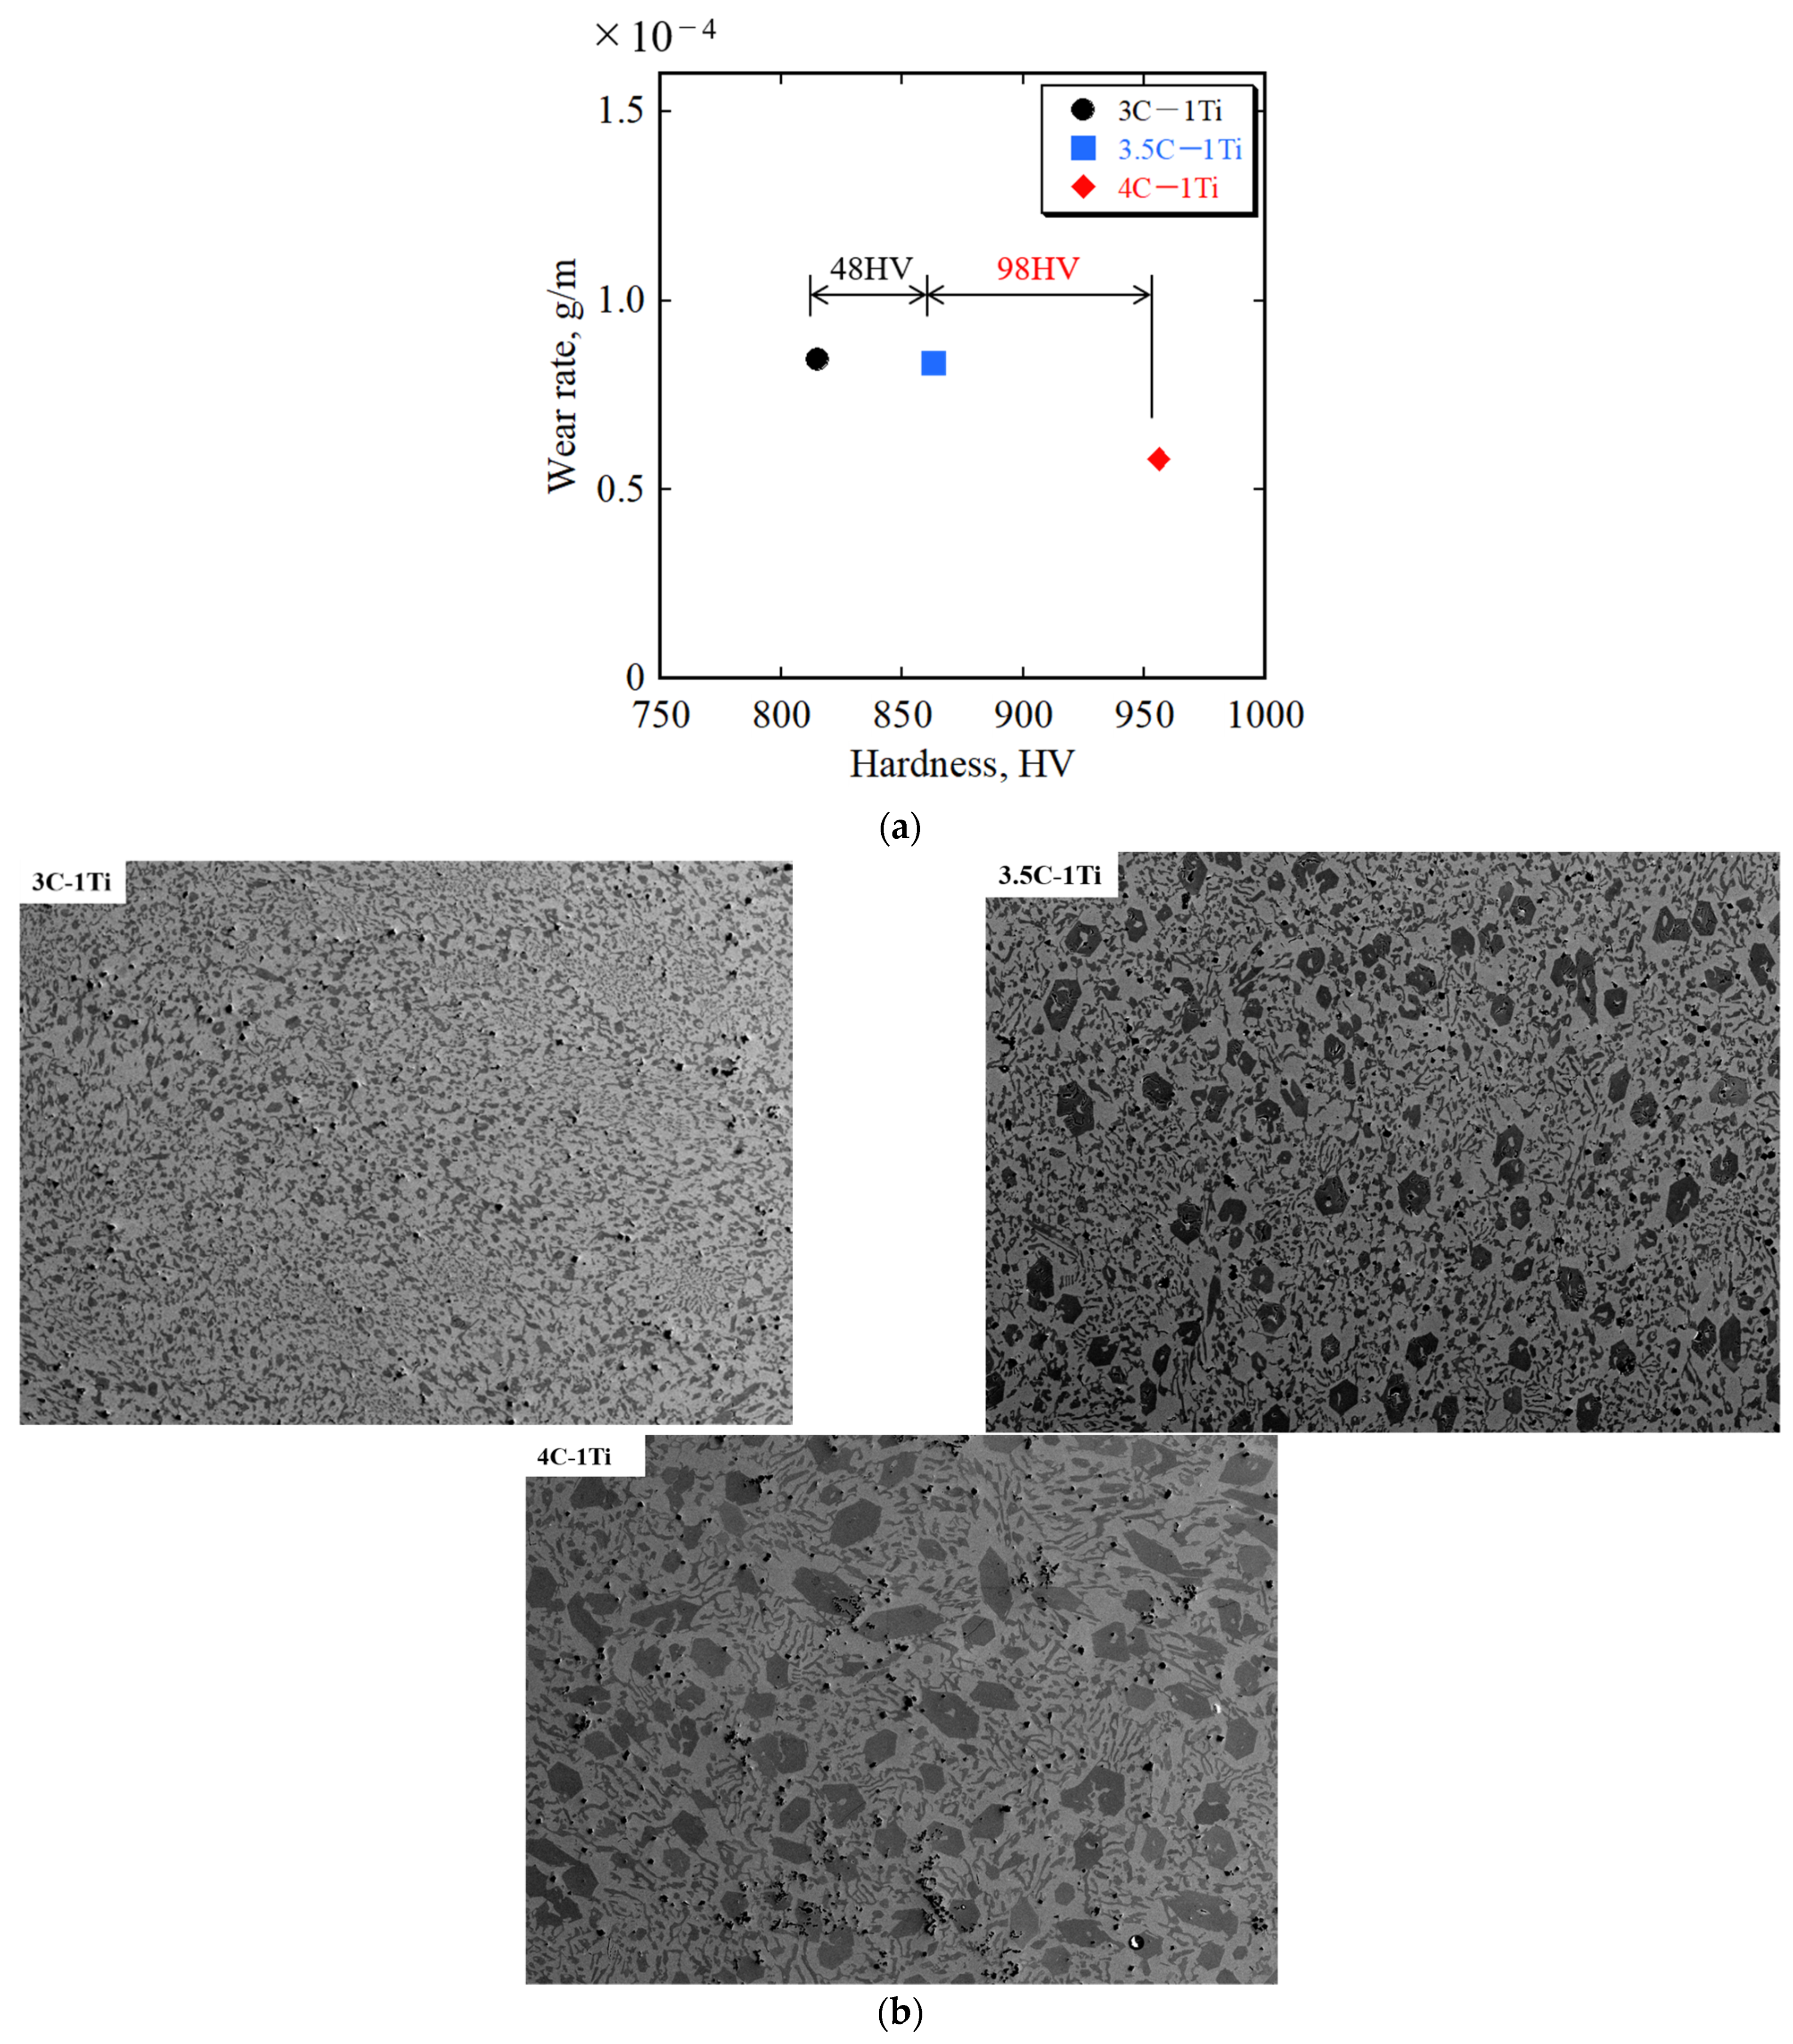
In order to eliminate the difference in the wear rate due to local wear, a comparison was drawn among the specimens with 1 wt.% Ti and three different amounts of C contents. The graph in Figure 9a illustrates the relationship between the wear rate and hardness. Comparison between the 3 wt.% C and 3.5 wt.% C specimens reveals that the wear rate was nearly identical, and the hardness difference was about 50 HV. In general, the abrasive wear rate falls with the rise in hardness. However, in this current case, such behavior was not observed. As a consequence, the carbide grain size is focused on in Figure 9b. The carbide grain size of the 3.5 wt.% C specimen was 19.8 µm, whereas the 3 wt.% C specimen contained 7.1 µm carbide grains. In comparison with the 3.5 wt.% C specimen, the 3 wt.% C specimen had finer carbide crystallization. This implies that fine carbides are effective in improving abrasive wear properties. When comparing the 3.5 wt.% C and 4 wt.% C test materials, the 4 wt.% C test material showed better performance in both the wear rate and hardness, while the 3.5 wt.% C test material had finer carbide crystals. As there was a large difference (100 HV) in hardness, it is inferred that the improvement in the abrasive wear characteristics of the 4 wt.% C test material is because of higher hardness. In view of this, a suggestion can be made that when the difference in hardness is large, the effect of the carbide grain size is small. In conclusion, when the hardness difference is about 50 HV, the fine carbides are effective in improving abrasive wear. However, with a hardness difference of 100 HV, the effect of the fine carbide is smaller. Hardness improves the abrasive wear resistance properties.
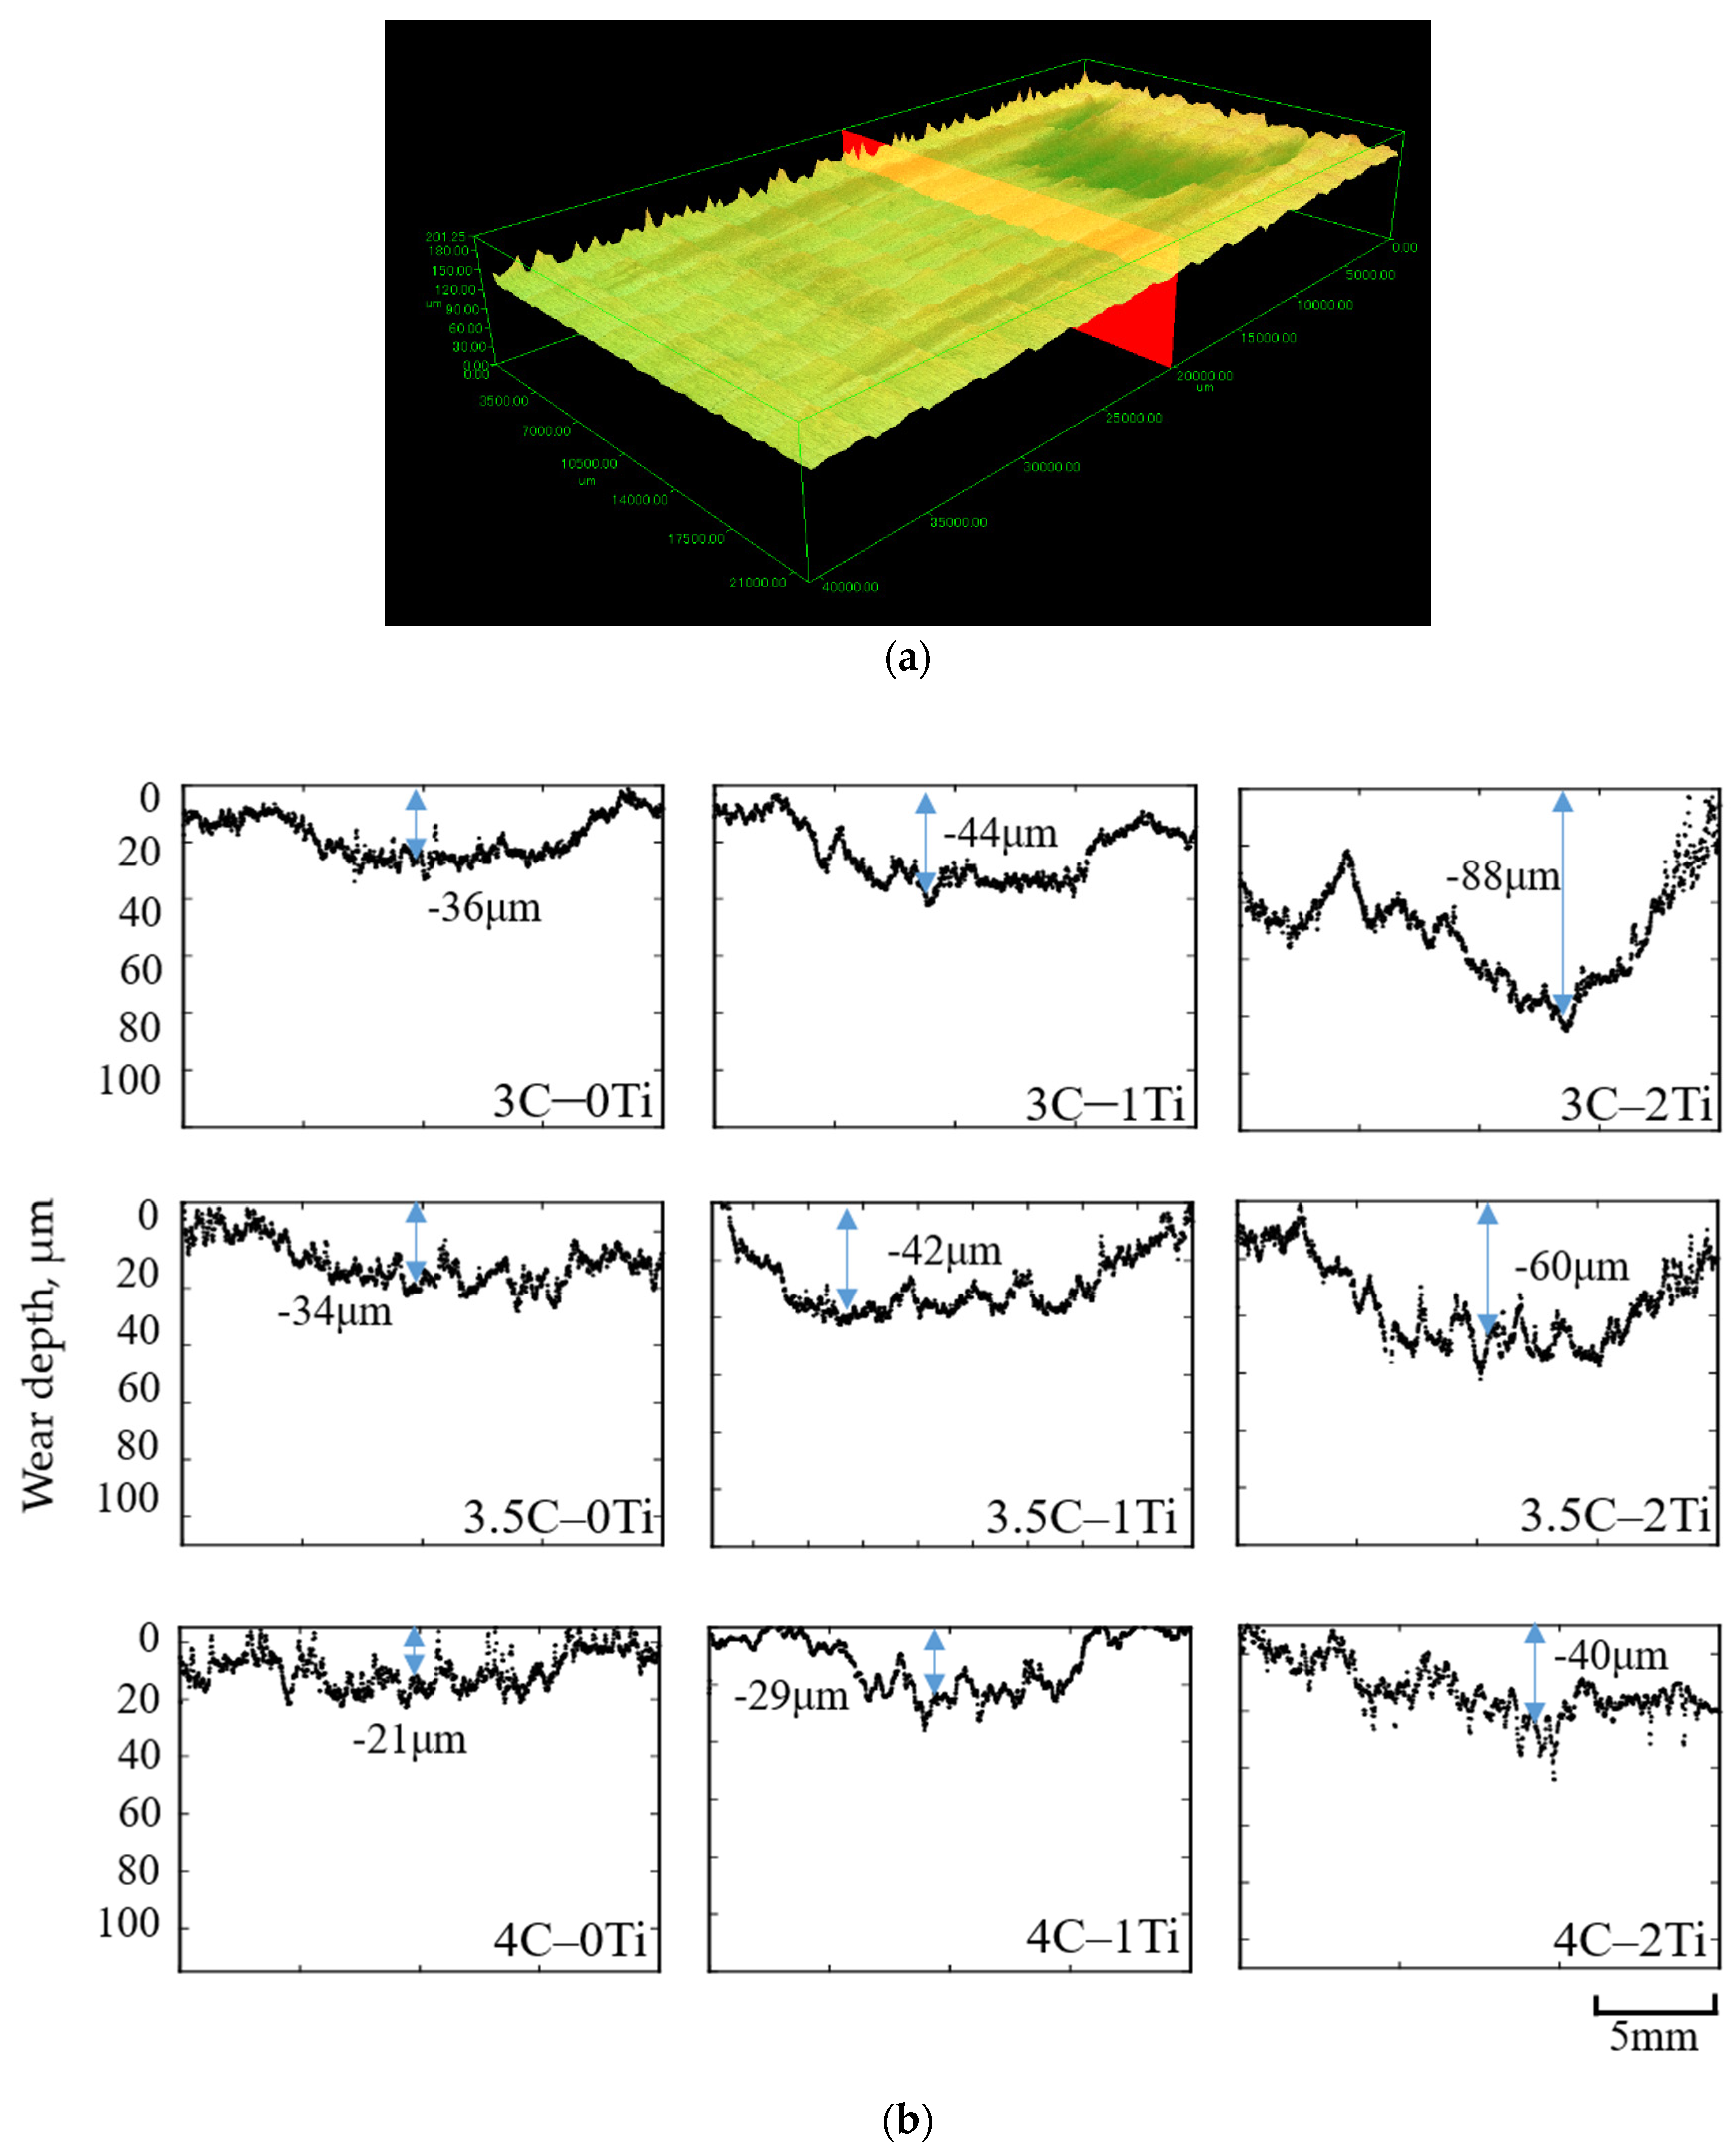
To comprehend the wear phenomenon more explicitly, the wear depth of each test specimen was investigated using a 3D laser microscope, which is illustrated in Figure 10a,b. The result shows that an increase in Ti content leads to a greater wear depth. On the contrary, an increase in C content results in a shallower wear depth. It was identified that with an escalating wear rate, the depth of wear tends to be deeper. Among all the test specimens, 4C-0Ti was confirmed to have the lowest wear depth.

4. Conclusions

After the investigation of the effects of Ti and C on the three-body abrasive wear performance of HCCI, the following conclusions can be extracted:
  • The addition of Ti causes the M7C3 carbides in the microstructure to become finer and TiC to crystallize. The hike in Ti content results in a decrease in the microstructure hardness.
  • From the rubber wheel abrasive test, it can be concluded that the overall hardness of the microstructure increases, leading to a lower wear volume and improved abrasive wear resistance.
  • The hardness of the microstructure, hardness of the matrix, and morphology of carbide crystallization have a notable effect on the abrasive wear resistance.
  • The highest C results in better wear resistance, while the 4C-0Ti composition exhibits better hardness, a lower wear rate, and a shallower wear depth.

Author Contributions

Writing—original draft preparation, conceptualization, investigation, and writing—review and editing, M.J.H.; methodology, resources, and supervision, K.S.; formal analysis and writing—review and editing, K.K.; project administration, R.H.P. All authors have read and agreed to the published version of the manuscript.

Funding

This study was partially supported by the Japan Society for the Promotion of Science KAKENHI, Grant Number 20K05146.

Data Availability Statement

The data presented in this study are available on request from the corresponding author.

Conflicts of Interest

The authors declare no conflict of interest.

References

  1. Gahr, K.-H.Z. Microstructure and Wear of Materials, 1st ed.; Elsevier S: New York, NY, USA, 1987. [Google Scholar]
  2. Tylczak, J.H. Abrasive Wear ASM Handbook; ASM International: Tokyo, Japan, 1992. [Google Scholar]
  3. Eyre, T.S. Wear Characteristics of Magnesium; SAE Technical Papers; SAE International: Warrendale, PA, USA, 1953. [Google Scholar]
  4. Li, H.; Tong, W.; Ma, C.; Chen, L.; Zuo, L. Abrasive wear behaviors of high-vanadium alloy steel using the dry sand/rubber wheel apparatus. J. Eng. Tribol. 2019, 233, 1800–1809. [Google Scholar] [CrossRef]
  5. Holmberg, K.; Erdemir, A. Influence of tribology on global energy consumption, costs and emissions. Friction 2017, 5, 263. [Google Scholar] [CrossRef] [Green Version]
  6. Mang, T.; Bobzin, K.; Bartels, T. Industrial Tribology: Tribosystems, Friction, Wear and Surface Engineering, Lubrication; WileyVCH: Weinheim, Germany, 2011; p. 1. [Google Scholar]
  7. Gahr, K.H.Z.; Scholz, W.G. Fracture Toughness of White Cast Irons. JOM 1980, 32, 38–44. [Google Scholar] [CrossRef]
  8. Francisco Vapeani Guerra, C.P.; Tabrett, I.R.; Sare, M.R. Ghomashchi, Microstructure property relationships in high chromium white iron alloys. Int. Mater. Rev. 1996, 41, 59. [Google Scholar]
  9. Ono, Y.; Murai, M.; Ogi, K. Partition Coefficients of Alloying Elements to Primary Austenite and Eutectic Phases of Chromium Irons of Rolls. ISIJ Int. 1992, 32, 1150. [Google Scholar] [CrossRef]
  10. Laird, G. Microstructures of Ni-Hard I, Ni-Hard IV, and High Cr White Cast Irons. AFS Trans. 1991, 99, 339. [Google Scholar]
  11. Todaka, T.; Shimizu, K.; Kusumoto, K.; Purba, R.H.; Gaqi, Y. Effect of Carbon Content on Three-body Abrasive Wear Characteristics of 28Cr-3Ni Cast Alloys. ISIJ Int. 2021, 61, 2274–2283. [Google Scholar] [CrossRef]
  12. Bedolla-Jacuinde, A.; Correa, R.; Quezada, J.G.; Maldonado, C. Effect of titanium on the as-cast microstructure of a 16% chromium white iron. Mater. Sci. Eng. A 2005, 398, 297. [Google Scholar] [CrossRef]
  13. Bedolla-Jacuinde, A.; Guerra, F.V.; Mejía, I.; Zuno-Silva, J.; Rainforth, M. Abrasive wear of V-Nb-Ti alloyed high-chromium white irons. Wear 2015, 332–333, 1006. [Google Scholar] [CrossRef]
  14. Gahr, K.-H.Z.; Doane, D.V. Optimizing fracture toughness and abrasion resistance in white cast irons. Met. Mater. Trans. A 1980, 11, 613. [Google Scholar] [CrossRef]
  15. Pearce, J.T.H. Examination of M7C3 carbides in high chromium cast irons using thin foil transmission electron microscopy. J. Mater. Sci. Lett. 1983, 2, 428–432. [Google Scholar] [CrossRef]
  16. Peev, K.; Radulovic, M.; Fiset, M. Modification of FeCr-C alloys using mischmetal. J. Mater. Sci. Lett. 1994, 13, 112–114. [Google Scholar] [CrossRef]
  17. Kibble, K.A.; Pearce, J.T.H. An examination of the effects of annealing heat treatment on secondary carbide formation in 25%Cr high chromium irons. Cast Met. 1995, 8, 123–127. [Google Scholar] [CrossRef]
  18. Powell, G.L.F.; Laird, G., II. Structure, nucleation, growth and morphology of secondary carbides in high chromium and Cr-Ni white cast irons. J. Mater. Sci. 1992, 27, 29–35. [Google Scholar] [CrossRef]
  19. Powell, G. Improved wear-resistant high-alloyed white irons—A historical perspective. In Proceedings of the International Congress on Abrasion Wear Resistance Alloyed White Cast Iron for Rolling and Pulverizing Mills, Fukuoka, Japan, 16–20 August 2002. [Google Scholar]
  20. Bedolla-Jacuinde, A. Microstructure of vanadium-, niobium and titanium-alloyed high-chromium white cast irons. Int. J. Cast Met. Res. 2001, 13, 343. [Google Scholar] [CrossRef]
  21. Wu, X.; Xing, J.; Fu, H.; Zhi, X. Effect of titanium on the morphology of primary M7C3 carbides in hypereutectic high chromium white iron. Mater. Sci. Eng. A 2007, 457, 180–185. [Google Scholar] [CrossRef]
  22. Dogan, O.N.; Hawk, J.A.; Laird, G., II. Solidification structure and abrasion resistance of high chromium white irons. Metall. Mater. Trans. A 1997, 28, 1315–1327. [Google Scholar] [CrossRef]
  23. Huang, Z.F.; Huang, W.D.; Zhang, A.F.; Xing, J.D. Study on impact and wear properties of semi-solid hypereutectic high-chromium cast iron. J. Xi’an Jiaotong Univ. 2005, 39, 775–778. [Google Scholar]
  24. Llewellyn, R.J.; Yick, S.K.; Dolmanb, K.F. Scouring erosion resistance of metallic materials used in slurry pump service. Wear 2004, 256, 592–599. [Google Scholar] [CrossRef]
  25. Qin, Z.R.; Nie, L.W. Effect of RE-Mg alloy modification on high chromium cast iron. Chin. Pet. Mach. 1998, 26, 20–23. [Google Scholar]
  26. Schneider, C.; Rasband, W.; Eliceiri, K. NIH Image to ImageJ: 25 years of image analysis. Nat. Methods 2012, 9, 671–675. [Google Scholar] [CrossRef] [PubMed]
  27. Karantzalis, A.E.; Lakatou, A.; Diavati, E. Effect of Destabilization Heat Treatments on the Microstructure of High Chromium Cast Iron: A Microscopy Examination Approach. J. Mater. Eng. Perform. 2009, 18, 1078–1085. [Google Scholar] [CrossRef]
  28. Kishore, K.; Kumar, U.; Dinesh, N.; Adhikary, M. Effect of Soaking Temperature on Carbide Precipitation, Hardness, and Wear Resistance of High-Chromium White Cast Iron. J. Fail. Anal. Prev. 2020, 20, 249–260. [Google Scholar] [CrossRef]
  29. Purba, R.H.; Shimizu, K.; Kusumoto, K.; Todaka, T.; Shirai, M.; Hara, H.; Ito, J. Erosive Wear Characteristics of High-Chromium Based Multi-Component White Cast Irons. Tribol. Int. 2021, 159, 106982. [Google Scholar] [CrossRef]
  30. Yu, S.K.; Sasaguri, N.; Matsubara, Y. Effects of Retained Austenite on Abrasion Wear Resistance and Hardness of Hypoeutectic High Cr White Cast Iron. Int. J. Cast Met. Res. 1999, 11, 561–566. [Google Scholar] [CrossRef]
  31. Sun, J.; Hao, Y. Microstructure Development and Mechanical Properties of Quenching and Partitioning (Q&P) Steel and an Incorporation of Hot-Dipping Galvanization during Q&P Process. Mater. Sci. Eng. A. 2013, 586, 100–107. [Google Scholar]
  32. Ma, S.; Xing, J.; He, Y.; Li, Y.; Huang, Z.; Liu, G.; Geng, Q. Microstructure and Crystallography of M7C3 Carbide in High Chromium Cast Iron. Mater. Chem. Phys. 2015, 161, 65–73. [Google Scholar] [CrossRef]
  33. Liu, S.; Zhou, Y.; Xing, X.; Wang, J.; Yang, Y.; Yang, Q. Agglomeration Model of (Fe, Cr)7C3 Carbide in Hypereutectic FeCr-C Alloy. Mater. Lett. 2016, 183, 272–276. [Google Scholar] [CrossRef]
  34. Geng, B.; Li, Y.; Zhou, R.; Wang, Q.; Jiang, Y. Formation Mechanism of Stacting Faults and its Effect on Hardness in M7C3 Carbides. Mater. Charact. 2020, 170, 110691. [Google Scholar] [CrossRef]
  35. Laird, G.; Gundlach, R.; Rohrig, K. Abrasion-Resistant Cast Iron Handbook; AFS: Oakland, CA, USA, 2000. [Google Scholar]
  36. Gahr, K.-H.Z. Recent developments in wear-mechanism maps. Tribol. Int. 1998, 31, 587. [Google Scholar] [CrossRef]
  37. Sare, I.R. Abrasion resistance and fracture toughness of white cast irons. Met. Technol. 1979, 6, 412. [Google Scholar] [CrossRef]
  38. Berns, H.; Fischer, A.; Theisen, W. Fracture Toughness and Microstructure of Fe-Cr-C-B Hard Facing Alloys. In Mechanical Behaviour of Materials V, Proceedings of the Fifth International Conference, Beijing, China, 3–6 June 1987; Pergamon Press: Beijing, China, 1987; pp. 285–294. [Google Scholar] [CrossRef]
  39. Ibrahim, K.M.; Nofal, A.A. Effect of titanium addition on structure and properties of the as-cast high Cr–Mo white iron. Int. J. Mater. Res. 2012, 103, 362–370. [Google Scholar] [CrossRef]
  40. Purba, R.H.; Shimizu, K.; Kusumoto, K.; Gaqi, Y. Comparison of Three-Body Abrasion Behaviors of High-Cr-Mo- and High-Cr-Based Multicomponent White Cast Irons. J. Mater. Eng. Perform. 2022. [Google Scholar] [CrossRef]
  41. Banadkouki, S.S.G.; Mehranfar, S. Wear Behavior of a Modified Low Alloy as Cast Hardening White Iron. ISIJ Int. 2012, 52, 2096–2099. [Google Scholar] [CrossRef]
Figure 1. (a) Three-body abrasion machine test according to ASTM G65. (b) Abrasive particles ( Si 0 2 , 300 µm).
Lubricants 10 00348 g001
Figure 2. Microphotograph of matrix and carbide through SEM (yellow circles denote M7C3 carbides, and white circles denote TiC carbides).
Lubricants 10 00348 g002
Figure 3. Carbide size distribution for the 3 wt.% C and 4 wt.% C specimens.
Lubricants 10 00348 g003
Figure 4. X-ray diffraction (XRD) patterns of the 3.5 wt.% C specimens.
Lubricants 10 00348 g004
Figure 5. Distribution of chemical elements through SEM-EDS analysis of the 4 wt.% C specimen’s wear surface: (a) 4C-0Ti specimen, (b) 4C-1Ti specimen, and (c) 4C-2Ti specimen.
Lubricants 10 00348 g005aLubricants 10 00348 g005b
Figure 6. Wear rate in terms of the test cycles and Vickers hardness: (a) relationship between wear loss and test cycle and (b) relationship between wear rate and Vickers hardness.
Lubricants 10 00348 g006
Figure 7. Microphotograph of the specimen’s worn surface after abrasive test through SEM. The white arrows denote the wear marks, and the yellow circles indicate localized wear in the Ti-added specimens.
Lubricants 10 00348 g007
Figure 8. Wear process schematic where Step 1, Step 2, Step 3, and Step 4 depict the wear mechanism of the material (HCCI).
Lubricants 10 00348 g008
Figure 9. (a) Wear rate of various hardness for specimens with similar Ti content but different C content and (b) SEM images of the specimens to show the effect of the carbide grain size on the wear resistance properties.
Lubricants 10 00348 g009
Figure 10. (a) Wear depth observation using 3D laser microscope and (b) wear depth of each specimen.
Lubricants 10 00348 g010
Table 1. Chemical composition of the specimens (wt.%).
Test MaterialCSiMnCrTiFe
3C-0Ti3.070.480.4327.180.01Bal.
3C-1Ti3.020.490.4427.101.09Bal.
3C-2Ti3.020.510.4426.921.87Bal.
3.5C-0Ti3.480.450.4427.340.06Bal.
3.5C-1Ti3.480.460.4527.181.18Bal.
3.5C-2Ti3.490.470.4527.022.09Bal.
4C-0Ti3.880.490.4127.500.07Bal.
4C-1Ti3.820.510.4227.181.24Bal.
4C-2Ti3.880.520.4226.912.35Bal.
Table 2. Vickers hardness and carbide volume fraction of each test specimen.
Test Material3C-0Ti3C-1Ti3C-2Ti
Macro hardness870HV815HV768HV
Matrix hardness643HV558HV524HV
CVF41.2%39.0%39.2%
Test material3.5C-0Ti3.5C-1Ti3.5C-2Ti
Macro hardness916HV863HV792HV
Matrix hardness665HV612HV549HV
CVF42.3%39.3%39.1%
Test material4C-0Ti4C-1Ti4C-2Ti
Macro hardness964HV956HV878HV
Matrix hardness748HV672HV623HV
CVF39.4%41.0%40.5%
Publisher’s Note: MDPI stays neutral with regard to jurisdictional claims in published maps and institutional affiliations.