Article

A Traction (Friction) Curve Is Not a Flow Curve

Regents’ Researcher, Retired Georgia Institute of Technology, Center for High-Pressure Rheology, George W. Woodruff School of Mechanical Engineering, Atlanta, GA 30332-0405, USA
Lubricants 2022, 10(9), 221; https://doi.org/10.3390/lubricants10090221
Submission received: 5 August 2022 / Revised: 27 August 2022 / Accepted: 30 August 2022 / Published: 12 September 2022
(This article belongs to the Special Issue Sustainable Elastohydrodynamic Lubrication)

Abstract

:
With the uncertainty regarding the global energy future, the ability to lubricate concentrated contacts with sufficiently thick liquid films while minimizing friction is of extreme importance. The assumptions of classical elastohydrodynamic lubrication have remained unchanged since the early days. It has not been possible to test many of these assumptions without the measurement of the viscosity at elastohydrodynamic lubrication (EHL) pressures, and viscometer measurements have been ignored. One of these assumptions has been the equivalence of a traction curve to a rheological flow curve for the lubricant. This notion should have been discarded forty years ago, simply because it required the pressure–viscosity behavior to be unlike the behavior observed in viscometers. At the heart of the problem is the fact that the pressure within the EHL contact is not homogeneous and the liquid properties are highly dependent on pressure, making the contact a very poor rheology laboratory. These past failures must be avoided in the future.

1. Introduction

Today, the field of elastohydrodynamic lubrication, EHL, can be divided into two different approaches, classical EHL and quantitative EHL [1]. With the classical approach, the lubricant properties are not obtained from measurements separate from the lubricated contact, except for the density and viscosity at ambient pressure. The most important property, viscosity at elevated pressure, is adjusted to attain agreement of the analysis with experimental measurements of film thickness or friction. Any conflict with viscometer measurements is ignored. With this approach, it has not been possible to validate the classical assumptions, many of which would have been shown to be unacceptable if confronted with viscometer measurements [2]. With the quantitative approach, at the very least, the temperature, pressure, and shear dependence of viscosity are determined in viscometers or rheometers, and assumptions are easily evaluated.
Most of the assumptions of classical EHL remain unchanged since the early days. The compressibility of all liquids is assumed to be independent of temperature and to be the same as that of mineral oil at room temperature [3]. The classical approach assumes that the entire pressure dependence of the low-shear viscosity depends only on two parameters, the viscosity at ambient pressure and a pressure coefficient. This assumption is most often introduced with fictional accounts of the work of Barus [4] or Roelands [5].
There are two additional rheological assumptions, without which classical EHL would have developed in quite a different way [6]. The first is the Newtonian response in the inlet of the EHL contact, where the film thickness is established, and the second is the equivalence of a traction curve to a rheological flow curve for the lubricant. This second assumption is investigated in this work; however, the first is essential to the second.
A flow curve is often a plot of the generalized Newtonian viscosity, η , versus the shear rate, γ ˙ , or shear stress, τ . It may also be a plot of shear stress versus shear rate. In EHL, if the entrainment velocity, u e = ( u 1 + u 2 ) / 2 , is held constant while the sliding velocity, Λ u = u 1 u 2 , is varied, the coefficient of friction, f , plotted versus the slide-roll ratio, S R R = Σ = Λ u / u e , becomes a traction (friction) curve. This curve may be recast as the average shear stress, τ ¯ = f p ¯ , plotted versus the apparent shear rate, γ ˙ ¯ = u e Σ / h c . Here, p ¯ is the average contact pressure and h c is the central film thickness. The second assumption states that τ ¯ ( γ ˙ ¯ ) is equivalent to τ ( γ ˙ ) , a type of rheological flow curve, for some pressure that exists within the EHL film. This assumption, if accurate, would provide the parameters of the shear-thinning relation for the liquid from a simple traction measurement, obviating the requirement of a viscometer that can vary the shear rate.
This second assumption began to be employed to describe non-Newtonian properties of lubricants in the 1970s, for example, reference [7]. Johnson and Tevaarwerk [8] made this approach the standard for classical EHL in one of the most cited papers in the field. Among those using the classical approach, guided by the Johnson and Tevaarwerk example, the discrepancy between the slower-than-exponential pressure dependence of viscosity reported in Johnson and Tevaarwerk [8] and the faster-than-exponential pressure dependence reported from viscometer measurements [2] went unnoticed. Indeed, the faster-than-exponential pressure response observed in viscometers makes the second assumption untenable [9]. To avoid this difficulty, Houpert [10] recommended that the Roelands correlation be used rather than the real pressure dependence from the viscometer measurements [6].
Modeling and calculation for sustainable elastohydrodynamic lubrication require friction and film thickness calculations. For that, meaningful fluid models with reliable data are required. The assumption that a traction curve is the equivalent of a rheological flow curve for the lubricant is examined and disproven in this article.

2. The Case of a High Viscosity Polyalphaolefin

The first full numerical solution to the EHL problem with real pressure and shear-dependent viscosity [11] was presented in 2007. It should be no surprise that both film thickness and friction were precisely predicted for a high viscosity polyalphaolefin (PAO). This result was repeated and validated 14 years later [12]. These calculations provide one of the few opportunities to test both rheological assumptions of the classical approach. Clearly, the first assumption is not supported, because the film thickness was overpredicted by as much as a factor of two by the Newtonian assumption. The second rheological assumption of the equivalence of a traction curve to a rheological flow curve is tested in the following exercise.
The constitutive equation, based upon viscometer measurements [13], is written for shear stress as
γ ˙ = τ μ [ 1 + ( τ G ) 2 ] ( 1 n ) / ( 2 n )
This is a modification of the Carreau equation, where the shear stress at the Newtonian limit is G = 31 kPa, and the rate sensitivity coefficient is n = 0.74 [13] for a range of temperatures and pressures. If the traction curve is equivalent to a flow curve, then the traction average shear stress, τ ¯ , will be related to the apparent shear rate, γ ˙ ¯ , by
γ ˙ ¯ = τ ¯ C C [ 1 + ( τ ¯ G ) 2 ] ( 1 n ) / ( 2 n )
Here, C C has units of Pa∙s and is not necessarily related to the low-shear viscosity, μ , at any pressure because of the elastic creep of the solid boundaries [14] and the pressure dependence of viscosity [15]. The second rheological assumption of the equivalence of a traction curve to a rheological flow curve requires that the parameters G and n be unchanged between Equations (1) and (2).
In reference [11], the film thickness was correctly calculated from Equation (1) without adjusting the pressure–viscosity response. The average shear stress calculated in reference [11] was in excellent agreement with the experimentally measured traction. It is shown in Figure 1 as the solid curve. The experimental traction measurements (the × symbols in Figure 1) were performed with a steel ball with a 12.7 mm radius loaded at 32 N against the face of a glass disc to provide Hertz pressure of 528 MPa and p ¯ = 352 MPa. Equation (2), fitted to the traction, is shown as the broken curve. The fit provides an average absolute relative deviation of 2.5%. The Carreau fit to the traction provides values of G = 3535 kPa, n = 0.541 , and C C = 32 Pa∙s. The low shear viscosity has a value of C C = 32 Pa∙s for a pressure value of 235 MPa at 75 °C, which is 2/3 of the average pressure and 45% of the Hertz pressure. It has not been possible to extract the pressure dependence of the viscosity from EHL friction for many reasons [15] which will not be listed here.
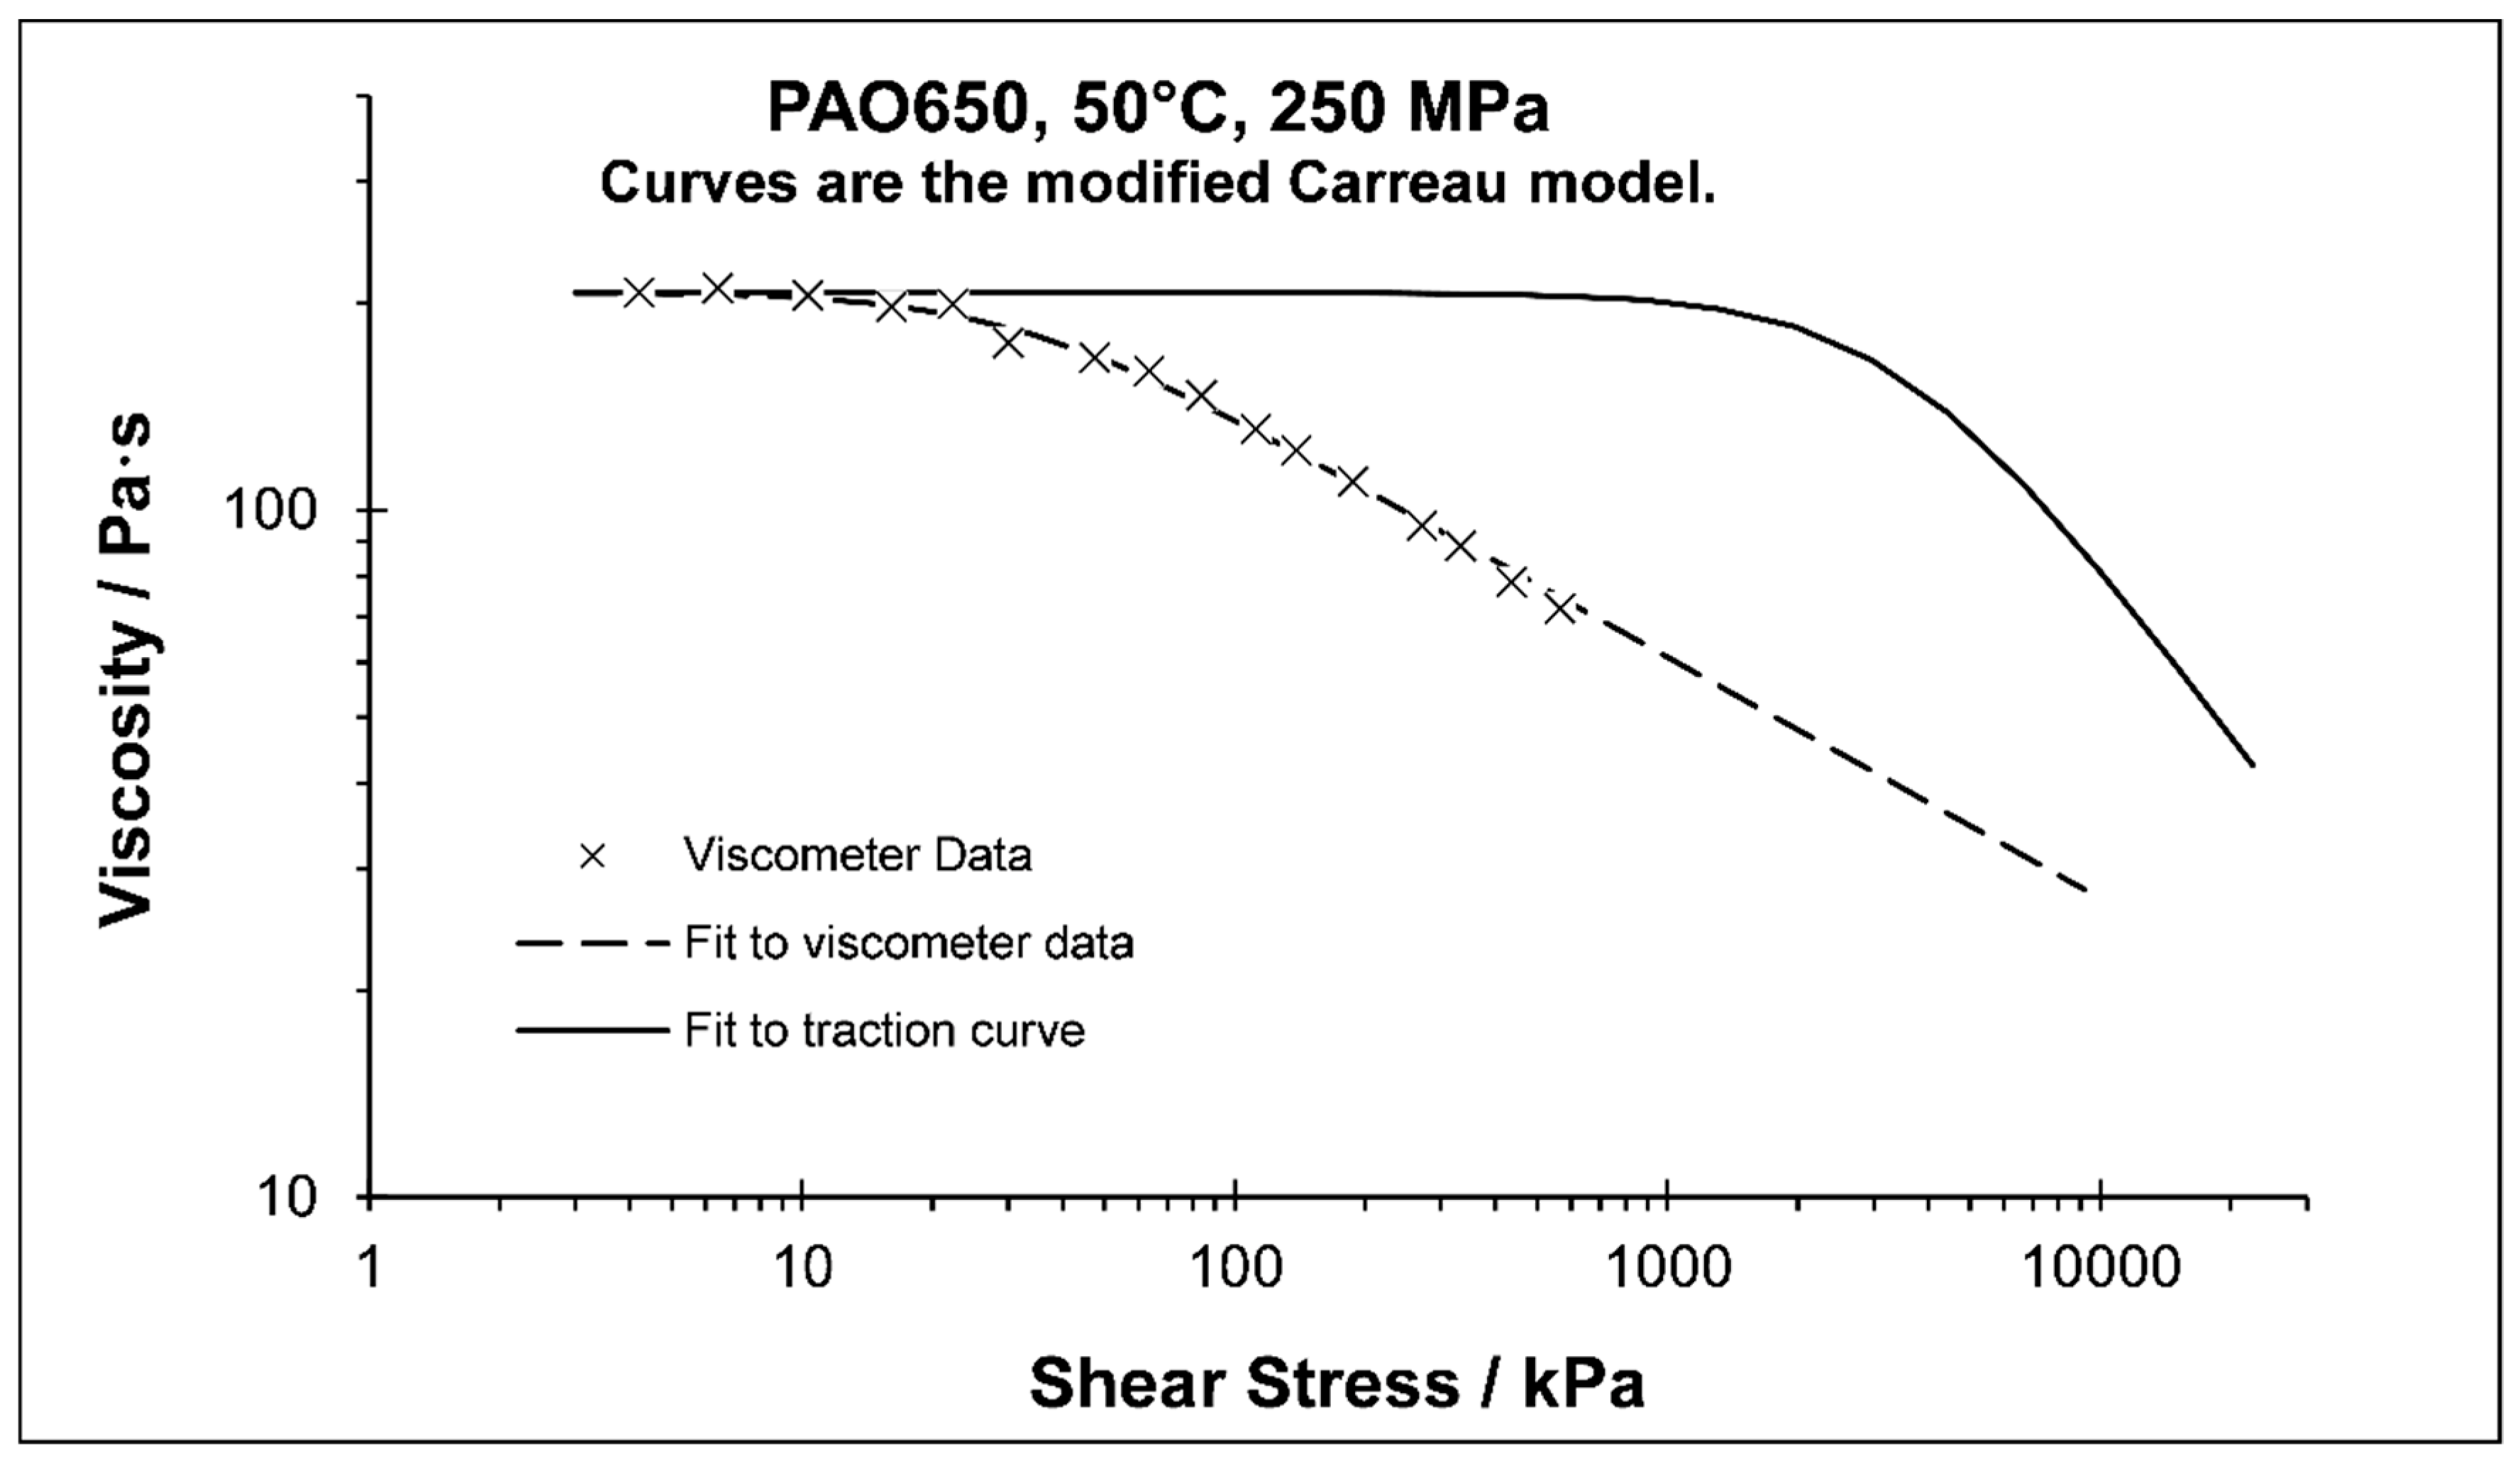
Flow curves are most often presented as the dependence of the generalized Newtonian viscosity, η = τ / γ ˙ , on the shear. In Figure 2, viscosity is plotted against shear stress, showing the measured values from a viscometer at 50 °C and 250 MPa. These are relativity easy measurements for a pressurized thin-film Couette viscometer [1]. In Figure 2, the real flow curve for the liquid is the broken curve, fitted to the viscometer data with values of G = 31 kPa and n = 0.74 .
η = μ [ 1 + ( τ G ) 2 ] ( 1 1 / n ) / 2
The modified Carreau Equation (3), with values of G = 3535 kPa and n = 0.541 from the fit to traction, is shown as the solid curve. The same value of the low-shear viscosity, 207 Pa∙s, is assumed for the comparison. Clearly, the friction curve is not a flow curve.

3. The Case of a Hirst and Moore Liquid Hydrocarbon

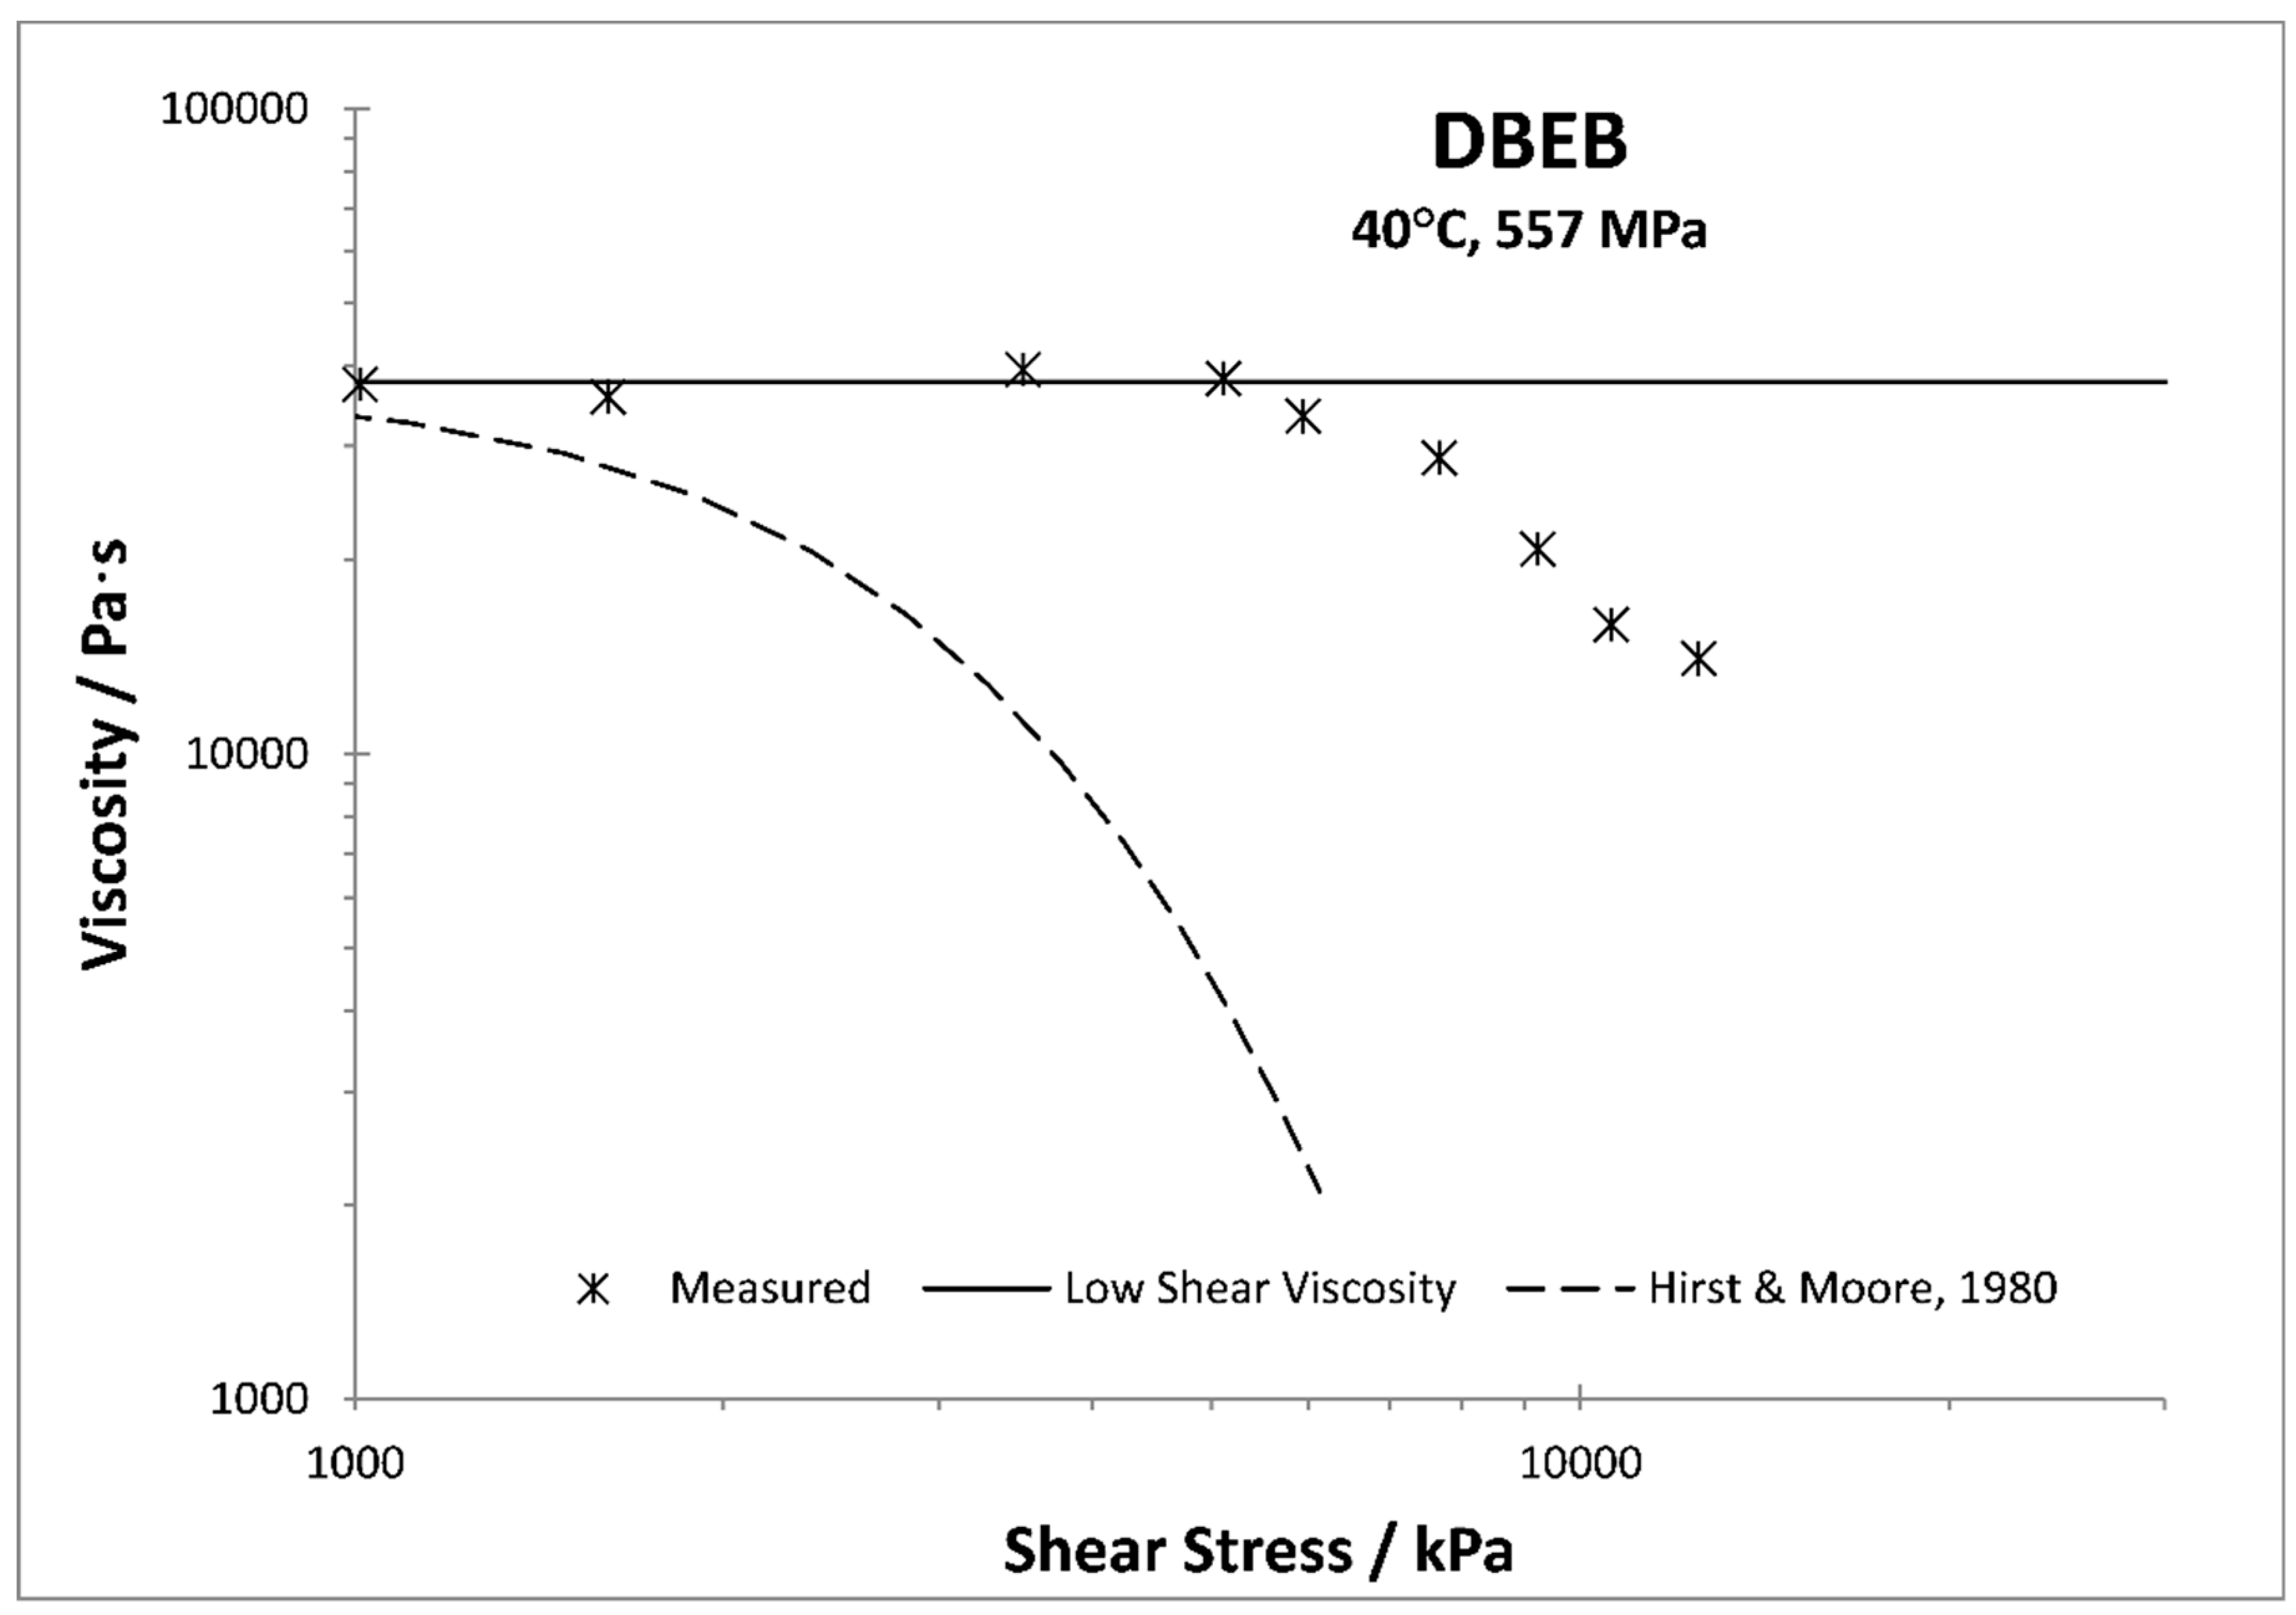
In the case of the PAO, the assumption that a traction curve is the equivalent of a rheological flow curve overstated the Newtonian limit stress. Because there is no simple relationship between the two properties of rheology and friction, there can be no simple relationship between the values of G from the two approaches. The second classical assumption often understates the Newtonian limit. Among the first researchers to associate a friction curve with rheology were Hirst and Moore [7]. In 1980 [16], they published the rheological properties of a pure hydrocarbon, dibenzyl ethylbenzene (DBEB). Their flow curve, the Eyring sinh law, is plotted in Figure 3 as the broken curve. Viscometer measurements [17] are the data points generated from measurements of the same sample from Monsanto. Clearly, the second classical assumption understates the Newtonian limit here, providing a viscosity value that is an order-of-magnitude less at a shear stress level of only 6 MPa.

4. The Case of a Johnson and Tevaarwerk Mineral Oil

One of the most widely studied liquid lubricants was the mineral oil of Johnson and Tevaarwerk [8], LVI 260, which is an example of a fragile liquid. The pressure response is faster than exponential for viscosity values greater than 1 Pas [1]. Johnson and Tevaarwerk [8] considered the traction curve to be a rheological flow curve, and from their two-disc experiments, reported various rheological properties: pressure-dependent viscosity, shear modulus, limiting shear stress, and shear-dependent viscosity. Only the limiting stress was supported by measurements outside of the EHL contact. The pressure response was reported to be slower-than-exponential, in contradiction with the viscometers. The shear modulus was reported to be about 1/4 of the values found from high-pressure ultrasound and stress-strain experiments [18].
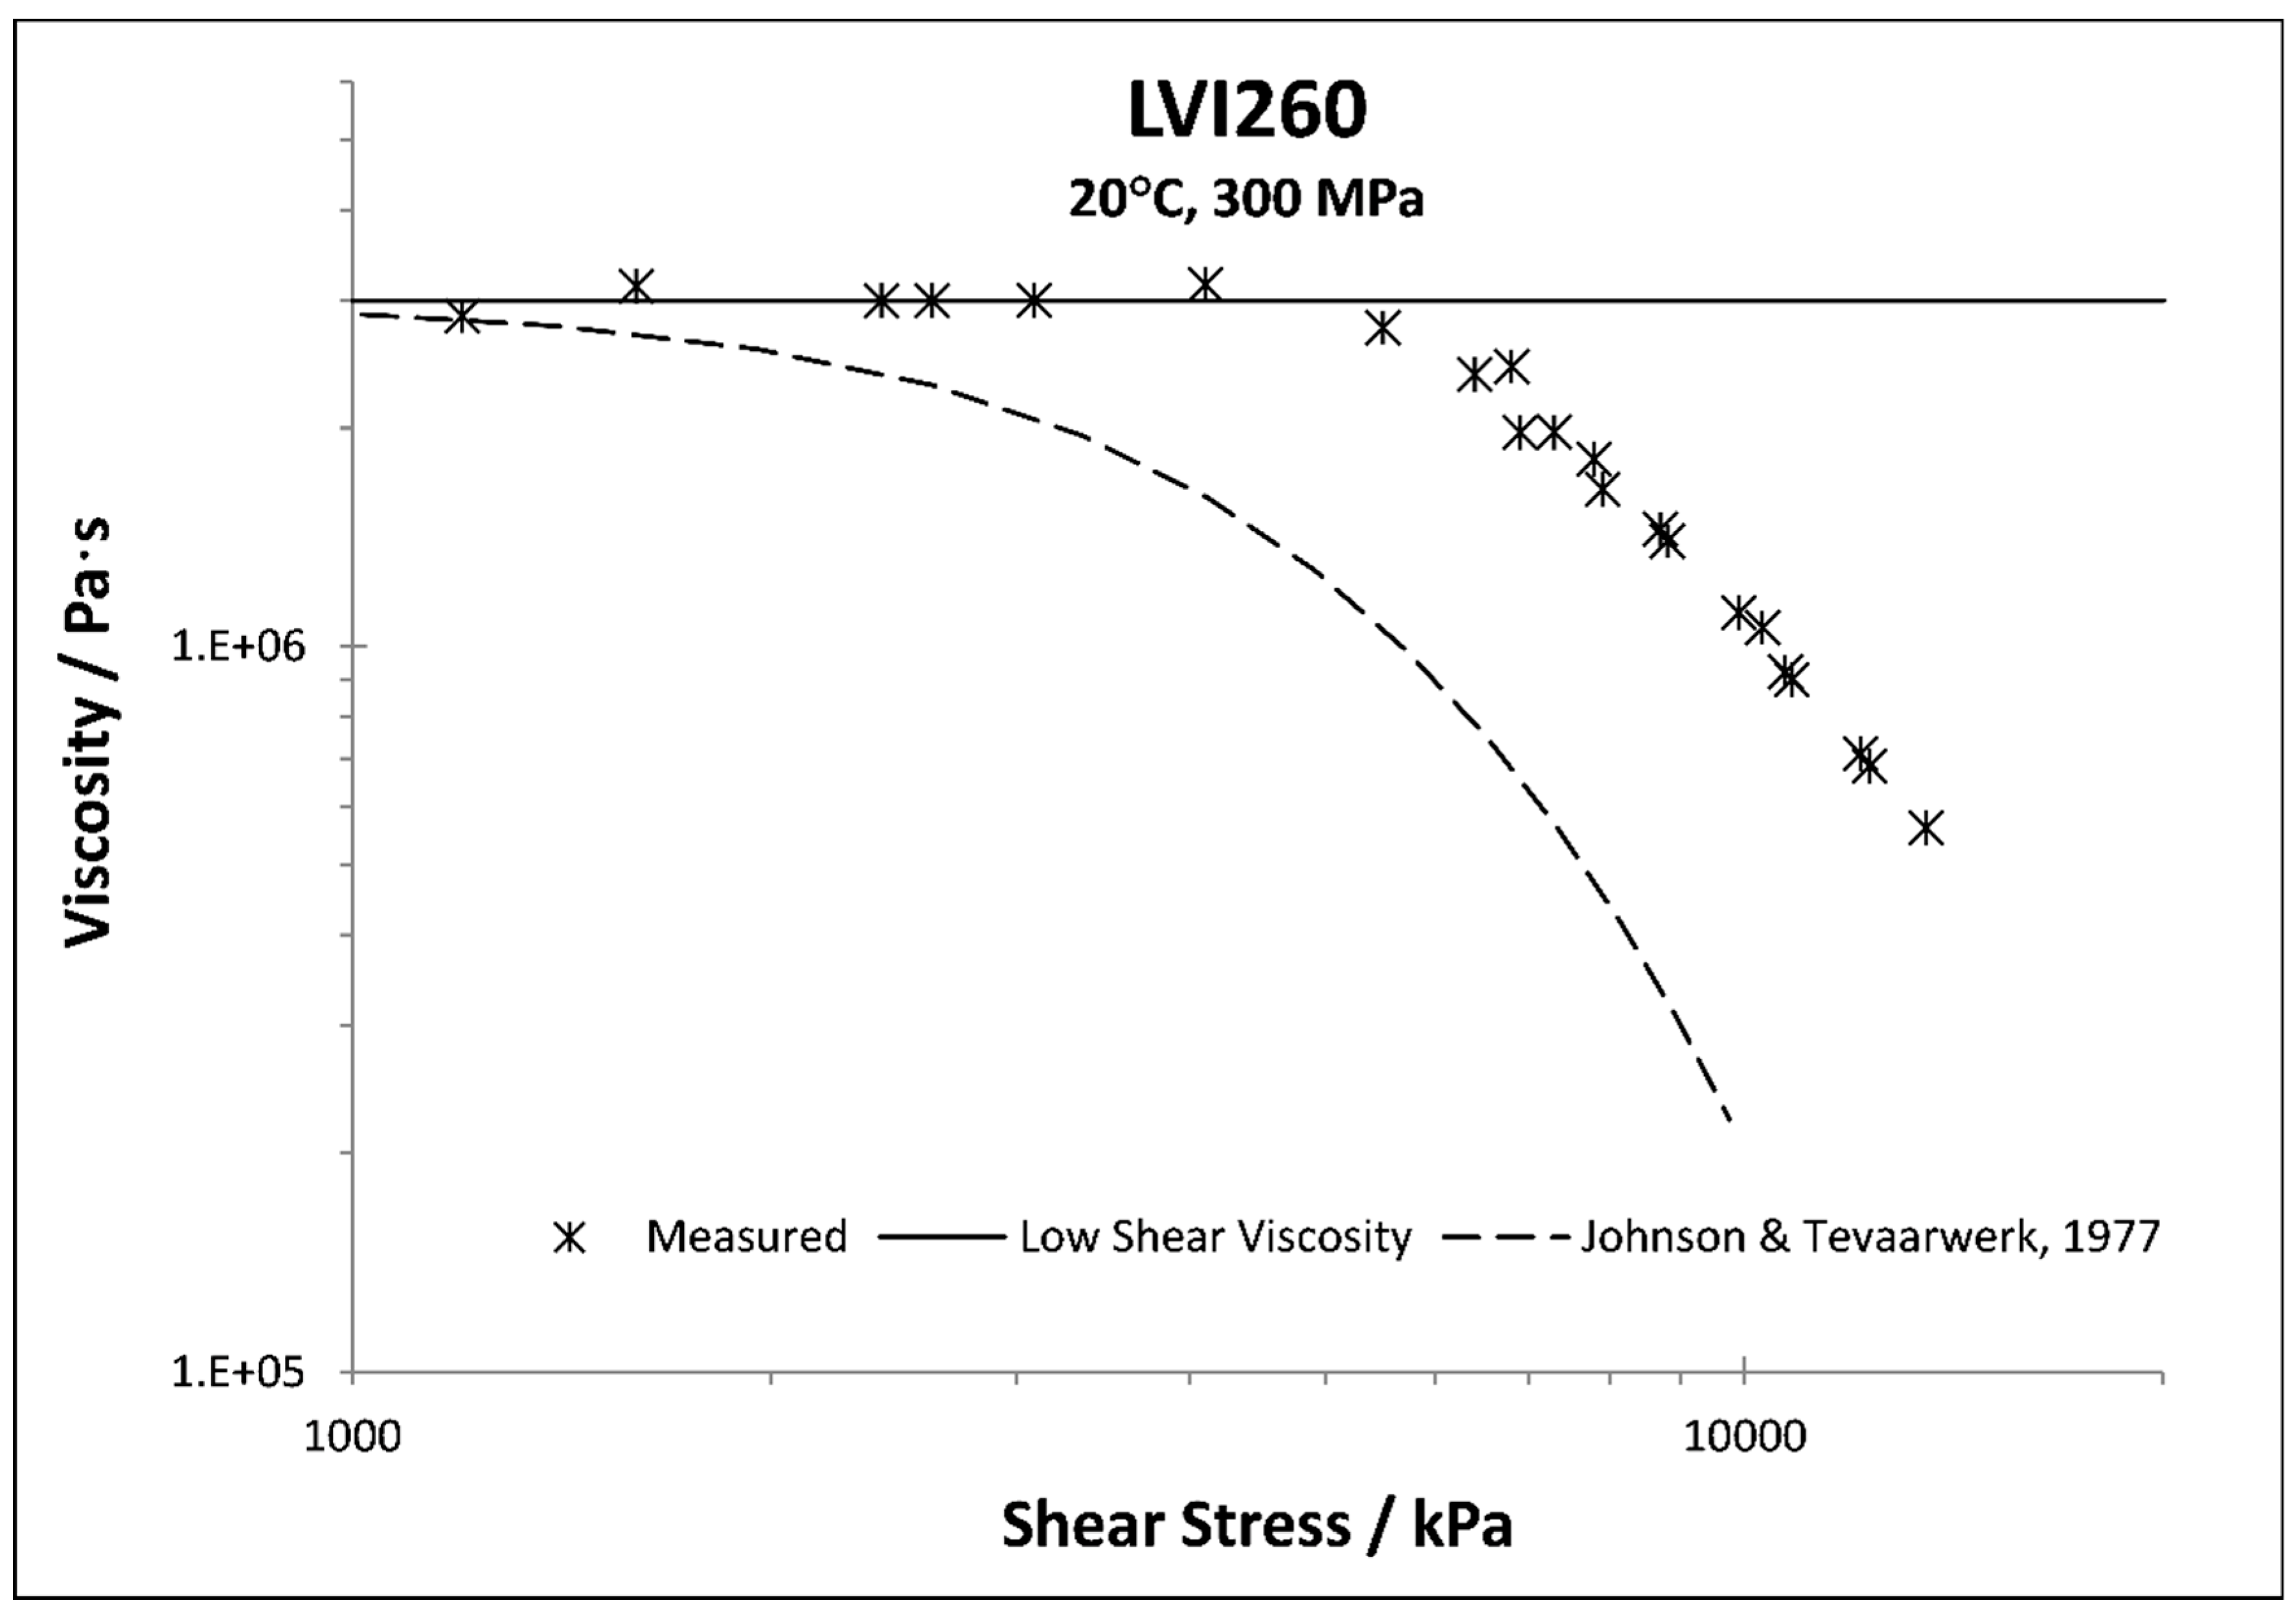
The shear-dependent viscosity was measured by this author [19] on a sample provided by K. L. Johnson, and the data are plotted in Figure 4 along with the shear dependence reported by Johnson and Tevaarwerk [8]. They found that the Eyring stress value decreased with pressure and was 2 MPa at a pressure of 500 MPa. This value was used in Figure 4 for the lower pressure of 300 MPa to be generous. The viscometer indicates the Newtonian response to 5 MPa in shear stress at 300 MPa. At this stress level, the flow curve extracted from friction has lost more than half of the Newtonian viscosity. Despite these failures, the 1977 Johnson and Tevaarwerk paper continues to be invoked, even today, to justify the extraction of rheological properties from EHL traction. See, for example, [20].

5. The Case of a Low-Viscosity Polyalphaolefin

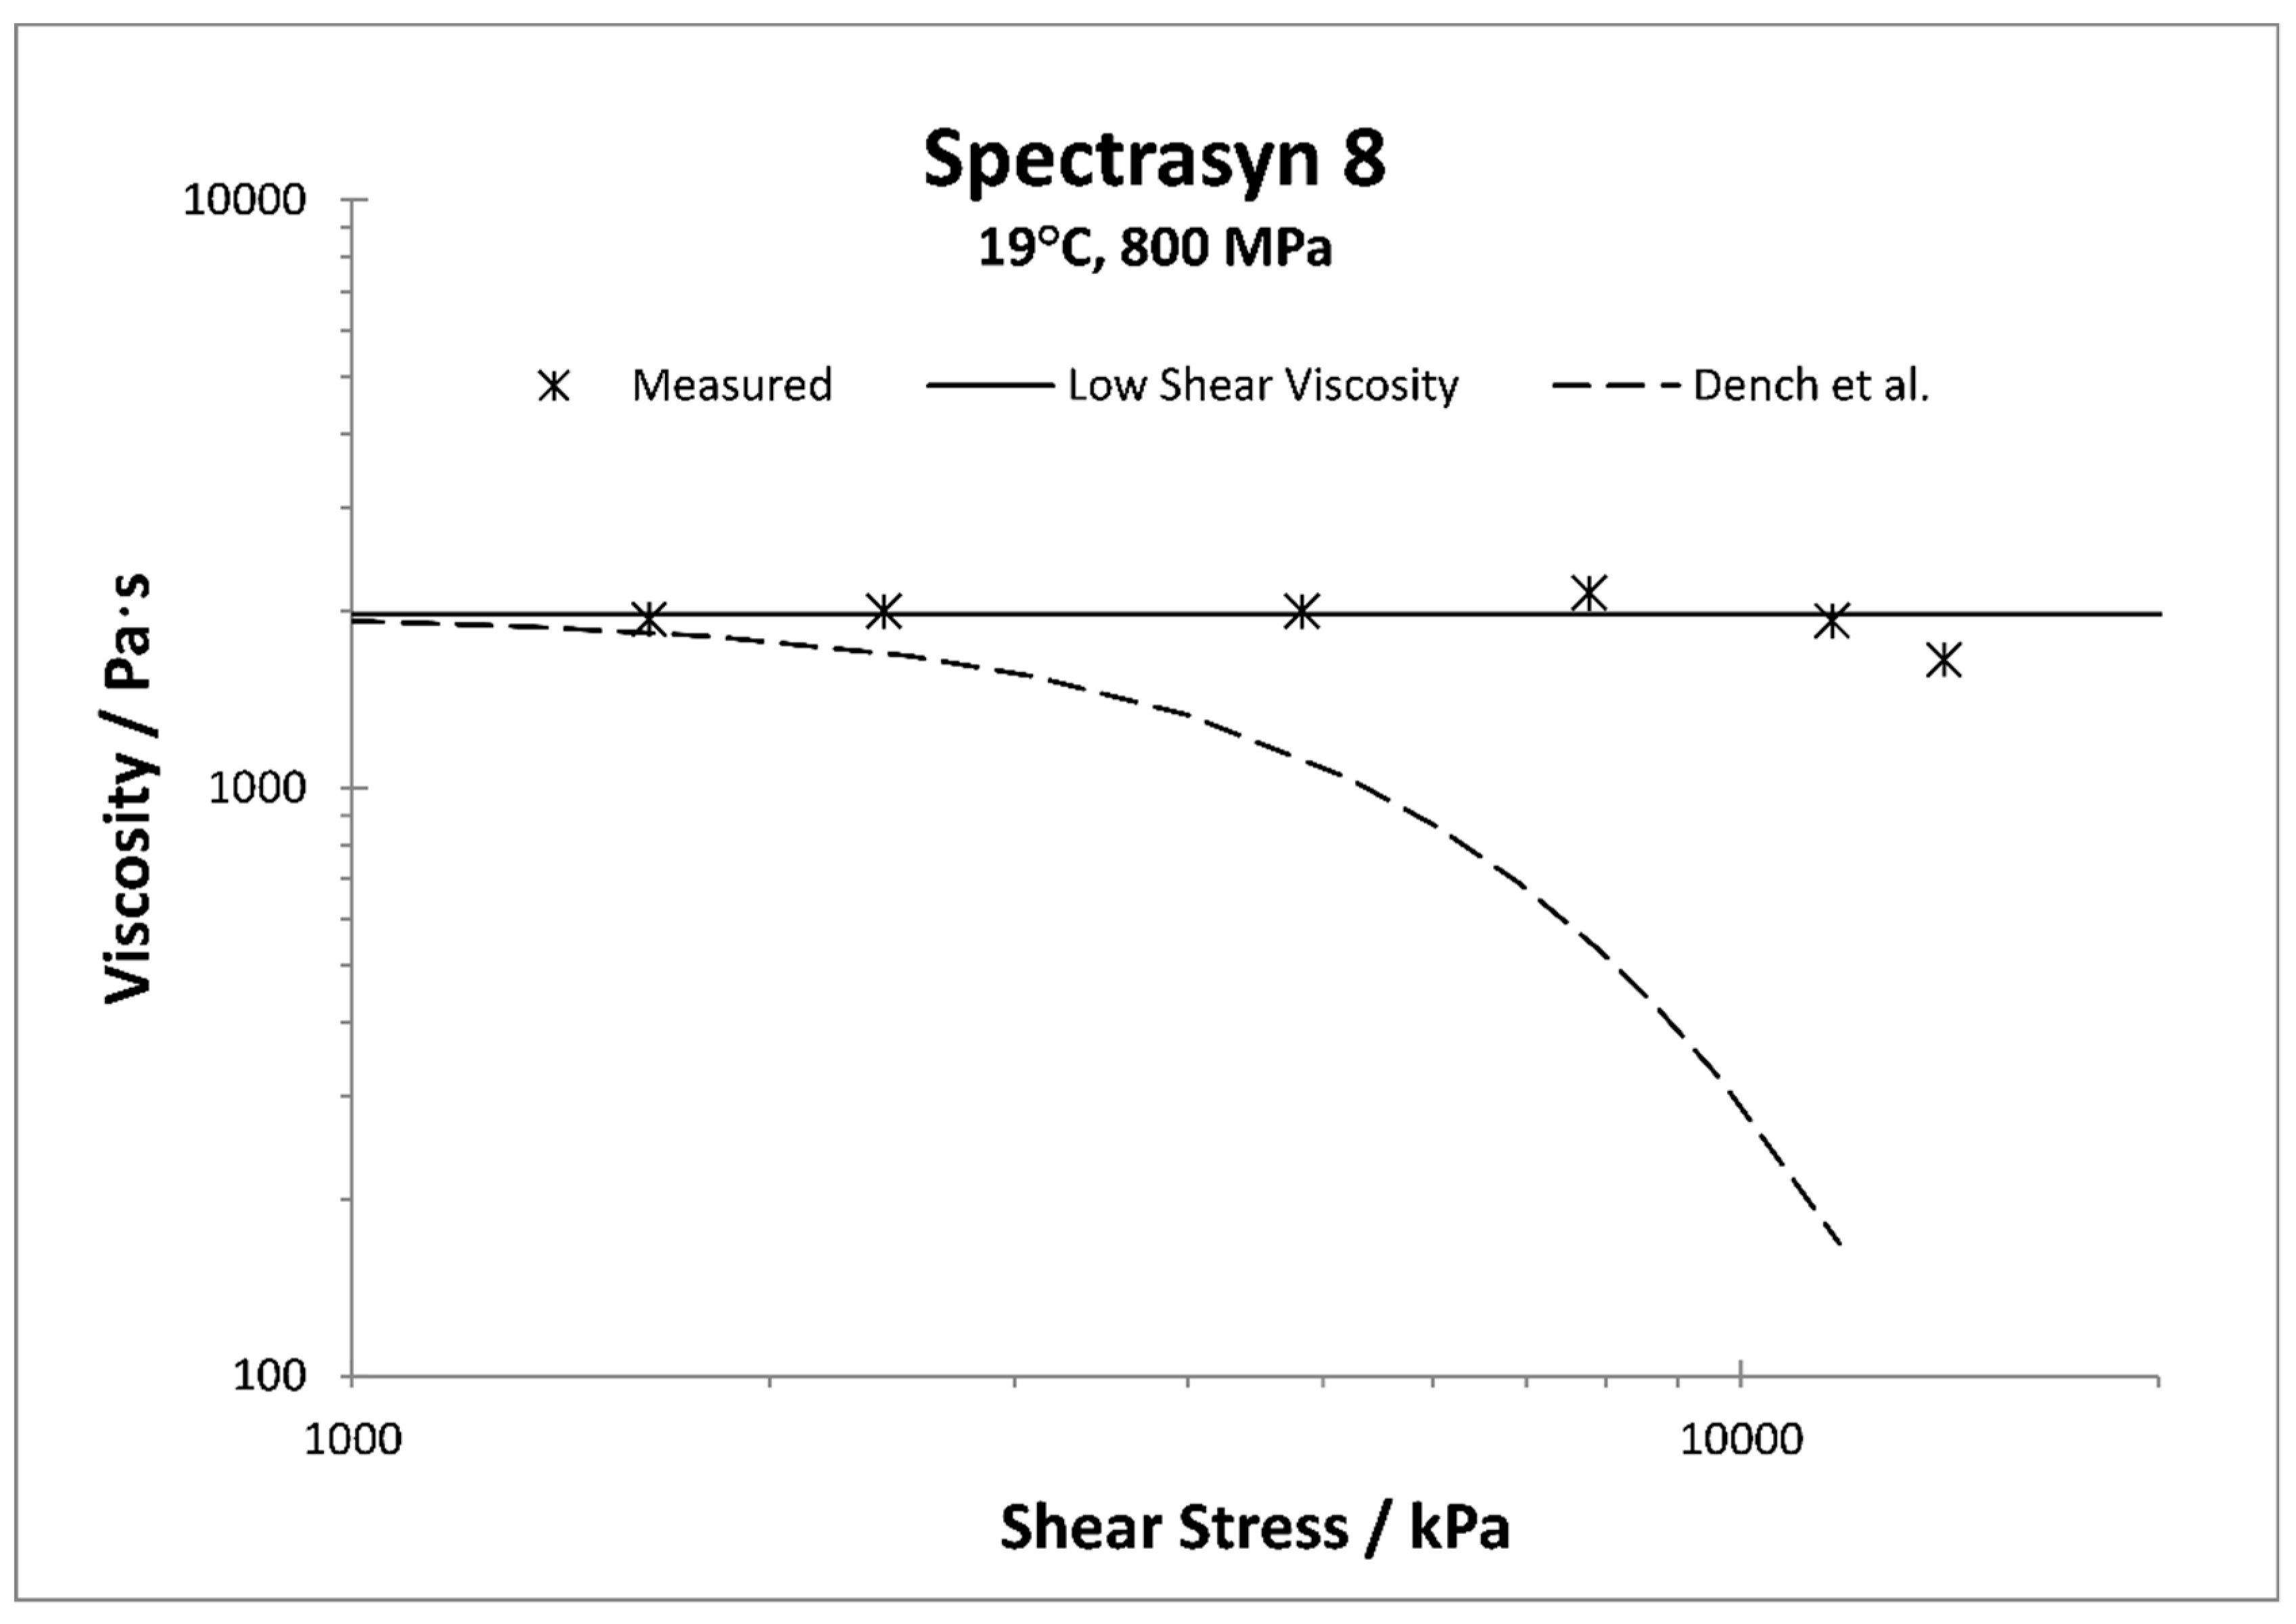
A recent case for which friction has understated the Newtonian limit was offered by Imperial College [21]. The viscometer data [15], generated at the request of the authors of [21], are shown in Figure 5. The PAO 8 is Newtonian to at least 11 MPa, while the “Eyring stress” value is reported to be 2.5 MPa [21]. Clearly, the Newtonian limit must have been much greater than the “Eyring stress” value in the friction measurements as reported.

6. Polymer-Containing Oils

A common rheological response for liquid lubricants involves the effect of a high molecular weight additive. For example, multigrade oils will begin shear-thinning at a shear stress value of 0.5 to 100 kPa [22] and continue to shear thin with a power law exponent of about n = 0.8 to 0.95. An inflection indicative of a second Newtonian in the log–log plot may be present when the value of n is in the lower part of the range and the base oil has a high Newtonian limit [23]. Occasionally, a second Newtonian plateau occurs, where the viscosity is independent of the shear up to the Newtonian limit of the base oil [23].
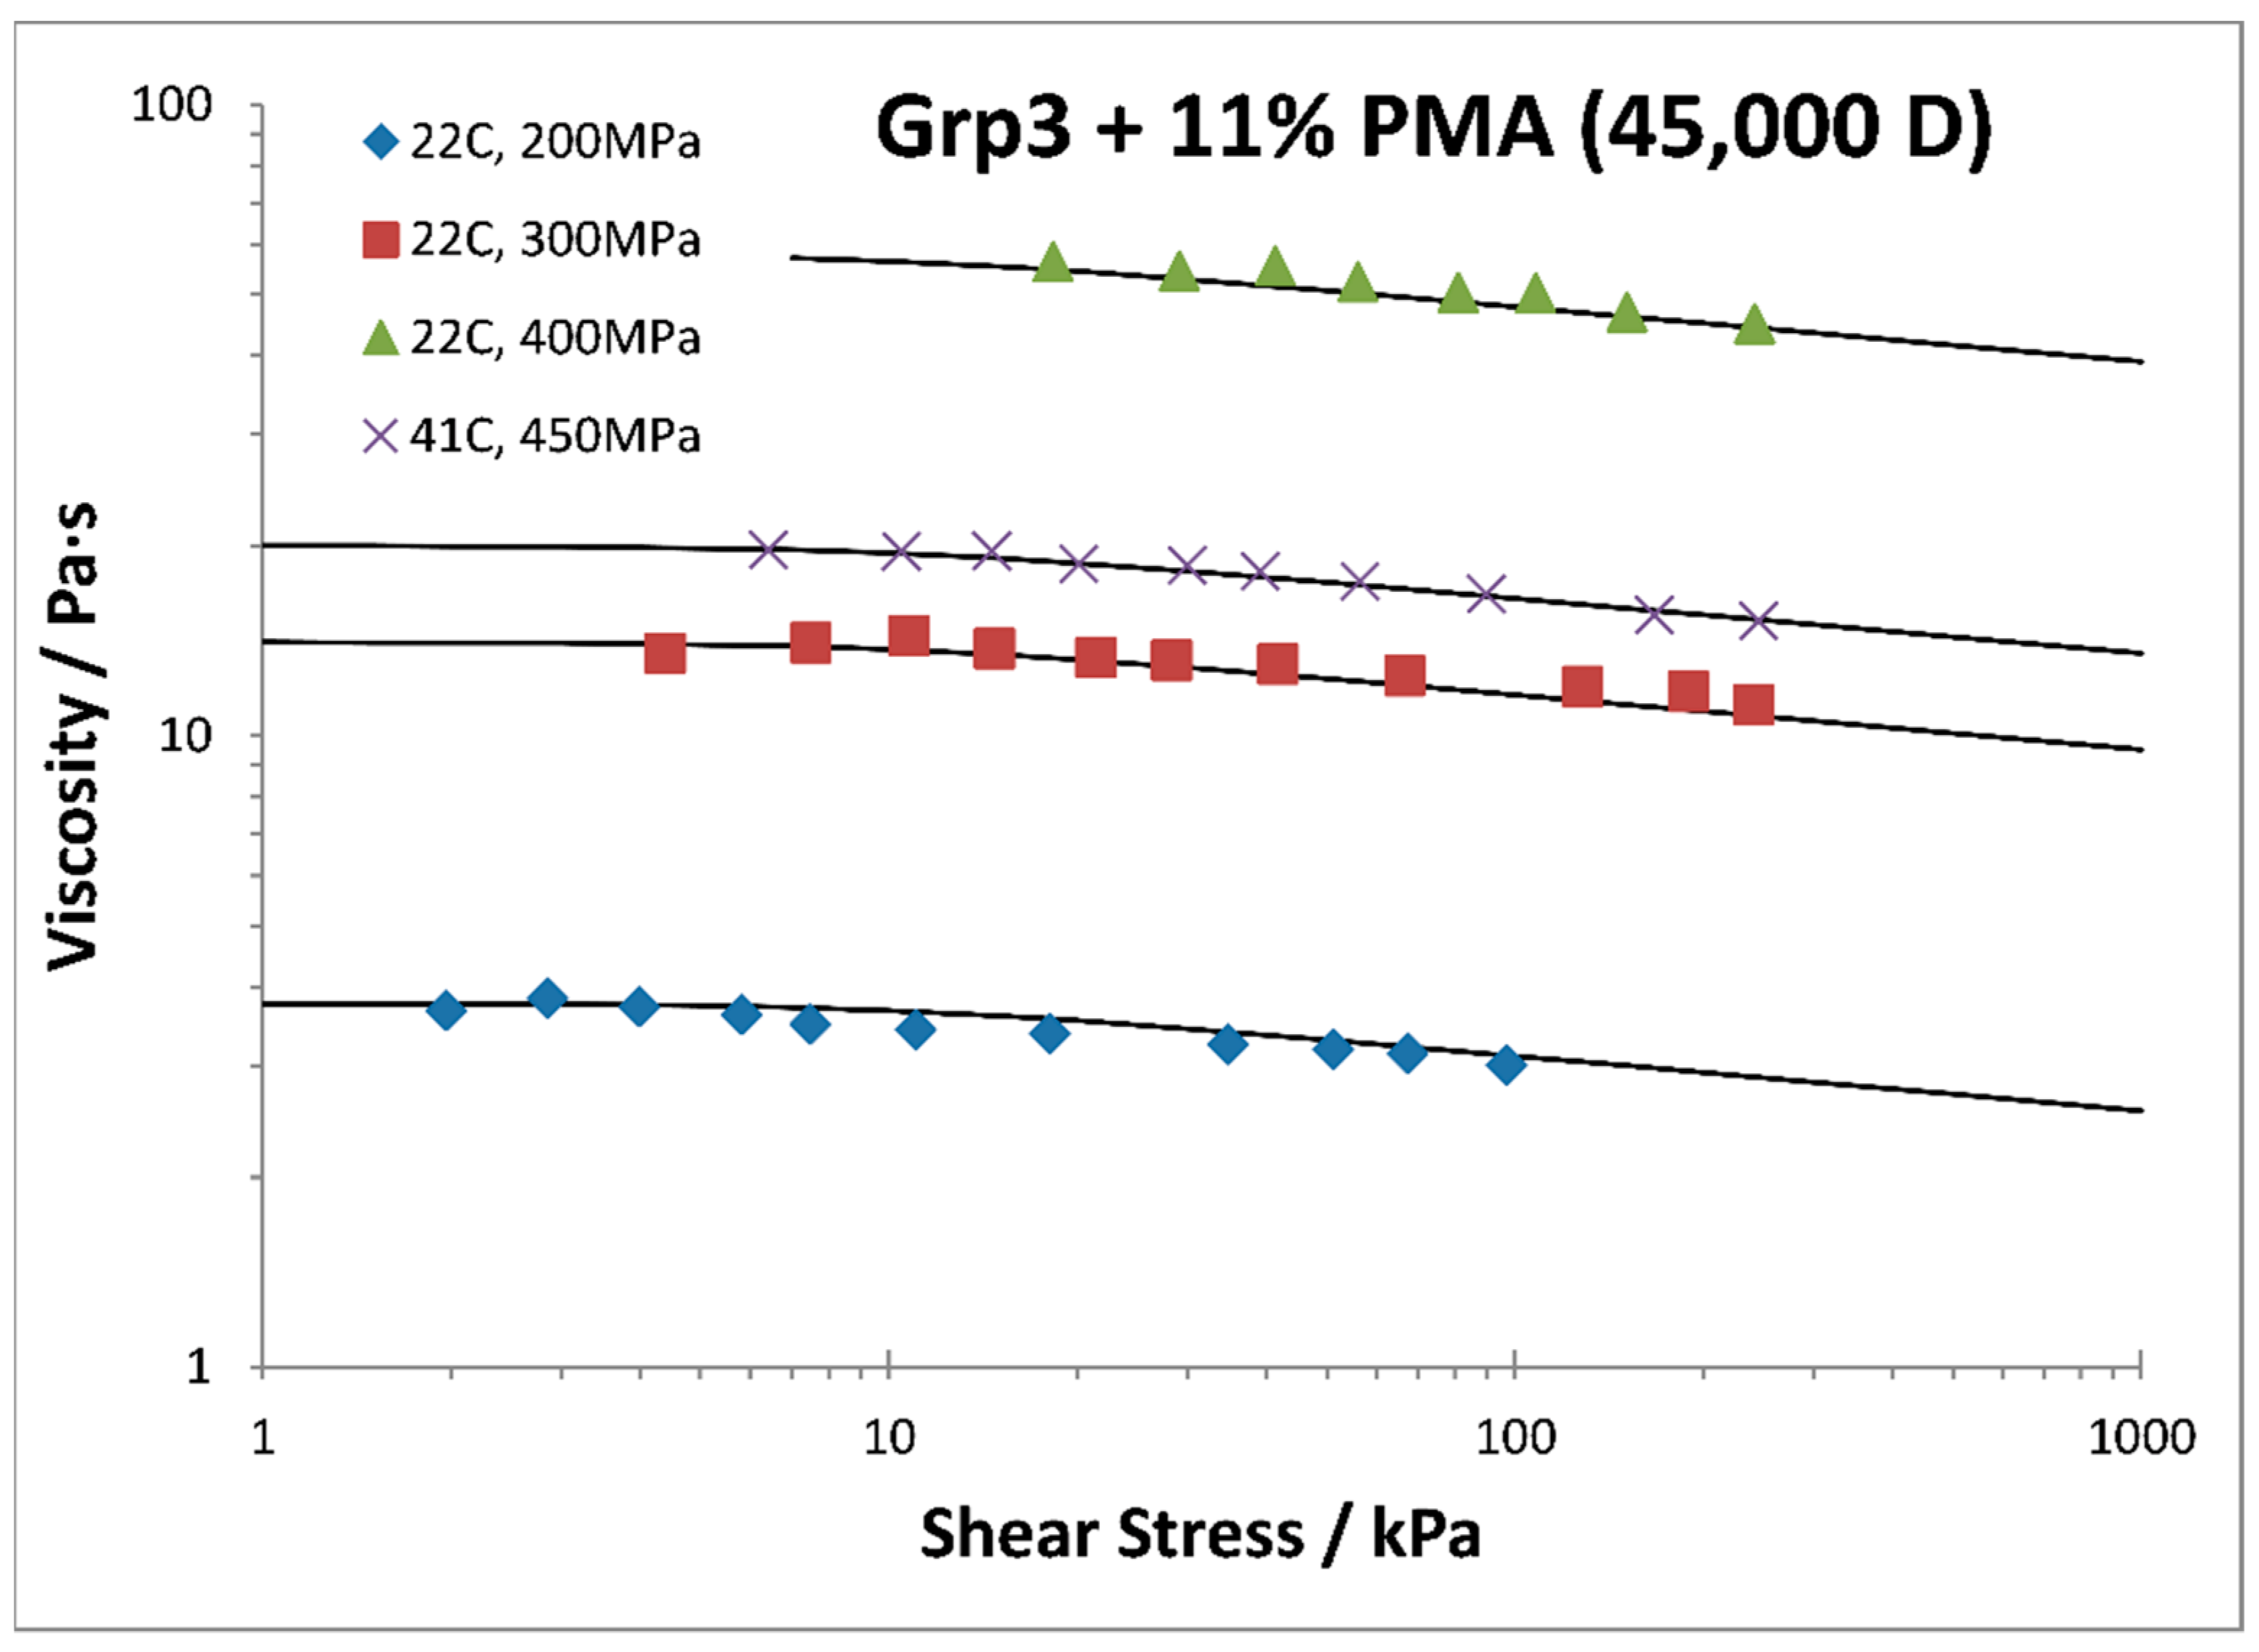
Figure 6 shows flow curves for a hydraulic oil that contains a polymer thickener. Polymers may be present for other purposes, such as dispersants. The ability to observe this type of rheology in lubricating oils has been available since 1969 [24]. There are commercial viscometers that can generate these data; however, the stress is greatly limited by shear cavitation [25]. The curves in Figure 6 represent the modified Carreau Equation (3) with values of G = 11 kPa and n = 0.92 . To date, this behavior has not been found in an EHL traction curve. Certainly, no second Newtonian has been reported. Therefore, the assumption that a traction curve is the equivalent of a rheological flow curve has impeded the investigation of the rheology of polymer/oil solutions in EHL.

7. Implications of the Invalid Assumption Relating Rheology to Traction

7.1. Inaccurate Pressure-Dependent Viscosity

The assumption that a traction curve is the equivalent of a rheological flow curve has had a profound influence on the development of the EHL field. The pressure dependence of viscosity in classical EHL is most often described by the Roelands equation [26] to pressures far exceeding the limit imposed by Roelands of 0.3 to 0.5 GPa [26]. Tribology students are taught that this relation is correct for extrapolation to very high pressures; reference [27] for an example.
Laboratories that measure viscosity to high pressure do not employ the Roelands correlation. The reason can be found from an inspection of the pressure–viscosity equation in its standard form, which requires only two parameters: the viscosity at ambient pressure and a pressure–viscosity index. Correlations that accurately describe the pressure–viscosity effect to 0.4 GPa use at least three parameters [1]. In his thesis [26], Roelands discarded data at high and low pressures, which did not fit his correlation [5].
Encouragement for using Roelands in EHL came from an influential paper by Houpert [10]. Houpert did not argue the accuracy of the Roelands relation; that would have required viscometer measurements. Instead, he pointed out that the Eyring sinh law was favored as an explanation for the prediction of traction when assuming that a traction curve is the equivalent of a rheological flow curve and that the Roelands equation offered accurate traction predictions when combined with the sinh law. The example used was the published traction for the Johnson and Tevaarwerk [8] mineral oil, Turbo 33. However, the pressure–viscosity relation that was offered by Houpert [10] greatly understated the pressure dependence of the viscosity of Turbo 33 as measured in a viscometer [6].
The portion of a traction curve which would be employed to extract the viscosity must be the linear region occurring at a low slide-to-roll ratio. Whereas it may be possible, at low contact pressure, to calculate an average viscosity value from the linear traction, it is not possible to assign a pressure value to that average viscosity. The average viscosity will only be found at the average contact pressure when the pressure–viscosity relation is linear [15]. The entire pressure–viscosity relation up to the maximum pressure is required to assign a pressure value to the average viscosity value.
At high contact pressure, it is not possible to calculate an average viscosity value from the linear traction because the elastic creep of the rollers dominates over the viscous response. Indeed, at high contact pressures, there may be little difference between an unlubricated (dry) traction curve and one with a full film [14]. The measurement of the glass transition pressure is an easier task than the measurement of the viscosity at high pressure [28], and such data have been available for more than forty years. For temperatures up to 100 °C, lubricating oils are glassy solids above 2 GPa [28,29]. Despite this knowledge, the pressure–viscosity relation for common base oils has recently been extracted from traction curves to 4 GPa [30] at Imperial College. Of course, the pressure dependence is slower-than-exponential, unlike that seen in viscometers.

7.2. Inaccurate Shear-Dependent Viscosity

In Figure 3 and Figure 5, the viscosity has been understated by at least an order-of-magnitude at the Newtonian limit from the assumption that a traction curve is the equivalent of a rheological flow curve. The classical approach has been silent on the effect of shear-thinning on film thickness and has required another invalid assumption—that of Newtonian response in the inlet zone—to explain film thickness in the presence of shear-thinning. The pressure dependence, in the form of a pressure–viscosity coefficient, has often been understated [1,31] to support this assumption. The pressure–viscosity coefficient quantifies the strength of the piezoviscous effect in the inlet zone, which is at relatively low pressure. The lack of a generally accepted definition of the pressure–viscosity coefficient can be attributed to the need to support the Newtonian inlet assumption [32].
In contrast to the film thickness, it is widely accepted that a description of the shear dependence is required for EHL traction. There are many cases in which the Newtonian description used by the classical formulas overstates the film thickness [1]. Superposition requires that the same shear dependence be used for film thickness as for traction.

8. Conclusions

The title of this article states a fact: a traction curve is not a flow curve. Forty years ago, the pressure dependence of the viscosity at EHL pressures was already known from the work of Bridgman [33]. It was, therefore, possible to test the assumption that a traction curve is the equivalent of a rheological flow curve from the traction data and the fitted sinh law of Johnson and Tevaarwerk [8]. Most tribologists chose not to test it and accept it as a convenient justification to investigate high-pressure rheology without so much as a pressurized viscometer. Such a test was published by Bair et al. [9] a few years ago, employing the mineral oil, LVI260, of Section 4 above. The constitutive equation (Eyring) that was fitted to the traction curves by Johnson and Tevaarwerk yielded a very different curve when integrated over the contact with Hertz pressure distribution. Therefore, when the real pressure dependence of the viscosity is considered, the work of Johnson and Tevaarwerk [8] can be used to disprove the Eyring shear dependence. At the heart of the problem is the fact that the pressure within the EHL contact is not homogeneous and the liquid properties are highly dependent on pressure, making the contact a very poor rheology laboratory.
The assumption that a traction curve is the equivalent of a rheological flow curve has not resulted in solutions to difficult problems in EHL. Decades of wasted effort demonstrate that the extraction of constitutive behavior from a traction curve must end.

Funding

This research received no external funding.

Institutional Review Board Statement

Not applicable.

Informed Consent Statement

Not applicable.

Data Availability Statement

The author will provide data upon request.

Conflicts of Interest

The author declares no conflict of interest.

Nomenclature

C C Traction fitting parameter (Pa·s)
G Newtonian limit stress (Pa)
p pressure (Pa)
npower-law exponent
T temperature (K or °C)
u velocity in the rolling direction (m/s)
α reciprocal asymptotic isoviscous pressure coefficient (Pa−1)
γ ˙ shear rate (s−1)
γ ˙ ¯ average shear rate (s−1)
η generalized (non-Newtonian) viscosity (Pa·s)
μ low shear viscosity (Pa·s)
τ shear stress
τ ¯ average shear stress

References

  1. Bair, S.S. High Pressure Rheology for Quantitative Elastohydrodynamics, 2nd ed.; Elsevier: Amsterdam, The Netherlands, 2019. [Google Scholar]
  2. Hutton, J.F.; Phillips, M.C. High Pressure Viscosity of a Polyphenyl Ether measured with a New Couette Viscometer. Nat. Phys. Sci. 1973, 245, 15–16. [Google Scholar] [CrossRef]
  3. Guimarey, M.J.G.; Comuñas, M.J.P.; López, E.R.; Amigo, A.; Fernández, J. Volumetric Behavior of Some Motor and Gear-Boxes Oils at High Pressure: Compressibility Estimation at EHL Conditions. Ind. Eng. Chem. Res. 2017, 56, 10877–10885. [Google Scholar] [CrossRef]
  4. Barus, C. Isothermals, isopiestics and isometrics relative to viscosity. Am. J. Sci. 1893, s3-45, 87–96. [Google Scholar] [CrossRef]
  5. Bair, S. Roelands’ missing data. Proceedings of the Institution of Mechanical Engineers. Part J J. Eng. Tribol. 2004, 218, 57–60. [Google Scholar] [CrossRef]
  6. Bair, S. The rheological assumptions of classical EHL: What went wrong? Tribol. Int. 2018, 131, 45–50. [Google Scholar] [CrossRef]
  7. Hirst, W.; Moore, A.J. Non-Newtonian behaviour in elastohydrodynamic lubrication. Proc. R. Soc. London. Ser. A Math. Phys. Sci. 1974, 337, 101–121. [Google Scholar] [CrossRef]
  8. Johnson, K.L.; Tevaarwerk, J.L. Shear behaviour of elastohydrodynamic oil films. Proc. R. Soc. London. Ser. A, Math. Phys. Sci. 1977, 356, 215–236. [Google Scholar] [CrossRef]
  9. Bair, S.; Martinie, L.; Vergne, P. Classical EHL versus quantitative EHL: A perspective part II—Super-Arrhenius piezoviscosity, an essential component of elastohydrodynamic friction missing from classical EHL. Tribol. Lett. 2016, 63, 1–10. [Google Scholar] [CrossRef]
  10. Houpert, L. New results of traction force calculations in elastohydrodynamic contacts. Trans. ASME J. Lub. Tech. 1985, 107, 241–248. [Google Scholar] [CrossRef]
  11. Liu, Y.; Wang, Q.J.; Bair, S.; Vergne, P. A Quantitative Solution for the Full Shear-Thinning EHL Point Contact Problem Including Traction. Tribol. Lett. 2007, 28, 171–181. [Google Scholar] [CrossRef]
  12. Liu, H.C.; Bin Zhang, B.; Schneider, V.; Venner, C.; Poll, G. Two-dimensional generalized non-Newtonian EHL lubrication: Shear rate-based solution versus shear stress-based solution. Proc. Inst. Mech. Eng. Part J J. Eng. Tribol. 2021, 235, 2626–2639. [Google Scholar] [CrossRef]
  13. Bair, S.; Vergne, P.; Querry, M. A unified shear-thinning treatment of both film thickness and traction in EHD. Tribol. Lett. 2005, 18, 145–152. [Google Scholar] [CrossRef]
  14. Bair, S.; Kotzalas, M. The Contribution of Roller Compliance to Elastohydrodynamic Traction. Tribol. Trans. 2006, 49, 218–224. [Google Scholar] [CrossRef]
  15. Bair, S. Is it possible to extract the pressure dependence of low-shear viscosity from EHL friction? Revised May, 2020. Tribol. Int. 2020, 151, 106454. [Google Scholar] [CrossRef]
  16. Hirst, W.; Moore, A.J. The effect of temperature on traction in elastohydrodynamic lubrication. Philos. Trans. R. Soc. London. Ser. A Math. Phys. Sci. 1980, 298, 183–208. [Google Scholar] [CrossRef]
  17. Bair, S. The high pressure rheology of some simple model hydrocarbons. Proc. Inst. Mech. Eng. Part J J. Eng. Tribol. 2002, 216, 139–149. [Google Scholar] [CrossRef]
  18. Hutton, J.F. Reassessment of Rheological Properties of LVI 260 Oil Measured in a Disk Machine. J. Tribol. 1984, 106, 536–537. [Google Scholar] [CrossRef]
  19. Bair, S.; Winer, W.O. A New High-Pressure, High-Shear Stress Viscometer and Results for Lubricants. Tribol. Trans. 1993, 36, 721–725. [Google Scholar] [CrossRef]
  20. Bayat, R.; Lehtovaara, A. EHL/mixed transition of fully formulated environmentally acceptable gear oils. Tribol. Int. 2020, 146, 106158. [Google Scholar] [CrossRef]
  21. Dench, J.; di Mare, L.; Morgan, N.; Wong, J.S.S. Comparing the molecular and global rheology of a fluid under high pressures. Phys. Chem. Chem. Phys. 2018, 20, 30267–30280. [Google Scholar] [CrossRef]
  22. Habchi, W.; Bair, S.; Qureshi, F.; Covitch, M.J. A Film Thickness Correction Formula for Double-Newtonian Shear-Thinning in Rolling EHL Circular Contacts. Tribol. Lett. 2012, 50, 59–66. [Google Scholar] [CrossRef]
  23. Bair, S. Polymer-Thickened Oil Rheology When There Is No Second Newtonian. Tribol. Lett. 2019, 67, 1–6. [Google Scholar] [CrossRef]
  24. Novak, J.D.; Winer, W.O. The effect of pressure on the non-Newtonian behavior of polymer blended petroleum oils. J. Lubr. Tech 1969, 90, 580–590. [Google Scholar] [CrossRef]
  25. Yu, M.; Zhang, J.; Joedicke, A.; Reddyhoff, T. Experimental investigation into the effects of diesel dilution on engine lubrication. Tribol. Int. 2020, 156, 106828. [Google Scholar] [CrossRef]
  26. Roelands, C.J.A. 1966, Correlational Aspects of the Viscosity-Temperature-Pressure Relationship of Lubricating Oils. Ph.D. Thesis, Technical University Delft, Delft, The Netherlands, Groningen, The Netherlands, 1966. [Google Scholar]
  27. Gohar, R.; Rahnejat, H. Fundamentals of Tribology, 2nd ed.; World Scientific Publishing Company: Hackensack, NJ, USA, 2012; p. 90. [Google Scholar]
  28. Alsaad, M.S.D.; Bair, S.; Sanborn, D.M.; Winer, W.O. Glass transitions in lubricants: Its relation to elastohydrodynamic lubrication (EHD). Trans. ASME J. Lubr. Technol. 1978, 100, 404–417. [Google Scholar] [CrossRef]
  29. Prentice, I.J.; Liu, X.; Nerushev, O.A.; Balakrishnan, S.; Pulham, C.R.; Camp, P.J. Experimental and simulation study of the high-pressure behavior of squalane and poly-α-olefins. J. Chem. Phys. 2020, 152, 074504. [Google Scholar] [CrossRef]
  30. Zhang, J.; Spikes, H. Measurement of EHD Friction at Very High Contact Pressures. Tribol. Lett. 2020, 68, 42. [Google Scholar] [CrossRef]
  31. Bair, S.; Vergne, P.; Marchetti, M. The Effect of Shear-Thinning on Film Thickness for Space Lubricants. Tribol. Trans. 2002, 45, 330–333. [Google Scholar] [CrossRef]
  32. Bair, S. The unresolved definition of the pressure-viscosity coefficient. Sci. Rep. 2022, 12, 1–7. [Google Scholar] [CrossRef]
  33. Bridgman, P.W. Viscosities to 30,000 kg/cm2. Proc. Am. Acad. Arts Sci. 1949, 77, 117–128. [Google Scholar]
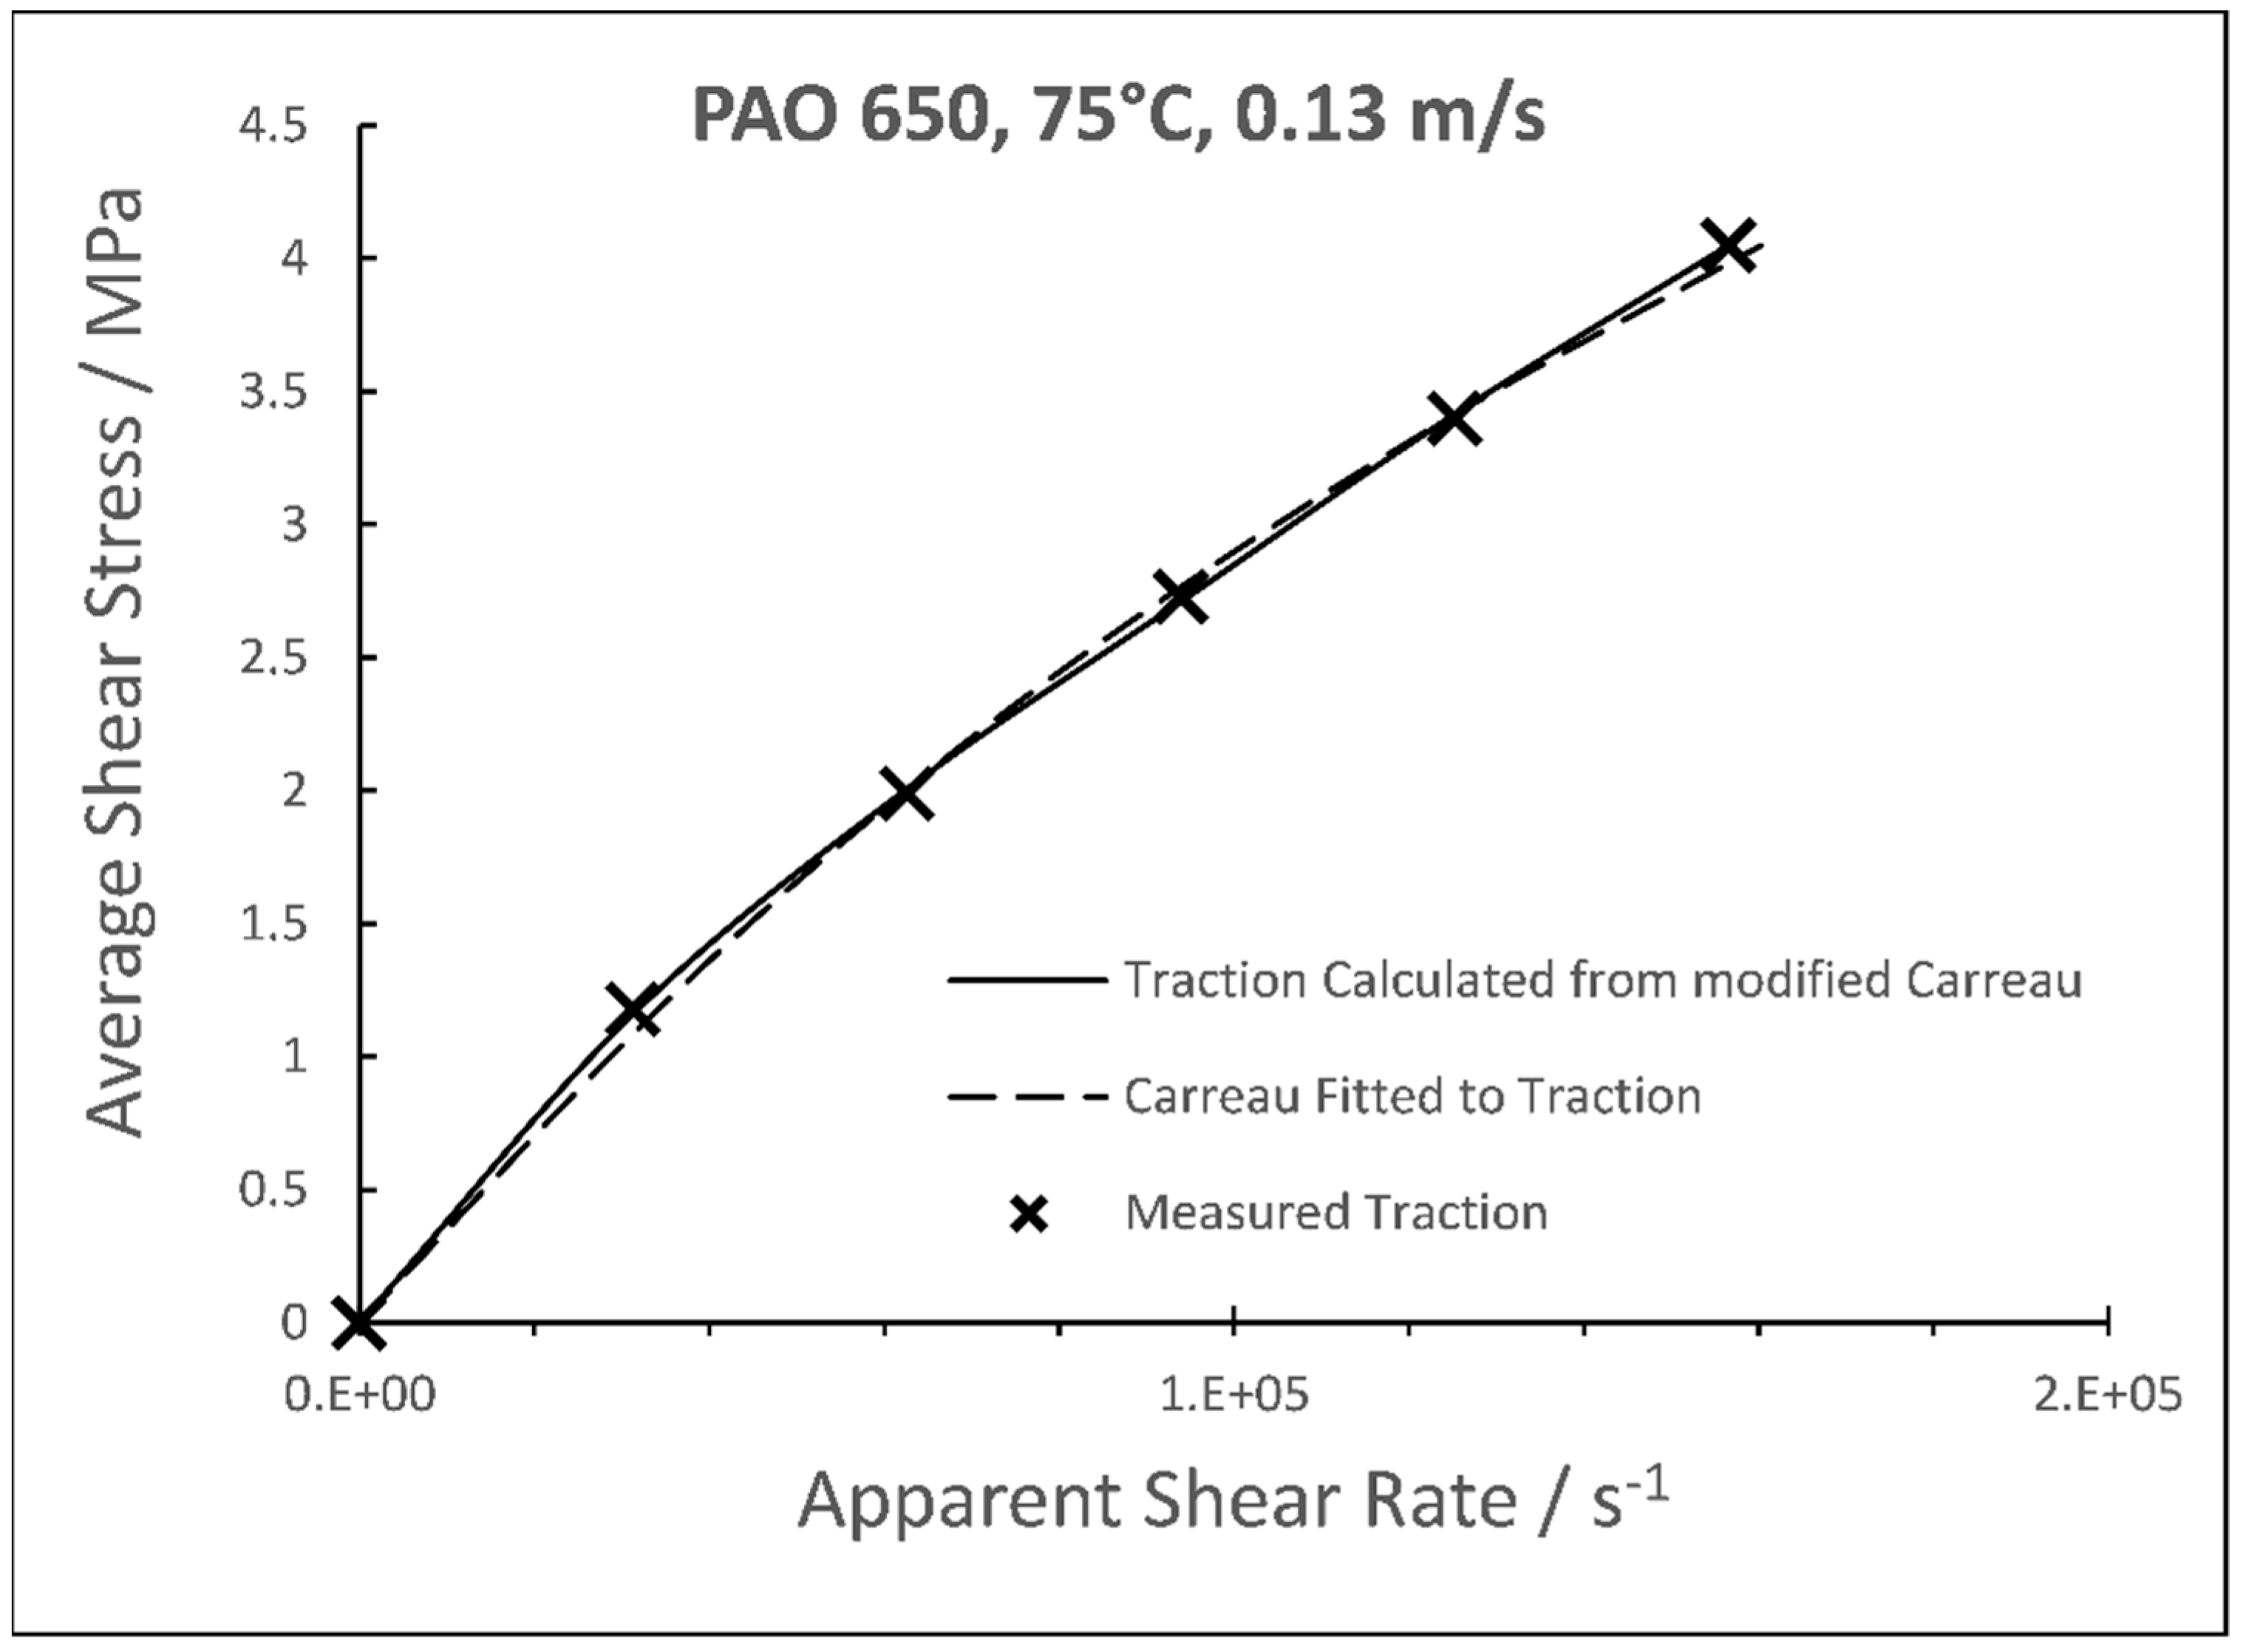
Figure 1. The measured average shear stress value in a traction measurement and predicted average shear stress using the measured Carreau parameters from a viscometer. The same Carreau equation has also been fitted to the traction for comparison in Figure 2.
Lubricants 10 00221 g001
Figure 2. The Carreau fit to the traction curve is compared with the measured viscosity and the Carreau fit to the measured viscosity.
Lubricants 10 00221 g002
Figure 3. The constitutive equation for dibenzylethylbenzene (DBEB), extracted from a friction curve and compared with viscometer measurements.
Lubricants 10 00221 g003
Figure 4. The constitutive equation for LVI 260, extracted from a friction curve and compared with viscometer measurements.
Lubricants 10 00221 g004
Figure 5. The constitutive equation for a low-viscosity PAO, extracted from friction at Imperial College, compared with viscometer measurements.
Lubricants 10 00221 g005
Figure 6. Flow curves for a hydraulic oil that contains 11%, by weight, of poly(alkyl methacrylate) thickener. The solid curves are the modified Carreau Equation (3).
Lubricants 10 00221 g006
Publisher’s Note: MDPI stays neutral with regard to jurisdictional claims in published maps and institutional affiliations.