Article

The Influence of Mullite Shape and Amount on the Tribological Properties of Non-Asbestos Brake Friction Composites

1
Key Laboratory of Spin Electron and Nanomaterials of Anhui Higher Education Institutes, Suzhou University, Suzhou 234000, China
2
School of Mechanical and Electronic Engineering, Suzhou University, Suzhou 234000, China
3
Technology and Research Center of Engineering Tribology, Suzhou University, Suzhou 234000, China
*
Author to whom correspondence should be addressed.
Lubricants 2022, 10(9), 220; https://doi.org/10.3390/lubricants10090220
Submission received: 14 August 2022 / Revised: 5 September 2022 / Accepted: 6 September 2022 / Published: 10 September 2022
(This article belongs to the Special Issue Tribology and Reliability of Mechanical Transmission)

Abstract

:
For investigating the effect of mullite as a reinforced fiber of the non-asbestos brake friction material on the performance of brake pads, mullite reinforced composites with different contents (5% and 10%) and shapes (powder-based and fiber-based) were developed, and the physical and mechanical properties of the composites were analyzed. The tribological properties of the composites were tested by a Chase tester followed by the IS-2742 standard, and the worn surface was investigated by three-dimensional surface topography and SEM. The results show that the brake friction material with 5% powdered mullite performs best, having the highest stable friction performance (0.86), the lowest wear rate (3%), the lowest friction variation performance (0.263), and the best fade-recovery performance. With the increase of mullite content, the friction variation, wear resistance, and friction stability of the composites become worse. Meanwhile, the performance of powder-based mullite composites is better than that of fiber-based. The worn surface analysis shows that the fiber-based mullite composite has a higher surface roughness, fewer contact platforms, more wear debris, and peeling pits. In contrast, the powder-based mullite composites have a better surface performance. It provides a practical basis for mullite-reinforced non-asbestos brake friction materials.

1. Introduction

The braking system is crucial to the safety of vehicle driving, and it converts the kinetic energy of vehicle driving into the heat energy of the friction surface through the friction between brake pads and brake discs, thus realizing vehicle braking [1,2,3]. Brake materials are an essential part of the braking system, and excellent brake materials must meet the requirements of stable friction coefficient, low wear, low noise, and environmental friendliness [4,5,6]. Brake friction materials mainly consist of binders, reinforcing fibers, fillers, and friction performance modifiers; the reasonable composition and ratio have an essential influence on the performance of brake pads, and reinforcing fibers are the focus in the study of brake pads on the friction and wear performance [7,8,9].
Asbestos is now banned as a composition in friction material because it has been recognized as a carcinogen [10,11,12,13], so asbestos fiber substitutes have been studied by many scholars [14], metal fiber [15], ceramic fiber [16], mineral fiber [17], natural fibers [18], and carbon fibers [19] have been extensively studied as asbestos substitutes with fruitful results. Among them, inorganic fibers have been reported to have a stable friction coefficient, good wear resistance, and excellent mechanical strength [20,21,22]. Liu [23] studied the effect of the mineral fiber on tribological behavior and found that the existence of Rockwool fiber could remarkably increase friction coefficient and restraint the heat fade at high temperatures. Paramathma [24] reported that the brake pads with coarser ceramic particles generated good fade resistance and an acceptable recovery rate. Raj [25] found the composite with 10 wt% of CaSO4 whiskers exhibited the most stable friction coefficient even at high sliding speeds. Jara [26] studied the synergistic effects of phenolic resin and potassium titanate on friction and wear of brake friction material and reported that the platy potassium titanate particles assisted the formation of secondary plateaus and led to better wear resistance responses.
Mullite is an inorganic mineral material formed by aluminosilicate at high temperature, with high-temperature thermal stability and low thermal conductivity, and it has been used in brake friction materials [27,28]. Ji [29] found that the whiskers with higher mullite phase contents enhanced the friction stability and the wear rate increased with an increasing aspect ratio of the mullite whisker. Peng [30] studied the amount of mullite on the tribological behaviors of the brake friction material and found that with the increase of mullite content, the wear rate generally decreased first, but subsequently increased after a high content. Kumar [31] found that 3 wt% of mullite abrasive in hybrid brake pad formulation produced reduced density, less squeal, and less frictional undulations with a minimum wear of 0.887 g for 100 brake applications. Zhu [32] reported that the porous flyash-mullite reinforcement greatly improved the friction and wear properties of A356 alloy, the wear rate of the optimal composite was less than half of the one of A356 alloy.
However, the above studies are concerned with either the varying content or the different sizes of the mullite. In this work, two different shapes (powder-based and fiber-based) with two different contents (5%, 10%) are taken for study. Brake pads with these two shapes of different contents were fabricated and characterized for physical and mechanical properties. Tribological properties were carried out on a Chase testing machine, following the IS-2742 standard. Further, the surface morphology study was carried out using a three-dimensional shape scanning instrument and scanning electron microscopy (SEM).

2. Materials and Methods

2.1. Materials and Fabrication

The mullite used in the experiments was provided by Zhejiang Deqing Leijing Crystal Fiber Co., Ltd.(Huzhou, China), where the powder size was less than 60 mesh and the fiber length was 2 mm or less, and the average fiber diameter was 2.9 microns. The scanning electron microscope (SEM) images of the selected mullite powder and fiber are shown in Figure 1. The brake composites formula system consists of seven basic ingredients and two various ingredients and the ingredient information of each formula is given in Table 1.
The fabrication process of the brake friction composites is in three steps:
(1)
Mix the mullite, rock wool, and lapinus fiber in the plough harrow mixer for 10 min and then add other ingredients to keep stirring for another 10 min;
(2)
Heat curing under a pressure of 14.4 MPa at a temperature of 155 °C with four breathings to expel volatile gas and then maintain the pressure of 14.4 MPa for 400 s;
(3)
Heat the samples in an oven at 130 °C for 2 h, then raise the temperature to 160 °C for 20 min and then keeping the temperature at 160 °C for 6 h.
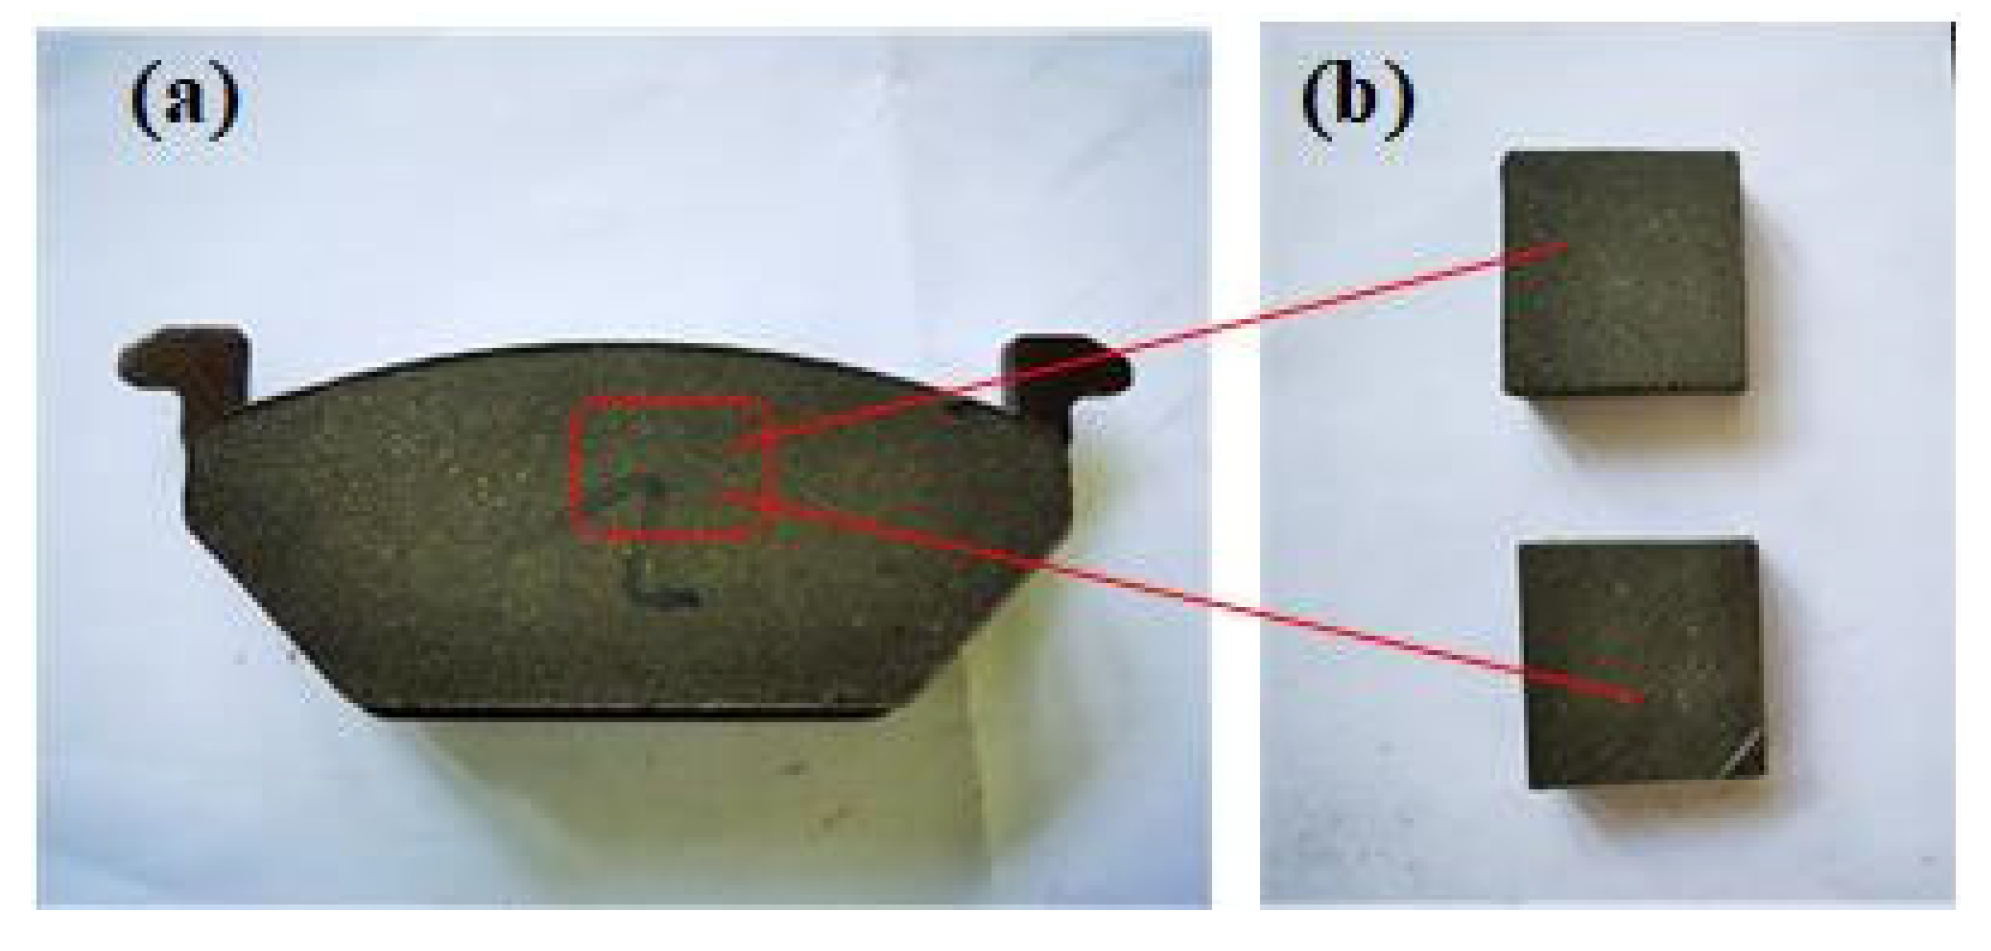
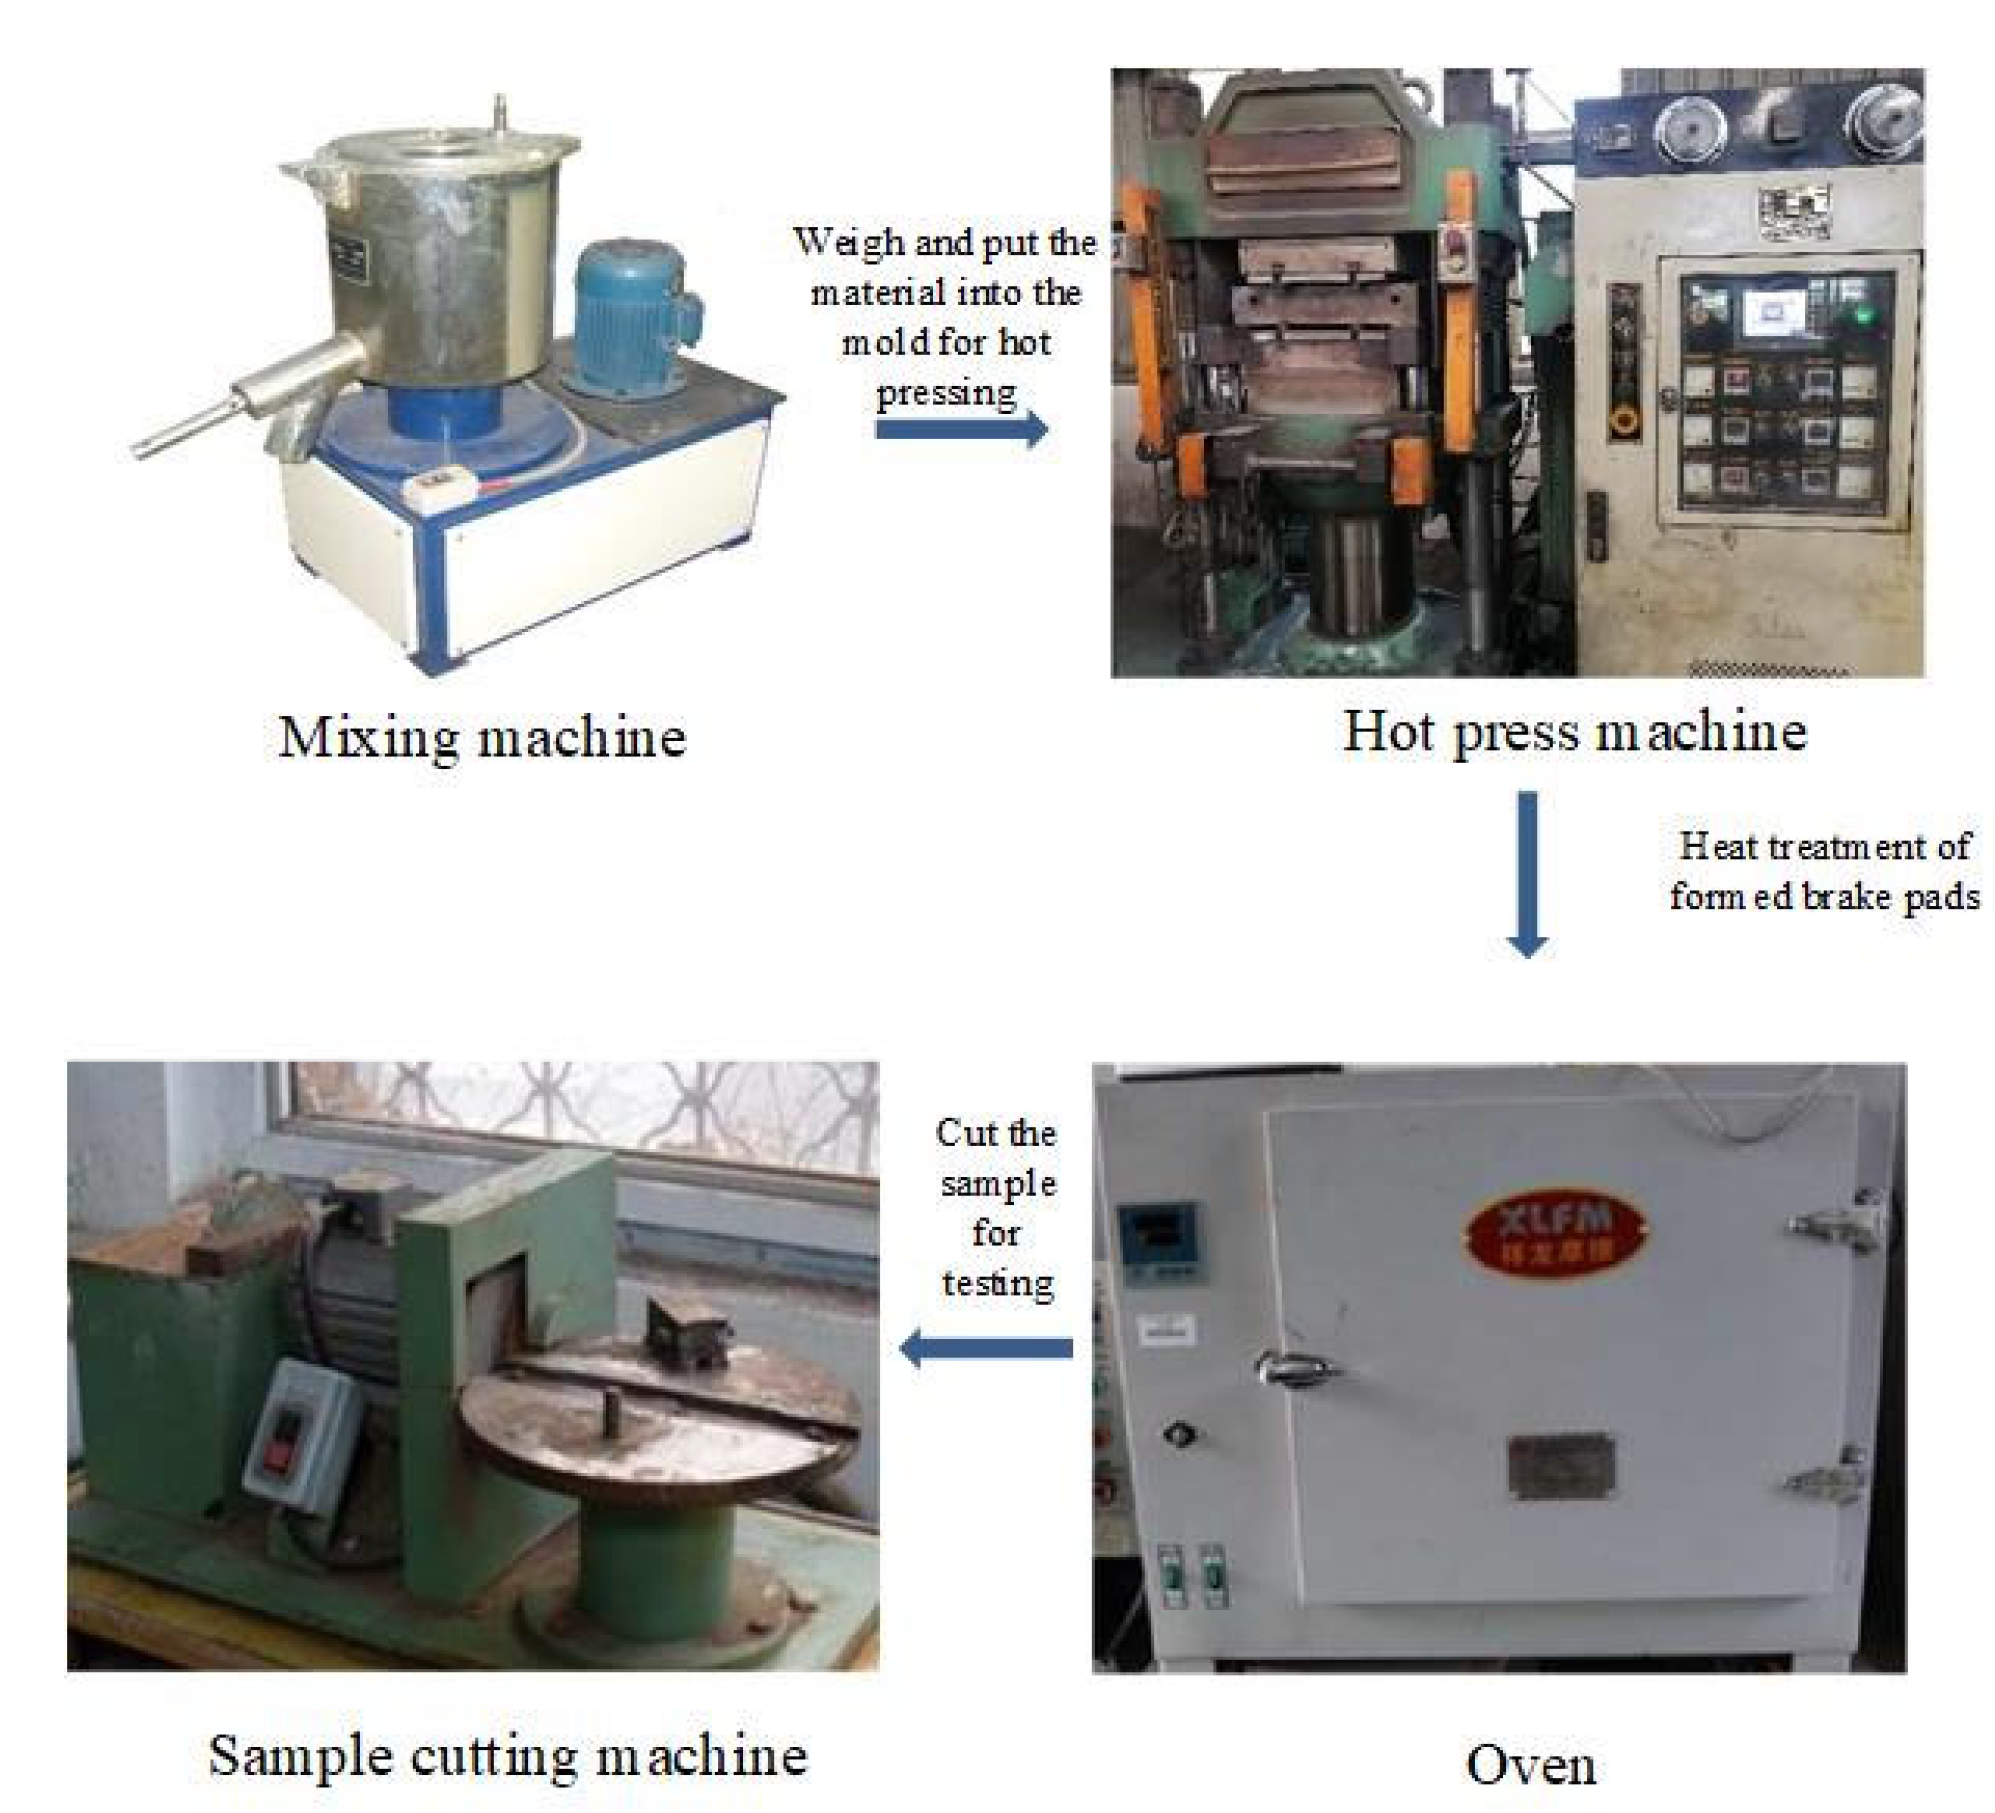
Finally, the samples were cut into the size of 25.4 mm × 25.4 mm × 6 mm and used for tribological performance assessment. The brake pad sample and test samples are shown in Figure 2, meanwhile, the specific sample preparation and treatment process is shown in Figure 3.

2.2. Characterization of Physical, Mechanical and Thermal Properties

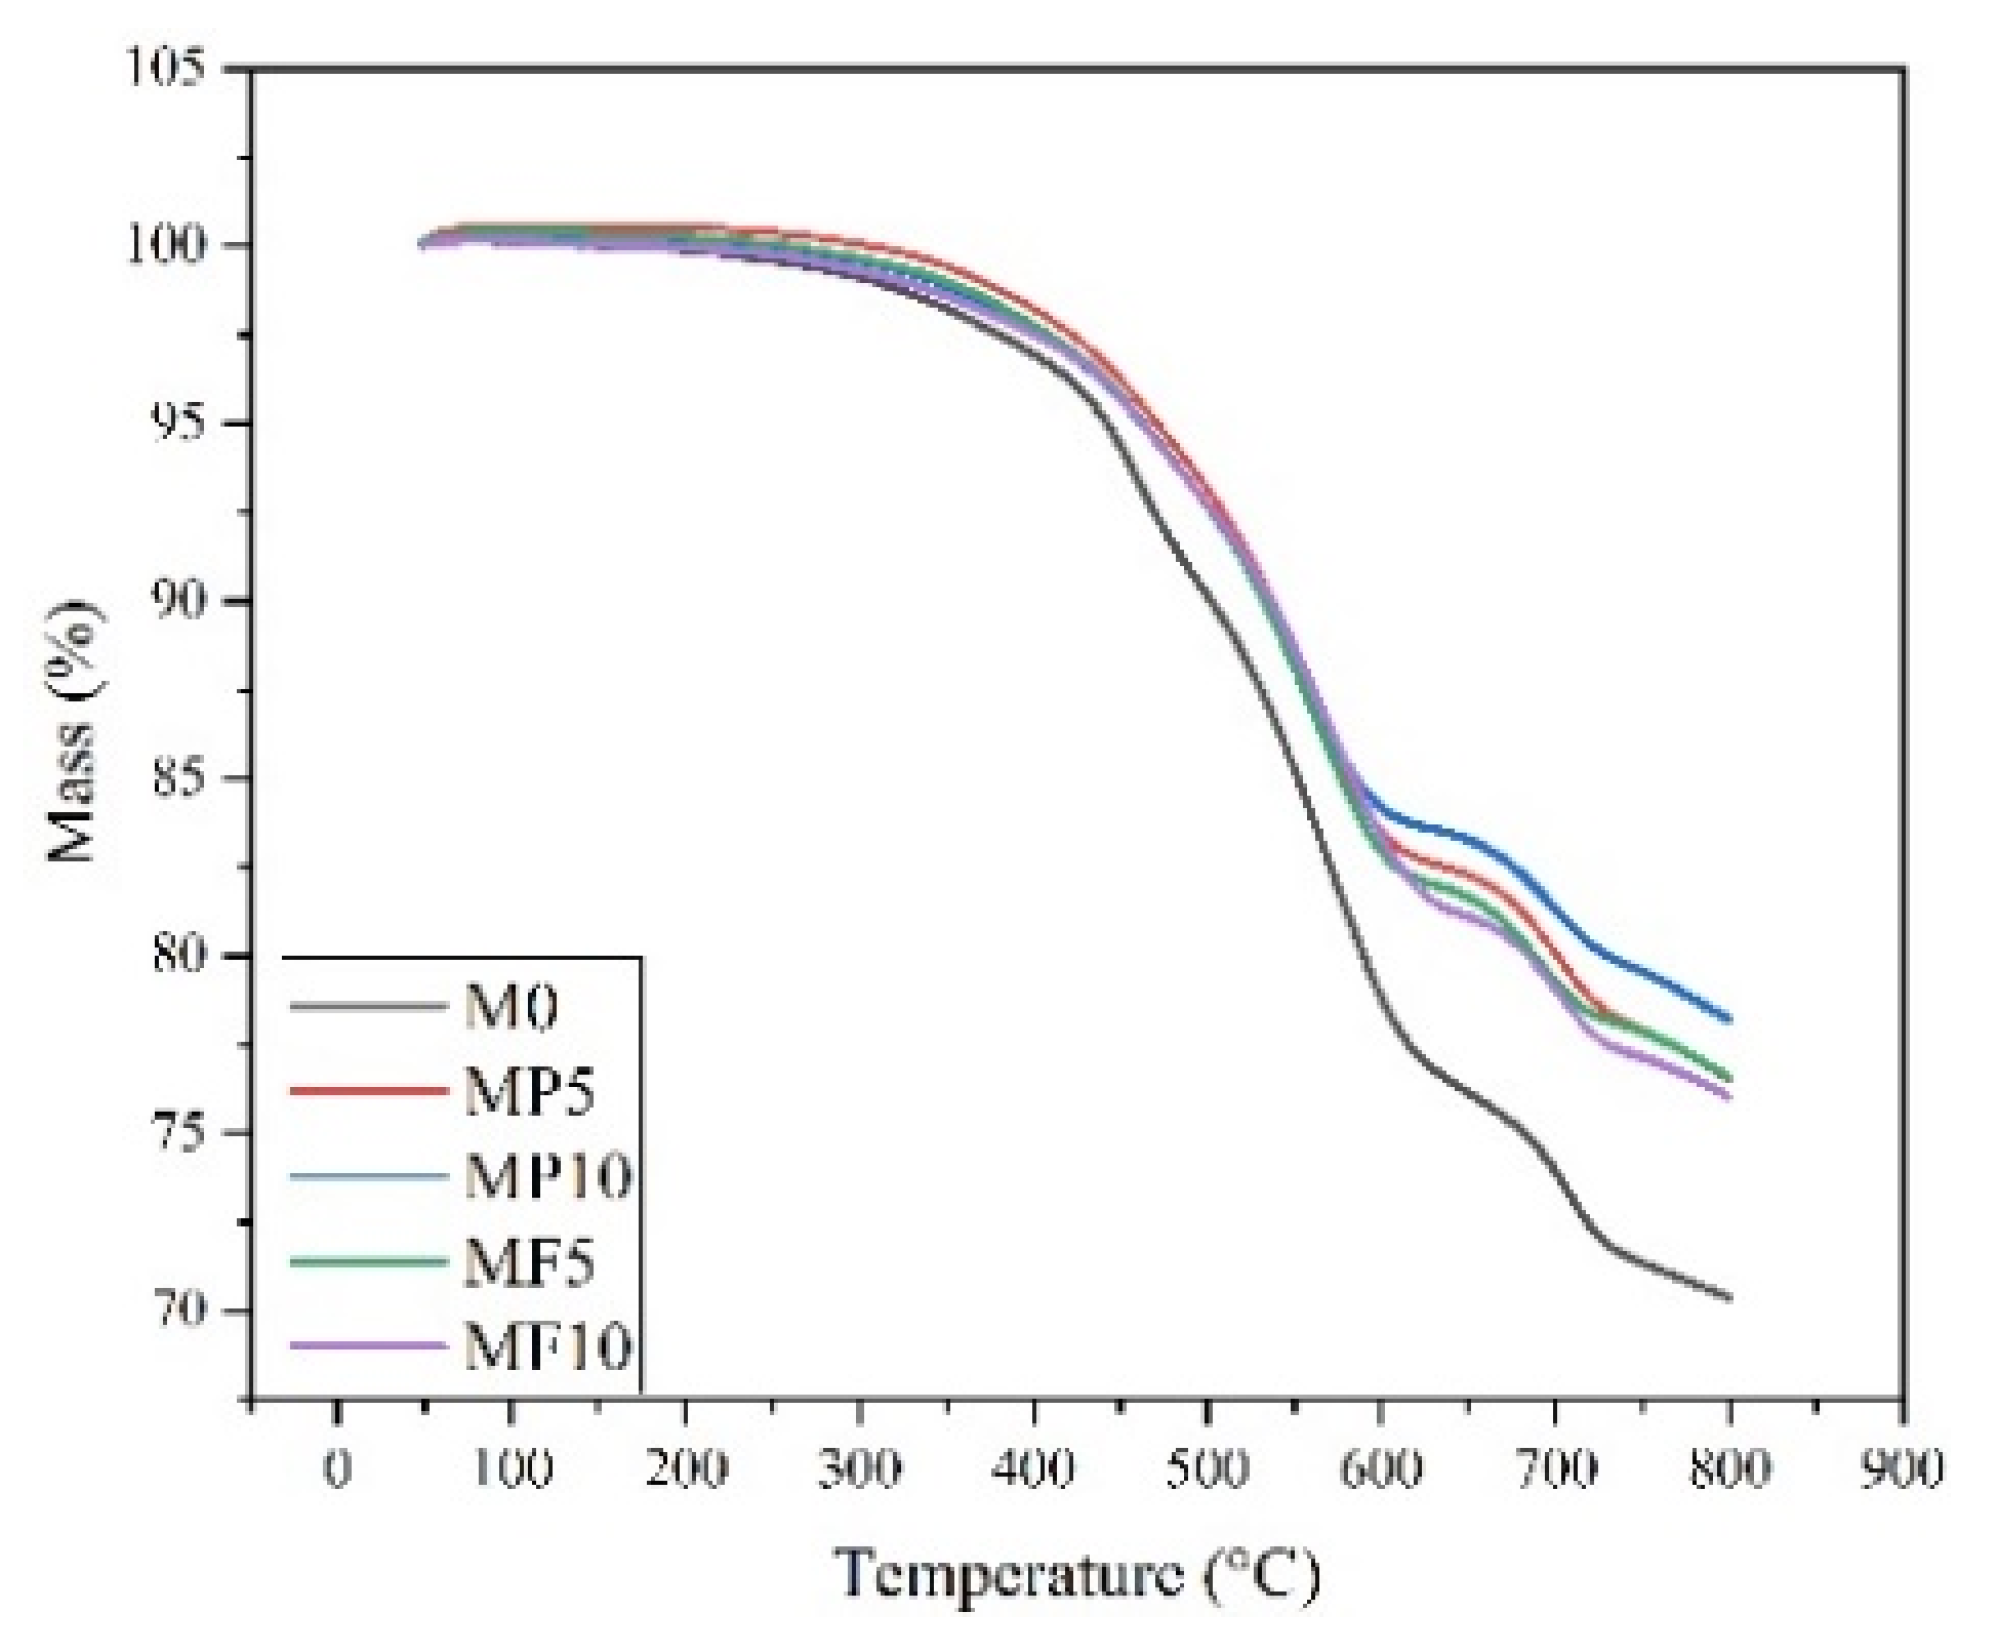
In this work, the density, hardness, water absorption, and shear strength of the prepared brake pad materials were tested to compare the physical and mechanical properties of each sample. The density of the prepared samples was measured at room temperature using the Archimedes method with the densitometer (GP-300S, Xiongfa Instrument Co., Ltd., Xiamen, China). The hardness of brake pads was measured by the Rockwell hardness tester, and the average hardness of five points uniformly distributed on the friction material avoiding holes and slots is taken. The water absorption was measured by immersing the samples in distilled water at 23 °C for 24 h according to the ASTM D 570-98 standard, calculating the increased weight ratio to the original weight. The shear strength of the prepared samples was measured with the shear strength testing machine (XJ-A, Xianyang Xinyi friction & sealing Equipment Co., Ltd., Xianyang, China). In addition, the thermal properties of composites were measured using the TA-60WS model supplied by Shimadzu scientific instruments at a heating rate of 10 °C/min from 50 °C temperature to 800 °C in the presence of air atmosphere.

2.3. Friction and Wear Testing

This experiment used a Chase machine (as shown in Figure 4, China, XJ-A, Xianyang Xinyi friction & sealing Equipment Co., Ltd.) to test the friction and wear performance of the brake pad composites according to the IS-2742 standard [11,12]. The whole test process of one sample includes two baseline tests, two fade and recovery tests, and one wear test according to the IS-2742 standard. The test temperatures of the fade-I are increased by 28 °C from 93 °C to 288 °C, the same as the fade-II from 93 °C to 343 °C. The test temperatures of the recovery-I are decreased by 56 °C from 260 °C to 93 °C, the same as the recovery-II from 316 °C to 93 °C, and other information is shown in Table 2.
The thermocouple attached to the brake drum was used to heat the brake drum to the set temperature measurement with a temperature sensor. When the temperature exceeds the set temperature, the air cooler starts to cool the contact surface. The two cooperate to control the test temperature at the set temperature. When the heater is off, the temperature is controlled by the cooler and friction heat.
The friction coefficient and wear rate are key indexes for evaluating brake pad composites. μ p , μ m i n , and μ m a x are defined as the average value, lowest value, and highest value of friction coefficient recorded for the two fade and two recovery cycles, respectively. Δ μ is the difference between μmin and μmax. Stability CoF (μs) and fluctuation CoF (μv) indicate performance indices of the prepared composite materials, which are calculated according to Formulas (1) and (2) [33].
μ s = μ p μ m a x
μ v = Δ μ μ p
The sample’s mass loss and thickness loss before and after the test were measured by an electronic balance and a spiral micrometer, respectively. The mass wear rate can be calculated as the ratio of lost mass to before test mass and the thickness wear rate can be calculated as the ratio of lost thickness to before test thickness [34].

3. Results and Discussions

3.1. Physical, Mechanical, and Thermal Properties of Composites

The test results of the physical and mechanical properties (density, water absorption, hardness, and shear strength) of the composites are shown in Table 3. It can be seen that the density of the composite materials decreases with the increase of mullite content, among them, the M0 composite (2.34) shows the highest, while the MF10 composite (2.10) shows the lowest density. This is because the density of barite (4.3 g/cm3) is greater than that of mullite (3.0 g/cm3). Meanwhile, the increase of fiber increases the internal pores of the composite material, so the density of fiber-based composites is lower than powder-based composites [14]. The water absorption property of the composite remains at a very low value, varying from 0.82 to 1.0. This is because there are few hydrophilic materials in the composite. The composite’s hardness has a certain increase with the increase of powdered mullite and decreases with the increase of fibrous mullite. Hard materials can show a positive correlation with hardness, while soft materials show a negative correlation with hardness [35]. Meanwhile, with the increase of fiber added, the crosslinking between the resin and the fiber is weakened. MP10 composite has the maximum hardness (84.8), while MF10 composite has the minimum hardness (81.3), due to more pores caused by more mullite fibers [36]. With the increase of fibrous and powdered mullite, the shear strength of the composite decreases, which is caused by the poor combination of excessive mullite and resin.
The thermal properties of composites are shown in Figure 4. It can be seen that before 200 °C, all the composites hardly degraded, mainly due to the loss of combined water in the composites. Between 200–400 °C, the phenolic resin degraded slightly, and the degradation degree is M0 > MF10 > MF5 = MP10 > MP5. However, at 400–600 °C, the resin decomposed violently, and the degradation degree of each sample is basically the same [30]. After 600 °C, it is mainly carbonization of other organic materials and inorganic substances, and the degradation degree is M0 > MF10 > MP5 = MF5 > MP10.

3.2. Tribological Performance of the Composites

3.2.1. Friction Performance of the Formulations

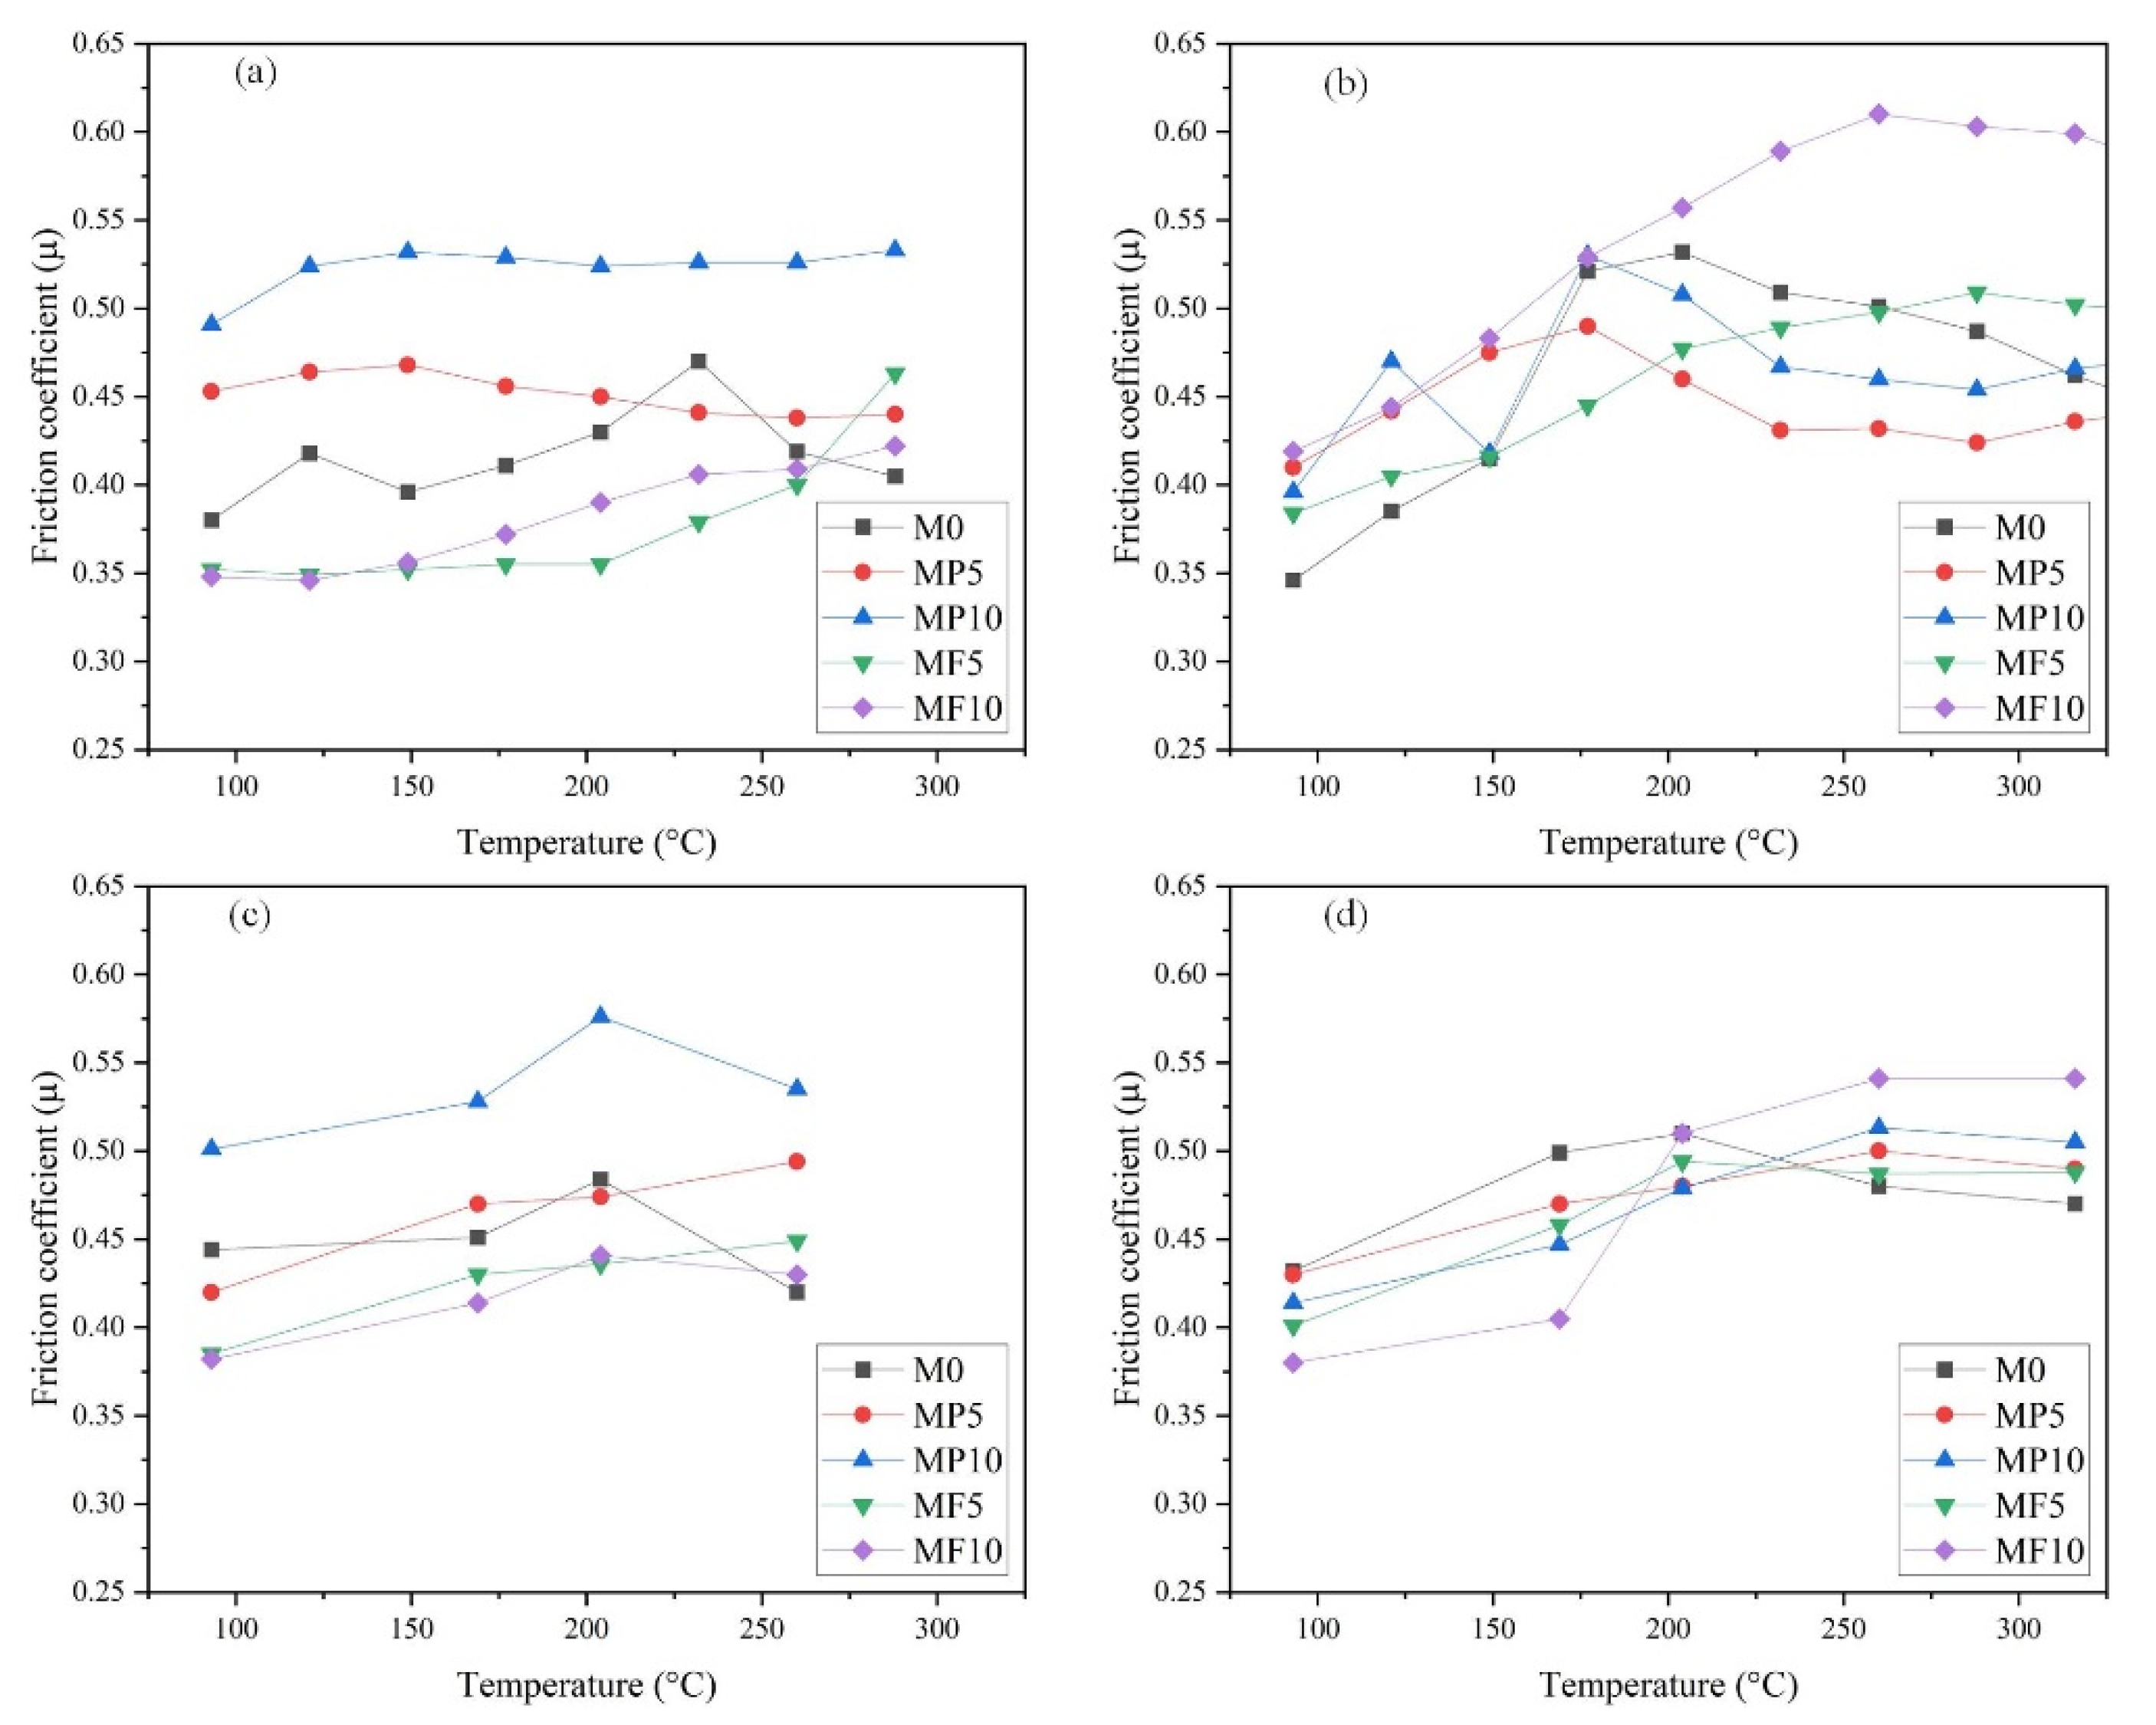
The friction coefficient ( μ ) of the compositions in two fade and recovery cycles is shown in Figure 5. In the first fade cycle, the friction coefficient ( μ ) for the 5% (MP5) and 10% (MP10) powder-based composites increase up to 149 °C and then MP5 decreases till the cycle ends, MP10 remains at a stable value. The μ for MF5 composition increase steadily, and the MF10 composite keeps steady at 206 °C and then grows rapidly to the end. The μ for M0 increases up to 232 °C and then decreases till the end. The μ for powder-based composites is higher than that of fiber-based composites. The hard mullite particles increase the friction coefficient of composites: the more content hard particles, the higher the friction coefficient [27].
In the second fade cycle, the μ start to increase at the beginning for all the composites, which may be due to the loosening of compacted wear debris at the end of the first recovery run [33]. The μ was found to increase for fiber-based composites up to 260 °C, then decrease. With the increase of mullite fiber content, the fiber exposed to the friction surface increases. During the friction with the dual disk, mullite fiber will break, pull, and shear. At the same time, the friction will be increased and the dual disk will be plowed as abrasive particles to further increase the friction coefficient [37]. The μ for MP5 and MP10 composites increase up to 177 °C, then decreases to 232 °C. Thereafter, it keeps steady with a slight increase. The μ for M0 composite was found to increase up to 204 °C, afterwards, it decreases.
In the first recovery cycle, the μ for M0, MF10, and MP10 composites has similar trends that increase up to 204 °C and then decrease to the end. MF5 and MP5 composites decrease slowly from the beginning to the end. In the second recovery cycle, the μ for MF5, MP10, and MP5 was found to increase to 260 °C and then the MP10 had a fast reduction, but for MF5, MF10, and MP5, it reduced slowly. For MP5 composition, the μ keeps stably until 204 °C, thereafter, it reduces until the end. The μ for the M0 composite is the same as MP5. As the temperature decreases, the surface resin is recured to form a resin-rich layer. The friction coefficient of the resin-rich layer is greatly different from the friction coefficient of the original material, resulting in a decrease in the recovery of the friction coefficient.

3.2.2. μ s , μ v , μ p , Δ μ Performance of the Composites

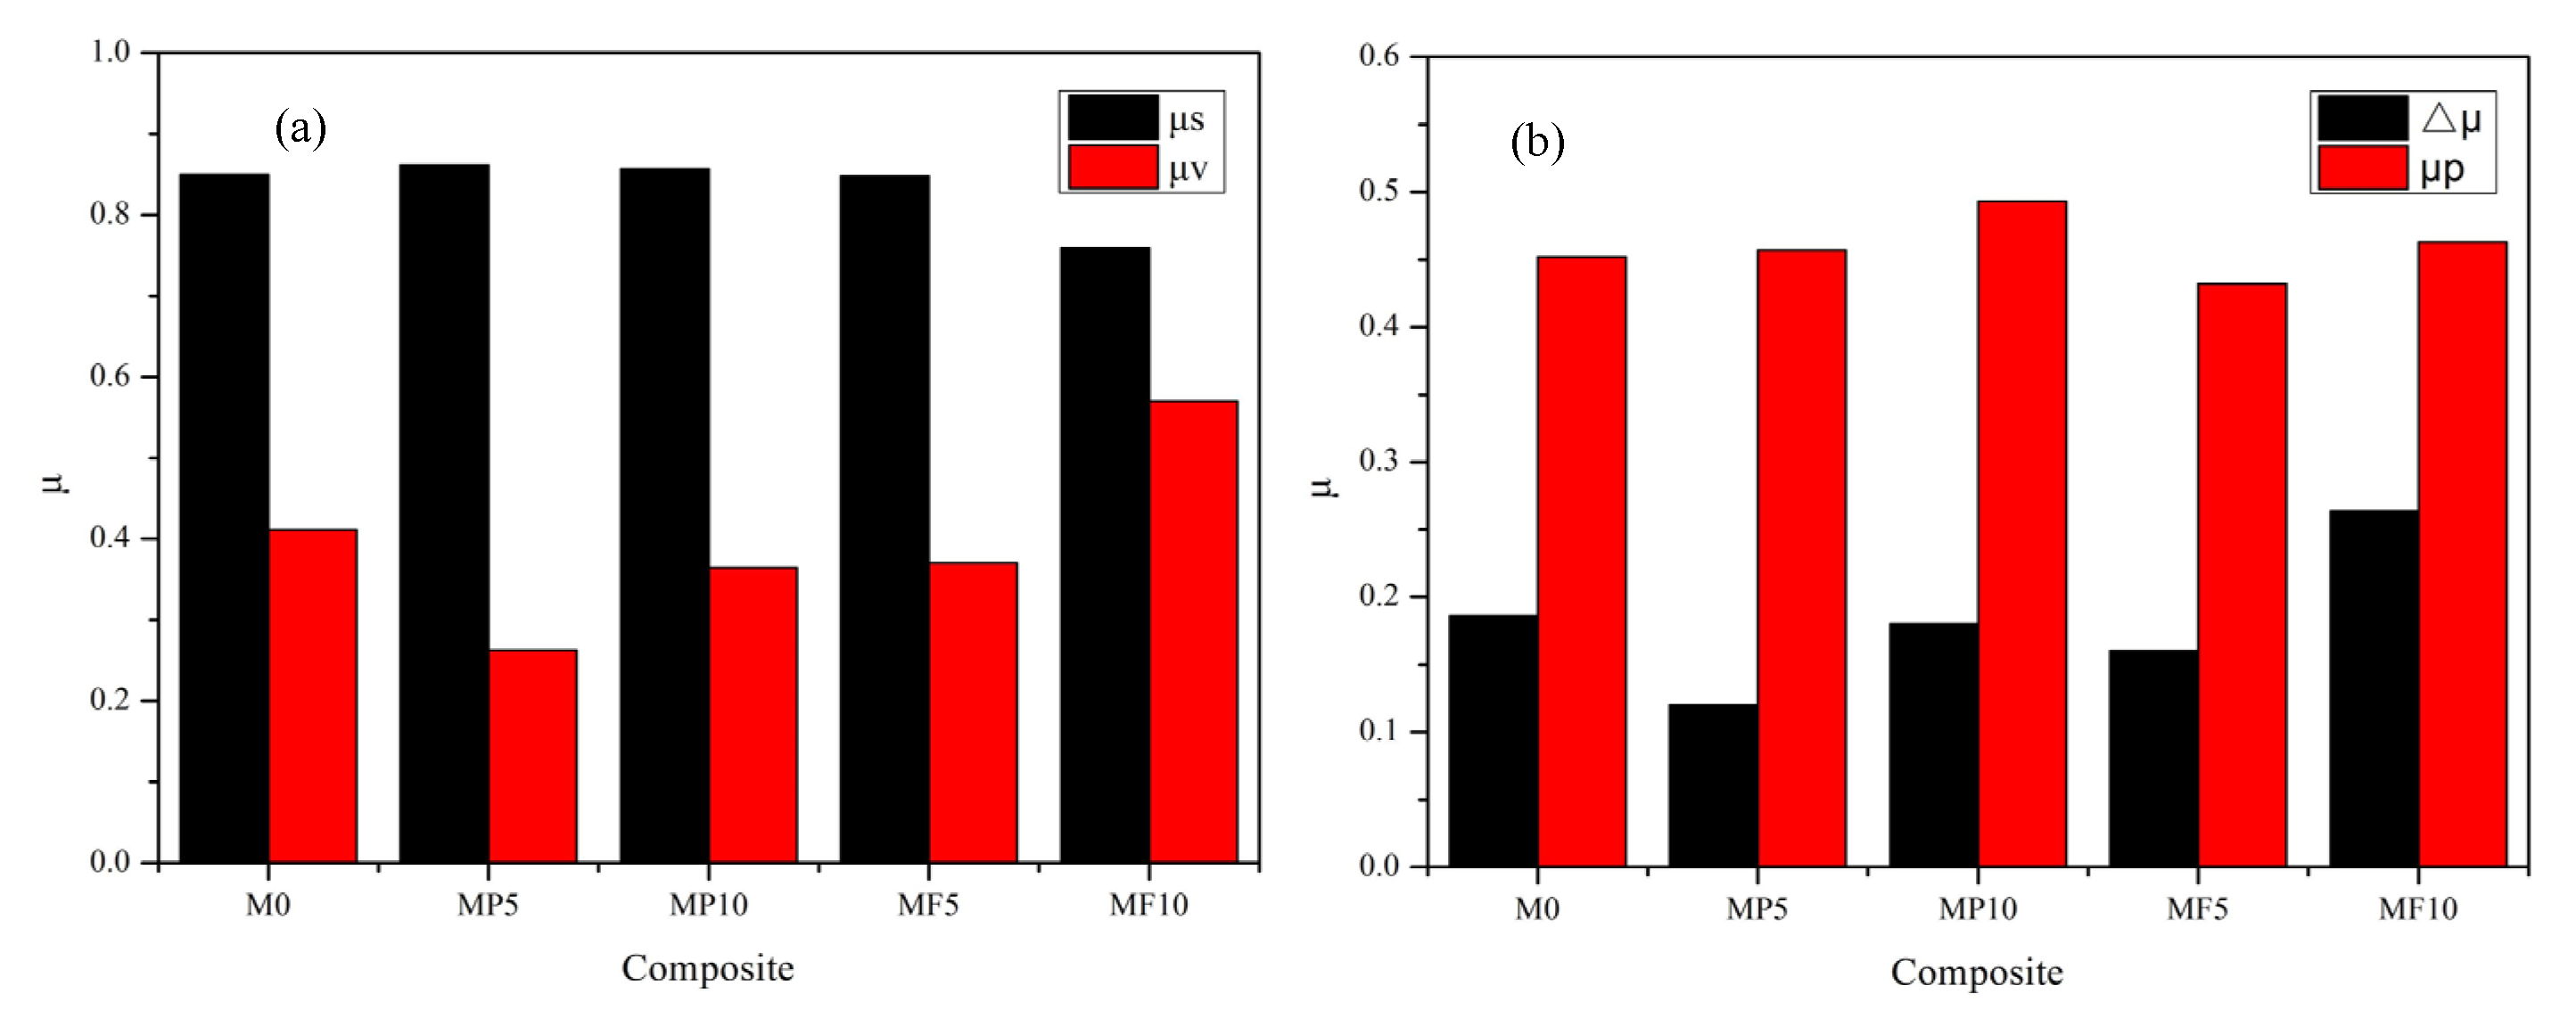
It can be seen from Figure 6a that with the increase of mullite content, the value of   μ s decreases (0.910–0.759), yet the value of μ v increases (0.198–0.570) whether powder-based (MP5 and MP10) or fiber-based (MF5 and MF10) composites. Under the same mullite content, the value of μ v for the powder-based composites is half of the fiber-based composites, and the value of   μ s is higher for the fiber-based composites. Compared with MF10 and MP5 composites, the value of μ v and   μ s for the M0 composite is basically maintained at the same level. In these five samples, the MF5 composite has the highest   μ s (0.91) and the lowest μ v (0.198), which has the best performance, however, the MF10 composite has the lowest   μ s (0.76) and the highest μ v (0.57).
The performance of these five friction composites in terms of the average value (   μ p ) and fluctuation value ( Δ μ ) are shown in Figure 6b. It can be seen that the value of Δ μ has a similar trend as μ v . The Δ μ of the friction composites was found to remain between 0.09 and 0.264, furthermore, the MP5 composition has the lowest Δ μ   (0.09), and the MF10 has the highest value (0.264). The value of   μ p for these five composites is between 0.432 and 0.463, which shows good friction performance, meanwhile, the value increased with the rise in mullite content. The fiber-based composites have a higher value (0.455–0.493) than the powder-based composites (0.432–0.463).
With the increase of fiber content, the thermal sensitivity becomes poor due to fiber agglomeration, which leads to greater friction coefficient fluctuation [11], so the MF10 sample has the highest fluctuation CoF. The mullite powder can be well filled in the composite, reducing the porosity of the material and increasing the thermal stability, so the powder-based composites have smaller friction fluctuation than fiber-based composites. With the increase of mullite hard powder, the friction film is continuously damaged [7], and the hard particles that continuously peel off as the third body causes the stability CoF (μs) for MP10 to be worse than the MP5 sample.

3.2.3. Fade and Recovery Performance of the Composites

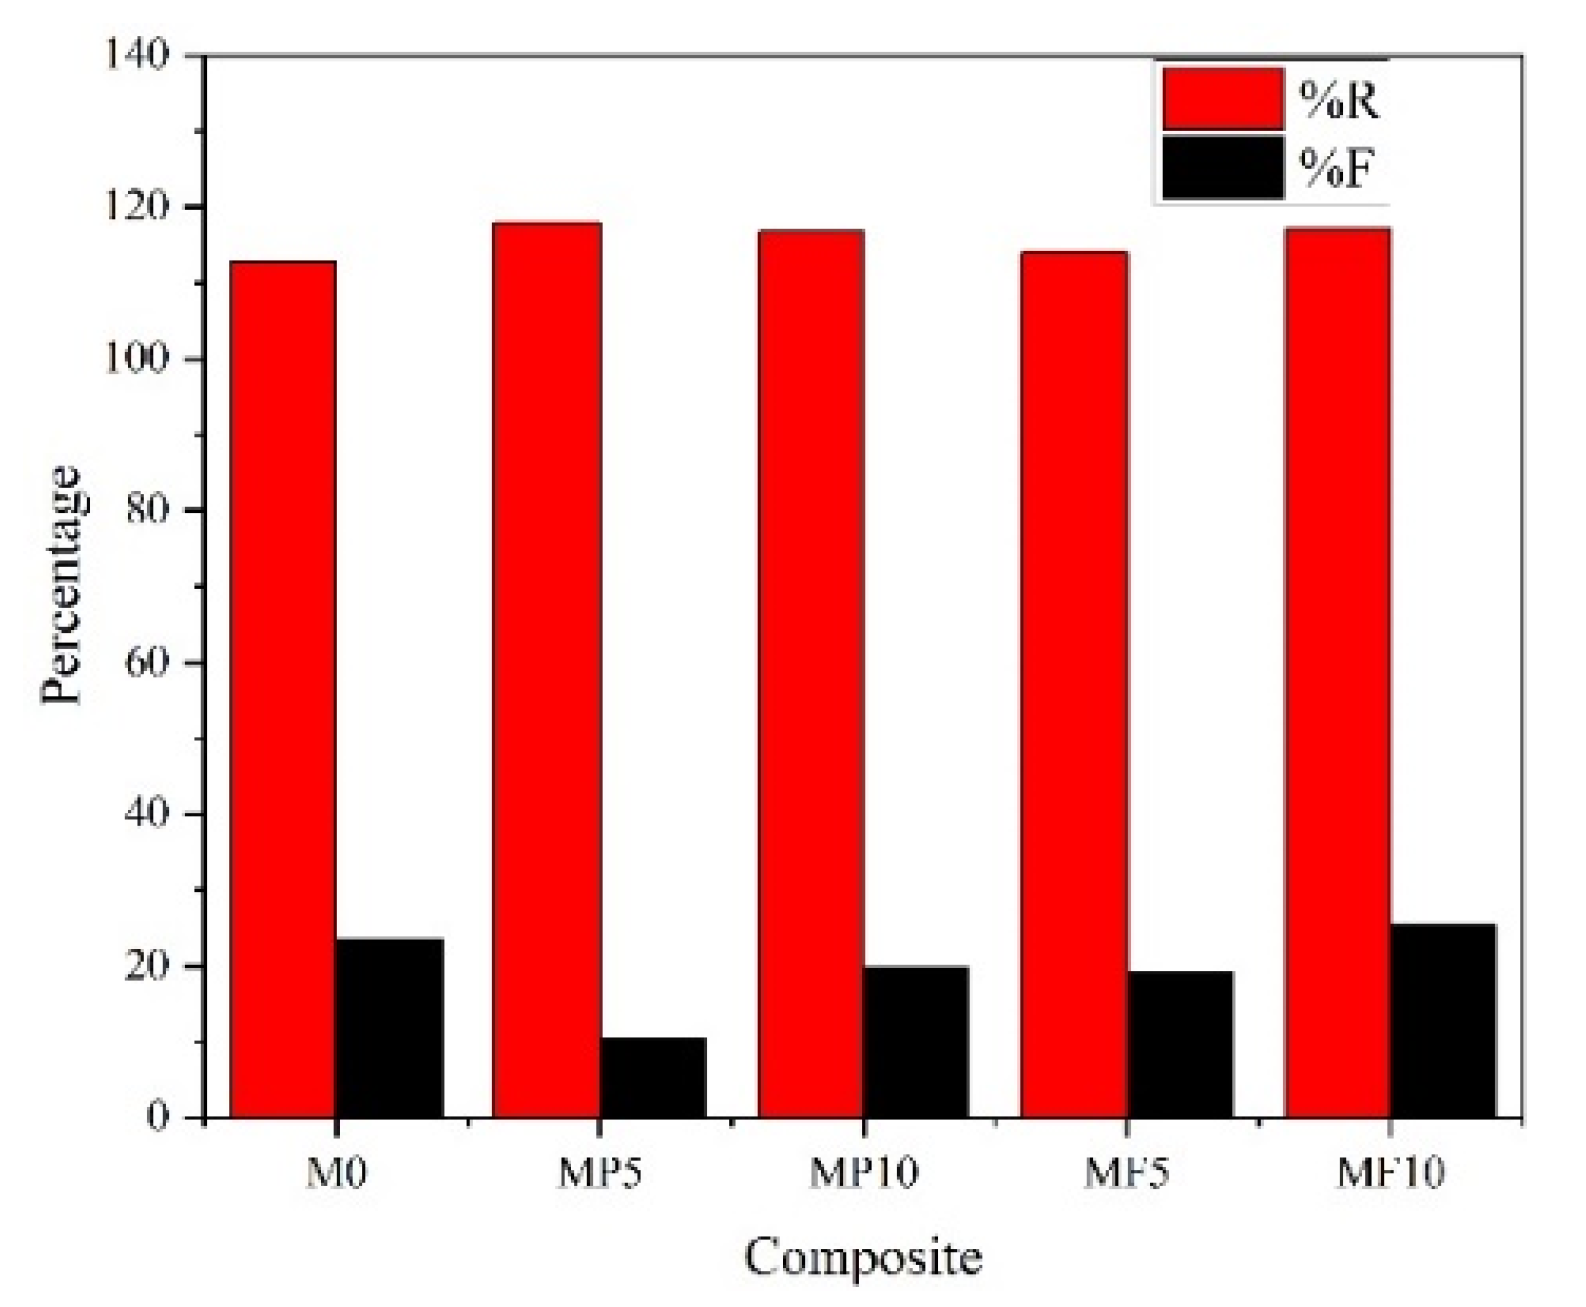
F% and R% indicate the fade and recovery performance of friction coefficient, respectively, which are calculated according to Formulas (3) and (4), the ideal brake pad has a higher recovery performance and a lower fade performance [38].
% F = μ p μ F μ p
% R = μ R μ p × 100
Among them, μ F is defined as the minimum friction coefficient recorded during two fade cycles; μ R   is defined as the maximum friction coefficient recorded during two recovery cycles.
It was observed from Figure 7 that the F% for MP5, MP10, and MF5 composites remain at a lower level (10.4, 19.7, and 19.1), whereas, the M0 and MF10 composites increase to a higher level. For 10% fibrous composite, the F% increased to 25.3, nearly 2.5 times that of composite MP5. The R% for these five composites exceeded 110, which performs a better recovery performance [7]. The R% for M0 and MF5 composites were in the range of 110–115, whereas the MP5, MP10, and MF10 composites have a higher value (115–120). The MP5 composite has the highest recovery performance (118). It can be seen that with the increase of fibrous mullite content, the F% and R% increase. The increase of fiber in the composite causes a heterogeneity matrix, resulting in more wear debris, peeling pit, and wear, which has been reported in many articles [11,38,39]. The lower fading and higher tendency in powder-based composites can be explained in that it forms more contact plateaus as compared to fiber-based friction composites MF5 and MF10.

3.3. Wear Performance of the Composites

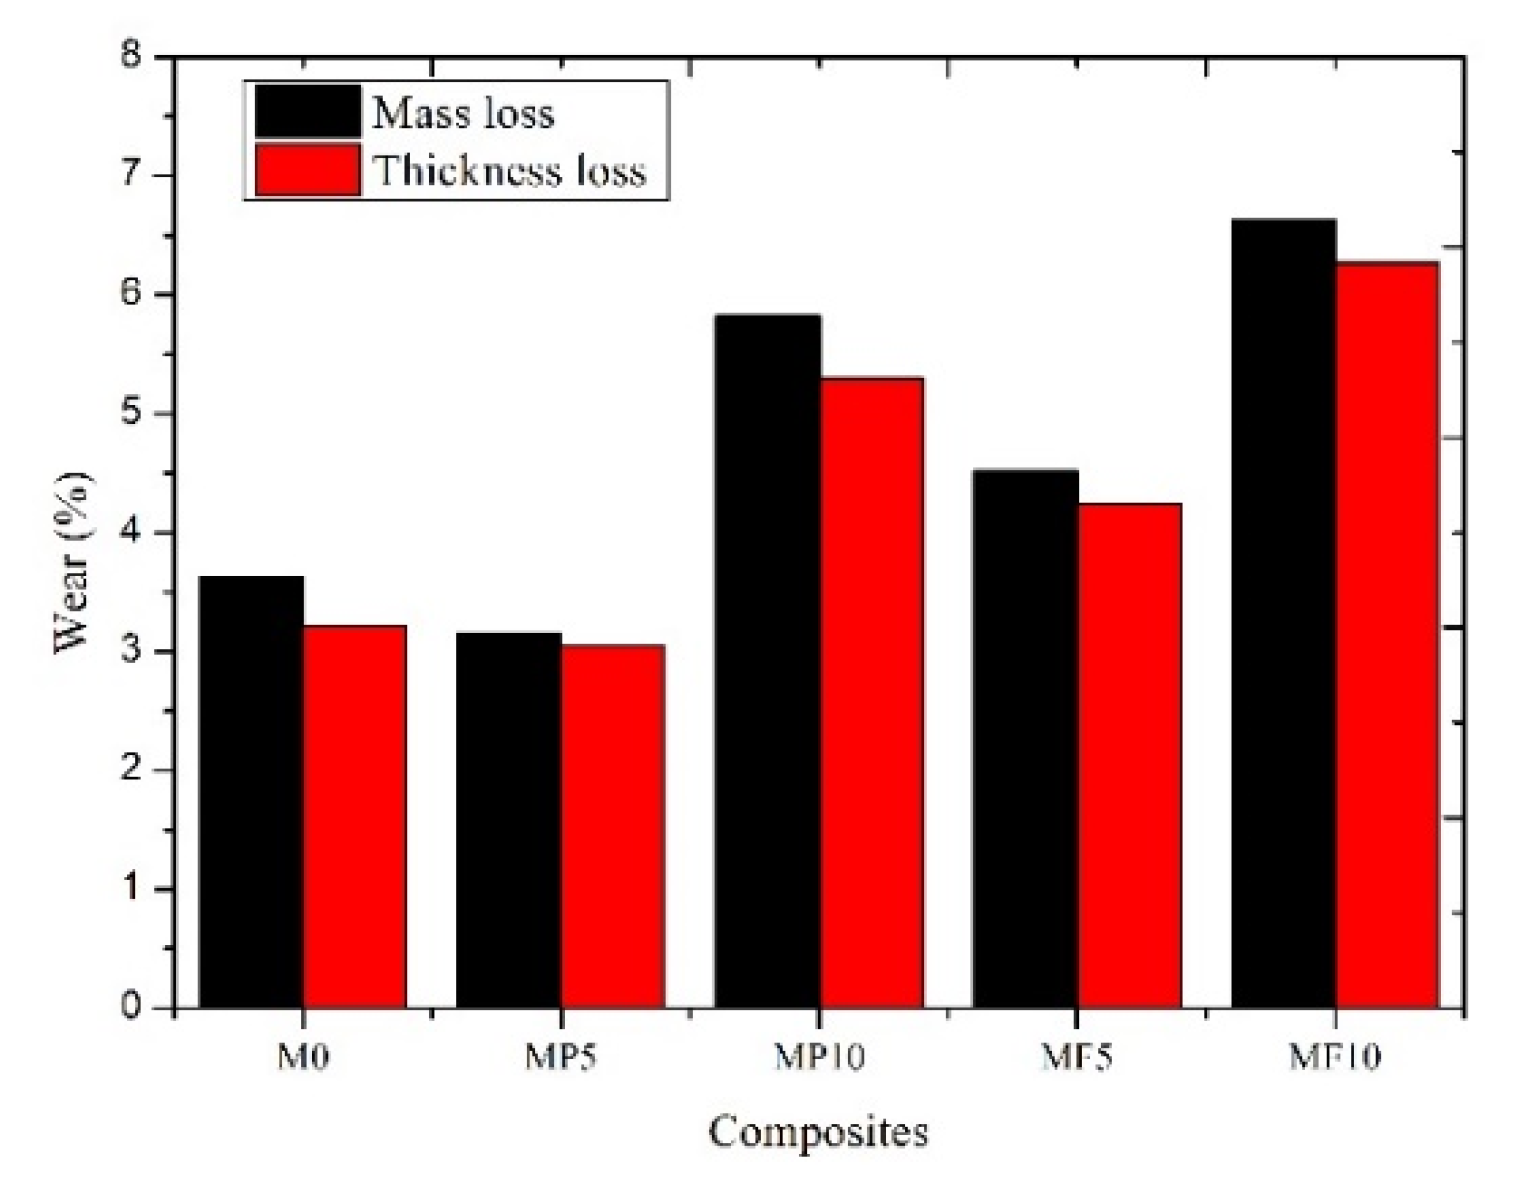
Figure 8 shows the wear performance of composite materials in the test according to the IS-2742 standard, mainly including mass loss and thickness loss. It can be seen that the mass loss rate and the thickness loss rate have the same change trend. The M0 composite has the lowest wear rate (3.1%), and the MF10 composite has the highest wear rate (6.52%). With the increase of mullite content, the wear rate gradually increases, indicating that mullite can increase the wear of the composite. Under the same mullite content, the wear rate of the composite with powder-based mullite is lower (the wear rate of MP5 is 70% of that of MF5) and has a higher wear resistance.
It can be explained as follows: with the increase of fiber content, the fibers will agglomerate and disperse unevenly, resulting in the reduction of the binding capacity with the resin. Under the action of shear force, the fibers will fall off, resulting in the aggravation of wear. On the other hand, mullite fiber is a kind of material with a low thermal conductivity and a low heat capacity [27]. The more mullite fiber content in the sample, the lower the heat conduction rate of the friction material, and the more easily the friction heat accumulates on the surface of the friction material. Finally, the surface temperature of the friction material increases, the strength decreases, and the wear rate increases [28]. Due to the high hardness of mullite, with the increase of mullite hard particles, the degree of abrasive wear on the surface of the brake disc and composite material increases, and the hard particles peel off, resulting in increased surface wear.
Table 4 gives the results of friction and wear performance of the Chase test, including various friction coefficients, mass, and thickness loss of samples. It can be seen that the MP5 sample has the best friction and wear performance, with the lowest wear and highest friction stability. The MF10 sample has the worst tribological performance. A lower content of mullite can stabilize friction coefficient and reduce wear, yet a higher content of mullite can intensify friction fluctuation and wear.

3.4. Worn Surface Study

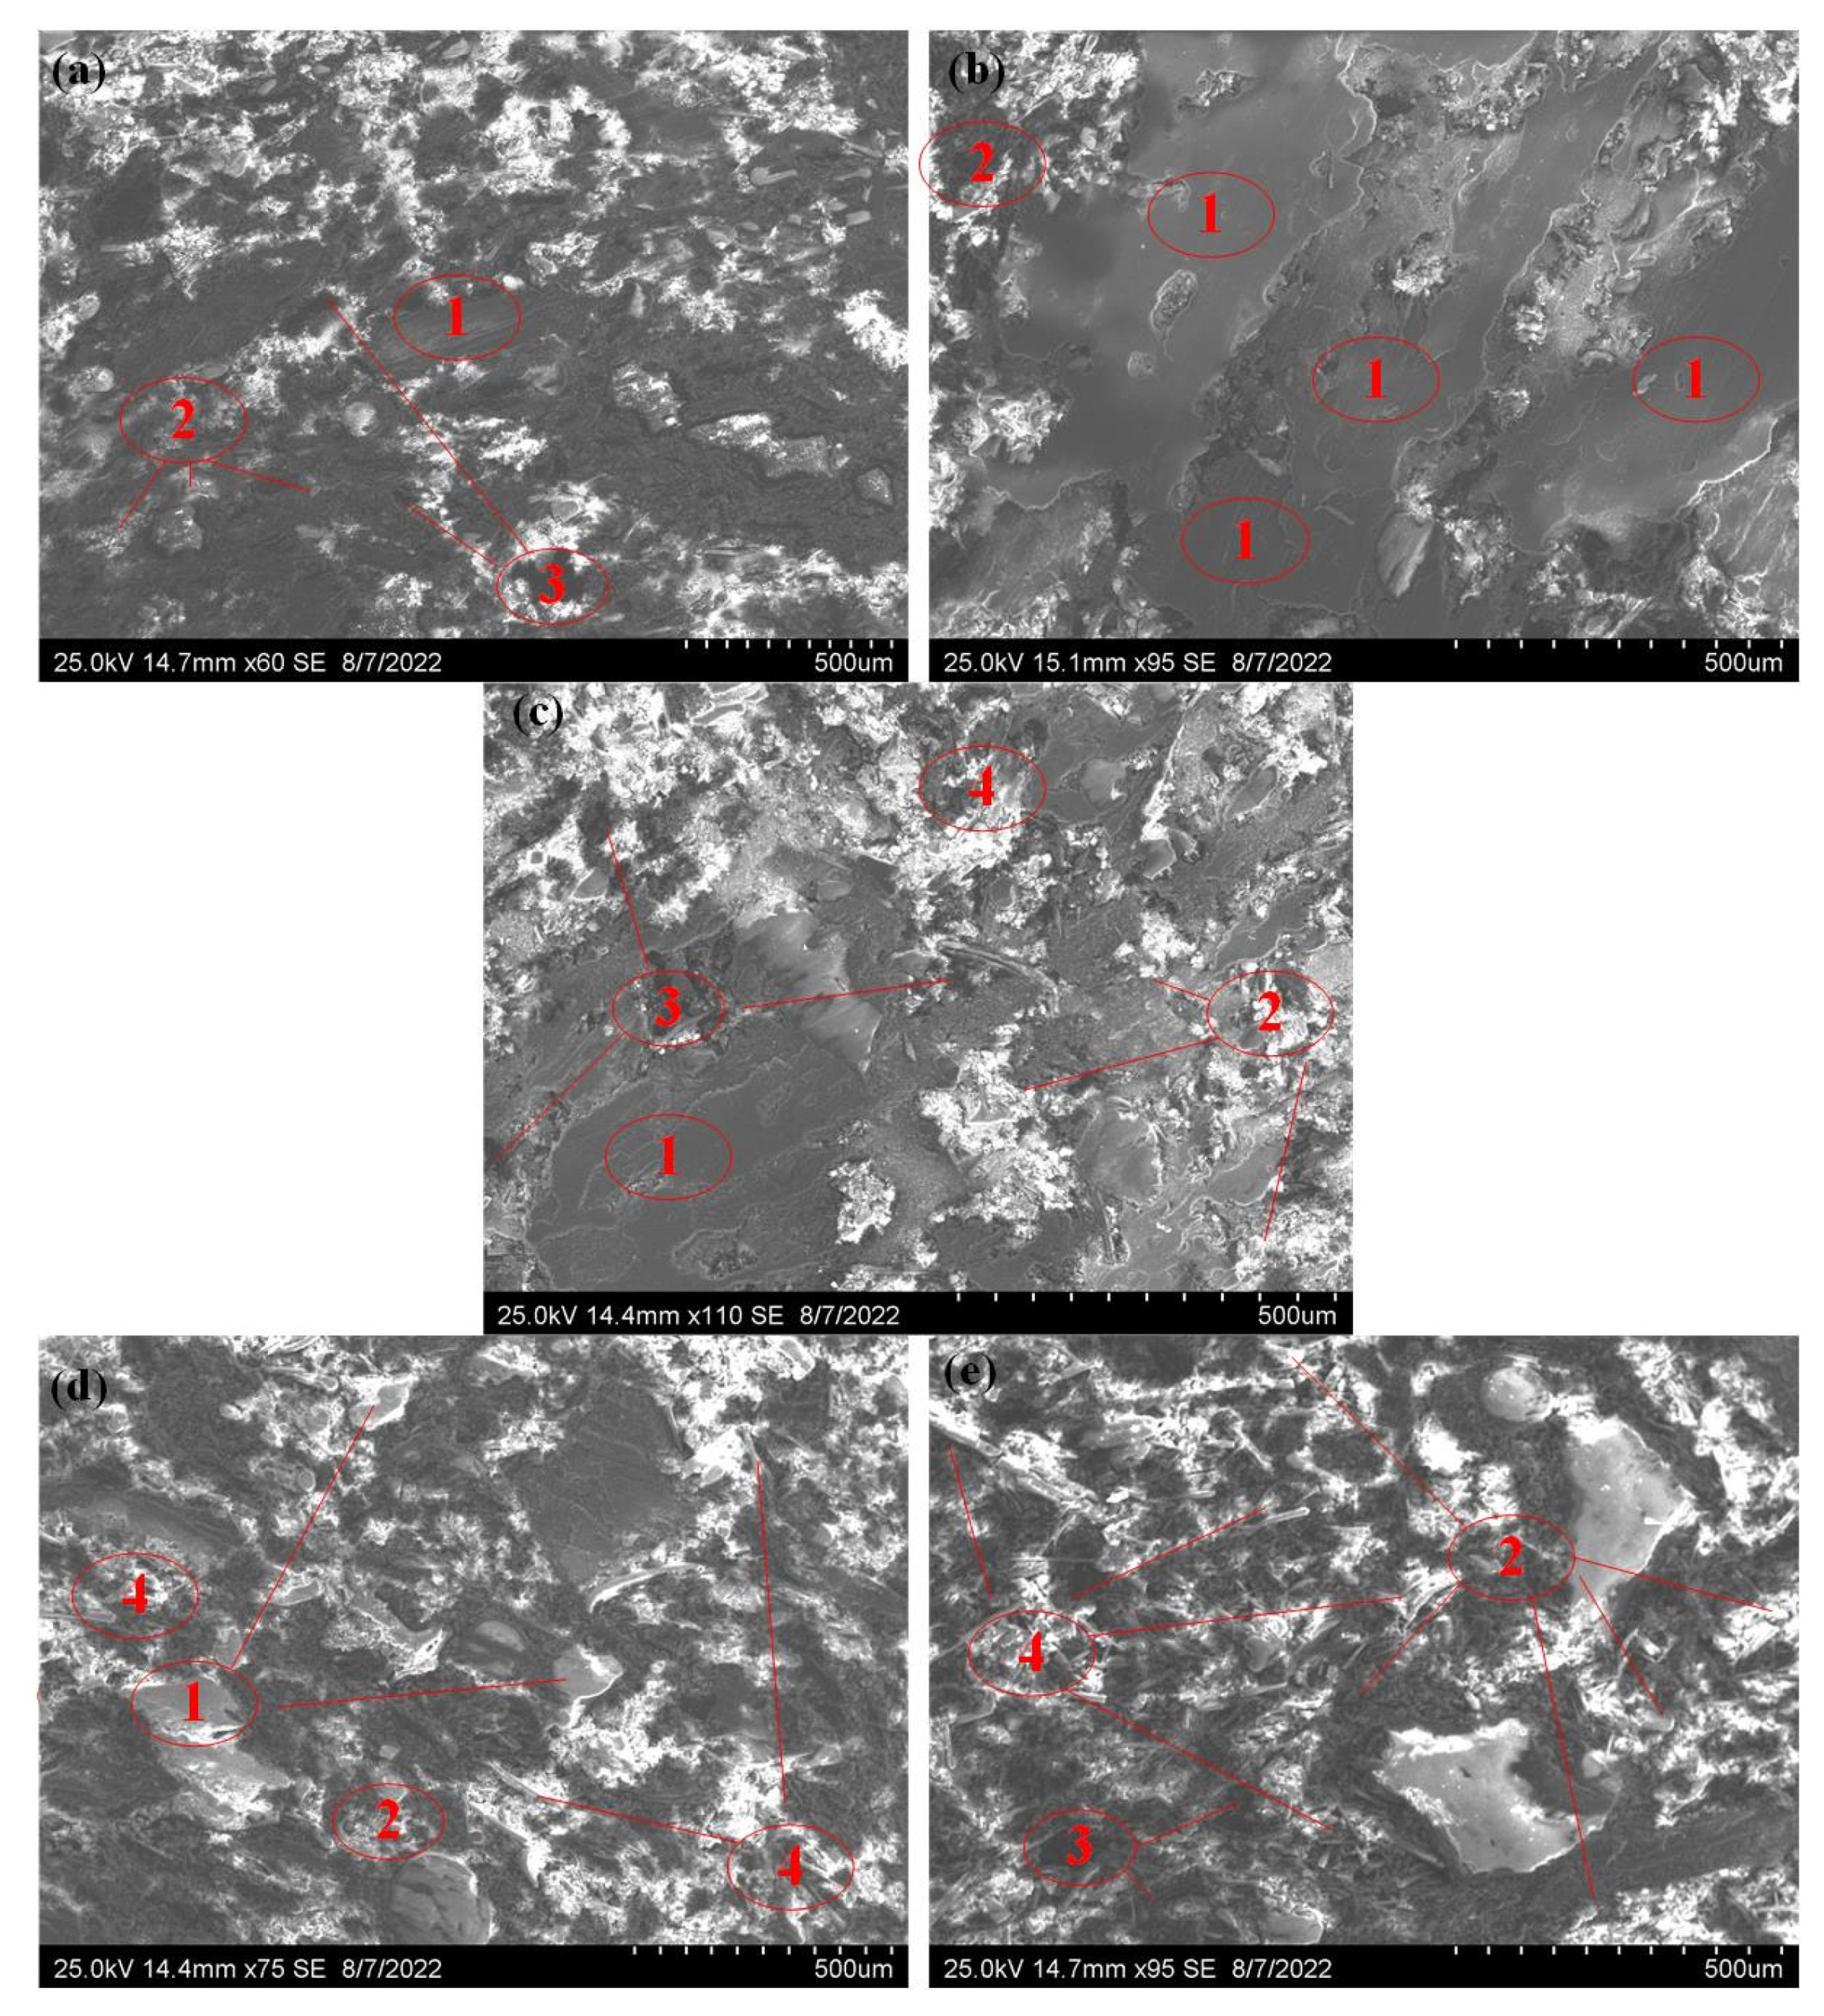
The worn surface morphology plays an important role in studying the tribological properties of brake pads [23]. The surface morphology of mullite reinforced composites was studied by scanning electron microscope and its worn mechanism was analyzed. The wear surface of the composites include contact platform, peeling pit, wear debris, exposed fibers, and other typical morphological features of brake pads in braking, as shown in Figure 9.
The worn surface of the M0 composite is relatively flat, forming a certain discontinuous contact platform. There are small peeling pits and a small number of wear debris embedded on the surface of the composite, but there are no exposed fibers, which shows a certain friction stability. Compared with the M0 composite, the MP5 composite formed a smooth surface and a large number of continuous contact platforms, without peeling fibers and exposed fibers. After many times of friction, the falling particles are concentrated on the friction surface, under the action of friction resistance, they fill the pits on the surface of the friction material, forming a uniform and continuous surface friction film. Due to the existence of hard particles, this film plays a role in stabilizing the friction coefficient and reducing the wear rate. This is consistent with the highest friction stability and a small minimum fluctuation in the friction performance test. MF5 and MP10 composites have similar worn surfaces with incomplete contact platforms, wear debris, peeling pits, and a small number of exposed fibers. However, MP10 composite has a large peeling pit, which intensifies the surface wear due to the increase of mullite hard particles. The surface of MF10 composite has large spalling pits, a large number of exposed fibers, and wear debris; this is because with the increase of fiber content, the binding capacity of resin and fiber decreases, which corresponds to the lowest friction stability and the highest friction fluctuation during the friction test.
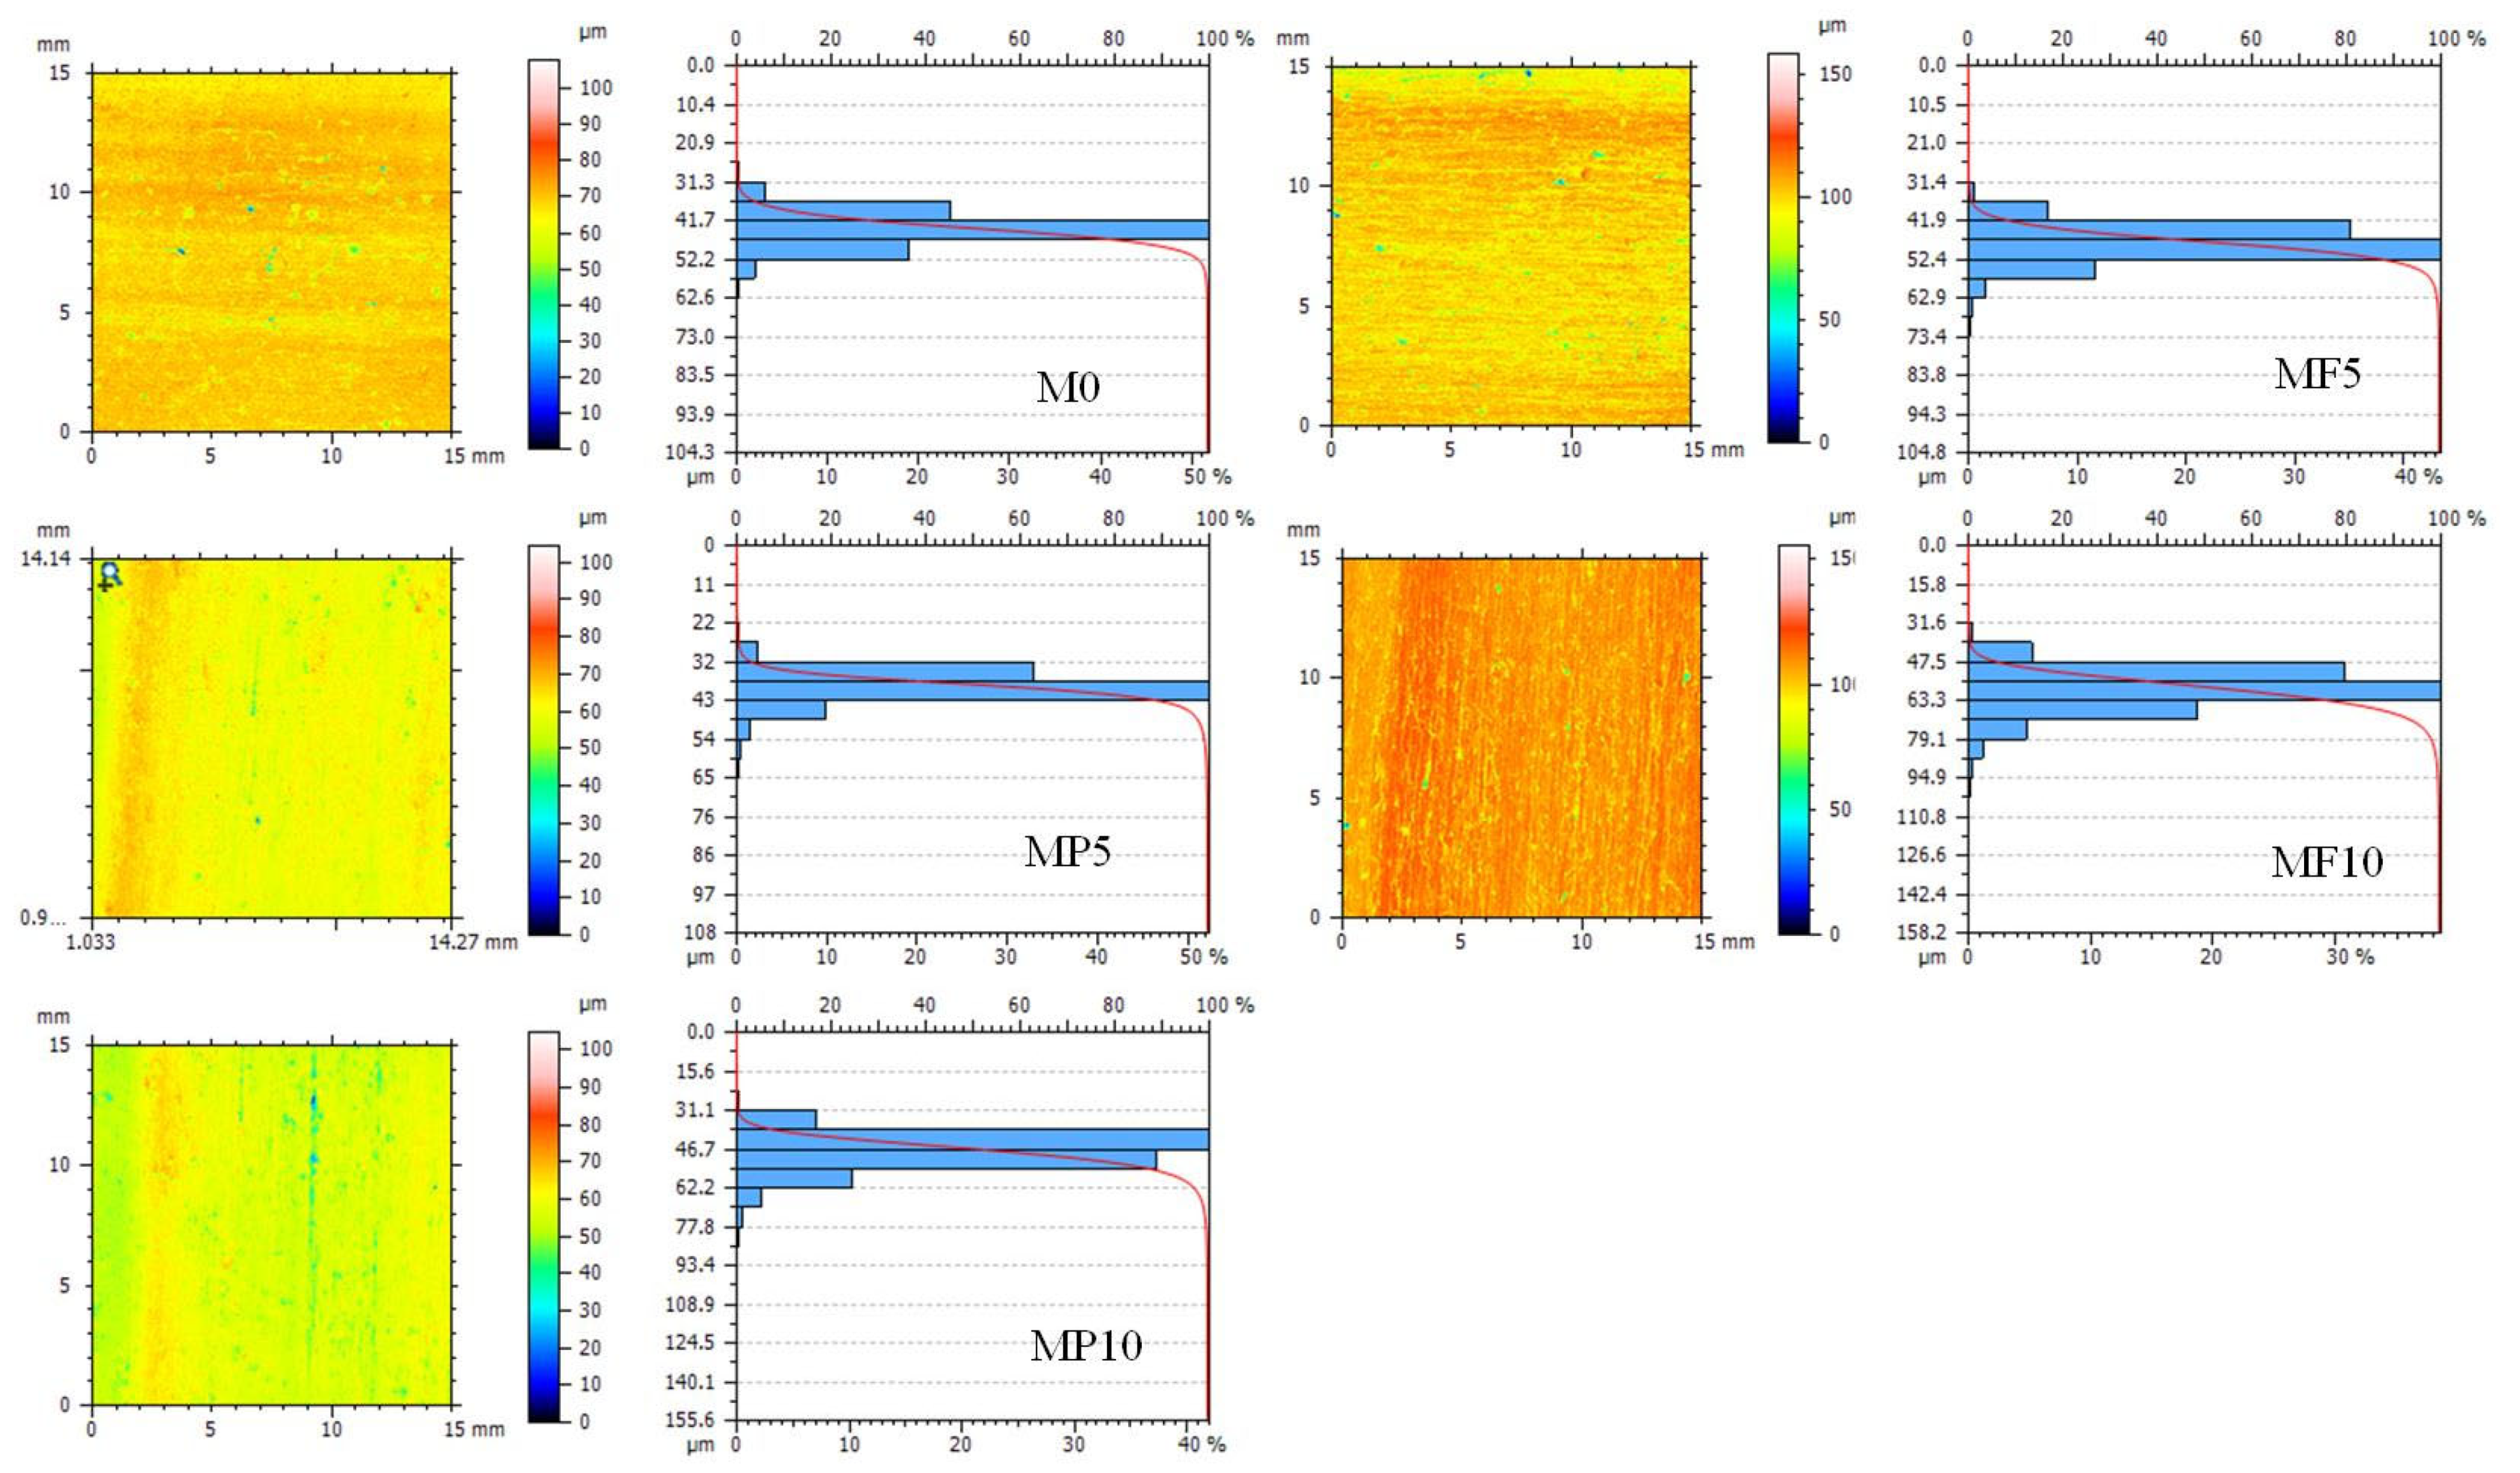
Figure 10 shows the surface wear depth data of samples developed with different fillers after wear. It can be seen that in M0 samples, the highest percentage of wear depth is 41–45 microns and it accounts for 50%, similarly, in the MP5, MP10, MF5, and MF10 samples; the value is 37–42 microns accounts for 50%, 47–52 microns accounts for 44%, 39–46 microns accounts for 42%, and 57–63 microns accounts for 40%, respectively. The wear depth and wear mass show a similar trend: MF5 samples had the lowest average wear depth, followed by M0, MF5, MP10, and MF10 had the largest average wear depth.

4. Conclusions

Brake friction materials reinforced with powder-based and fiber-based mullite by utilizing different contents were developed, meanwhile, their physical, mechanical, and tribological properties were analyzed in detail. The results are shown below:
(1)
Fibrous mullite brake friction materials have a higher shear strength and hardness and a lower density compared to powdered mullite composites, as mullite content increases, hardness, and shear strength increase and density decreases. Mullite content and shape have less of an effect on water absorption properties;
(2)
The stability coefficient of the composites decreases, while the variability coefficient, wear, and frictional fluctuations increase with the increased mullite content; meanwhile, the powder-based mullite composites perform better than that of fiber-based composites;
(3)
As the mullite content increases, the fade and recovery performance of the composites become worse, and the powder-based composites perform better than fiber-based composites;
(4)
The worn surface of the composites showed typical wear characteristics, the powdered composites present a completely continuous contact platform and small roughness on the surface, yet more spalling and wear debris on the surface of the fibrous composites and increased surface damage as the mullite content increased;
(5)
The brake friction material with 5% powdered mullite has the highest stable friction performance (0.86), the lowest wear rate (3%), the highest %R (118), the lowest %F (10.4), and the lowest friction variation performance (0.263), which is considered to be the optimal formulation.

Author Contributions

Conceptualization, N.W.; formal analysis, N.W.; funding acquisition, N.W.; investigation, Z.Y.; methodology, N.W.; software, N.W.; validation, Z.Y.; writing—original draft, N.W.; writing—review & editing, Z.Y. All authors have read and agreed to the published version of the manuscript.

Funding

This research was funded by the National Natural Science Foundation of China (No. 52004034), the Natural Science Research Project in Universities of Anhui Province in China (No. KJ2021A1115), the Natural Science Research Project of Suzhou University (No.2017yzd01, 2019yzd03, and 2021yzd02), and the Major Projects of Natural Science Research in the Universities of Anhui Province (No. KJ2021ZD0137).

Data Availability Statement

Not applicable.

Conflicts of Interest

The authors declare that there is no conflict of interest.

References

  1. Baskara Sethupathi, P.; Chandradass, J. Comparative study of different solid lubricants towards friction stability in a non-asbestos disc brake pad. Ind. Lubr. Tribol. 2021, 73, 897–903. [Google Scholar]
  2. Jubsilp, C.; Jantaramaha, J.; Mora, P.; Rimdusit, S. Tribological Performance and Thermal Stability of Nanorubber-Modified Polybenzoxazine Composites for Non-Asbestos Friction Materials. Polymers 2021, 13, 2435. [Google Scholar] [CrossRef]
  3. Wongpayakyotin, A.; Jubsilp, C.; Tiptipakorn, S.; Mora, P.; Bielawski, C.W.; Rimdusit, S. Effects of Alkyl-Substituted Polybenzoxazines on Tribological Properties of Non-Asbestos Composite Friction Materials. Polymers 2021, 13, 567. [Google Scholar] [CrossRef]
  4. Kalel, N.; Bhatt, B.; Darpe, A.; Bijwe, J. Suppression of Brake Noise and Vibration Using Aramid and Zylon Fibers: Experimental and Numerical Study. ACS Omega 2022, 7, 21946. [Google Scholar] [CrossRef]
  5. Shen, M.-X.; Li, H.-X.; Du, J.-H.; Ji, D.-H.; Liu, S.-P.; Xiao, Y.-L. New insights into reducing airborne particle emissions from brake materials: Grooved textures on brake disc surface. Tribol. Int. 2022, 174, 107721. [Google Scholar] [CrossRef]
  6. Ahdy, M.A.; Ali MK, A.; Mourad, M.; Abd-El-Tawwab, A.M. Review of automotive brake lining materials and their tribological properties. Proc. Inst. Mech. Eng. Part J J. Eng. Tribol. 2022, 236, 1445–1465. [Google Scholar] [CrossRef]
  7. Singh, T.; Tiwari, A.; Patnaik, A.; Chauhan, R.; Ali, S. Influence of wollastonite shape and amount on tribo-performance of non-asbestos organic brake friction composites. Wear 2017, 386, 157–164. [Google Scholar] [CrossRef]
  8. Sinha, A.; Ischia, G.; Menapace, C.; Gialanella, S. Experimental characterization protocols for wear products from disc brake materials. Atmosphere 2020, 11, 1102. [Google Scholar] [CrossRef]
  9. Wang, X.; Bao, J.; Liu, J.; Yin, Y.; Liu, T.; Zhao, S. Preparation and optimization of a soft magnetic brake friction material based on permalloy additive. Industrial Lubr. Tribol. 2021, 73, 308–315. [Google Scholar] [CrossRef]
  10. Kim, S.-H.; Jeong, M.H.; Kim, J.; Shim, W.; Kwon, S.-U.; Lee, J.-J.; Huh, S.H.; Pee, J.-H.; Kim, J.-Y. Dynamometric Investigation on Airborne Particulate Matter (PM) from Friction Materials for Automobile: Impact of Abrasive and Lubricant on PM Emission Factor. Lubricants 2021, 9, 118. [Google Scholar] [CrossRef]
  11. Kumar, N.; Kumar, S.; Grewal, J.S.; Mehta, V.; Ali, S. Comparative study of Abaca fiber and Kevlar fibers based brake friction composites. Polym. Compos. 2022, 43, 730–740. [Google Scholar] [CrossRef]
  12. Karaca, F.; Can, İ. Effects of grain size on the performance of brake linings with Al2O3 additives. Mater. Test. 2021, 63, 822–828. [Google Scholar] [CrossRef]
  13. Shinde, D.; Bulsara, M.; Patil, J. Wear analysis of eco-friendly non-asbestos friction-lining material applied in an automotive drum brake: Experimental and finite-element analysis. Proc. Inst. Mech. Eng. Part J J. Eng. Tribol. 2022, 236, 552–562. [Google Scholar] [CrossRef]
  14. Kumar, N.; Grewal, J.S.; Kumar, N.; Kumar, S. A novel Pinus roxburghii natural leaves fiber used as reinforcement polymer composite: As asbestos-free brake friction material. Polym. Compos. 2022, 43, 566–573. [Google Scholar] [CrossRef]
  15. Monreal-Pérez, P.; González, J.; Iraizoz, A.; Bilbao, U.; Clavería, I. Effect of the steel fiber length on the friction performance and wear mechanism of railway brake shoes. Tribol. Int. 2022, 172, 107589. [Google Scholar] [CrossRef]
  16. Wei, L.; Choy, Y.S.; Cheung, C.S.; Jin, D. Tribology performance, airborne particle emissions and brake squeal noise of copper-free friction materials. Wear 2020, 448–449, 203215. [Google Scholar] [CrossRef]
  17. Zaquen, N.; Tegels, D.; Kerssemakers, A.; Persoon, F. Establishing a Correlation Between Friction Performance and Tribolayer Formation Using Engineered Mineral Fibers. J. Tribol. 2021, 143, 101701. [Google Scholar] [CrossRef]
  18. Irawan, A.P.; Fitriyana, D.F.; Tezara, C.; Siregar, J.P. Overview of the Important Factors Influencing the Performance of Eco-Friendly Brake Pads. Polymers 2022, 14, 1180. [Google Scholar] [CrossRef]
  19. Guo, Y.; Zhang, L.; Song, Q.; Zhang, R.; Zhao, F.; Li, W.; Sheng, H.; Hou, X.; Li, H. Simultaneously enhancing mechanical and tribological properties of carbon fiber composites by grafting SiC hexagonal nanopyramids for brake disk application. J. Mater. Sci. Technol. 2022, 121, 1–8. [Google Scholar] [CrossRef]
  20. Fiore, V.; Scalici, T.; Di Bella, G.; Valenza, A. A review on basalt fibre and its composites. Compos. Part B Eng. 2015, 74, 74–94. [Google Scholar] [CrossRef]
  21. Pucci, M.F.; Seghini, M.C.; Liotier, P.J.; Sarasini, F.; Tirilló, J.; Drapier, S. Surface characterisation and wetting properties of single basalt fibres. Compos. Part B Eng. 2017, 109, 72–81. [Google Scholar] [CrossRef]
  22. Cui, G.; Han, J. Resin Matrix Brake Materials Reinforced by Nano-Al2O3 for Mining Equipment. J. Wuhan Univ. Technol.-Mater. Sci. Ed. 2019, 34, 75–81. [Google Scholar] [CrossRef]
  23. Liu, Y.; Ma, Y.; Lv, X.; Yu, J.; Zhuang, J.; Tong, J. Mineral fibre reinforced friction composites: Effect of rockwool fibre on mechanical and tribological behaviour. Mater. Res. Express 2018, 5, 095308. [Google Scholar] [CrossRef]
  24. Baskara Sethupathi, P.; Chandradass, J. Effect of zirconium silicate and mullite with three different particle sizes on tribo performance in a non-asbestos brake pad. Proc. Inst. Mech. Eng. Part J J. Eng. Tribol. 2022, 236, 314–325. [Google Scholar] [CrossRef]
  25. Raj, J.S.; Christy, T.V.; Gnanaraj, S.D.; Sugozu, B. Influence of calcium sulfate whiskers on the tribological characteristics of automotive brake friction materials. Eng. Sci. Technol. Int. J. 2020, 23, 445–451. [Google Scholar]
  26. Jara, D.C.; Jang, H. Synergistic effects of the ingredients of brake friction materials on friction and wear: A case study on phenolic resin and potassium titanate. Wear 2019, 430, 222–232. [Google Scholar] [CrossRef]
  27. Huang, Y.-Q.; Li, Z.; Liu, P.-F.; Huang, T.-X.; Li, Y.; Xiao, P. Tribological properties of Mullite/3Y-TZP ceramics with different content of mullite fabricated by gel-casting. Appl. Surf. Sci. 2019, 476, 232–241. [Google Scholar] [CrossRef]
  28. Schneider, H.; Schreuer, J.; Hildmann, B. Structure and properties of mullite—A review. J. Eur. Ceram. Soc. 2008, 28, 329–344. [Google Scholar] [CrossRef]
  29. Ji, Z.; Luo, W.; Zhou, K.; Hou, S.; Zhang, Q.; Li, J.; Jin, H. Effects of the shapes and dimensions of mullite whisker on the friction and wear behaviors of resin-based friction materials. Wear 2018, 406, 118–125. [Google Scholar] [CrossRef]
  30. Cai, P.; Wang, Y.; Wang, T.; Wang, Q. Improving tribological behaviors of friction material by mullite. Tribol. Int. 2016, 93, 282–288. [Google Scholar] [CrossRef]
  31. Vineeth Kumar, V.; Senthil Kumaran, S.; Dhanalakshmi, S.; Sivaramakrishnan, R. Tribological performance evaluation of fused mullite-reinforced hybrid composite brake pad for defence application. J. Braz. Soc. Mech. Sci. Eng. 2019, 41, 179. [Google Scholar] [CrossRef]
  32. Zhu, J.; Yan, H. Fabrication of an A356/fly-ash-mullite interpenetrating composite and its wear properties. Ceram. Int. 2017, 43, 12996–13003. [Google Scholar] [CrossRef]
  33. Singh, T.; Pattnaik, P.; Pruncu, C.I.; Tiwari, A.; Fekete, G. Selection of natural fibers based brake friction composites using hybrid ELECTRE-entropy optimization technique. Polym. Test. 2020, 89, 106614. [Google Scholar] [CrossRef]
  34. Amirjan, M. Microstructure, wear and friction behavior of nanocomposite materials with natural ingredients. Tribol. Int. 2019, 131, 184–190. [Google Scholar] [CrossRef]
  35. Pai, A.; Subramanian, S.; Sood, T. Tribological response of waste tire rubber as micro-fillers in automotive brake lining materials. Friction 2020, 8, 16. [Google Scholar] [CrossRef]
  36. Wang, F.; Ying, L. Mechanical and tribological properties of ceramic-matrix friction materials with steel fiber and mullite fiber. Mater. Des. 2014, 57, 449–455. [Google Scholar] [CrossRef]
  37. Liu, Z.Y.; Huang, B.Y.; Di, S.U. Relationship Between Fiber Content and Properties of Automotive Friction Materials. Tribology 1999, 32, 32–36. [Google Scholar]
  38. Kumar, N.; Singh, T.; Grewal, J.S.; Patnaik, A.; Fekete, G. Experimental investigation on the physical, mechanical and tribological properties of hemp fiber-based non-asbestos organic brake friction composites. Mater. Res. Express 2019, 6, 1–11. [Google Scholar] [CrossRef]
  39. Kumar, N.; Grewal, J.S.; Kumar, S.; Ali, S.; Kumar, N. A novel Himachal’s Bagar (Sabai) grass fiber used as a brake friction material in brake polymer composite and compared to standard brake friction material. Polym. Compos. 2022, 43, 215–224. [Google Scholar] [CrossRef]
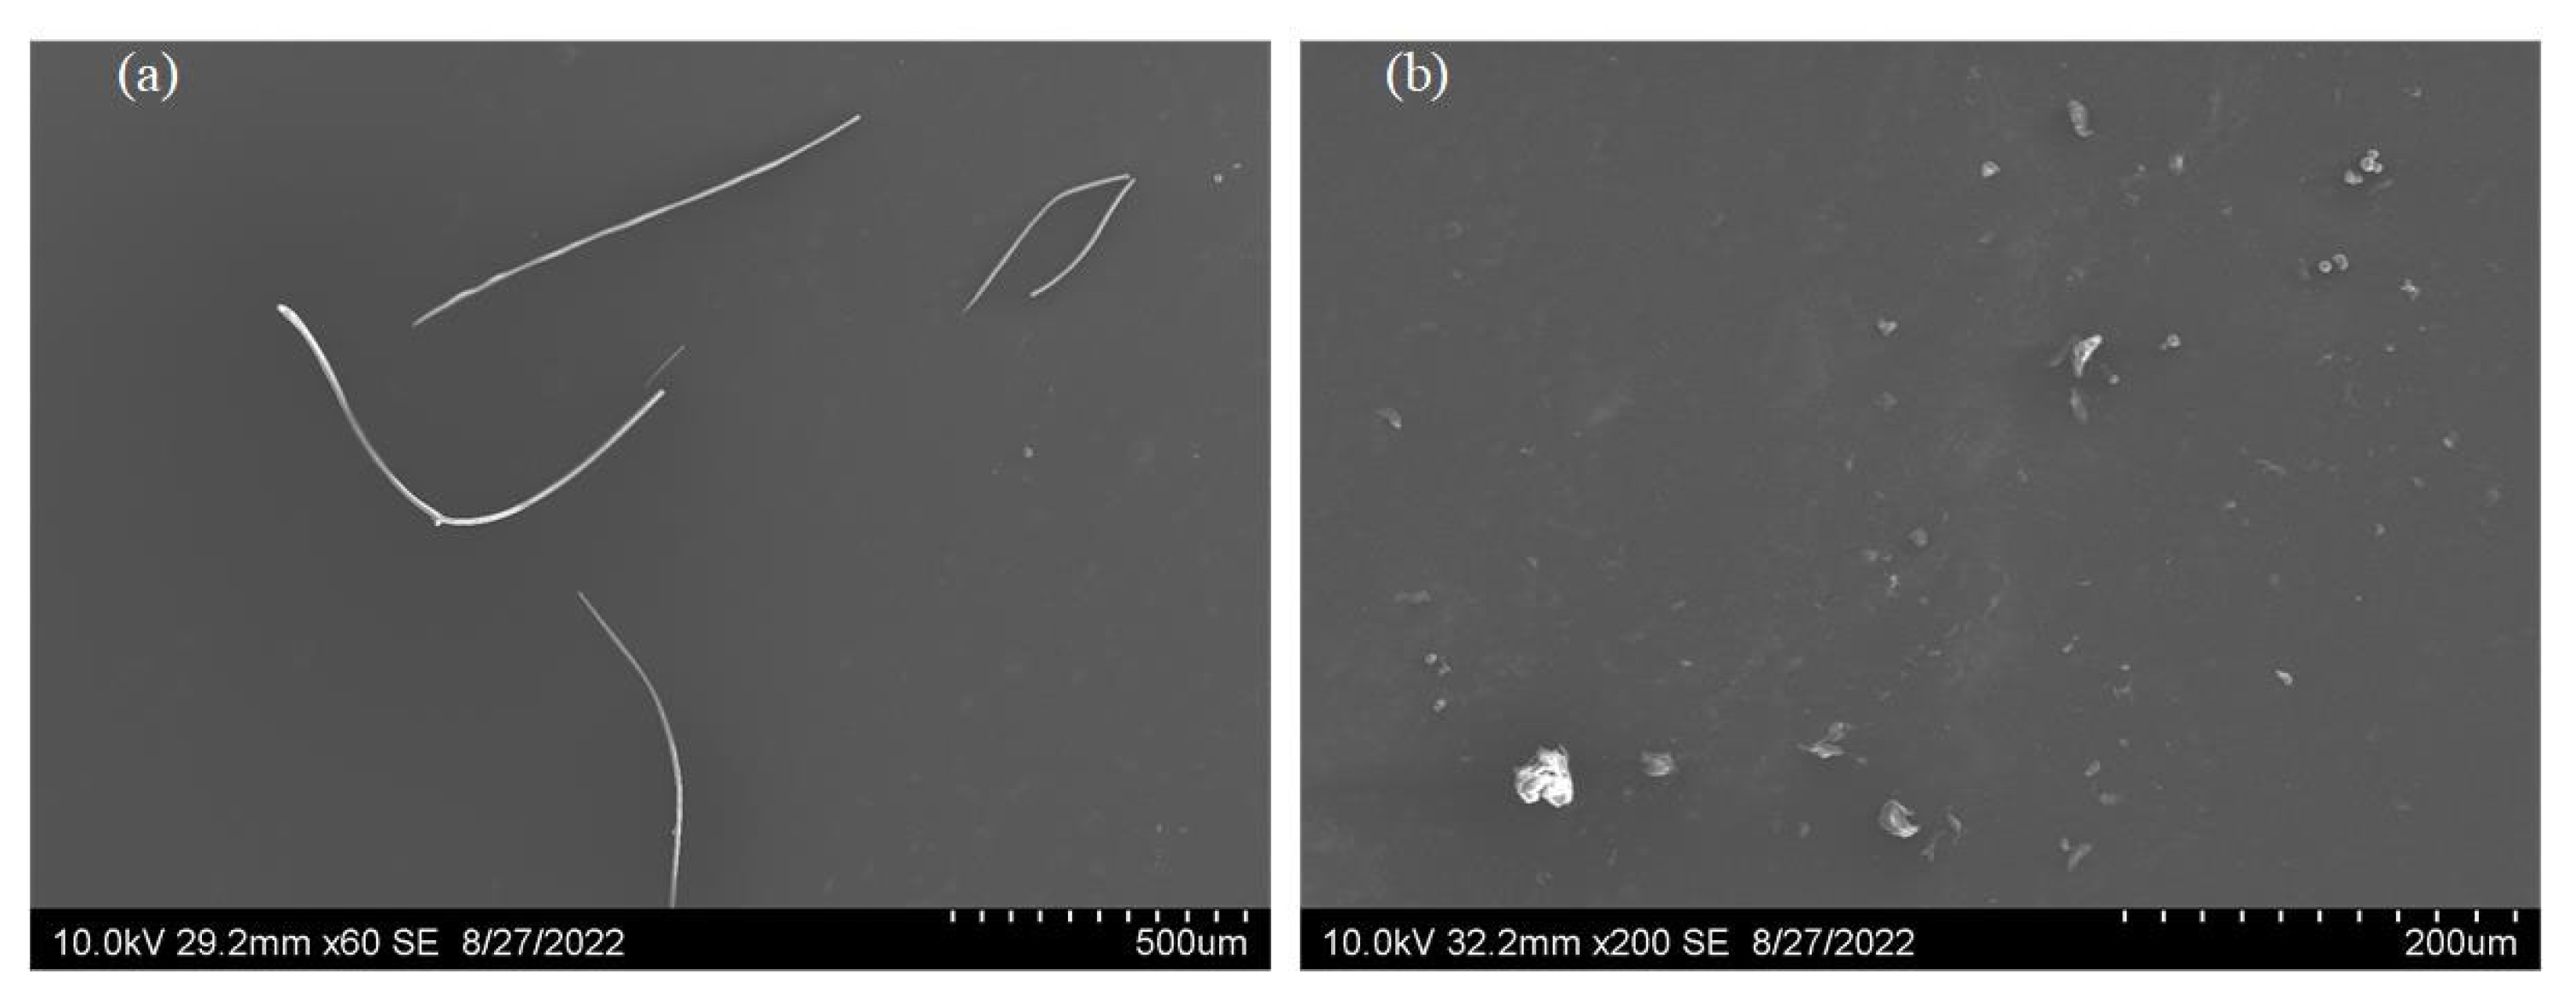
Figure 1. SEM micrographs of mullites: (a) Fiber and (b) Powder.
Lubricants 10 00220 g001
Figure 2. (a) Brake pad sample and (b) Test samples.
Lubricants 10 00220 g002
Figure 3. The preparation and sampling process of brake pad.
Lubricants 10 00220 g003
Figure 4. The thermal properties of composites.
Lubricants 10 00220 g004
Figure 5. Friction curves during fade and recovery cycles of the prepared composite material: (a) Fade-I, (b) Fade-II, (c) Recovery-I, (d) Recovery-II.
Lubricants 10 00220 g005
Figure 6. (a) The performance of μ v and   μ s ; (b) The performance of   μ p and Δ μ .
Lubricants 10 00220 g006
Figure 7. The performance of %R and %F.
Lubricants 10 00220 g007
Figure 8. Wear performance of prepared composite material.
Lubricants 10 00220 g008
Figure 9. SEM images of worn surfaces: (a) M0, (b) MP5, (c) MP10, (d) MF5, (e) MF10. 1: Contact platform; 2: Wear debris; 3: Spalling pit; 4: Exposed fibers.
Lubricants 10 00220 g009
Figure 10. Wear appearance and depth distribution images of samples.
Lubricants 10 00220 g010
Table 1. Formulation of brake friction composite.
Ingredient (wt%)M0MP5MP10MF5MF10
Resin1010101010
Rubber33333
Friction powder33333
Mullite0510510
Rock wool1515151515
Lapinus fiber1010101010
Graphite77777
Vermiculite77777
Barite4540354035
Notes: M0, MP5, MP10, MF5, and MF10 represent the sample without mullite, 5% mullite powder, 10% mullite powder, 5% mullite fiber, and 10% mullite fiber, respectively.
Table 2. Experimental procedure of the Chase test.
CycleSpeed
(rpm)
Load (N)Time Temp. (°C)ApplicationsHeater
onoffminmax
Burnish31244020 min--931off
Baseline41766710 s-8210420off
Fade-I41766710 min-932881on
Recovery-I41766710 s-260931off
Wear41766720 s10 s193204100off
Fade-II41766710 min-933431on
Recovery-II41766710 s-316931off
Baseline41766710 s20 s8210420off
Table 3. Physical and mechanical properties of composites.
PropertiesM0MP5MP10MF5MF10
Density (g/cm3)2.342.292.212.192.10
Hardness (HRR)83.183.884.882.683.3
Water absorption (%)0.90.820.930.850.97
Shear strength (MPa)7.37.47.18.27.6
Table 4. The results of the friction and wear test.
Sample   μ p Δ μ   μ s μ v %F%RMass LossThickness Loss
M00.4520.1860.850.41123.5112.83.57%3.24%
MP50.4570.120.8620.26310.2116.03.19%3.05%
MP100.4930.180.8570.36519.7116.75.75%5.36%
MF50.4320.160.8480.37119.1114.44.51%4.21%
MF100.4630.2640.7590.5725.3116.86.59%6.27%
Publisher’s Note: MDPI stays neutral with regard to jurisdictional claims in published maps and institutional affiliations.