Article

Influence of Test Parameters on the Evaluation of Chocolate Silkiness Using the Tribological Method

1
School of Mechanical Engineering, Jiangnan University, Wuxi 214122, China
2
Jiangsu Key Laboratory of Advanced Food Manufacturing Equipment and Technology, Jiangnan University, Wuxi 214122, China
3
School of Food Science, Jiangnan University, Wuxi 214122, China
*
Author to whom correspondence should be addressed.
Lubricants 2022, 10(9), 217; https://doi.org/10.3390/lubricants10090217
Submission received: 12 August 2022 / Revised: 4 September 2022 / Accepted: 5 September 2022 / Published: 8 September 2022
(This article belongs to the Special Issue State-of-the-Art of Tribology in China)

Abstract

:
Silkiness is an extremely important attribute in high-end chocolate, and tribology is one of the commonly used methods of evaluating certain properties of the relevant food. In this study, based on three commercial chocolates of the same brand, the silky sensation was assessed by means of the professional sensation evaluation method. Artificial saliva was employed to obtain the mixed solutions with different chocolates, and their viscosity and coefficient of friction (CoF) were measured under different test parameters. The correlation of chocolate silkiness with the viscosities and average CoFs (aCoFs) are later discussed. The results showed that the silkiness of the three chocolates were negatively correlated with cocoa concentration and weakly correlated with viscosity. As the chocolate percentage decreased, the aCoF of the mixed solutions decreased, but the aCoF of the mixed solutions increased in relation to the cocoa concentration. In combination with the correlation coefficient of chocolate silkiness with the aCoFs, it was considered that 75% chocolate solutions using the Two-PDMS pair could be representative of the silkiness characteristic in oral processing at suitable operated parameters. The study results provide an insight into the rapid evaluation and development of similar attributes of high-end food.

1. Introduction

Since chocolate was first made from cocoa beans in the Olmec Civilization, chocolates have gradually become part of the human diet. Chocolate’s unique texture, which is hard and crisp but not greasy, and its melting characteristics, whereby it melts in the mouth but not in the hand, provide its nice taste and flavor [1]. Subsequently, chocolates are favored proverbially regardless of age, gender or ethnicity. It is significantly difficult to evaluate the properties of chocolates, especially the key index of the silkiness degree. In recent years, it has been thought that there is a certain connection between food viscosity and silkiness. The ingredients of chocolates play a major role in their rheological properties [2,3,4]. In commercial chocolates, cocoa, carbohydrate and total fat are the most important parameters that affect their rheological behavior and influence the morphology of the final products [4]. Cocoa is one of the main ingredients of chocolate, and many previous studies have confirmed that the viscosity of chocolate is related to the cocoa concentration [5,6,7]. In addition, the viscosity of chocolate could also be improved by the additives, such as the butters phospholipid and C-trim30 [8,9].
However, with the prolongation of chewing frequency or oral processing time, rheological or textural methods have failed to completely satisfy this specific evaluation of the chocolate silkiness. In general, food oral processing is completed by the cooperation of tongue, palate and teeth, which produces many contacting pairs in tribological behavior. Tribology was first applied in the research of food mouthfeel by Kokini [10]. Subsequently, tribological methods have been used widely to evaluate the sectional attributes of food products, and a variety of experimental devices have been employed, including the friction tester with a rubber band [11,12,13], optical tribological configuration [14], the mini traction machine (MTM) [6,15], surface-force apparatus [16], a rheometer based on the ball-on-three-plates [17,18] or double balls-on-plate [19] tests, modified structural apparatus [20] and the in vivo method of the Iowa Oral Performance Instrument [21]. In addition, tribology methods are also applied to detect food safety [22,23]. Recently, there have been many factors that affect the friction property of chocolate by means of tribology techniques, but they mainly come from the chocolate itself, such as in the chocolate ingredients [6,16,24] and additives [9,25]. For instance, the friction property of molten chocolate was strongly influenced by the presence of solid sugar particles and cocoa solids [6]. Moreover, the additives of magnesium stearate powder and plant sterol powder failed to affect the melting behavior of chocolate but improved their coefficient of friction (CoF) compared to pure chocolate [25]. In addition to the factors of chocolate itself, other factors can also affect its friction property, such as sliding speed [17], lubricant [6,26] and rubbing pair [27]. Saliva is more lubricating than phosphate-buffered saline (PBS), which resulted in lower CoFs for chocolate–saliva mixtures than chocolate–PBS mixtures [6]. Among them, the common rubbing pairs are ball-on-soft, soft-on-glass and soft-on-soft. The commonly used soft materials were mainly polydimethylsiloxane (PDMS) [20,24,26,27] and poly (tetrafluoroethylene) (PTFE) [28]. However, there are lots of papillae with different shapes and sizes on the natural tongue surface [29,30], and there are significant differences in the size of the papillae on the tongue surfaces of different genders and ages [31]. Among them, the proportion of the bacteroid papillae on the adult tongue tip was found to be relatively higher, with a density of about 133.95 ± 4.04 /cm2 [32,33], and the contacting probability between this area and food is relatively higher. Therefore, a soft material with similar papillae should be much closer to natural tongue. Under such conditions, it would be worth performing an investigation on the friction property of chocolate.
In addition, chocolate silkiness has a higher relation to its friction property. For instance, a lower CoF could lead to excellent silkiness in food oral processing. Until now, food silkiness has mainly been achieved using the manual sensory evaluation method, but the deviation among these results is usually quite evident. The optimal sensation of silkiness may occur instantaneously during oral processing. To some content, mixed food solutions of different percentages matching their silkiness well could be representative of oral food processing. Moreover, The CoF of food solutions is affected by many factors, such as rubbing pair, load, speed, etc. Based on the appropriate test parameters, the CoFs of food solutions have better correlations with mouthfeel evaluation, and even the differences among the measured CoFs are high enough to discriminate them, which will be of great significance. Accordingly, a rapid method for characterizing the silkiness of similar products can be obtained to decrease the deviation of manual sensory evaluations.
In this study, the influence of test parameters on the silkiness of the same brand of commercial chocolates was investigated, mainly by means of the tribological method. Firstly, the silky sensation of these chocolates was evaluated using the professional sensation evaluation method. Secondly, soft materials containing a few papillae and mixed solutions with different chocolate percentages were prepared. Finally, the viscosities and CoFs were measured under different test parameters, and the correlation of the silkiness with the viscosity and average CoF (aCoF) are discussed. The results provide a better viewpoint to rapidly detect chocolate silkiness and develop high-end chocolates.

2. Materials and Methods

2.1. Materials

Polydimethylsiloxane (PDMS, Sylgard 184, Dow Corning, Midland, TX, USA) was widely used as the experimental material. It consisted of the base liquid and the curing agent [34]. The main composition of the base liquid was poly (dimethyl-methylvinylsiloxane), and the main composition of the curing agent was poly (dimethyl-methylhydrosiloxane). The mixture with the polydimethylsiloxane and the curing agent, at mass ratios of 20:1 and 10:1, were poured into micro-convex and round molds, respectively. The micro-convex mold was a hemispherical shape with similar papillae to natural tongue, and its diameter, height and center distance were 0.72 mm, 0.36 mm and 0.86 mm, respectively. These fluids were stirred uniformly by ultrasonic means for 20 min and placed in a high-temperature vacuum dryer at 75 °C for 24 h. Then, they were taken out of the dryer and cooled at room temperature. Finally, a soft material with a mass ratio of 20:1 (soft-PDMS, 30 mm × 10 mm × 5 mm, shown in Figure 1) and a relatively hard material with a mass ratio of 10:1 (hard-PDMS, Φ4 mm × 5 mm) were applied to simulate the tongue and upper palate, respectively. In addition, a ceramic ball with a diameter of 6 mm was used as part of the rubbing pair again hard-PDMS to simulate the contact of hard tooth and tongue tissue in the oral cavity.
The same brand of commercial chocolates with three cocoa concentrations of 25%, 48% and 66% were employed and named D1, D2 and D3, respectively. Other components of these three chocolates are listed in Table 1. The artificial saliva was obtained, and its detailed properties can be seen in previous work [35]. To evaluate the time variation in chocolate silkiness with the oral processing, the chocolates were first cut into diamond shapes, the artificial saliva was added to them, and mixed solutions with chocolate mass percentages of 100%, 75%, 50%, 25% and 5% were prepared. These mixed solutions were put into an incubator at 37 °C for a short time to simulate the oral environment of the chocolate and allow better mixing of the chocolate with the artificial saliva. In addition, a DHR-2 rheometer (TA Instruments, New Castle, DE, USA) was used to measure the viscosity of the mixed solutions as a function of shear rate at a constant temperature of 37 °C.

2.2. Evaluation Process of Chocolate Silkiness

The evaluation of chocolate silkiness was commissioned by the Food Sensory Evaluation Laboratory of Jiangnan University, and a detailed procedure of the silkiness evaluation can be seen in previous work [35]. In this way, 32 subjects with the same ratio of men to women were selected to participate in the evaluation. Moreover, the 32 subjects were also required to fill in their understanding of the silkiness concept. The parameters involved were mainly the melting speed, hardness, viscosity and particle sensation of the chocolate samples, which were helpful in the further investigation of their relationships with silkiness evaluation and in other experiments.

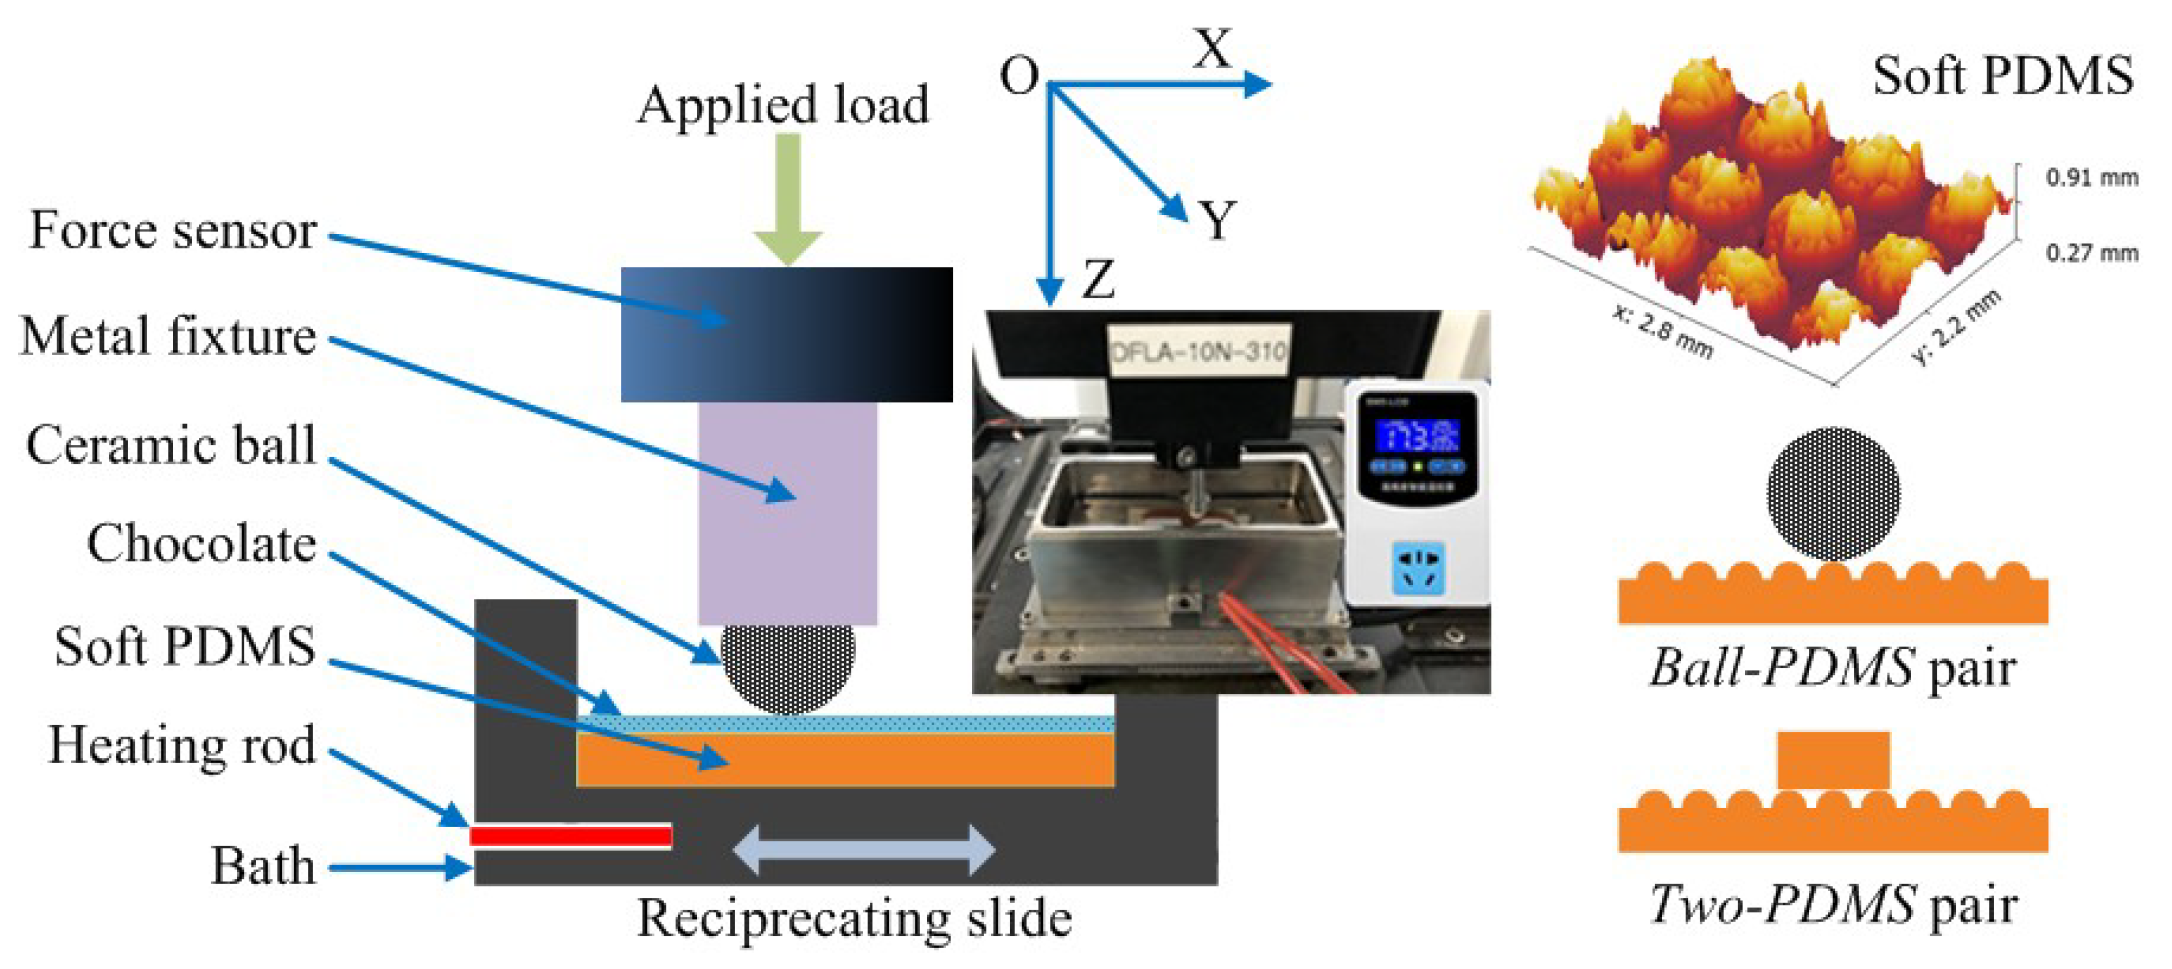
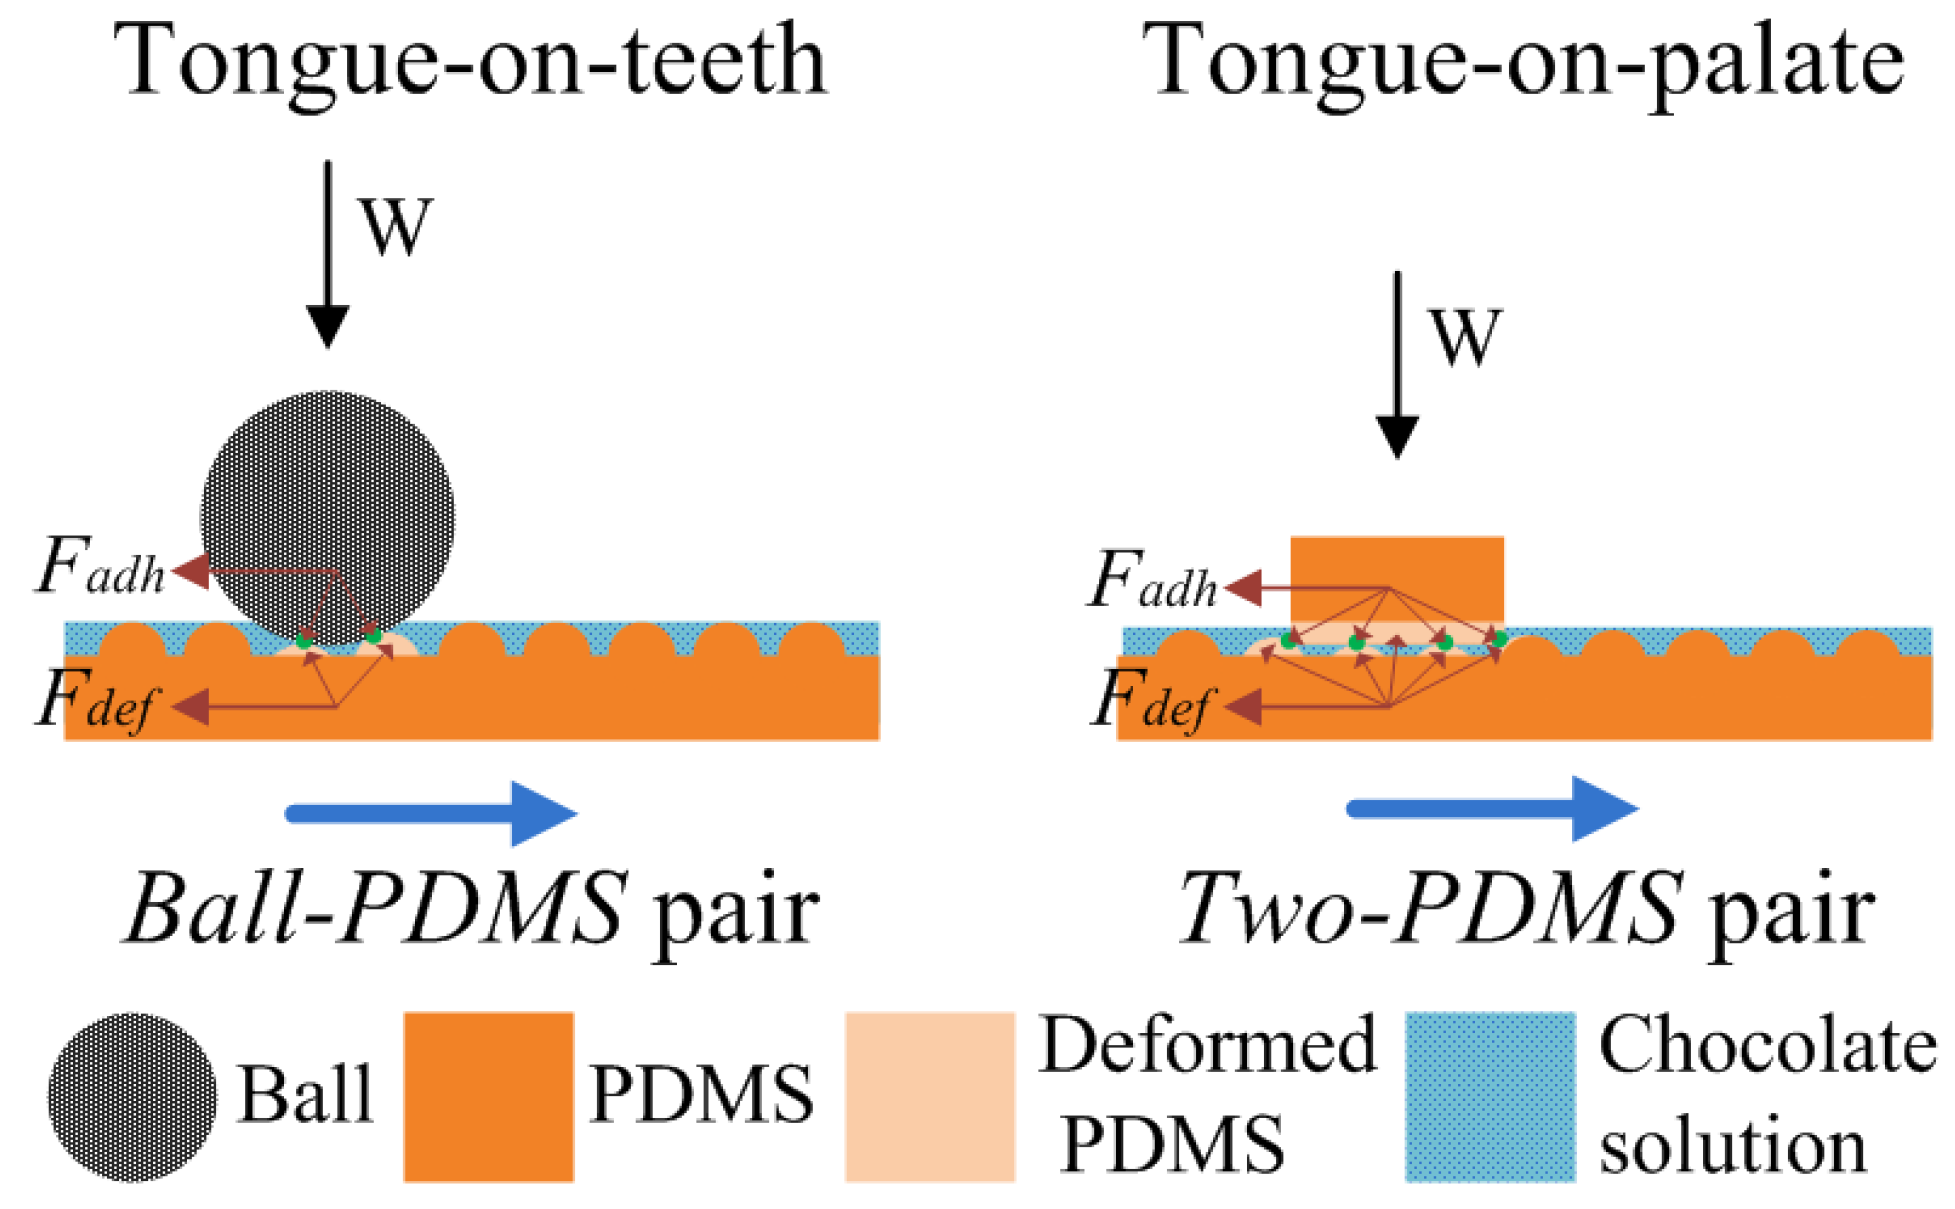
2.3. Testing Method for Friction Properties of Mixed Chocolate Solution

The rubbing test method between the ceramic ball and soft-PDMS (named the Ball-PDMS pair) was performed on an MFT-5000 wear tester (Rtec Instruments, Inc., San Jose, CA, USA) as shown in Figure 1, and similar details about the testing method can be seen in previous work [35]. In this study, at the test temperature, the load, speed, sliding distance and time were 37 °C, 0.4 N, 2 mm/s, 20 mm and 120 s, respectively. The parameters were controlled by the program of the wear tester. It is worth noting that new materials needed to be used to carry out the next test.
The rubbing test method of hard-PDMS and soft-PDMS (named the Two-PDMS pair) was similar to that of the Ball-PDMS pair. Only the ball was replaced with the hard-PDMS with a load of 2 N, and the other parameters and the experimental process were completely the same. To investigate the influence of loads and speeds on the friction property of mixed chocolate solutions, their aCoFs under different loads and speeds were measured on the Two-PDMS pair. The detailed experimental parameters are listed in Table 2. At the temperature of 37 °C, each test reciprocated the sliding for 6 cycles with a sliding distance of 20 mm.

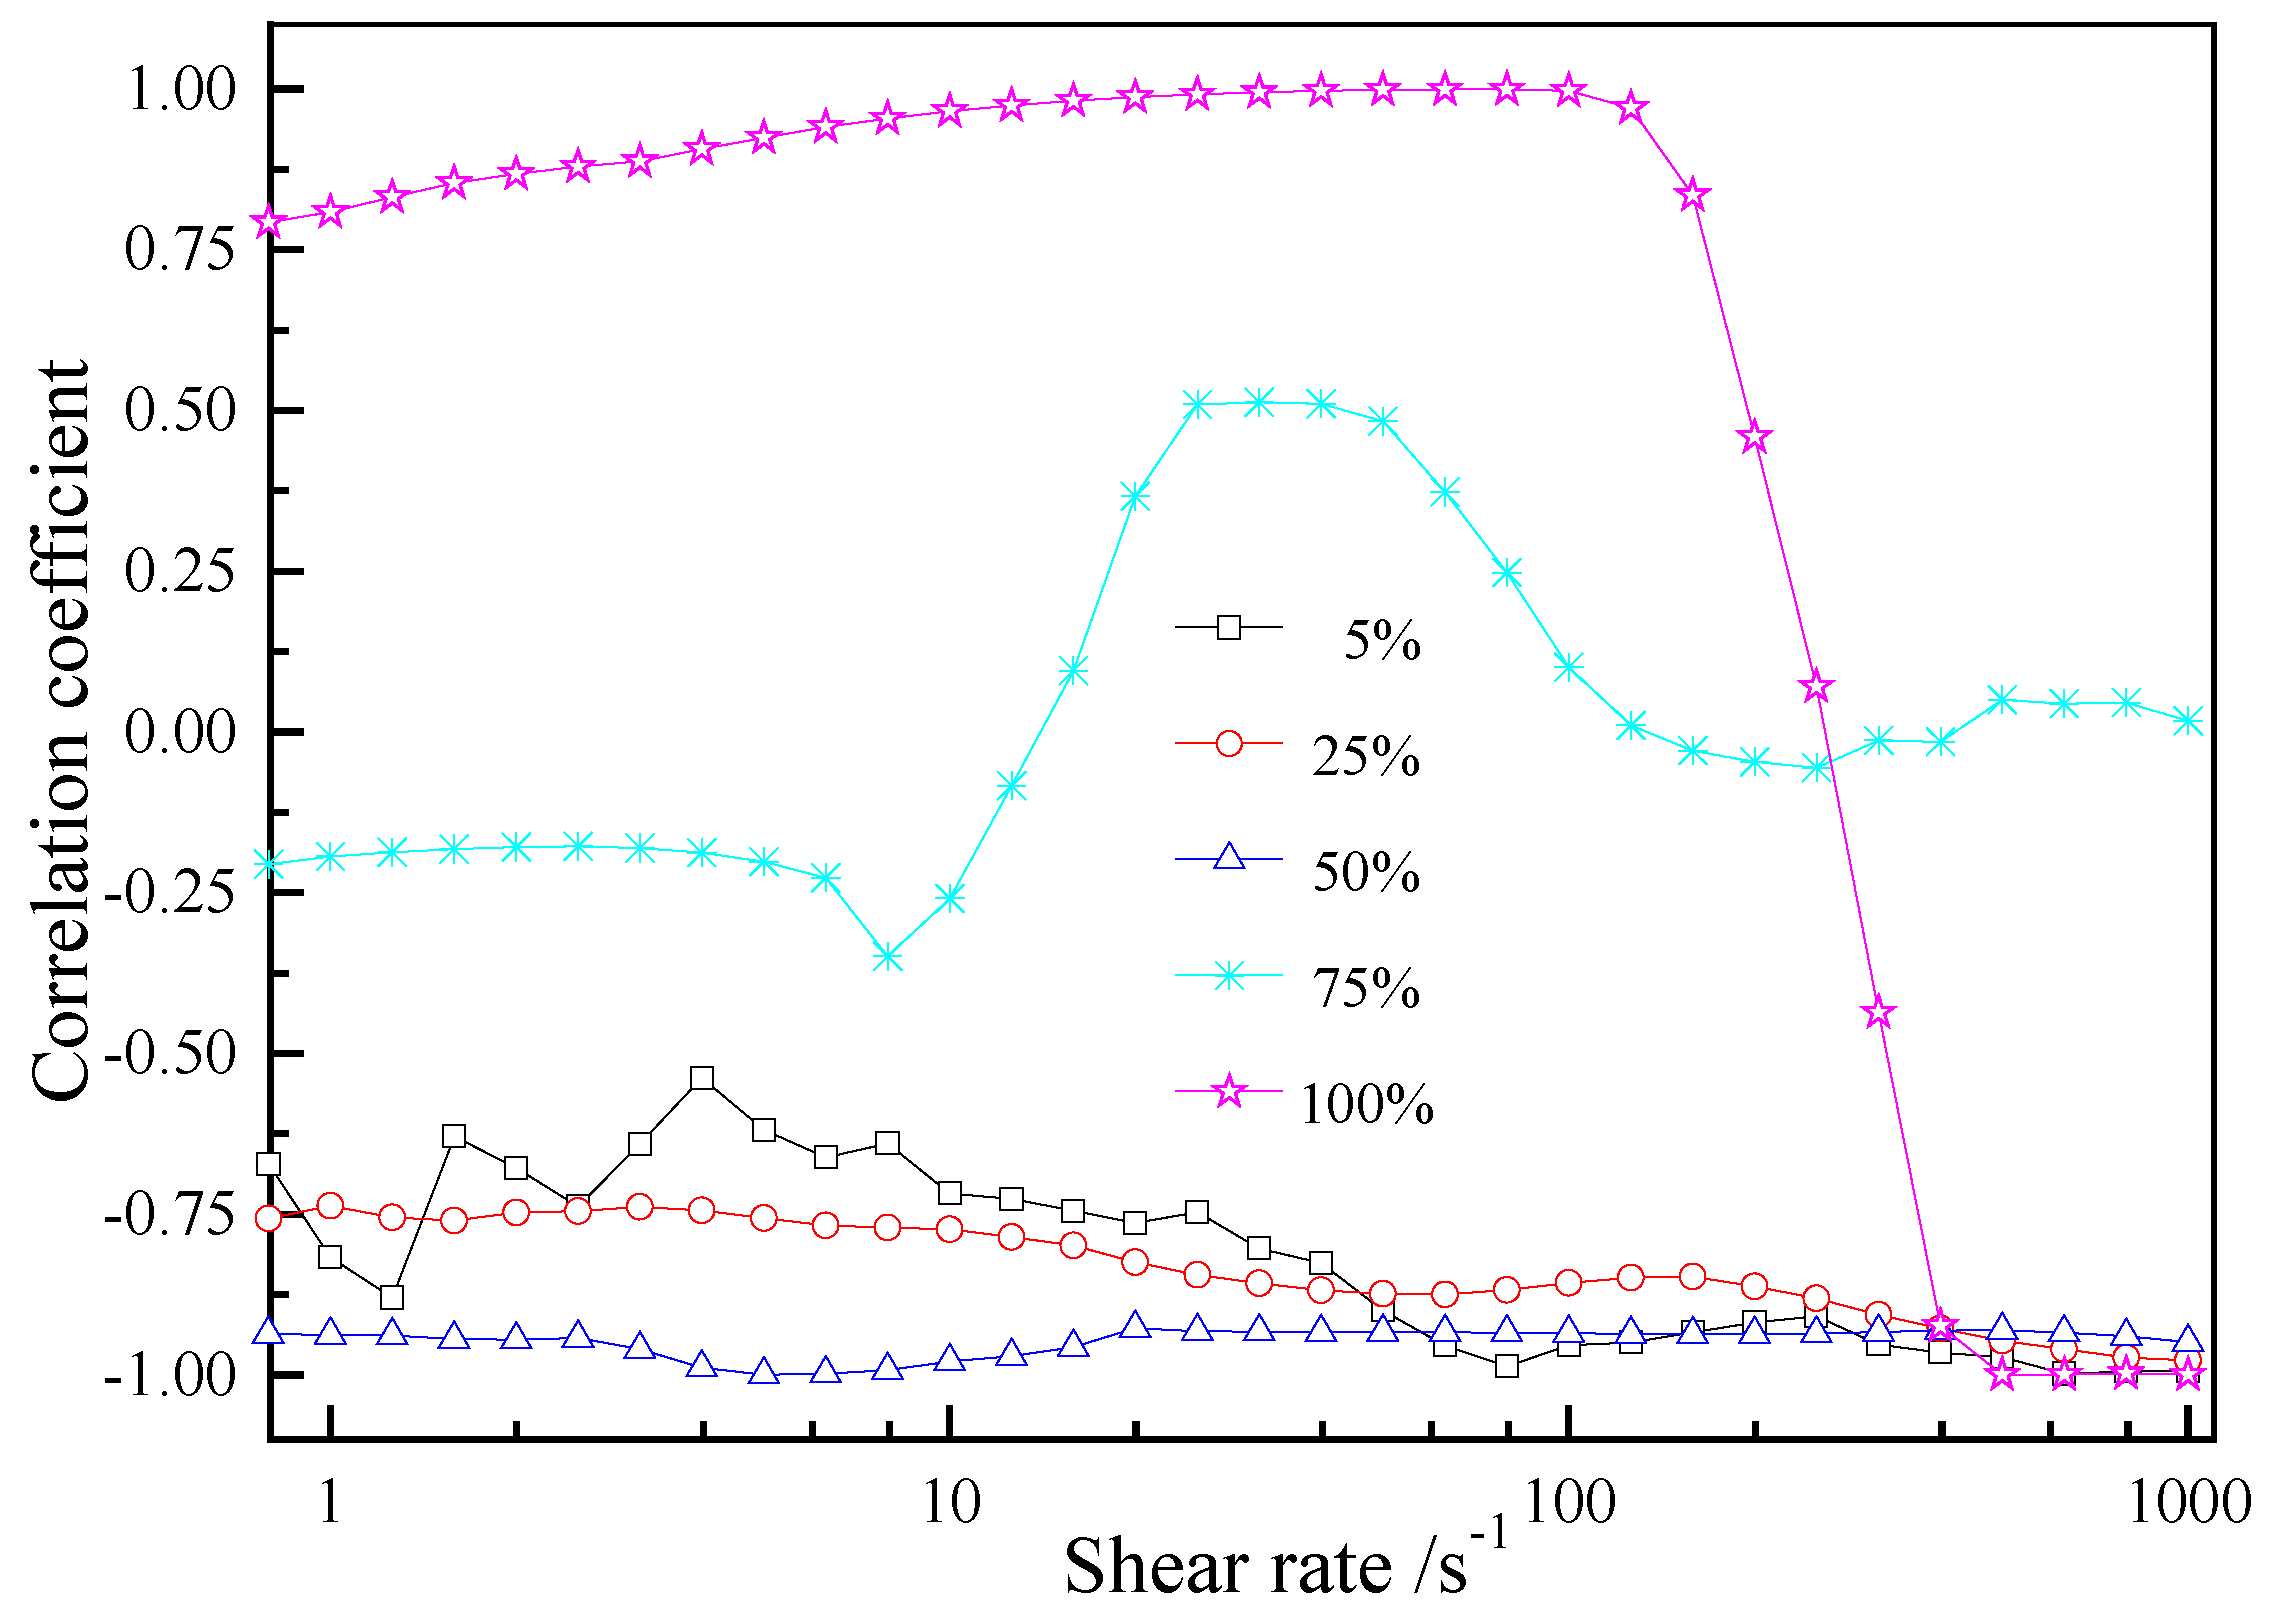
2.4. Correlation Coefficient

The correlation coefficient R2 is a characteristic parameter and can characterize the linear relationship index between two groups of variables. If the absolute value of R2 is close to 1, it means that the correlation degree between two groups is much higher. If the absolute value of R2 approaches 0, the correlation degree between two groups is much weaker. Moreover, if R2 is much closer to 1, they are positively related, whereas if R2 is much closer to −1, they are negatively related. In this current study, the Corrcoef Function of MatLab software was employed to investigate the related degree between the smoothness of three kinds of chocolate solutions and their viscosity or aCoF under the same operation conditions, and the effects of their rheological and lubricating properties on the corresponding smoothness were further evaluated.

3. Results and Discussion

3.1. Effect of Cocoa Concentration on Chocolate Silkiness

The silkiness of the D1, D2 and D3 chocolate samples evaluated by the 32 subjects were 6.03 ± 2.29, 5.13 ± 1.95 and 4.59 ± 2.12, respectively. One-way analysis of variance was employed to estimate the differences in the sensation results between the three chocolates by means of the software SPSS. The main effect of the sensation evaluation results was significant, and the detection statistic F was 3.74 (p < 0.05). The subsequent testing results showed that the evaluation result between chocolates D1 and D2 had marginal significance (0.05 < p = 0.09 < 0.1), the differences between chocolates D2 and D3 were not significant, and the differences between D1 and D3 were significant (p < 0.05), indicating that the sensation evaluation results of three chocolates had higher credibility. This indicates that the average silkiness of the same brand of chocolate was negatively correlated with the cocoa concentration. The chocolate with lower cocoa concentration could bring about a more silky sensation. Moreover, from the subject’s understanding of the silky sensation listed in Table 3, 62.5% of them thought that the melting speed of chocolate played a more important role in the silkiness. The chocolate with a more rapid melting speed would result in better silkiness. However, other attributes failed to exert a significant impact on their silkiness. Only 25% of the subjects were convinced that chocolate with lower viscosity could bring about better silkiness, further indicating that the correlation between chocolate silkiness and viscosity was much weaker.

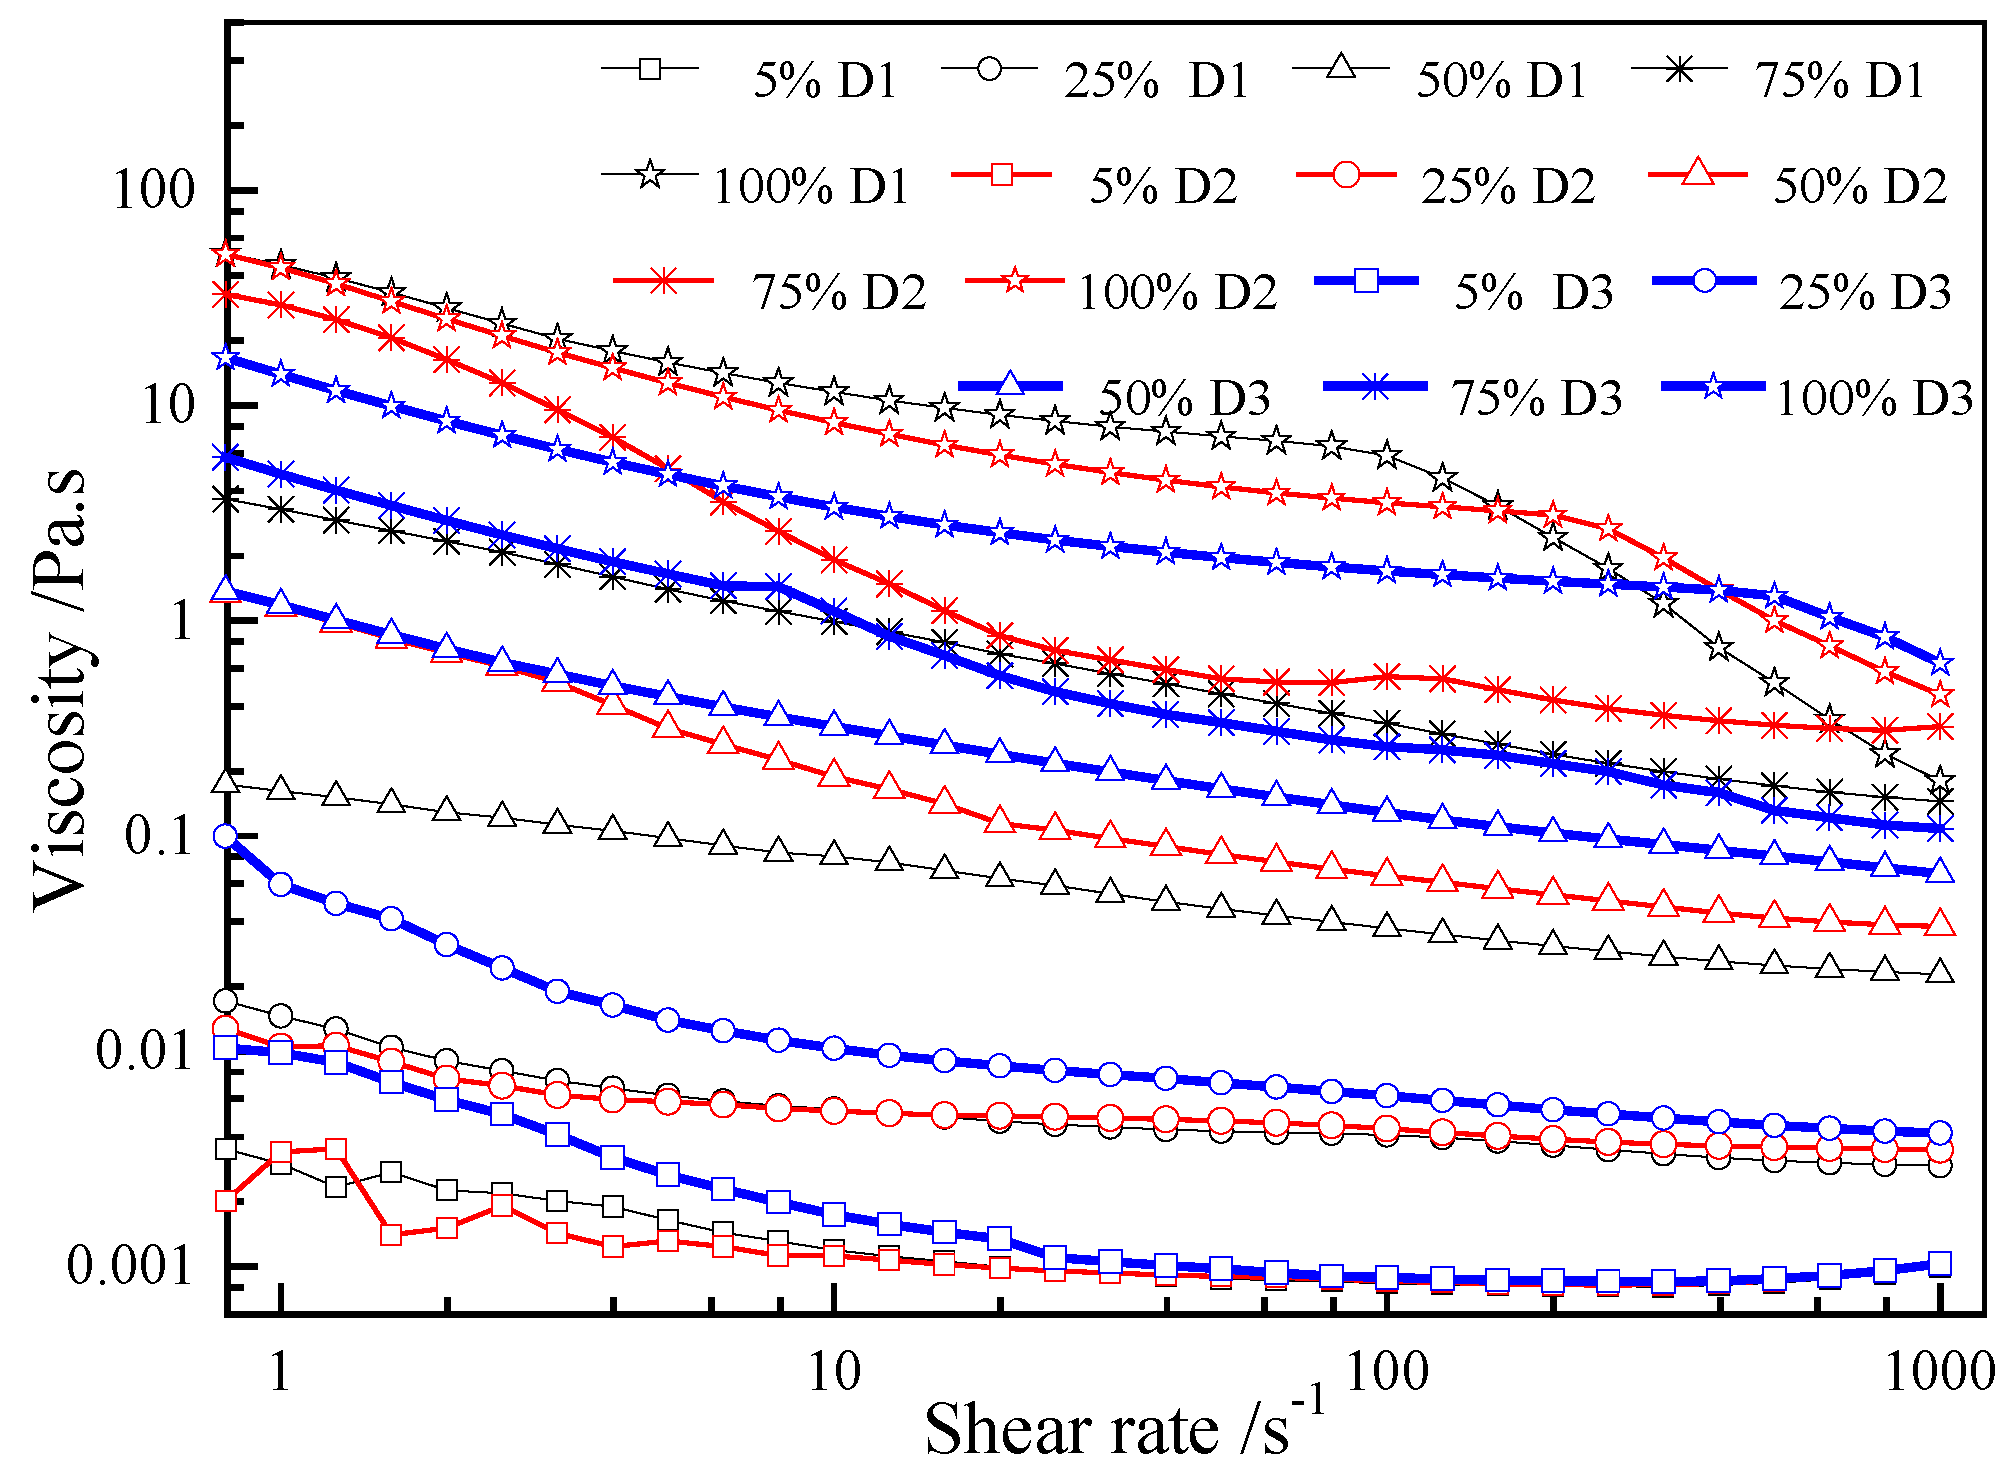
3.2. Effect of Cocoa Concentration on Viscosity

Figure 2 indicates the variation in the viscosity of the mixed solutions with the shear rate under different cocoa concentrations and chocolate percentages. The viscosity underwent a nonlinear decrease with the shear rate, and the cocoa concentration and chocolate percentage had a great influence on the viscosities of these mixed solutions. The artificial saliva was similar to the natural saliva in the ingredients. When artificial saliva was added to the chocolate to form the mixed solutions by means of outside heating, it was able to reduce the concentrations of cocoa, sugar and fat in these solutions, contributing to the fact that that the viscosity of the mixed chocolate solution showed a decreasing trend. As the mass percentage of the chocolates was 75% or 100%, the highest viscosity of the mixed solutions was not stationary. However, not in excess of a 50% percentage, the corresponding viscosity of the D3 solutions was the highest. At a 5% mass percentage, the viscosities of the three solutions were nearly equal to the increase in the shear rate. Therefore, the viscosity of the chocolate mixtures was related to the cocoa concentration, but they did not strictly conform to the same particular rule.
As depicted in Figure 3, the correlation coefficients between the silkiness and viscosity of the chocolate solutions of five percentages varied with the shear rate. The chocolate percentage had a greater influence on the correlation coefficient. Except for the 50% chocolate solutions, the correlation coefficients of all the percentages underwent an obvious fluctuation with the shear rate, especially for the 75% chocolate solutions. However, at no more than a 50% percentage, the correlation coefficients were lower than zero and were close to −1. Moreover, the correlation coefficients of the 50% chocolate solutions were close to −1. The results further confirmed that chocolate silkiness had a weaker relation to viscosity, as shown in Table 3 (25% involved).

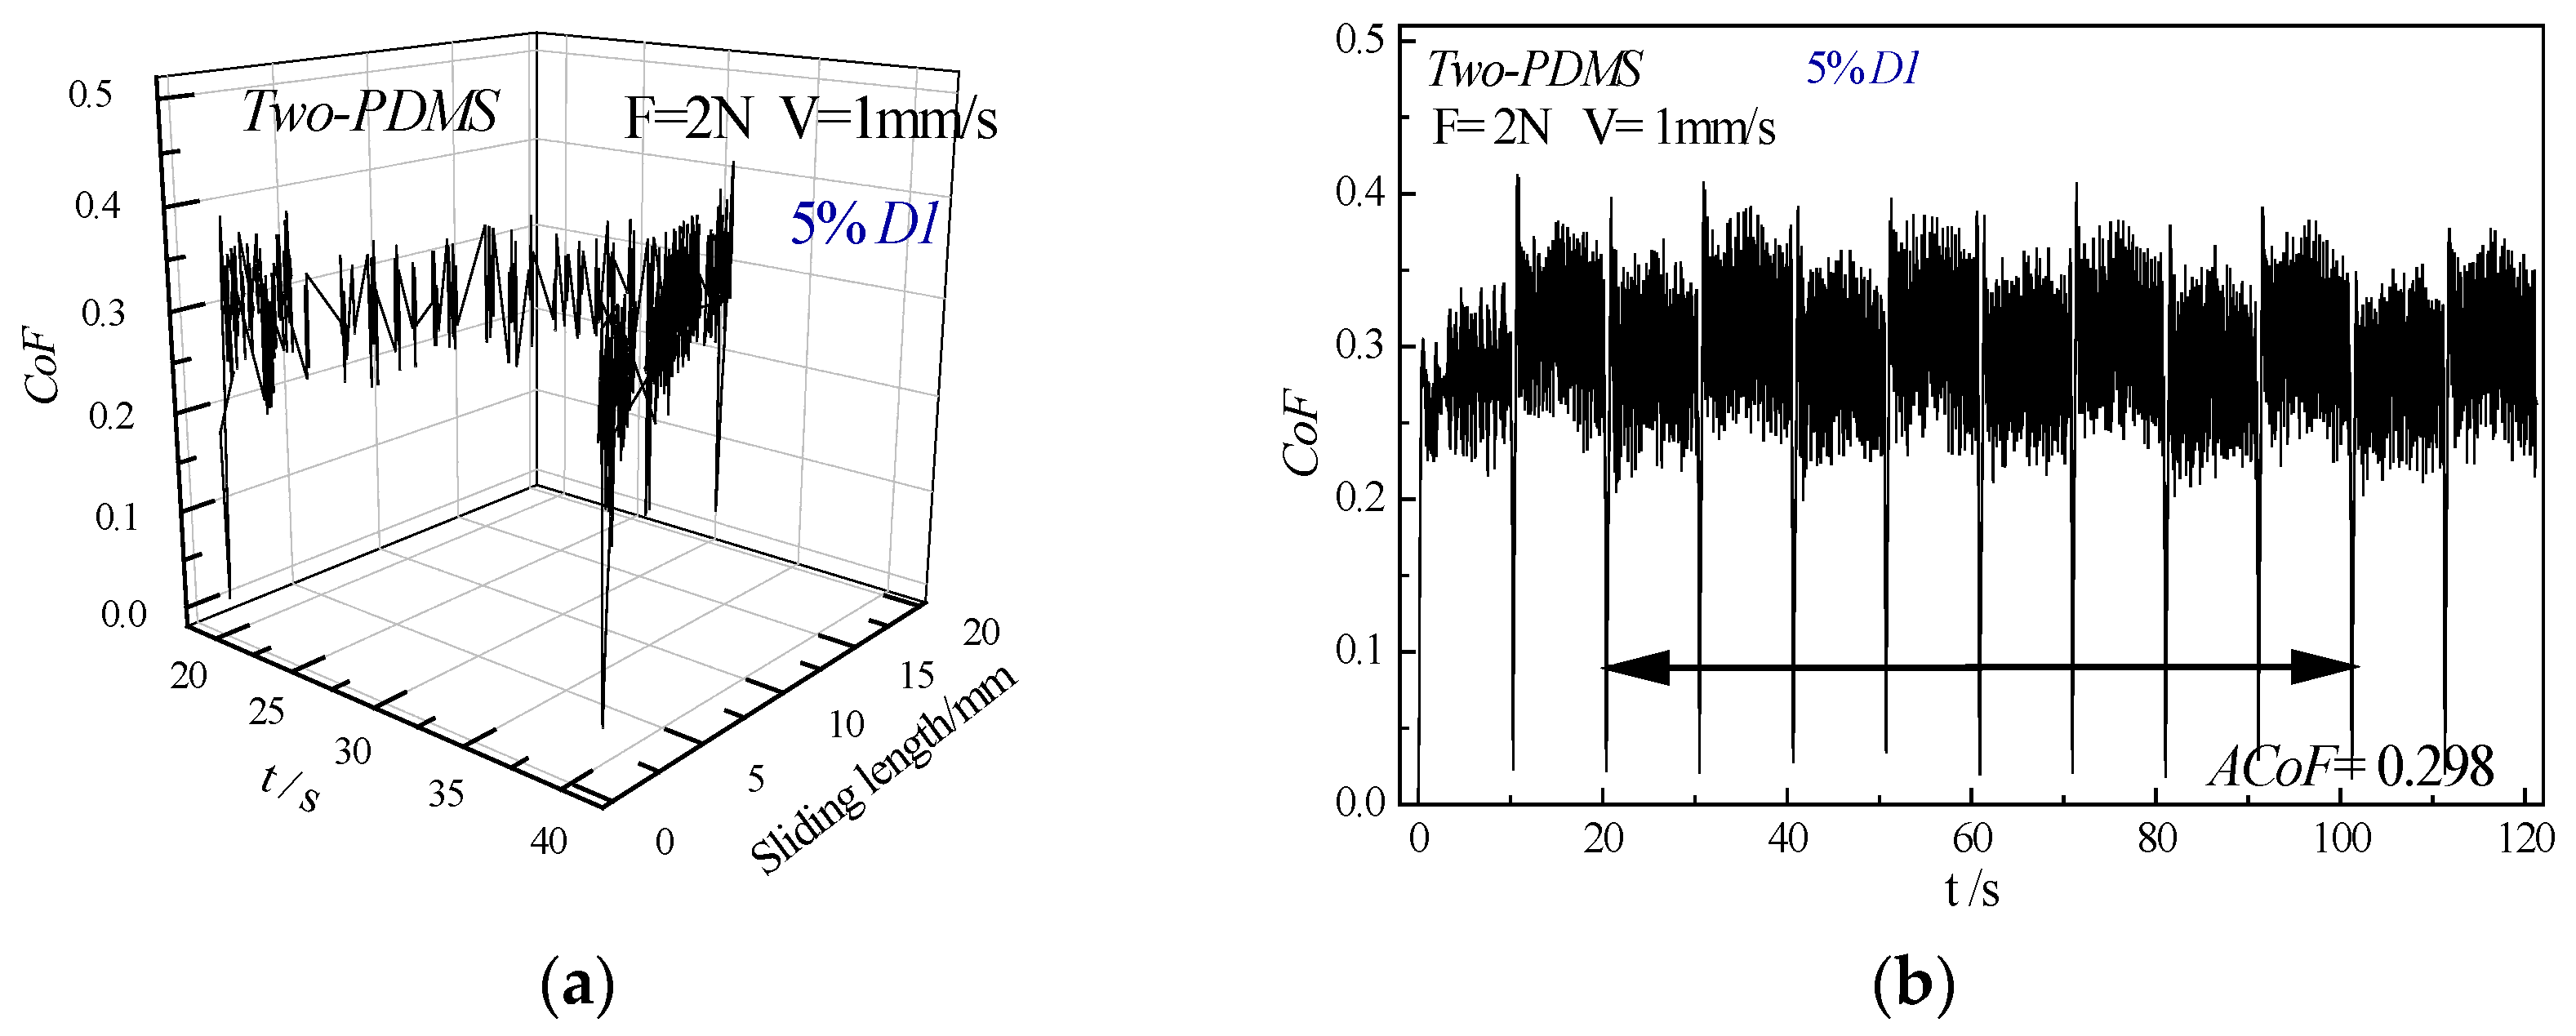
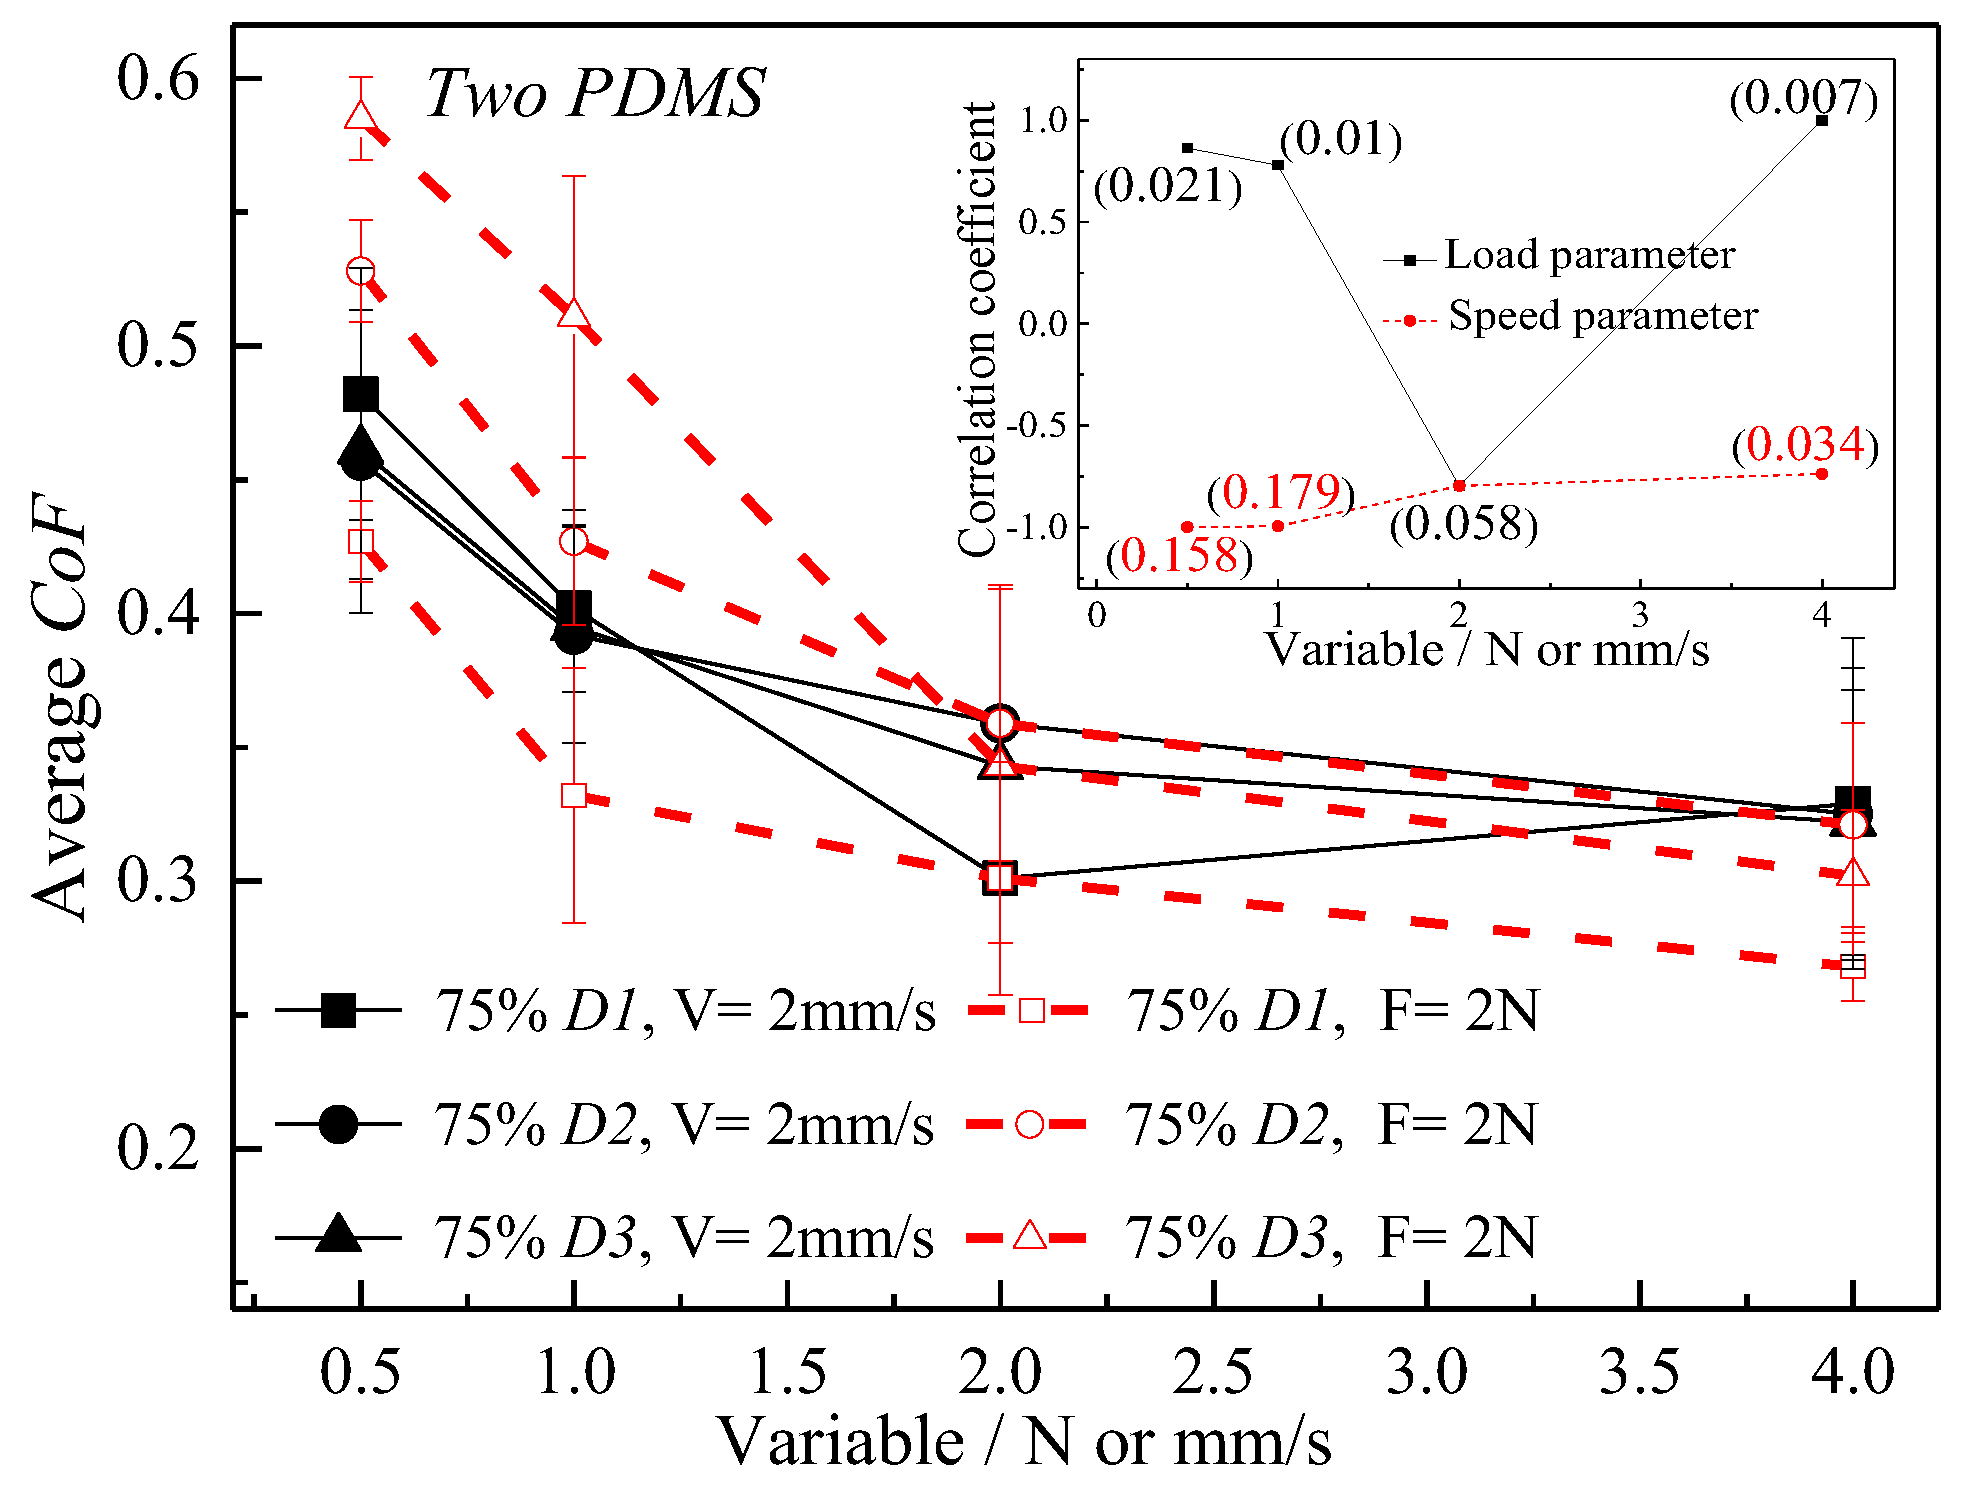
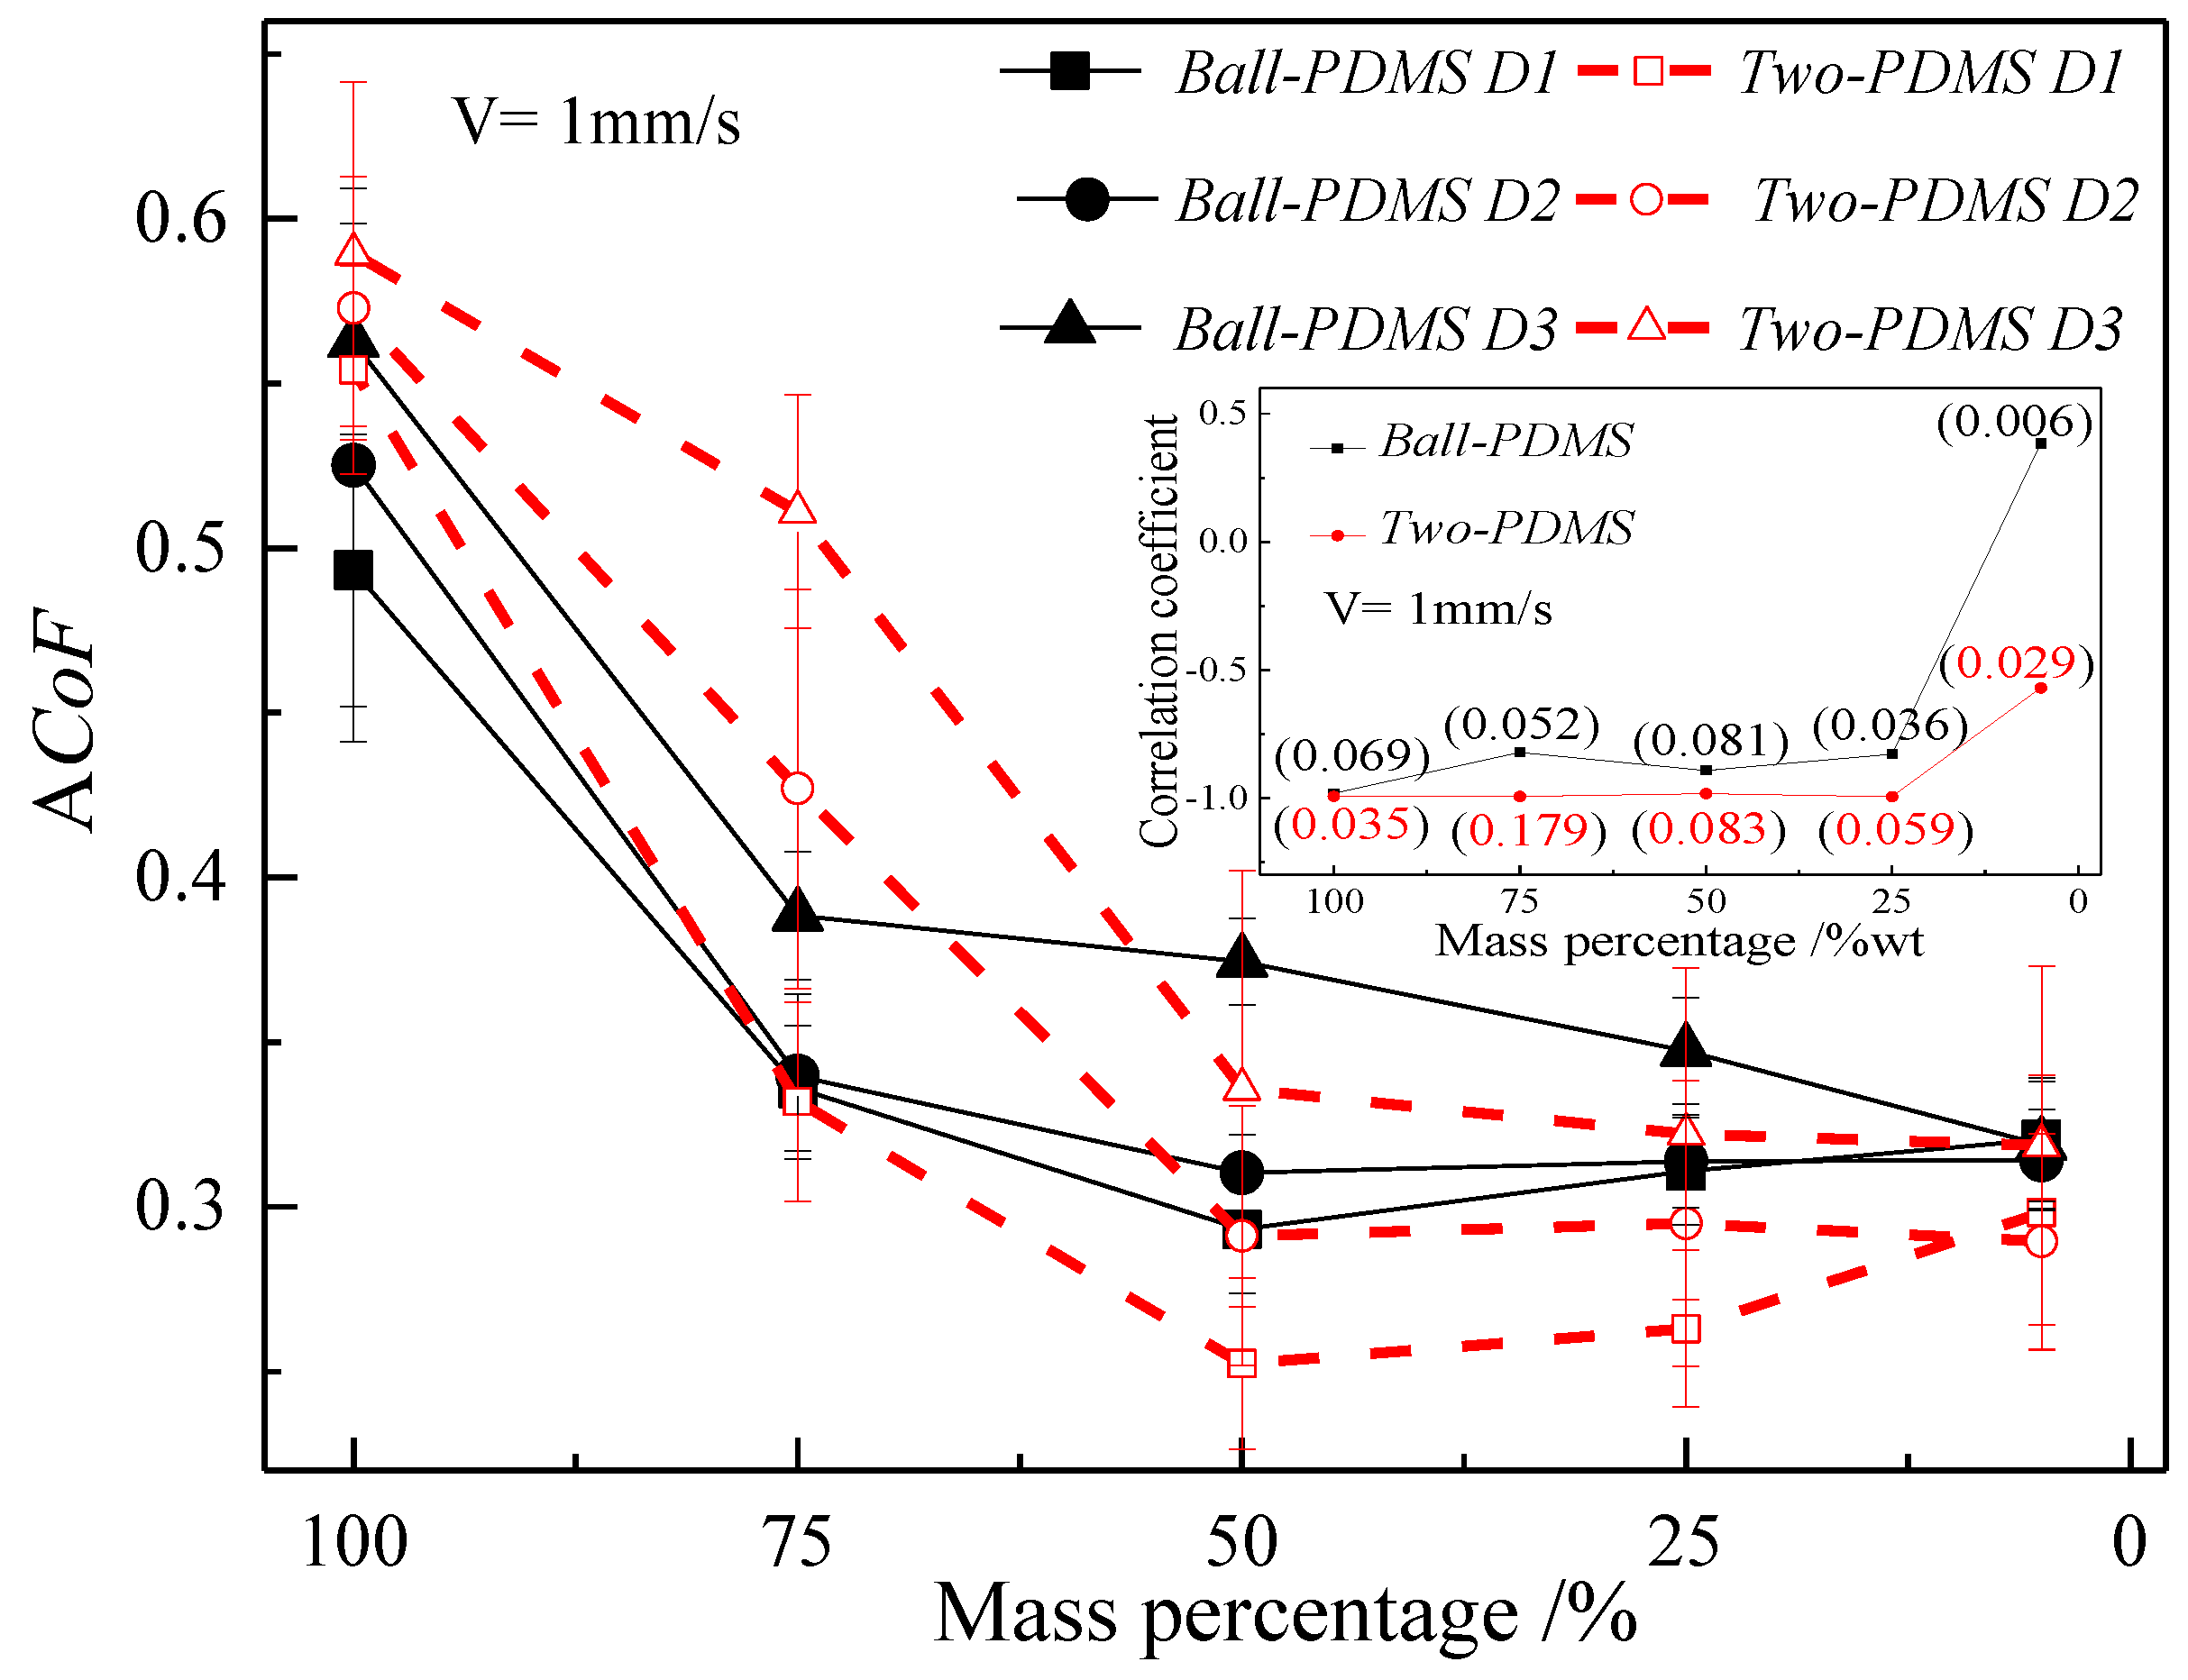
3.3. Effects of Cocoa Concentration on the Friction Property

Figure 4 shows that the CoF of the mixed solution containing 5% D1 chocolate varied with sliding time on the Two-PDMS rubbing pair (the spatial trajectory of the CoF with sliding length and time during the reciprocating sliding). At the end point of the same sliding direction, due to the change in sliding direction, the friction force and CoF sharply dropped to zero and sharply rose from zero to a certain value, as shown in Figure 4a. To eliminate the influence of its two ends on the CoF, the CoF in 30–70% of the sliding length (the zone ranged from 6 mm to 14 mm) was used to obtain the aCoF. Moreover, according to the variation in the CoF in Figure 4b, the CoF of the forward sliding was significantly lower than that of the reverse sliding, which might be highly related to the sample surface [36,37]. In addition, the CoF was not stable at the initial stage of the sliding process. Therefore, in the six sliding cycles, the average value of the four cycles from the second to the fifth cycle was determined to obtain the aCoF (0.298). In the subsequent investigation, the aCoF was obtained according to this method.
The aCoF of the mixed solutions varied with chocolate percentage under the two rubbing pairs and three cocoa concentrations, as shown in Figure 5. A one-way Analysis of Variance (ANOVA) was also performed to evaluate the covariance analysis of the aCoF results with chocolate percentage as a fixed factor, and with cocoa concentration and rubbing pair types as random factors. The main effects of the testing results of the chocolate percentage and cocoa concentration were significant (F = 58.265 (p < 0.001) for chocolate percentage, F = 8.652 (p = 0.002 < 0.05) for cocoa concentration), and the main effect of the rubbing pair was not significant (F = 0.328 (p = 0.573 > 0.05) for cocoa concentration). This indicates that the aCoF results have higher credibility. Under these test operating conditions, the chocolate percentage and cocoa concentration had a greater impact on the aCoF, but the rubbing pair had a small impact on the aCoF. It can be seen from the post-inspection that there was no significant difference in the aCoF between the three chocolate percentages of 5%, 25% and 50%, and the aCoFs of 75% and 100% were significantly different from the others. In most cases of lower chocolate percentage, the aCoFs of the Ball-PDMS pair were higher than those of the Two-PDMS pair. With the increase in cocoa concentration, the aCoF also increased at the same chocolate percentage. For the two rubbing pairs, the aCoFs of the D3 solutions were obviously higher than those of the D1 solutions. With the prolongation of oral processing time, the mass percentage of chocolate decreased, and the corresponding aCoF mainly depicted a decreasing trend and had obvious differences related to cocoa concentration. At the chocolate percentage lower than 75%, the aCoFs of the D2 solutions were almost equal regardless of the Ball-PDMS or Two-PDMS pairs. However, the aCoFs of the D1 solutions showed a firstly decreasing, and then, increasing change with a decrease in their percentages, irrespective of the ball-PDMS or Two-PDMS pairs. By contrast, the aCoFs of the mixed solutions with the chocolate percentage of 5% were almost equal for the same rubbing pair.
The correlation coefficients between the chocolate silkiness and the aCoF are also depicted in Figure 5. Commonly, the higher the chocolate silkiness was, the lower the aCoF, indicating that the correlation coefficient between them was close to −1. With a decrease in chocolate percentage, the correlation coefficients of the Two-PDMS pair were much closer to −1 than those of the Ball-PDMS pair. Moreover, the value in brackets for the variation in the correlation coefficient with mass percentage represents the maximum difference in the aCoFs of the three solutions at the corresponding correlation coefficients. It was found that the 75% solutions had the greatest difference (0.179) in the aCoFs of the Two-PDMS pair, but the differences in the other cases were all lower than 0.085, showing that the existing conditions were more conducive to the evaluation of their silkiness differences.
In addition, based on the mixed solution with 75% chocolate, the influences of load and speed on the friction properties were also determined. Figure 6 indicates the variation in the aCoFs of the mixed solutions with load or speed under the three cocoa concentrations. The black thin lines represent the variation in cocoa concentration with load under the same speed, while the red thick lines represent the variation in cocoa concentration with speed under the same load. A one-way analysis of variance was also employed to evaluate the covariance analysis of the aCoF results with sliding speed or load as a fixed factor, and cocoa concentration as a random factor. It was found that the main effects of the testing results of the sliding speed, load and cocoa concentration-related speed were significant (F = 18.543 (p = 0.002) for the speed, F = 35.262 (p < 0.001) for the load and F = 7.603 (p = 0.023) for cocoa concentration-related speed), and the main effects of the cocoa concentration-related load were not significant (F = 0.063 (p = 0.939)). This indicates that the aCoF results had higher credibility. The aCoF decreased with increasing load or speed, but the effect of load on the aCoF of the chocolate solutions was significantly higher than that of speed. This was also confirmed by the correlation coefficient between the aCoF and chocolate silkiness. The correlation coefficients of the speed were mainly better than those of the load. Furthermore, the aCoF difference among the three chocolate solutions at the testing parameters of 2 N and 1 mm/s was the highest (0.179), indicating that it was very important to choose a suitable load and speed to evaluate the friction property of the chocolates.

3.4. Discussions

Chocolate is a very nice food, and its silkiness is one of the extremely important attributes of high-grade products, and brings a pleasant experience to consumers. According to the existing taste assessments and testing results, oral processing time and test parameters played an important role in chocolate’s silkiness, and cocoa concentration also played some roles.
According to the results of the current food sensory assessment, the D2 and D3 samples were basically of medium silkiness, and only the D1 sample reached high silkiness. The main components of these three chocolates are listed in Table 1. It was found that the fat and sugar concentrations of the D1 and D2 products were relatively similar, but there was still a bigger difference in the silkiness of these two chocolates. In the main components of the three chocolates, the difference in the cocoa concentration was the highest, which also preliminarily confirmed that cocoa concentration played certain role in silkiness for the same brand of chocolates. Based on the feedback from the 32 subjects in Table 3, most of them believed that the chocolate silkiness was highly related to its melting speed. In the chocolate, a higher cocoa concentration could probably lead to an increase in its melting point in the oral cavity, further leading to a slower melting speed and a difference in the silkiness. In addition, only 25% of the subjects thought that chocolate silkiness was related to its viscosity, which was also confirmed by the correlation coefficients between the viscosity and silkiness of the chocolate solutions in Figure 3.
From the perspective of the rubbing pair used in the mixed chocolate solutions, the lower sample of soft-PDMS containing a few papillae underwent reciprocating sliding, while the upper sample of the ceramics ball or hard-PMDS was stable. Soft-PDMS, the ceramic ball and hard-PMDS were similar to natural tongue, teeth and the upper palate, respectively. As shown in Figure 7, the Ball-PDMS and Two-PDMS rubbing pairs were representative of mutual sliding of the tongue and teeth and of the tongue and palate, respectively. Therefore, the rubbing pairs in this study were much closer to the oral processing of the chocolate, and the results were more instructive.
In the reciprocating sliding of the soft rubbing pair, the friction force suffered by the soft material mainly comes from the adhesion friction force Fadh and deformation friction force Fdef (hysteresis friction force), as presented in Figure 7 [38]. The Fadh mainly comes from the interaction of molecules on the surfaces of the rubbing pair, that is to say, the formation and destruction of the connection points (green point in Figure 7) of these molecules on the surfaces. When the upper and lower surfaces between the rubbing pair began to slide relatively to each other, the chains on the two surfaces always wanted to combine with the matrix molecules to form a new adhesion. Before the formation of the new adhesion point, the chain would undergo the process of stretching and breaking under the sliding action, which enabled the molecules of the soft material’s surface to jump vigorously for a certain distance to reach the new equilibrium adhesion point. The process of stretching and breaking was accompanied by energy consumption. The Fadh was also essentially a surface force, which was obtained by calculating the energy consumed and its elastic deformation in the sliding process [39]. Additionally, the Fdef mainly came from the fact that the soft material could not recover in time to its original shape under the external load. When the relative motion of the two rubbing pairs occurred, the stress would gather at the forefront of the micro peak on the rubbing surface, resulting in forward migration of the contact area location and asymmetric pressure distribution. At this moment, the horizontal component of the stress would produce a lagging force and hinder its sliding. Therefore, the Fdef of the soft material was a volume force and mainly obtained through analysis of the elastic deformation and the loss of energy in the sliding process.
In the current study, the elastic modulus of the ceramic ball was much higher than that of PDMS, so all deformation was concentrated on the soft-PDMS. The adhesion action between the ceramic ball and soft-PDMS was relatively lower. Therefore, the Fdef played an important role in the Ball-PDMS pair. However, in the Two-PDMS rubbing pair, the load was together borne by the hard-PDMS and soft-PDMS due to the larger contact area, and its total deformation was relatively small, so the Fdef played a smaller role. Due to the two materials being made of the same raw material, their adhesion action played a greater role between hard-PDMS and soft-PDMS. The Fdef of the Ball-PDMS pairs was higher than that of the Two-PDMS pairs, but the Fadh of the former pair was lower than that of the latter pair. Therefore, in most cases, the aCoF of the Ball-PDMS pair was higher than that of the Two-PDMS pair (Figure 5). Similar results have been reported in other soft rubbing pairs [37,40]. From the sensory evaluation of chocolate products, a lower aCoF is thought to be much closer to the silkiness degree in the oral environment.
In addition, the chocolate solution, containing several substances such as sugar and fat, entered the contact area and mainly improved the adsorption performance of the rubbing surfaces. Sugar enhanced the Fadh between the two rubbing pair surfaces, so the mixed solutions with higher chocolate percentages led to a higher aCoF. However, the solutions also included a certain amount of fat, which would stick to the surface of the rubbing pair and perform a lubrication function to some extent. Therefore, with a decrease in chocolate percentage, the aCoF underwent a firstly decreasing then increasing variation. When the chocolate percentage was very low, these sugars and fats played a smaller role, and the aCoFs of all three groups of mixed solutions tended to be equal. Moreover, at the end of each test, a layer of chocolate solution still remained on the surfaces of the soft-PDMS, indicating that the mixed solutions all may have entered the contact zone during the whole experiment and were in a mixed or fluid lubrication state.
The load and speed exhibited a great influence on the CoF in the Two-PDMS pair. When the sliding speed increased, the contacting time of the two rubbing pairs decreased, and the resulting Fdef and Fadh between the two pairs both tended to be decreased. The aCoF decreased with increasing speed. However, the increase in the external load led to an increase in the total deformation of the two rubbing pairs, which also enhanced the Fdef and Fadh of the rubbing pairs. However, the increase in the amplitude of the total friction forces was lower than that of the external load, resulting in the fact that the aCoF (obtained via the ratio of total friction forces to external load) tended to decrease. Therefore, a higher load could lead to a lower CoF, which has often been reported in soft rubbing pairs in previous literature [37]. For human beings, their special swallowing abilities are different, especially their swallowing pressure and speed [41]. From another point of view, different age groups of the same commodity could feel different silkiness degrees, and the corresponding measured aCoFs were not equal. In this way, factors such as consumers’ ages and patients’ symptoms will be taken into full consideration in the future study and development of the functional food.
Therefore, from the correlation between the aCoFs of the chocolate solutions and the silkiness evaluation results of the chocolates, the correlation coefficient of the Two-PDMS pair tends to be much closer to −1, which is more suitable for the silkiness evaluation of chocolate products. Based on the differences in the measured aCoFs of the same chocolate solution, the aCoF difference at a load of 2 N and a speed of 1 mm/s was the highest. This also confirms that it is also highly significant to select suitable testing parameters to evaluate some attributes of certain foods.
It is worth highlighting that the subjects had to repeatedly taste the chocolates, and then, they gave their final values of the silkiness degree in the sensory assessment process. It took a few attempts to achieve the assessment process. Hence, it was concluded that the total value of the chocolate silkiness would not be determined at the beginning, but during the whole process of oral processing, which is significantly correlated with chocolate constituents. In combination with the correlation coefficient in Figure 5 and Figure 6, it was thought that the mixed solutions with 75% chocolate could be used to characterize the silkiness attribute of the chocolates using the Two-PDMS pair with the parameters of 2 N and 1 mm/s. This could be considered to be a rapid method of evaluating the silkiness of certain foods in the future.

4. Conclusions

In this study, the chocolate silkiness for a single brand preliminarily had a negative correlation with the cocoa concentration. With decreasing chocolate percentage, the viscosity of the mixed solutions decreased, but the chocolate silkiness was poorly correlated with the viscosity of the mixed solutions. The chocolate percentage, rubbing pair, load and speed played a prominent role in the correlation coefficient of chocolate silkiness with the aCoFs. Moreover, it is thought that the 75% chocolate solutions at 2 N and 1 mm/s using the Two-PDMS pair could be highly representative of the silkiness characteristic in the oral environment. This study provides better insight into the characterization of certain attributes of similar foods.

Author Contributions

Conceptualization, S.Q. and Z.N.; Methodology, S.Q. and F.X.; Software, S.C.; Validation, S.C., and L.W.; Formal Analysis, S.C. and L.W.; Investigation, S.Q. and Z.N.; Resources, S.Q.; Data Curation, Z.N.; Writing—Original Draft Preparation, Z.N. and S.C.; Writing—Review and Editing, S.Q.; Visualization, S.Q.; Supervision, S.Q.; Project Administration, S.Q.; Funding Acquisition, S.Q. All authors have read and agreed to the published version of the manuscript.

Funding

This study was supported by the National Natural Science Foundation of China (51775244) and the Jiangsu Key Laboratory of Advanced Food Manufacturing Equipment and Technology (FMZ202204).

Data Availability Statement

The experimental data are available on request.

Conflicts of Interest

The authors declare that they have no conflicts of interest.

References

  1. Lonchampt, P.; Hartel, R.W. Fat bloom in chocolate and compound coatings. Eur. J. Lipid Sci. Technol. 2004, 106, 241–274. [Google Scholar] [CrossRef]
  2. Fernandes, V.A.; Muller, A.J.; Sandoval, A.J. Thermal, structural and rheological characteristics of dark chocolate with different compositions. J. Food Eng. 2013, 116, 97–108. [Google Scholar] [CrossRef]
  3. Glicerina, V.; Balestra, F.; Dalla Rosa, M.; Romani, S. Microstructural and rheological characteristics of dark, milk and white chocolate: A comparative study. J. Food Eng. 2016, 169, 165–171. [Google Scholar] [CrossRef]
  4. Vasquez, C.; Henriquez, G.; Lopez, J.V.; Penott-Chang, E.K.; Sandoval, A.J.; Muller, A.J. The effect of composition on the rheological behavior of commercial chocolates. Lwt-Food Sci. Technol. 2019, 111, 744–750. [Google Scholar] [CrossRef]
  5. Ren, S.; Barringer, S. Electrohydrodynamic spraying quality of different chocolate formulations. J. Electrost. 2016, 84, 121–127. [Google Scholar] [CrossRef]
  6. Rodrigues, S.A.; Selway, N.; Morgenstern, M.P.; Motoi, L.; Stokes, J.R.; James, B.J. Lubrication of chocolate during oral processing. Food Funct. 2017, 8, 533–544. [Google Scholar] [CrossRef]
  7. Silva, G.D.J.; Ferreira Goncalves, B.H.R.; De Jesus, J.C.; Teixeira Ribeiro Vidigal, M.C.; Minim, L.A.; Ferreira, S.O.; Ferreira Bonomo, R.C.; Barbosa Ferrao, S.P. Study of the structural properties of goat’s milk chocolates with different concentrations of cocoa mass. J. Texture Stud. 2019, 50, 547–555. [Google Scholar] [CrossRef]
  8. Parsons, J.G.; Keeney, P.G. Phospholipid concentration in cocoa butter and its relationship to viscosity in dark chocolate. J. Am. Oil Chem. Soc. 1969, 46, 425–427. [Google Scholar] [CrossRef]
  9. Lee, S.; Biresaw, G.; Kinney, M.P.; Inglett, G.E. Effect of cocoa butter replacement with a beta-glucan-rich hydrocolloid (C-trim30) on the rheological and tribological properties of chocolates. J. Sci. Food Agric. 2009, 89, 163–167. [Google Scholar] [CrossRef]
  10. Kokini, J.L.; Kadane, J.B.; Cussler, E.L. Liquid texture perceived in the mouth. J. Texture Stud. 1977, 8, 195–218. [Google Scholar] [CrossRef]
  11. Wijk, R.A.D.; Prinz, J.F. The role of friction in perceived oral texture. Food Qual. Prefer. 2005, 16, 121–129. [Google Scholar] [CrossRef]
  12. De Wijk, R.A.; Prinz, J.F. Mechanisms underlying the role of friction in oral texture. J. Texture Stud. 2006, 37, 413–427. [Google Scholar] [CrossRef]
  13. Subramanian, S.; Viswanathan, R. Bulk density and friction coefficients of selected minor millet grains and flours. J. Food Eng. 2007, 81, 18–126. [Google Scholar] [CrossRef]
  14. Dresselhuis, D.M.; De Hoog, E.H.A.; Stuart, M.A.C.; Van Aken, G.A. Application of oral tissue in tribological measurements in an emulsion perception context. Food Hydrocoll. 2008, 22, 323–335. [Google Scholar] [CrossRef]
  15. Meyer, D.; Vermulst, J.; Tromp, R.H.; De Hoog, E.H.A. The effect of inulin on tribology and sensory profiles of skimmed milk. J. Texture Stud. 2011, 42, 387–393. [Google Scholar] [CrossRef]
  16. Luengo, G.; Tsuchiya, M.; Heuberger, M.; Israelachvili, J. Thin film rheology and tribology of chocolate. J. Food Sci. 1997, 62, 767–812. [Google Scholar] [CrossRef]
  17. Carvalho-da-Silva, A.M.; Van Damme, I.; Taylor, W.; Hort, J.; Wolf, B. Oral processing of two milk chocolate samples. Food Funct. 2013, 4, 461–469. [Google Scholar] [CrossRef]
  18. Taylor, B.L.; Mills, T.B. Using a three-ball-on-plate configuration for soft tribology applications. J. Food Eng. 2020, 274, 109838. [Google Scholar] [CrossRef]
  19. Joyner, H.S.; Pernell, C.W.; Daubert, C.R. Impact of parameter settings on normal force and gap height during tribological measurements. J. Food Eng. 2014, 137, 51–63. [Google Scholar] [CrossRef]
  20. Chen, J.; Liu, Z.; Prakash, S. Lubrication studies of fluid food using a simple experimental set up. Food Hydrocoll. 2014, 42, 100–105. [Google Scholar] [CrossRef]
  21. Mo, L.; Chen, J.; Wang, X. A novel experimental set up for in situ oral lubrication measurements. Food Hydrocoll. 2019, 95, 396–405. [Google Scholar] [CrossRef]
  22. Liu, Y.; Hu, J.; Zhong, M.; Xu, W. A novel, simple and rapid method for the detection of melamine from milk based on tribology measurements. Tribol. Int. 2018, 119, 66–72. [Google Scholar] [CrossRef]
  23. Liu, Y.; Qu, F.; Luo, L.; Xu, W.; Zhong, M. Detection of rice syrup from acacia honey based on lubrication properties measured by tribology technique. Tribol. Int. 2019, 129, 239–245. [Google Scholar] [CrossRef]
  24. Masen, M.; Cann, P.M.E. Friction measurements with molten chocolate. Tribol. Lett. 2018, 66, 24. [Google Scholar] [CrossRef]
  25. Mantihal, S.; Prakash, S.; Godoi, F.C.; Bhandari, B. Effect of additives on thermal, rheological and tribological properties of 3D printed dark chocolate. Food Res. Int. 2019, 119, 161–169. [Google Scholar] [CrossRef] [PubMed]
  26. He, Q.; Bramante, F.; Davies, A.; Elleman, C.; Fourtouni, K.; Wolf, B. Material properties of ex vivo milk chocolate boluses examined in relation to texture perception. Food Funct. 2018, 9, 3532–3546. [Google Scholar] [CrossRef] [PubMed]
  27. Bongaerts, J.H.H.; Rossetti, D.; Stokes, J.R. The lubricating properties of human whole saliva. Tribol. Lett. 2007, 27, 277–287. [Google Scholar] [CrossRef]
  28. Lee, S.; Heuberger, M.; Rousset, P.; Spencer, N.D. A tribological model for chocolate in the mouth: General implications for slurry-lubricated hard/soft sliding counterfaces. Tribol. Lett. 2004, 16, 239–249. [Google Scholar] [CrossRef]
  29. Segovia, C.; Hutchinson, I.; Laing, D.G.; Jinks, A.L. A quantitative study of fungiform papillae and taste pore density in adults and children. Dev. Brain Res. 2002, 138, 135–146. [Google Scholar] [CrossRef]
  30. Essick, G.K.; Chopra, A.; Guest, S.; McGlone, F. Lingual tactile acuity, taste perception, and the density and diameter of fungiform papillae in female subjects. Physiol. Behav. 2003, 80, 289–302. [Google Scholar] [CrossRef]
  31. Just, T.; Stave, J.; Pau, H.W.; Guthoff, R. In vivo observation of papillae of the human tongue using confocal laser scanning microscopy. ORL J. Otorhinolaryngol. Relat. Spec. 2005, 67, 207–212. [Google Scholar] [CrossRef] [PubMed]
  32. Chen, N.; Yang, X.; Zuniga, J.R. Quantitative studies of taste and fungiform papillae on the anterior human tongue. Chin. J. Stomatol. 1998, 33, 140–142. [Google Scholar]
  33. Correa, M.; Hutchinson, I.; Laing, D.G.; Jinks, A.L. Changes in fungiform papillae density during development in humans. Chem. Senses 2013, 38, 519–527. [Google Scholar] [CrossRef] [PubMed]
  34. Xie, K.W.; Zebin Li, Z.B.; Deng, Y.; Zhang, Q.; Zhong, S.Y.; Cai, J.J.; Chang, L.X. Stress-laser composite fabrication of right-angle microgrooves on polydimethylsiloxane flexible substrate. Polym. Mater. Sci. Eng. 2022, 38, 106–112. [Google Scholar]
  35. Qian, S.H.; Cheng, S.; Liu, Z.; Xu, F.F.; Yu, J.H. A rapid method to evaluate the chocolate smoothness based on the tribological measurement. J. Texture Stud. 2020, 51, 882–890. [Google Scholar] [CrossRef] [PubMed]
  36. Qian, S.; Zhang, L.; Ni, Z.F.; Huang, C.; Zhang, D. Investigation of contact characteristics and frictional properties of natural articular cartilage at two different surface configurations. J. Mater. Sci. Mater. Med. 2017, 28, 84. [Google Scholar] [CrossRef]
  37. Qian, S.; Liu, L.; Ni, Z.; Luo, Y. Experimental investigation of the dynamic properties of natural cartilage under reciprocating sliding at two typical rubbing pairs. J. Eng. Tribol. 2019, 233, 1318–1326. [Google Scholar] [CrossRef]
  38. Moore, D.F. The Friction and Lubrication of Elastomers; Pergamon Press: Oxford, UK, 1972. [Google Scholar]
  39. Guo, Y.; Wang, J.; Li, F.; Pan, D.; Li, K. Theory of adhesion-hysteresis-fatigue of elastomeric tribology and experimental demonstration. Tribology 2013, 33, 443–448. [Google Scholar]
  40. Su, B.; Huang, W.; Wang, X. Distribution effect of surface texture on the elastic deformation in soft contacts. Ind. Lubr. Tribol. 2019, 71, 1194–1199. [Google Scholar] [CrossRef]
  41. Peng, C.L.; Jost-Brinkmann, P.G.; Miethke, R.R.; Lin, C.T. Ultrasonographic measurement of tongue movement during swallowing. J. Ultrasound Med. 2000, 19, 15–20. [Google Scholar] [CrossRef] [Green Version]
Figure 1. Schematic of the wear tester with the PDMS and surface topography of soft-PDMS.
Lubricants 10 00217 g001
Figure 2. Variation in viscosity of the mixed solutions with shear rate under different cocoa concentrations and chocolate percentages.
Lubricants 10 00217 g002
Figure 3. Variation in correlation coefficients between the silkiness and viscosity of five kinds of chocolate solutions with shear rate.
Lubricants 10 00217 g003
Figure 4. Variation in CoF of the mixed solution containing 5% D1 chocolate with time on the Two-PDMS rubbing pair. (a) 3D of CoF, (b) 2D of CoF.
Lubricants 10 00217 g004
Figure 5. Variation in aCoF of mixture solutions with the chocolate percentage under two rubbing pairs and three cocoa concentrations (the value in brackets represents the maximum differences in the aCoFs of the three solutions at the corresponding correlation coefficients).
Lubricants 10 00217 g005
Figure 6. Variation in aCoF and correlation coefficient of mixed solutions with loads or speeds under three cocoa concentrations (the value in brackets represents the maximum difference in the aCoFs of the three solutions at the corresponding correlation coefficients).
Lubricants 10 00217 g006
Figure 7. Schematic of two rubbing pairs with soft-PDMS.
Lubricants 10 00217 g007
Table 1. Main components of the same brand with three cocoa concentrations (per 100 g).
ChocolateEnergy (kJ)Cocoa (%)Protein (g)Fat (g)Carbohydrates (g)
D12270256.331.657
D22177485.733.559.1
D32388667.144.848.1
Table 2. Experimental parameters at different loads and speeds.
Load GroupSpeed Group
VariableLoad (N)Speed (mm/s)Time (s)Load (N)Speed (mm/s)Time (s)
Value0.5212020.5480
11240
22120
4460
Table 3. Related attributes of chocolate silkiness (total of 32 subjects).
Affected AttributesEvaluated CriterionInvolved Subjects
Melting speedHigher melting speed produced more silkiness20 (62.5%)
HardnessLower hardness produced more silkiness10 (31.2%)
ViscosityLower viscosity produced more silkiness8 (25%)
Particle sensationLower particle sensation produced more silkiness7 (21.9%)
Publisher’s Note: MDPI stays neutral with regard to jurisdictional claims in published maps and institutional affiliations.

