Nano- and Micro-Tribological Investigations of Boundary Layers on Axial Bearing Washers Tested under WEC Critical Conditions


Abstract
:1. Introduction
2. Materials and Methods
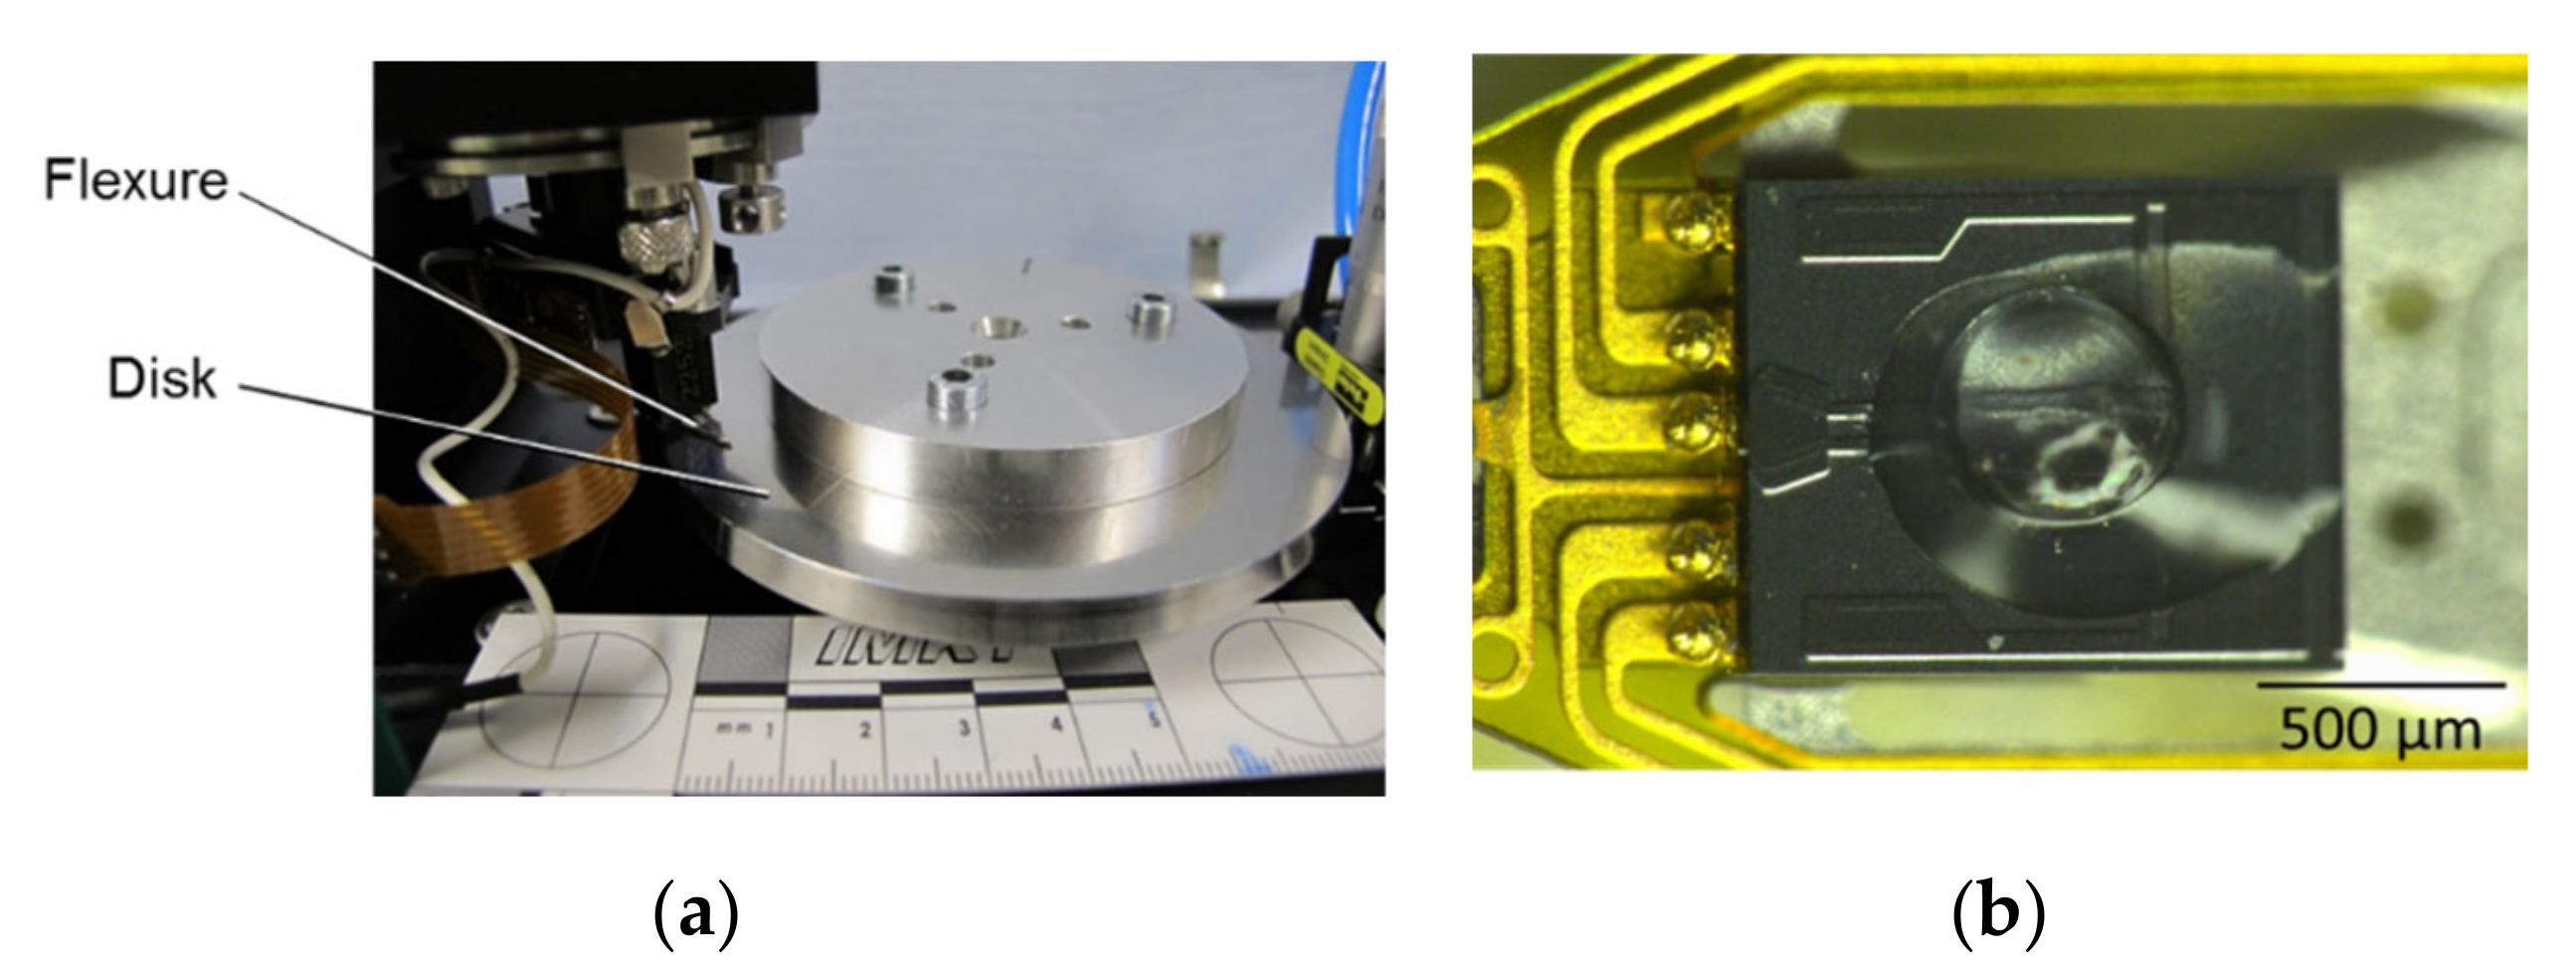
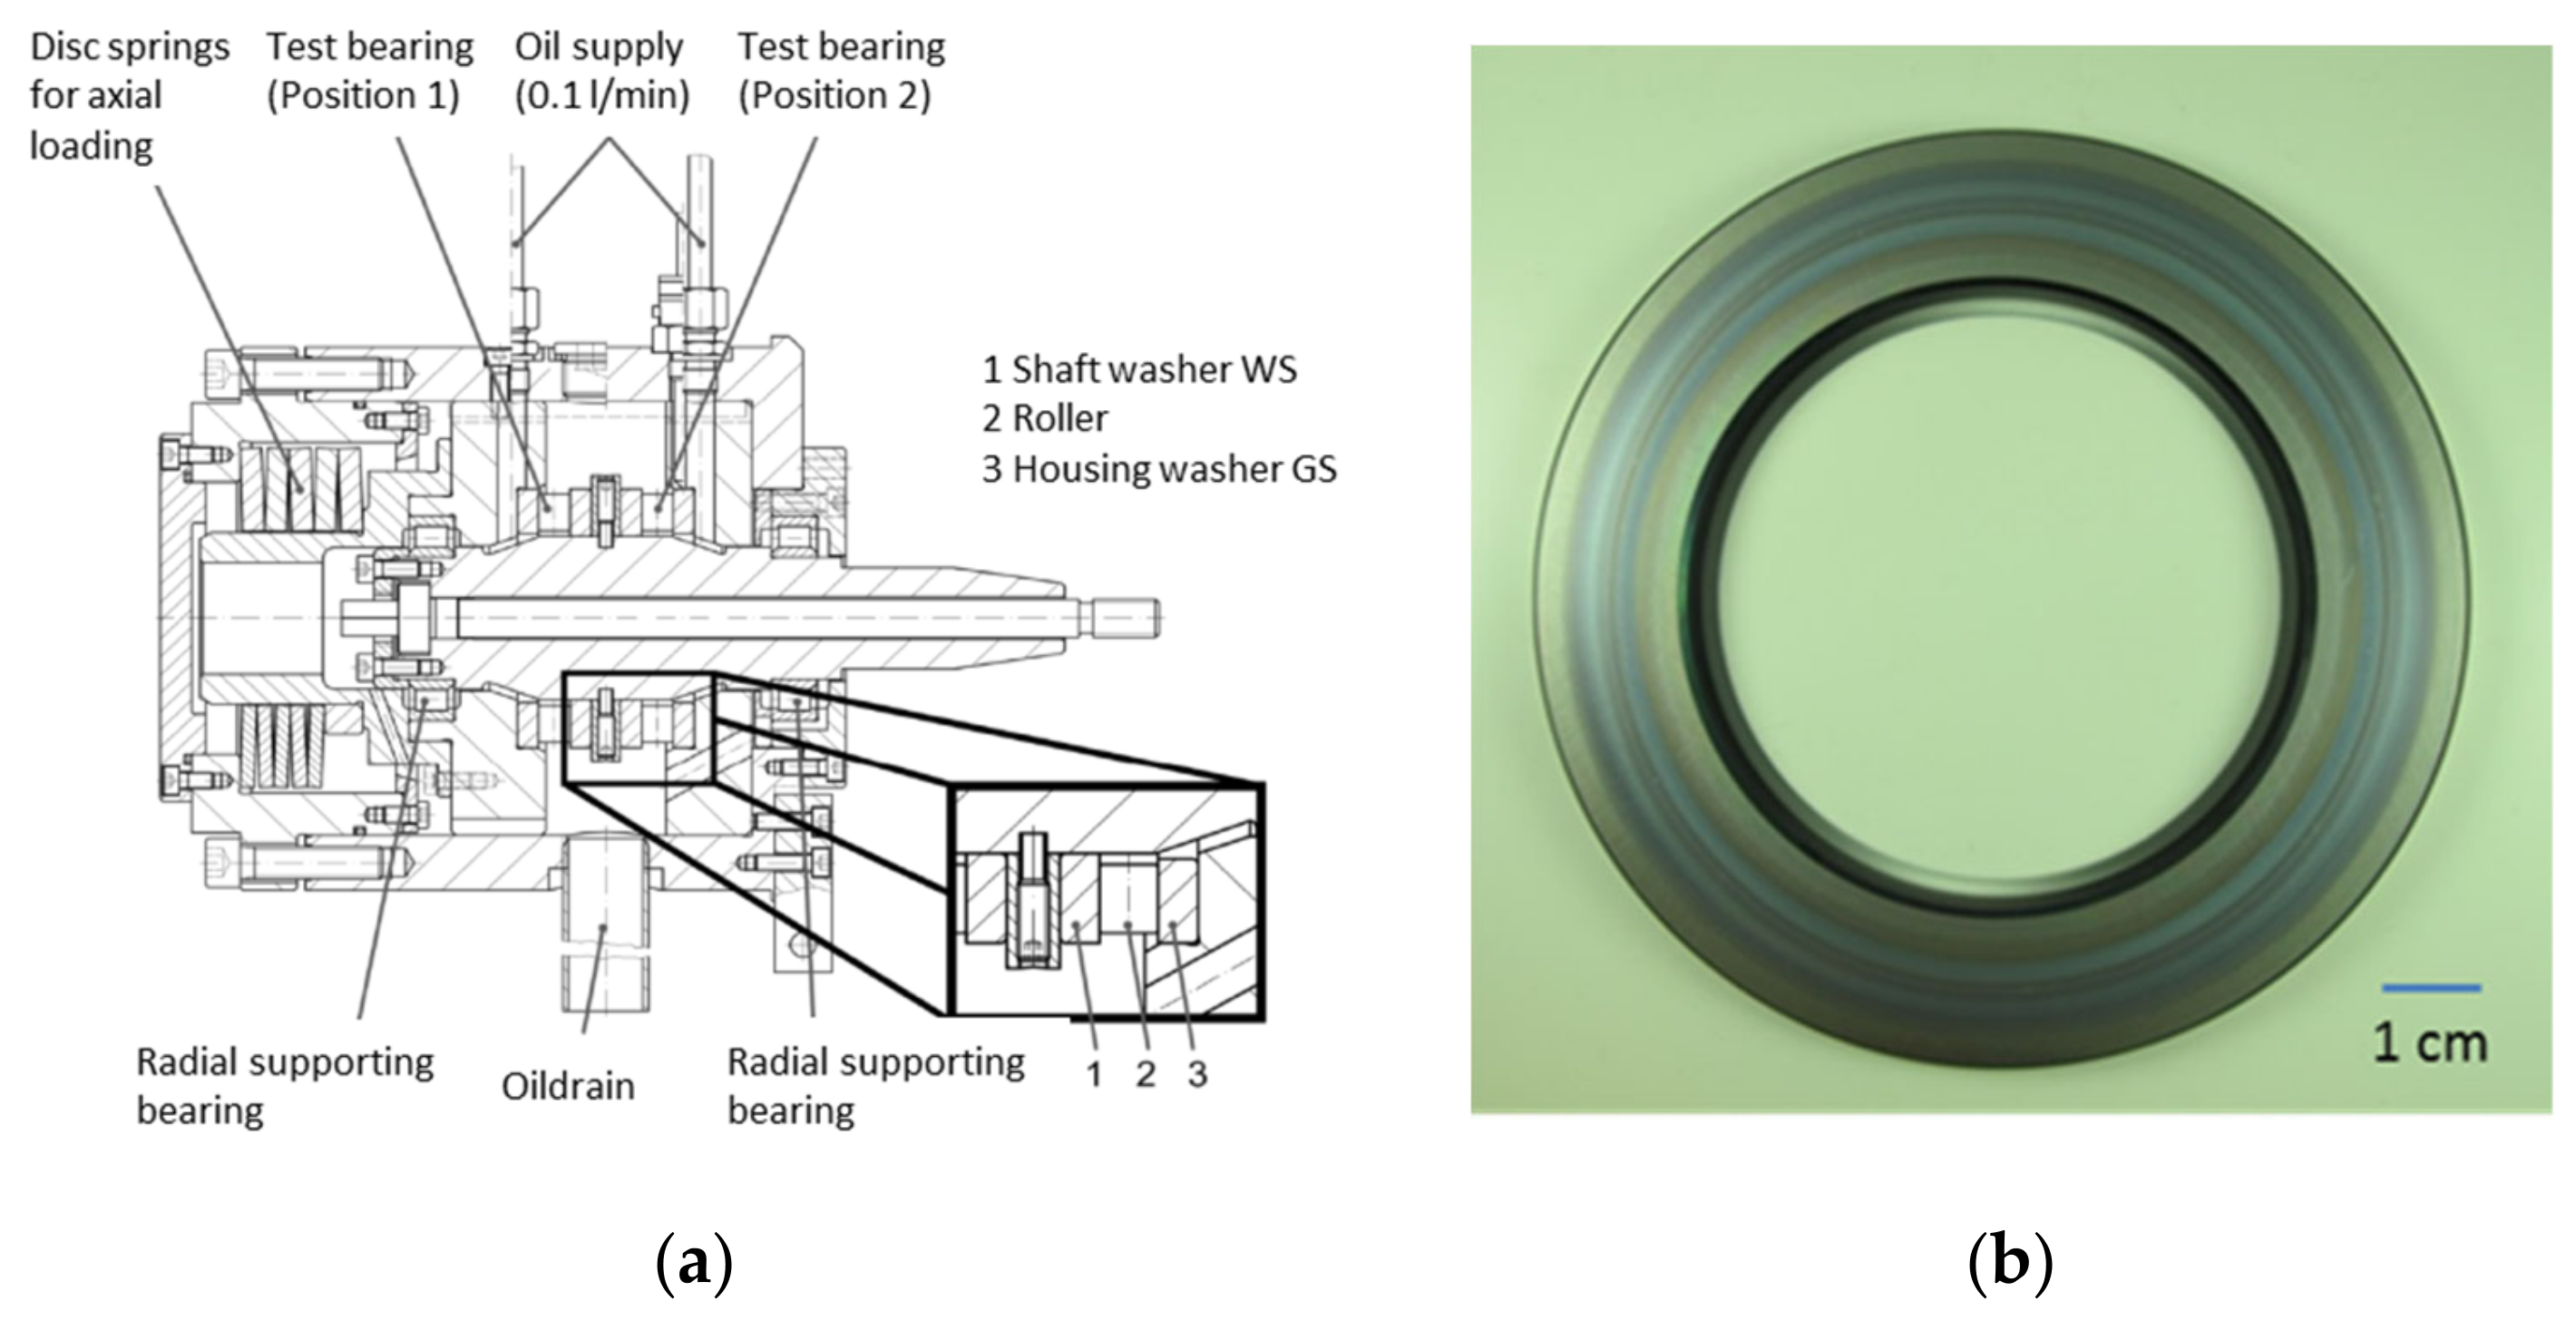
2.1. Micro Pin-on-Disk Tester
2.2. Time-of-Flight Secondary Ion Mass Spectrometry
3. Results
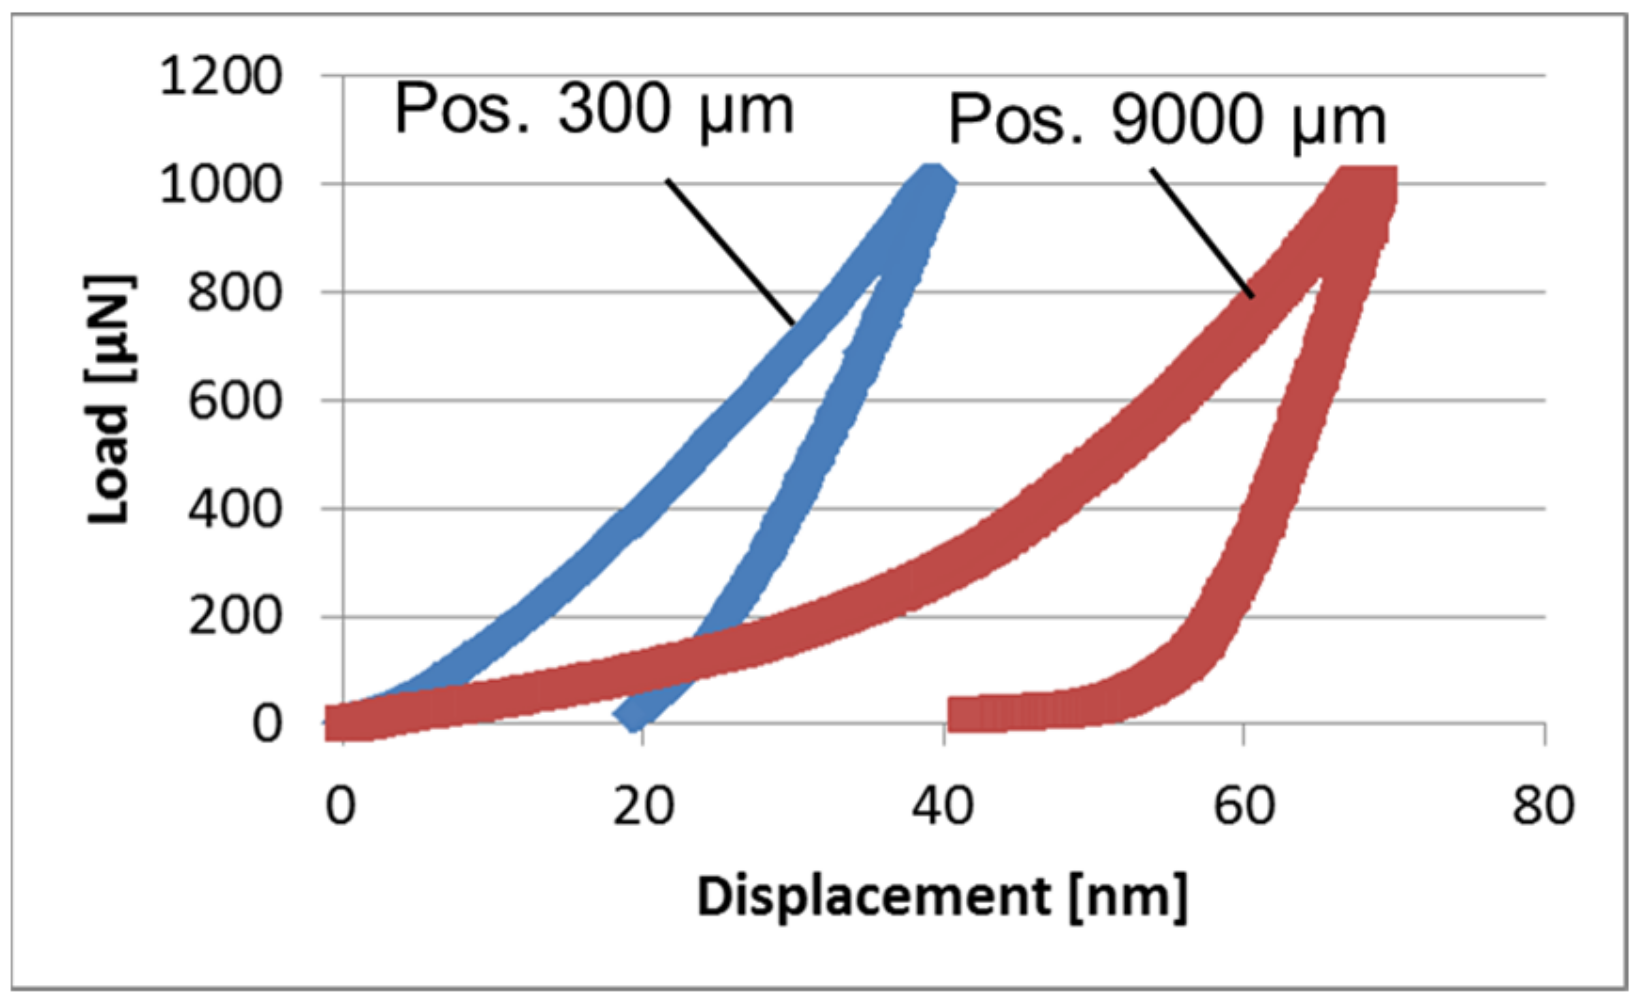
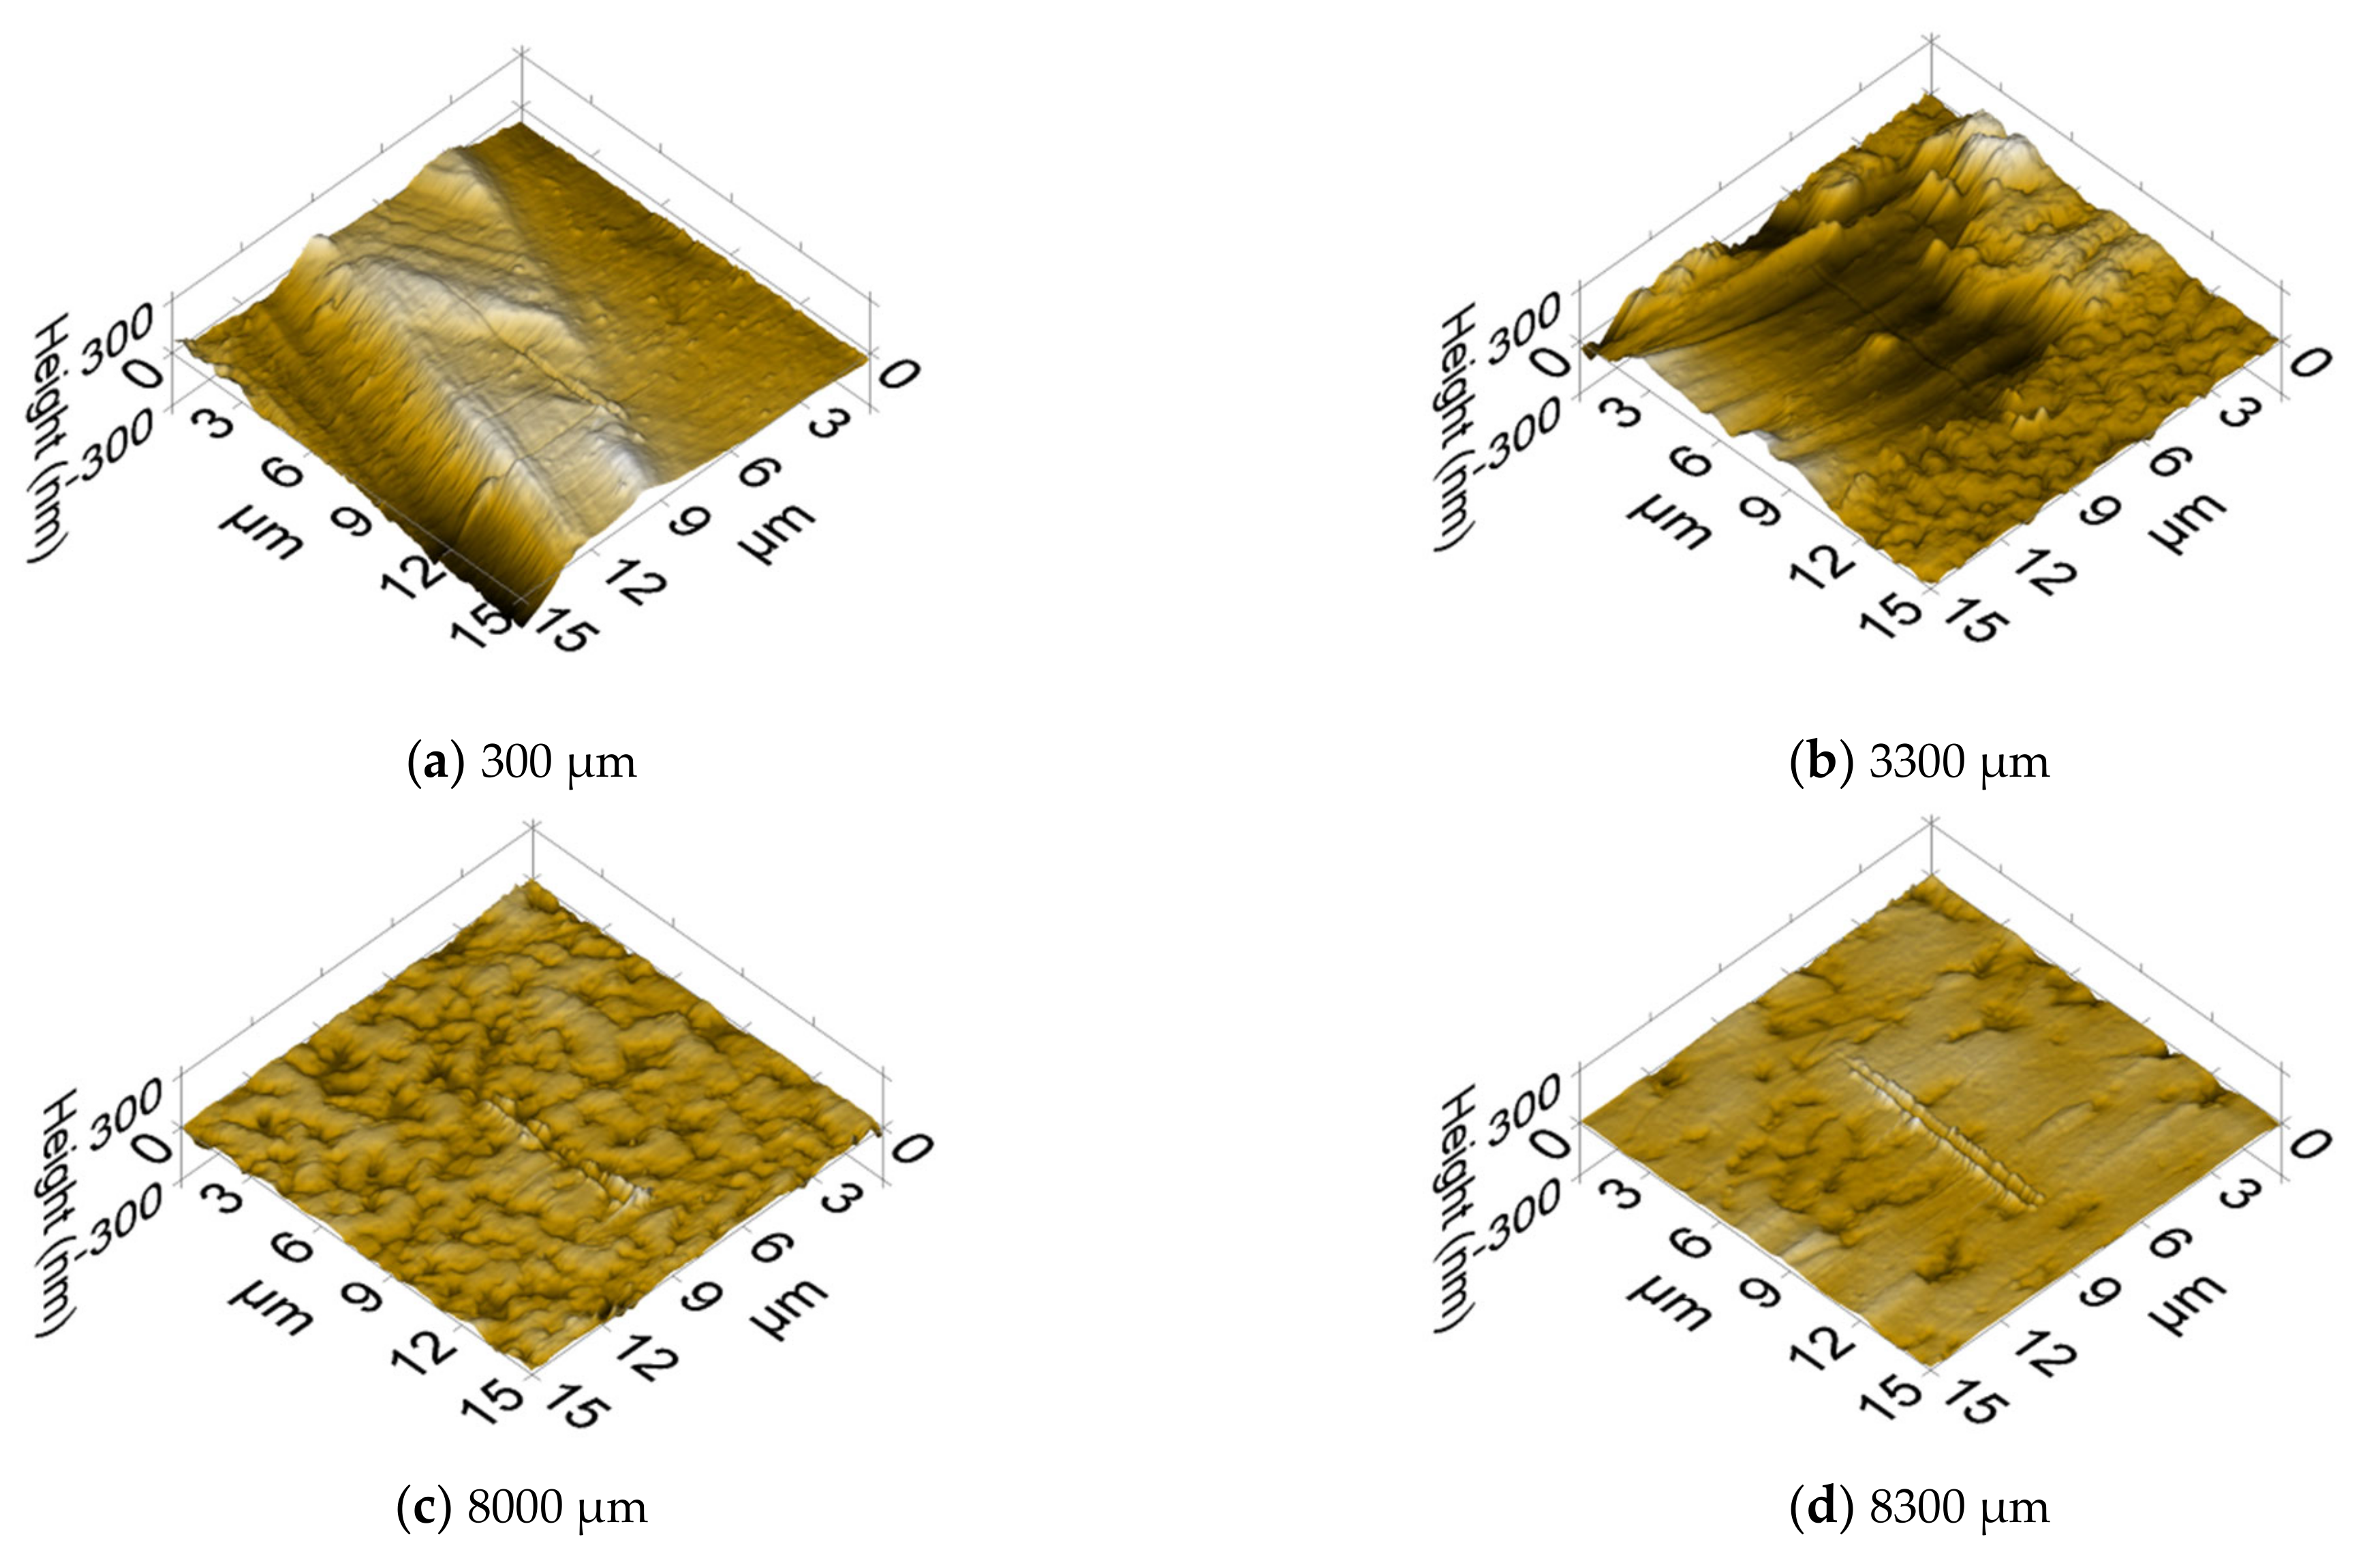
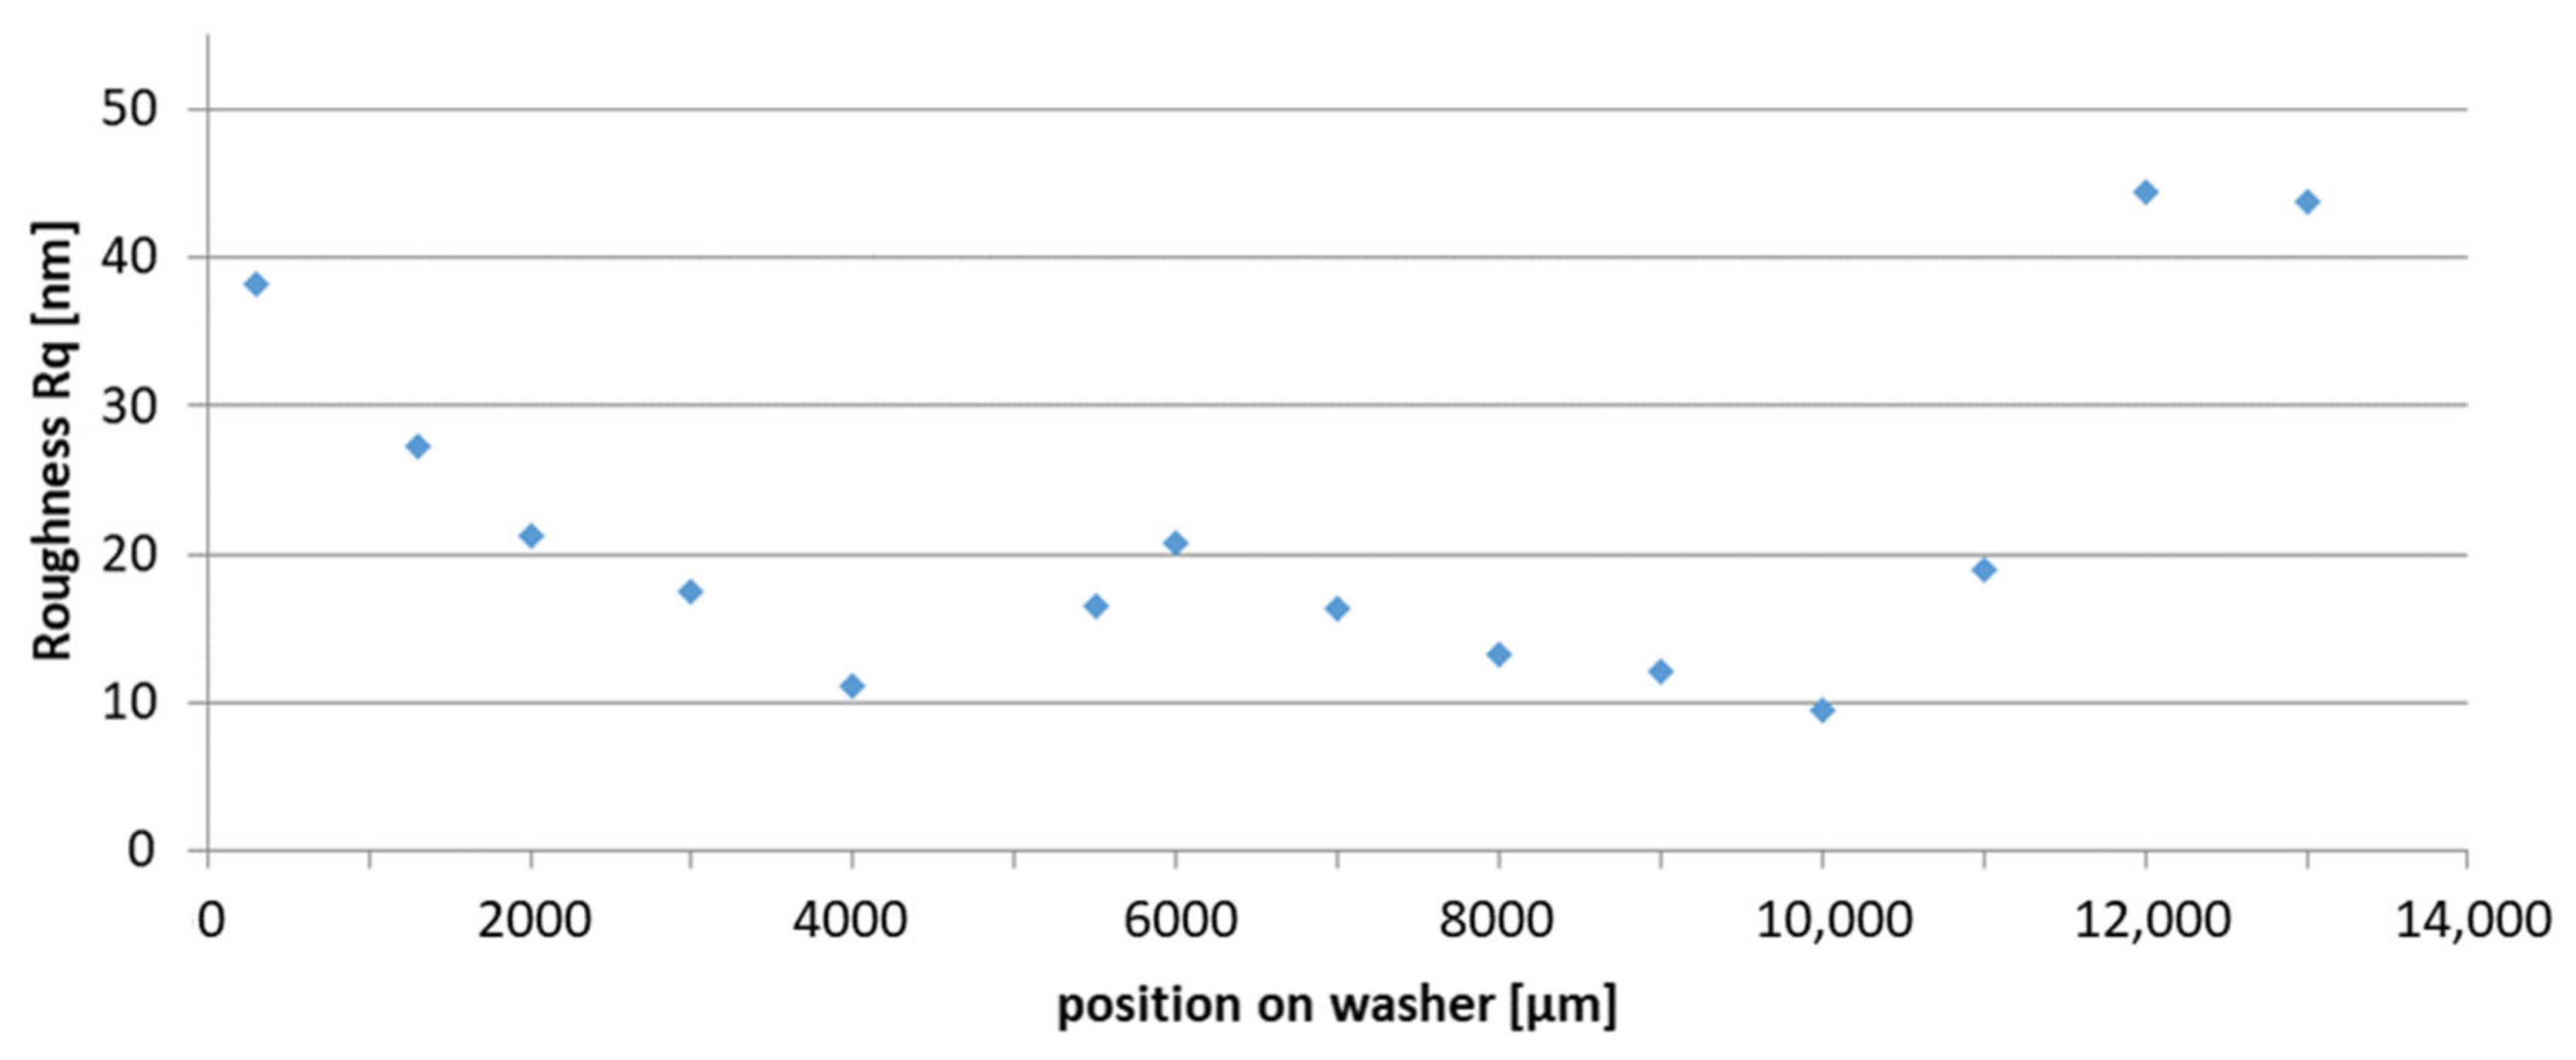
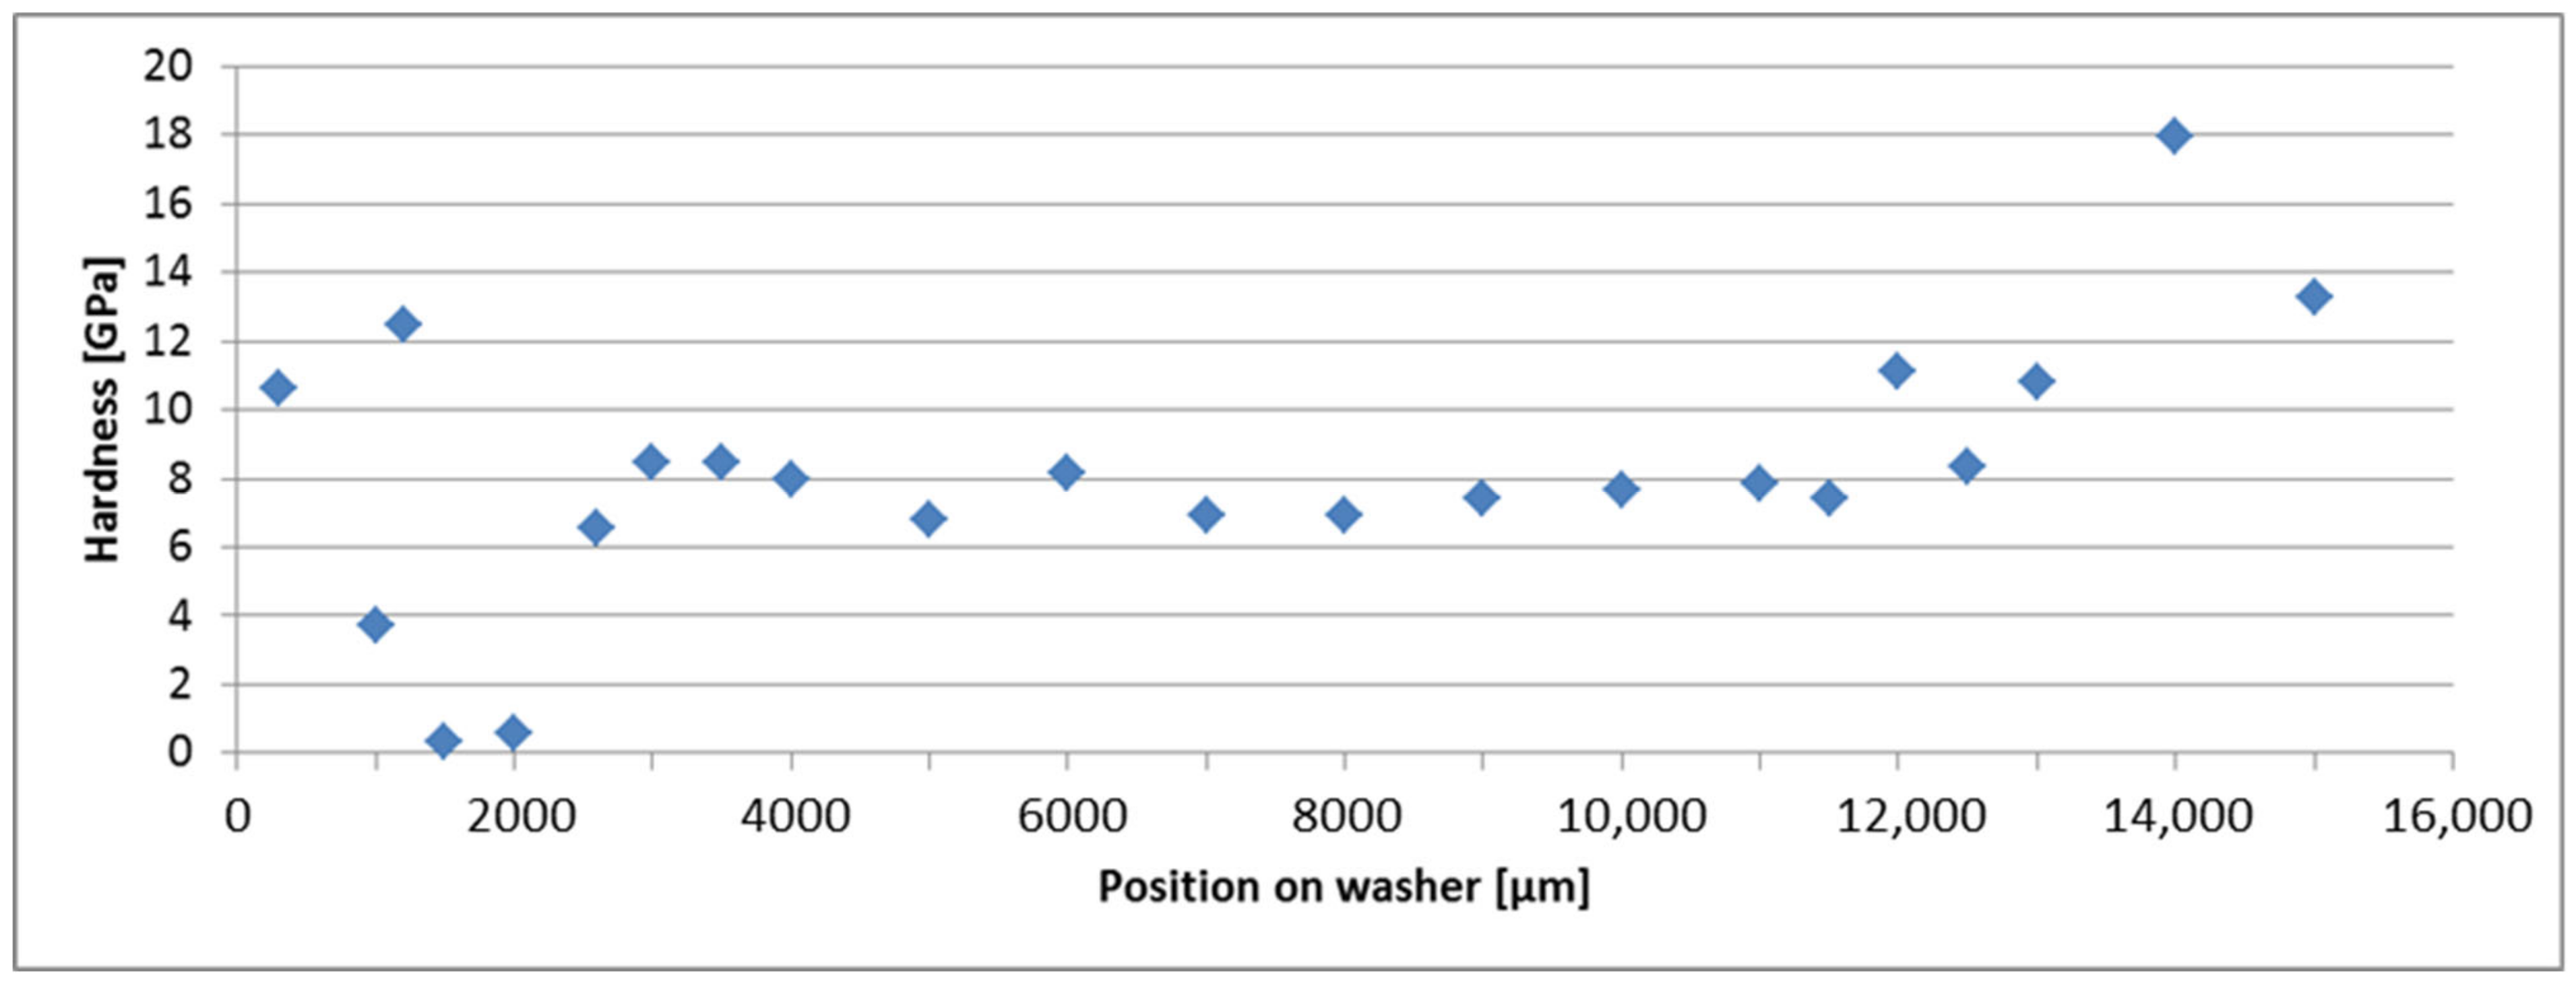
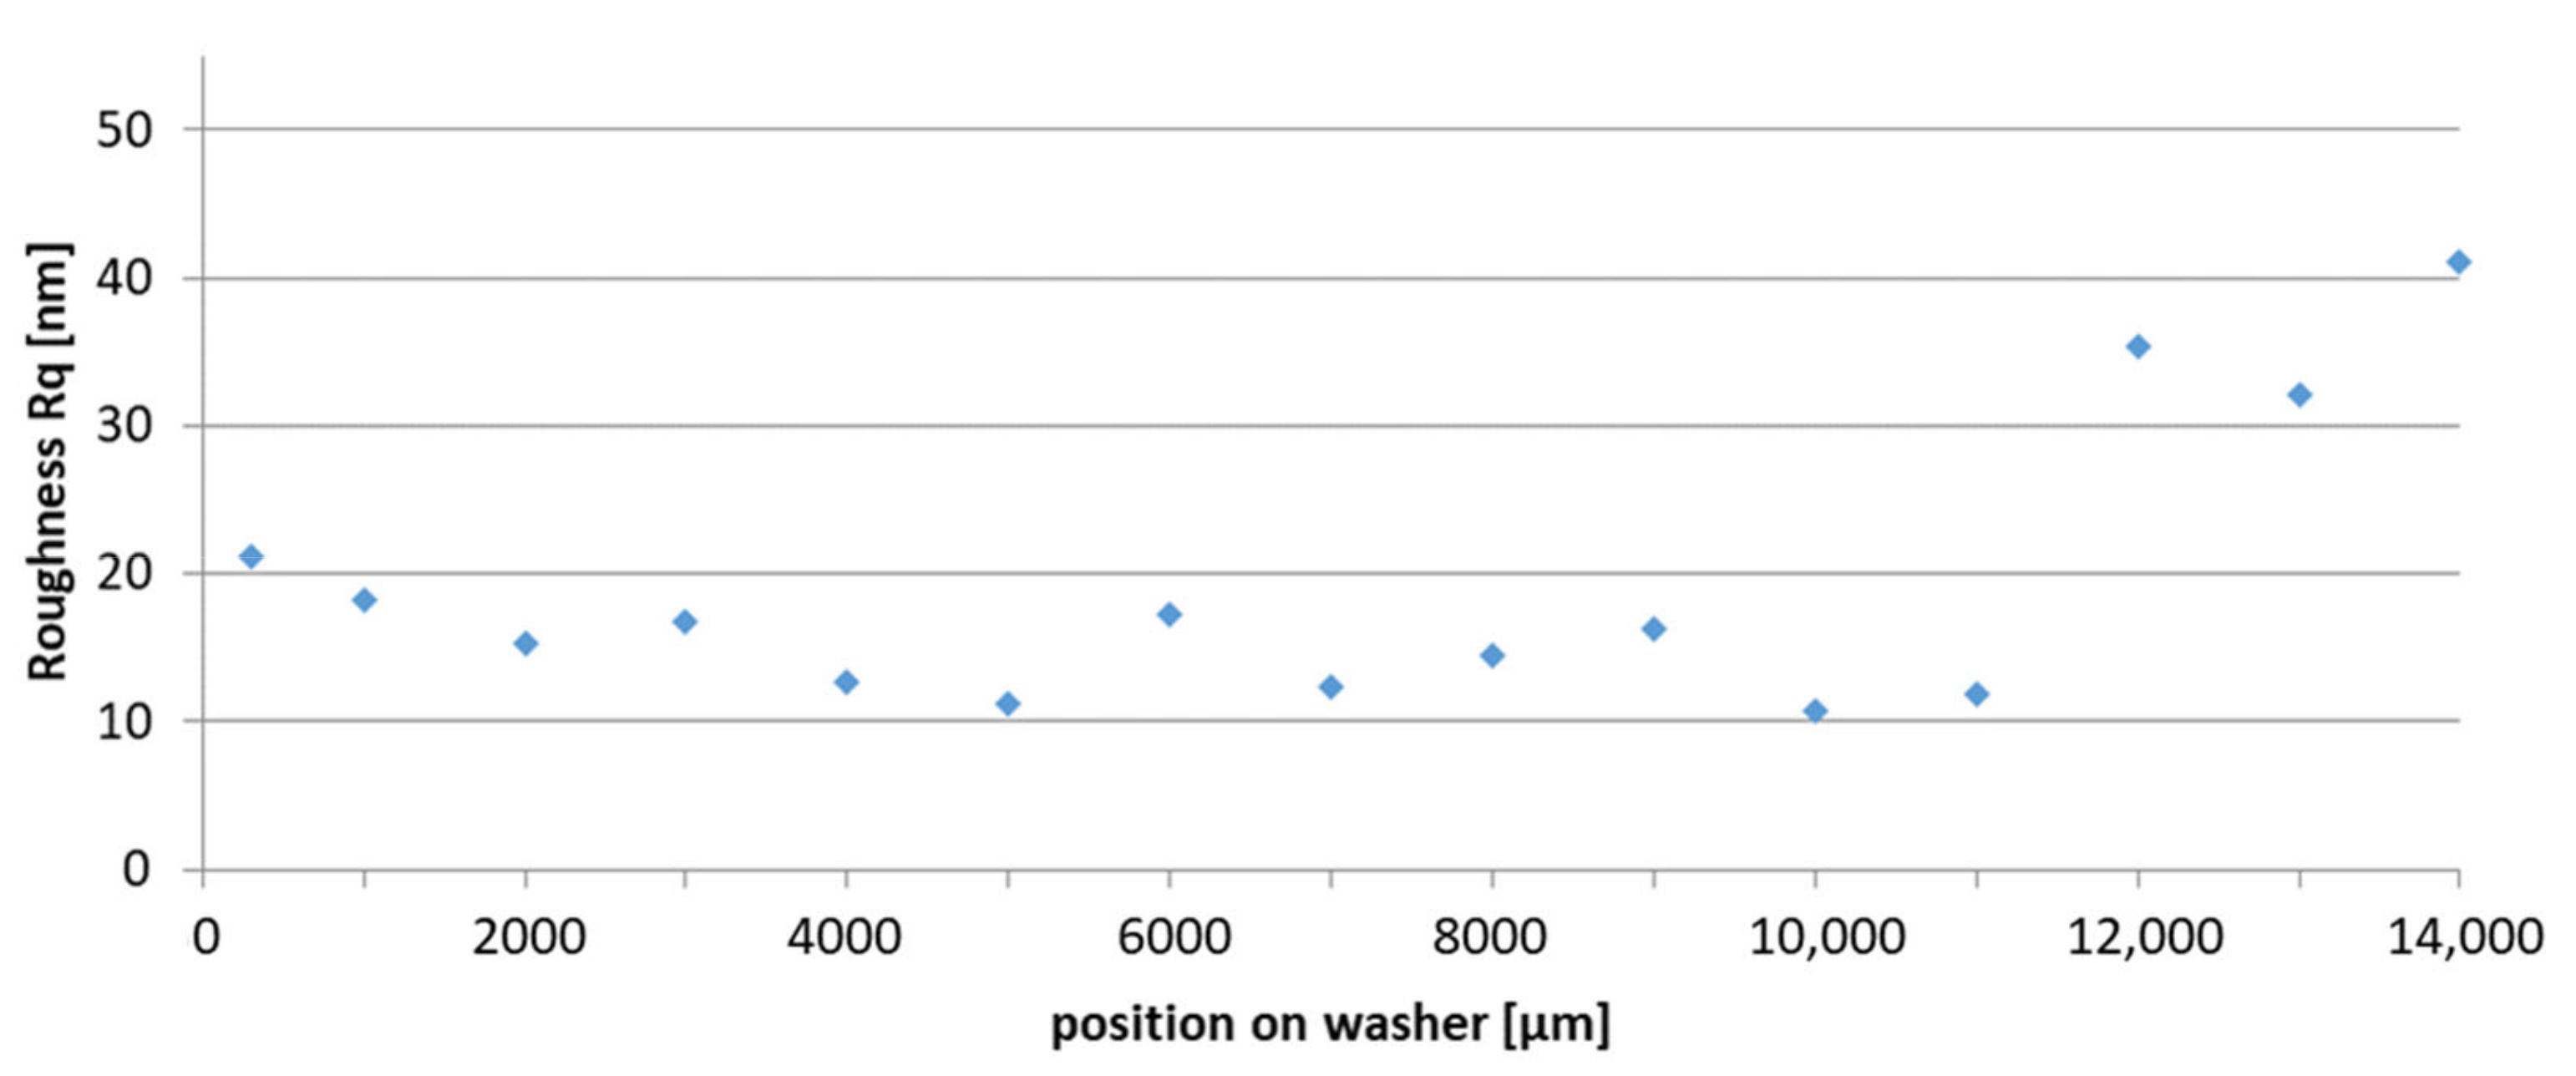
3.1. Nanoindentational Test Results
3.2. Micro Pin-on-Disk Test Results
3.3. Time-of-Flight Secondary Ion Mass Spectrometry Results
4. Discussion
5. Conclusions
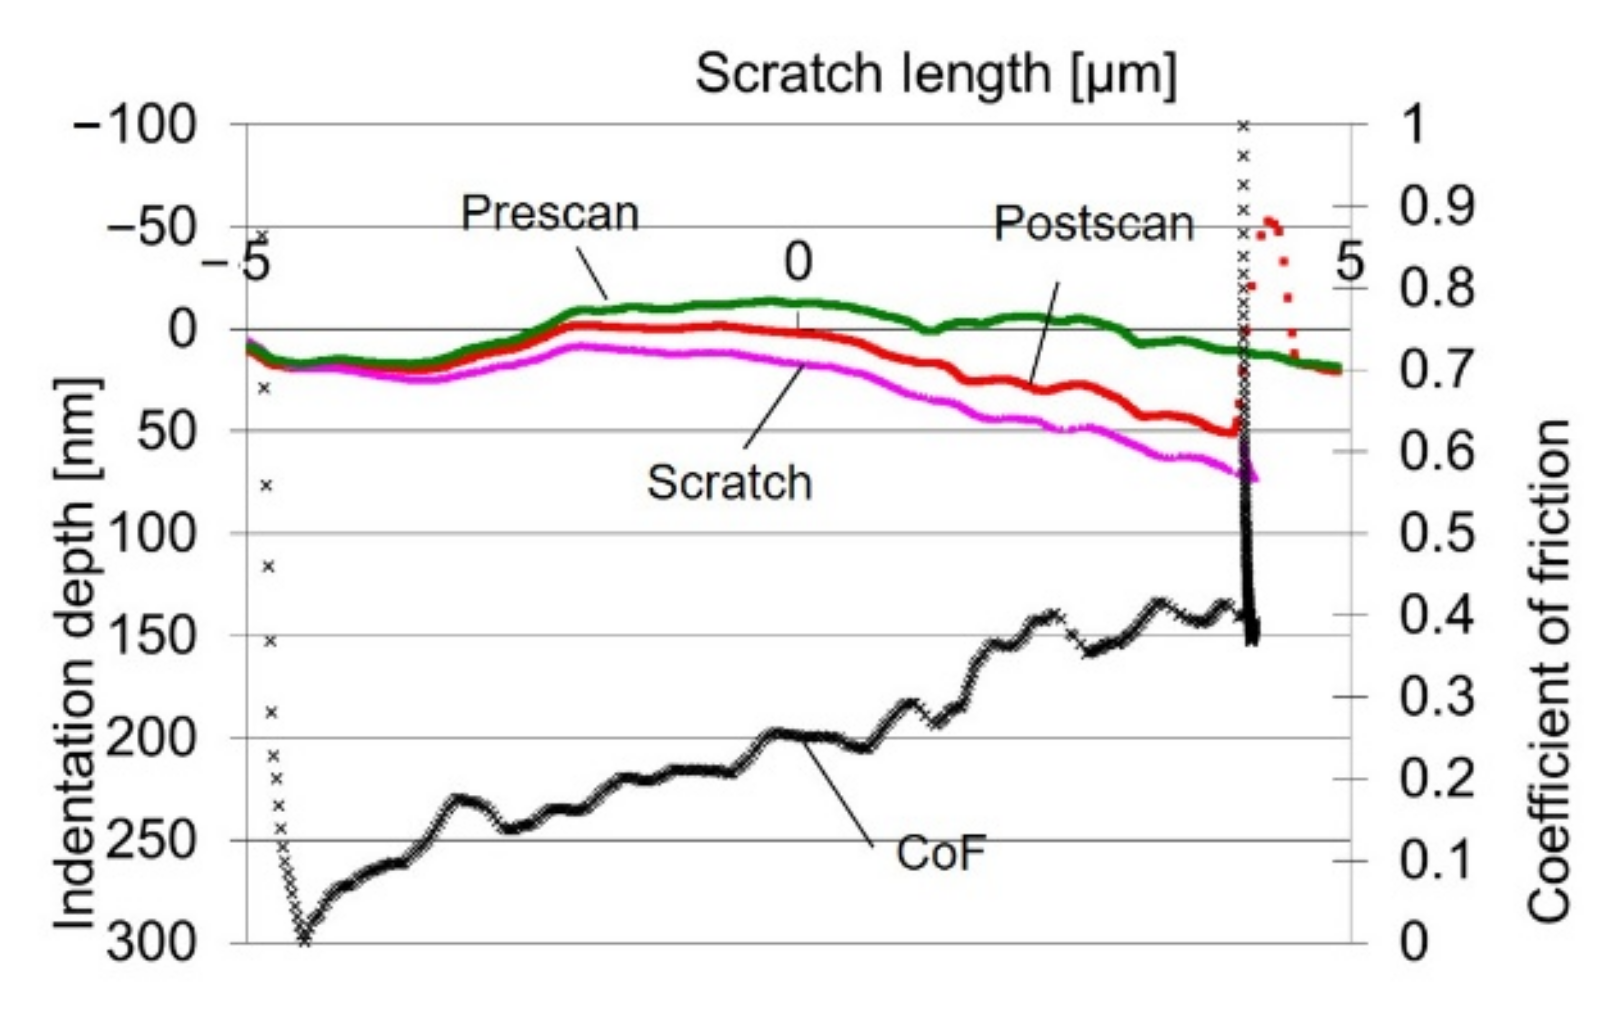
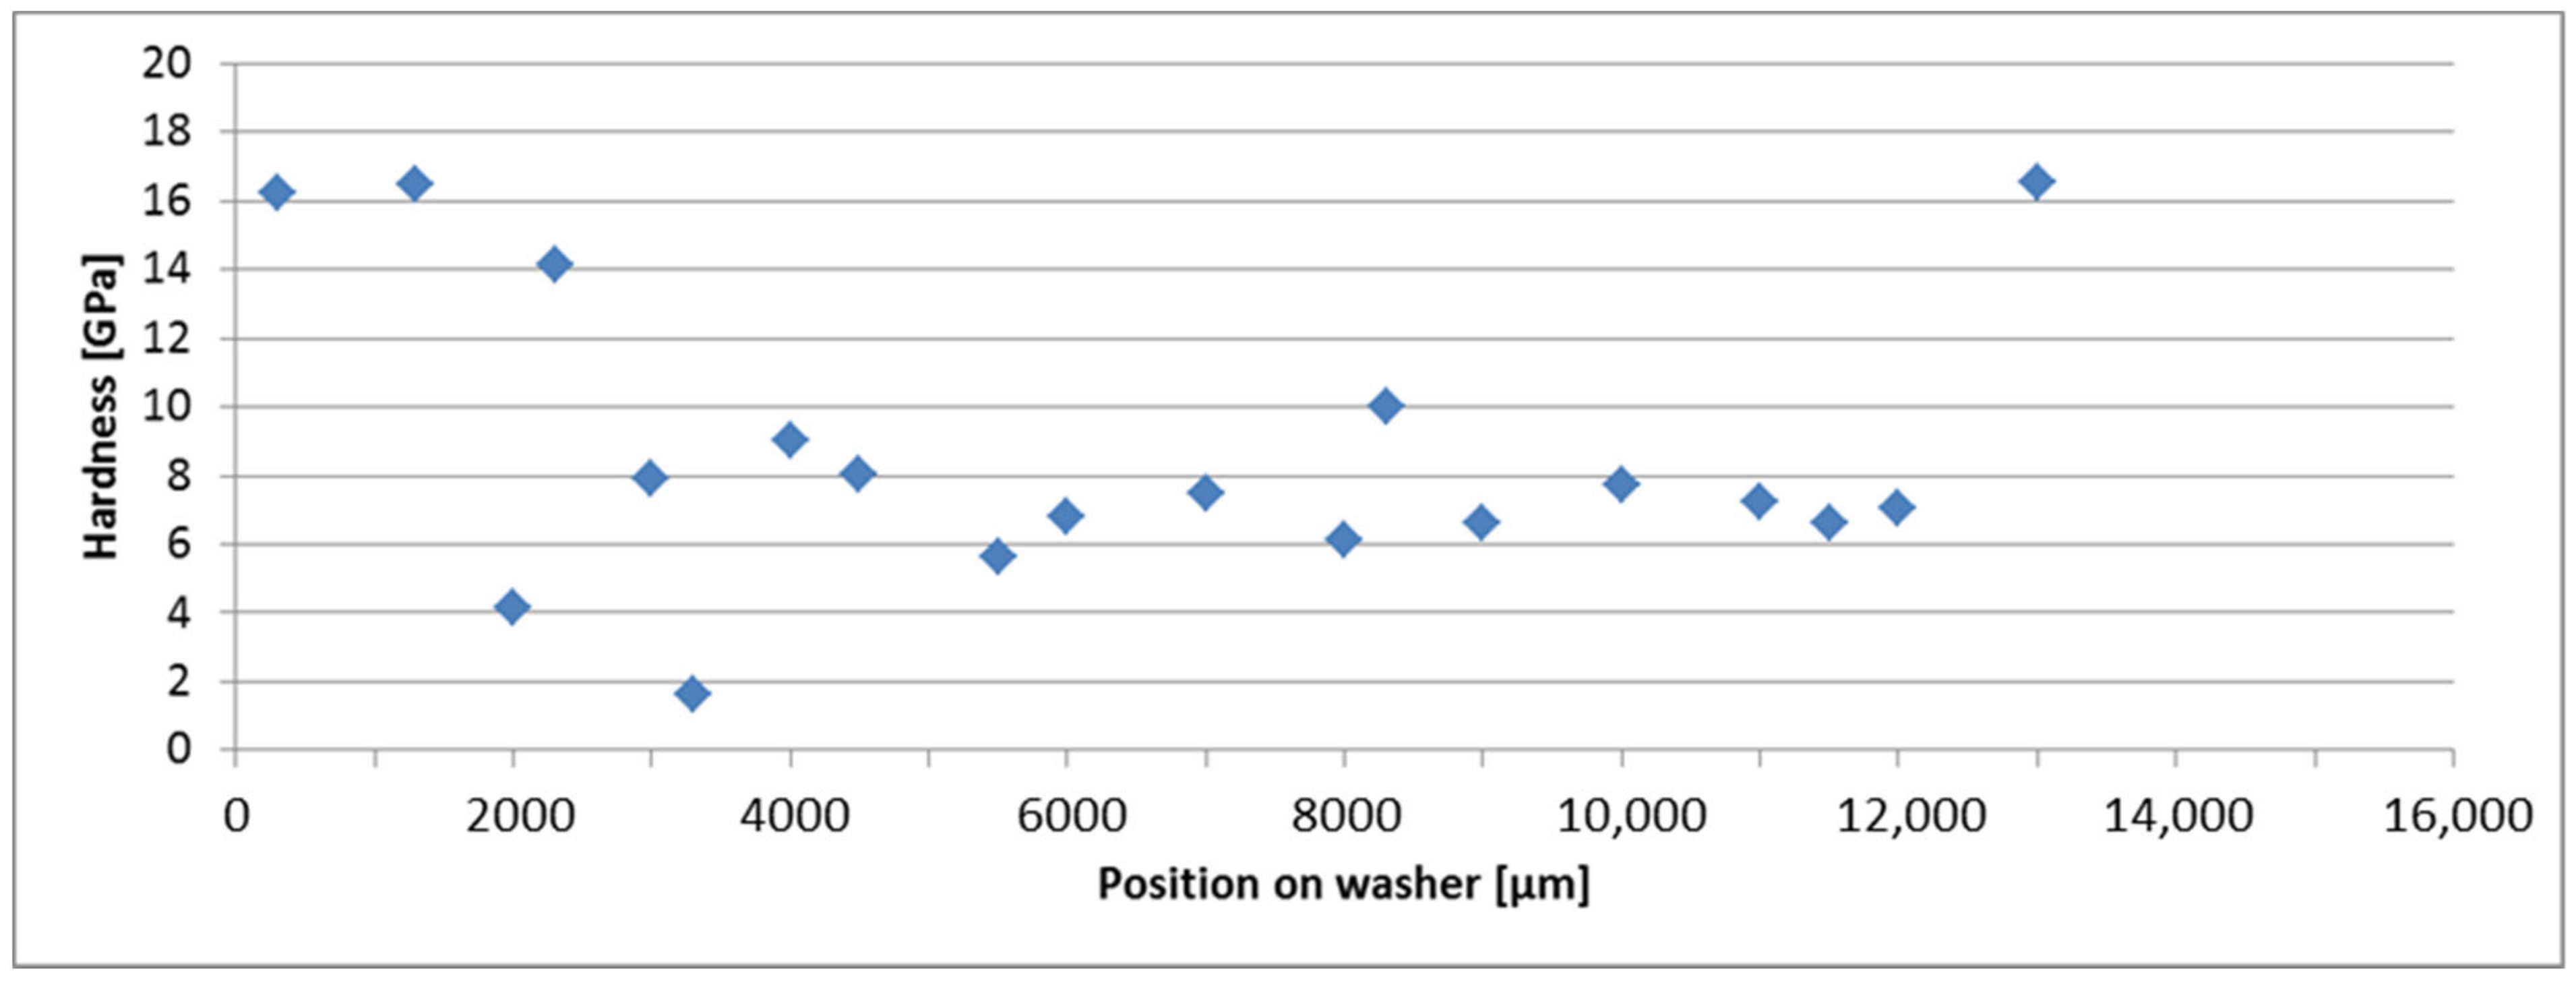
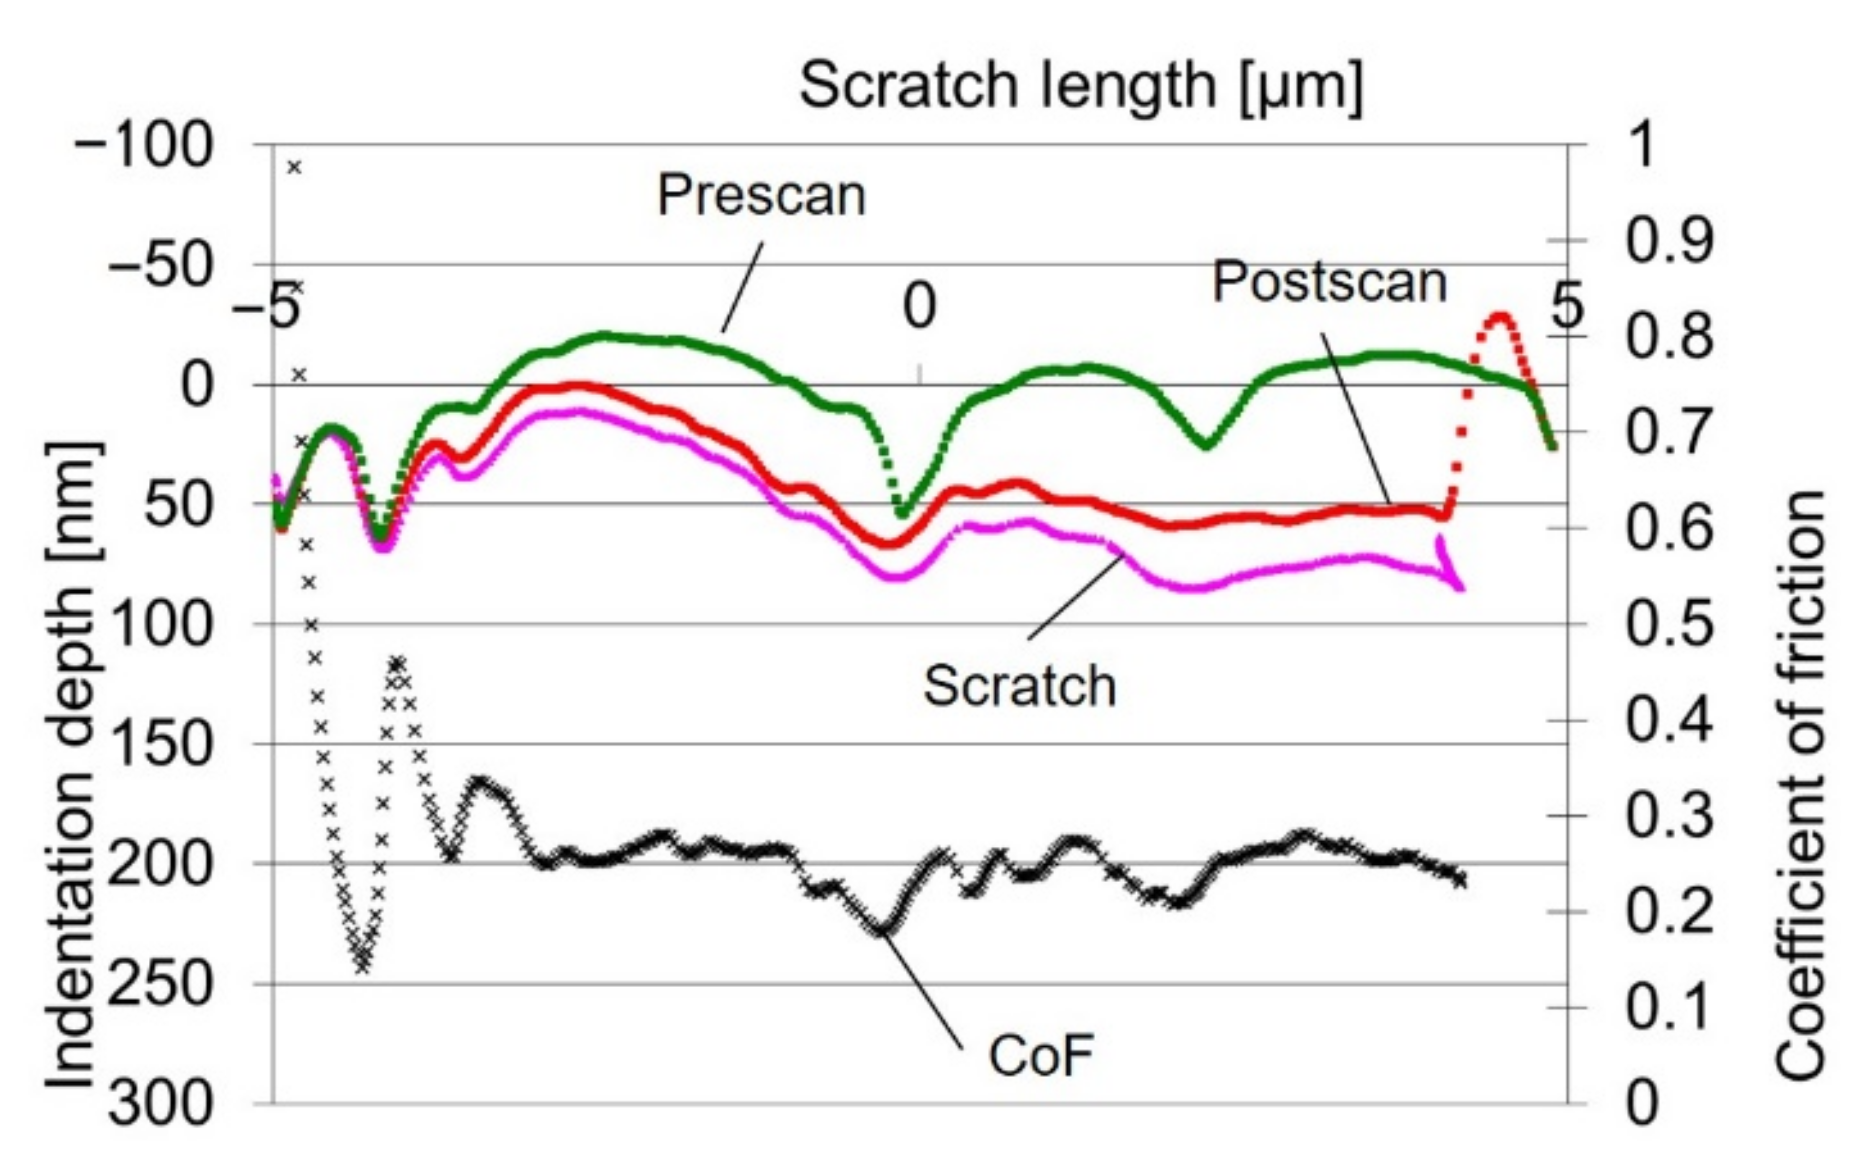
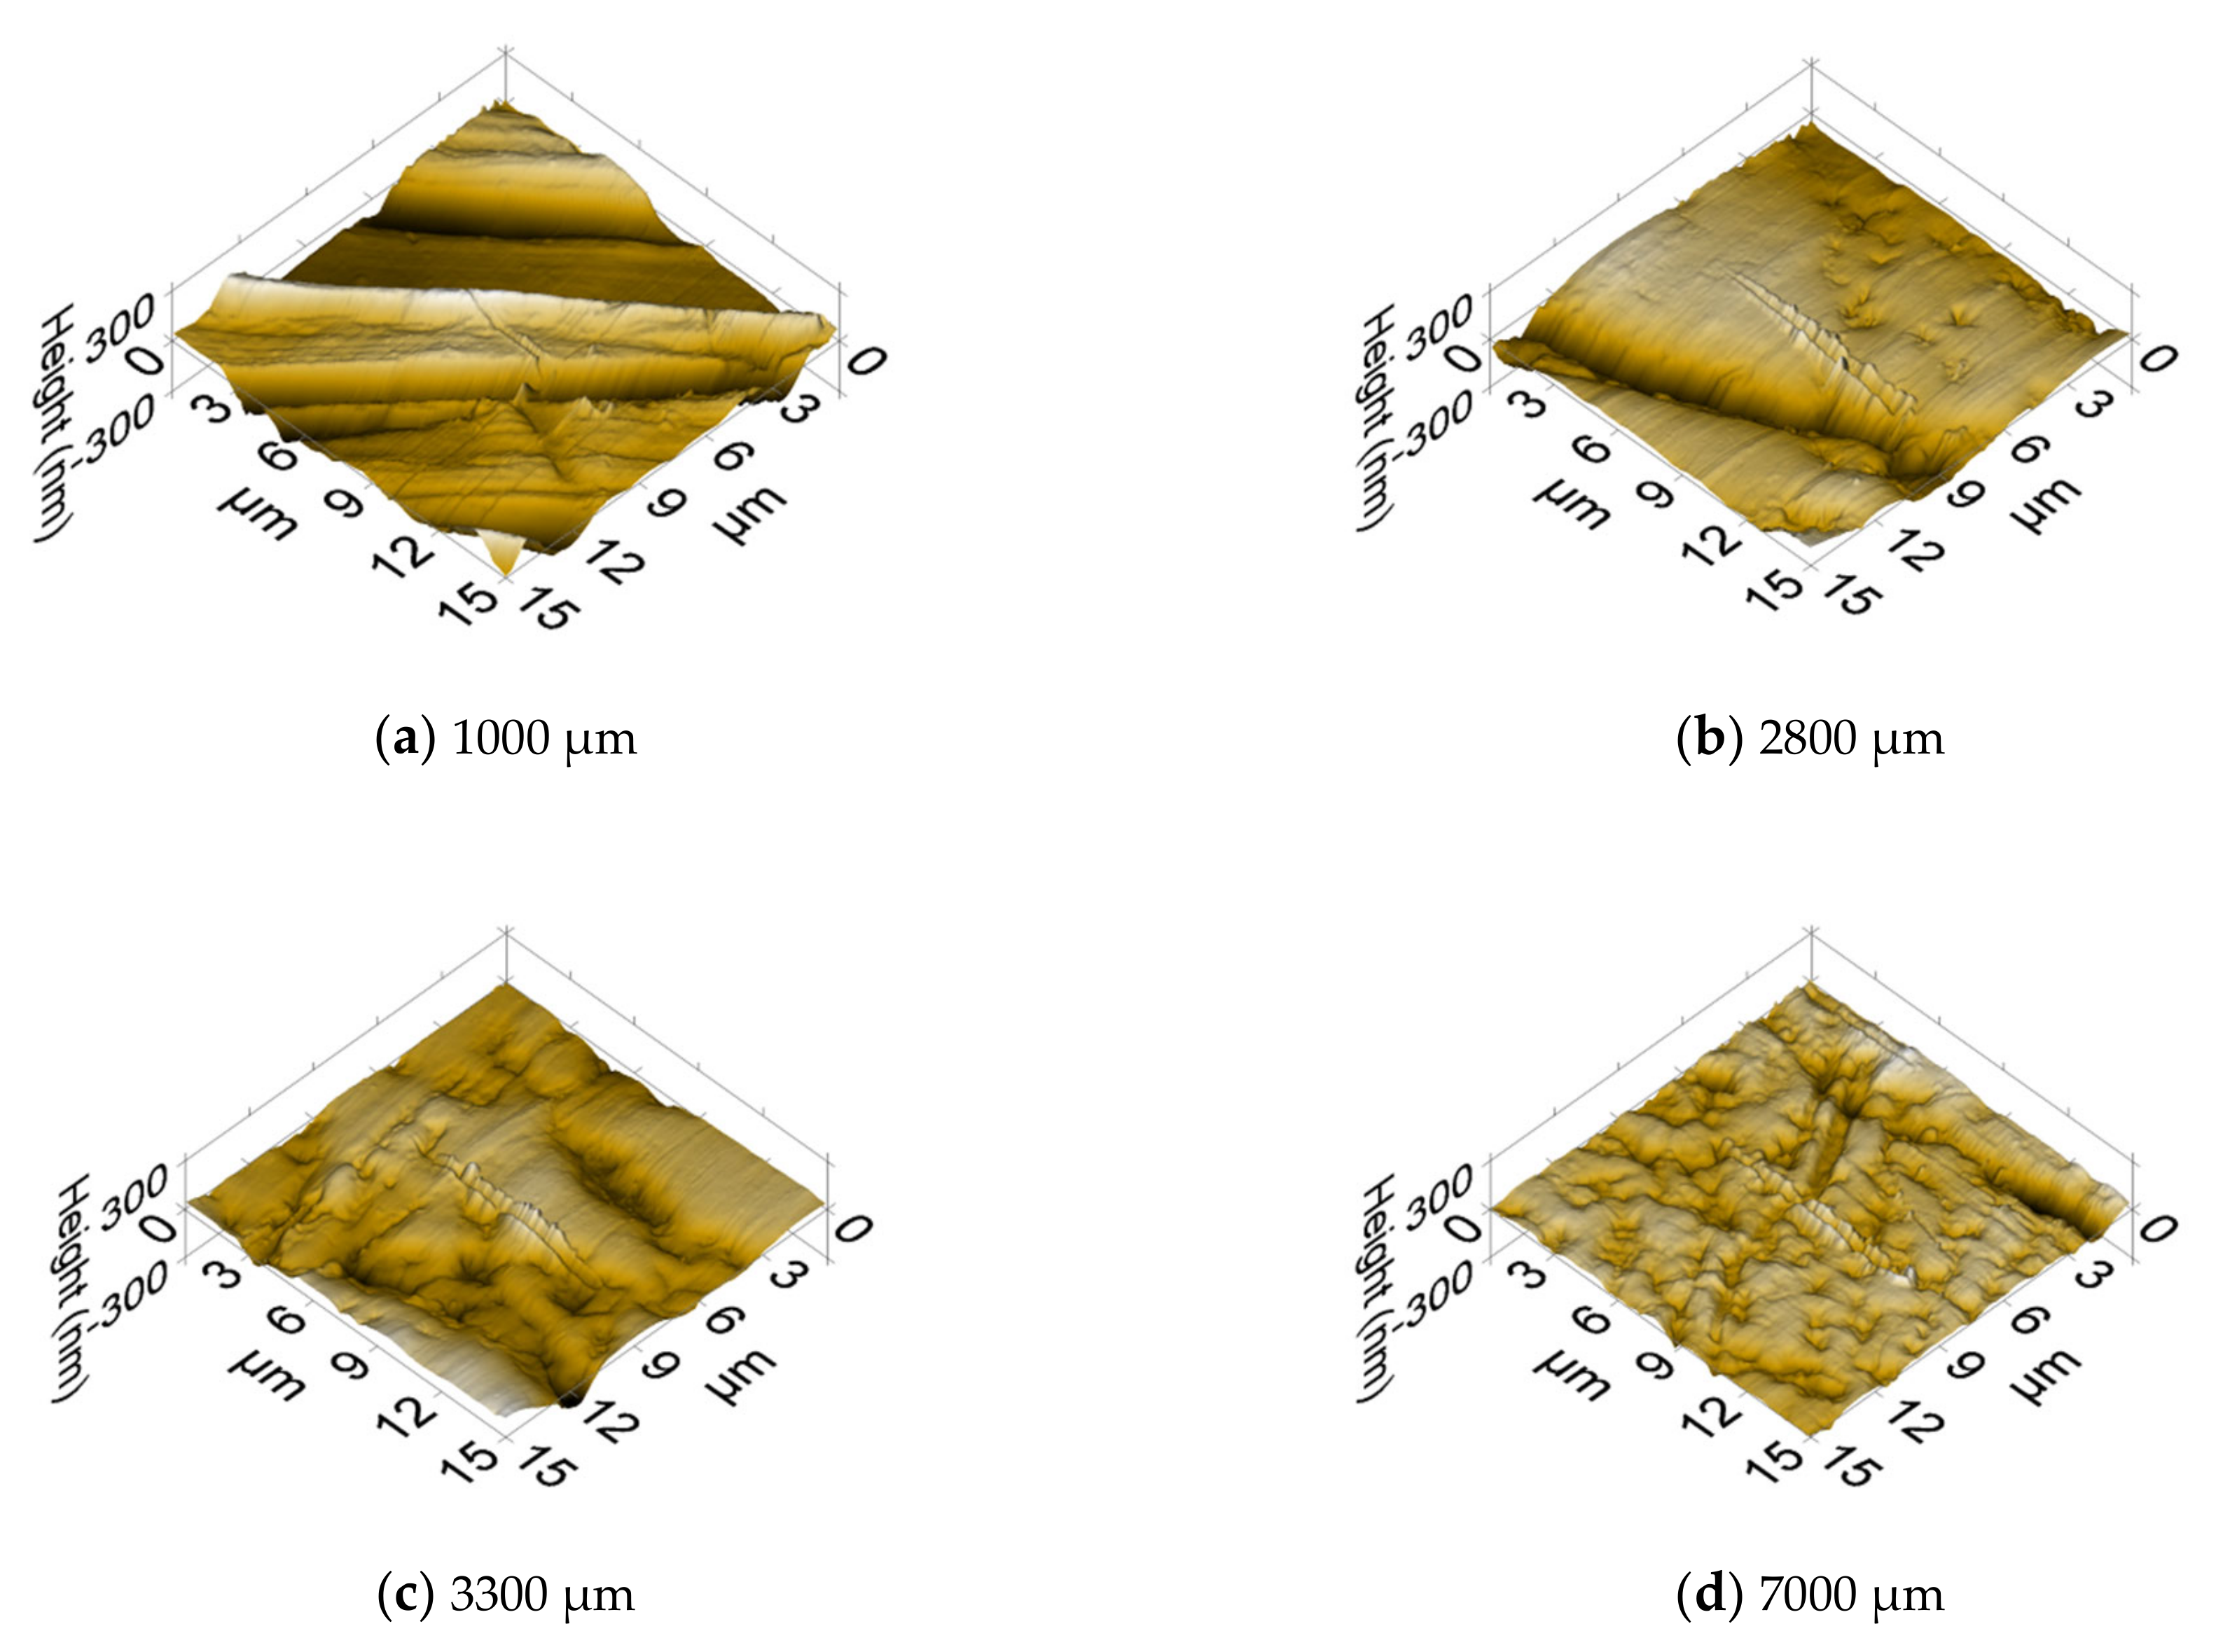
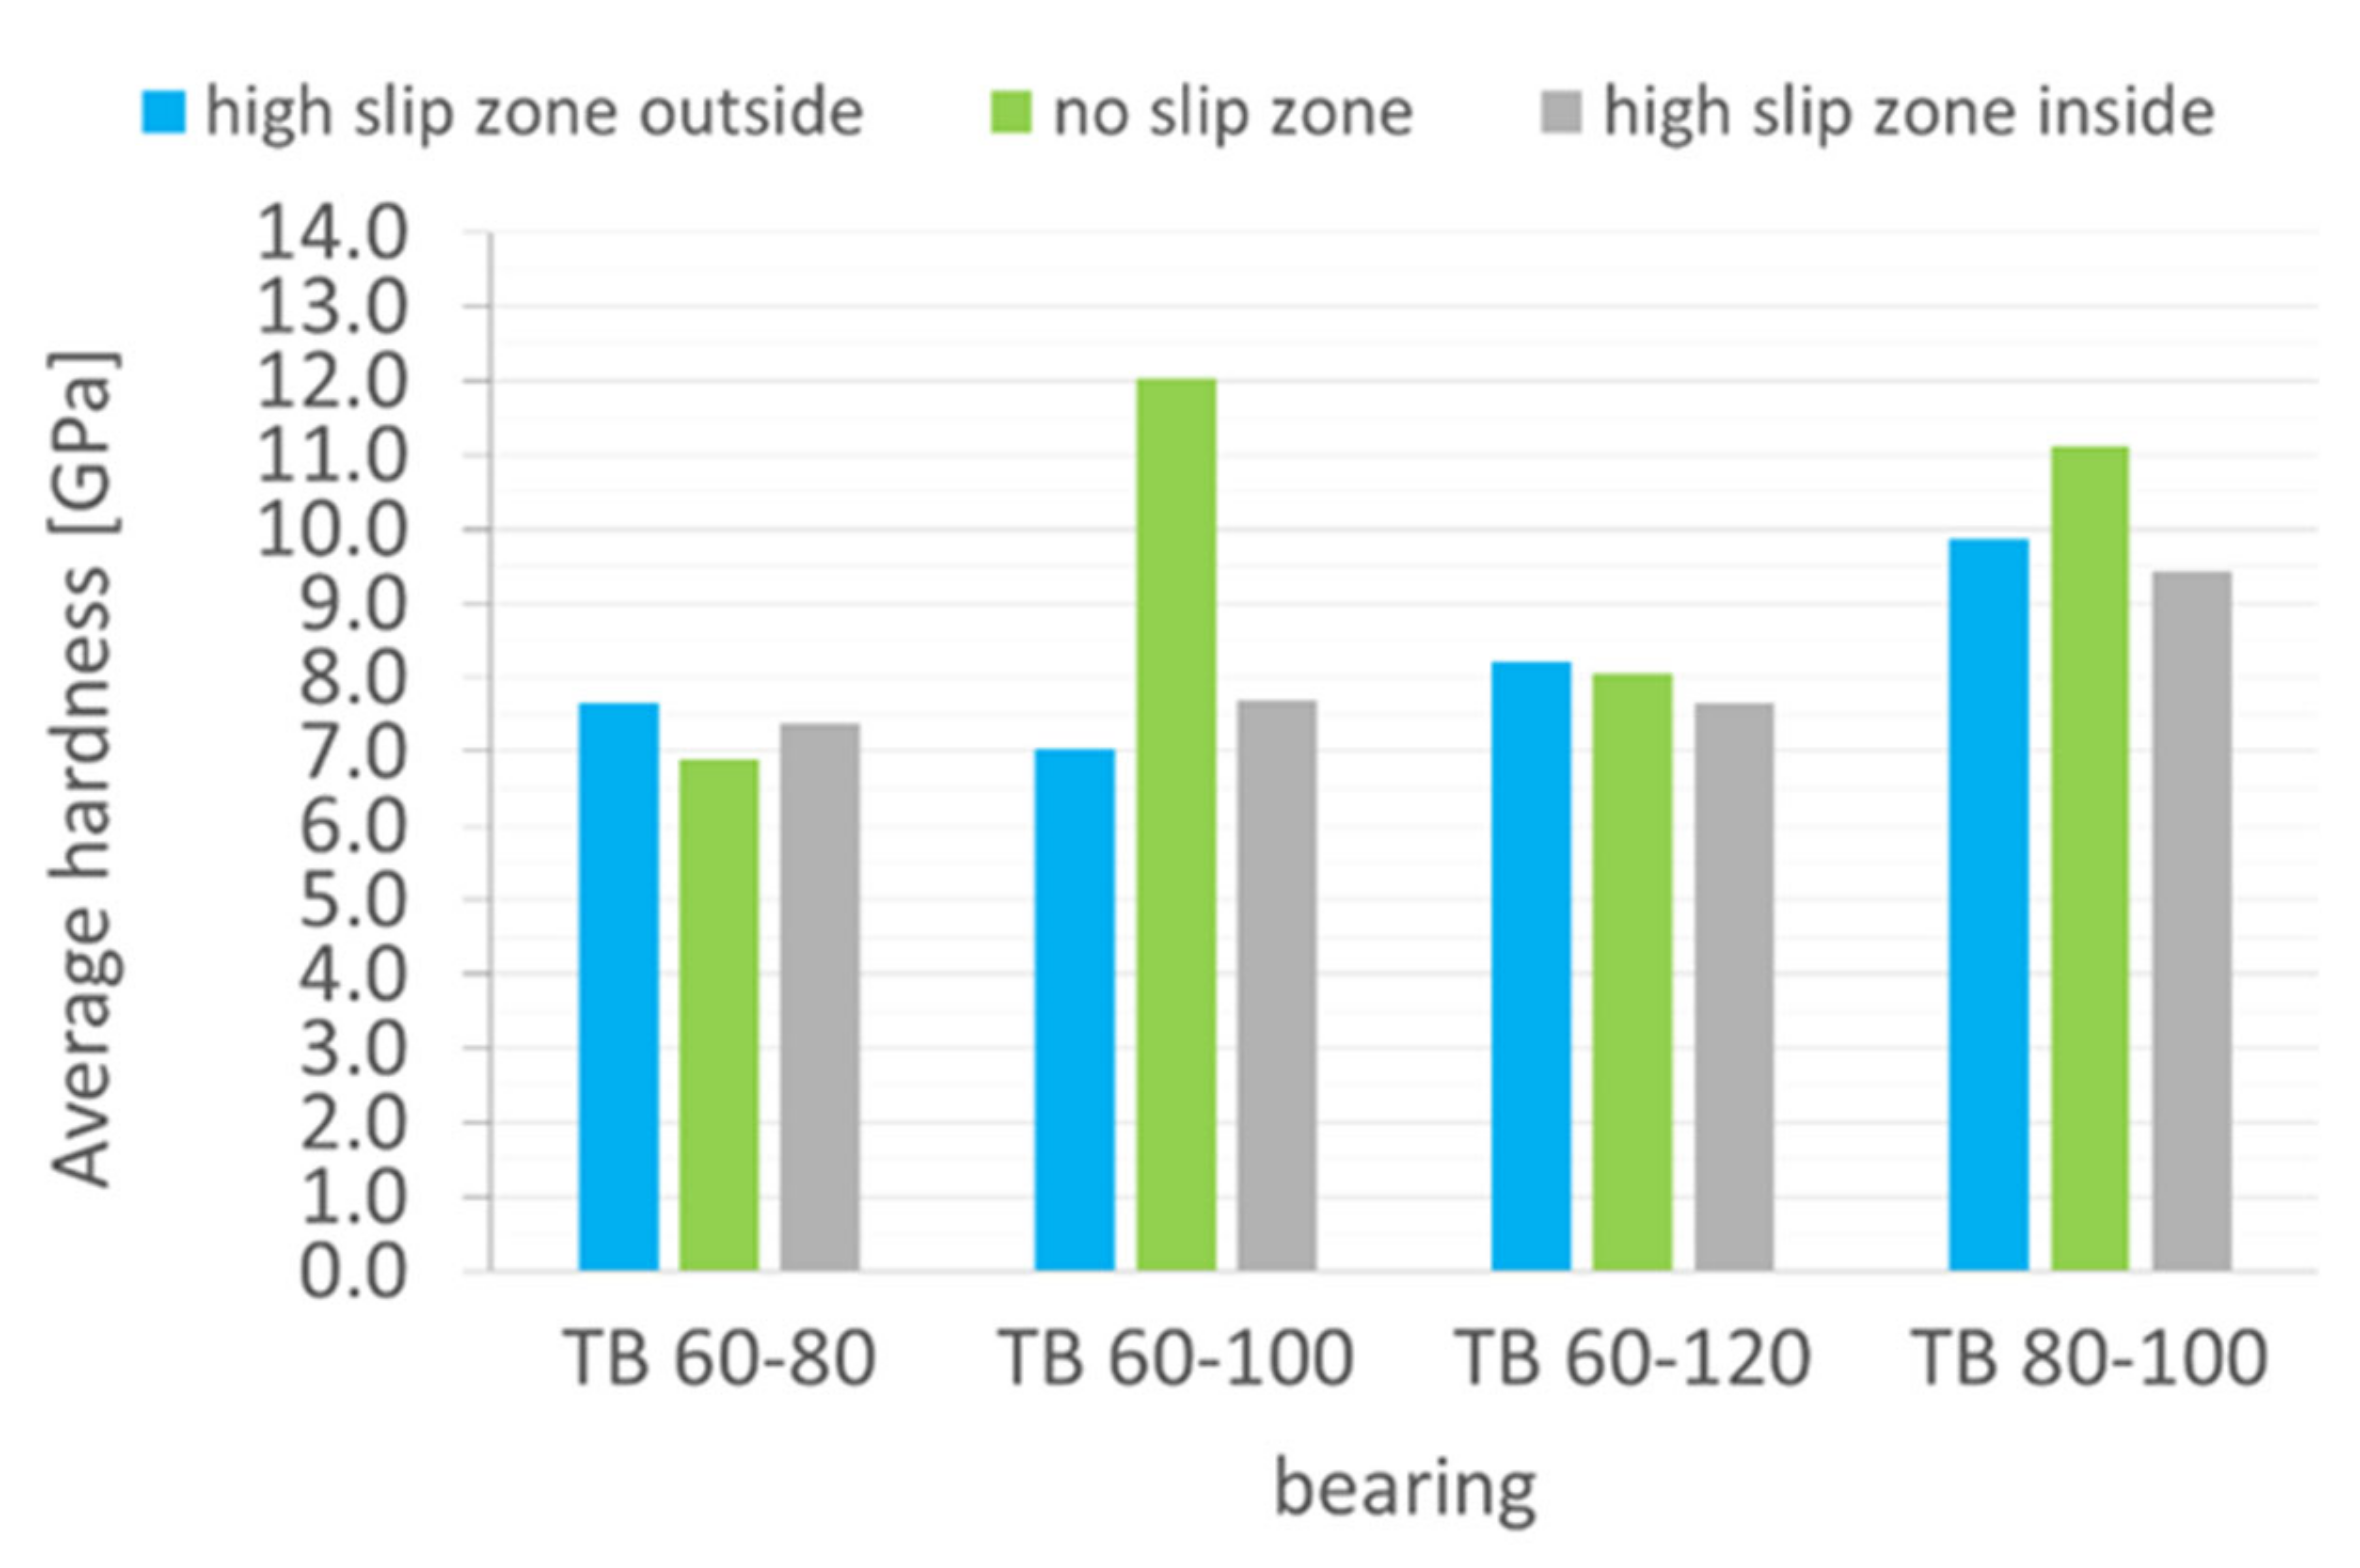
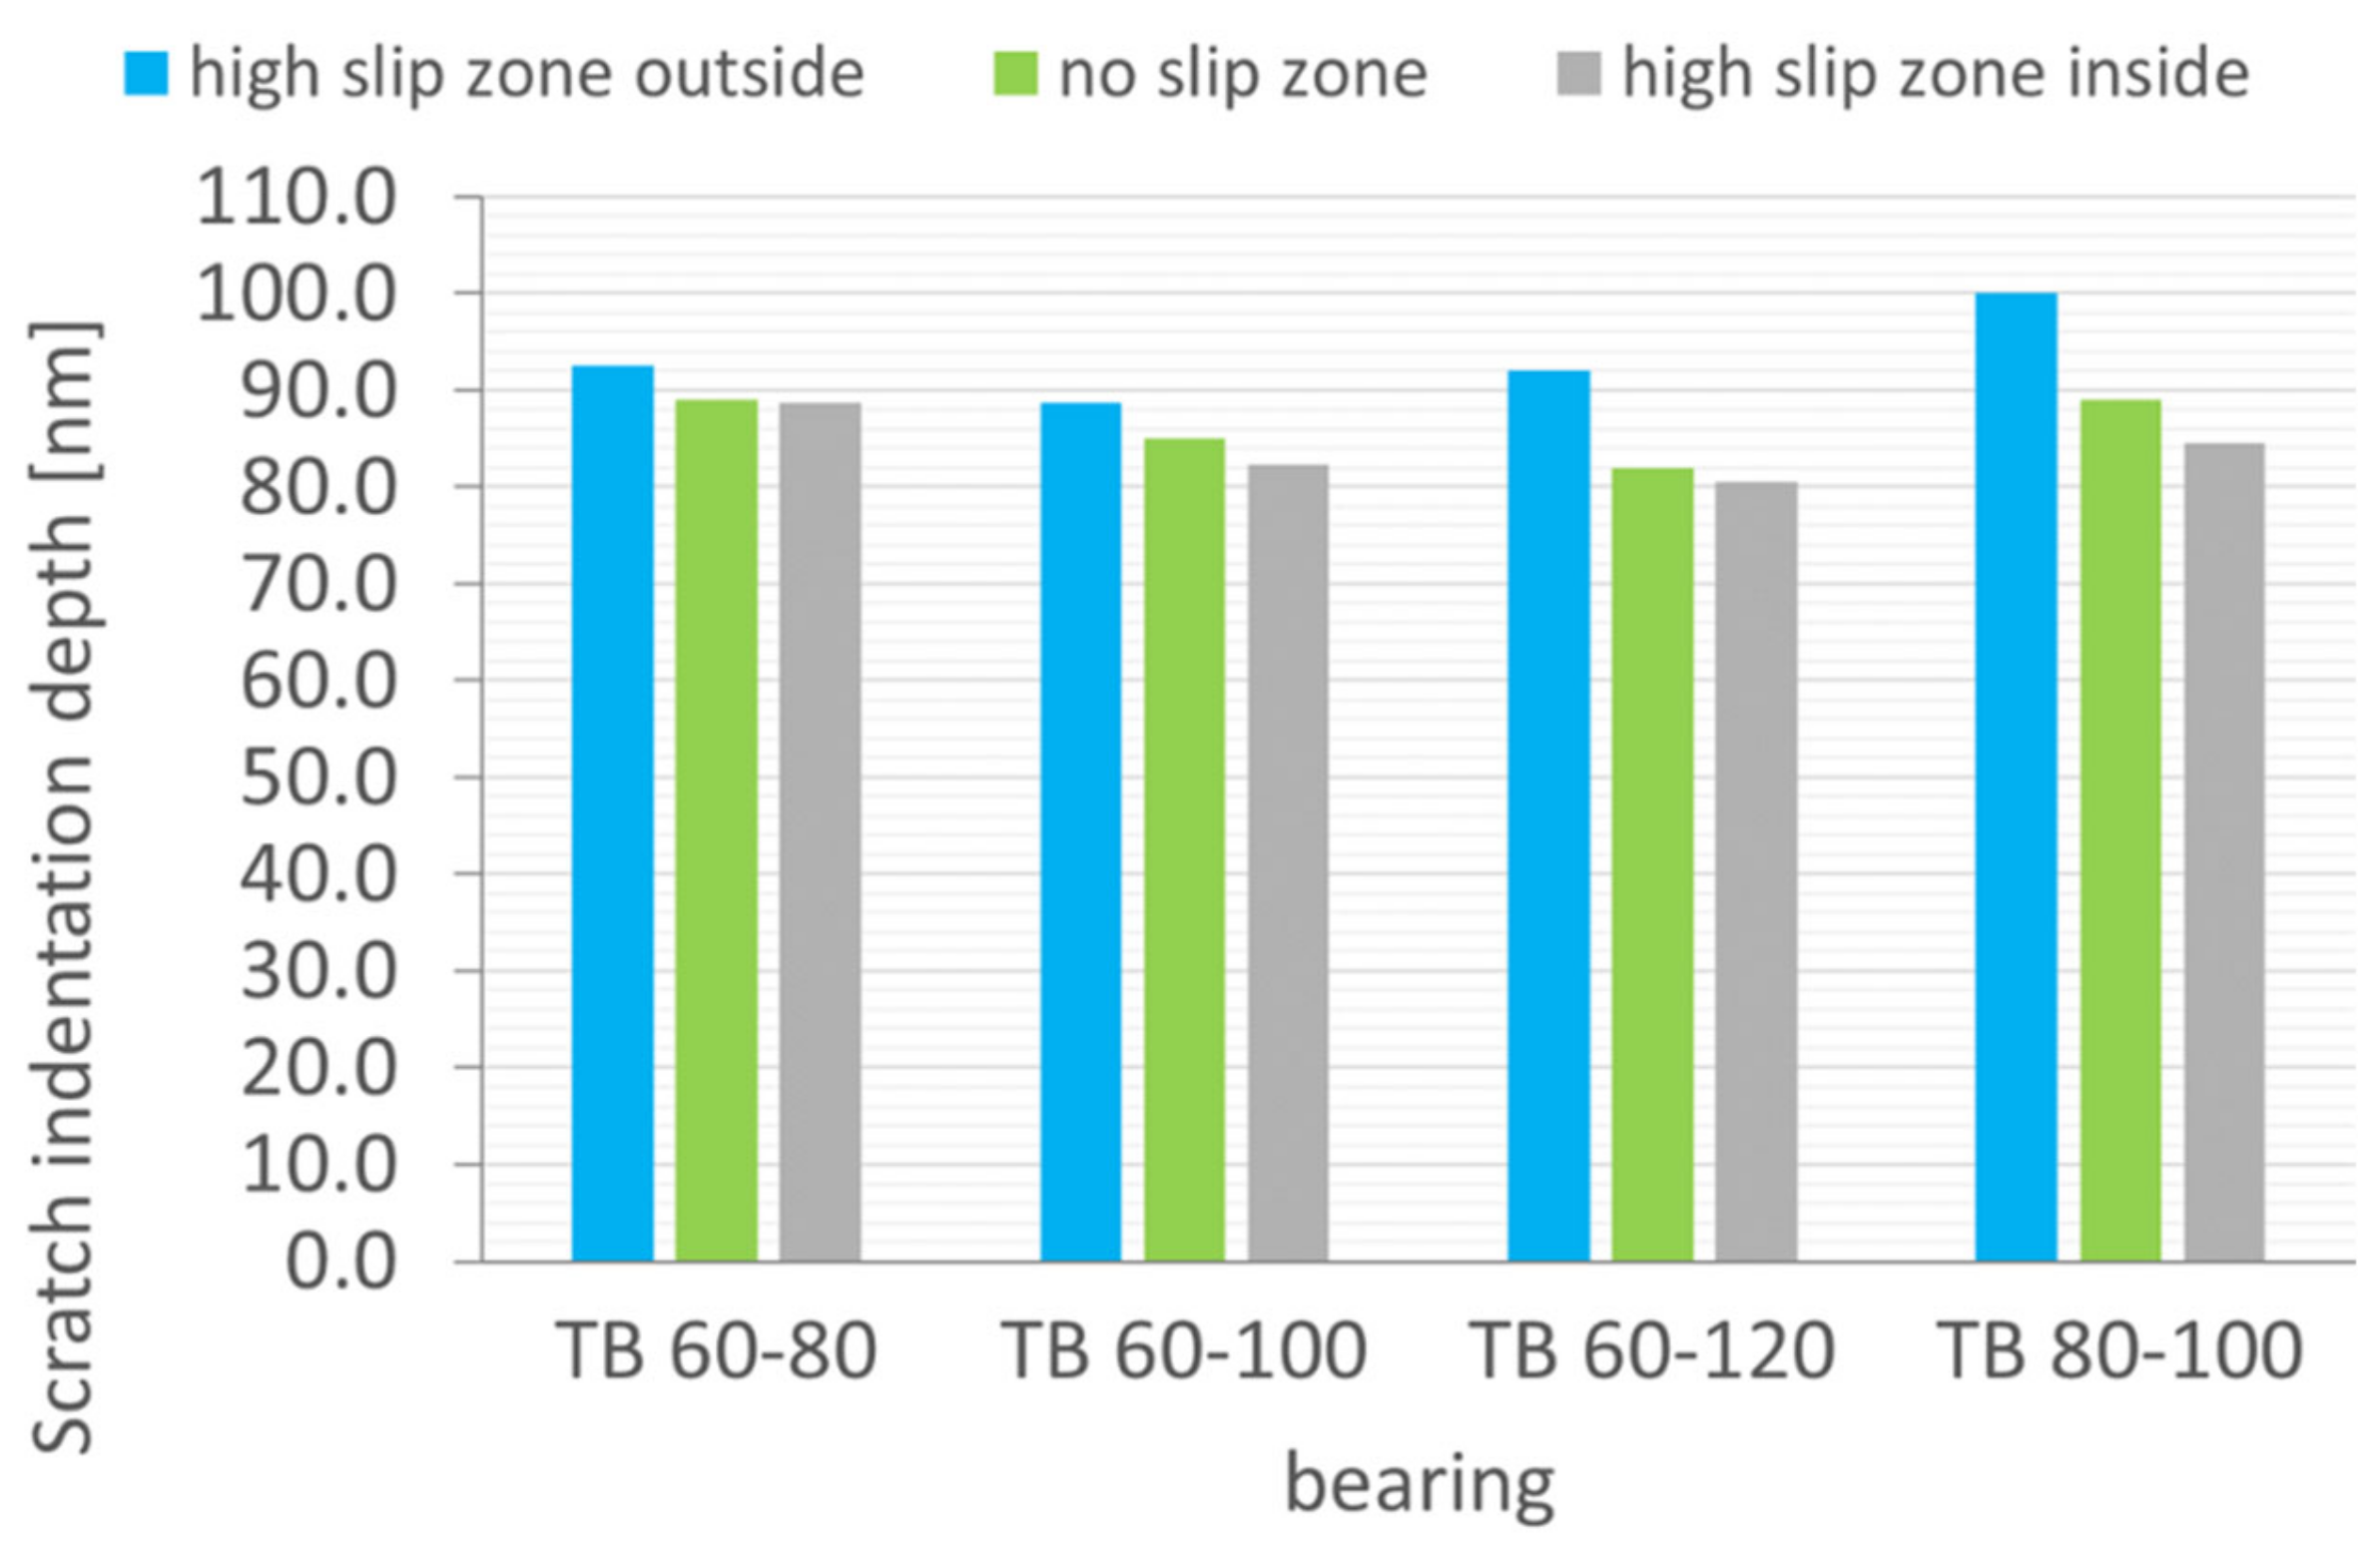
- It could be proven by nano scratch tests that the decreased hardness cannot only be measured under the contact of the tip used for the nanoindents. The soft layers are distributed for a larger field and result in wider scratches on the surface. To improve the bearing life, these boundary layers should provide soft properties combined with a higher CoF compared to boundary layers on bearings with earlier failure.
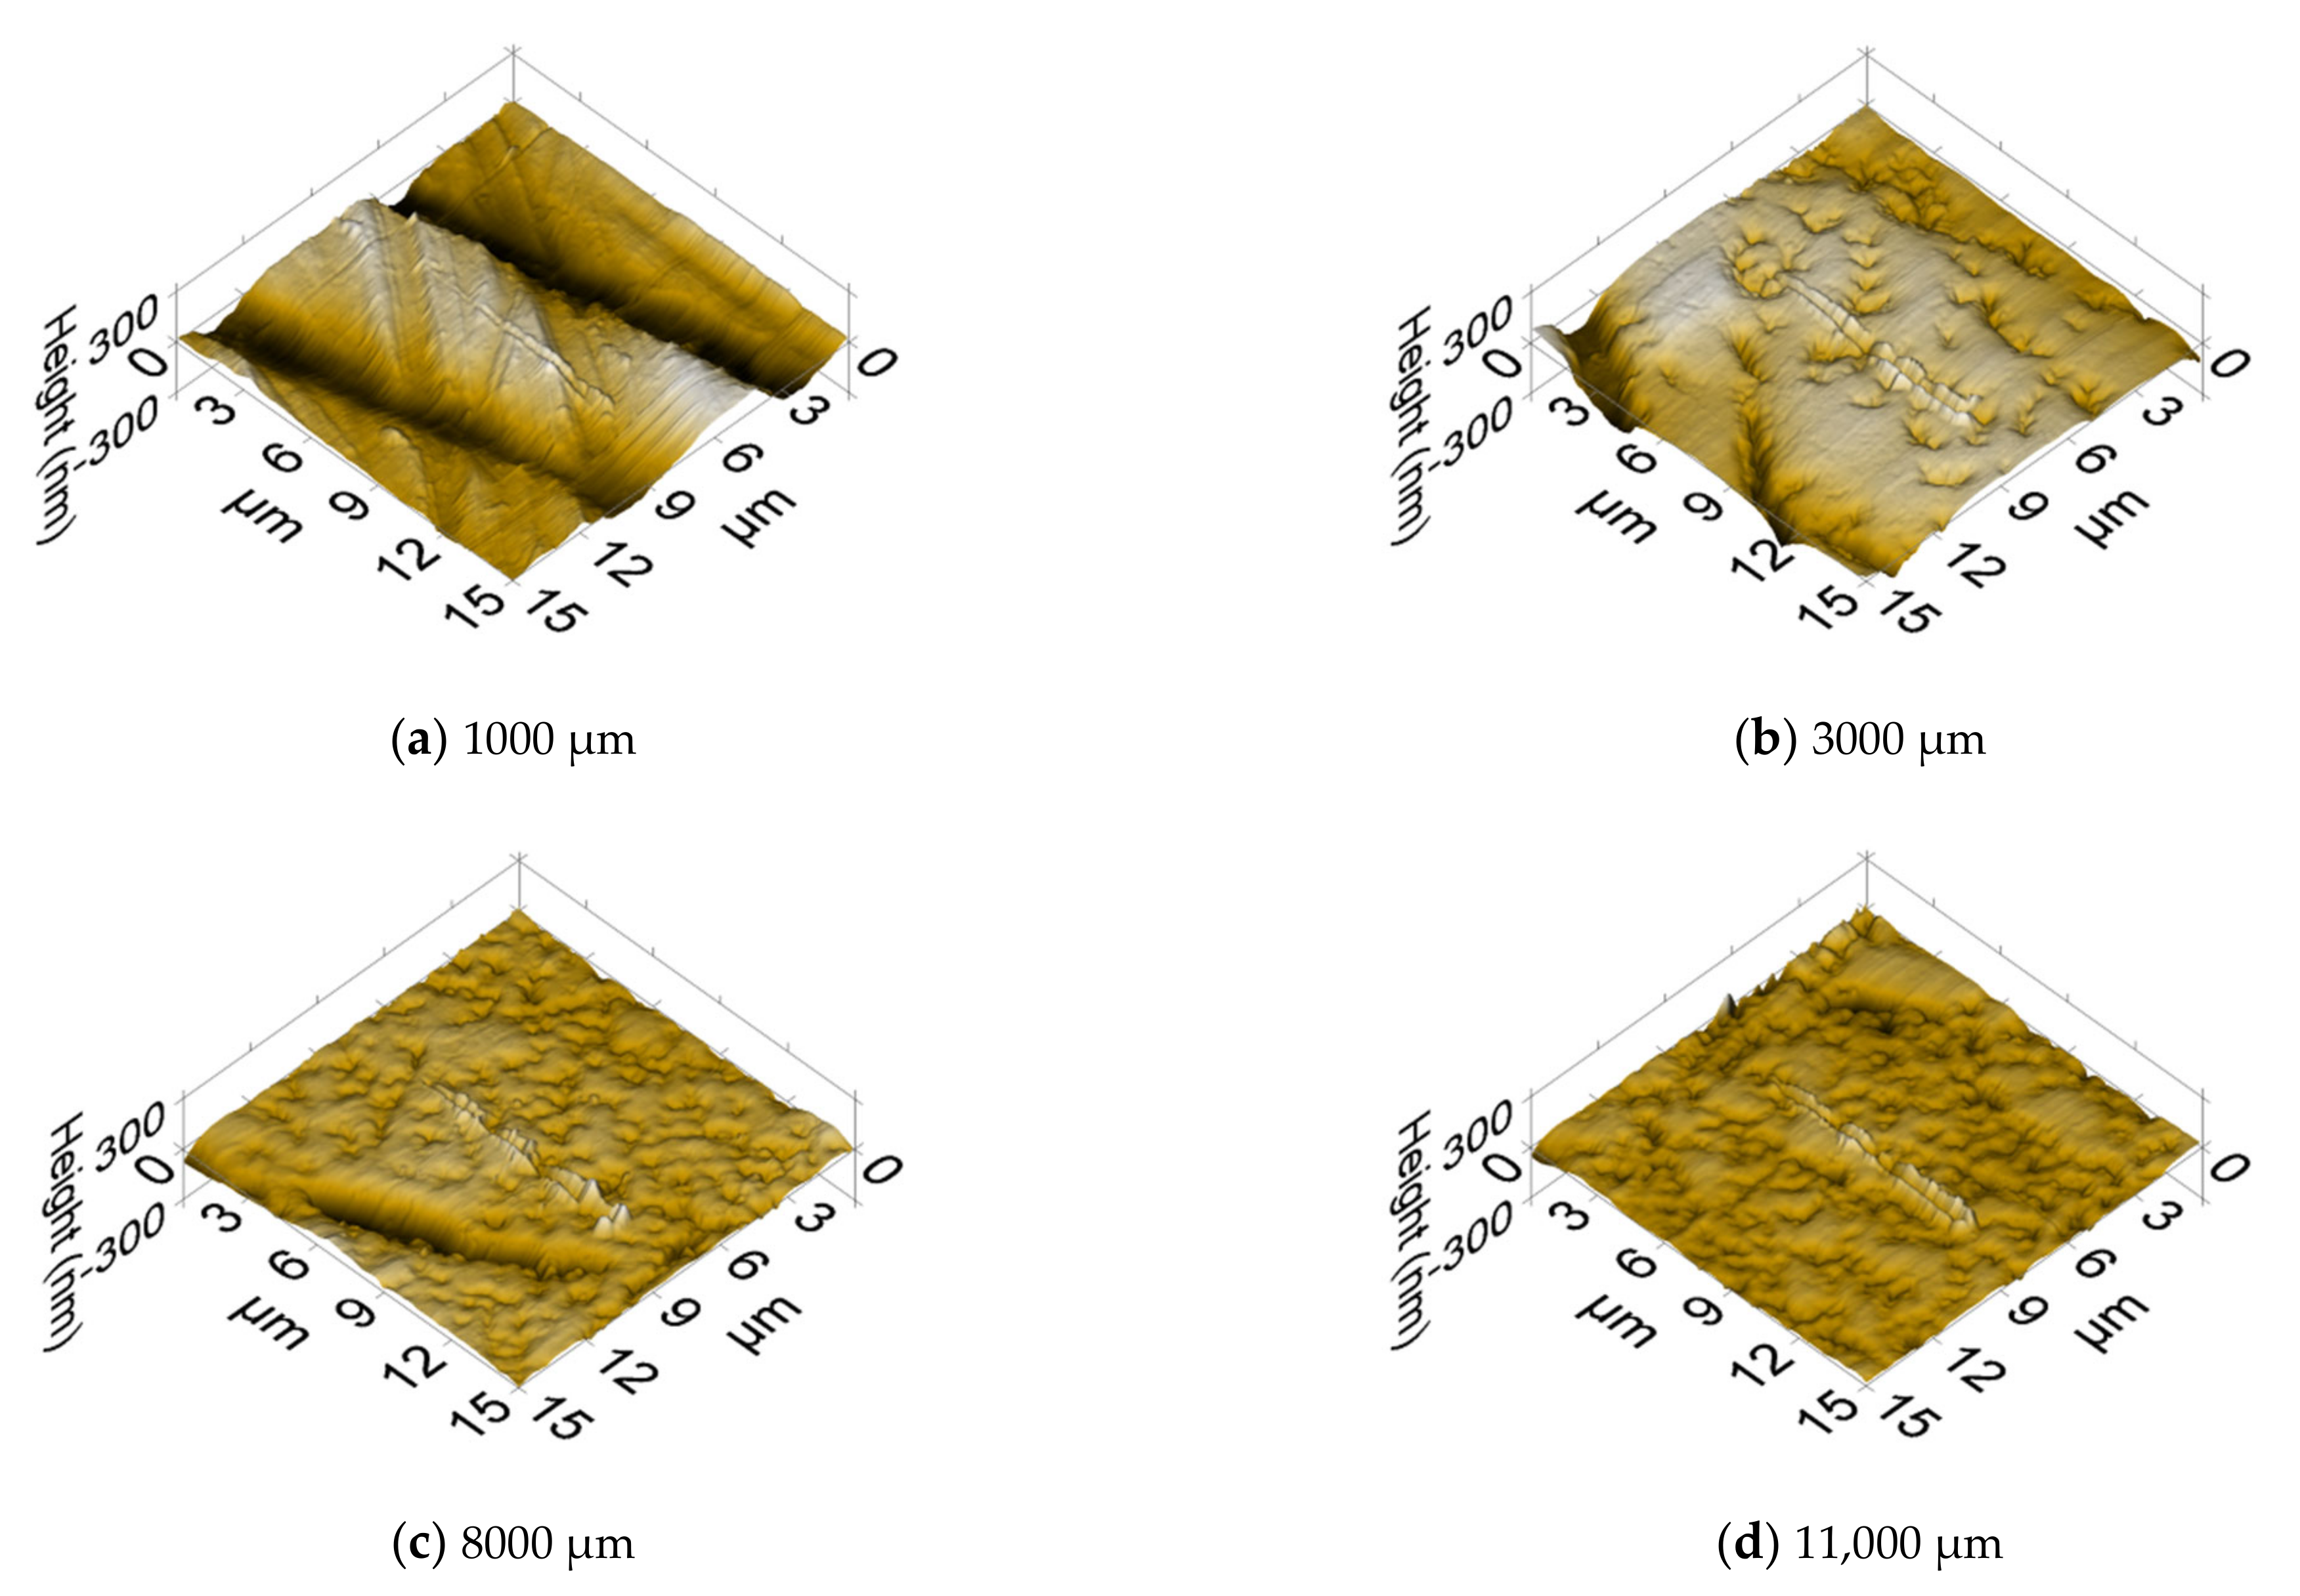
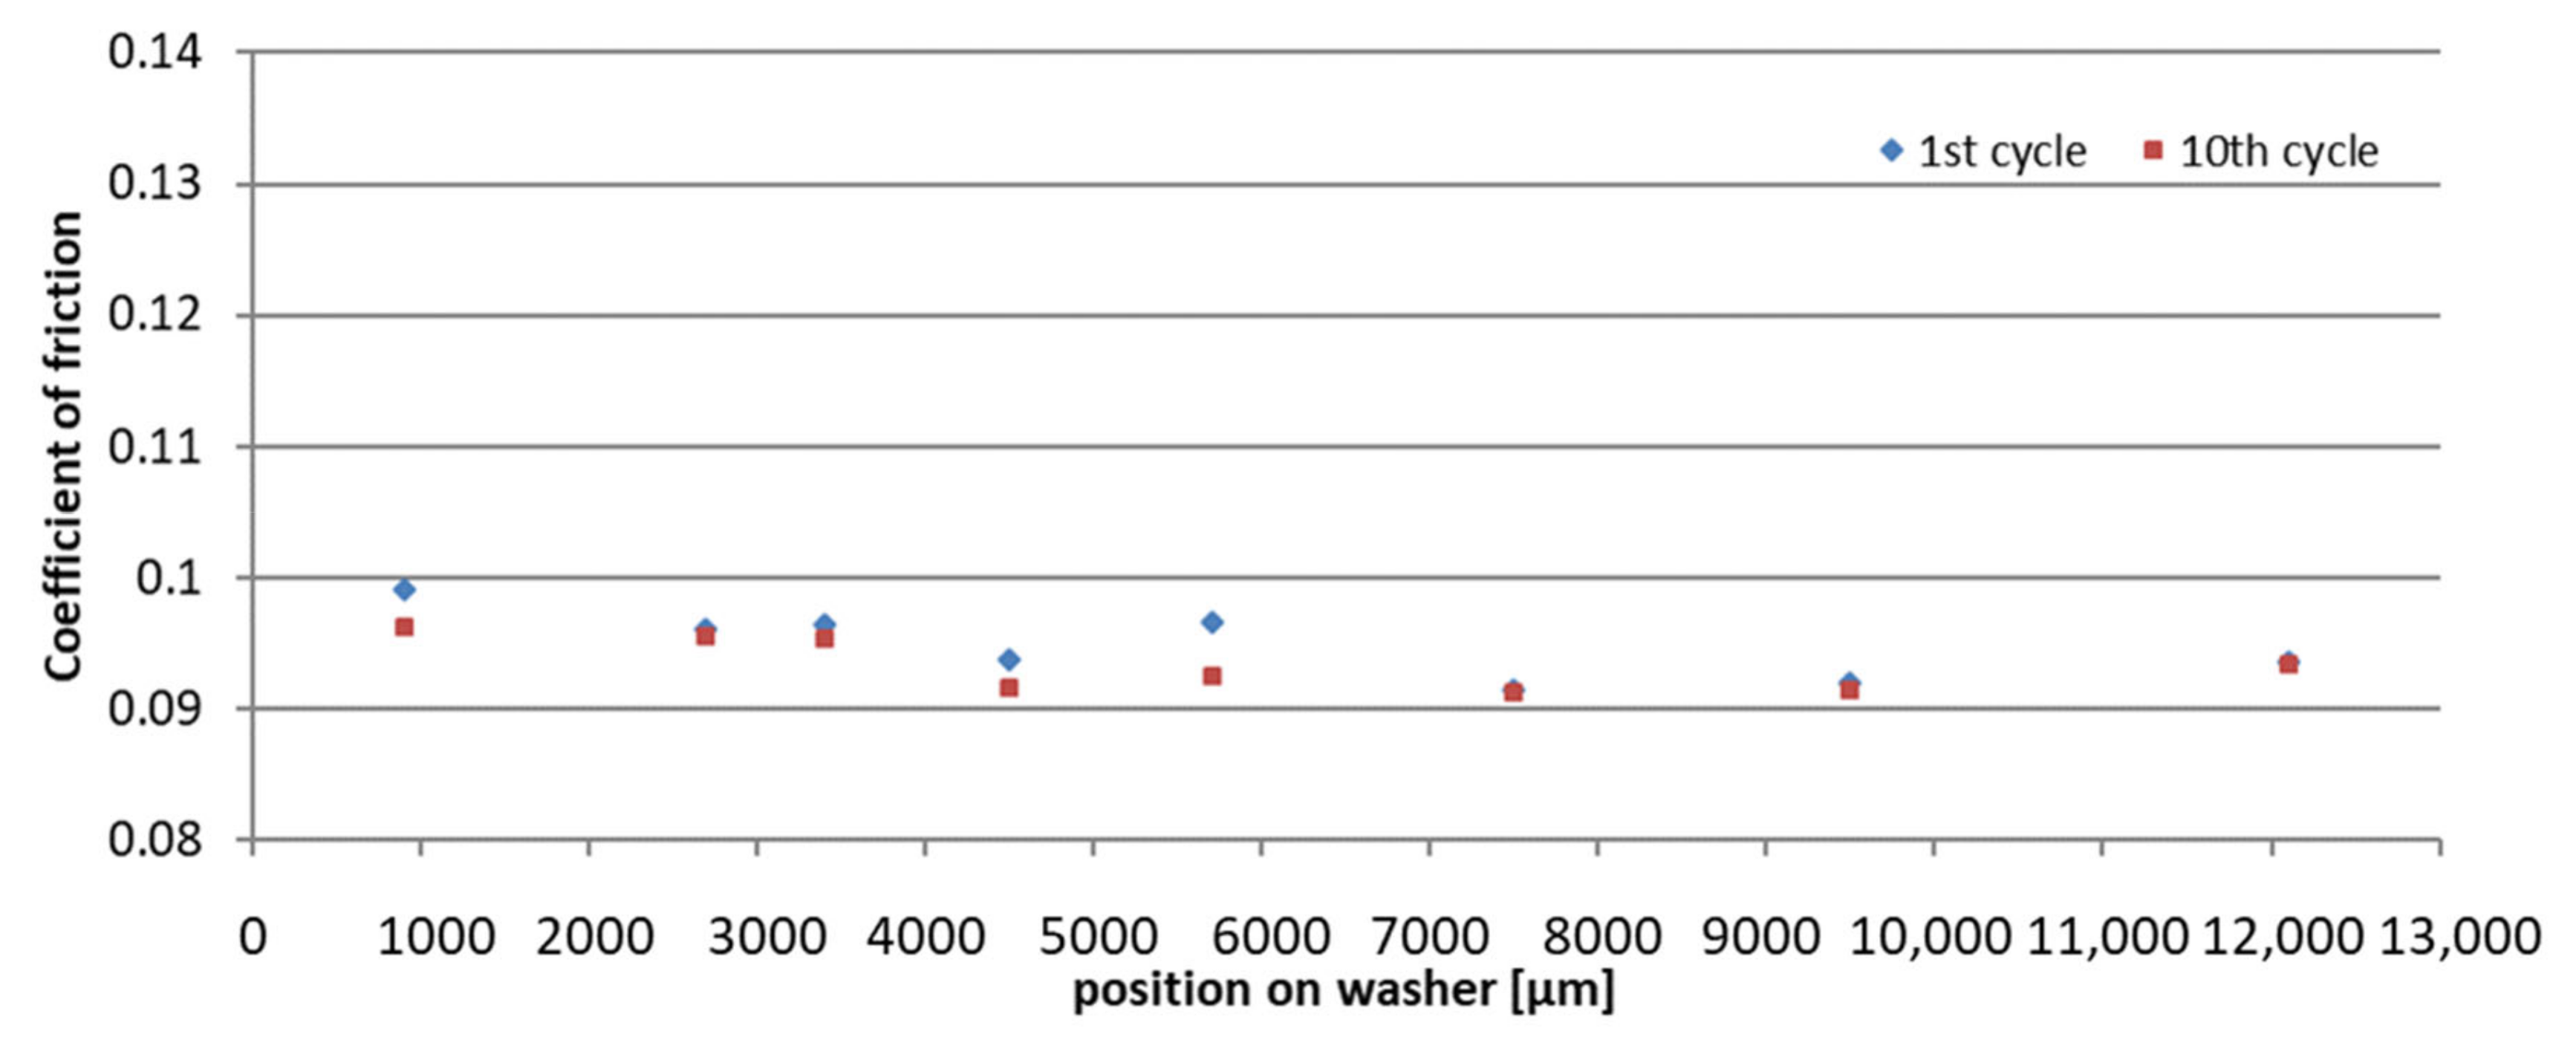
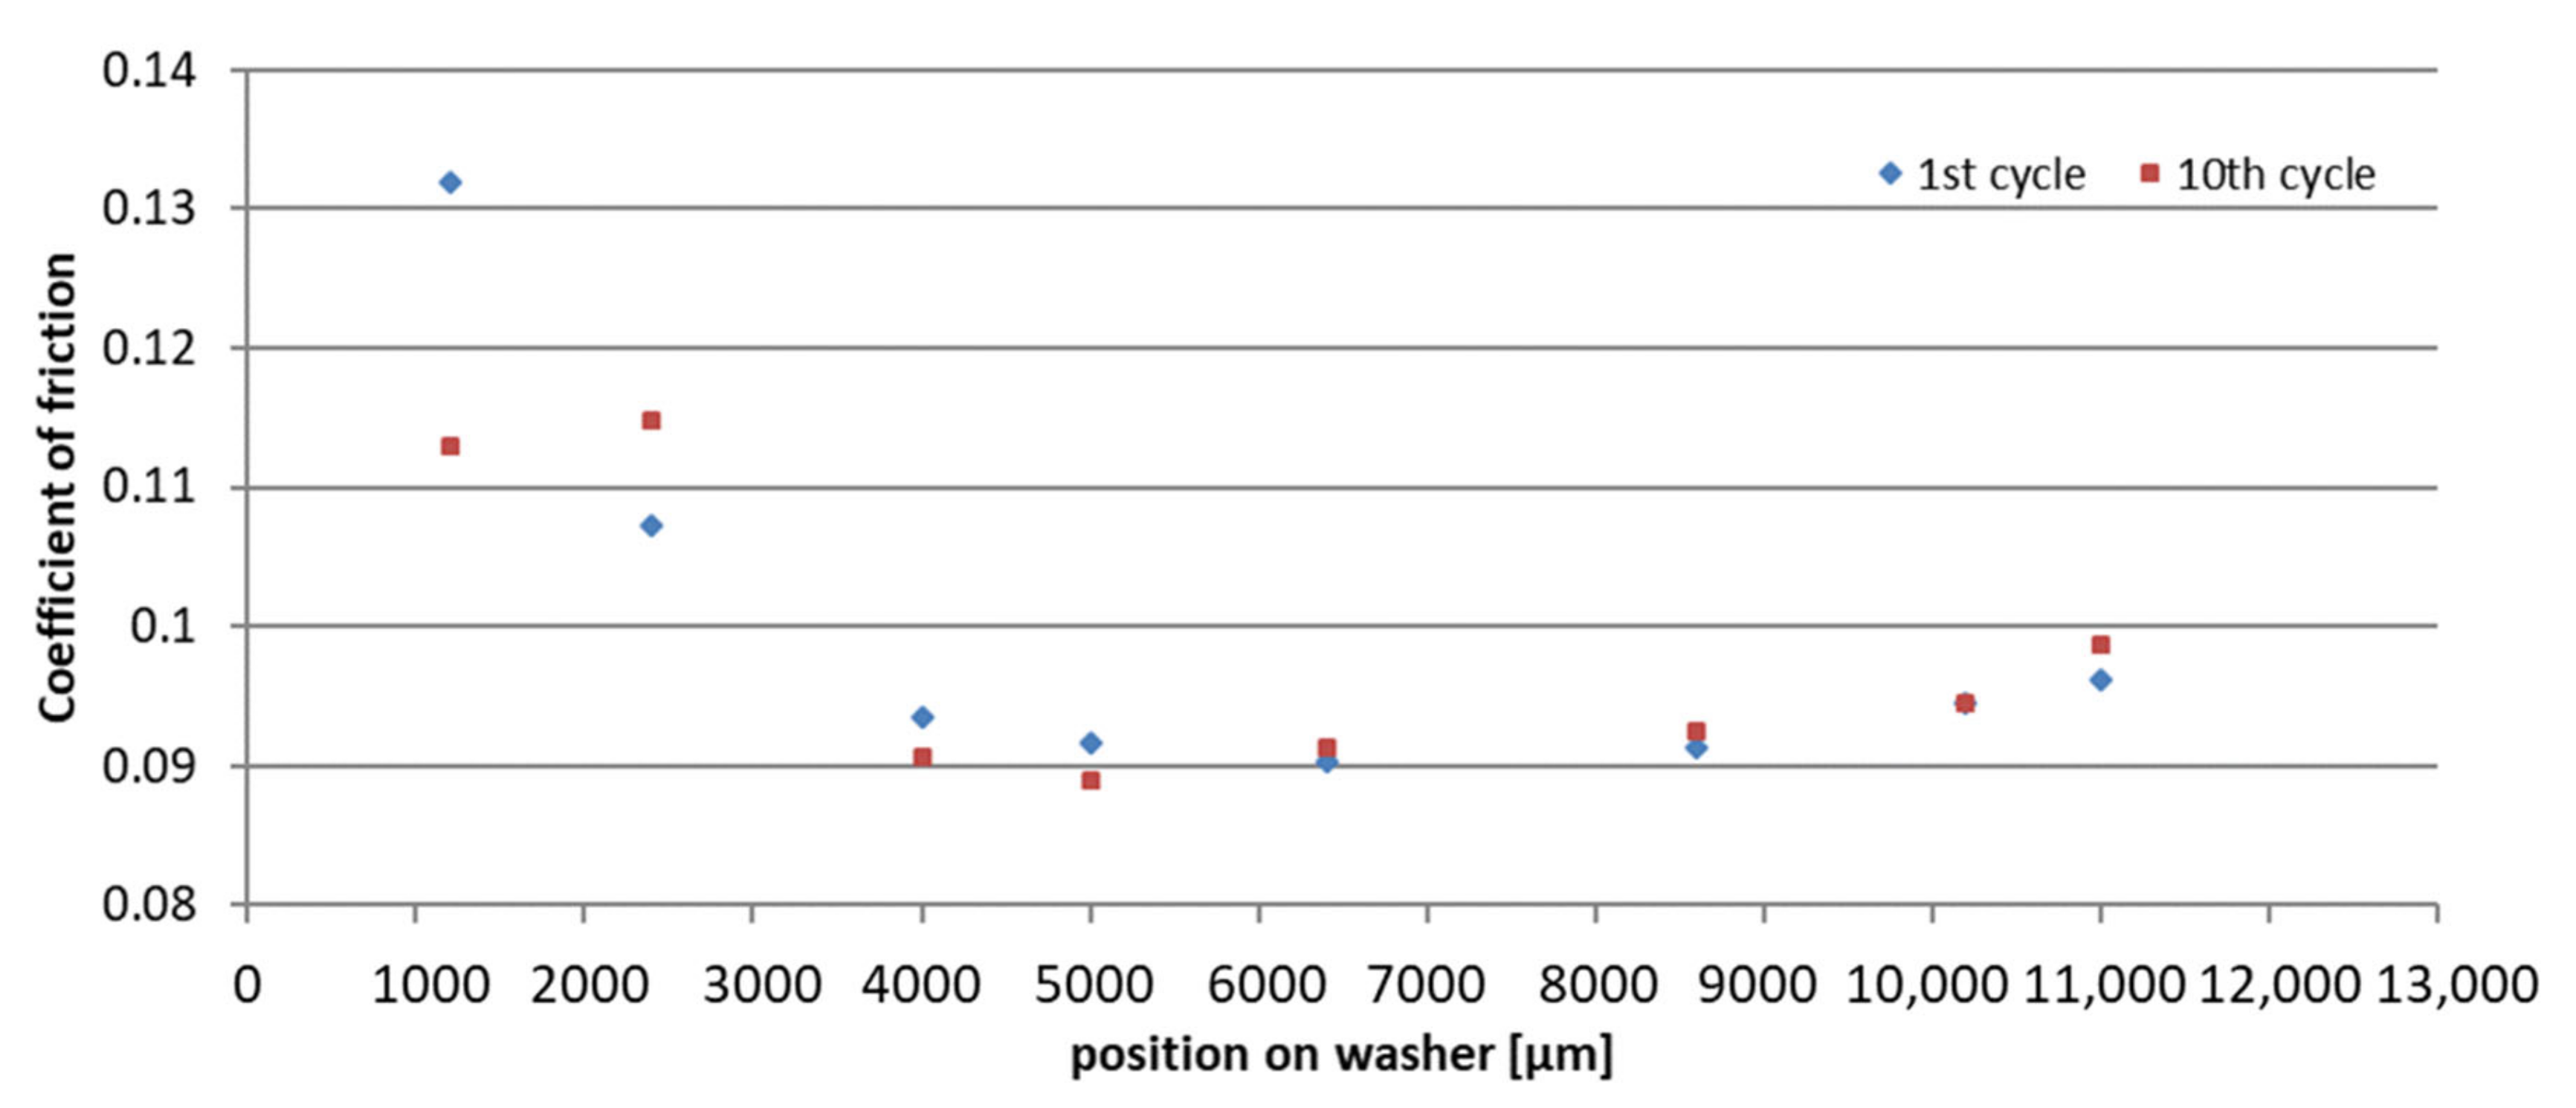
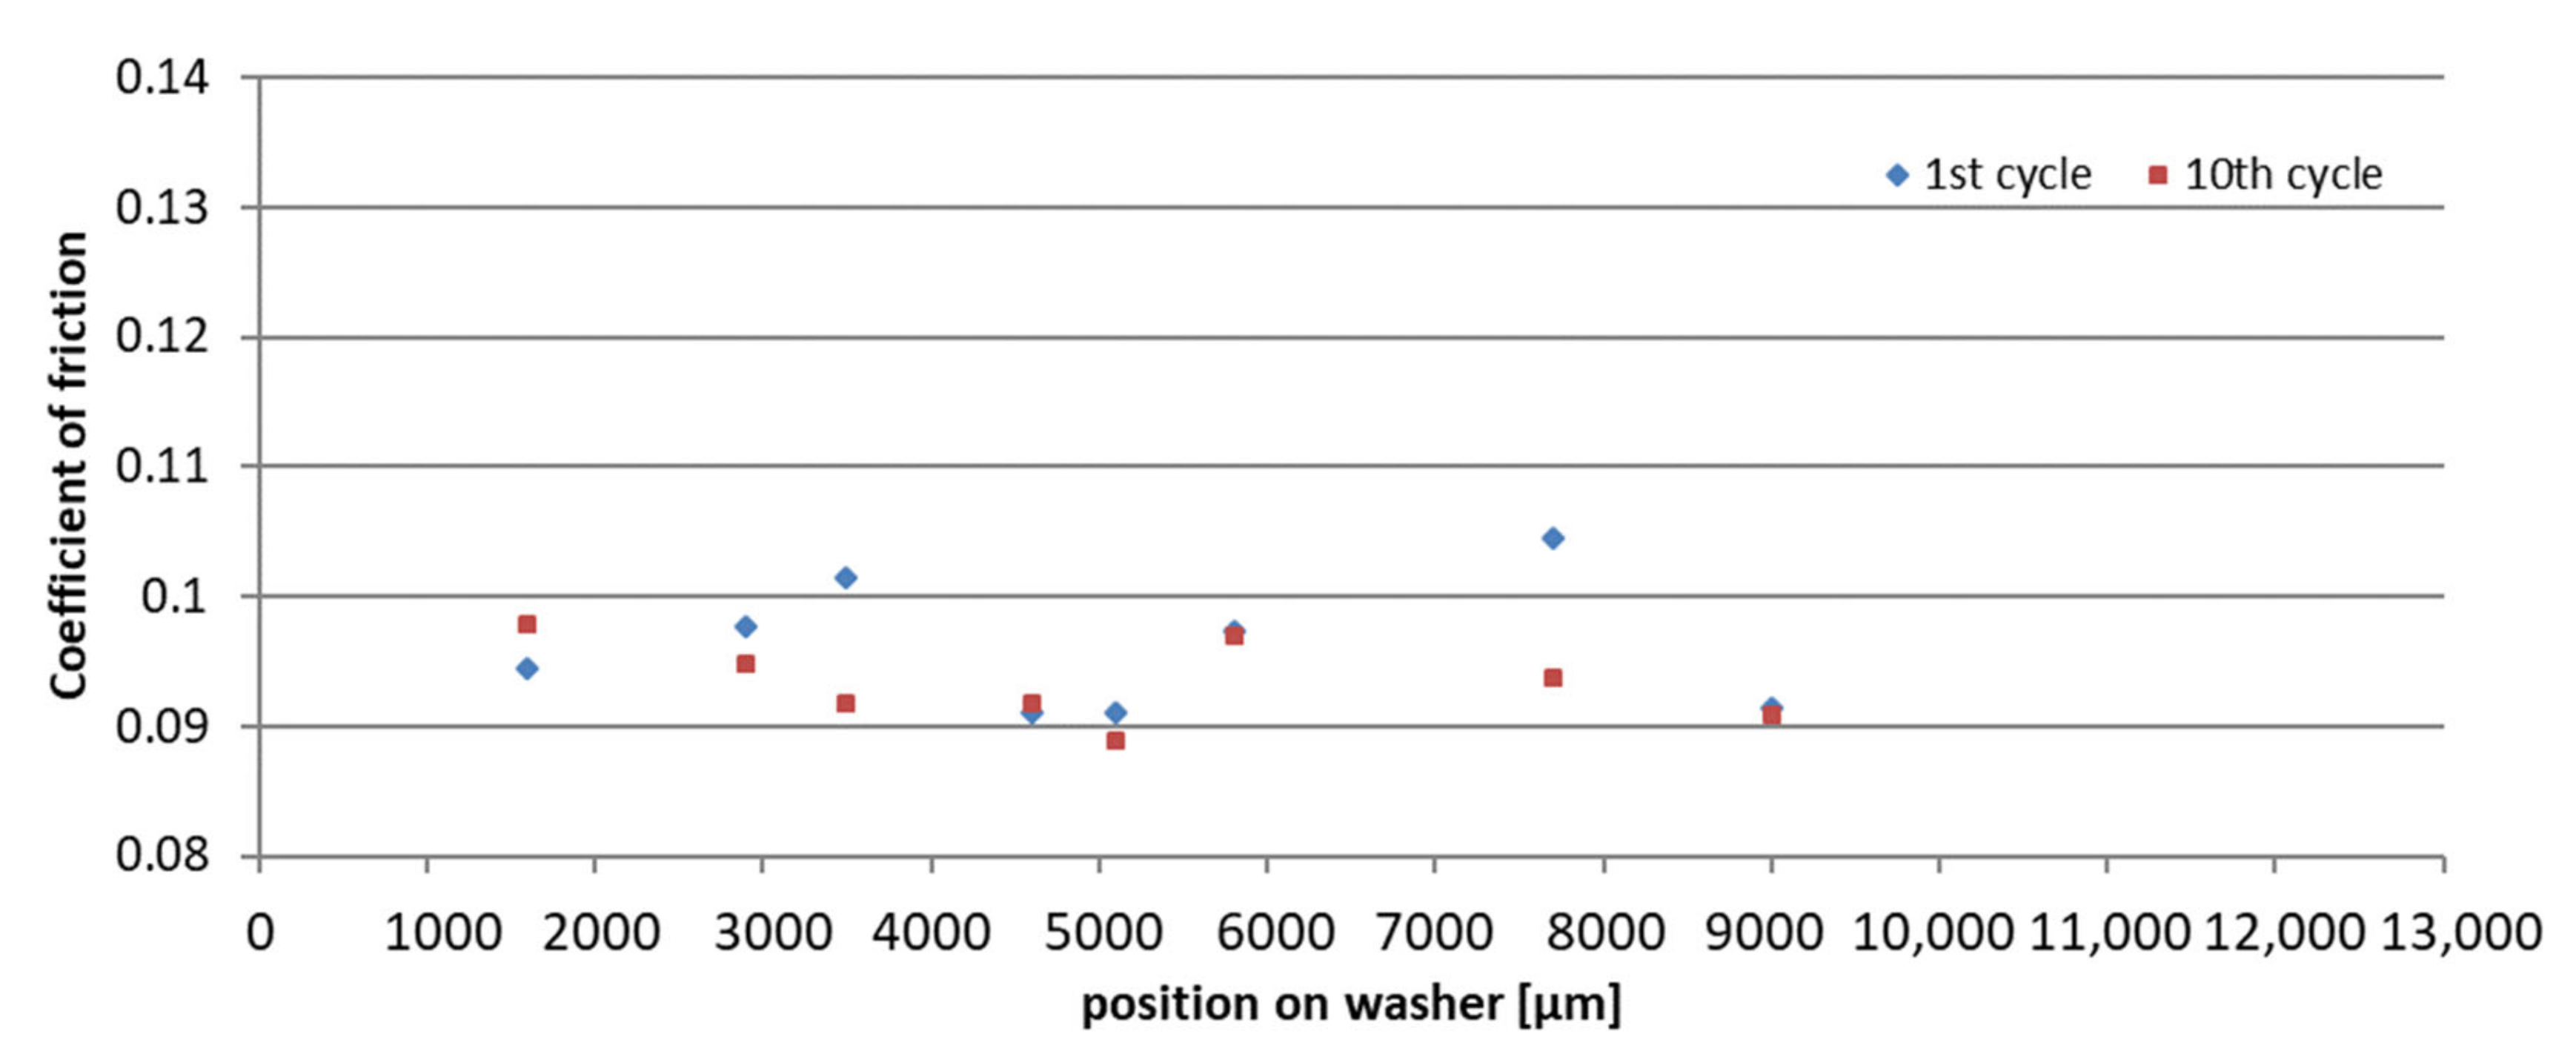
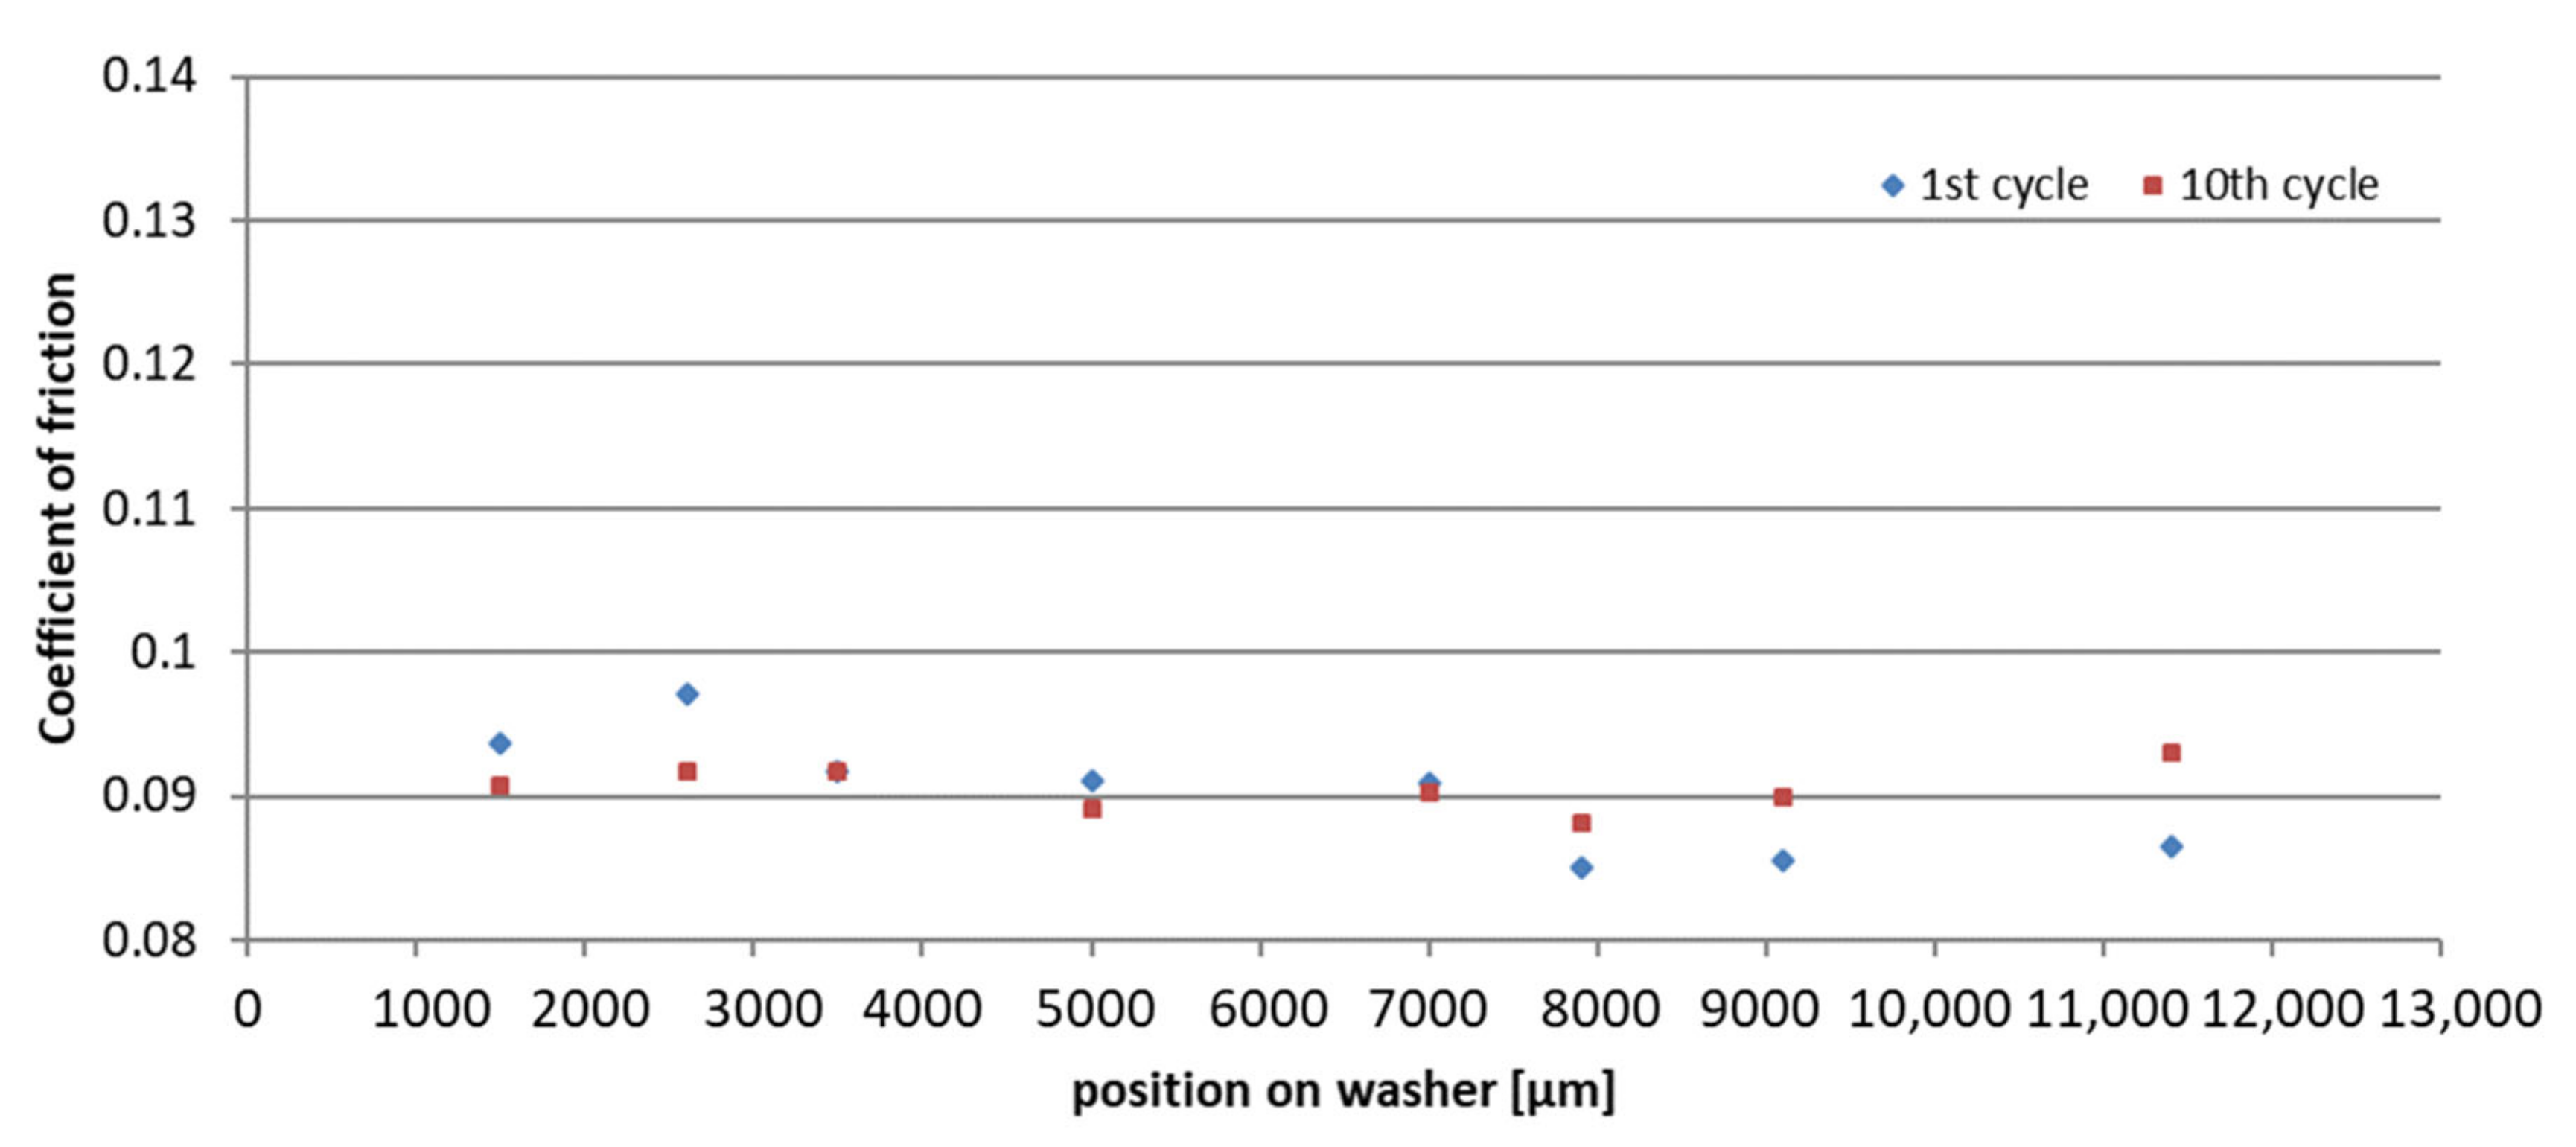
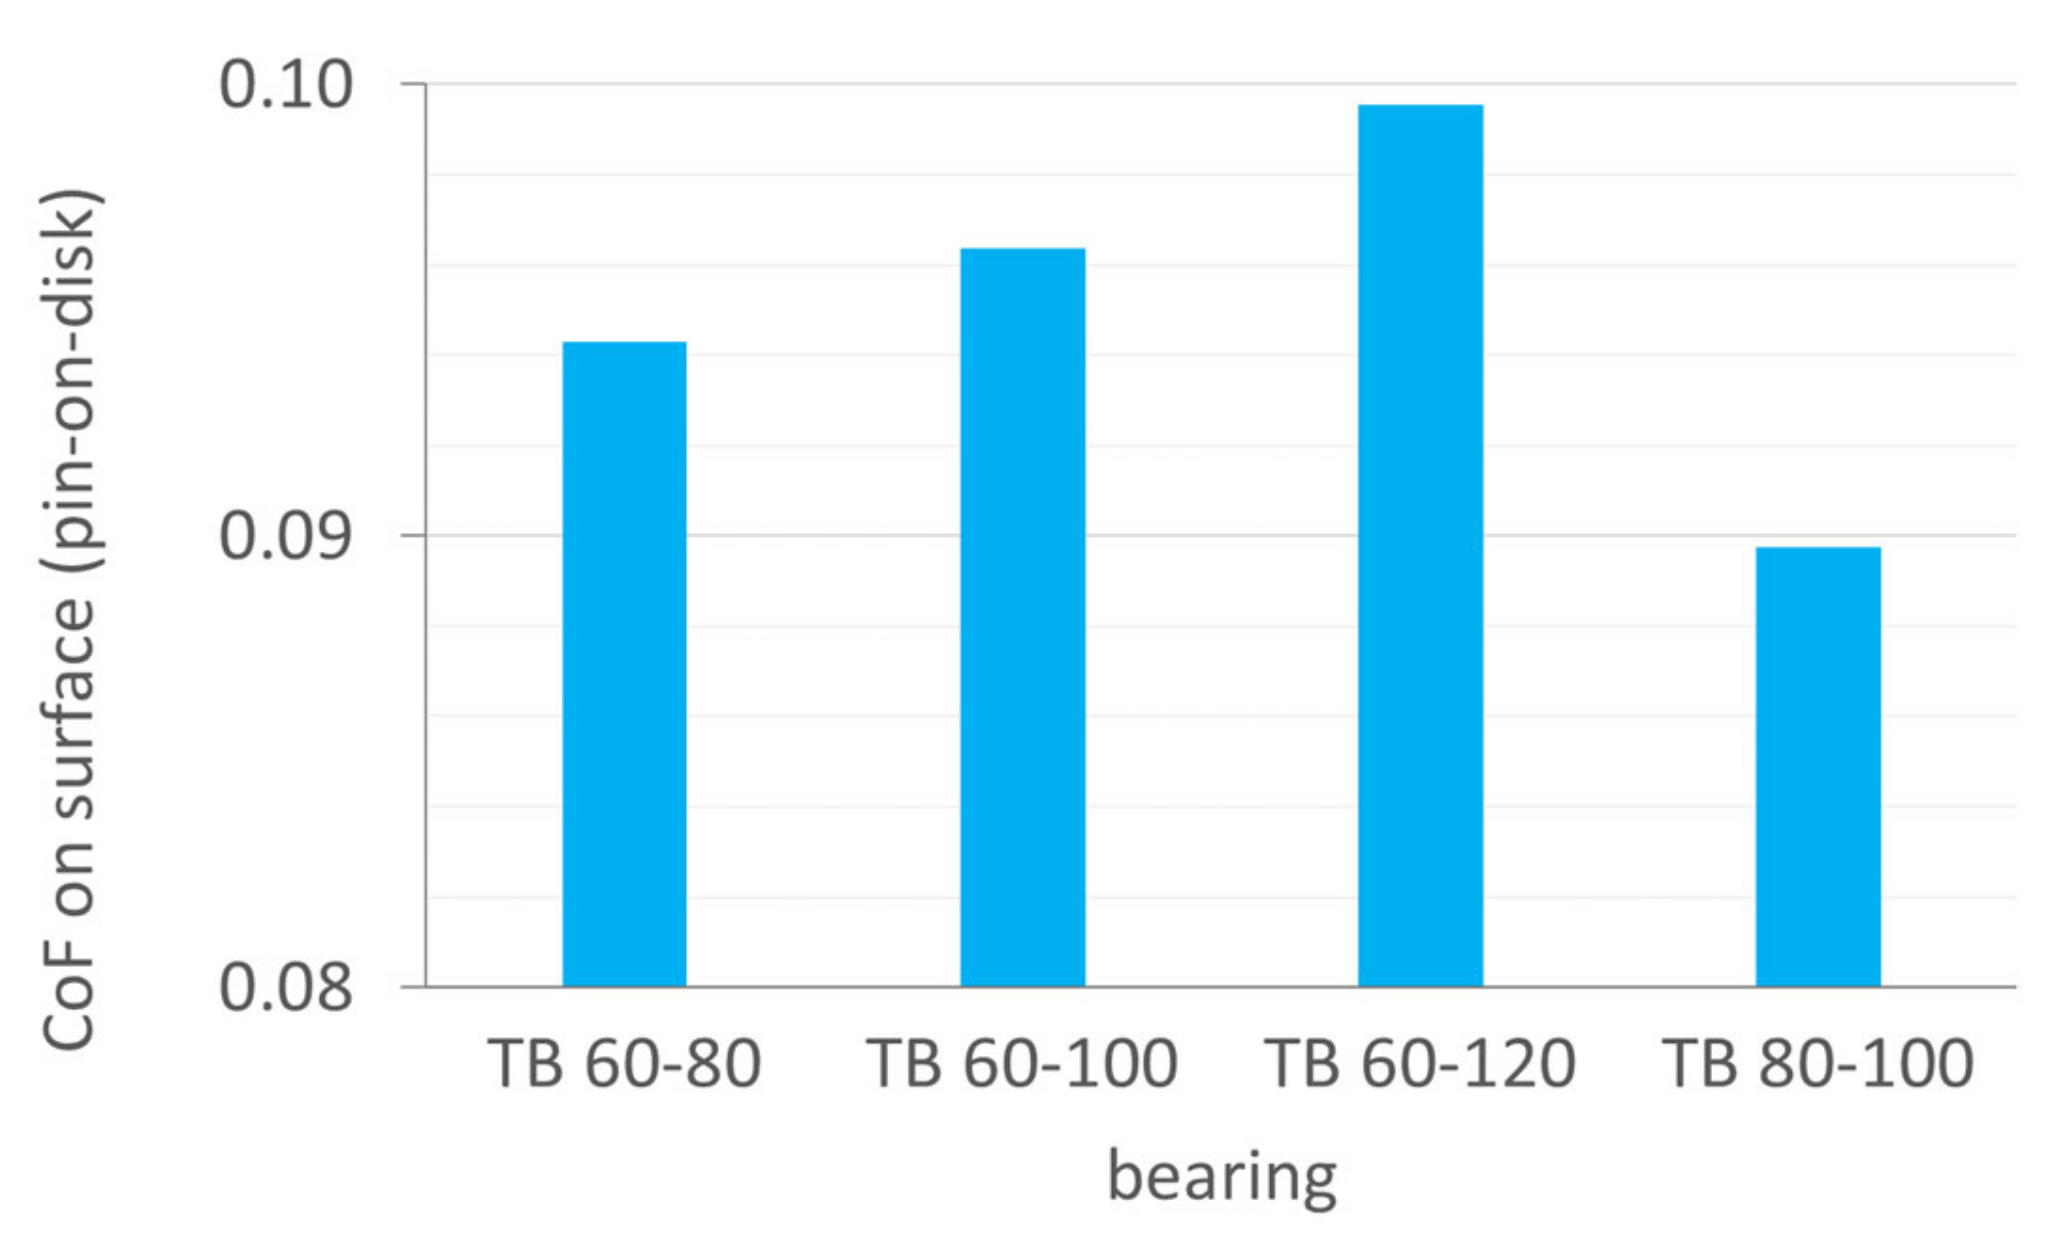
- This can be proven as well in micro pin-on-disk tests. The early failed bearings feature a lower CoF on the surface between 0.9 and 1, while the bearing washers run at 80 °C and 120 °C feature higher frictional properties on the surface. Thus, a change in the running conditions changes the tribochemical reactions on the surface and results in preferable boundary layers.
- It could also be shown that slipping wear with partial tribofilm loss does not result in subsurface WEC formation.
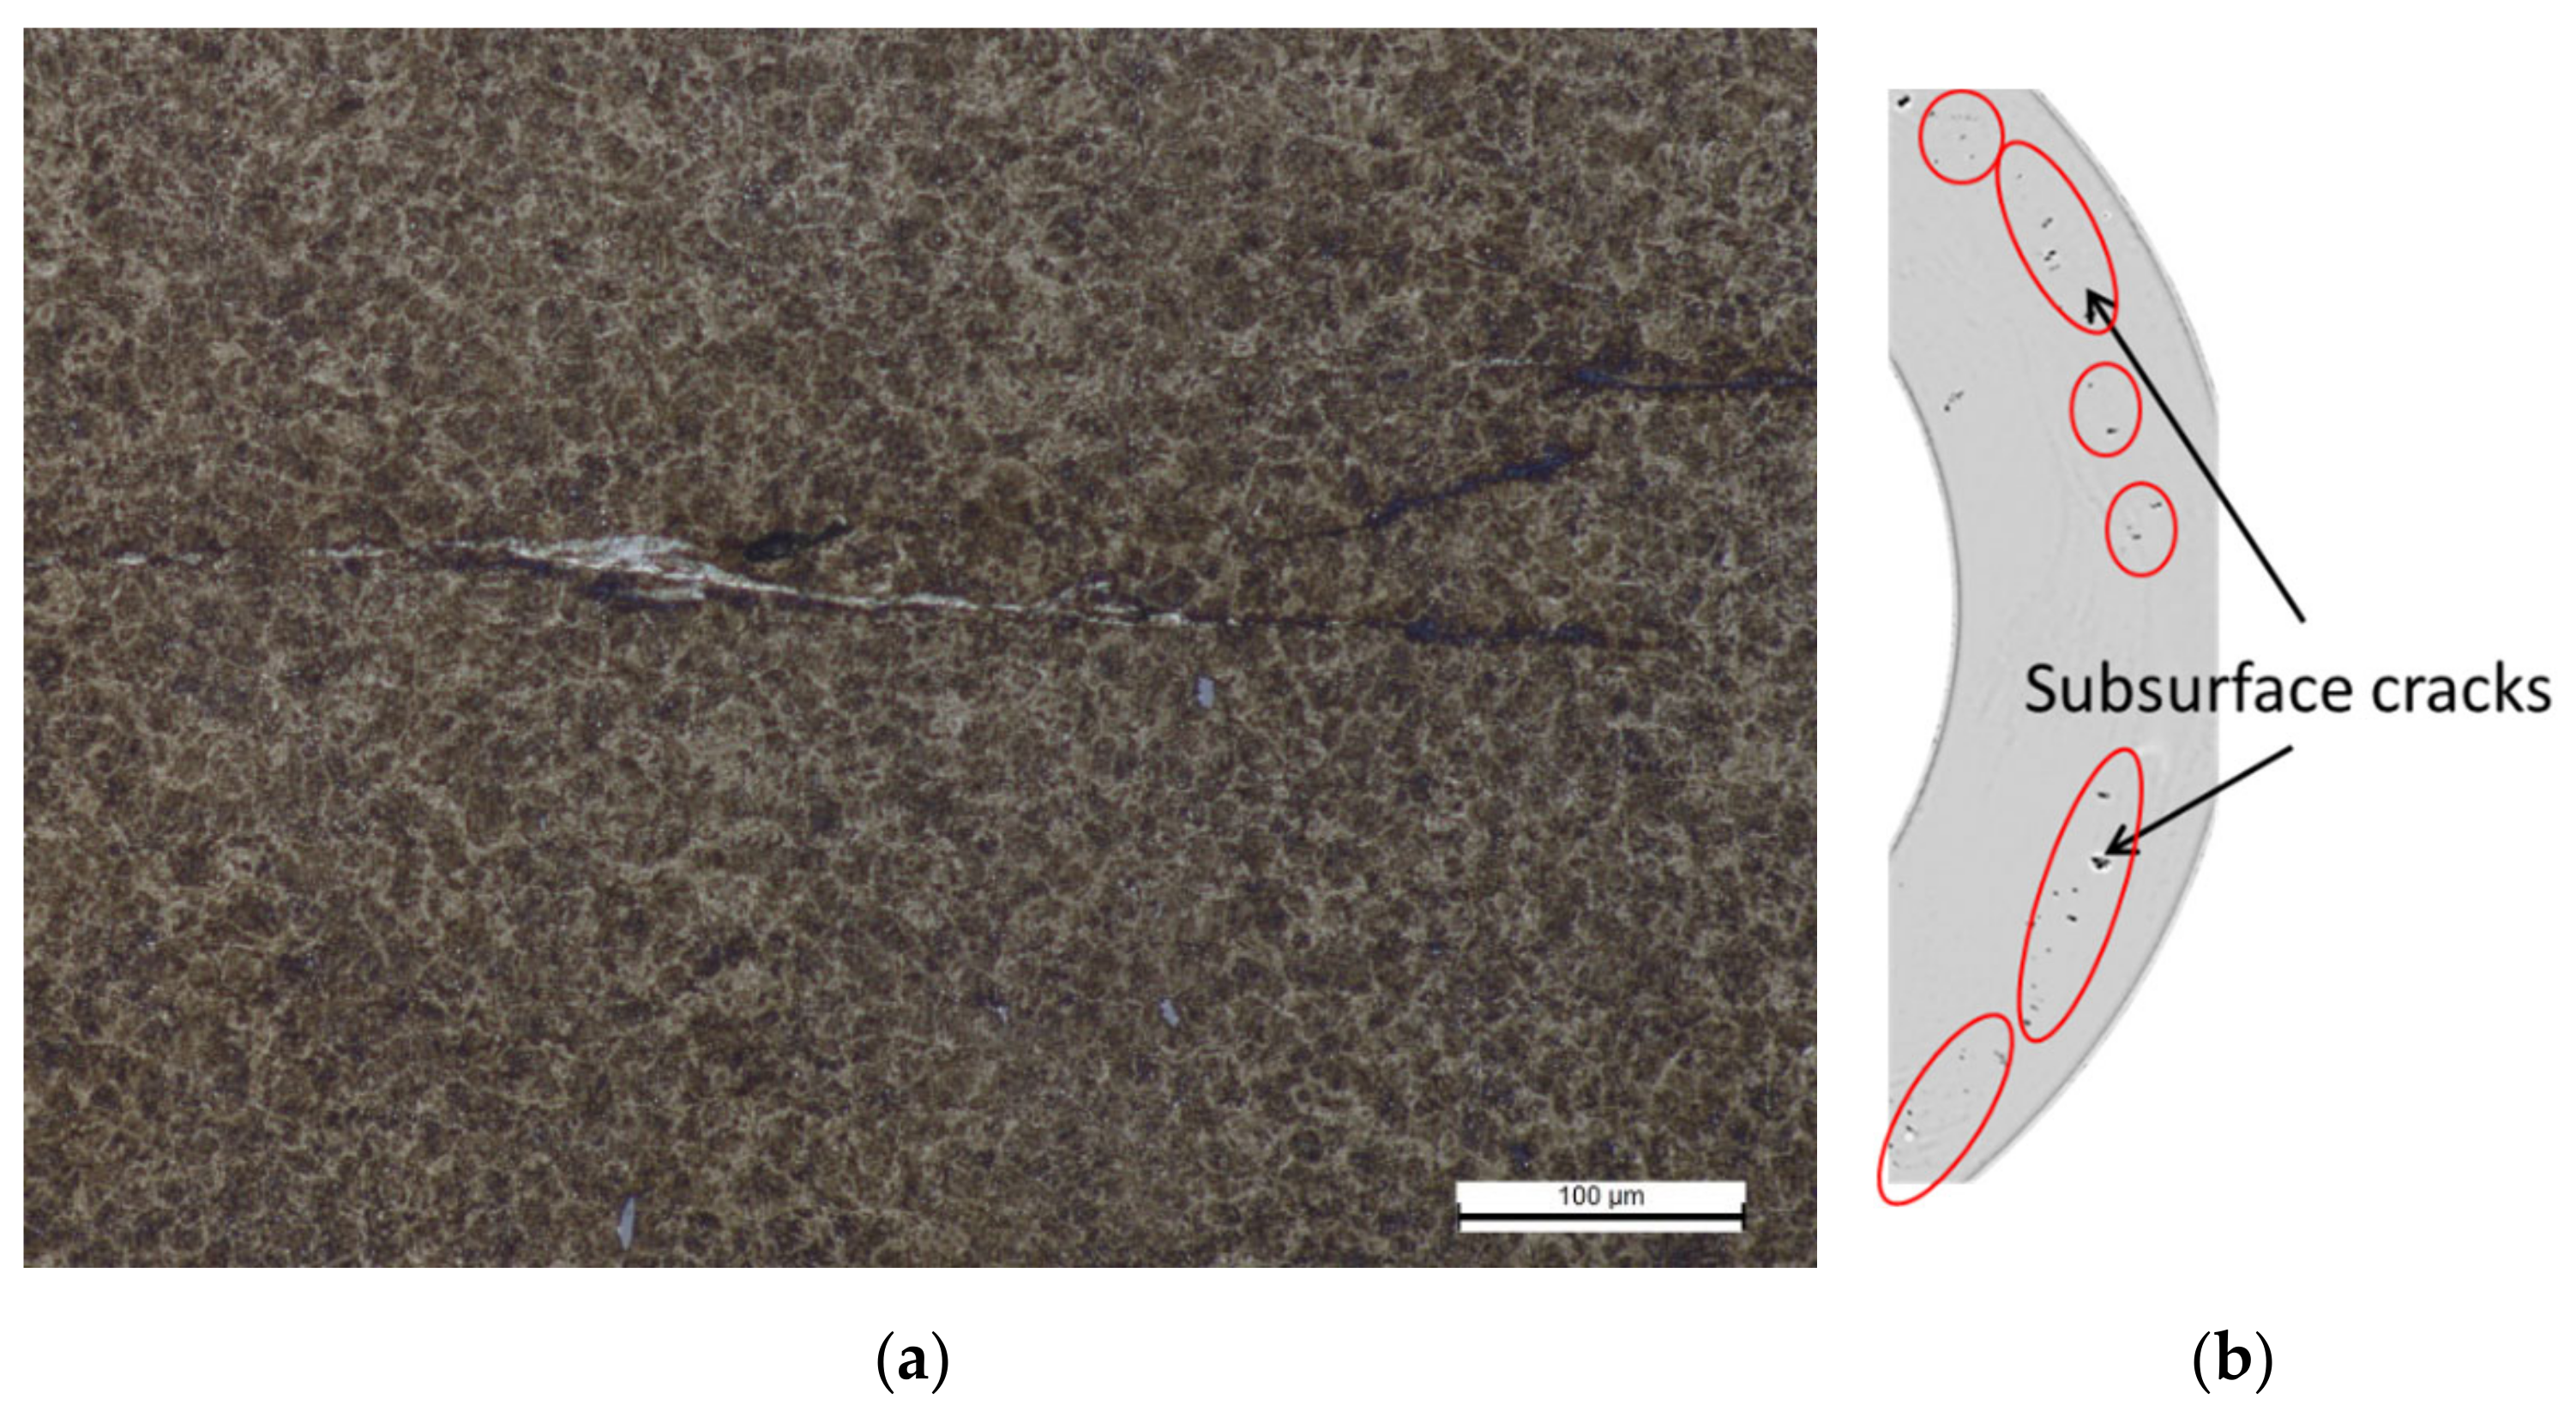
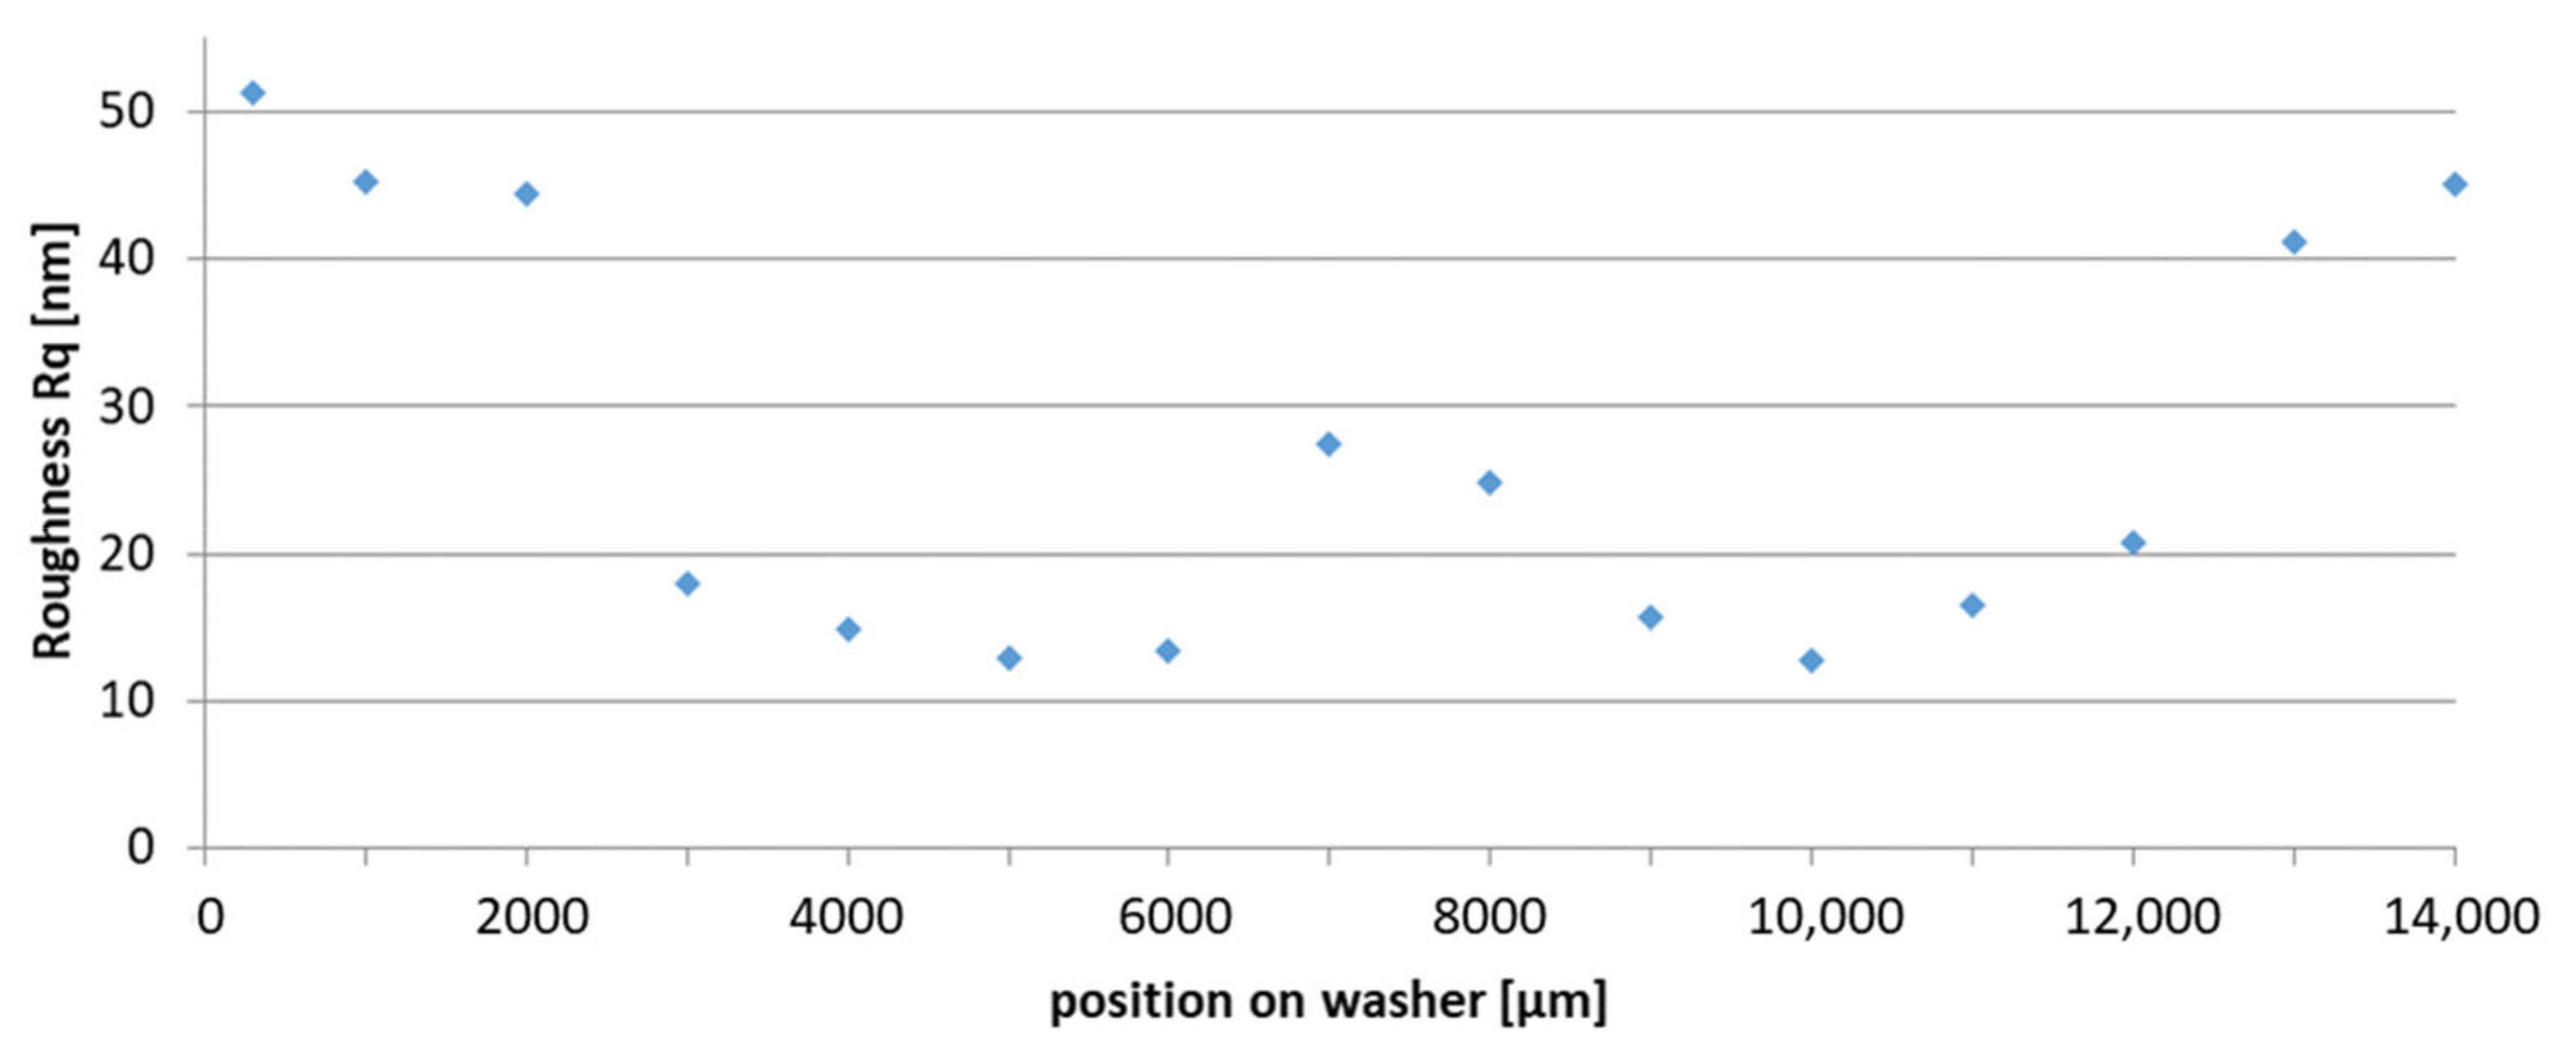
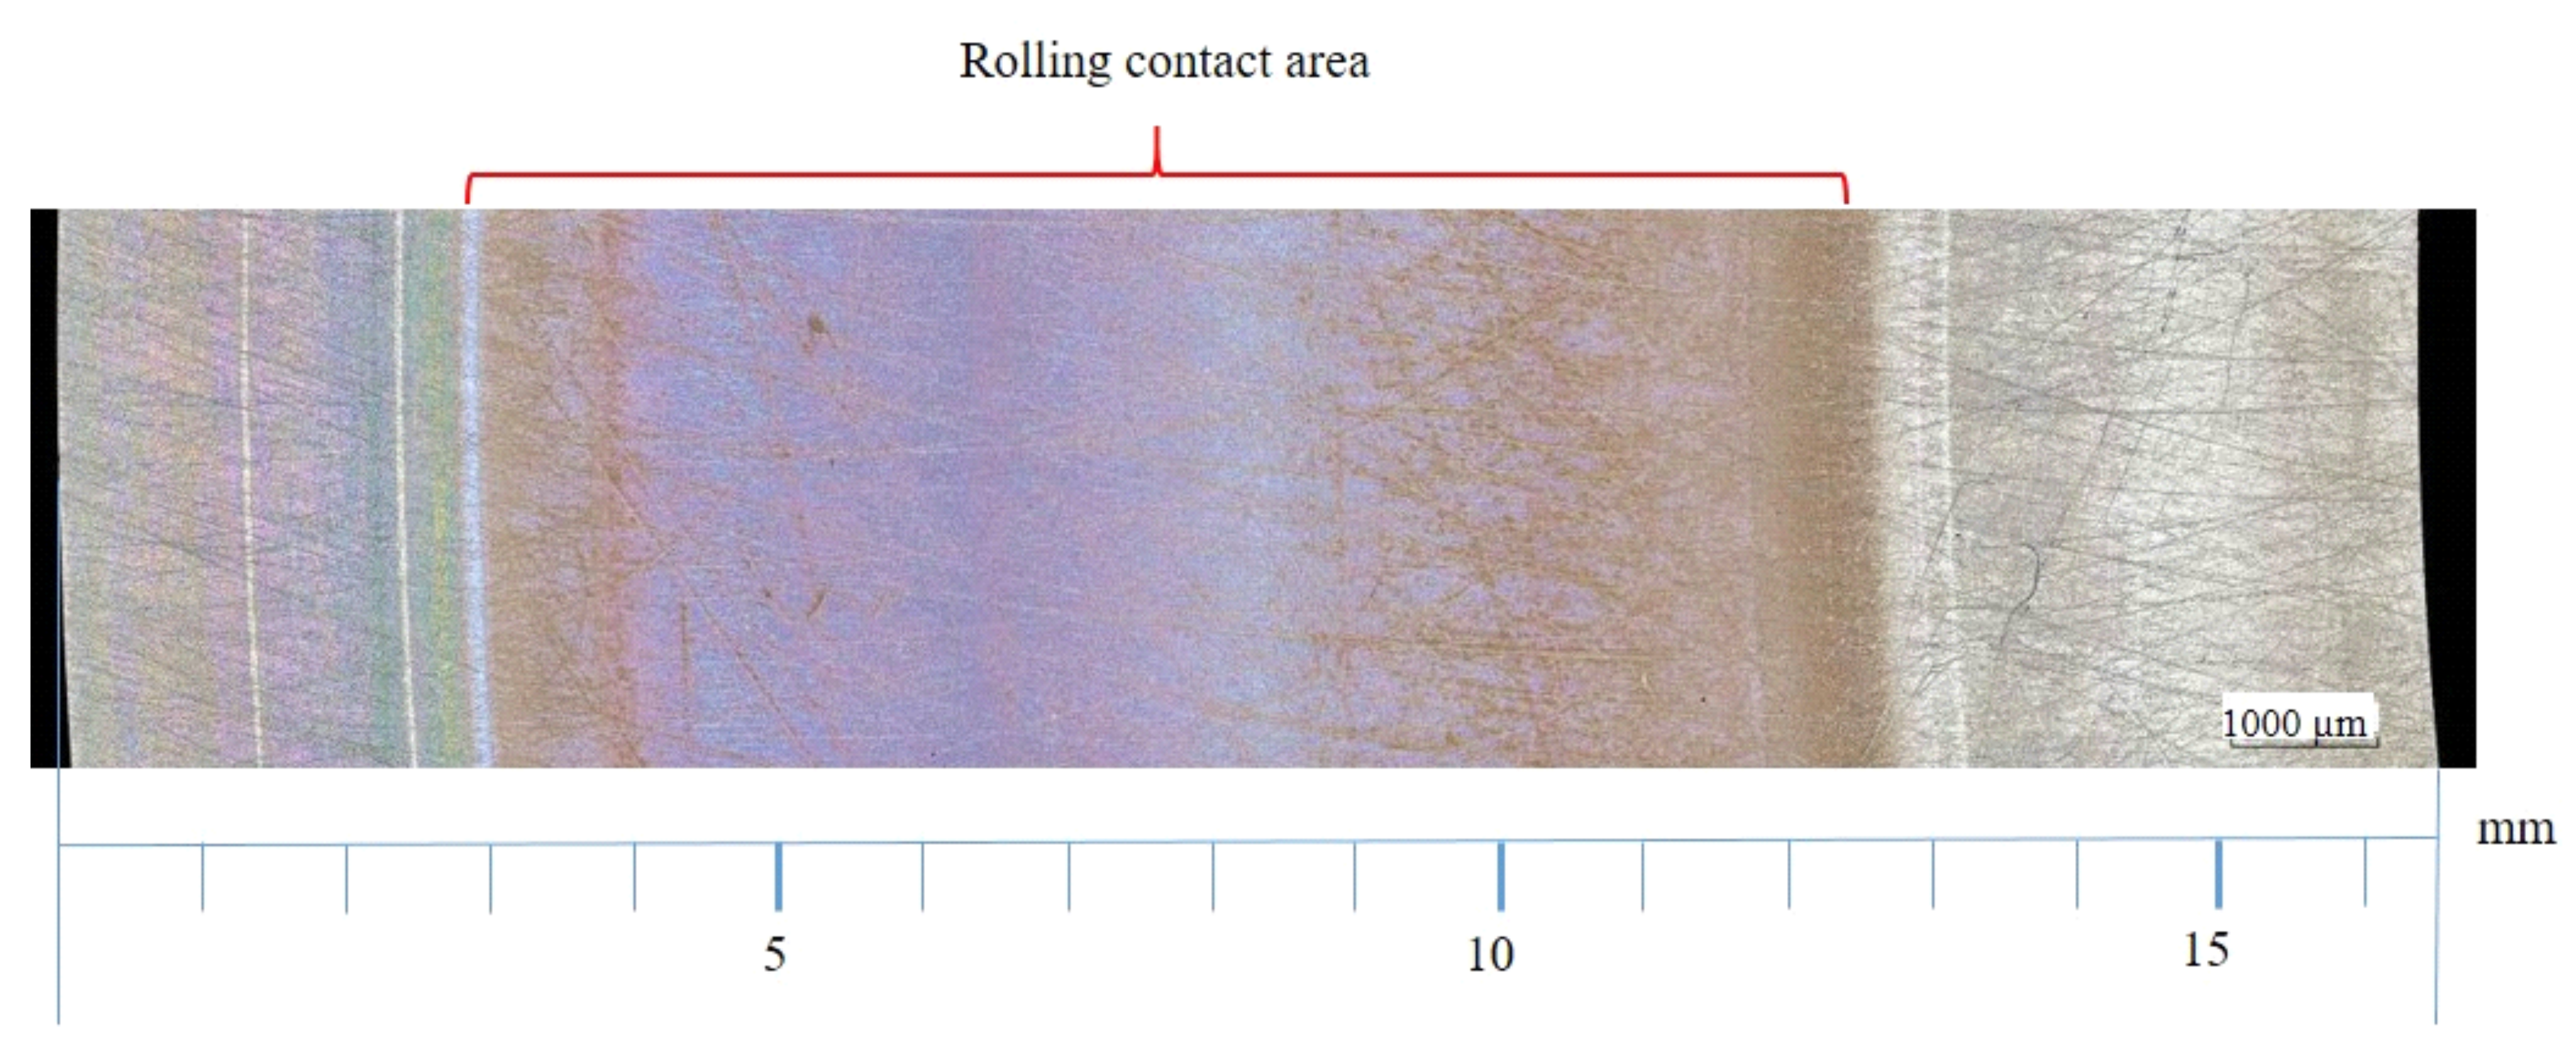
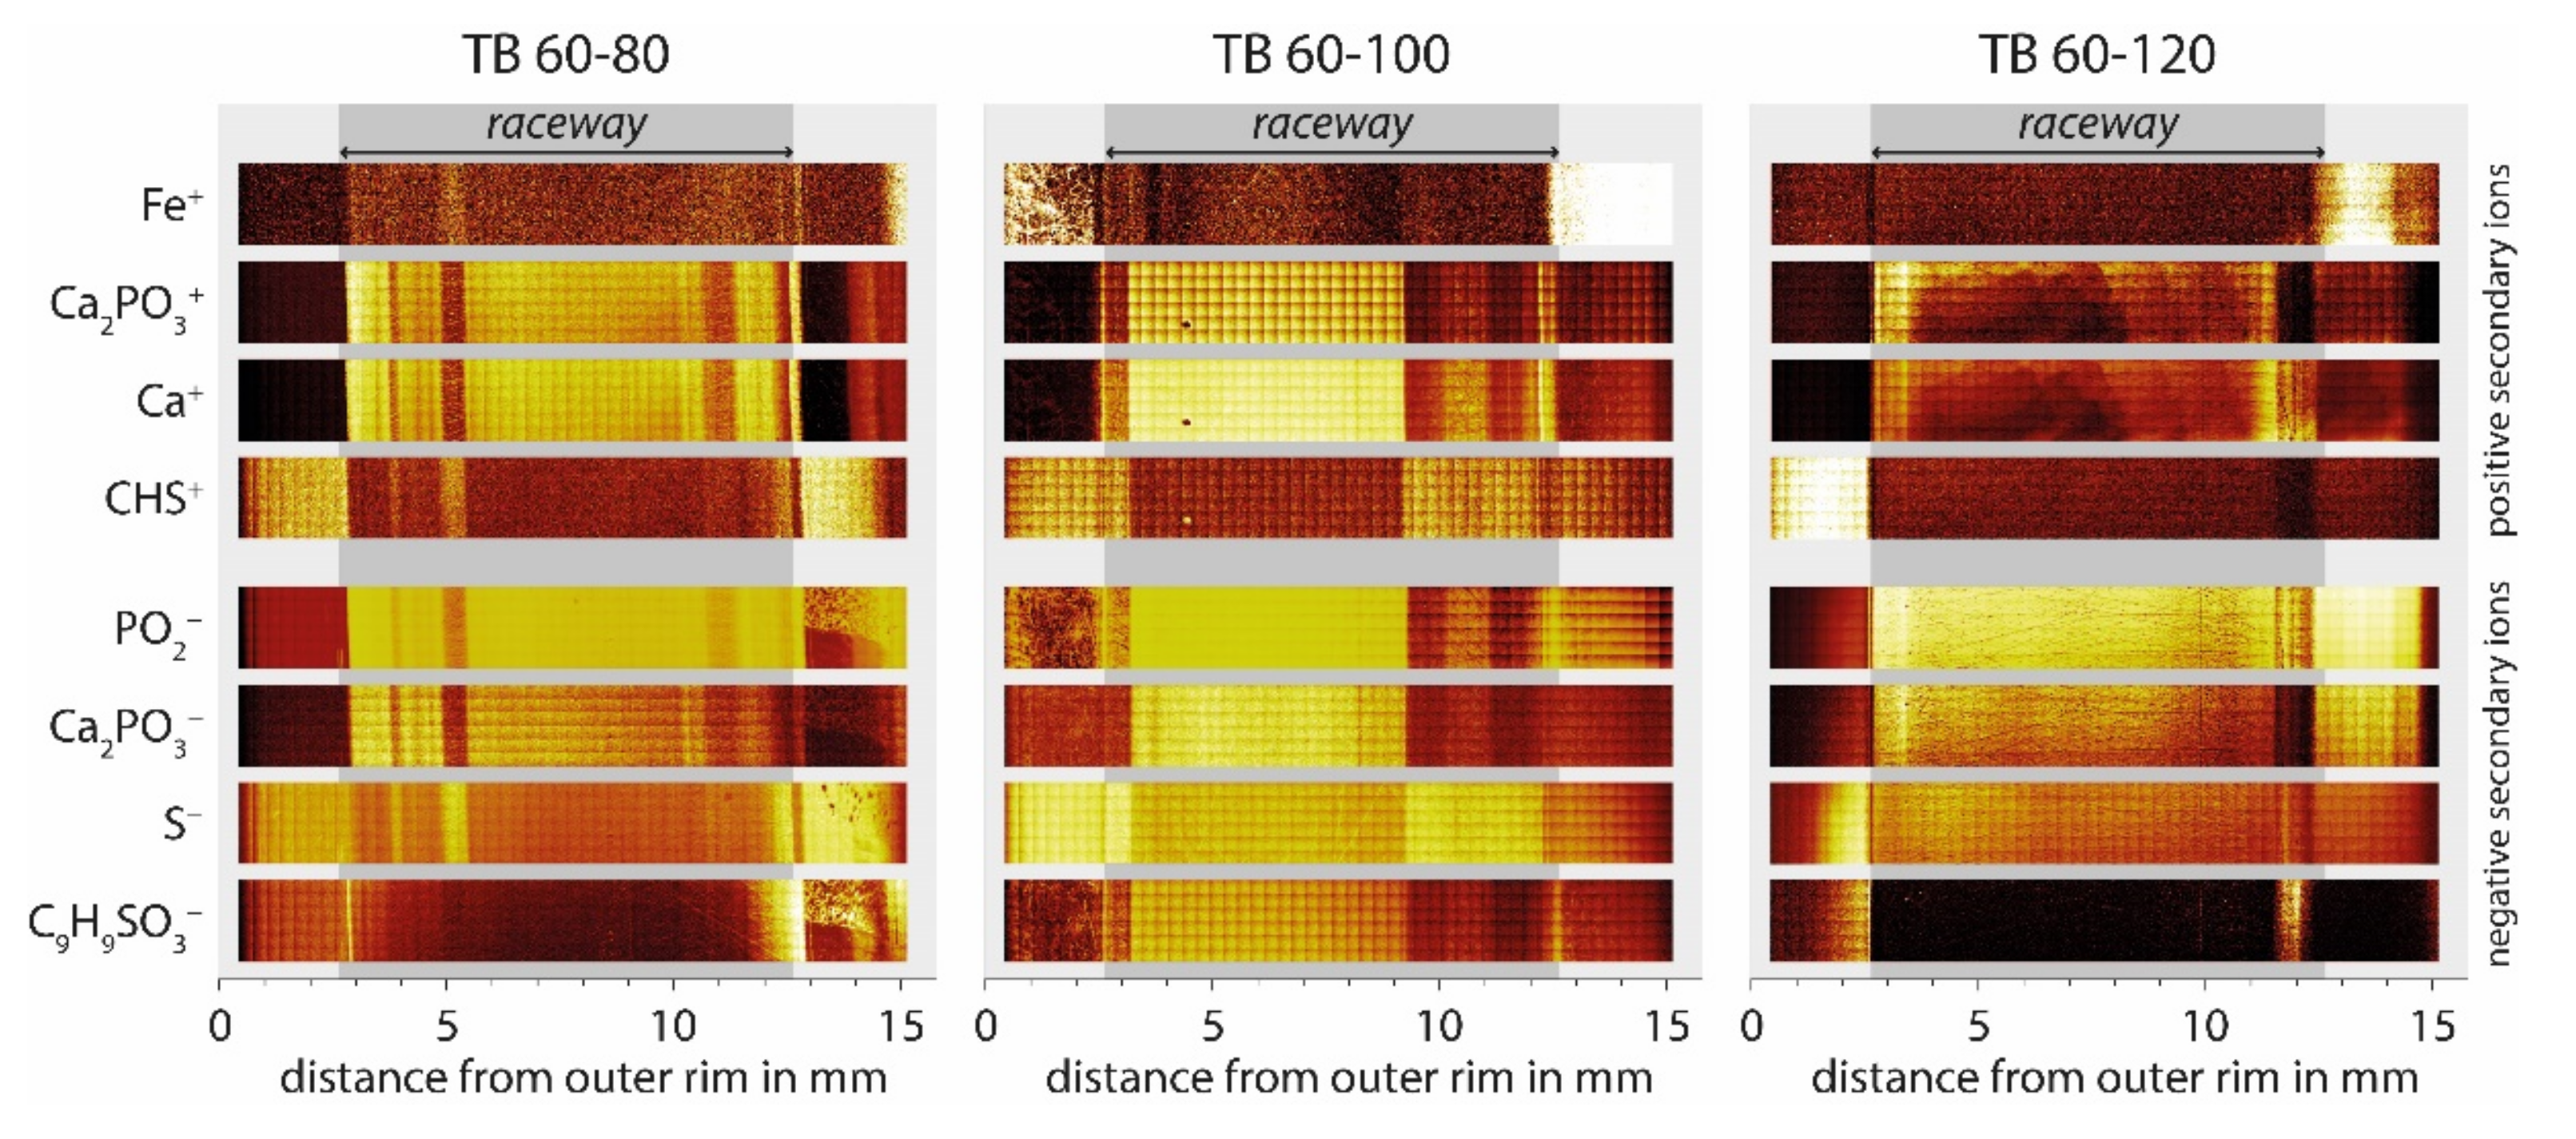
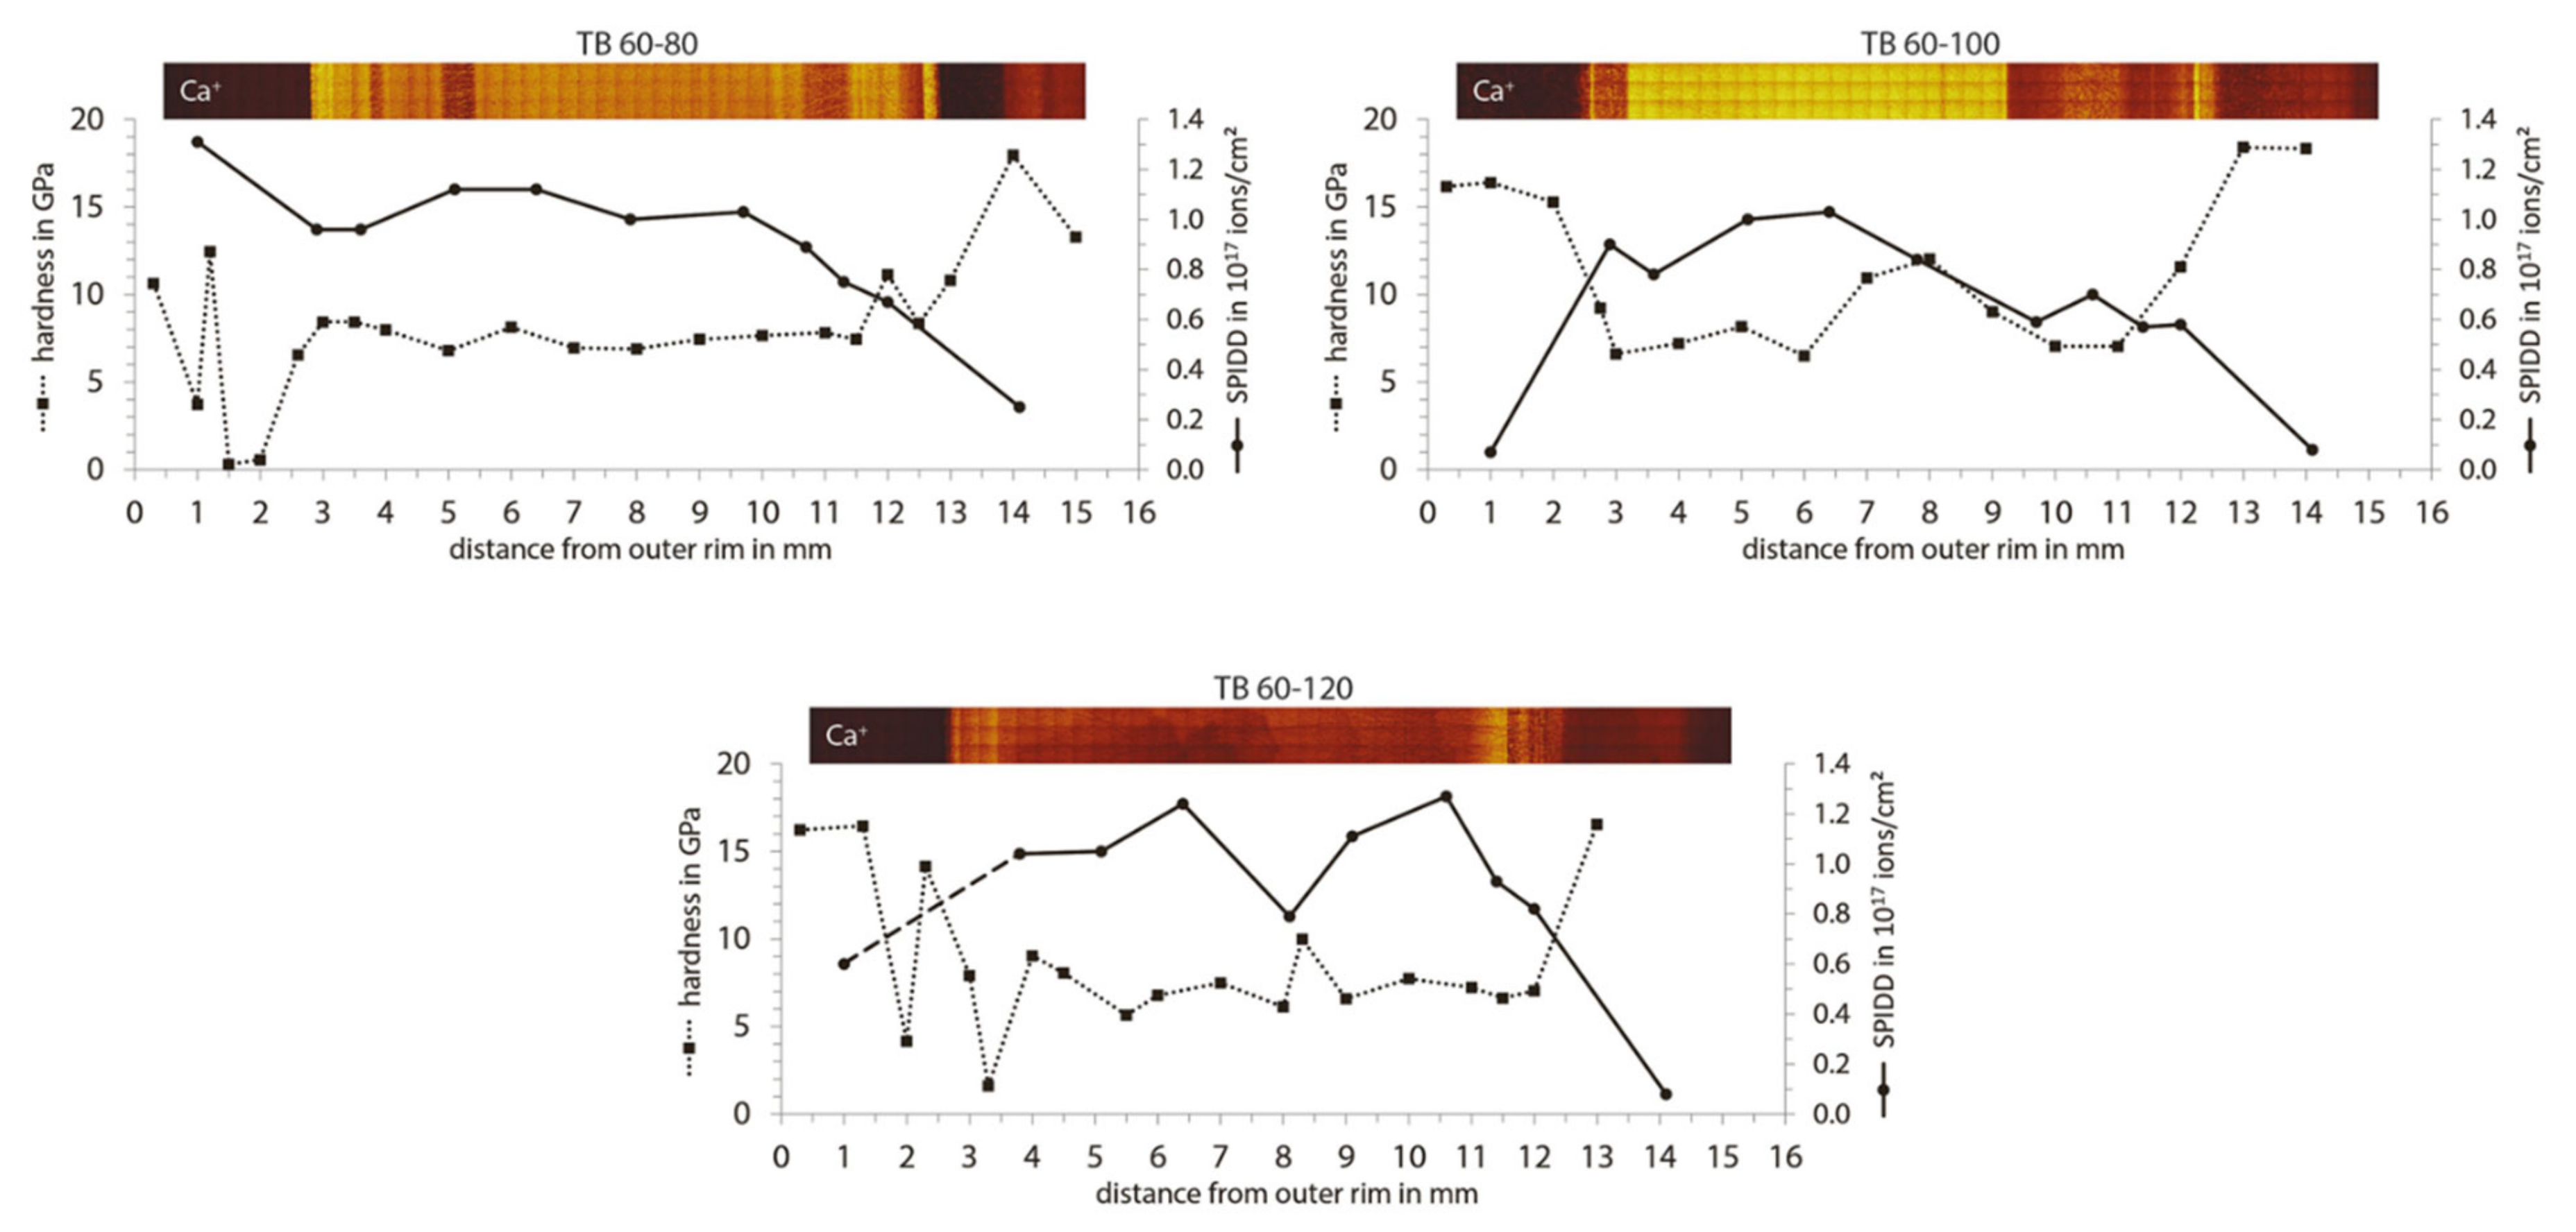
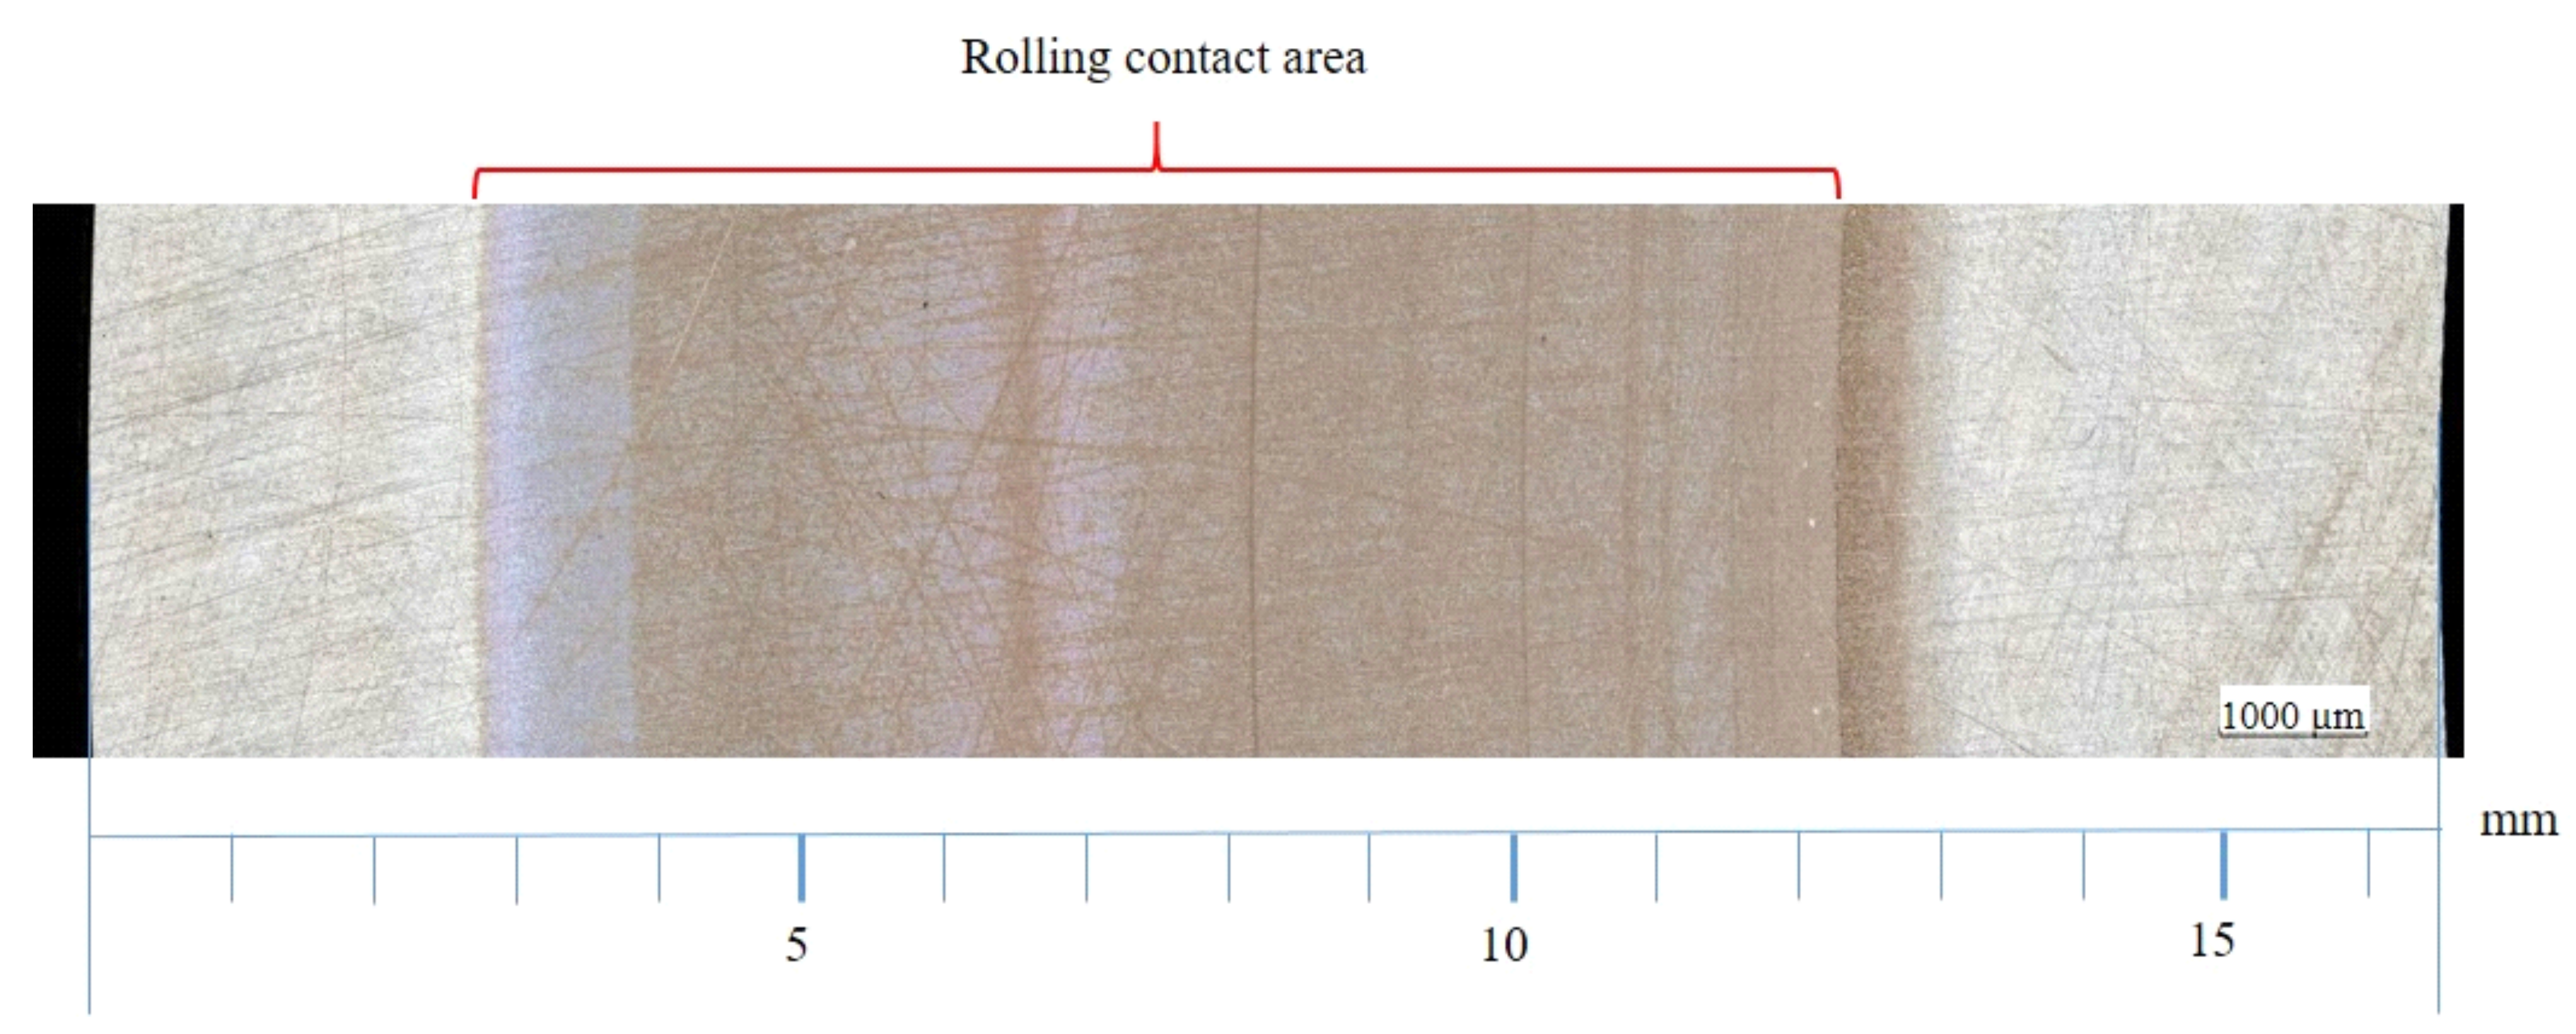
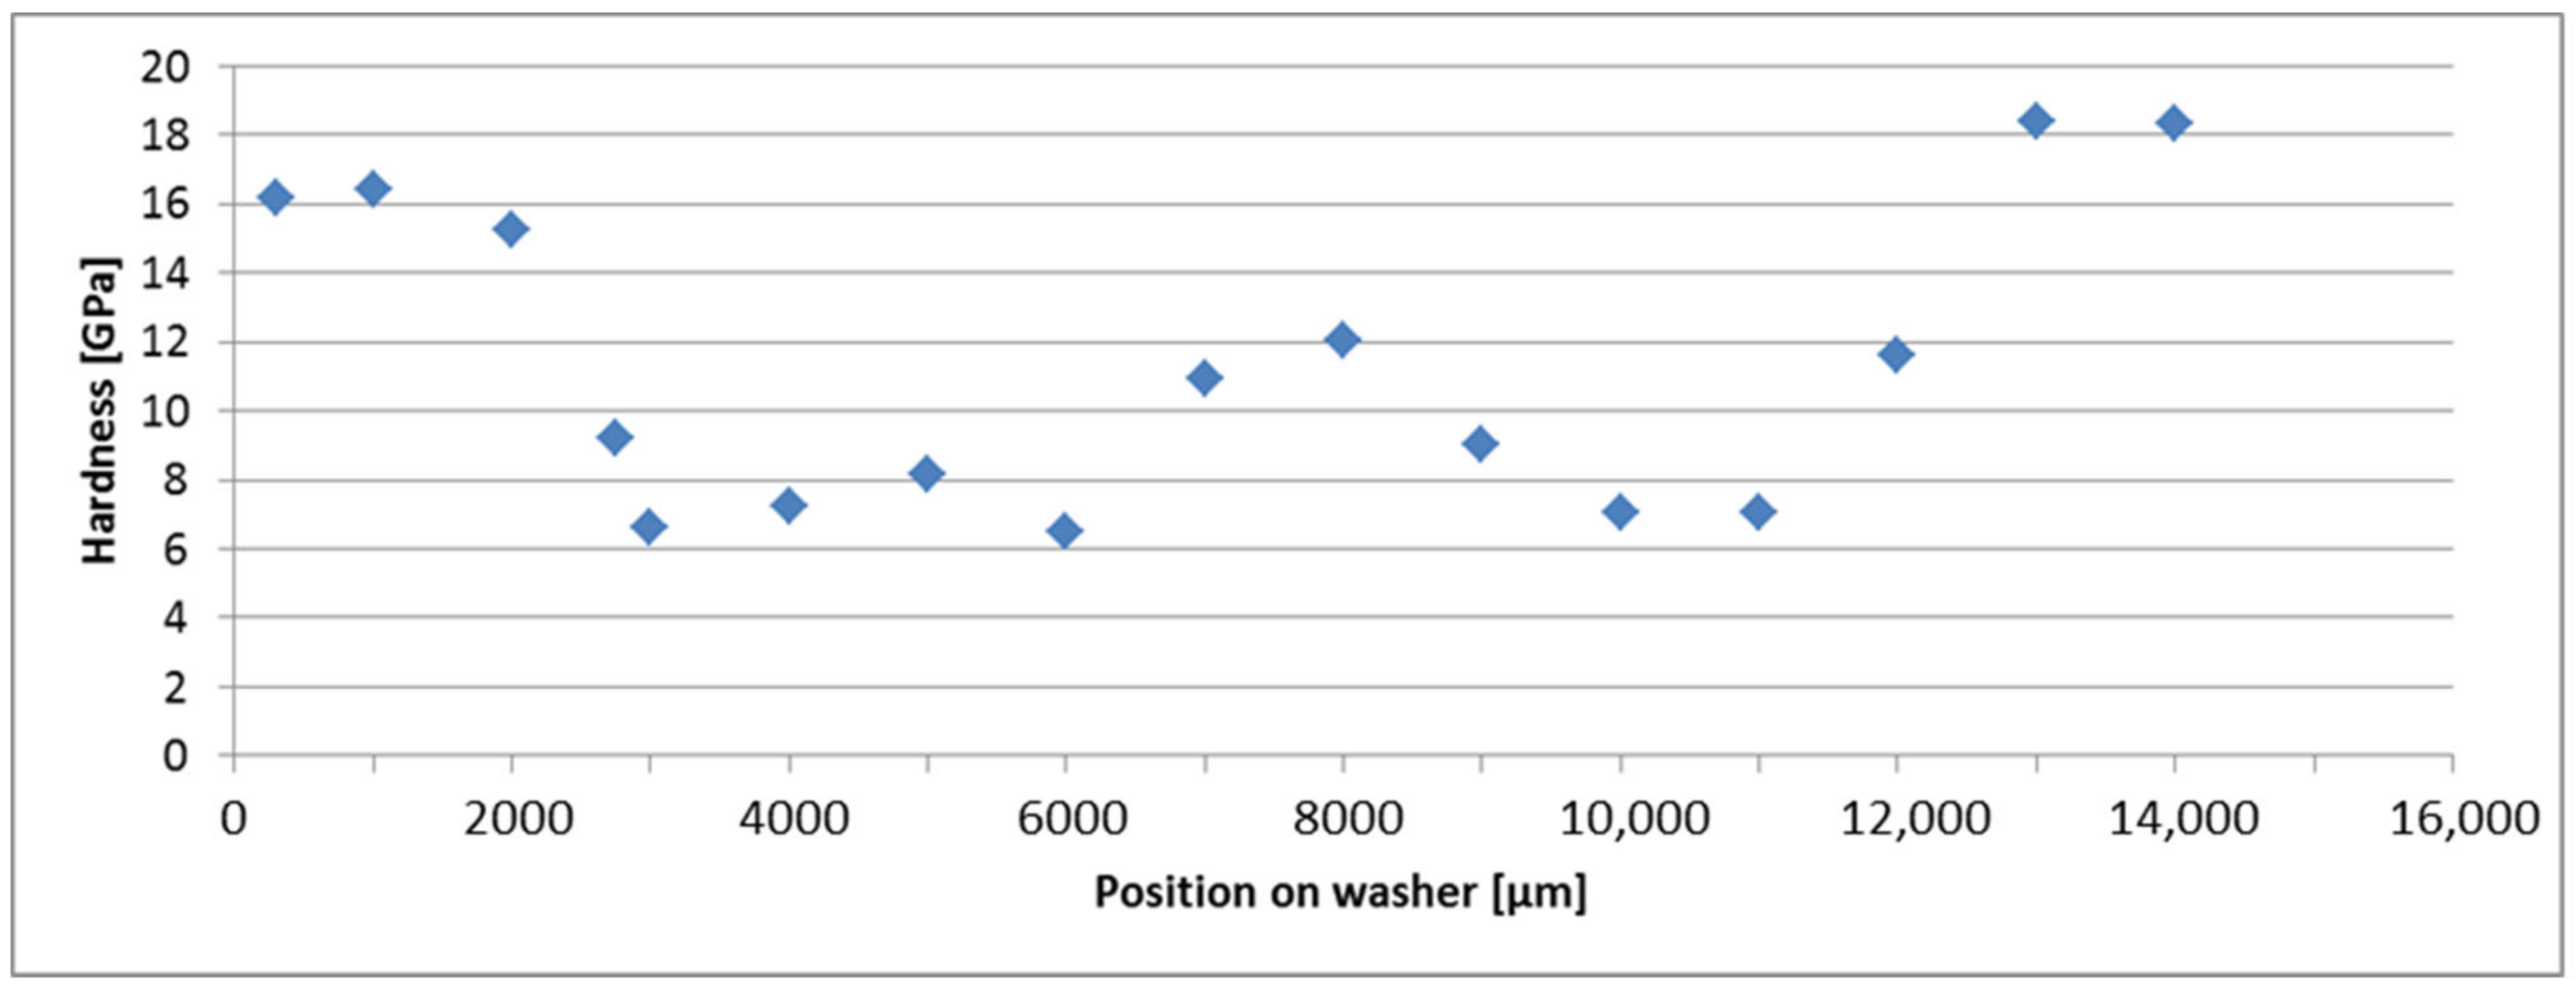
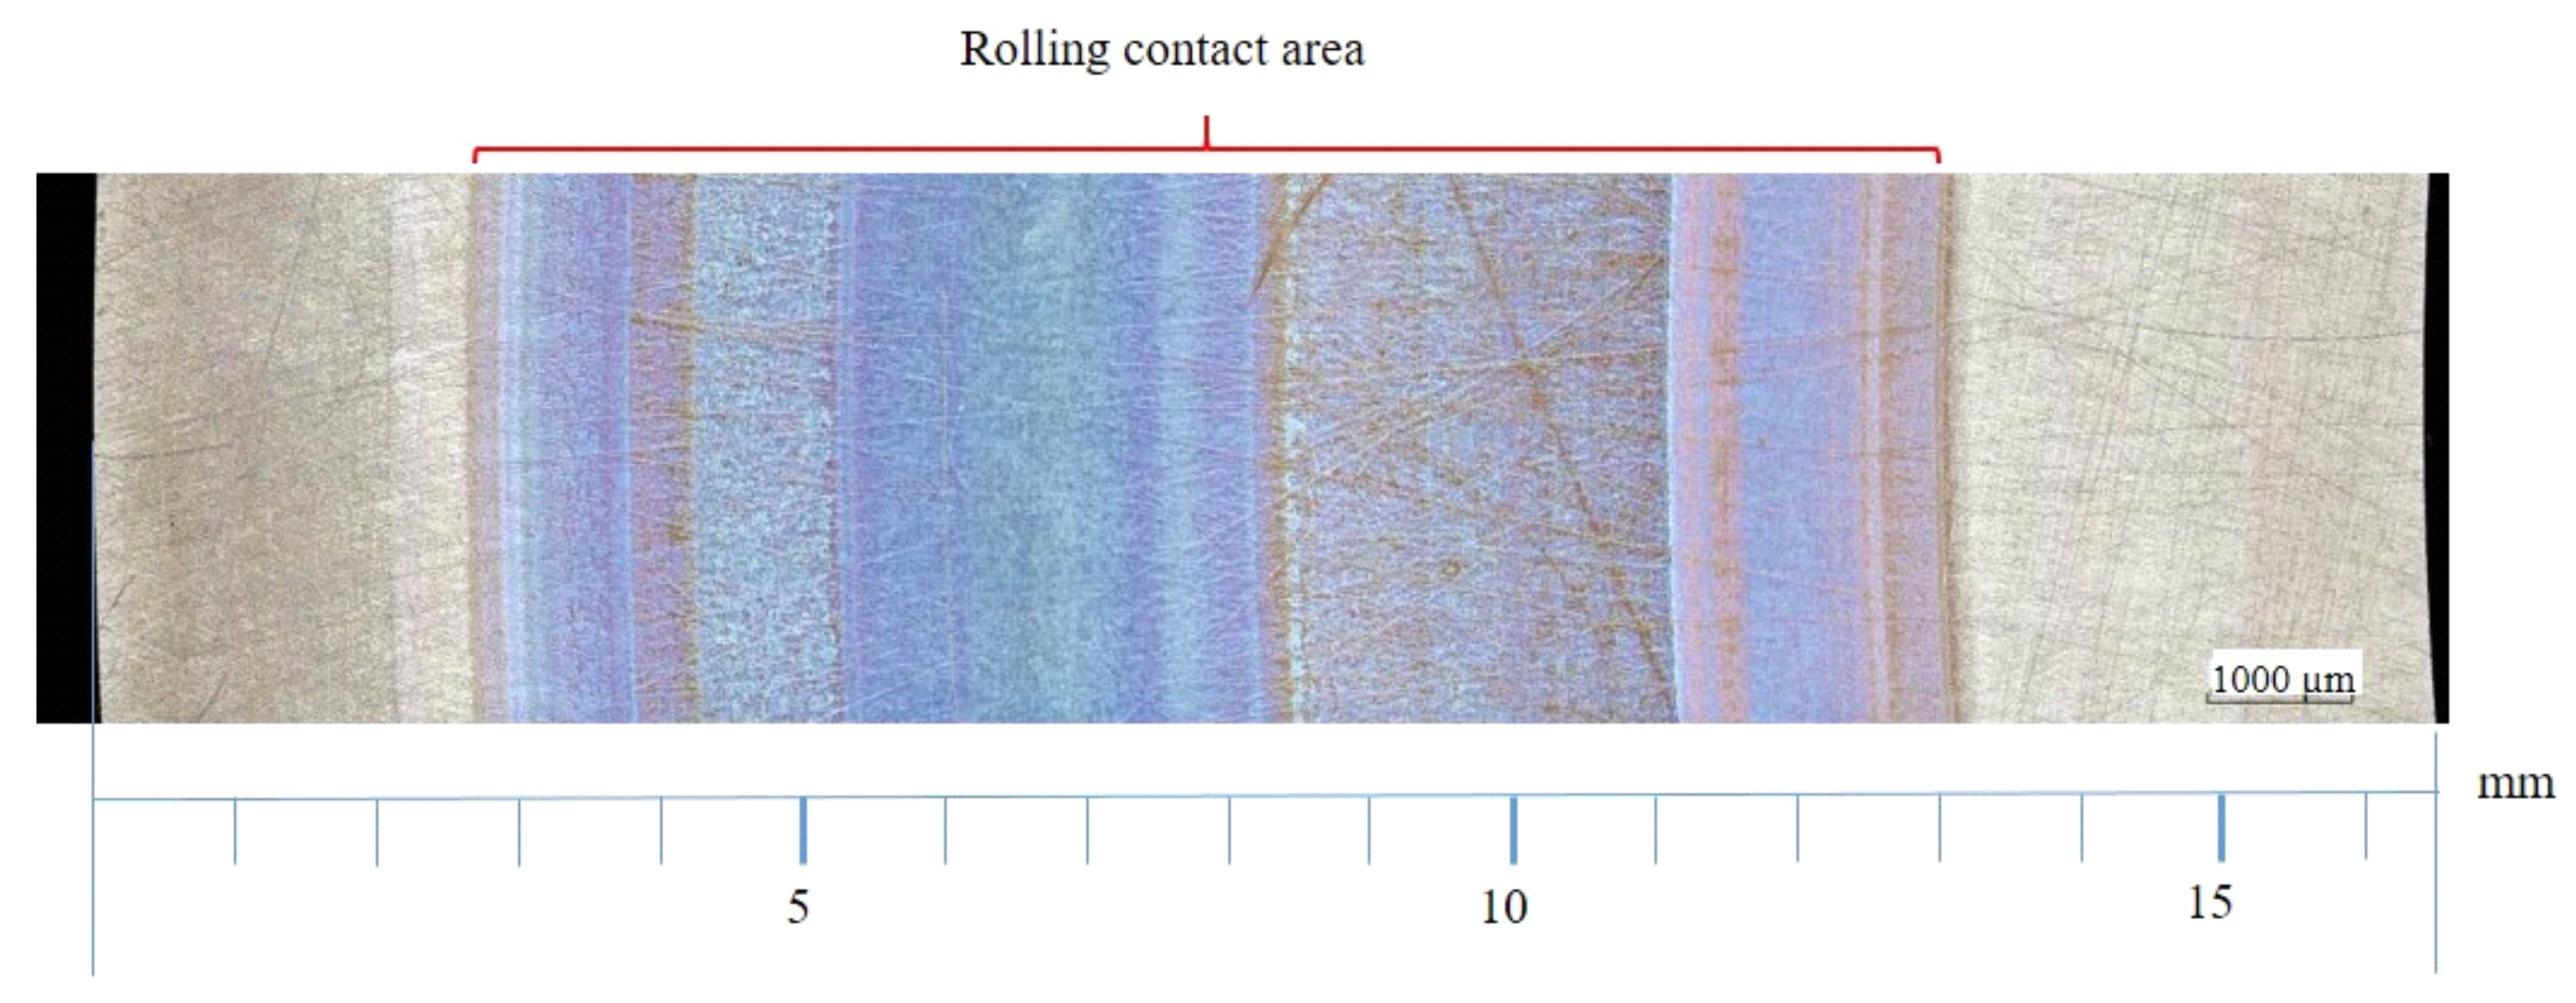
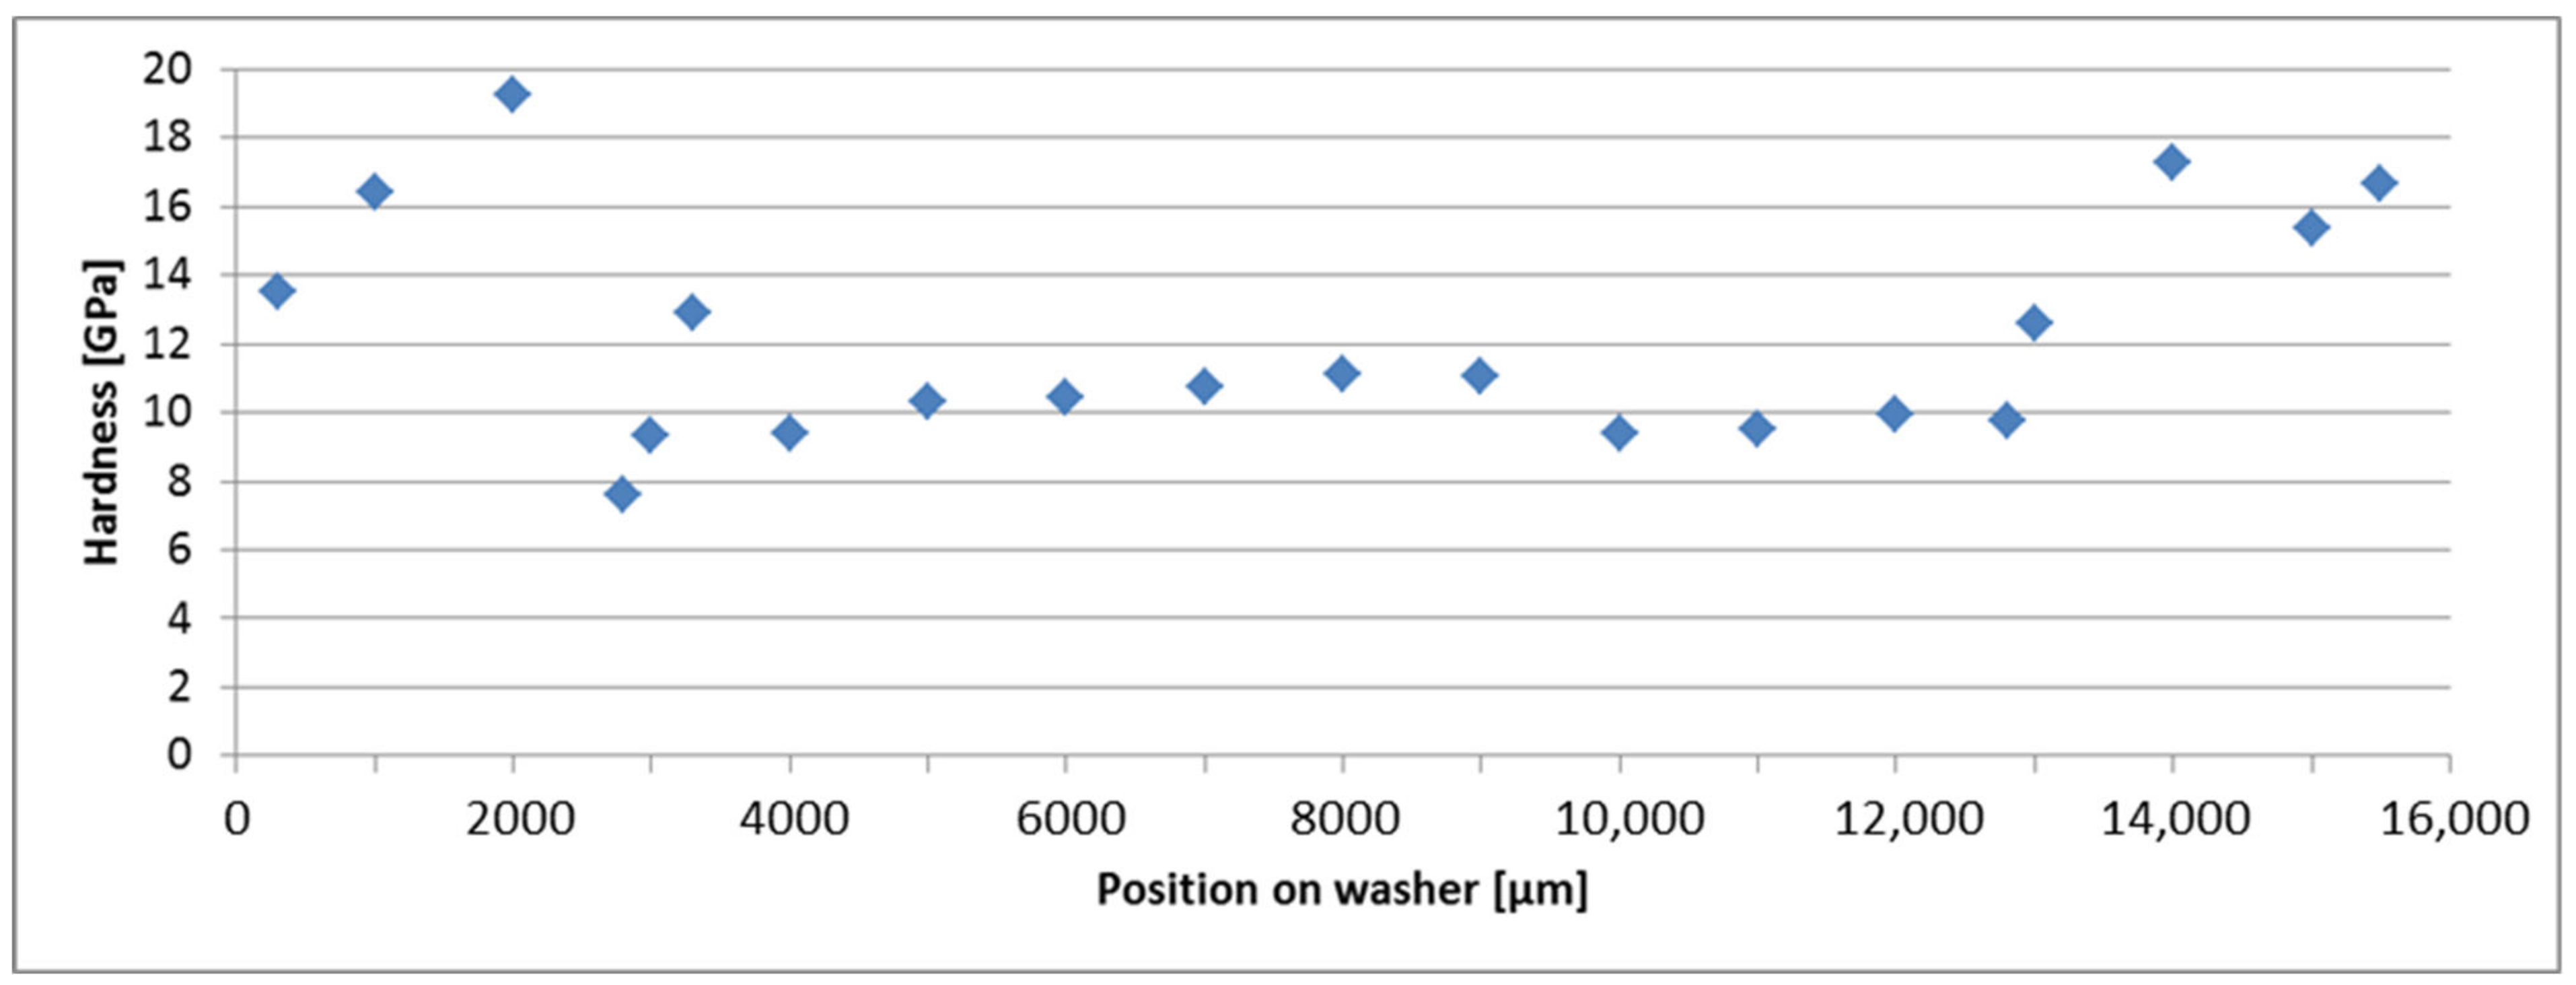
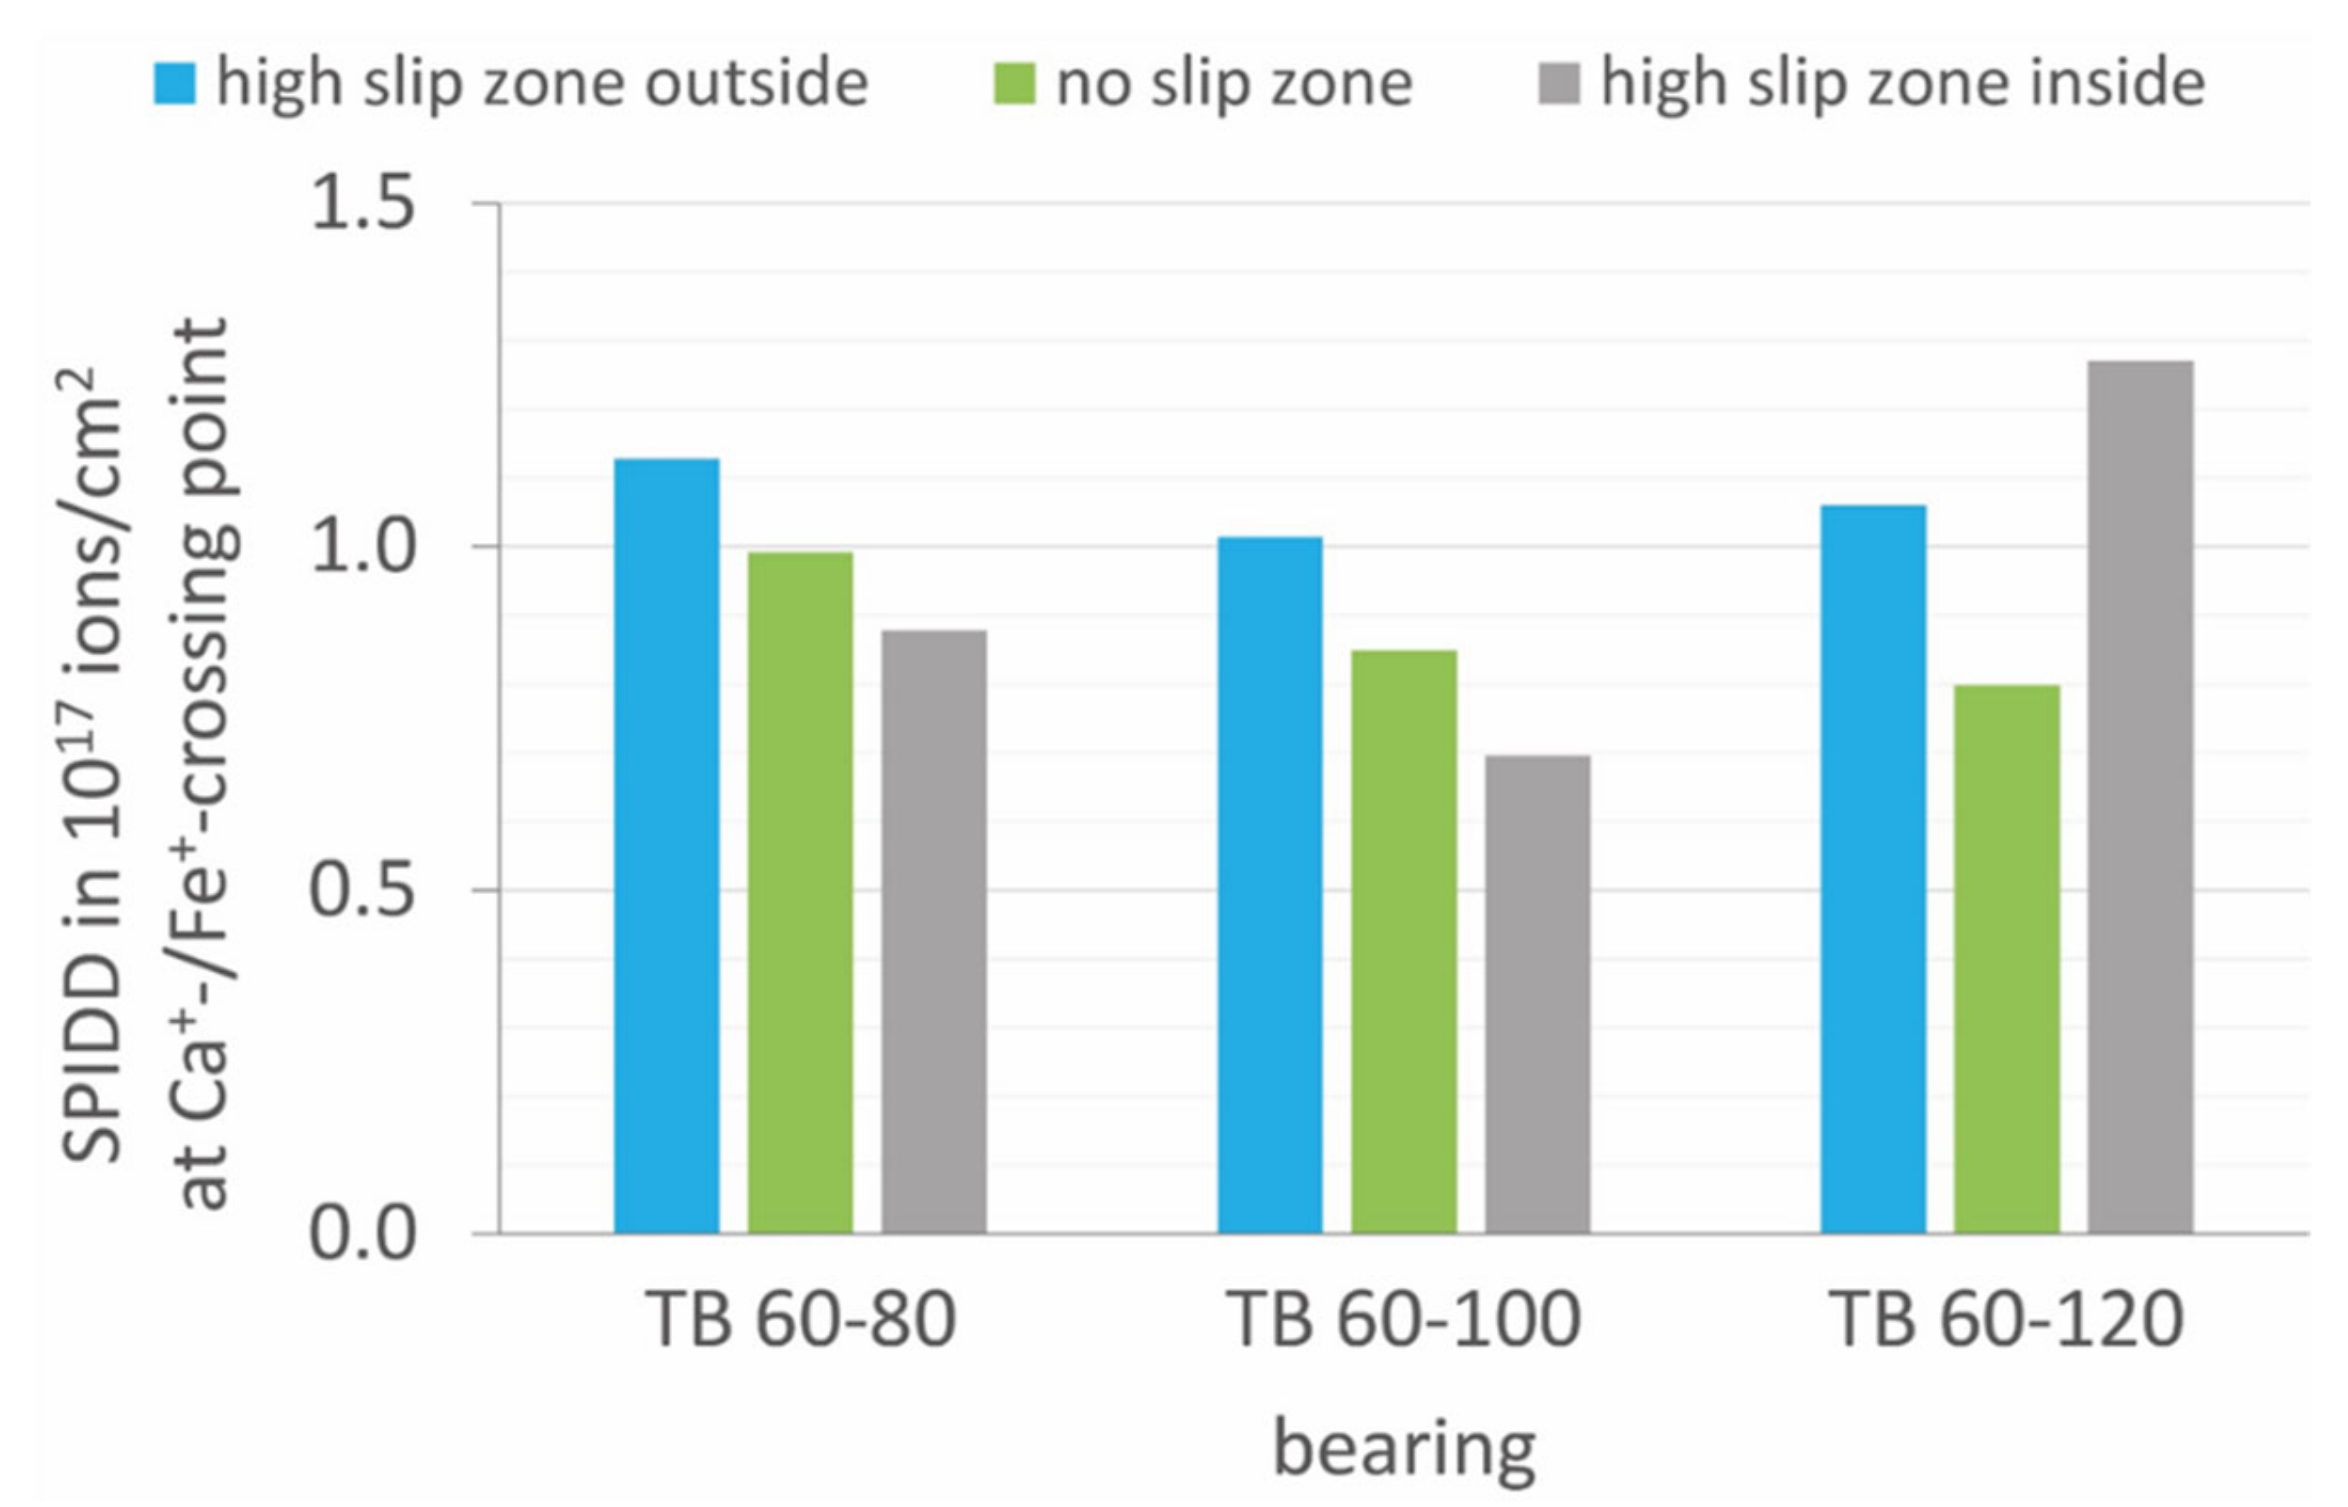
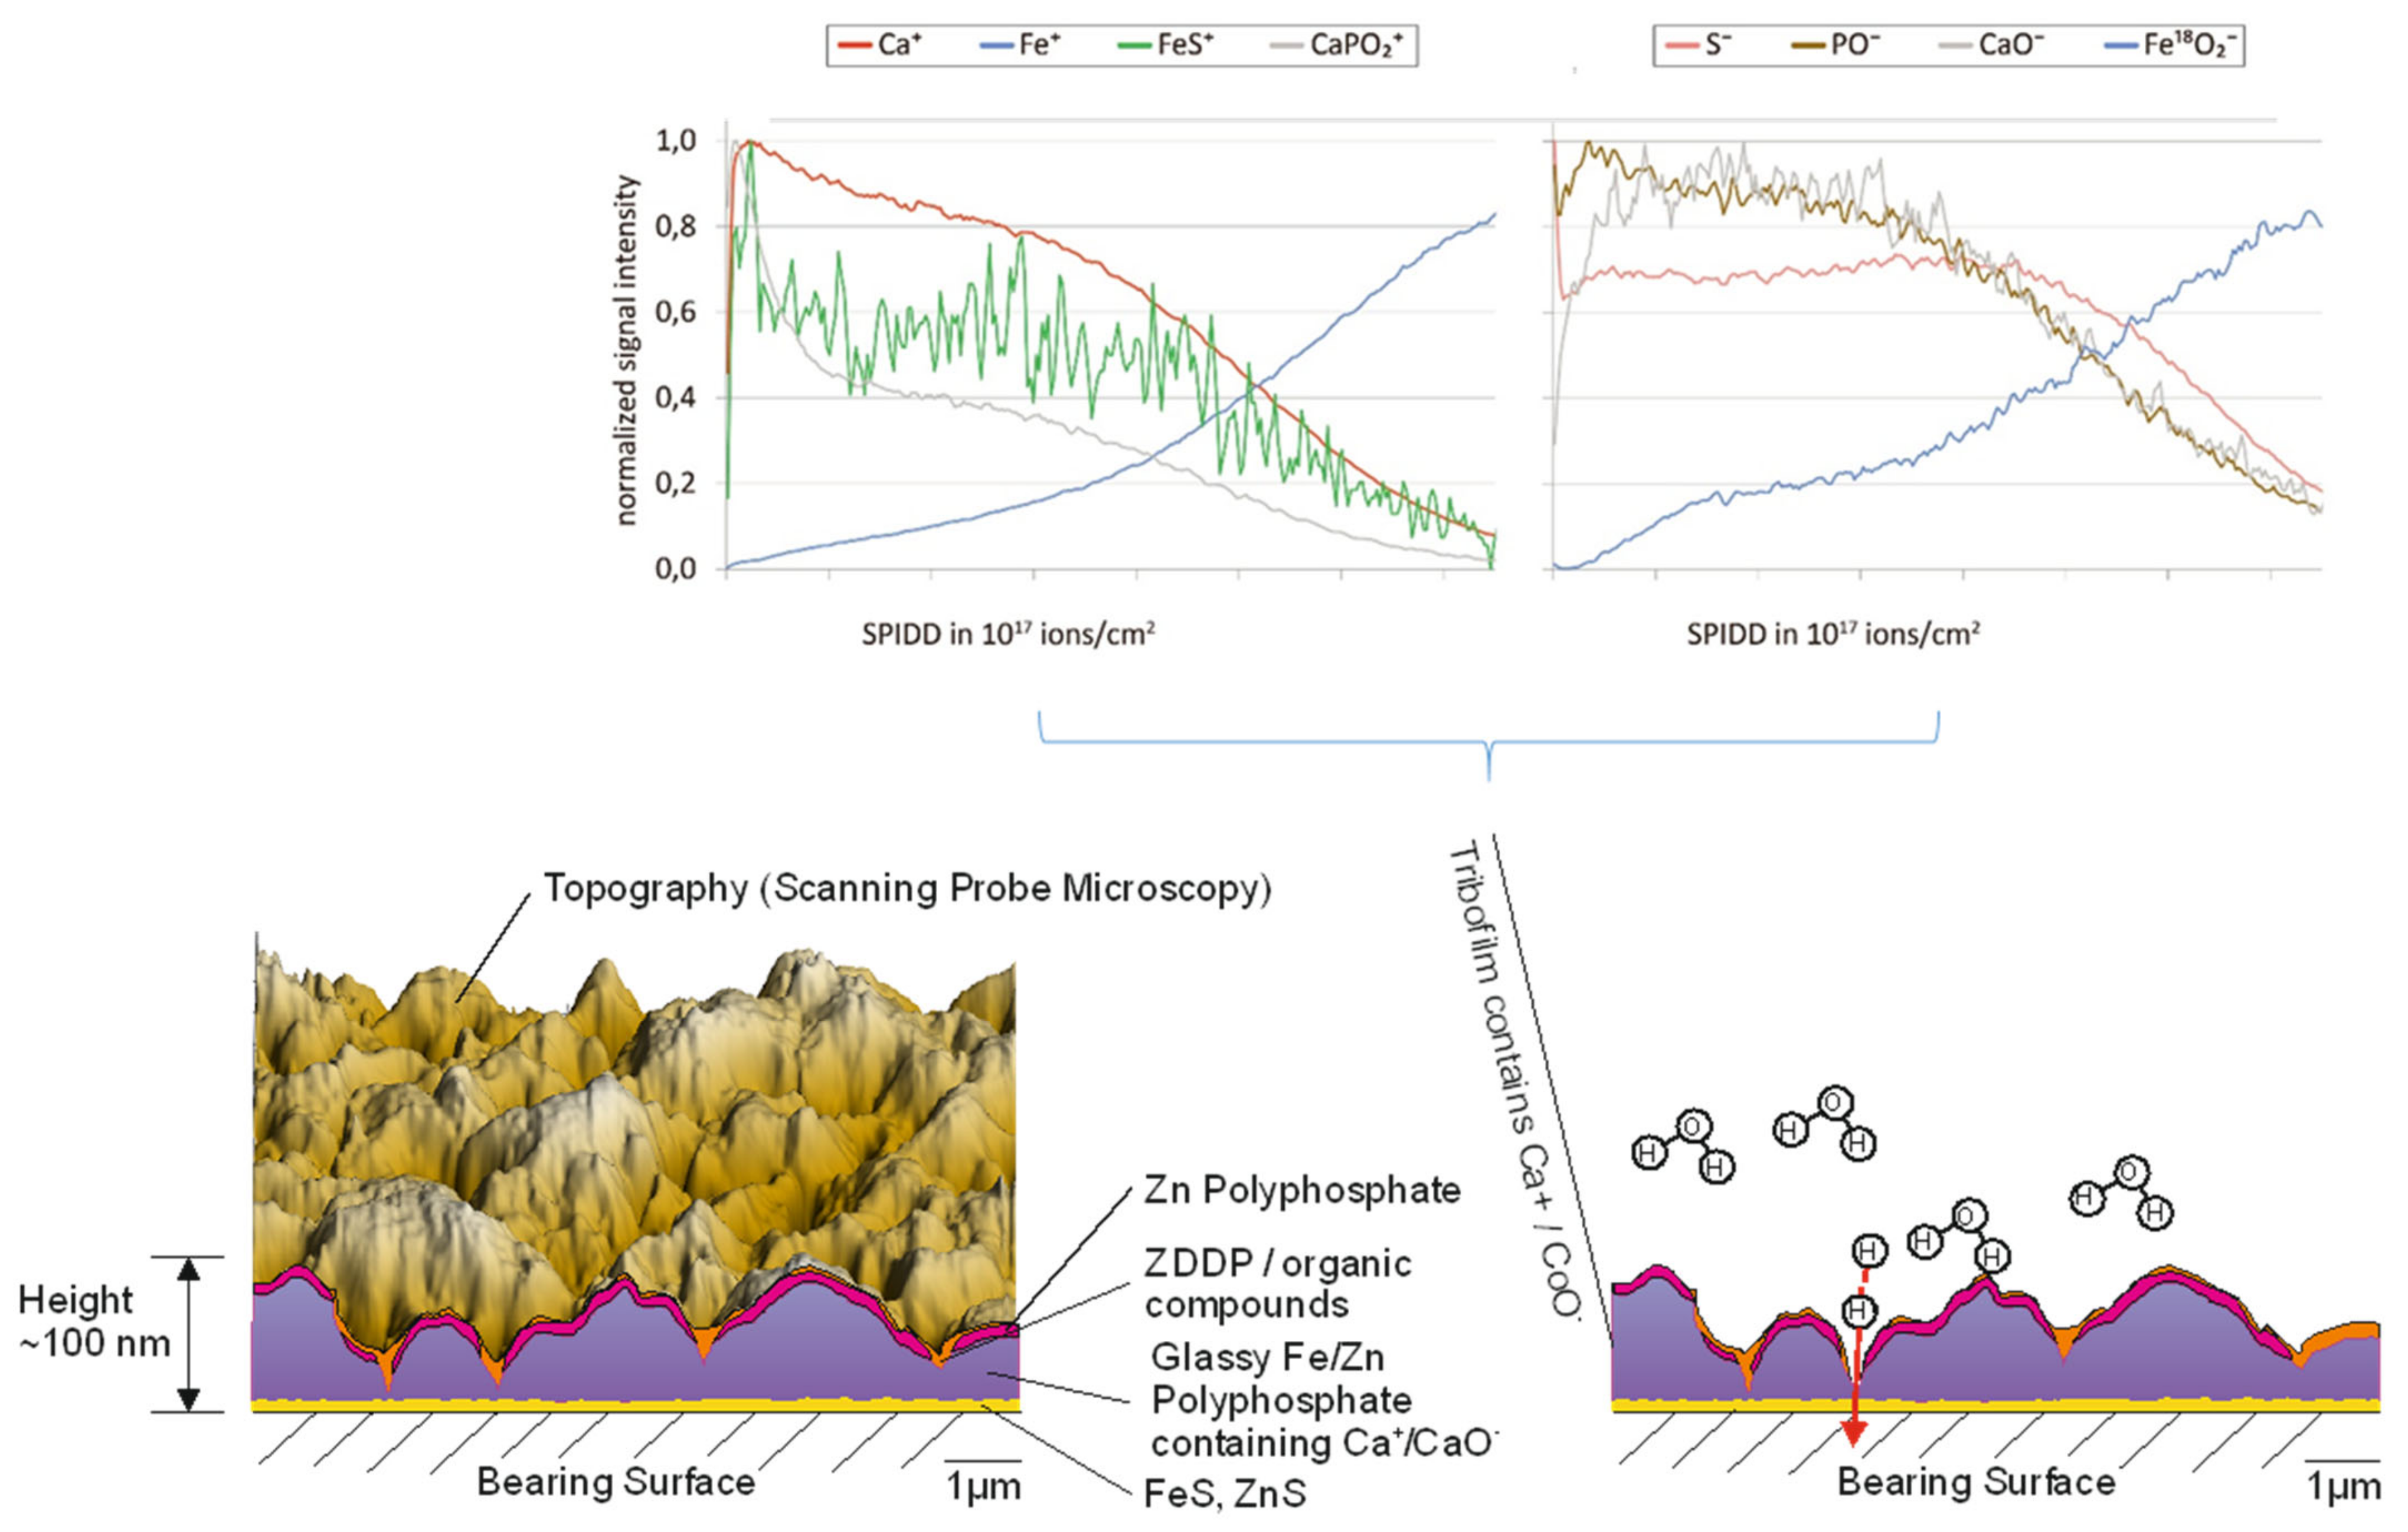
- To investigate differences in the chemical composition of the boundary layers, ToF-SIMS (Time-of-Flight Secondary Ion Mass Spectrometry) was performed on the bearing surfaces. For the bearing running at 120 °C, large area mappings show a more or less uniform distribution of secondary ion signals inside the rolling contact area. In contrast, with both bearings run at lower temperatures, several secondary ion signals show inhomogeneous distributions inside the raceway much more pronounced for the bearing, where a tendency for white etching cracks was observed. ToF-SIMS-depth profiles show non-uniform values for boundary layer thicknesses across the rolling contact areas of the bearing washers tested at 60 kN with some correlations with respect to local values of hardness from nanoindentation. The reduced values of hardness can be explained by increased layer thicknesses of non-metallic layers. The thickness of these layers is estimated to be a few 10 nm. The intensity of Ca+ signals for the bearing TB 60-100 (failed due to WEC) is increased. On the outer high slip zone, the SPIDD-values needed to reach the Ca+-/Fe+-crossing is highest, which is also the zone of subsurface WEC found by ultrasonic studies (Figure 3b). It has to be remarked that calcium, in combination with water molecules, promotes hydrogen formation; this effect can be assisted by the increase in temperature in the tribological contact. Thus, the higher calcium amount can lead to increased WEC formation.
Funding
Data Availability Statement
Acknowledgments
Conflicts of Interest
References
- Gould, B.; Greco, A. Investigating the Process of White Etching Crack Initiation in Bearing Steel. Tribol. Lett. 2016, 62, 26. [Google Scholar] [CrossRef]
- Gould, B.; Greco, A.; Stadler, K.; Xiao, X. An analysis of premature cracking associated with microstructural alterations in an AISI 52100 failed wind turbine bearing using X-ray tomography. Mater. Des. 2017, 117, 417–429. [Google Scholar] [CrossRef] [Green Version]
- Ooi, S.; Gola, A.; Vegter, R.H.; Yan, P.; Stadler, K. Evolution of white-etching cracks and associated microstructural alterations during bearing tests. Mater. Sci. Technol. 2017, 33, 1657–1666. [Google Scholar] [CrossRef]
- Evans, M.-H. An updated review: White etching cracks (WECs) and axial cracks in wind turbine gearbox bearings. Mater. Sci. Technol. 2016, 32, 1133–1169. [Google Scholar] [CrossRef]
- Phorer, B. Analyse des Zusammenhangs zwischen dem tribochemischen Aufbau von Grenzschichten und der Ausbildung von White Etching Crack Schäden. Ph.D. Thesis, Friedrich-Alexander-Universität Erlangen-Nürnberg, Nürnberg, Germany, 2022. [Google Scholar]
- Ruellan, A.; Kleber, X.; Ville, F.; Cavoret, J.; Liatard, B. Understanding white etching cracks in rolling element bearings: Formation mechanisms and influent tribochemical drivers. Proc. Inst. Mech. Eng. Part J J. Eng. Tribol. 2015, 229, 886–901. [Google Scholar] [CrossRef]
- Zhang, J.; Spikes, H. On the Mechanism of ZDDP Antiwear Film Formation. Tribol. Lett. 2016, 63, 24. [Google Scholar] [CrossRef] [Green Version]
- Tripaldi, G.; Vettor, A.; Spikes, H. Friction Behaviour of ZDDP Films in the Mixed, Boundary/EHD Regime. SAE Trans. 1996, 105, 1819–1830. [Google Scholar] [CrossRef]
- Gosvami, N.N.; Bares, J.A.; Mangolini, F.; Konicek, A.R.; Yablon, D.G.; Carpick, R.W. Mechanisms of antiwear tribofilm growth revealed in situ by single-asperity sliding contacts. Science 2015, 348, 102–106. [Google Scholar] [CrossRef] [Green Version]
- Benedet, J.; Green, J.H.; Lamb, G.D.; Spikes, H.A. Spurious Mild Wear Measurement Using White Light Interference Microscopy in the Presence of Antiwear Films. Tribol. Trans. 2009, 52, 841–846. [Google Scholar] [CrossRef]
- Fujita, H.; Spikes, H.A. The formation of zinc dithiophosphate antiwear films. Proc. Inst. Mech. Eng. Part J J. Eng. Tribol. 2004, 218, 265–278. [Google Scholar] [CrossRef]
- Mosey, N.; Woo, T.; Kasrai, M.; Norton, P.; Bancroft, G.; Müser, M. Interpretation of experiments on ZDDP anti-wear films through pressure-induced cross-linking. Tribol. Lett. 2006, 24, 105–114. [Google Scholar] [CrossRef]
- Dorgham, A.; Azam, A.; Morina, A.; Neville, A. On the Transient Decomposition and Reaction Kinetics of Zinc Dialkyldithiophosphate. ACS Appl. Mater. Interfaces 2018, 10, 44803–44814. [Google Scholar] [CrossRef] [PubMed]
- Sharma, V.; Erdemir, A.; Aswath, P. An analytical study of tribofilms generated by the interaction of ashless antiwear additives with ZDDP using XANES and nano-indentation. Tribol. Int. 2015, 82, 43–57. [Google Scholar] [CrossRef] [Green Version]
- Tang, H.; Wang, L.-P.; Gui, J.; Kuo, D. Experimental and analytical studies of dynamic friction at the head/disk interface. Tribol. Int. 2000, 33, 343–351. [Google Scholar] [CrossRef]
- Bhushan, B. Adhesion and stiction: Mechanisms, measurement techniques, and methods for reduction. J. Vac. Sci. Technol. B Microelectron. Nanometer Struct. Process. Meas. Phenom. 2003, 21, 2262–2296. [Google Scholar] [CrossRef] [Green Version]
- Fu, T.C.; Suzuki, S. Low stiction/low glide height head–disk interface for high-performance disk drives. J. Appl. Phys. 1999, 85, 5600–5605. [Google Scholar] [CrossRef]
- Tohyama, M.; Ohmori, T.; Murase, A.; Masuko, M. Friction reducing effect of multiply adsorptive organic polymer. Tribol. Int. 2009, 42, 926–933. [Google Scholar] [CrossRef]
- Wiendl, S.; Zabel, W.-R.; Poll, G.; Gatzen, H.-H. The Influence of boundary layer properties on grease lubricated high-speed ball bearing performance. Tribol. Ser. 2003, 43, 441–447. [Google Scholar] [CrossRef]
- Gatzen, M.; Pape, F.; Bruening, C.; Gatzen, H.; Arlinghaus, H.; Poll, G. Correlation between performance and boundary layers in high speed bearings lubricated with polymer-enhanced greases. Tribol. Int. 2010, 43, 981–989. [Google Scholar] [CrossRef]
- Oliver, W.C.; Pharr, G.M. An improved technique for determining hardness and elastic modulus using load and displacement sensing indentation experiments. J. Mater. Res. 1992, 7, 1564–1583. [Google Scholar] [CrossRef]
- Pape, F. Mikrotribologische Untersuchungen an Wälzlagern mit polymeradditivierter Fettschmierung (Microtribological Investigations of Roller Bearings Lubricated with Greases Containing Polymer Additives). Ph.D. Thesis, Leibniz University Hanover, Hanover, Germany, 2011. [Google Scholar]
- Pape, F.; Rissing, L.; Gatzen, H.H. Fabrication and Tribological Investigation of Fullerene C60/C70 Reinforced Epoxy Resin SU-8. Tribol. Und Schmier. 2011, 58, 51–55. [Google Scholar]
- Benninghoven, A.; Rudenauer, F.G.; Werner, H.W. Secondary Ion Mass Spectrometry: Basic Concepts, Instrumental Aspects, Applications and Trends; Chemical Analysis; Wiley: New York, NY, USA, 1987; Volume 86. [Google Scholar]
- Vickerman, J.C.; Briggs, D. (Eds.) ToF-SIMS: Materials Analysis by Mass Spectrometry, 2nd ed.; IM Publications: Chichester, UK, 2013. [Google Scholar]
- Arlinghaus, H.F. Static Secondary Ion Mass Spectrometry. In Surface and Thin Film Analysis, 2nd ed.; Bubert, H., Jenett, H., Eds.; Wiley-VCH: Weinheim, Germany, 2011. [Google Scholar]
- Minfray, C.; Martin, J.M.; De Barros, M.I.; Mogne, T.L.; Kersting, R.; Hagenhoff, B. Chemistry of ZDDP tribofilm by ToF-SIMS. Tribol. Lett. 2004, 17, 351–357. [Google Scholar] [CrossRef]
- Kubo, T.; Fujiwara, S.; Nanao, H.; Minami, I.; Mori, S. TOF-SIMS analysis of boundary films derived from calcium sulfonates. Tribol. Lett. 2006, 23, 171–176. [Google Scholar] [CrossRef]
- Murase, A.; Mori, H.; Ohmori, T. TOF-SIMS analysis of friction surfaces of hard coatings tested in engine oil. Appl. Surf. Sci. 2008, 255, 1494–1497. [Google Scholar] [CrossRef]
- Lipinsky, D.; Brüning, C.; Mayer, C.; Arlinghaus, H.F.; Skubacz, T.; Poll, G. Oberflächenanalyse der aus Additiven gebildeten tribologischen Schichten mit der Flugzeit-Sekundärionenmassenspektrometrie. Tribol. Schmier. 2011, 58, 29–35. [Google Scholar]
- Mayer, C.; Lipinsky, D.; Wohlleber, F.; Pflaum, H.; Stahl, K.; Arlinghaus, H.F. Coordinated test-rig and ToF-SIMS experiments to investigate the influence of phosphate glass layers on the friction behavior of a wet clutch. Surf. Interface Anal. 2014, 46, 401–404. [Google Scholar] [CrossRef]
- Muhmann, C. Untersuchung der unter tribologischer Belastung auf Laufflächen von Axial-Zylinderrollenlagern gebildeten Grenzschichten mittels ToF-SIMS und Nanoindentation. Ph.D. Thesis, Westfälische Wilhelms-Universität Münster, Münster, Germany, 2018. [Google Scholar]
- Pape, F.; Poll, G.; Mallach, D.; Lipinsky, D.; Arlinghaus, H.F.; Matthias, T.; Behrens, B.A. Investigations of ZDDP tribofilm formation regarding temperature influences. In Proceedings of the Bearing World Conference, Online, 19–23 October 2020. [Google Scholar]
- Topolovec-Miklozic, K.; Forbus, T.R.; Spikes, H.A. Film thickness and roughness of ZDDP antiwear films. Tribol. Lett. 2007, 26, 161–171. [Google Scholar] [CrossRef]
- Loos, J.; Kruhoeffer, W. Einfluss der Reibbeanspruchung auf die WEC-Bildung in Wälzlagern. Tribol. Schmier. 2014, 62, 33–43. [Google Scholar]


| Axial Bearing Washer | Temperature (°C) | Axial Load (kN) | Test Length (h:min) | Average Frictional Torque (Nm) |
|---|---|---|---|---|
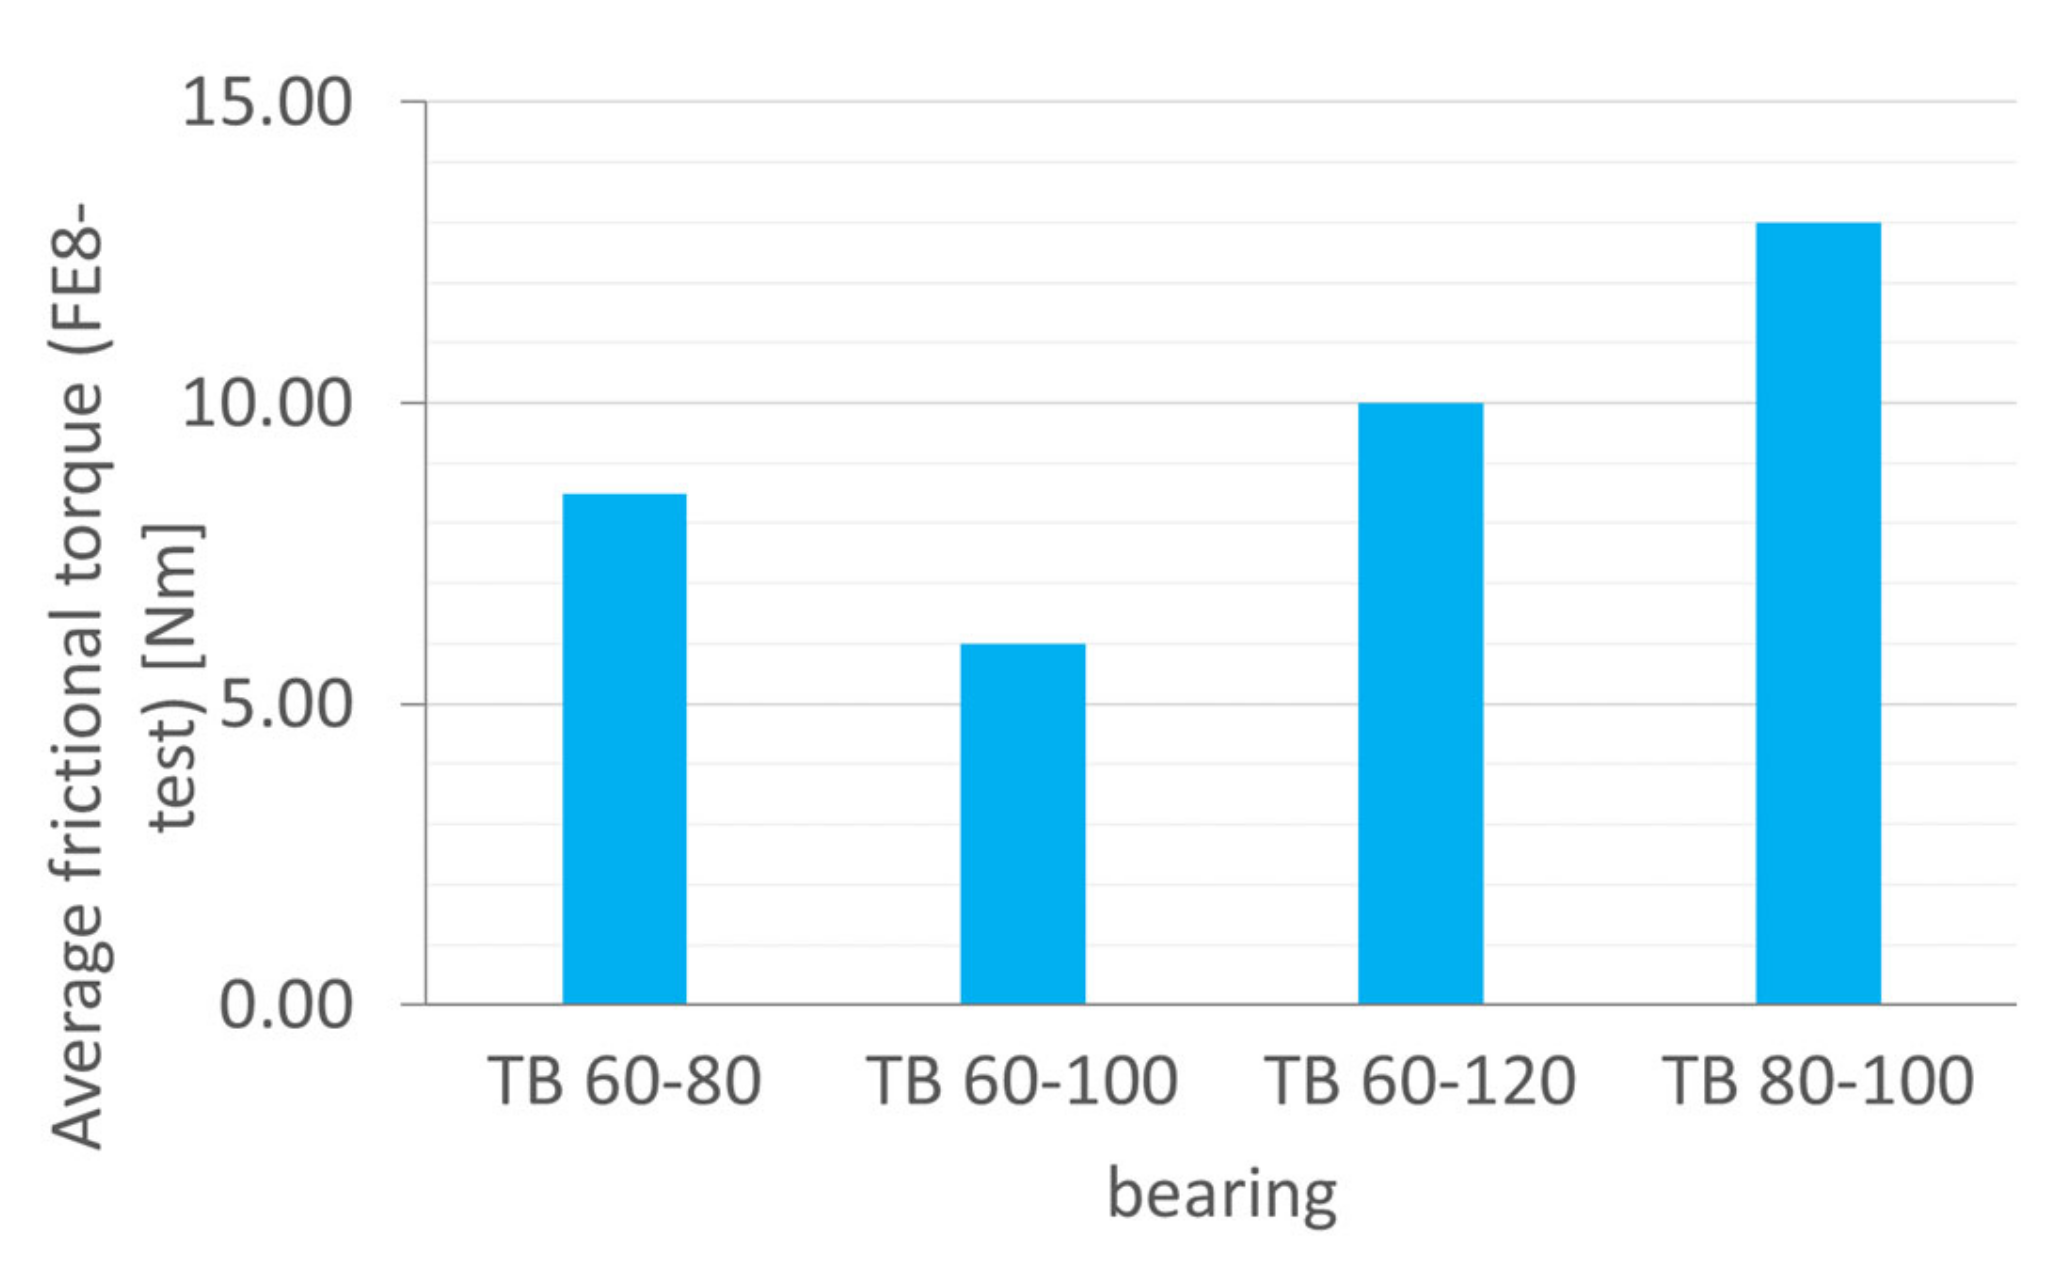
| 3 (TB 60-80) | 80 | 60 | 200:00 | 10 |
| 1 (TB 60-100) | 100 | 60 | 50:12 | 8.5 |
| 2 (TB 60-120) | 120 | 60 | 200:00 | 6 |
| 4 (TB 80-100) | 100 | 80 | 37:52 | 13 |
Publisher’s Note: MDPI stays neutral with regard to jurisdictional claims in published maps and institutional affiliations. |
© 2022 by the author. Licensee MDPI, Basel, Switzerland. This article is an open access article distributed under the terms and conditions of the Creative Commons Attribution (CC BY) license (https://creativecommons.org/licenses/by/4.0/).
Share and Cite
Pape, F. Nano- and Micro-Tribological Investigations of Boundary Layers on Axial Bearing Washers Tested under WEC Critical Conditions. Lubricants 2022, 10, 198. https://doi.org/10.3390/lubricants10080198
Pape F. Nano- and Micro-Tribological Investigations of Boundary Layers on Axial Bearing Washers Tested under WEC Critical Conditions. Lubricants. 2022; 10(8):198. https://doi.org/10.3390/lubricants10080198
Chicago/Turabian StylePape, Florian. 2022. "Nano- and Micro-Tribological Investigations of Boundary Layers on Axial Bearing Washers Tested under WEC Critical Conditions" Lubricants 10, no. 8: 198. https://doi.org/10.3390/lubricants10080198
APA StylePape, F. (2022). Nano- and Micro-Tribological Investigations of Boundary Layers on Axial Bearing Washers Tested under WEC Critical Conditions. Lubricants, 10(8), 198. https://doi.org/10.3390/lubricants10080198