Abstract
A wheel/rail friction coefficient that is too low can result in damage to the wheel and rail due to slips and slides, delays and safety concerns. A friction coefficient that is too high can result in excessive wear, noise and rolling contact fatigue. Changing contact and environmental conditions cause variations in wheel/rail friction, so friction management products, applied via wayside or on-board applicators, are used to either increase or decrease the friction coefficient so that an improved level is reached. They can be split into three classes; traction enhancers, lubricants and top-of-rail products (including water-based, oil/grease-based and hybrid products). This paper focuses on top-of-rail products and describes the different apparatus, contact conditions, product application methods and result interpretation that have been used to test these products and highlights the requirement for a more standardised test method. A proposed test method is outlined, which uses a twin disc test rig to collect “effective level of friction” and “retentivity” data to assess product effectiveness. More comparable and standardised data will ensure that maximum benefit is obtained from each set of results and help both product development and the approvals process.
1. Introduction
Friction management products can be used to increase, maintain or decrease the friction coefficient in the wheel-rail interface. They can be split into the following classes:
Traction enhancers, designed to increase the friction coefficient from low levels. Traction gels are commonly used, solid particles suspended in a liquid component that are used to mitigate against low adhesion conditions.
Lubricants, for instance greases used on the gauge corner, designed to decrease the friction coefficient to low levels (below 0.1).
Top-of-rail (TOR) products, designed to decrease the friction coefficient from high levels and maintain it at an intermediate level; if the friction coefficient is too low it will negatively affect traction and breaking and if it is too high then excessive wear or rolling contact fatigue may occur. A review of their use and effects can be found in [1].
They are intended to create positive friction characteristics, preventing stick-slip oscillations in the contact which result in excessive noise and corrugation development [2,3,4]. A detailed summary of TOR product behaviour can be found in [5], it states that “In railway applications, a TOR product refers to a material that specifically reduces the friction from high levels under dry conditions (0.5–0.8) to an intermediate coefficient of friction (COF) of 0.3–0.4. TOR products can be split into two categories: water-based drying products (TOR-FM) and non-drying, containing oil or grease (TOR-Lubricants) [5]”.
A schematic of wheel-rail friction regimes, the conditions that cause these and the effects of friction management products are shown in Figure 1.
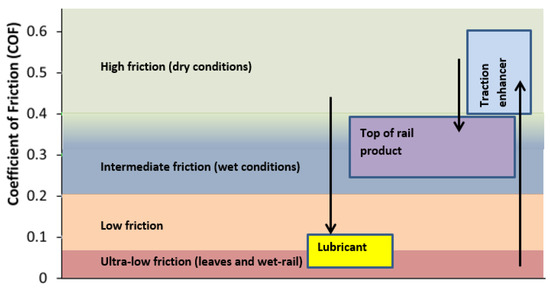
Figure 1.
Wheel/rail friction regimes and actions required by friction management products.
This intermediate region (0.3–0.4) is different to that described in Figure 1 (0.2–0.4). Different rail networks specify different friction requirements [2] and these are dependent on contact conditions, so these conditions should be viewed as a guide rather than absolute values. The desired creep curve behaviour of TOR products is shown in Figure 2 [5].
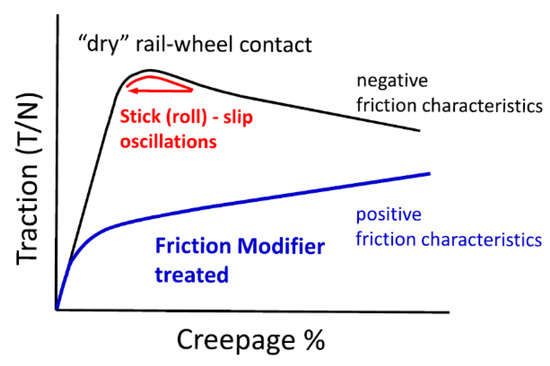
Figure 2.
Behaviour of TOR-FM’s compared to a dry contact [5].
While a Network Rail standard exists for specifying testing of curve lubricants (NR/L3/TRK/3530/A01 Track Lubricants: Curve Lubricants, 2012) there are currently very few guidelines that specify the requirements of TOR products or how to assess their effectiveness. As a result, product specifications vary significantly and the performance of the products is relatively unknown. Anecdotal evidence is often favoured and the perception and use of these products in the UK, for example, varies significantly between locations.
An ideal benchmark product assessment would involve a set of reliable small-scale tests, which are cost effective to run and accessible. The test method should have been validated previously to ensure that the results are representative of that seen in the actual wheel-rail contact. This work provides a review of small scale, full scale and field testing that has previously been carried out using friction management products and proposes a validated, standard approach that could be used for the twin disc testing of these materials.
There are three types of test regularly carried out on friction management products; one to determine “effective friction” and “retentivity” (how long the product remains active in the contact); another for “creep curve” generation and finally a wear test. The first is most often used [6], ensuring the product meets the desired friction thresholds for operational use. Creep curves may be required if the data are to be used for modelling, for instance multi-body dynamics simulations. A standard approach for wear testing is proposed in [7], so this work will focus on the friction behaviour. Coupled with appropriate data analysis, the effective friction and retentivity data can be used to understand product performance in the field.
There are five key components that need to be detailed in a standard test protocol: apparatus, specimens, test conditions, product application and interpretation of results. These are discussed with test sensitivities and the key parameters to control, as well as best practice in carrying out the tests, in the following.
2. Test Requirements and Review
2.1. Apparatus
Six different types of test rig are regularly used in top-of-rail product testing, each with their own benefits and limitations. At the most complex end are full scale test rigs which can be rotating or linear [4,8,9]. Both have representative contact sizes and are useful for scaling work and generating data for modelling. These are expensive and time consuming to use with very few facilities available, which makes them unsuitable for a standardised test protocol. When using top-of-rail products, they can also be difficult to clean in between tests, which leads to repeatability issues when testing multiple products.
High pressure torsion (HPT) test rigs also have a realistic contact size. The HPT contact is comprised of areas of partial sliding as rotation is increased, which allows a creep curve to be produced. The advantage of the HTP set-up is the specimens are flat which allows a more accurate application of a third body material [10]. However, very few of these test facilities are available.
The pin-on-disc test approach is largely unsuitable due to the very small sliding contact, which can push product out of the contact and makes it difficult to apply the correct amount of product. Some work has successfully been carried out where the pin was designed to have a larger contact and the “sliding” was set-up to mimic the slip component of the partially sliding contact conditions [11], but for a standard test a rolling component would be preferred.
Mini traction machines (MTM) [12] and twin disc test rigs are both readily available and use a rolling/sliding contact. Tests were carried out on both over the course of this work to determine which would be most suitable for a standardised test method.
The mini traction machine can operate at higher speeds, but the ball-on-flat geometry still results in products being pushed out of the contact making it difficult for the true quantity of product to be established. It is designed for oil based homogenous lubricants, but solid particles are quickly pushed from the contact, as shown in Figure 3.
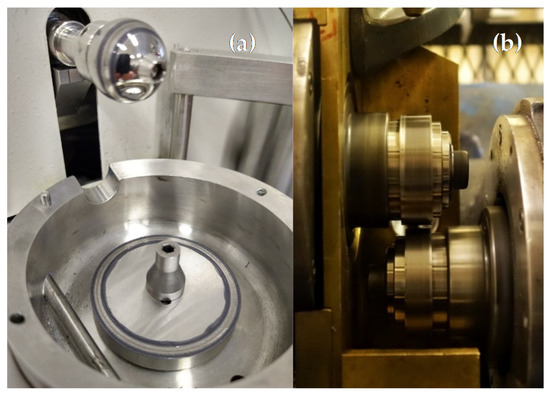
Figure 3.
A mini traction machine contact after a friction test with product addition (a); a twin disc contact after a friction test with product addition (b).
Although there can still be product fling-off if large quantities are applied, the wider line contact and rolling action of the twin disc test rig means that product is more likely to remain in the contact during the test (Figure 3). This is important when assessing how quickly the product is consumed.
Any standard approach will require accessible testing to meet the needs of industry. Twin disc, mini-traction machine and pin-on-disc are all relatively accessible, whilst the others are only found in specialist rail facilities. When considering availability of the above rigs, which is key for a “standard” approach, as well as realistic product entrainment, the most appropriate test is the twin disc approach.
The two cylindrical twin discs give a line contact. This ensures that, even if the discs wear, the contact stays at the same dimensions which helps to maintain the same contact pressure throughout the test. Using a disc with a radius on could lead to contact pressure dropping by several orders of magnitude. Table 1 shows how wear affects contact pressure with different geometry specimens.

Table 1.
Contact geometries and contact stress for different test types.
2.2. Specimens
It is critical that discs are made from wheel and rail material to ensure that the wear behaviour, roughness evolution and oxide formation is similar to that in the field, since water-based drying products rely on mixing with oxides to give optimum performance.
This is due to the naturally occurring third body layer, a solid interfacial layer on the wheel and rail surface which is composed of iron oxides and steel wear particles, along with any other external contamination. In a real wheel/rail situation, this layer is between 15–100 µm thick and affects the resultant friction coefficient, both on its own or when mixed with TOR products or water [13,14,15].
It is also important that all the disc specimens used have consistent properties, and as such, they should be cut horizontal to the wheel and rail contact surface. Hardness measurements should also be taken to check what values the discs have—this can be undertaken on the disc surface, but it is better to achieve this by sectioning the discs. Disc hardness measurements taken perpendicular to the disc surface are shown in Figure 4 [16]. The hardness is relatively consistent, but this may not be the case for heat-treated wheels and rails.
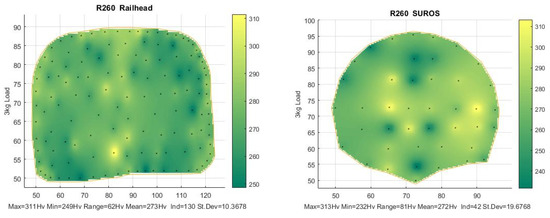
Figure 4.
Hardness map taken from a sectioned R260 rail head and rail disc [16].
Disc size is limited by the diameter that can be machined from a rail head, 47 mm, which ensures that the material has the right microstructure and heat treatment. It is important that roughness is representative of “run-in” wheels and rails, and that all discs have the same roughness. There are some arguments that roughness should be scaled for small contacts [17], but more work is required to investigate this.
Figure 5 shows roughness data from measurements carried out on ground rail to see how it ran-in and what roughness values resulted [18]. Run-in values here were less than 1 micron. Test outcomes (both in terms of “effective friction” and in particular “retentivity”) are very sensitive to roughness.
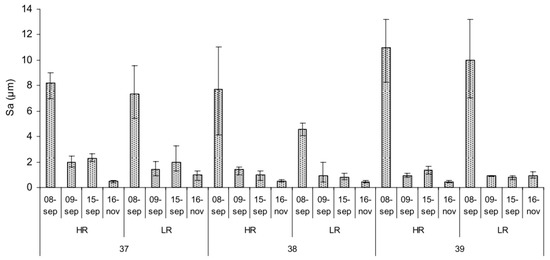
Figure 5.
Rail roughness measured post-grinding [18].
Data are shown in Figure 6 for tests run with curve lubricants [19] which shows how much retentivity varies for different initial disc roughness.
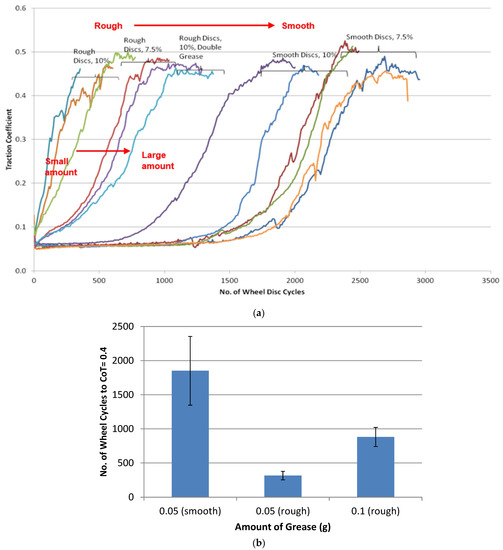
Figure 6.
(a,b) Friction data for curve lubricant retentivity testing with different disc roughness [19].
Assessing disc “roundness” and that the mounting hole is central is important. A disc that is not round could induce dynamic effects in the rig that lead to discs forming flats, which tend to propagate around the disc [20].
Cleaning the discs before testing is important, as they could have contaminants from the manufacturing processes left on the surface, care should be taken to avoid touching the disc surface. Cleaning with acetone in an ultrasonic bath will remove excessive oil-based contamination on the discs, but the length of cleaning time and method should be kept consistent between tests to ensure that the discs have a comparable surface state. Excessive cleaning, for instance scrubbing with long solvent bath times, is unnecessary due to the naturally occurring third-body [13] layer such as iron oxide (which is built up on the twin discs during the dry run-in step) playing an important role in the operational use of these products.
2.3. Test Contact Conditions
The range of wheel/rail interface conditions has been characterised using multi-body dynamics (MBD) simulations. Figure 7 shows a map of conditions identified for the wheel tread/rail head contact and the wheel flange/rail gauge corner in terms of contact pressure and sliding speed in the partial slip region of the contact [21]. From this, conditions can be selected to represent the various types of railway system that utilise TOR products. Conditions for the contact of interest (wheel tread/rail head) will vary according to track and vehicle type. Product users will be interested in testing at conditions relevant to their system, so the choice for these should be left open. Some systems may have unique characteristics that need tests to reflect these. For example, some systems have vehicles that coast at various points on their routes and as such, tests at 0% slip become of interest. Another example of this is heavy haul freight, where a small number of locomotives provide tractive effort to a large number of wagons with non-driven wheelsets.
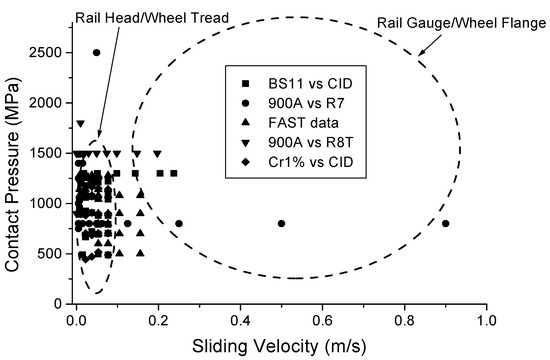
Figure 7.
Map of contact conditions from Gensys MBD simulations of the Stockholm local railway (available twin disc test data for rail wear is overlaid) [21].
Contact conditions must be selected carefully though, as effective friction values and retentivity are sensitive to contact pressure and slip (see Figure 8 [22]). Specific MBD simulations may be appropriate to obtain representative system-specific values.
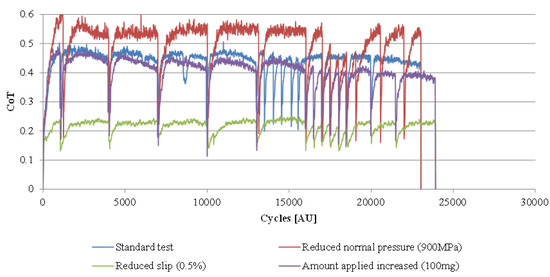
Figure 8.
TOR product twin disc testing for different contact pressure, slip and application amounts [22].
2.4. Product Application
TOR products are frequently over-applied in experimental work. Amounts should be scaled to take account of the smaller contact sizes being used in the tests. It is relevant to look at different amounts as carry-down mechanisms mean that the amount of product on the rail head changes with distance from the application point (see Figure 9 [23]). Another issue is the misapplication of water-based TOR-FMs. They are designed to work by forming a dry third-body layer made up of the solid component mixed with the oxides naturally present in the wheel/rail interface. In most studies they are applied wet to the contact and therefore only the application point is simulated. In the methods described here, the product dries out and forms a steady state layer before being consumed as the contact returns to dry conditions.
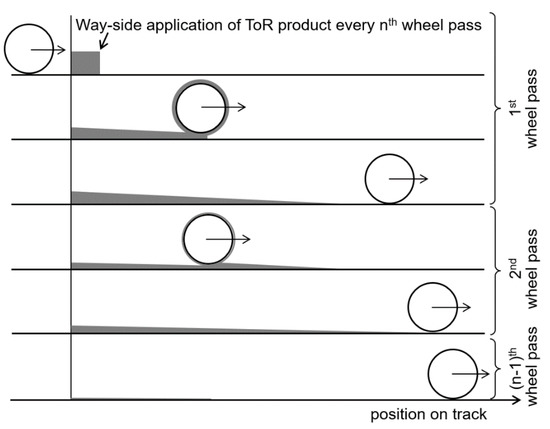
Figure 9.
Pick-up and carry-down schematic [23].
For the wayside application of products, a puddle of approximately 1–5 g is pumped onto the rail head. When passing, a wheel engages with approximately 0.1 g. From this, the layer thickness of product should be approximately 10 µm (for “on-board” application amounts the thickness needs to be 0.025 µm).
“Effective friction” and “retentivity” results are very sensitive to applied product amount for both laboratory tests (see Figure 8 [22] and Figure 6 [19]) and field tests (see Figure 10 [5]). The field data show that application amount is more critical for TOR lubricants where the envelope of applied amount that gives an intermediate level of friction is very small. This makes the application process for this product in testing very critical. It is easy to get misleading results from over or under application. Consistent spreading of product is also important as results are variable, with more viscous products in particular, if it is not consistent.
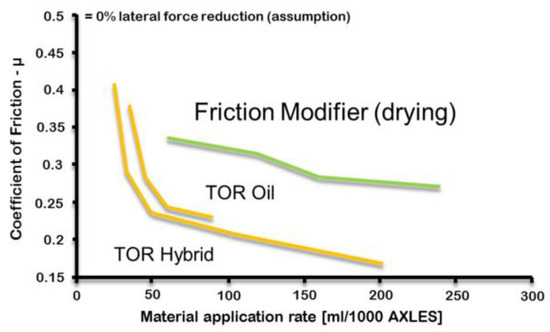
Figure 10.
Field test data for different application amounts of TOR products [5].
2.5. Results and Interpretation
2.5.1. Effective Friction Data
In order to consider the performance of TOR products with respect to “effective friction” level, the required intermediate friction regime they should be designed to operate in must be specified.
Intermediate friction levels have been defined as being between 0.2 and 0.4—these thresholds should not be considered as clear cut, as if testing in the partial slip region (up to around 1–2% slip), friction levels may be lower. An example of this creep curve is shown in Figure 2. During a “retentivity”, test friction will vary, but with all products there will be a steady state region where “effective friction” can be determined. It may also be appropriate to define the number of cycles a product is in the intermediate regime. This means that for different products tested, a number of parameters can be considered in ranking their performance.
Comparison of laboratory friction data with field data is very important. However, most methods for field measurement involve the use of a tribometer to measure friction between the tribometer “wheel” or “slider” and may not be representative of what is achieved in a wheel/rail contact, for instance due to the lack of the previously described third body layer. Figure 11a shows a comparison of data from a range of different measurements [24]. Most rail head friction measuring devices, including the pendulum device and the push-tribometer, provide a poor representation of wheel/rail interface conditions. However, the data in Figure 11b show that for TOR-FM measurements the pendulum device does give results similar to a full-scale rig [24].
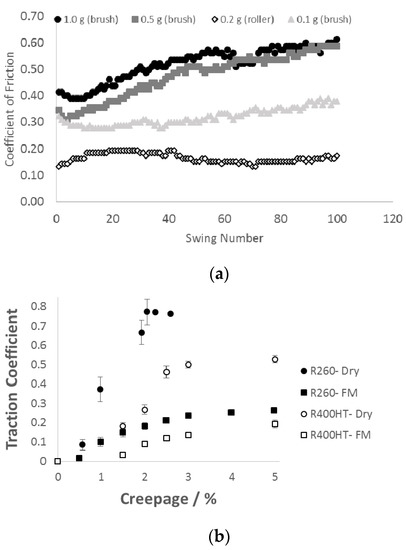
Figure 11.
Friction data from rail head measurements with a TOR-FM applied (a) Pendulum data; (b) Full-scale rig data [24].
The OnTrak railhead tribometer [25] is a new portable device with more representative contact conditions. Figure 12 compares data from rail head measurements of a TOR-FM layer run-in with a shunter locomotive using this device, against twin disc data for the same TOR-FM. Comparative average values are observed between twin disc and tribometer results, the large spread of data in the twin disc results is likely due the data recording the full product spectrum from initial product addition to dry values after consumption over a large number of cycles, whilst the tribometer provides more of a “snapshot” over fewer cycles.
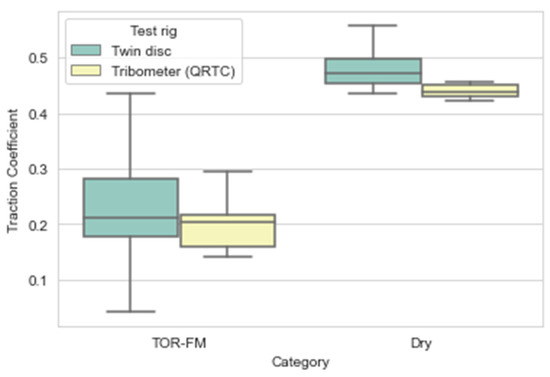
Figure 12.
Comparison of TOR-FM friction values from rail head measurements using an OnTrak tribometer, against twin-disc data.
The best comparison is made with data from locomotive tests. Figure 13 shows friction measurements from locomotive tests carried out with the “on-board” application of a TOR-FM [26]. The tests with no product were aiming to measure “dry” conditions, but it was drizzling so it is described in the graph as a “damp” railhead.
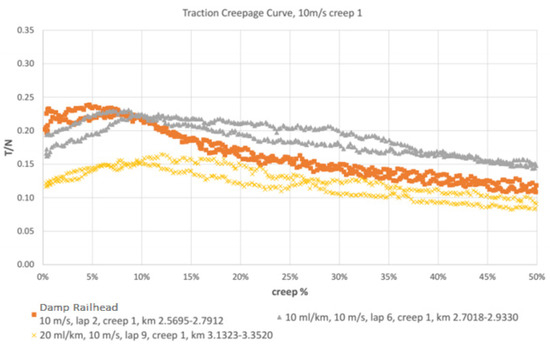
Figure 13.
Friction data from locomotive tests with a TOR-FM [26].
Scaling data from a small-scale test to a full-scale contact is complex. The best approach to achieve this is to use small-scale data to parameterise a creep force model which can then be used for predictions of field behaviour. This has been performed for a TOR-FM using data from High Pressure Torsion tests [26] and the extended creep force (ECF) model. The predictions for full-scale contacts are shown in Figure 14. These compare well with locomotive data shown in Figure 13 (where the “damp” curve in rainy conditions compares well to the “wet” curve in Figure 14). The 16 and 32 mL/mile dosages modelled here are equivalent to the 10 and 20 mL/km dosages used in the track trials.
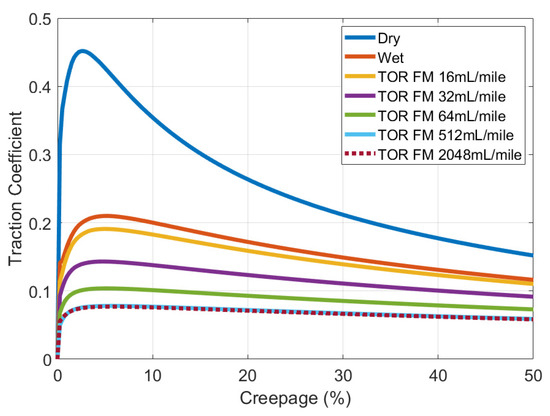
Figure 14.
Full-scale predictions from the parameterised ECF model [26].
Friction curves produced from retentivity tests on a twin disc machine have been used to inform the development of a top-of-rail product friction/consumption model which has been used to predict full-scale contact performance [22] and validated against full scale measurements [23].
2.5.2. Retentivity Data
There are no thresholds defined for “retentivity” so it can only really be used for comparisons between products. However, previous twin disc testing on different greases to study retentivity has shown that the test approach can resolve differences between different products [19], as can be seen in Figure 15.
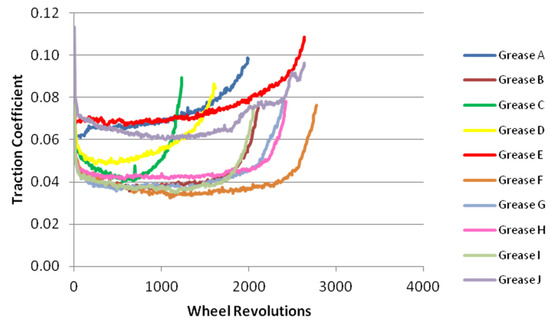
Figure 15.
Retentivity tests for difference curve lubricants [19].
There have been no direct investigations of “retentivity” in the field as this is hard to quantify. However, creep curves were measured using the Ontrak railhead tribometer after different numbers of axle passes following the application of a TOR-FM (see Figure 16) [25]. Friction value has been replotted against cycle numbers for different slip values, as shown in Figure 17. The cycles to “dry” friction compare quite well with twin disc data [8].
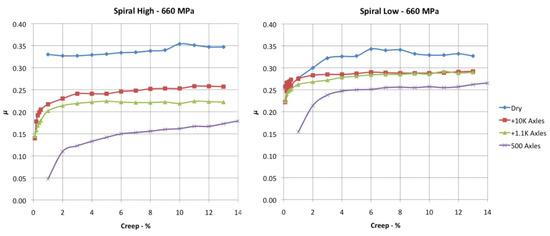
Figure 16.
Creep curve measurements using an OnTrak tribometer showing TOR-FM layer durability [25].
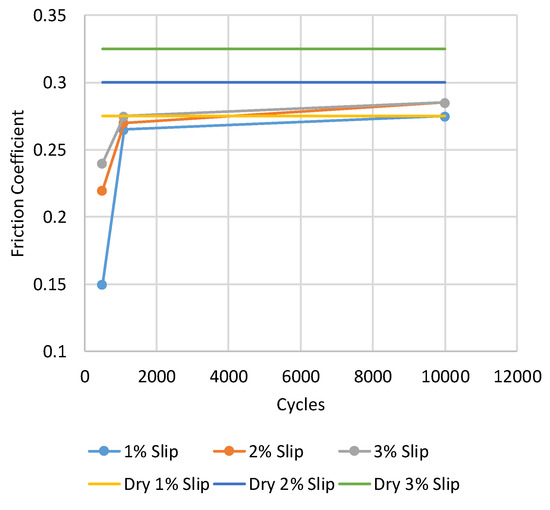
Figure 17.
Friction against cycle number calculated from OnTrak rail head tribometer creep curves for the “spiral low” (shown in Figure 16).
A full analysis of the importance of experimental design and statistical analysis in tribological testing can be found in previous work [27] where the study concluded that more thorough statistical analysis would be beneficial for the field. At least three repeats for each condition should be carried out. If possible, products and sample discs should be randomized and blinded. Raw results should be included in any reporting, along with details of any data that has been omitted.
3. Proposed Test Specifications
A test approach is proposed below, based on the work that has been reviewed in the previous section. The aim of this test is to define an “effective level of friction” for a top-of-rail product and its “retentivity”. The “effective level of friction” of a product is the friction level achieved when the product is applied in a wheel/rail interaction.
“Retentivity” is a measure of how long a product is able to retain its effective friction level before being consumed from the wheel/rail contact patch and eventually returning to the dry baseline friction level. A retentivity test conducted on a twin disc rig can measure a product’s retentivity relative to other products tested at the same conditions and effective friction level.
The test specification is split into three sections: pre-test preparation and measurement, test execution and measurements during the test and post-test measurement, analysis and data presentation. A summary “checklist” for a twin disc test, similar to that proposed in [7], is shown below.
Further test specifications have been proposed for twin disc testing, covering low adhesion simulation and traction gels [28], as well as full scale testing [29].
- Pre-test preparation and measurements
- Manufacture specimens to specification shown in Section 3.1;
- Grind to 1 µm Ra (measured laterally across disc);
- Select desired normal load, dependent on the railway system to be simulated;
- Plan sufficient repeats and test randomisation/blinding if required [27];
- Measure disc mass and roughness;
- Surface images.
- Test execution and measurements during the test
- Dry run-in (low load and slip to condition discs);
- Measure friction, load and slip;
- Room temperature and humidity;
- Any unusual behaviour of the test specimen (noise, visible surface change, change in wear debris);
- Any unusual product behaviour (visible fling-off, colour changes).
- Post-test measurement, analysis and data presentation
- Disc mass before cleaning (can be used to estimate mass of product remaining on surface);
- Roughness;
- Surface images;
- Show effective friction and retentivity. Plot results alongside a dry baseline.
3.1. Pre-Test Preparation and Measurements
Based on the review in Section 2.1 a twin disc rig is recommended, providing an optimum balance between complexity and control. The twin disc apparatus should allow loading and rolling of two discs together under a controlled load and rolling speed to achieve partial slip between them (see Figure 18 for typical set-up, the discs can also be loaded together horizontally which makes product easier to apply directly into the contact.
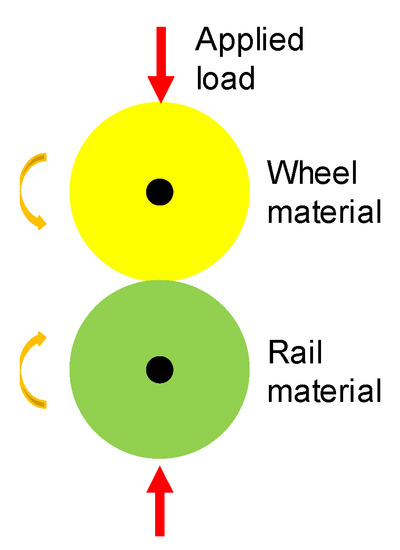
Figure 18.
Vertical twin disc test set-up.
The apparatus needs to have a wide load range to achieve contact stresses up to around 2 GPa and a full range of possible slip values (1–5% to cover partial slip to saturation and up to 20% for testing flange lubricants).
A machine designed primarily for testing lubricants may not have a torque specification high enough to deal with dry testing needed for benchmarking, so take care to check the rig capabilities and discuss this with the supplier.
Machine resolution will allow different rates of slip or load graduation if this is ever required during a test. Care must be taken to not increase it too quickly, as typically there is a settling time needed before the required values are attained.
Discs of actual wheel and rail material should be cut parallel to the running surface of the actual wheel and rail (see Figure 19). Disc diameter should be 47 mm with a 10 mm contact width. Hardness of the discs should be measured using an indentation-based test machine measuring Vickers hardness.
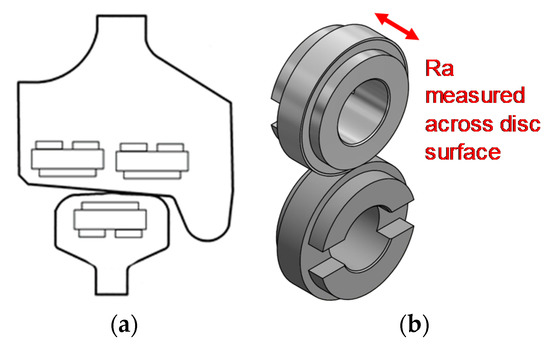
Figure 19.
Location for disc extraction to ensure consistent properties (a); Roughness measurement direction for disc contact surface (b).
Discs should be cylinders, so a line contact is achieved. Roughness of surfaces (Ra, measured across disc contact surface, see Figure 3) should be 1 micron (consistent with run-in wheels and rails). A technical drawing of the twin disc specimen is shown in Figure 20. Roundness and centrality of the internal bore of the discs should be checked prior to testing using an appropriate measurement device, for example a Talyrond. Discs must be thoroughly cleaned before testing using a solvent such as acetone and an ultrasonic bath for 10 min to remove oil residue from the manufacturing process. Discs should be mounted on the test rig without being touched once cleaned. Discs should not be re-used unless regrinding them to return to the original roughness, since friction and product performance is very sensitive to roughness.
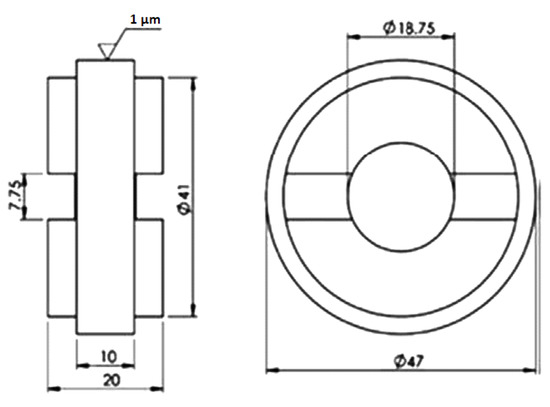
Figure 20.
Dimensions of a SUROS disc.
3.2. Test Execution and Measurements during the Test
For a top-of-rail product, the values representative of a wheel tread/rail head contact should be used. Contact stress and slip values should be representative of the railway system under consideration, for instance:
- Conventional rail system: 1200 MPa and 1% slip;
- Light rail system: 900 MPa and 1% slip;
- Heavy haul freight system: 1500 MPa and 1% slip.
If the braking performance on these products is to be tested, additional tests at 3% slip should be carried out.
If contact stress and slip values for a specific vehicle and track scenario are needed, these should be determined via multi-body dynamics (MBD) simulations. Alternatively, if wheel and rail profiles, and vehicle loading, will be known, then Hertz analysis can give contact stresses.
The relationship between load applied and disc geometry with maximum contact pressure (p0) for two elastically identical steels is:
where R is disc radius, P is applied load and E is Young’s modulus.
Two different approaches can be found for calculating slip. For railway research the approach that should be used is:
where V is disc speed in rpm.
Discs should be run-in under dry conditions, before product application, using low load and slip for 2000 cycles at 900 MPa and 0.2% slip. This is to condition the discs and build up the naturally occurring iron oxides and wear particles of the third body layer, more closely simulating real wheel/rail conditions.
A representative amount of product should be applied for the field application approach (wayside or “on-board”). For wayside application, 5 mg of top-of-rail product should be dispensed. Product application should be achieved using an accurate dispensing device such as a micro-pipette (if the product is not too viscous for pipette use) or 1 ml syringe. The disc and syringe should be weighed on a high-resolution balance before and after product addition, to measure the exact mass of product added.
A series of “drops” making up the required amount of product (spread over four product application locations in this situation, but this may vary due to product viscosity) should be applied and then the discs should be carefully rotated at a low speed and low slip to “spread” the product evenly around the disc. If product is applied in only one location, it can be squeezed out of the contact and the discs should be observed after the product is spread to ensure that this has not occurred. An image of 5 mg applied in small drops, as shown in Figure 21. For “on-board” application the amount would be significantly lower. This would require a spray or atomisation of the product depending on the actual field application method.
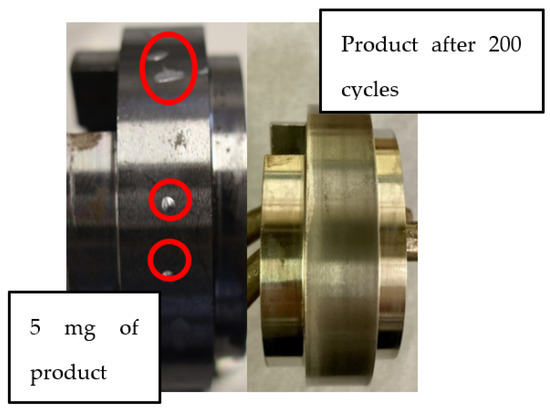
Figure 21.
5 mg of product on a disc and then after 200 cycles of rolling-in.
The test should then be carried out using the required contact conditions and the desired number of repeats carried out to ensure validity of results [27].
3.3. Post-Test Measurement, Analysis and Data Presentation
The traction coefficient should be measured during the test. The friction behaviour and values will differ in nature depending on the product type: water-based (drying), or oil/grease-based (non-drying).
See Figure 22 for typical behaviours—from these plots the following parameters can be defined (see Figure 23):
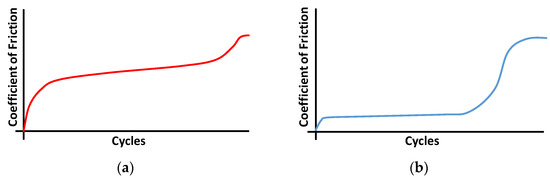
Figure 22.
Typical friction responses for a water-based drying product (a); oil based non-drying product (b).
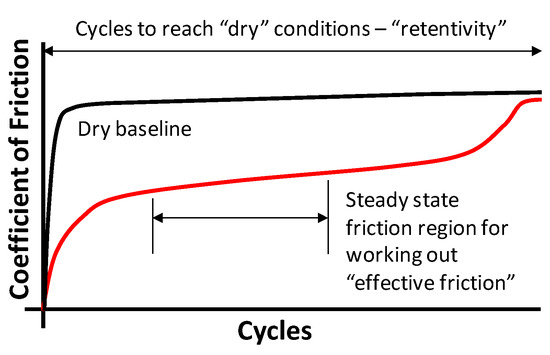
Figure 23.
How to determine effective friction and retentivity.
- “effective friction” (friction to be expected if the top-of-rail product has been effectively transferred to the wheel/rail interface)—from averaging the friction in a steady state region. TOR products would be expected to give an “intermediate” level of friction (0.2–0.4).
- “retentivity” (measure of how long a product is able to retain its respective effective friction level before being consumed from a wheel/rail contact and eventually returning to the dry baseline friction level)—by working out the number of cycles for a “dry” friction value to be reached. There is no specified value for “retentivity”, but the longer a product can give friction in the required range the better.
- cycles in the “intermediate friction regime” for top-of-rail products could also be defined if there is a desired range of effective friction (for example if the product user requires a friction coefficient of 0.2–0.35).
Average values of key parameters should be presented along with standard deviation. A dry baseline test at the same contact conditions should also be carried out to give a baseline for the product performance, as Section 2.3 highlighted dry values can vary between test rigs, contact conditions and steel types.
4. Conclusions
The review (Section 2) has highlighted the range of apparatus, conditions, application methods and results interpretation used when assessing top-of-rail product performance. The inconsistency between approaches means that a comparison of results is very difficult between studies.
In an effort to work towards more comparable future results and maximise the benefit from potentially time consuming and expensive testing, a set of guidelines for assessing TOR products using a twin disc test rig has been proposed in this work. This test specification has outlined how to collect two types of data; effective friction and retentivity. Coupled with appropriate data analysis, these can be used to understand how products will perform in the field.
This test approach has been specified from the results of the review, as well as the authors’ personal experience. It may be refined in future, but remains a step towards a more standardised approach. Even if the full test specification is not followed, for example if product usage of apparatus availability differs, then following summary checklist shown in Section 3 as closely as possible will improve data comparison.
A future step could be to use this test specification to carry out a worldwide round-robin test using a range of twin disc test rigs. As well as the dry baseline, a “calibration” product should be used so that the results between test rigs can be assessed. This round-robin test can also provide enough data to be used in statistical analysis, helping to set limits for what the reproducibility and repeatability of each test should be.
The more consistent test approach and comparable results obtained from these test specifications will help product users, such as infrastructure managers, choose the most suitable product and better understand when, where and whether to use these friction management products. More robust test specifications can also be used by product suppliers to demonstrate performance of new products and open the market to new entrants through a simpler and more consistent approvals process.
Further test specifications have been proposed for full scale testing, as well as simulating low adhesion conditions and testing traction gels, they can be found in [28,29].
Author Contributions
Conceptualization and Writing, B.W. and R.L.; Validation, Z.S.L. All authors have read and agreed to the published version of the manuscript.
Funding
This work was co-funded by RSSB and Network Rail for project COF-G19.
Data Availability Statement
More information can be found at www.sparkrail.org (accessed on 25 May 2022). For the purpose of open access, the author has applied a Creative Commons Attribution (CC BY) license to any Author Accepted Manuscript version arising.
Conflicts of Interest
The authors declare no conflict of interest.
References
- Harmon, M.; Lewis, R. Review of top-of-rail friction modifier tribology. Tribol. Mater. Surf. Interfaces 2016, 10, 150–162. [Google Scholar] [CrossRef] [Green Version]
- Magel, E.E. A Survey of Wheel/Rail Friction; Final Report; U.S. Department of Transportation: Washington, DC, USA, 2017.
- Eadie, D.T.; Santoro, M.; Oldknow, K.; Oka, Y. Field studies of the effect of friction modifiers on short pitch corrugation generation in curves. Wear 2008, 265, 1212–1221. [Google Scholar] [CrossRef]
- Eadie, D.; Elvidge, D.; Oldknow, K.; Stock, R.; Pointner, P.; Kalousek, J.; Klauser, P. The effects of top-of-rail friction modifier on wear and rolling contact fatigue: Full-scale rail-wheel test rig evaluation, analysis and modelling. Wear 2008, 265, 1222–1230. [Google Scholar] [CrossRef]
- Stock, R.; Stanlake, L.; Hardwick, C.; Yu, M.; Eadie, D.; Lewis, R. Material concepts for top-of-rail friction management—Classification, characterization and application. Wear 2016, 366–367, 225–232. [Google Scholar] [CrossRef]
- Gutsulyak, D.V.; Stanlake, L.J.E.; Qi, H. Twin disc evaluation of third body materials in the wheel/rail interface. Tribol.-Mater. Surf. Interfaces 2021, 15, 115–126. [Google Scholar] [CrossRef]
- Lewis, R.; Magel, E.; Wang, W.; Olofsson, U.; Lewis, S.; Slatter, T.; Beagles, A. Towards a standard approach for the wear testing of wheel and rail materials. Proc. Inst. Mech. Eng. Part F J. Rail Rapid Transit 2017, 231, 760–774. [Google Scholar] [CrossRef]
- Buckley-Johnstone, L.; Harmon, M.; Lewis, R.; Hardwick, C.; Stock, R. A comparison of friction modifier performance using two laboratory test scales. Proc. Inst. Mech. Eng. Part F J. Rail Rapid Transit 2019, 233, 201–210. [Google Scholar] [CrossRef]
- Boyacioglu, P.; Bevan, A.; Allen, P.; Bryce, B.; Foulkes, S. Wheel wear performance assessment and model validation using Harold full scale test rig. Proc. Inst. Mech. Eng. Part F J. Rail Rapid Transit 2021, 236, 406–417. [Google Scholar] [CrossRef]
- Evans, M.; Skipper, W.A.; Buckley-Johnstone, L.; Meierhofer, A.; Six, K.; Lewis, R. The development of a high pressure torsion test methodology for simulating wheel/rail contacts. Tribol. Int. 2021, 156, 106842. [Google Scholar] [CrossRef]
- Lewis, S.R.; Lewis, R.; Olofsson, U.; Eadie, D.T.; Cotter, J.; Lu, X. Effect of humidity, temperature and railhead contamination on the performance of friction modifiers: Pin-on-disk study. Proc. Inst. Mech. Eng. Part F J. Rail Rapid Transit 2012, 227, 115–127. [Google Scholar] [CrossRef]
- Galas, R.; Kvarda, D.; Omasta, M.; Krupka, I.; Hartl, M. The role of constituents contained in water-based friction modifiers for top of rail application. Tribol. Int. 2018, 117, 87–97. [Google Scholar] [CrossRef]
- Descartes, S.; Desrayaud, C.; Niccolini, E.; Berthier, Y. Presence and role of the third body in a wheel/rail contact. Wear 2005, 258, 1081–1090. [Google Scholar] [CrossRef]
- Lu, X.; Cotter, J.; Eadie, D.T. Laboratory study of the tribological properties of friction modifier thin films for friction control at the wheel/rail interface. Wear 2005, 259, 1262–1269. [Google Scholar] [CrossRef]
- Meierhofer, A.; Hardwick, C.; Lewis, R.; Six, K.; Dietmaier, P. Third body layer-experimental results and a model describing its influence on the traction coefficient. Wear 2014, 314, 148–154. [Google Scholar] [CrossRef]
- Christoforou, P.; Fletcher, D.I.; Lewis, R. Benchmarking of premium rail material wear. Wear 2019, 436–437, 202990. [Google Scholar] [CrossRef]
- Poole, W. A Discussion on the Effect of Surface Roughness on Creep Curves. Br. Rail Res. Intern. Memo. 1981, 84, 2161–2168. [Google Scholar]
- Lundmark, J.; Hoglund, E.; Prakash, B. Running-in Behaviour of Rail and Wheel Contacting Surfaces. In Proceedings of the 5th International Conference on Tribology, Parma, Italy, 20–22 September 2006. [Google Scholar]
- Lewis, S.R.; Lewis, R.; Evans, G.; Buckley-Johnstone, L.E. Assessment of railway curve lubricant performance using a twin-disc tester. Wear 2014, 314, 205–212. [Google Scholar] [CrossRef]
- Garnham, J.E.; Brightling, J.R.; Beynon, J.H. Rolling-sliding analysis. Wear 1988, 124, 45–63. [Google Scholar] [CrossRef]
- Lewis, R.; Olofsson, U. Mapping rail wear regimes and transitions. Wear 2004, 257, 721–729. [Google Scholar] [CrossRef] [Green Version]
- Lee, Z.; Trummer, G.; Six, K.; Lewis, R. Modelling the effects of top-of-rail products on creep forces in the wheel-rail interface. 2022; to be submitted. [Google Scholar]
- Trummer, G.; Lee, Z.S.; Lewis, R.; Six, K. Modelling of frictional conditions in the wheel–rail interface due to application of top-of-rail products. Lubricants 2021, 9, 100. [Google Scholar] [CrossRef]
- Harmon, M.; Santa, J.F.; Jaramillo, J.A.; Toro, A.; Beagles, A.; Lewis, R. Evaluation of the coefficient of friction of rail in the field and laboratory using several devices. Tribol. Mater. Surf. Interfaces 2020, 14, 119–129. [Google Scholar] [CrossRef]
- Eadie, D.T.; Harrison, H.; Kempka, R.; Lewis, R.; Keylin, A.; Wilson, N. Field assessment of friction and creepage with a new tribometer. In Proceedings of the 11th International Conference on Contact Mechanics and Wear of Rail/Wheel Systems, Delft, The Netherlands, 24–27 September 2018; pp. 208–217. [Google Scholar]
- Evans, M.; Lewis, R. Top-of-Rail Friction Modifier Performance Assessment: High Pressure Torsion Testing; Creep Force Modelling and Field Validation. 2022; to be submitted. [Google Scholar]
- Watson, M.; Christoforou, P.; Herrera, P.; Preece, D.; Carrell, J.; Harmon, M.; Krier, P.; Lewis, S.; Maiti, R.; Skipper, W.; et al. An analysis of the quality of experimental design and reliability of results in tribology research. Wear 2019, 426–427, 1712–1718. [Google Scholar] [CrossRef] [Green Version]
- Lewis, R.; White, B. Twin Disc Test Specifications for Assessing Top-of-Rail Product Performance, Creating Low Adhesion Layers, and Assessing Traction Gel Performance. 2021. Available online: https://www.sparkrail.org/Lists/Records/DispForm.aspx?ID=27582 (accessed on 25 May 2022).
- Lewis, R.; White, B.; Lee, Z. Full-Scale Rig Test Specifications for Assessing Top-of-Rail Product Pick-Up and Carry-Down Performance. 2021. Available online: https://www.sparkrail.org/Lists/Records/DispForm.aspx?ID=27581 (accessed on 25 May 2022).
Publisher’s Note: MDPI stays neutral with regard to jurisdictional claims in published maps and institutional affiliations. |
© 2022 by the authors. Licensee MDPI, Basel, Switzerland. This article is an open access article distributed under the terms and conditions of the Creative Commons Attribution (CC BY) license (https://creativecommons.org/licenses/by/4.0/).