1. Introduction
Life prediction of machine elements under working conditions is a basic issue in technology and engineering. With the increasing of engineering applications, major equipment such as the aero-engine, nuclear coolant pump, and gas turbine are working under more complicated working conditions and higher duty parameters [
1,
2], leading to harsh environments for key mechanical parts with tribo-pairs under mixed lubrication, including seals [
3,
4], bearings [
5] and gears [
6]. For example, the relative sliding velocity and temperature of seals in an aero-engine could be over 180 m/s and 620 °C, respectively [
7,
8]. Due to such strict conditions, the wear level is aggravated; thus, the probability of wear failure has been increased remarkably and becomes the main failure form for these key mechanical parts [
9,
10]. It is estimated that 70–80% failures of seals in aero-engines are the result of wear [
2,
7,
8]. Considering that wear failure is the main limit for the life of these mechanical parts, it is reasonable to predict life from the perspective of wear prediction.
An appropriate and accurate wear model is required to predict the wear amount with certain duty parameters and wear duration. More than 300 kinds of quantitative wear models have been proposed with consideration of over 100 kinds of influence factors to date [
11,
12]. Among these models, the dissipation wear model based on the frictional thermodynamics proves accurate wear prediction [
13,
14]. In terms of physical concepts, the wear process is regarded as an irreversible thermodynamic degradation process of the material and is evaluated by entropy increase, conforming to the physical intrinsic properties of wear [
15,
16,
17,
18,
19,
20,
21]. As for mathematical form, a brief linear relationship between wear amount and entropy increase between solids is revealed under different lubrication conditions, including dry friction, grease lubrication, boundary lubrication, and mixed lubrication [
5,
22,
23,
24,
25,
26]. In addition, the wear process at a micro scale could be described by a dissipation wear model, presenting multi-scale properties [
27,
28]. Hence, the dissipation wear model is selected as the fundamental theoretical model in this paper.
Another issue for wear life prediction is the constantly increasing wear life test duration due to progressions in abrasive resistance technologies such as surface modification [
29], structure modification [
30] and new materials [
31], although the available test time is generally limited to a much shorter duration than the wear life under common duty parameters [
32,
33,
34]. Hence, long life test duration of a traditional 1:1 simulation test with relatively low duty parameters could not be acceptable [
32,
33,
34]. The accelerated wear test methods are required to shorten the life test duration instead.
The key of the accelerated wear test is selecting an appropriate physical or mathematical quantity as the equivalent of wear, meaning a quantitative relationship should be revealed between such equivalent and wear amount. By modifying the ‘stress levels’ of the duty parameters, the rate of the equivalent could be increased, resulting in increasing of the wear rate and acceleration of the test duration. A few equivalents of wear have been investigated, including failure probability [
35,
36,
37], surface topography [
38] and temperature [
39,
40]. However, existing accelerated wear test methods have not been investigated with quantitative wear models as basics yet, leading to an insufficiency in theoretical supports and feasibility.
For this reason, an accelerated wear test method based on a dissipation wear model is proposed in this paper. Both theoretical deduction and experimental verification are presented for the following contents: a dissipation wear model under mixed lubrication condition, an accelerated wear test method based on this quantitative model, and design of the test based on entropy gradient analysis.
3. Experimental Verification
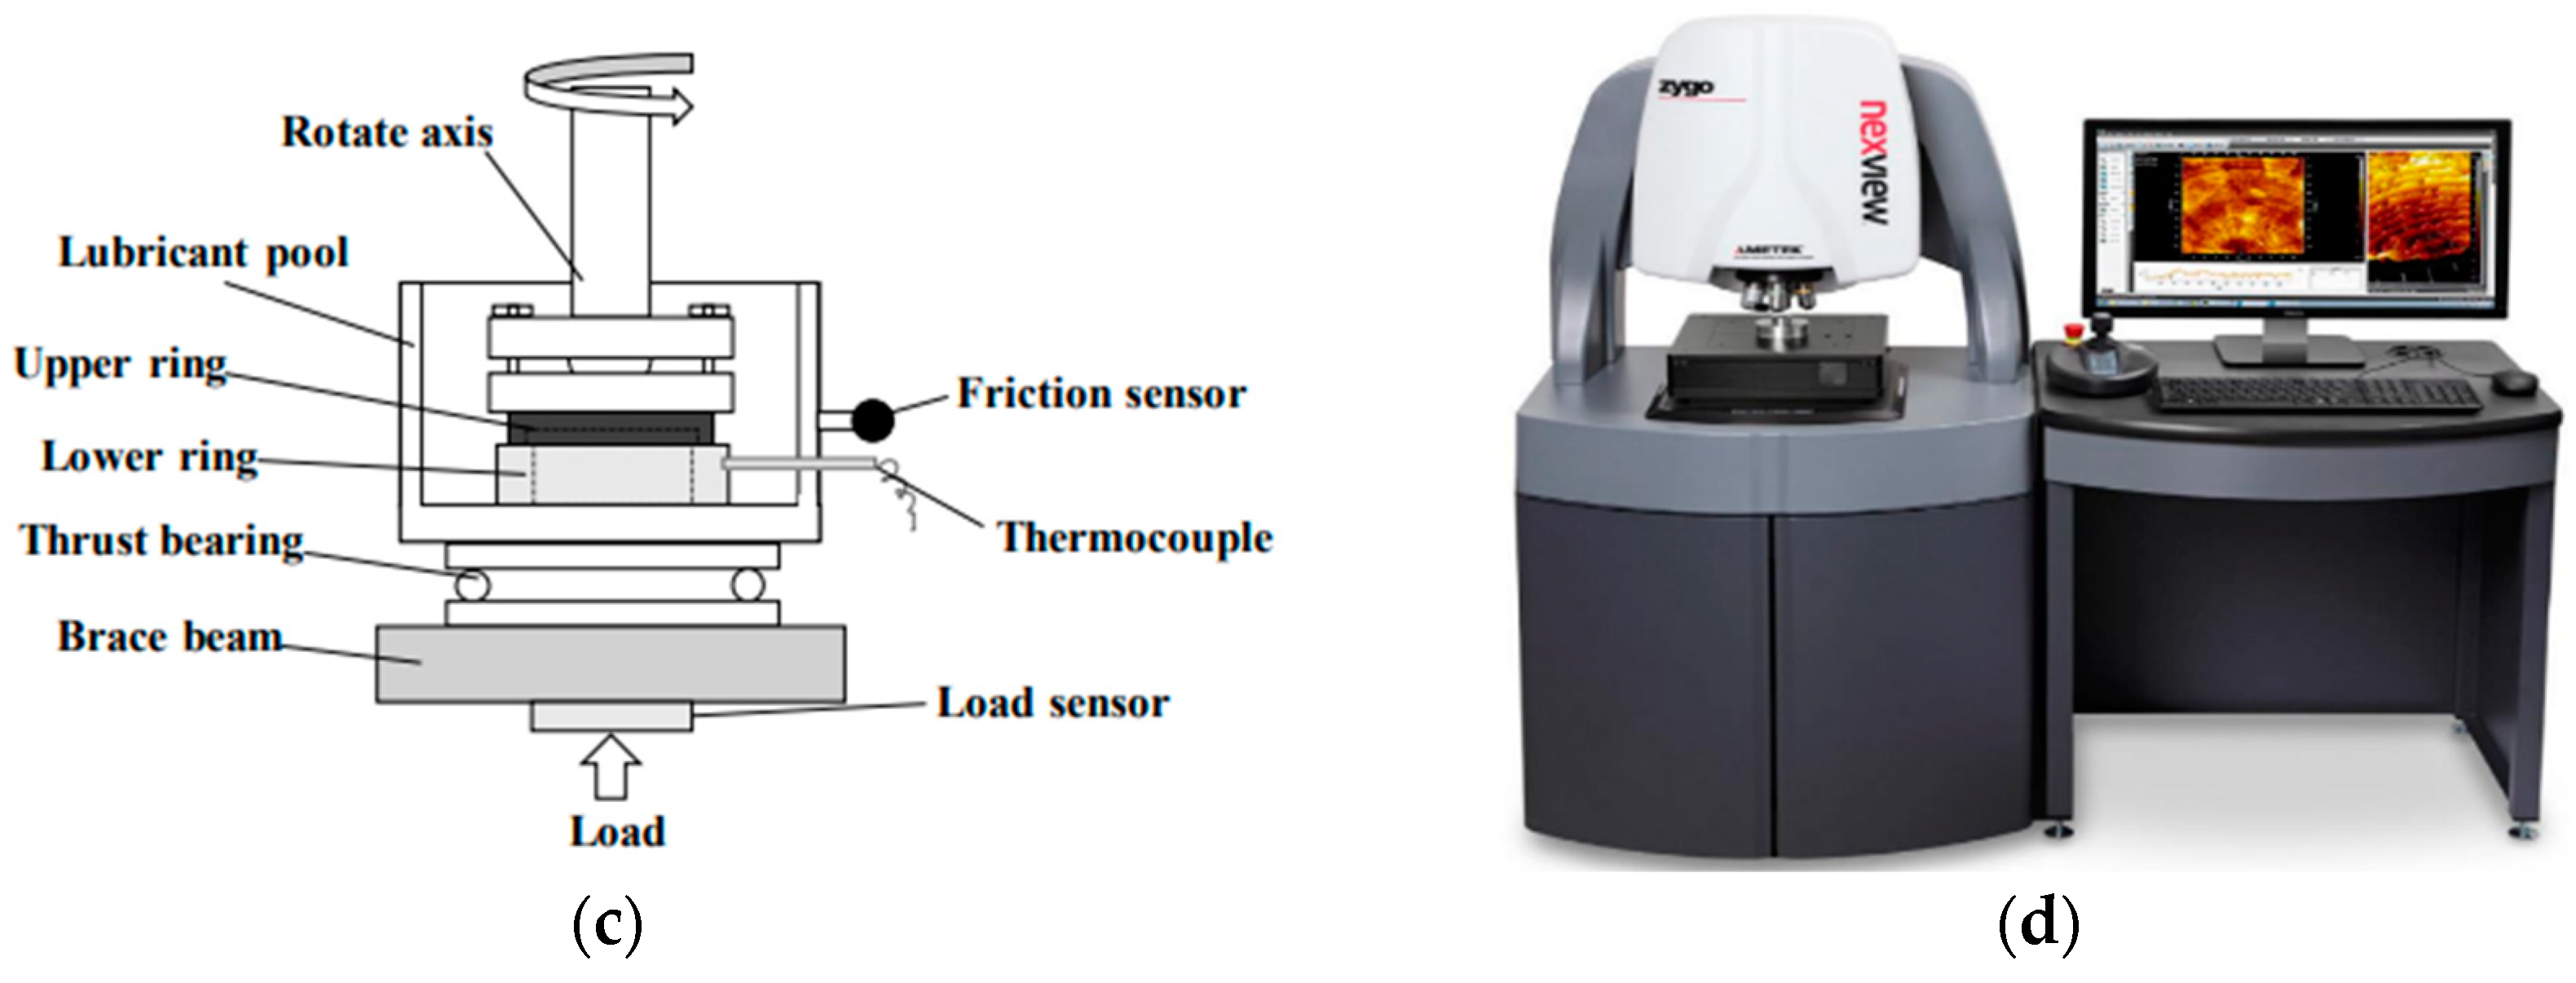
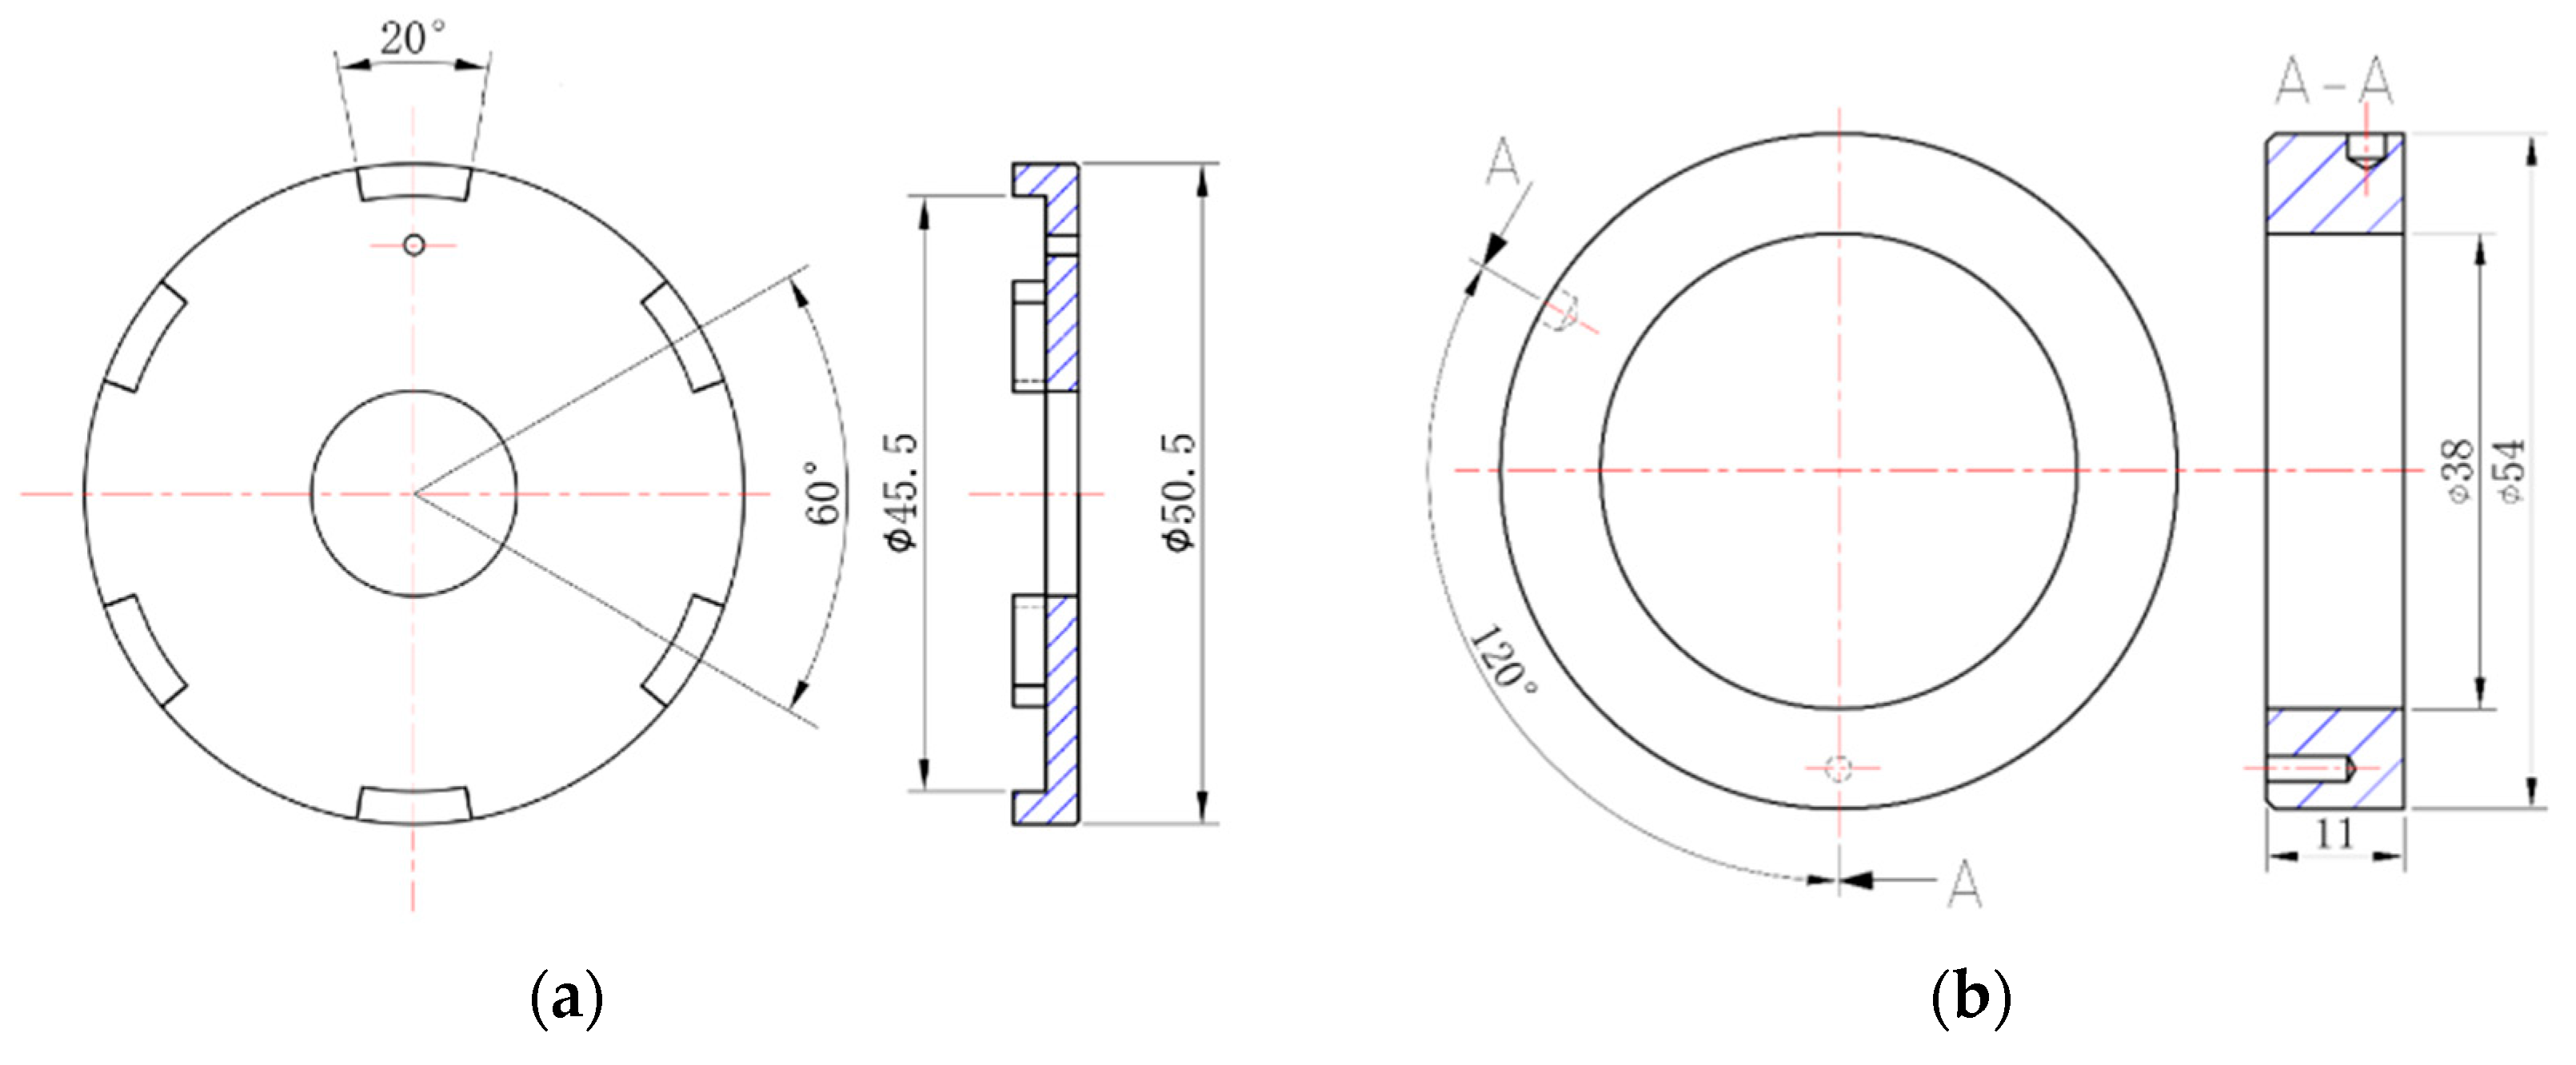
In this section, an example of an accelerated wear test is conducted to verify the method proposed in this paper. A stainless steel-graphite tribo-pair is tested on the Plint TE-92 standard tester (Phoenix Tribology, Kingsclere, UK) for wear experiment under mixed lubrication condition. The friction coefficient is calculated by the load and friction torque measured, respectively, by the load cell and torque sensor of the tester. The thermocouple of the tester could measure the temperature of the sample surface through a machined hole on the sample. The drawings of samples and tester are shown in
Figure 2.
The results are obtained from the Zygo Nex View white light interferometer by measuring the average depth of the wear scratch. The wear amount is presented by the soft graphite material volume wiped off by the opposite hard stainless steel material in the wear process, while the wear rate is defined as the ratio of wear volume and total wear distance.
3.1. Dissipation Wear Model Verification
The Stribeck curve of the tribo-pair is measured firstly to determine the duty parameter range of the mixed lubrication regime, since such a range is required to calculate the load-sharing factors. The test parameters and corresponding results for the Stribeck curve are shown in
Table 1, while the calculated load-sharing factors are shown in
Table 2.
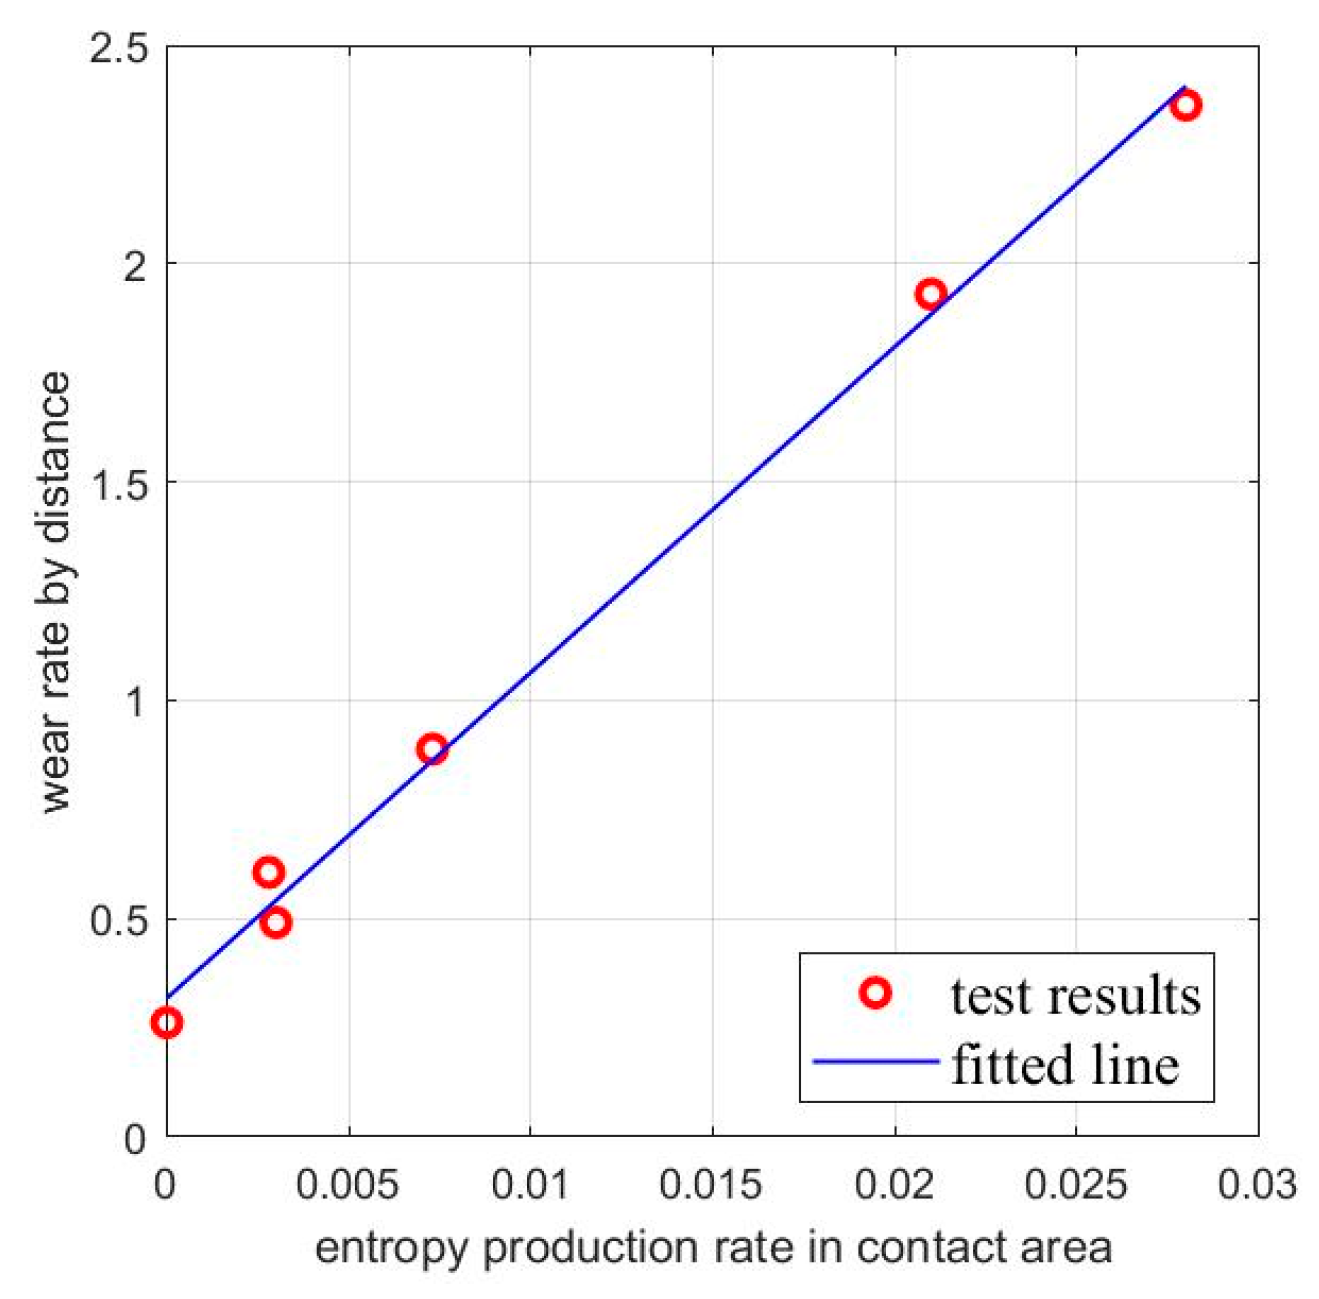
The dissipation wear model under mixed lubrication conditions is verified by a series of standard wear tests, of which the entropy increase rate in the contact area is obtained by Equation (14) and the parameters in
Table 1 and
Table 2. Results data are shown in
Table 3.
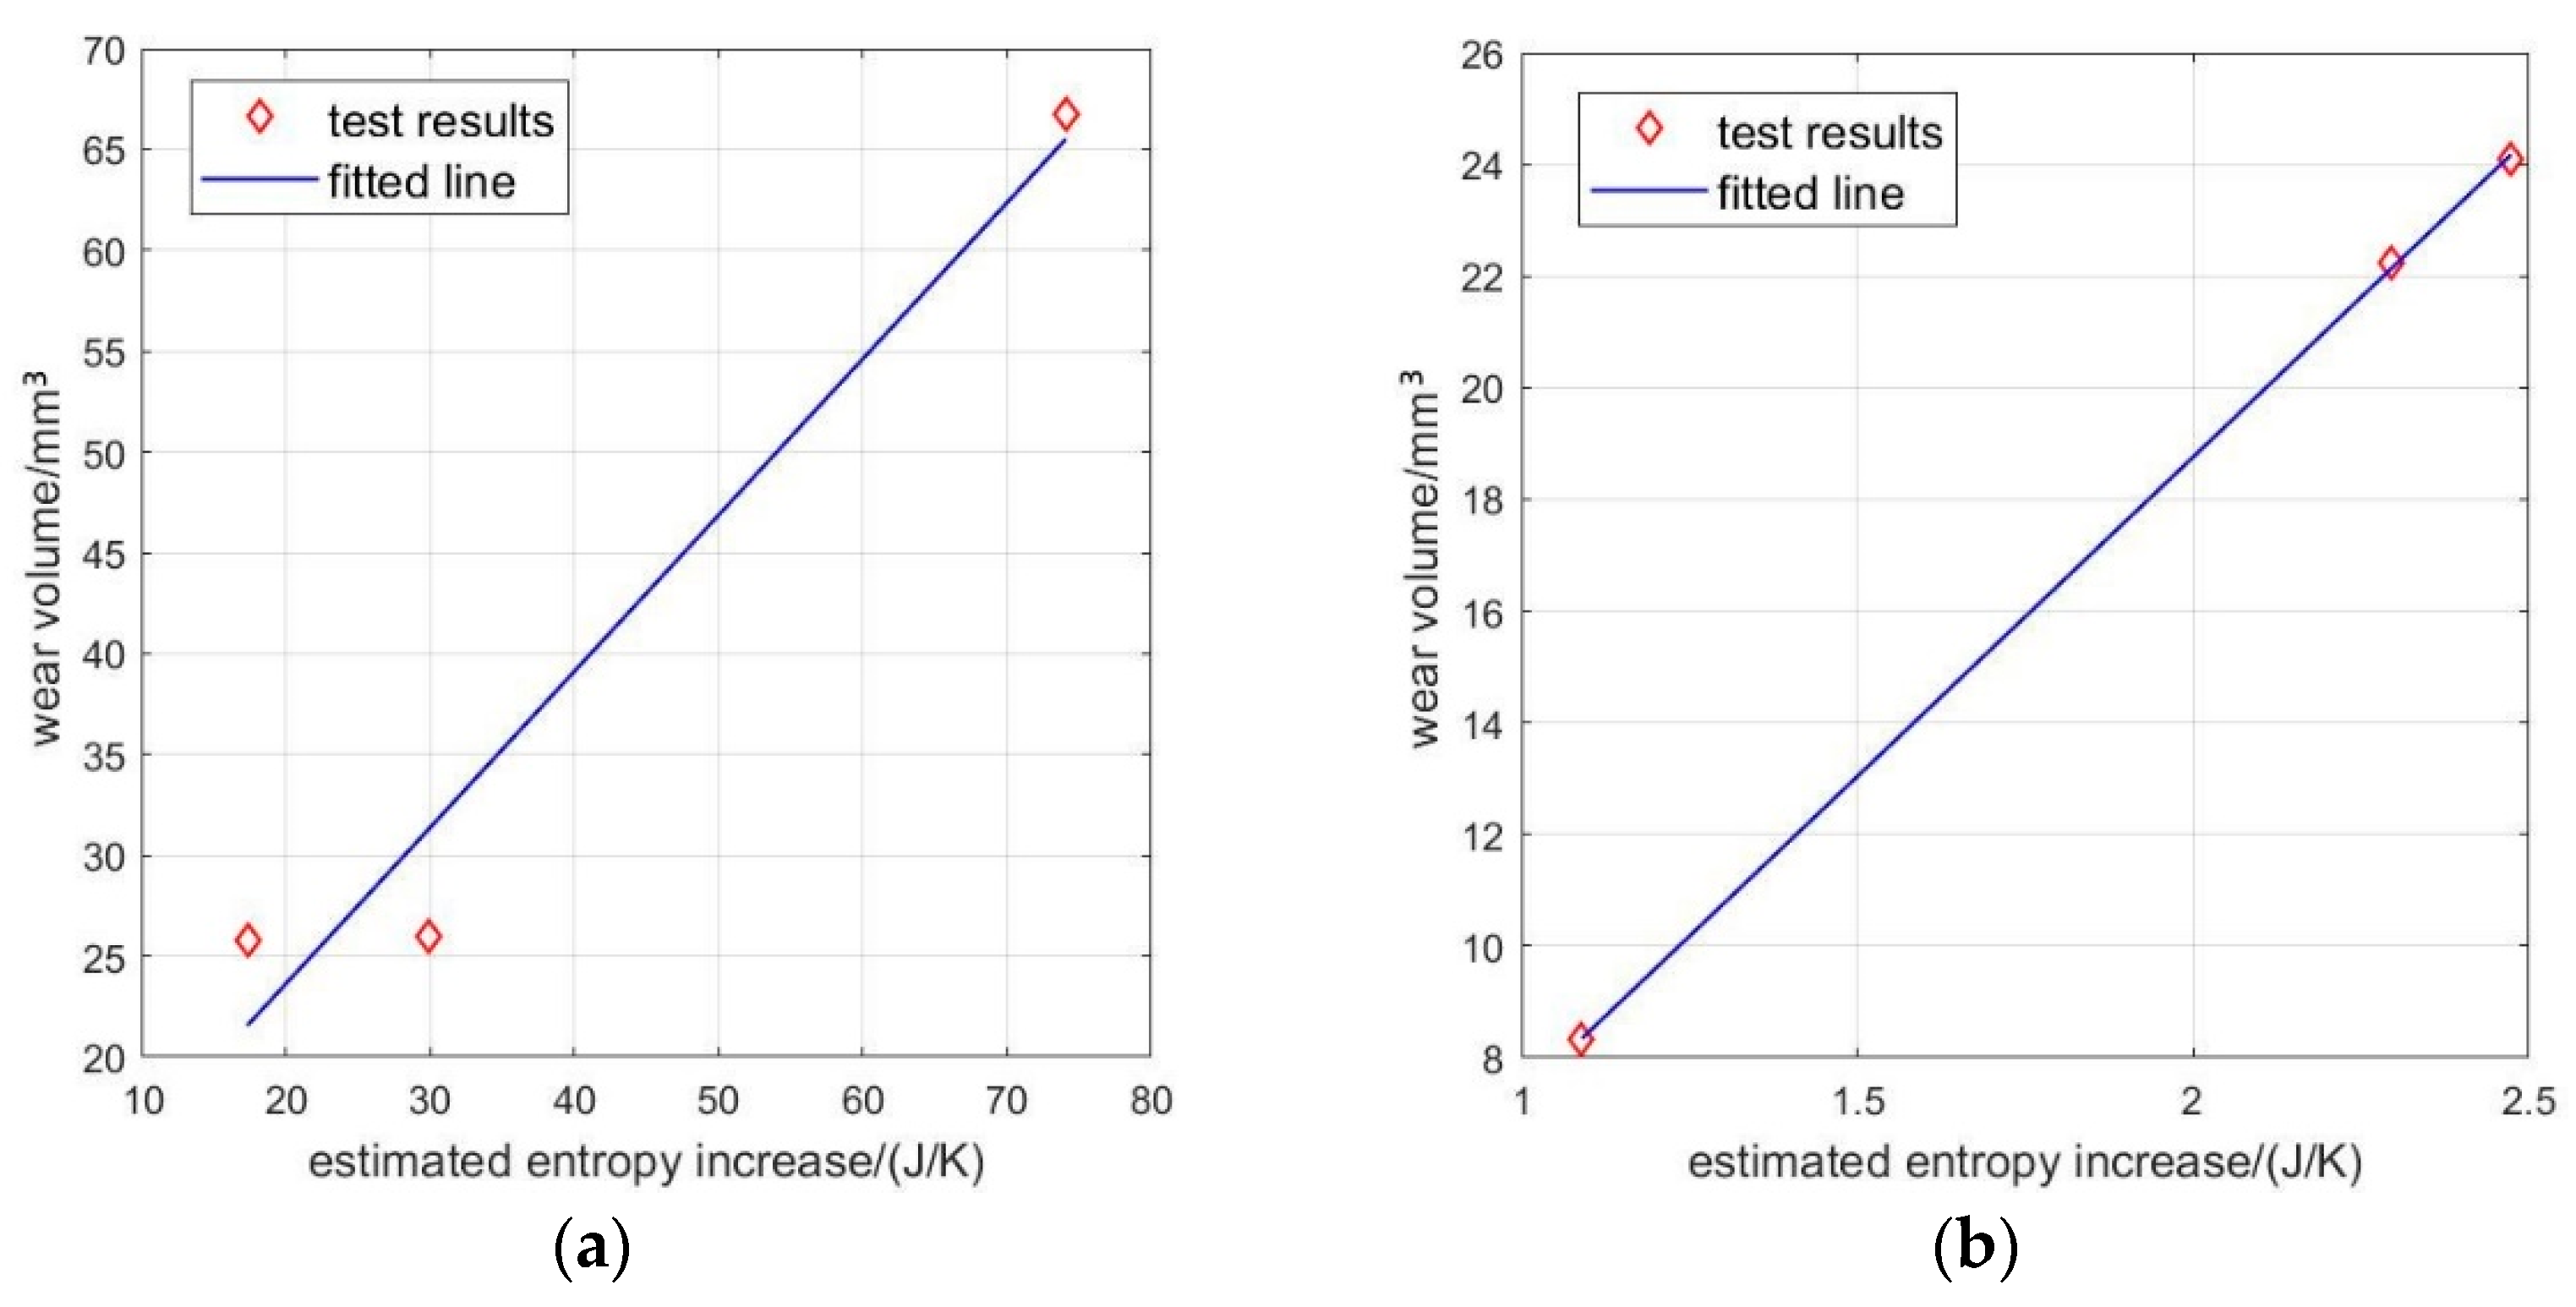
From the data in
Table 3, a remarkable linear relationship (see Equation (35)) could be revealed from the fitted function between the wear rates and the entropy increase rates in the contact area; see
Figure 3.
In summary, the expected linear relationship of the dissipation wear model under mixed lubrication conditions is verified in this section.
3.2. Accelerated Wear Test Verification
With the verification of the model above, the entropy increase could be regarded as an equivalent of wear amount under mixed lubrication conditions. On this basis, a series of further standard tests are conducted to verify the accelerated wear test method suggested in
Section 2.2.
Under the same entropy increase amount that corresponds to the equal wear effect, a group of accelerated wear tests with different expected test durations and inversely proportional entropy increase rates are designed with different duty parameters, as shown in
Table 4.
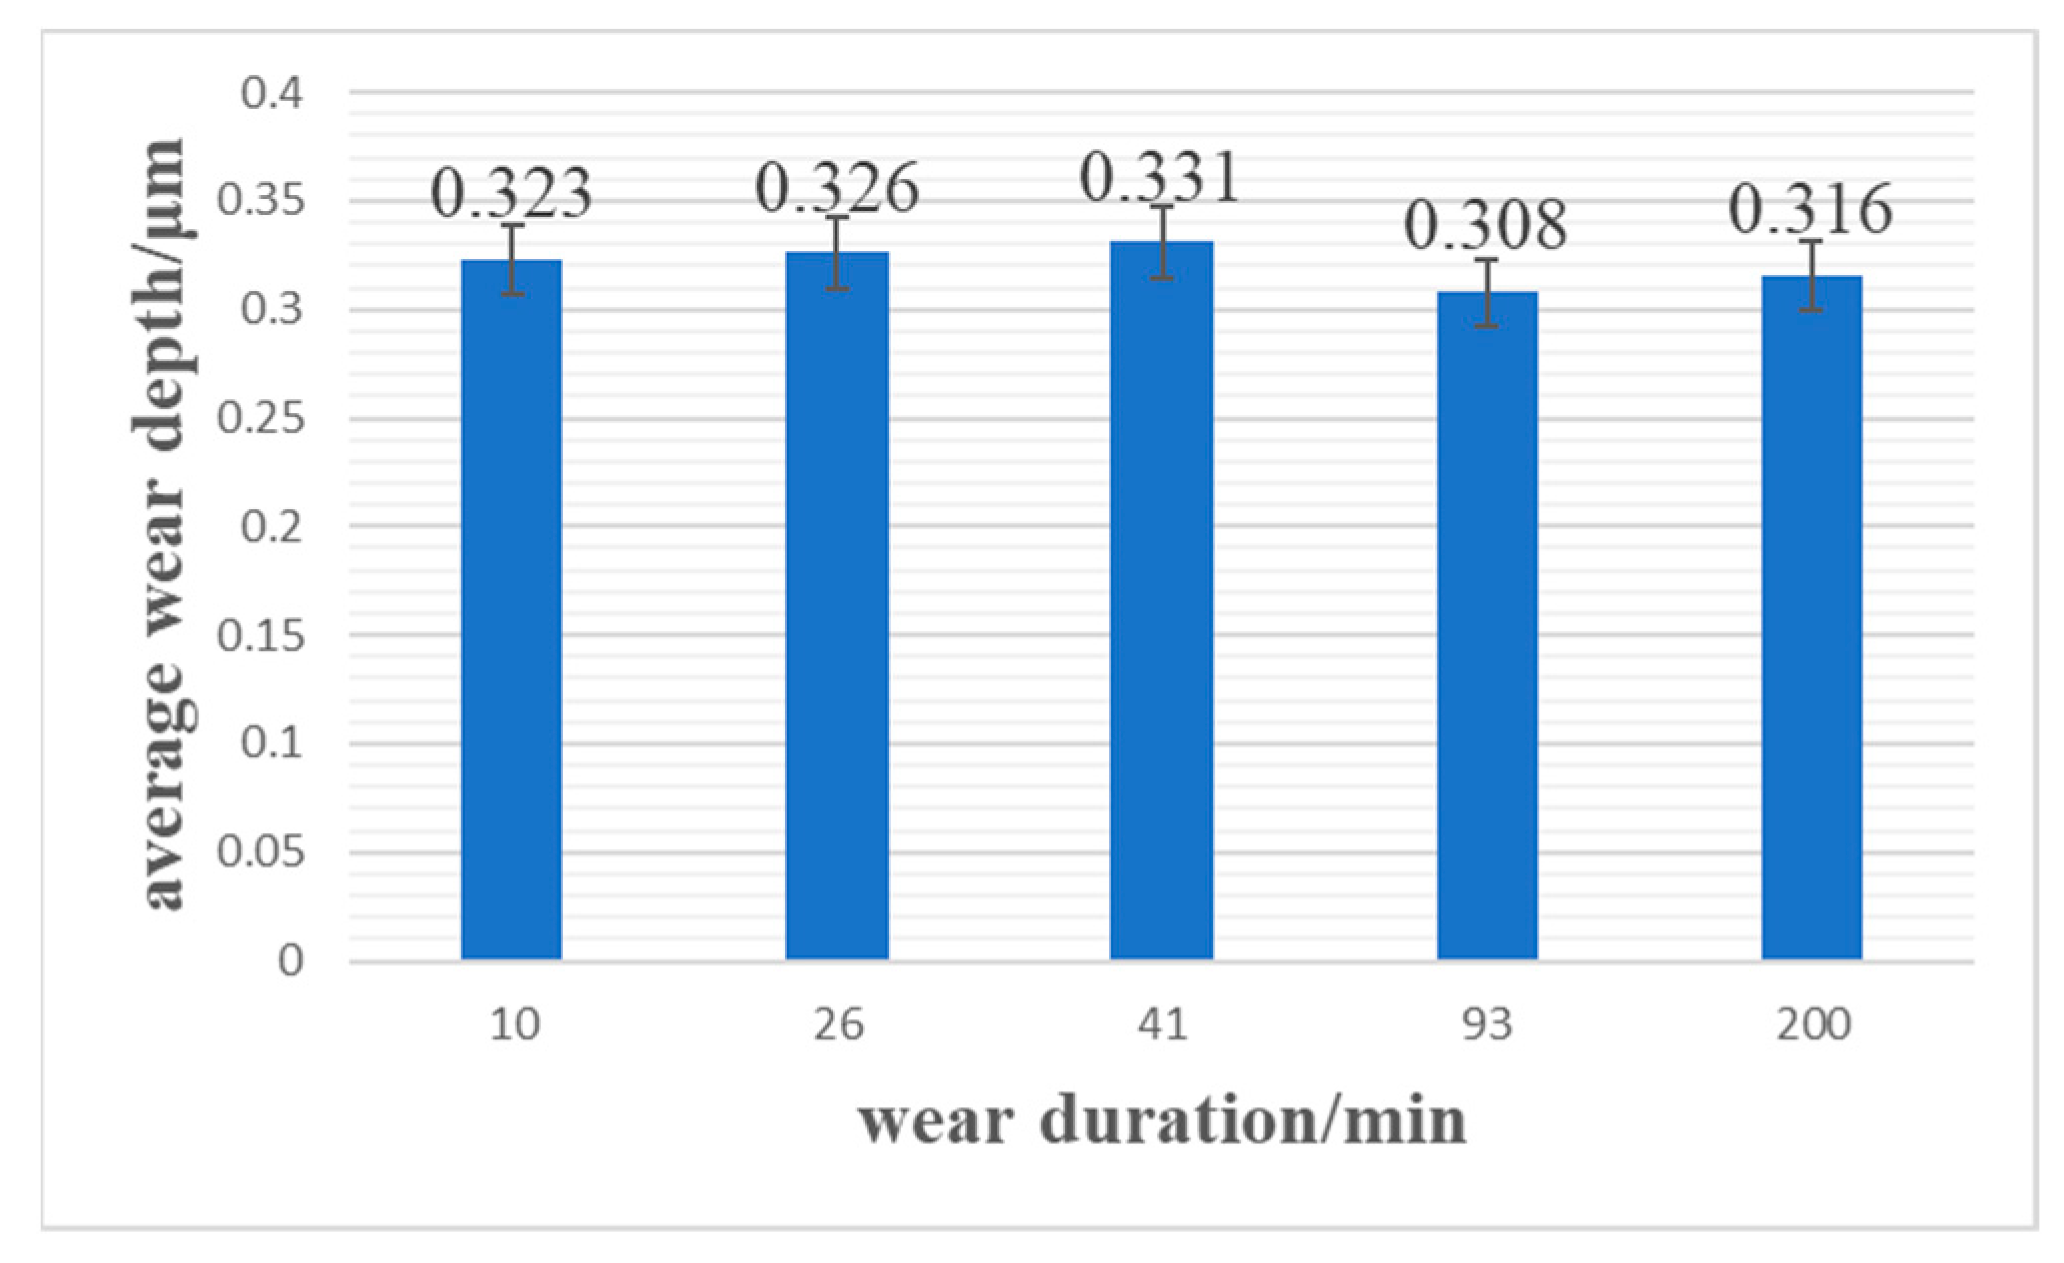
Each test will be conducted under the set duty parameters for the expected duration; then, wear depth will be measured to calculate the wear amount. The feasibility of the proposed method is estimated by comparing the obtained wear amounts under different entropy increase rates.
As shown in
Figure 4, acceptable errors of the test results are obtained between tests with different duty parameters, revealing that the accelerated wear test method based on a dissipation wear model could be used to shorten the wear test duration. The largest acceleration time in these test is 20, with a relative error of wear amount less than 5%.
3.3. Discussion of Linear Fitting
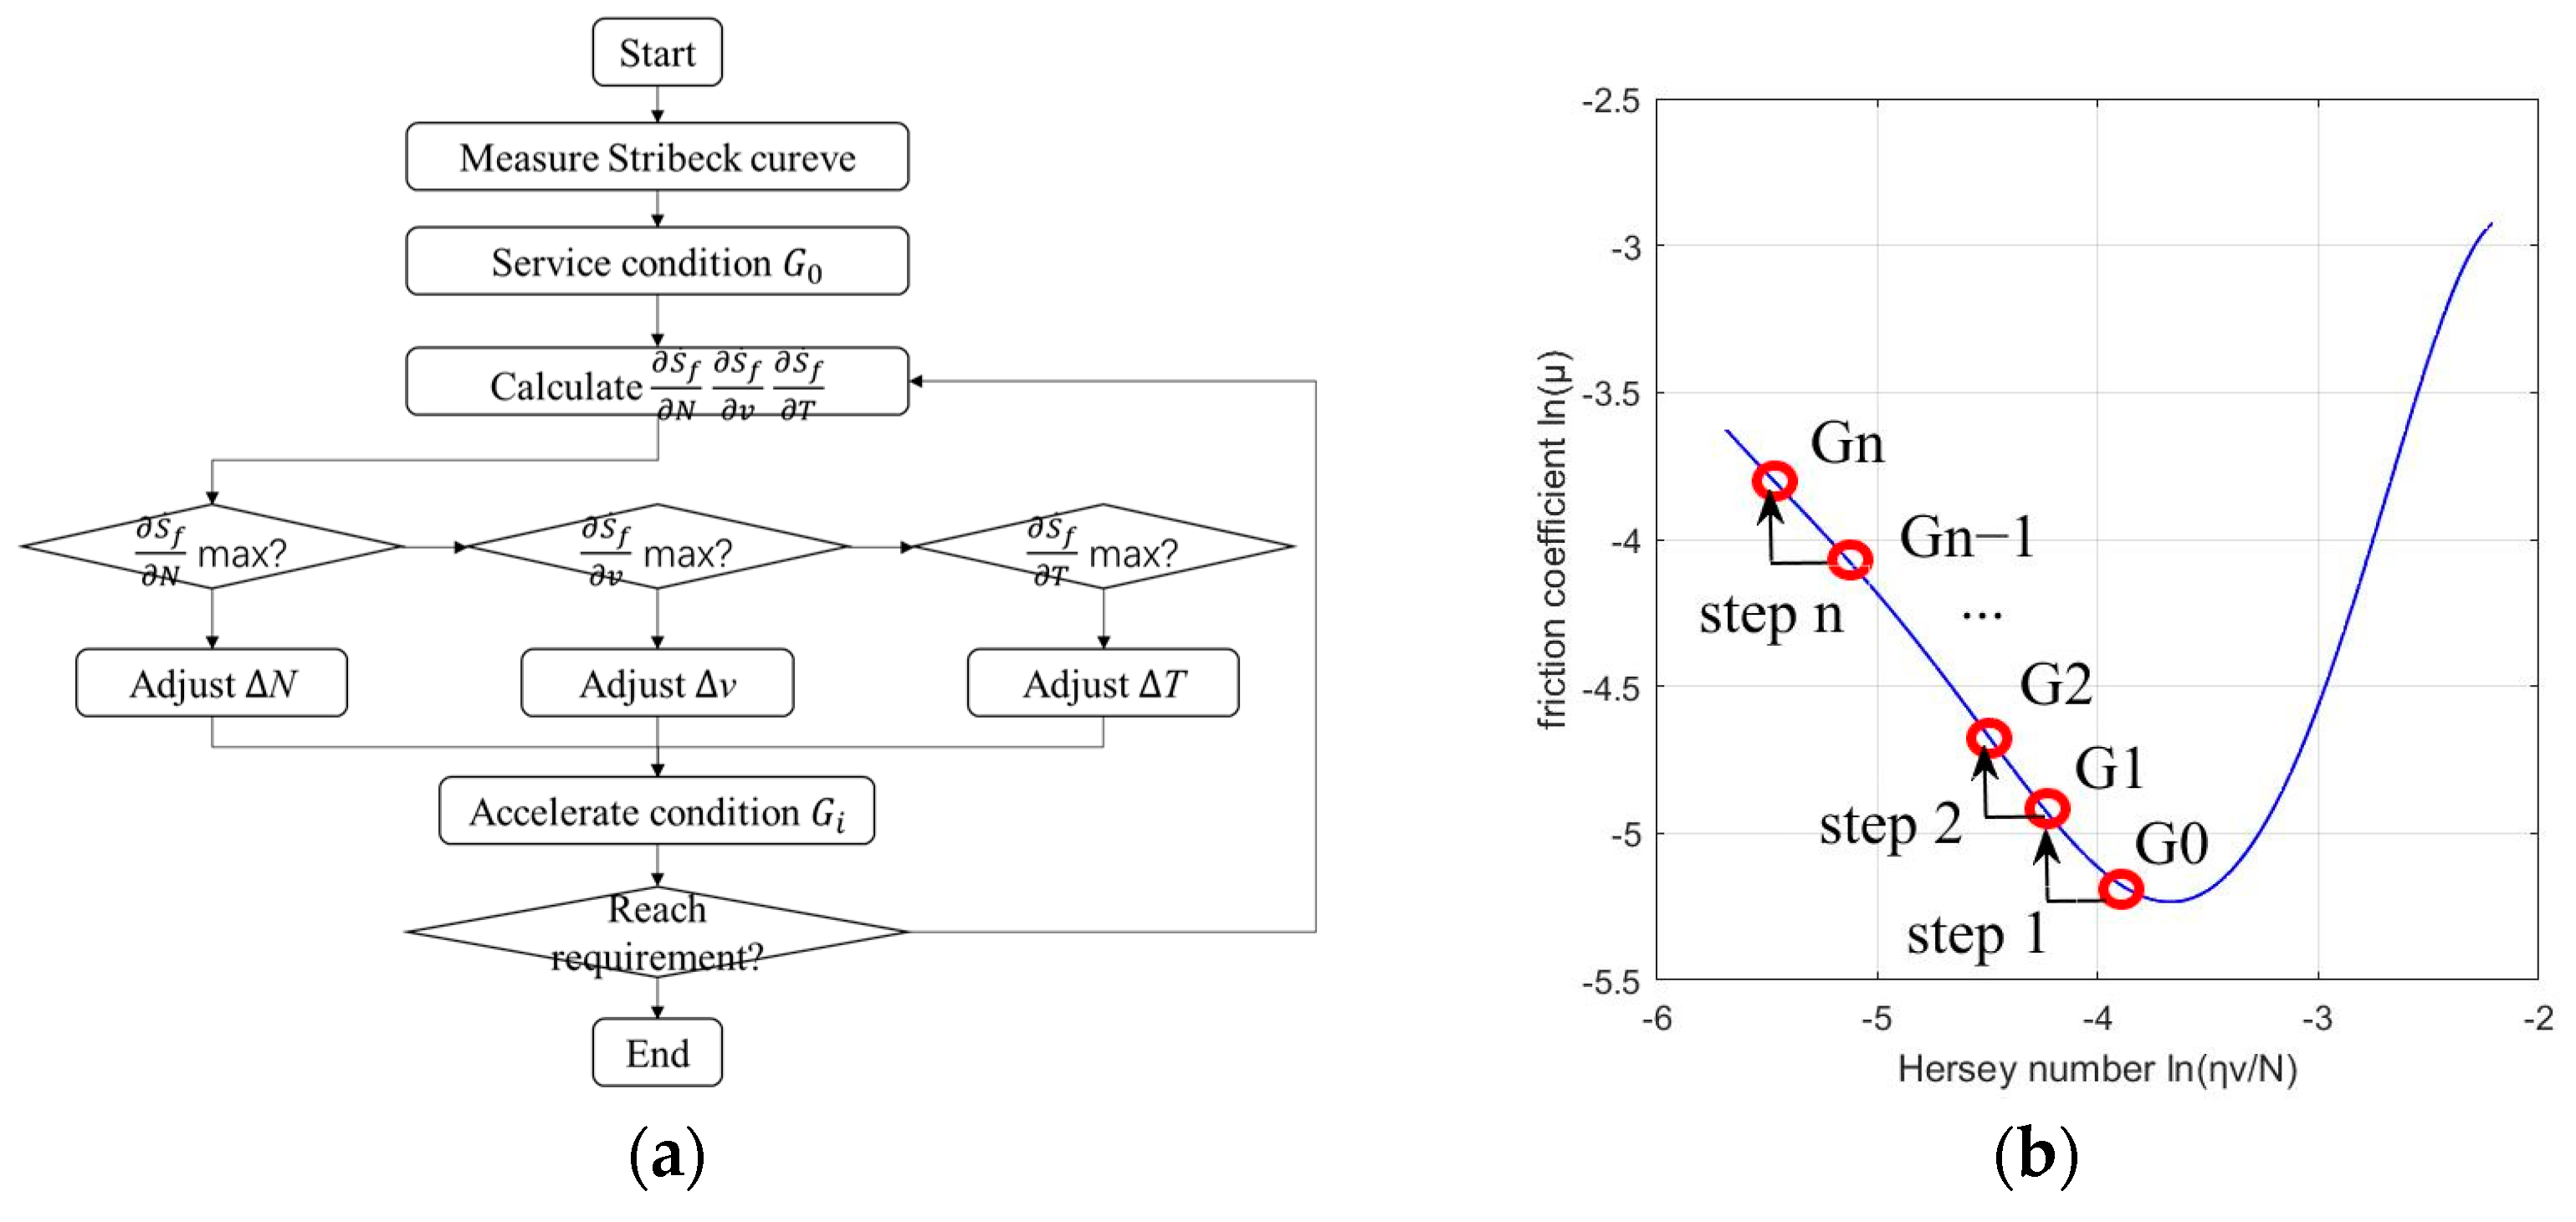
The sliding velocity is selected as the adjustment parameter to accelerate the tests in
Section 3.2. Here, the basis of such selection will be discussed, and a design method to decide the fastest acceleration parameter by entropy gradient analysis will be proposed.
By substituting the data in
Table 1 and
Table 2 into Equations (24) and (25), a fitted linear function could be obtained for the friction coefficient and the load-sharing factor, as shown in
Figure 5.
The fitted
function and
function are shown as Equations (36) and (37).
It could be reveled from
Figure 5 that there are considerable errors in the linear fitting; thus, the implication of such errors for the accelerated wear test will be discussed in this section.
The interpolation method shown as Equation (9) could be presented as a
linear function.
Since the value of
and the value of
, Equation (39) could be presented.
If further simplification is conducted assuming that
closes to zero, the
would be in direct proportion with
.
The relative error
of load-sharing factor
could be correspondingly derived when there is a relative error
for friction coefficient
.
The effect of such an error is shown in Equations (43) and (44).
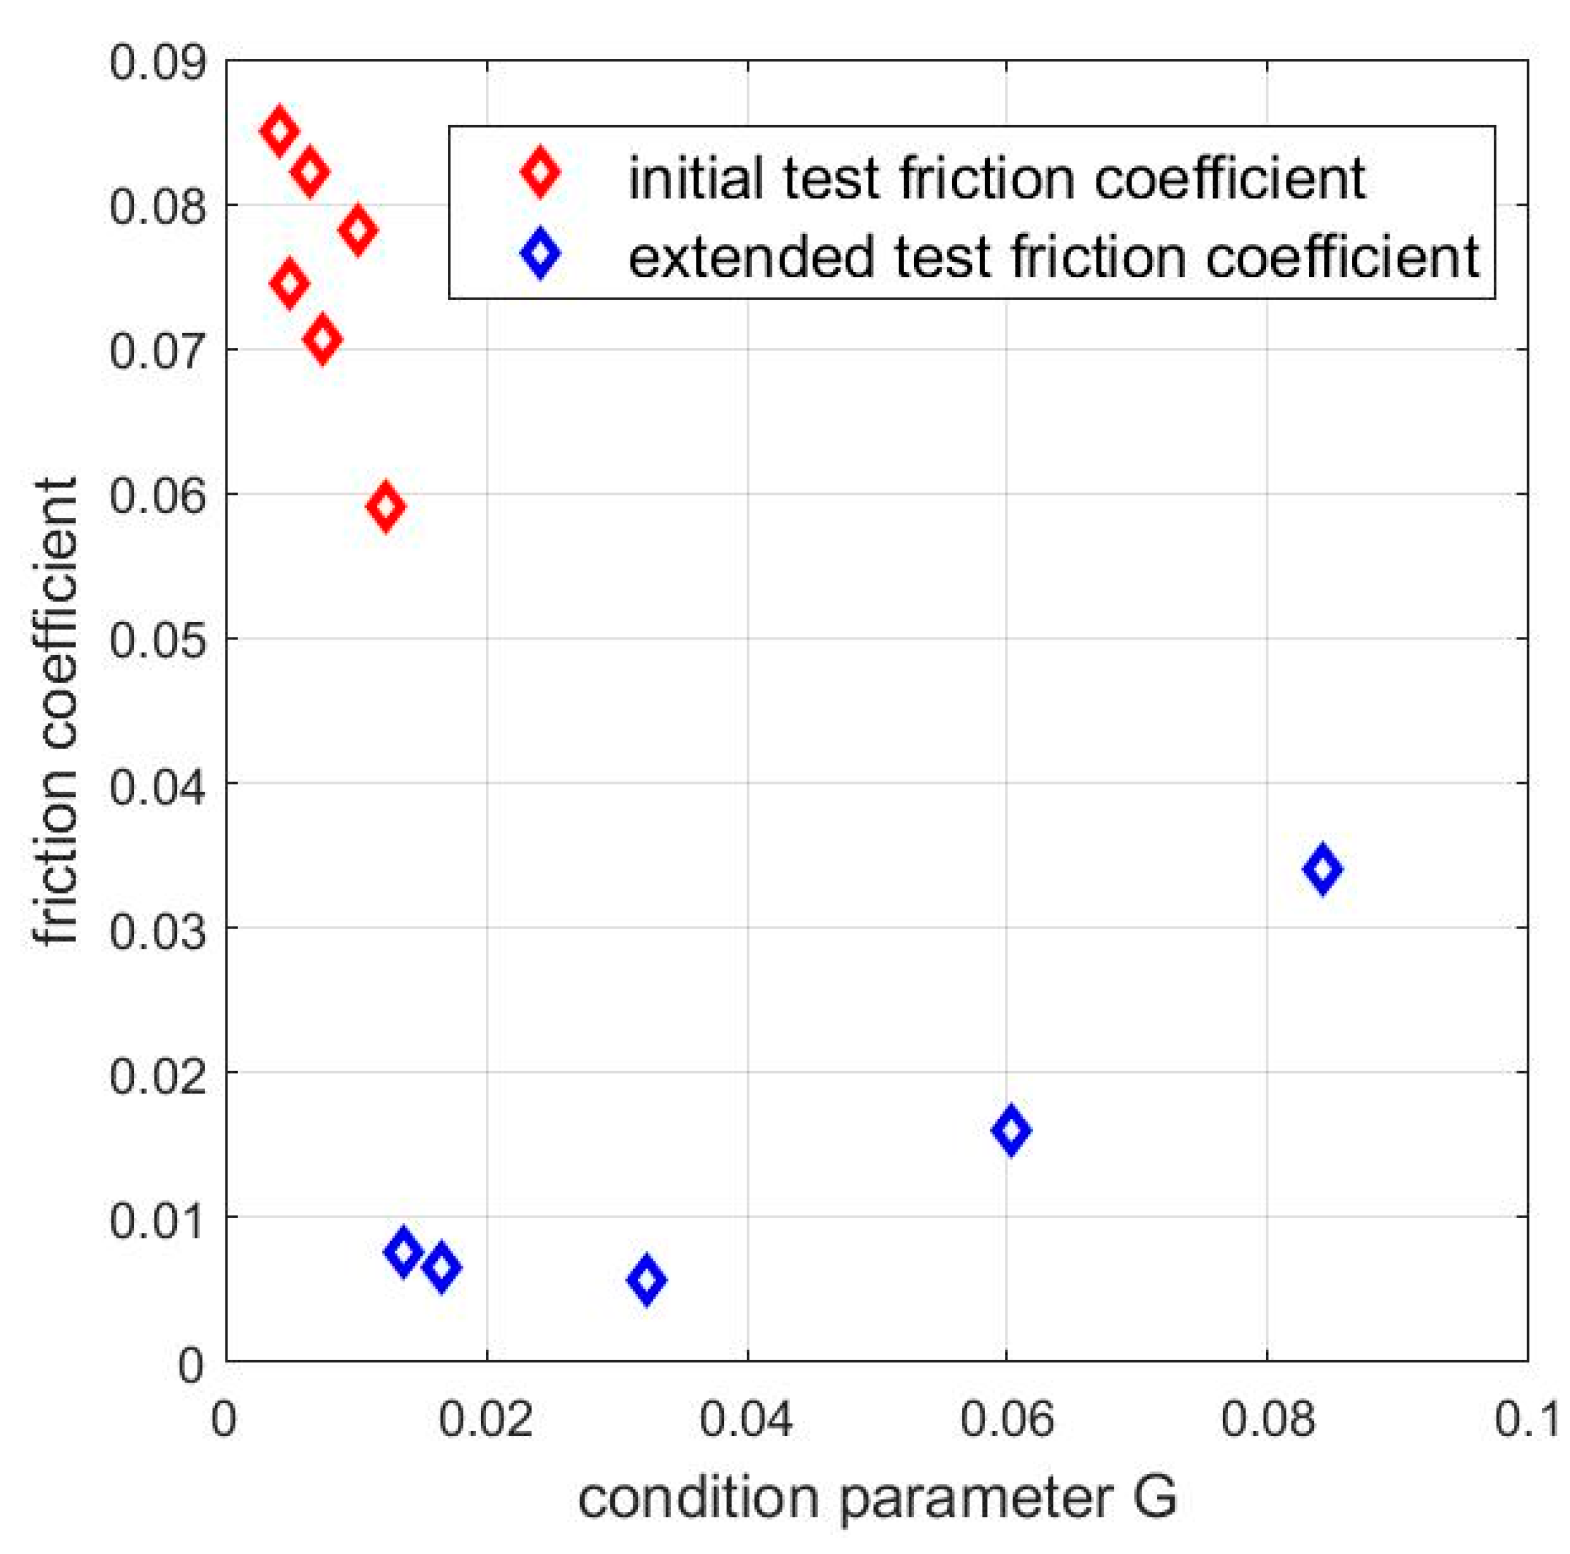
The turning point of the Stribeck curve could be found with extended test, as shown in
Figure 6. The
is an order of magnitudes less than
, so that the assumption of Equation (40) could be satisfied.
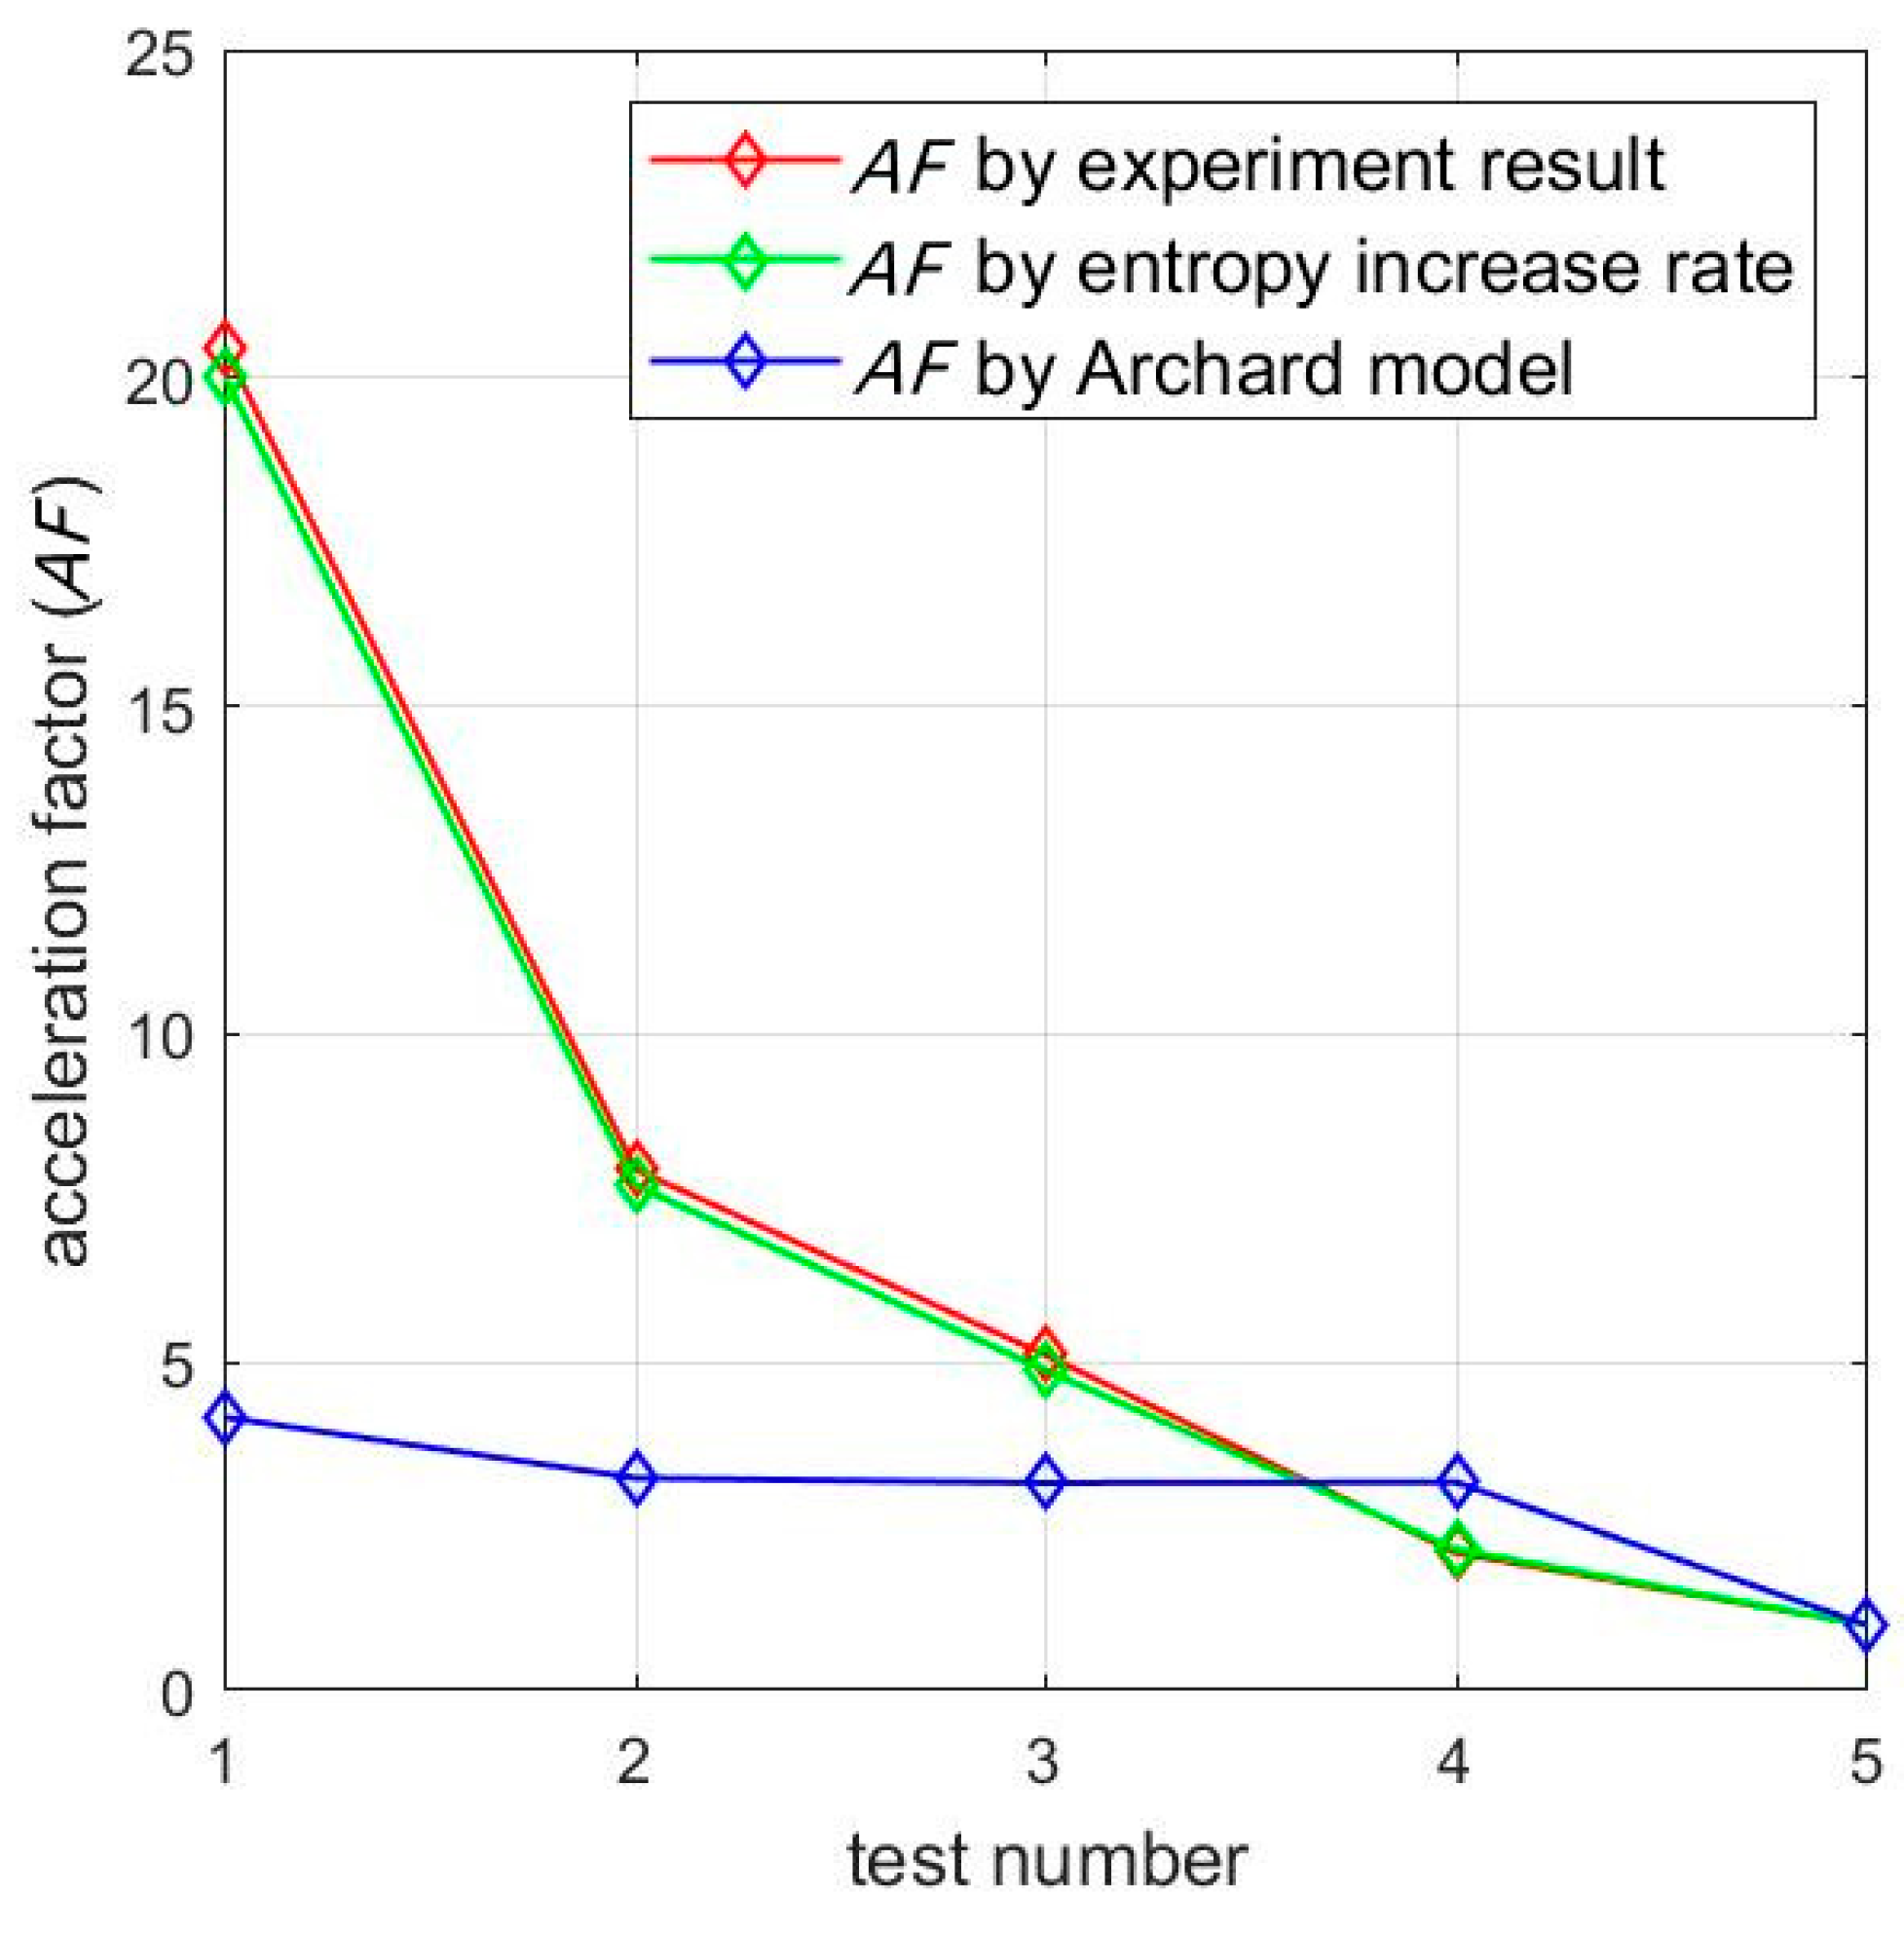
Since the relative error of
for the accelerated wear test in this paper are all close to the same value shown in
Figure 7a, the error items in Equation (44) could be eliminated, so that the
AF is basically accurate, although large errors exist in the linear fitting of Equations (36) and (37), as shown in
Figure 7b; the detailed data are listed in
Table 5. Such insensitivity of
AF to error is an advantage of the accelerated wear test method proposed in this paper. However, the prediction of wear still requires accurate measurement and calculation of friction coefficient
and load-sharing factor
, which will be a significant issue in further investigations.
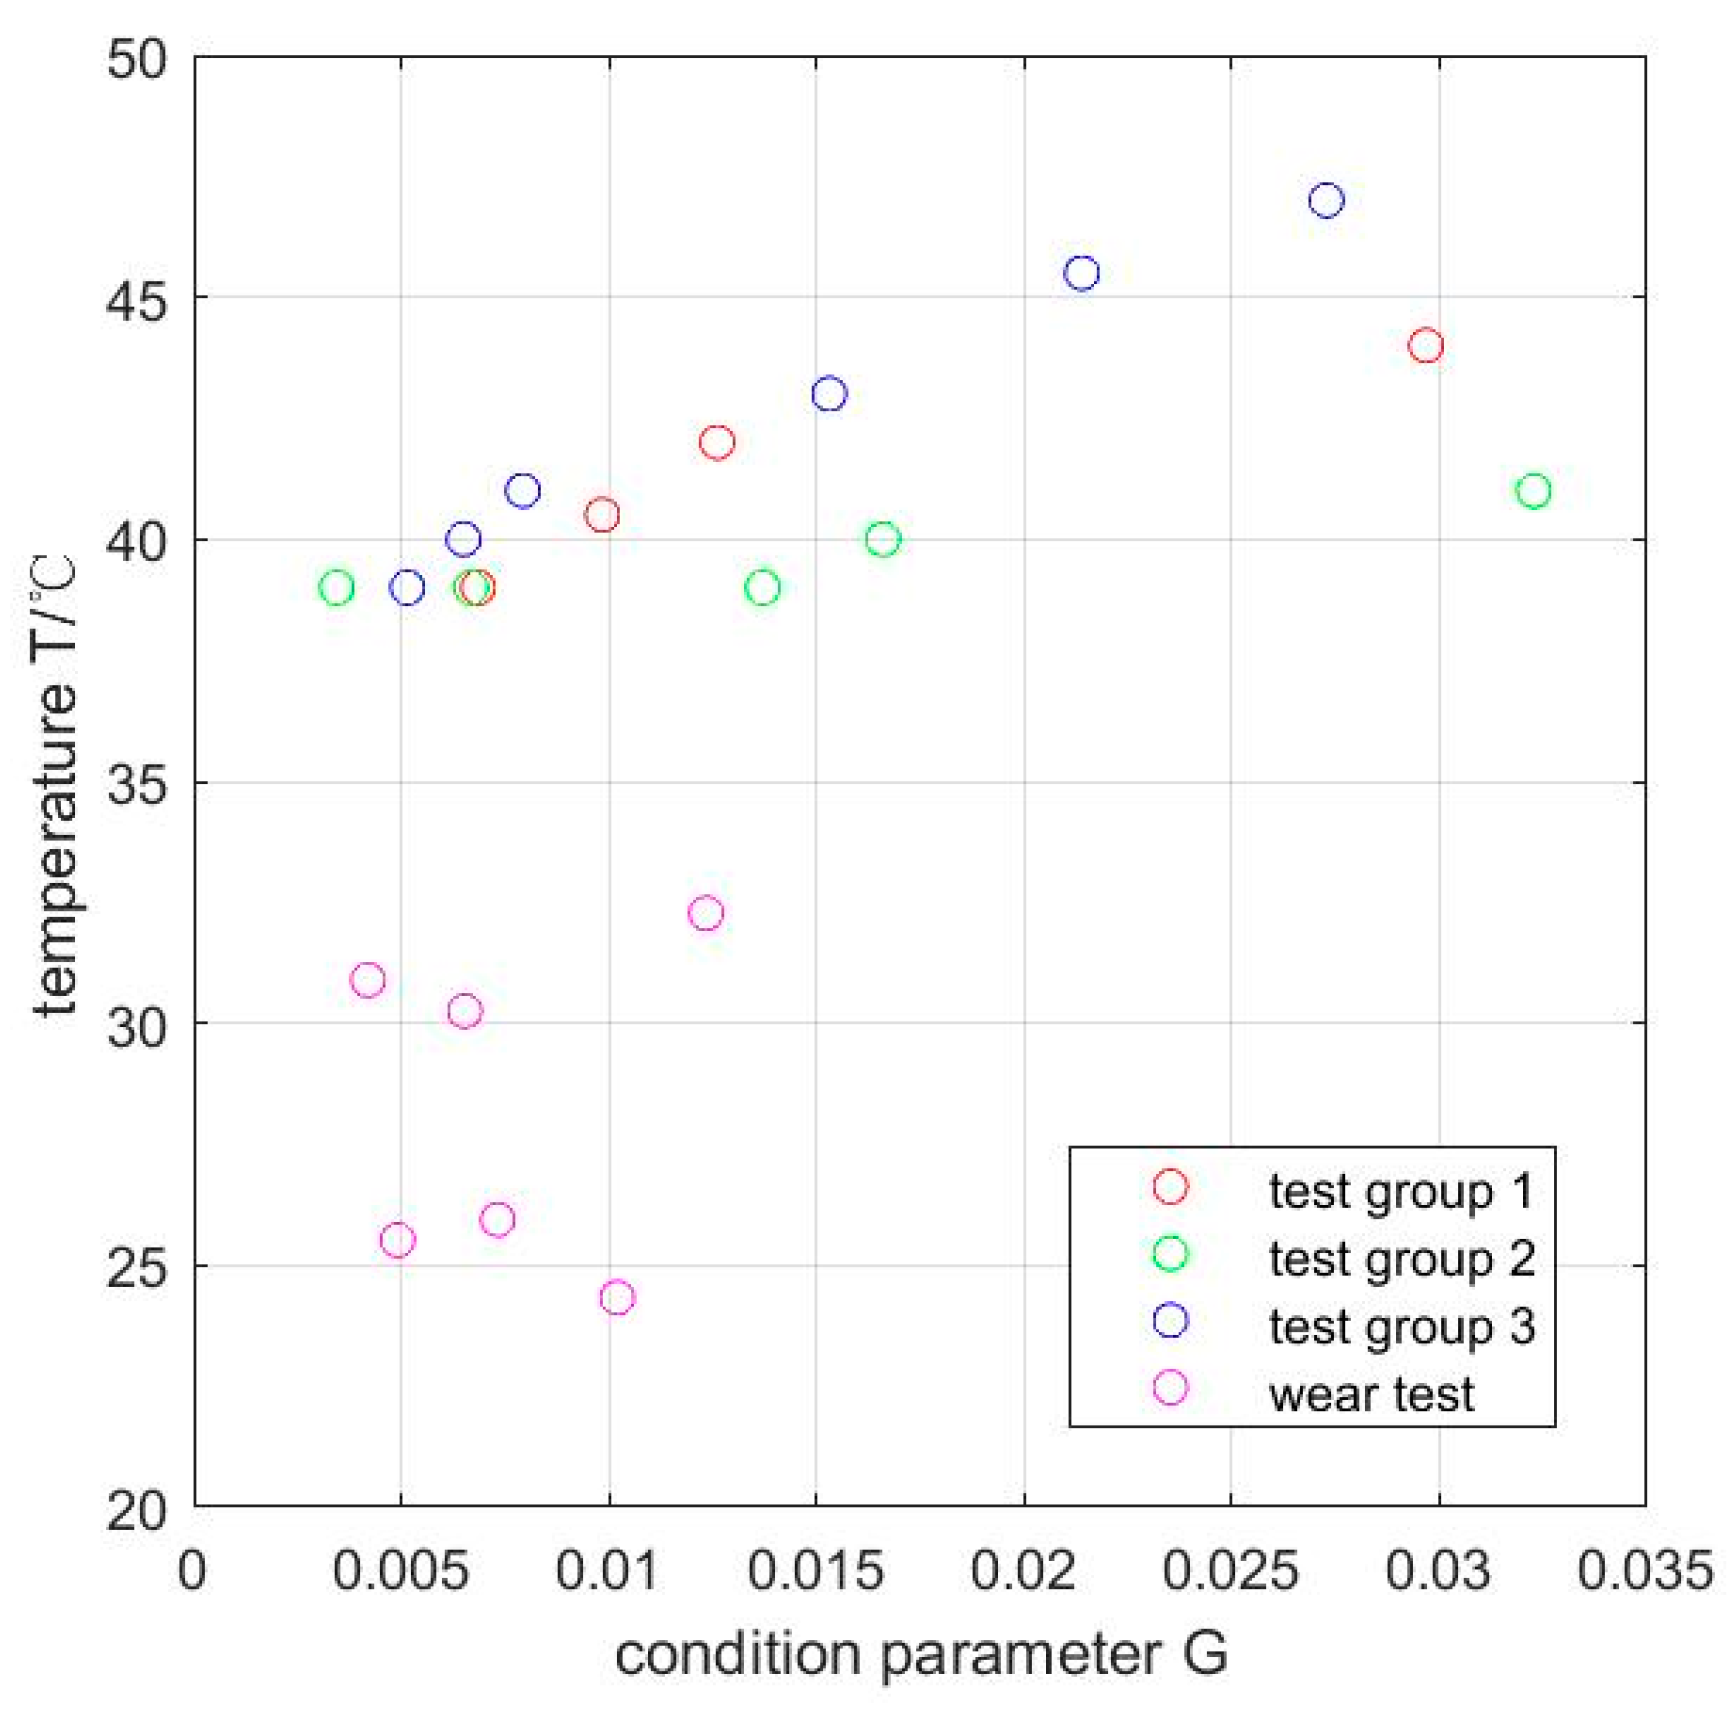
3.4. Discussion of Entropy Gradient
Among the duty parameters that decide the value of
G, few changes have been observed from the temperature with the change of
G in repeated tests for measurement of the Stribeck curve under mixed lubrication, as shown in
Figure 8.
Hence, the temperature could be concerned as a constant for tests in this paper so that the entropy increase rate could be simplified as a function with double variants: the sliding velocity
v and the normal load
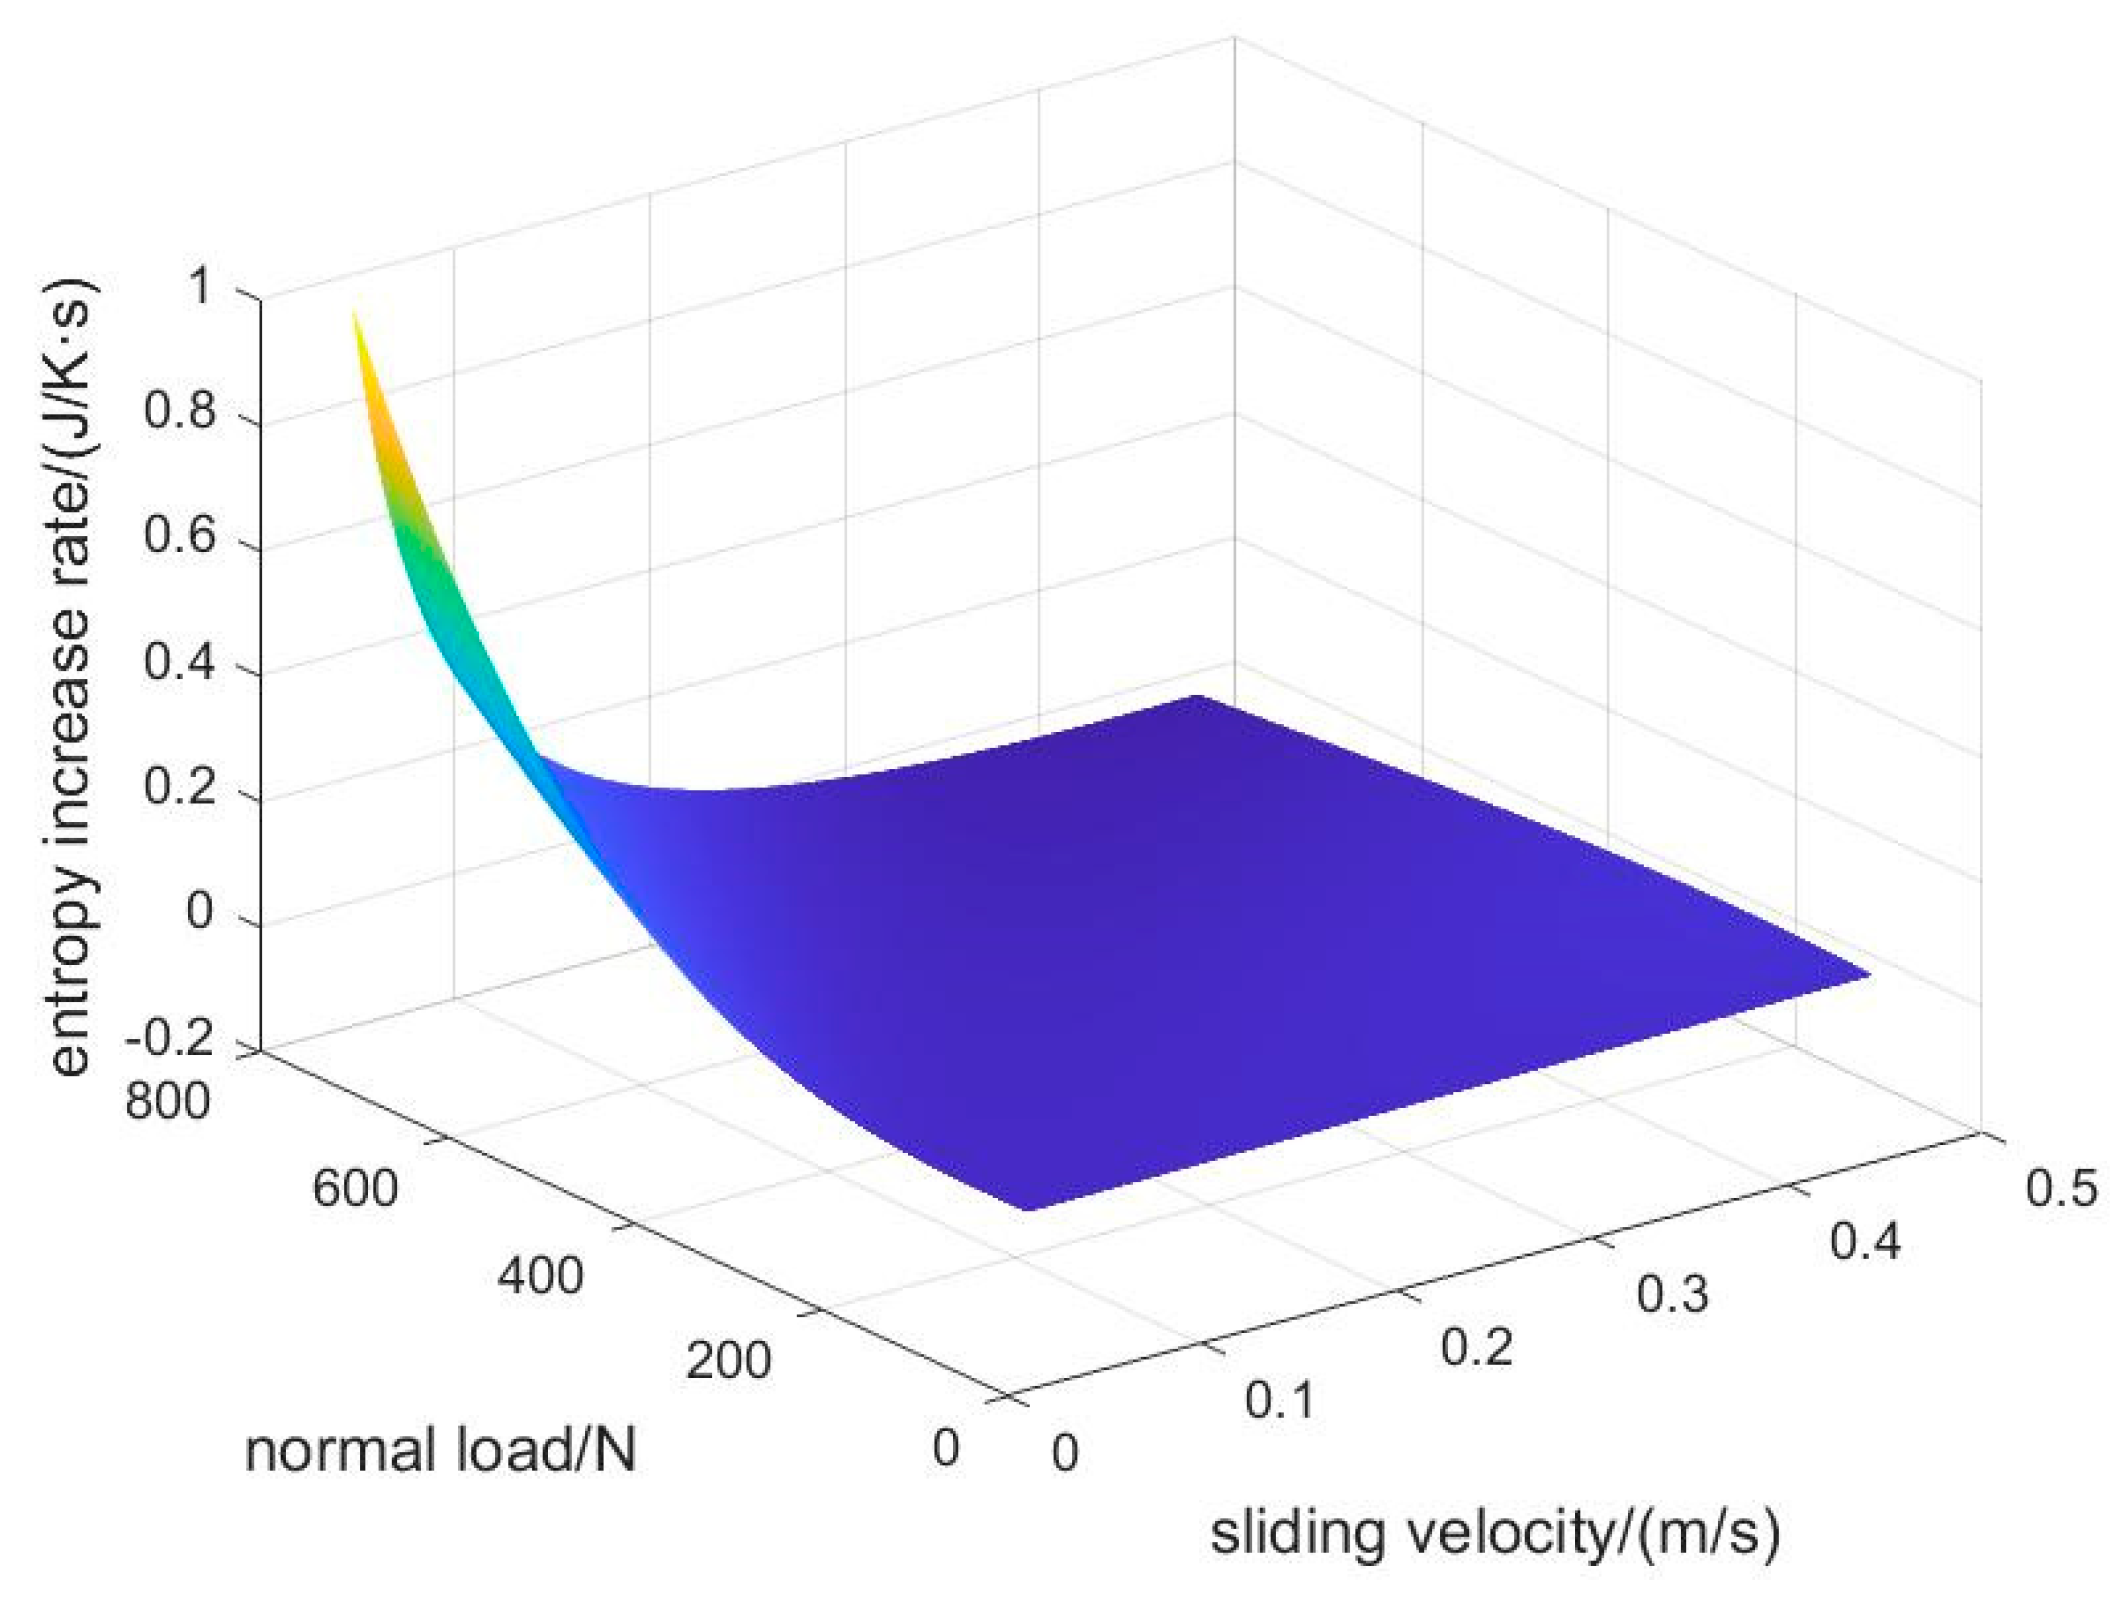
N. With Equations (36) and (37), the entropy increase rate
could be expressed quantitatively.
Additionally, the relationship between entropy increase rate with the sliding velocity v and the normal load N could be further expressed on a 3D surface, from which it could be revealed that would have an accelerated increase with the increasing normal load and the decreasing sliding velocity.
Equations (27) and (28) could be expressed quantitatively so that the gradient of
Figure 9 could be obtained, revealing the changing speed of the entropy increase rate with the sliding velocity and the normal load.
If the load is set as different values around the test normal load, the gradient
could be calculated. Similarly, if the sliding velocity is set as different values around the test rotating speed, the gradient
could be calculated, as shown in
Figure 10.
It could be revealed from the comparison of the two gradients that the gradient by the sliding velocity is three orders of magnitudes larger than that by the normal load, so that a remarkably better acceleration effect could be obtained by adjusting the sliding velocity of the example in this paper, proving that the sliding velocity adjustment operation in
Section 3.2 is appropriate.
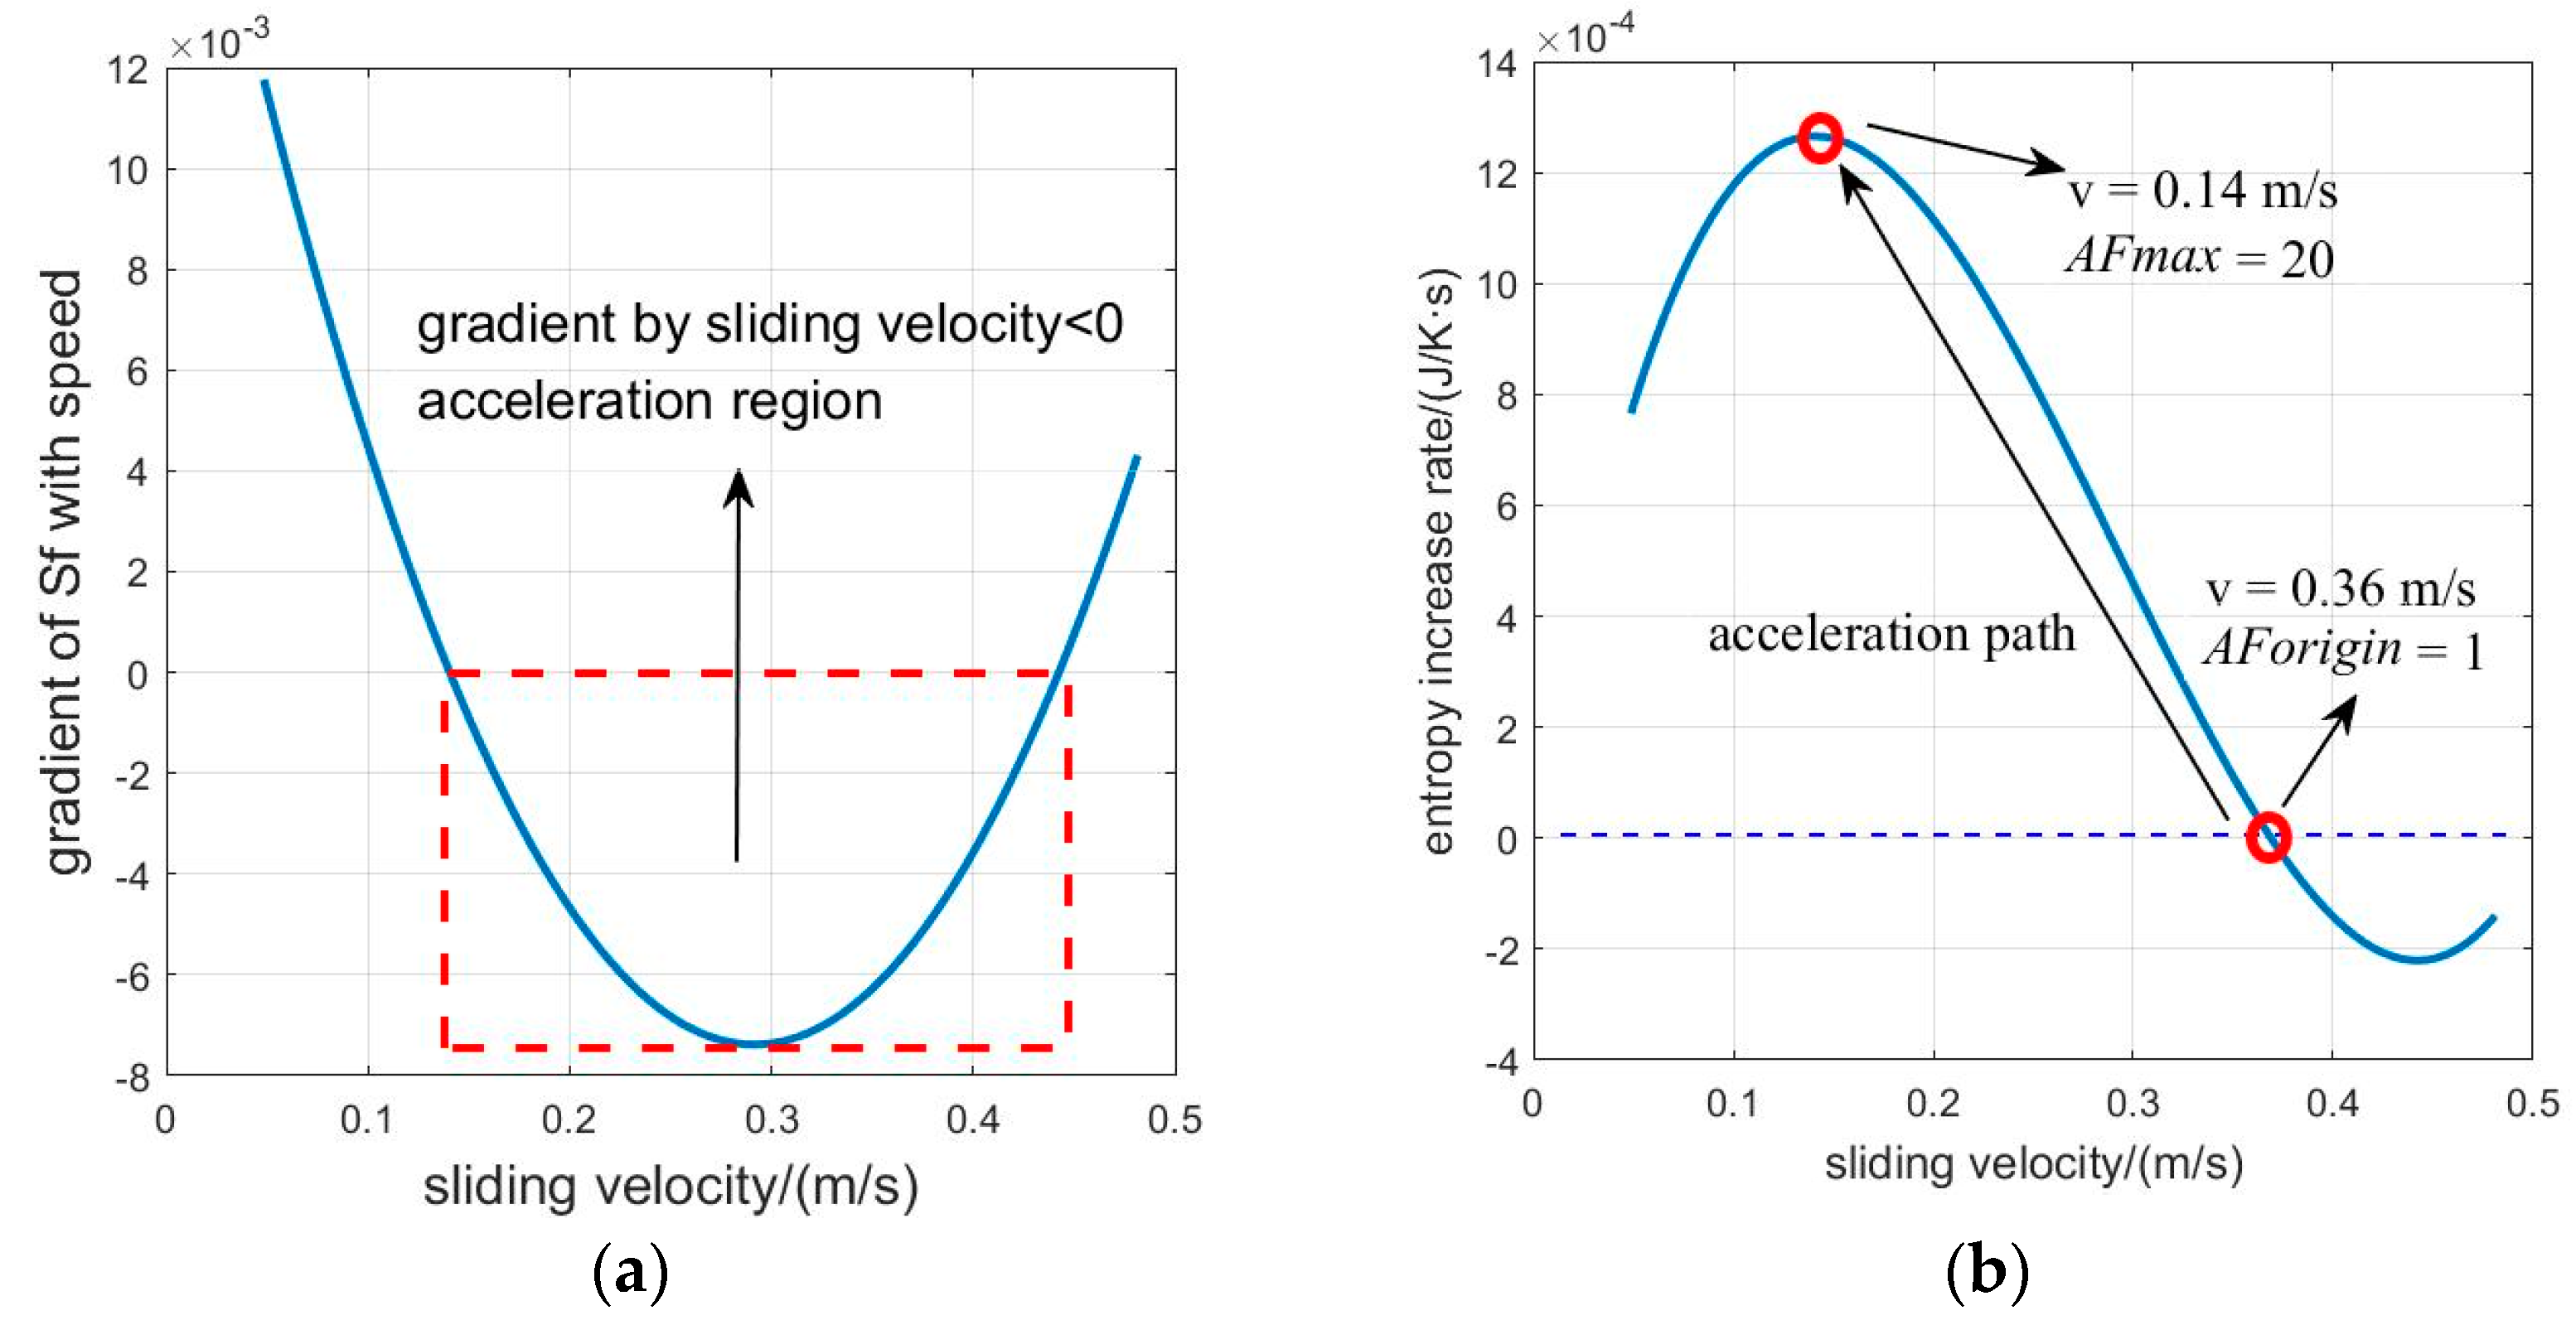
Although sliding velocity adjustment is the suitable direction for the accelerated wear test, there is a restricted range in which the gradient by sliding velocity is negative so that the entropy increase rate could be increased. In this paper, the acceleration sliding velocity range is (0.14 m/s, 0.36 m/s); see
Figure 11a. With the sliding velocity decreasing in such a range, the
AF will increase from 1 to 20; see
Figure 11b.
The design process of the accelerated wear test suggested in Equation (32) is practiced with the test results in this paper. The acceleration step length is set as 10 rpm, and the corresponding entropy increase rates calculated by differential calculation for each step are presented in
Figure 12. By comparison with the entropy increase rate predicted by Equation (45), it is revealed that the design method for the accelerated wear test by entropy gradient analysis and entropy increase rate predicted by Equation (32) is practicable.


