Tribological Properties and Physiochemical Analysis of Polymer-Ceramic Composite Coatings for Bone Regeneration

 ,
,  , ,
, , 
Abstract
:1. Introduction
2. Materials and Methods
2.1. Reagents
2.2. Preparation of Coatings
2.3. Fourier-Transform Infrared Spectroscopy Analysis
2.4. Determination of Sorption Capacity
- m1—the weight of immersed sample (g)
- m0—the initial weight of specimen (g)
- St—swelling at given time t (%),
- Se—equilibrium swelling (power parameter) (%),
- t—time for swelling St (min),
- τ—the “rate parameter” (min).
2.5. Surface Topography and Roughness
2.6. Contact Angle and Surface Free Energy
2.7. Nanotribometer
2.8. Hardness Measurement of Coatings
3. Results and Discussion
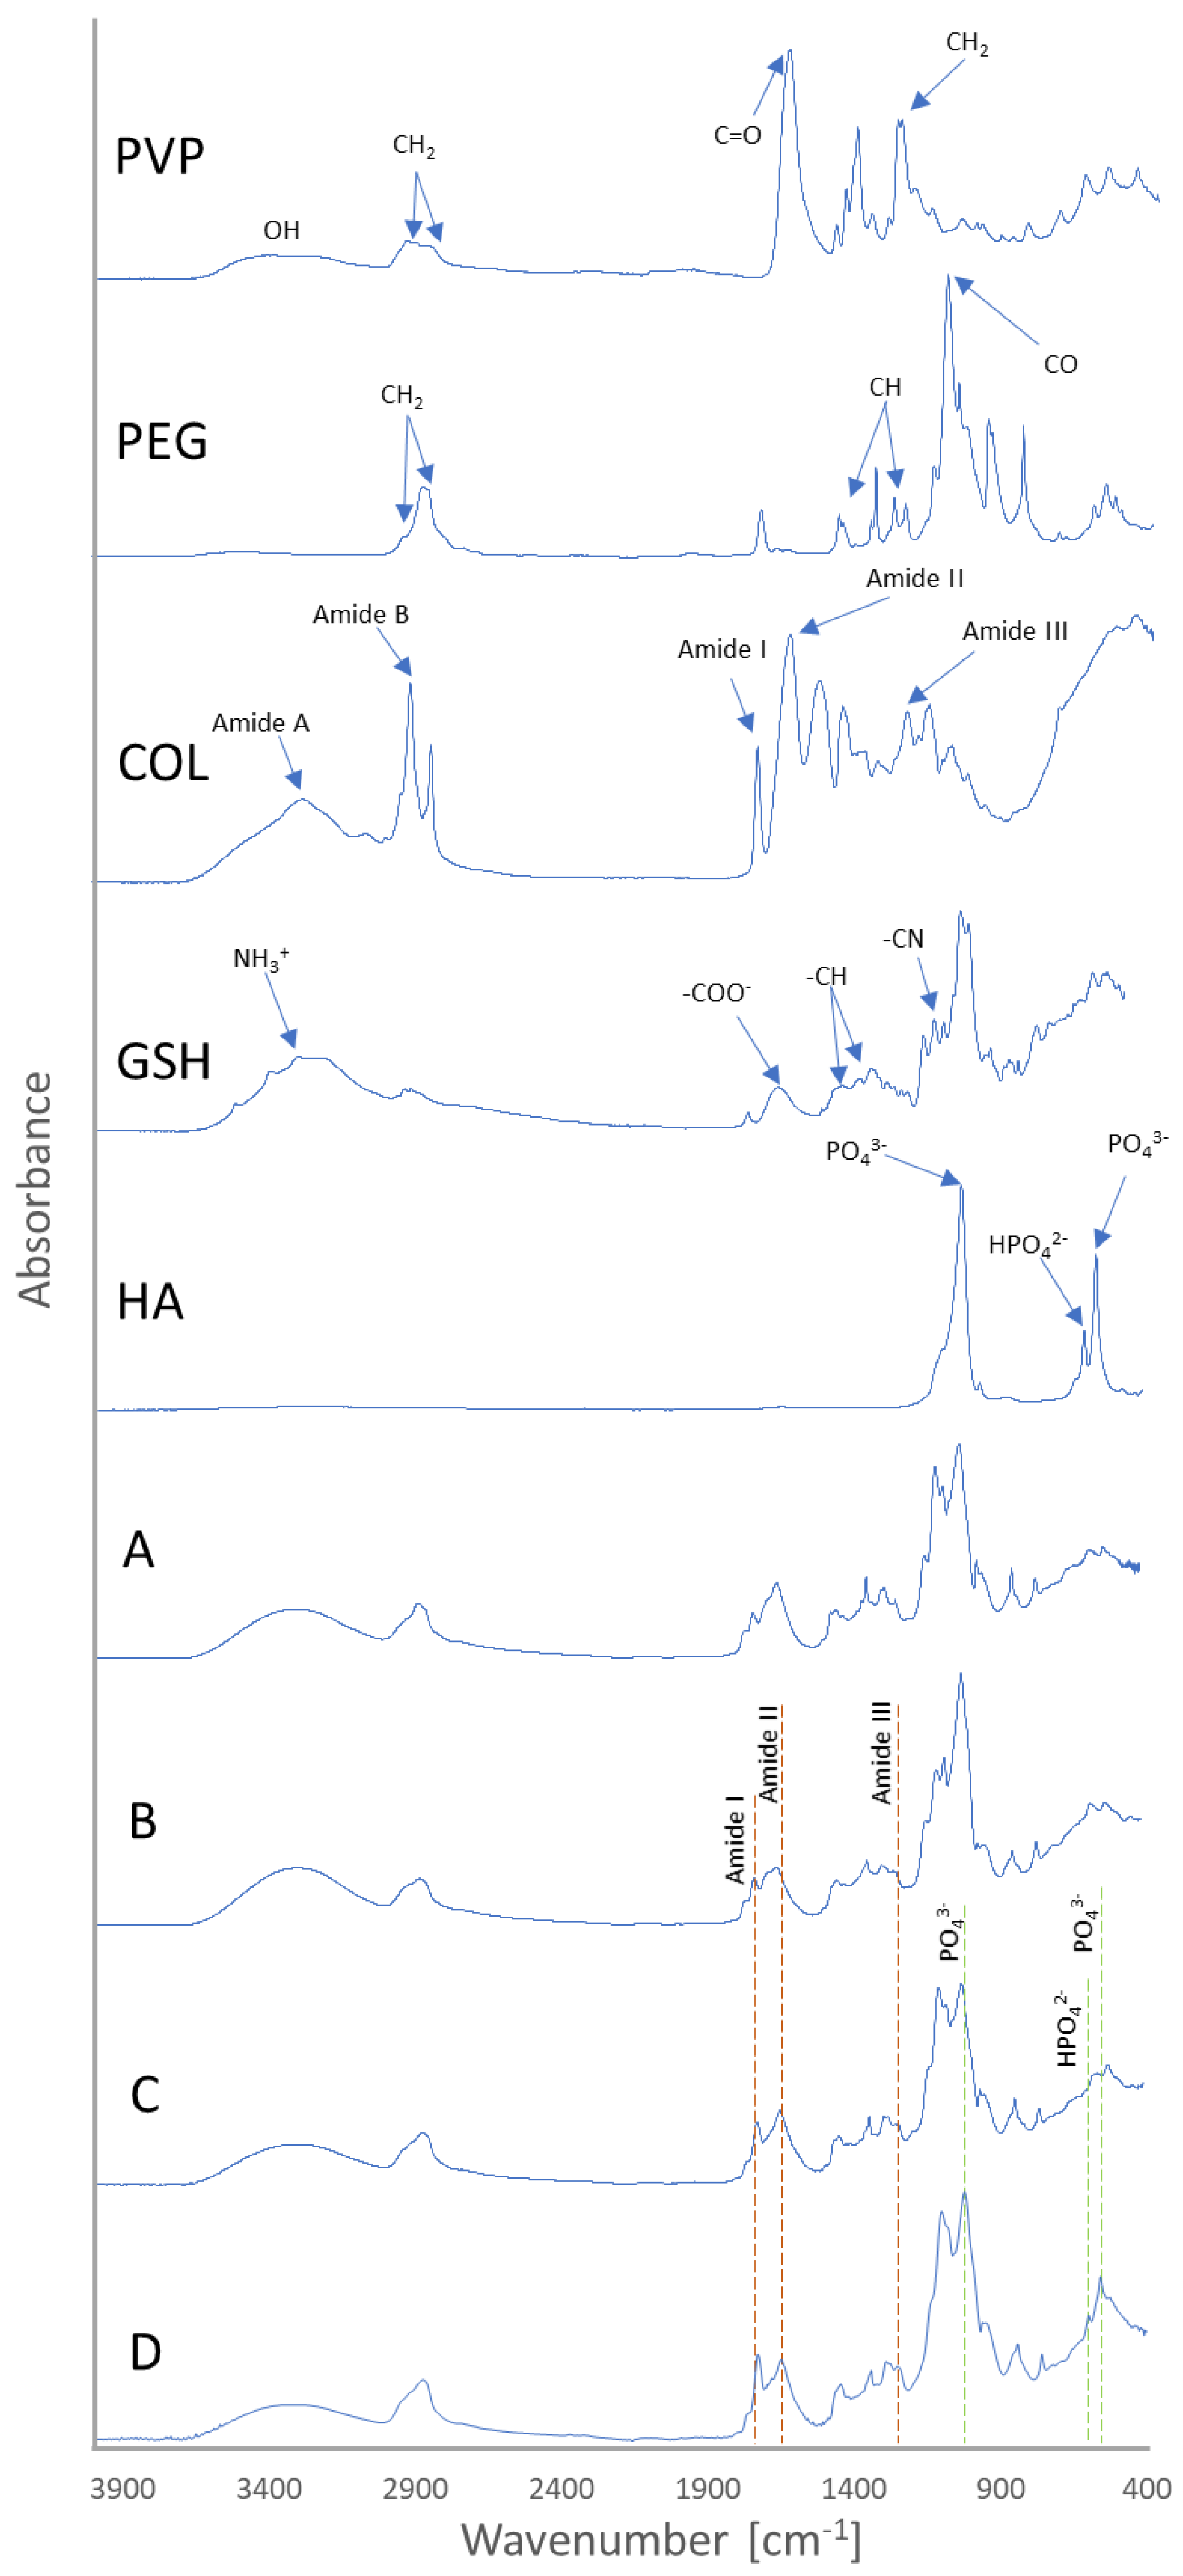
3.1. Fourier-Transform Infrared Spectroscopy Analysis
3.2. Determination of Sorption Capacity
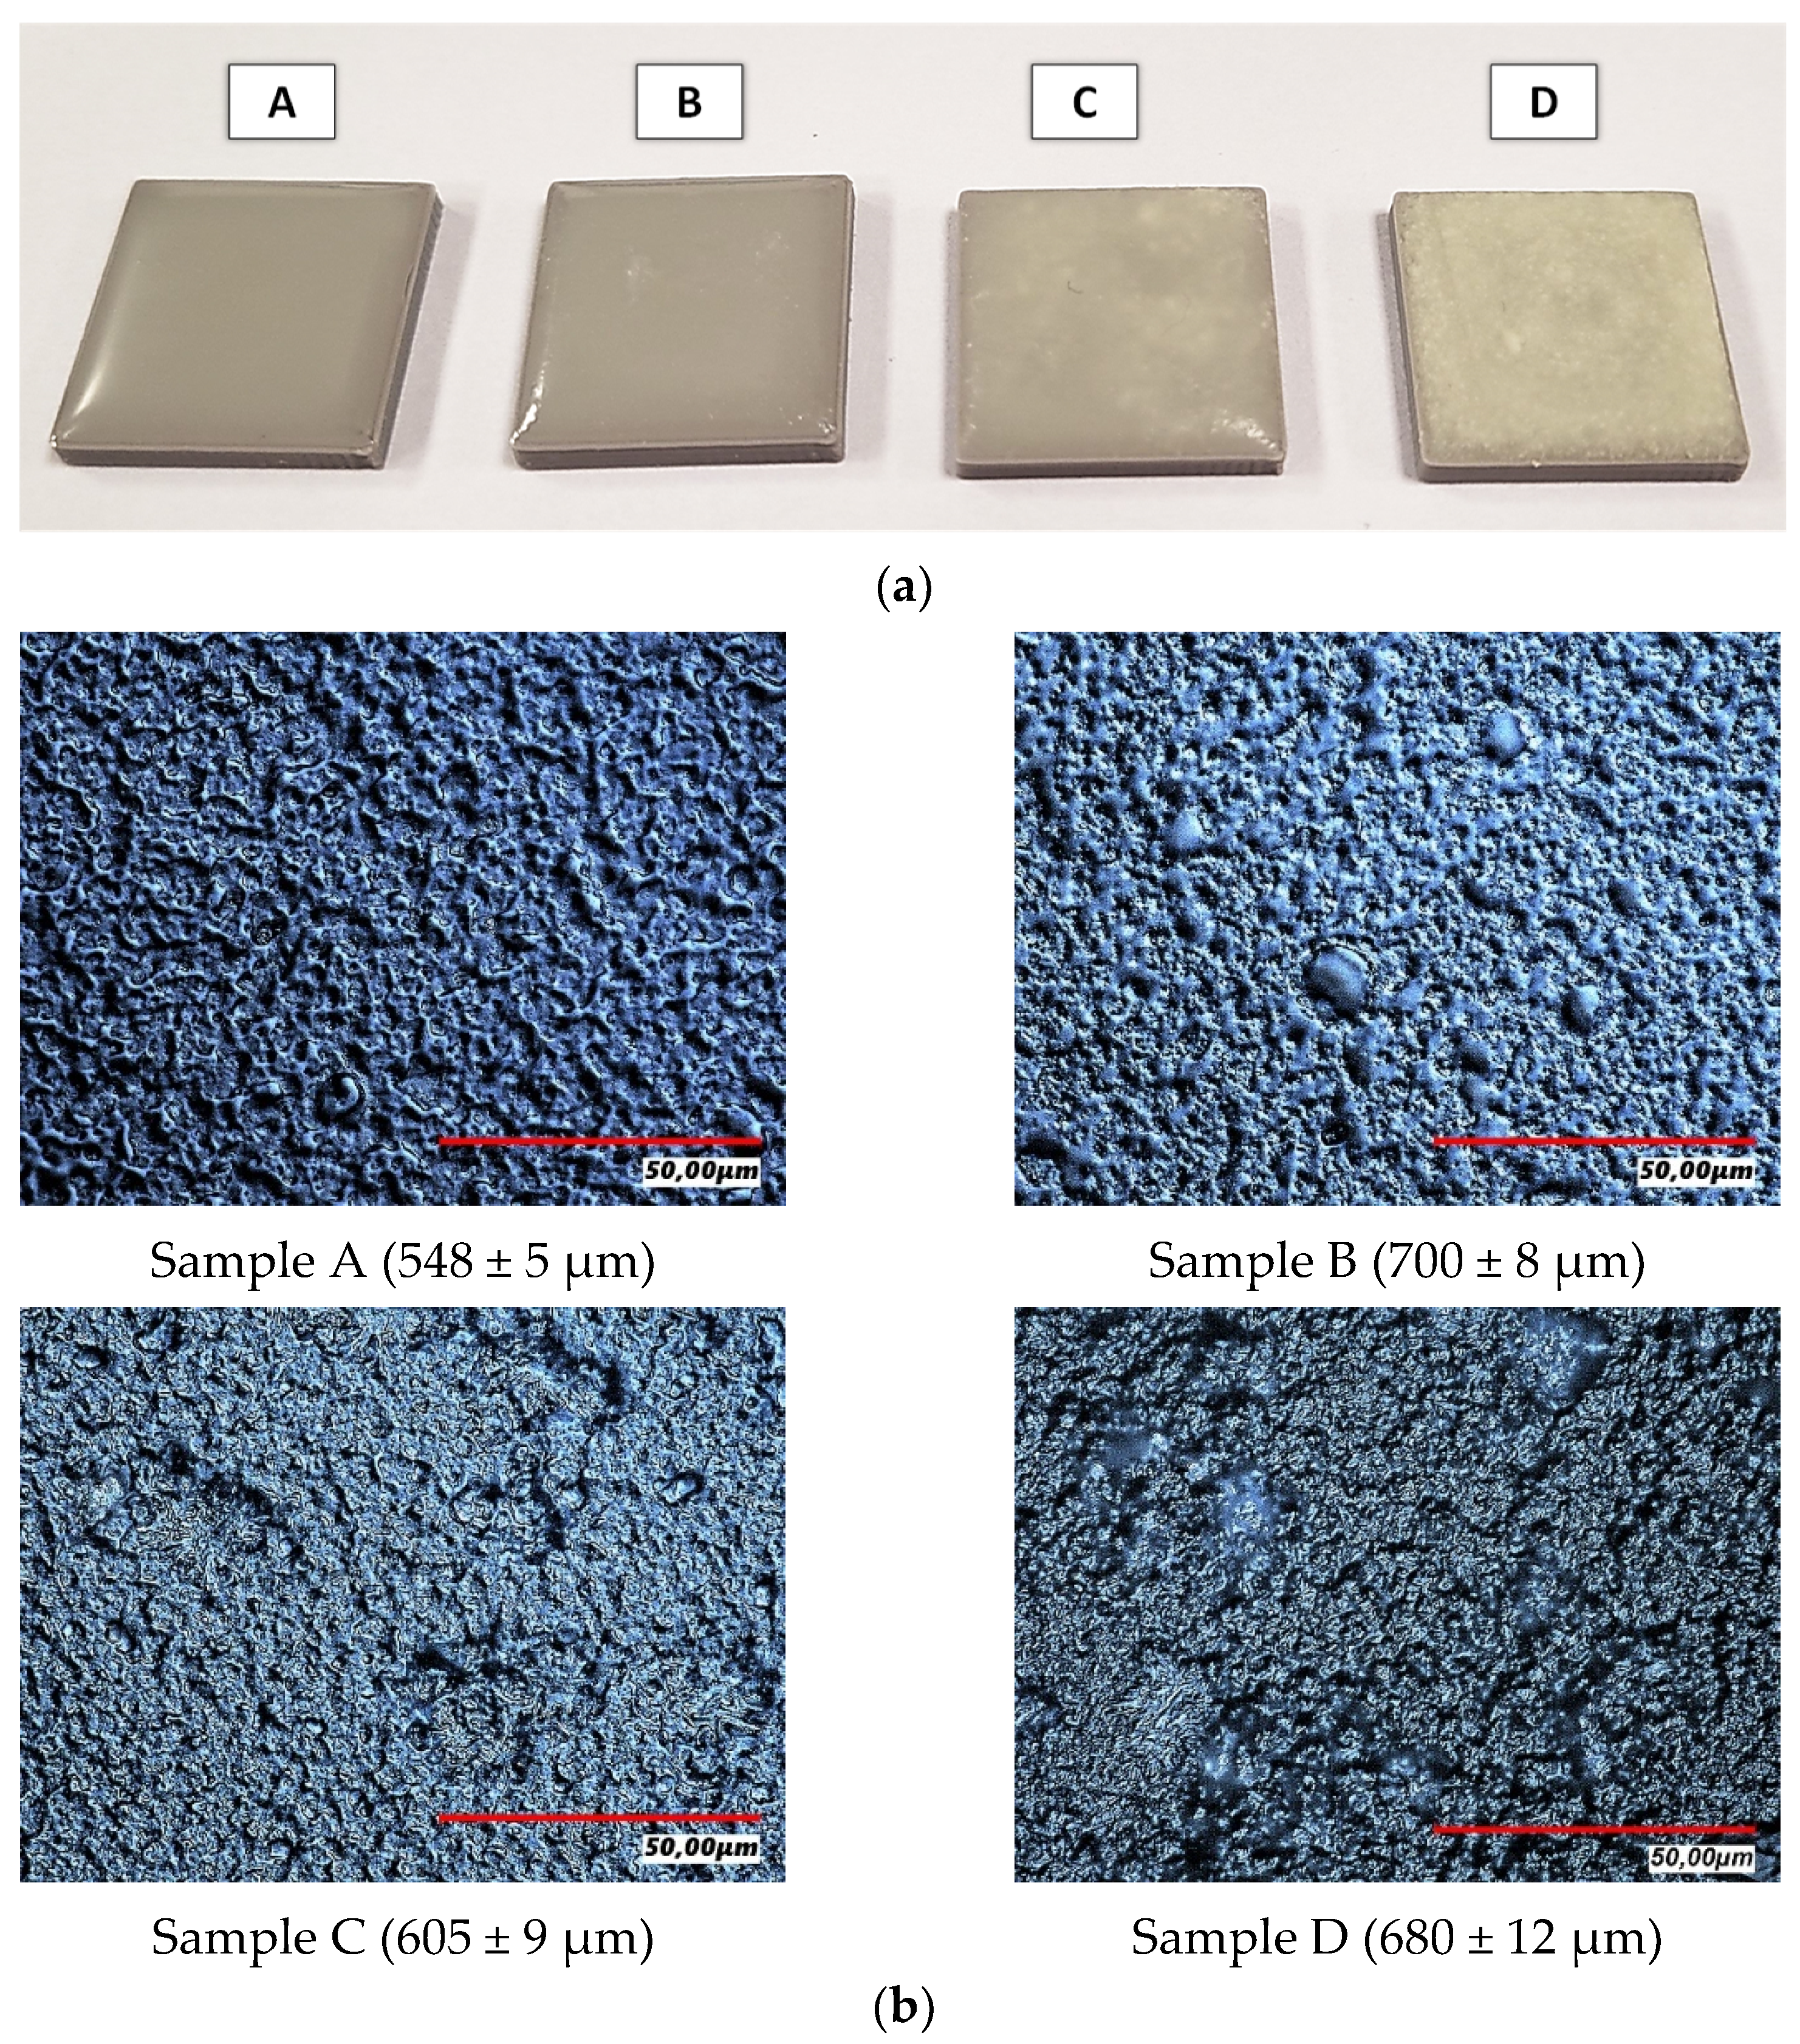
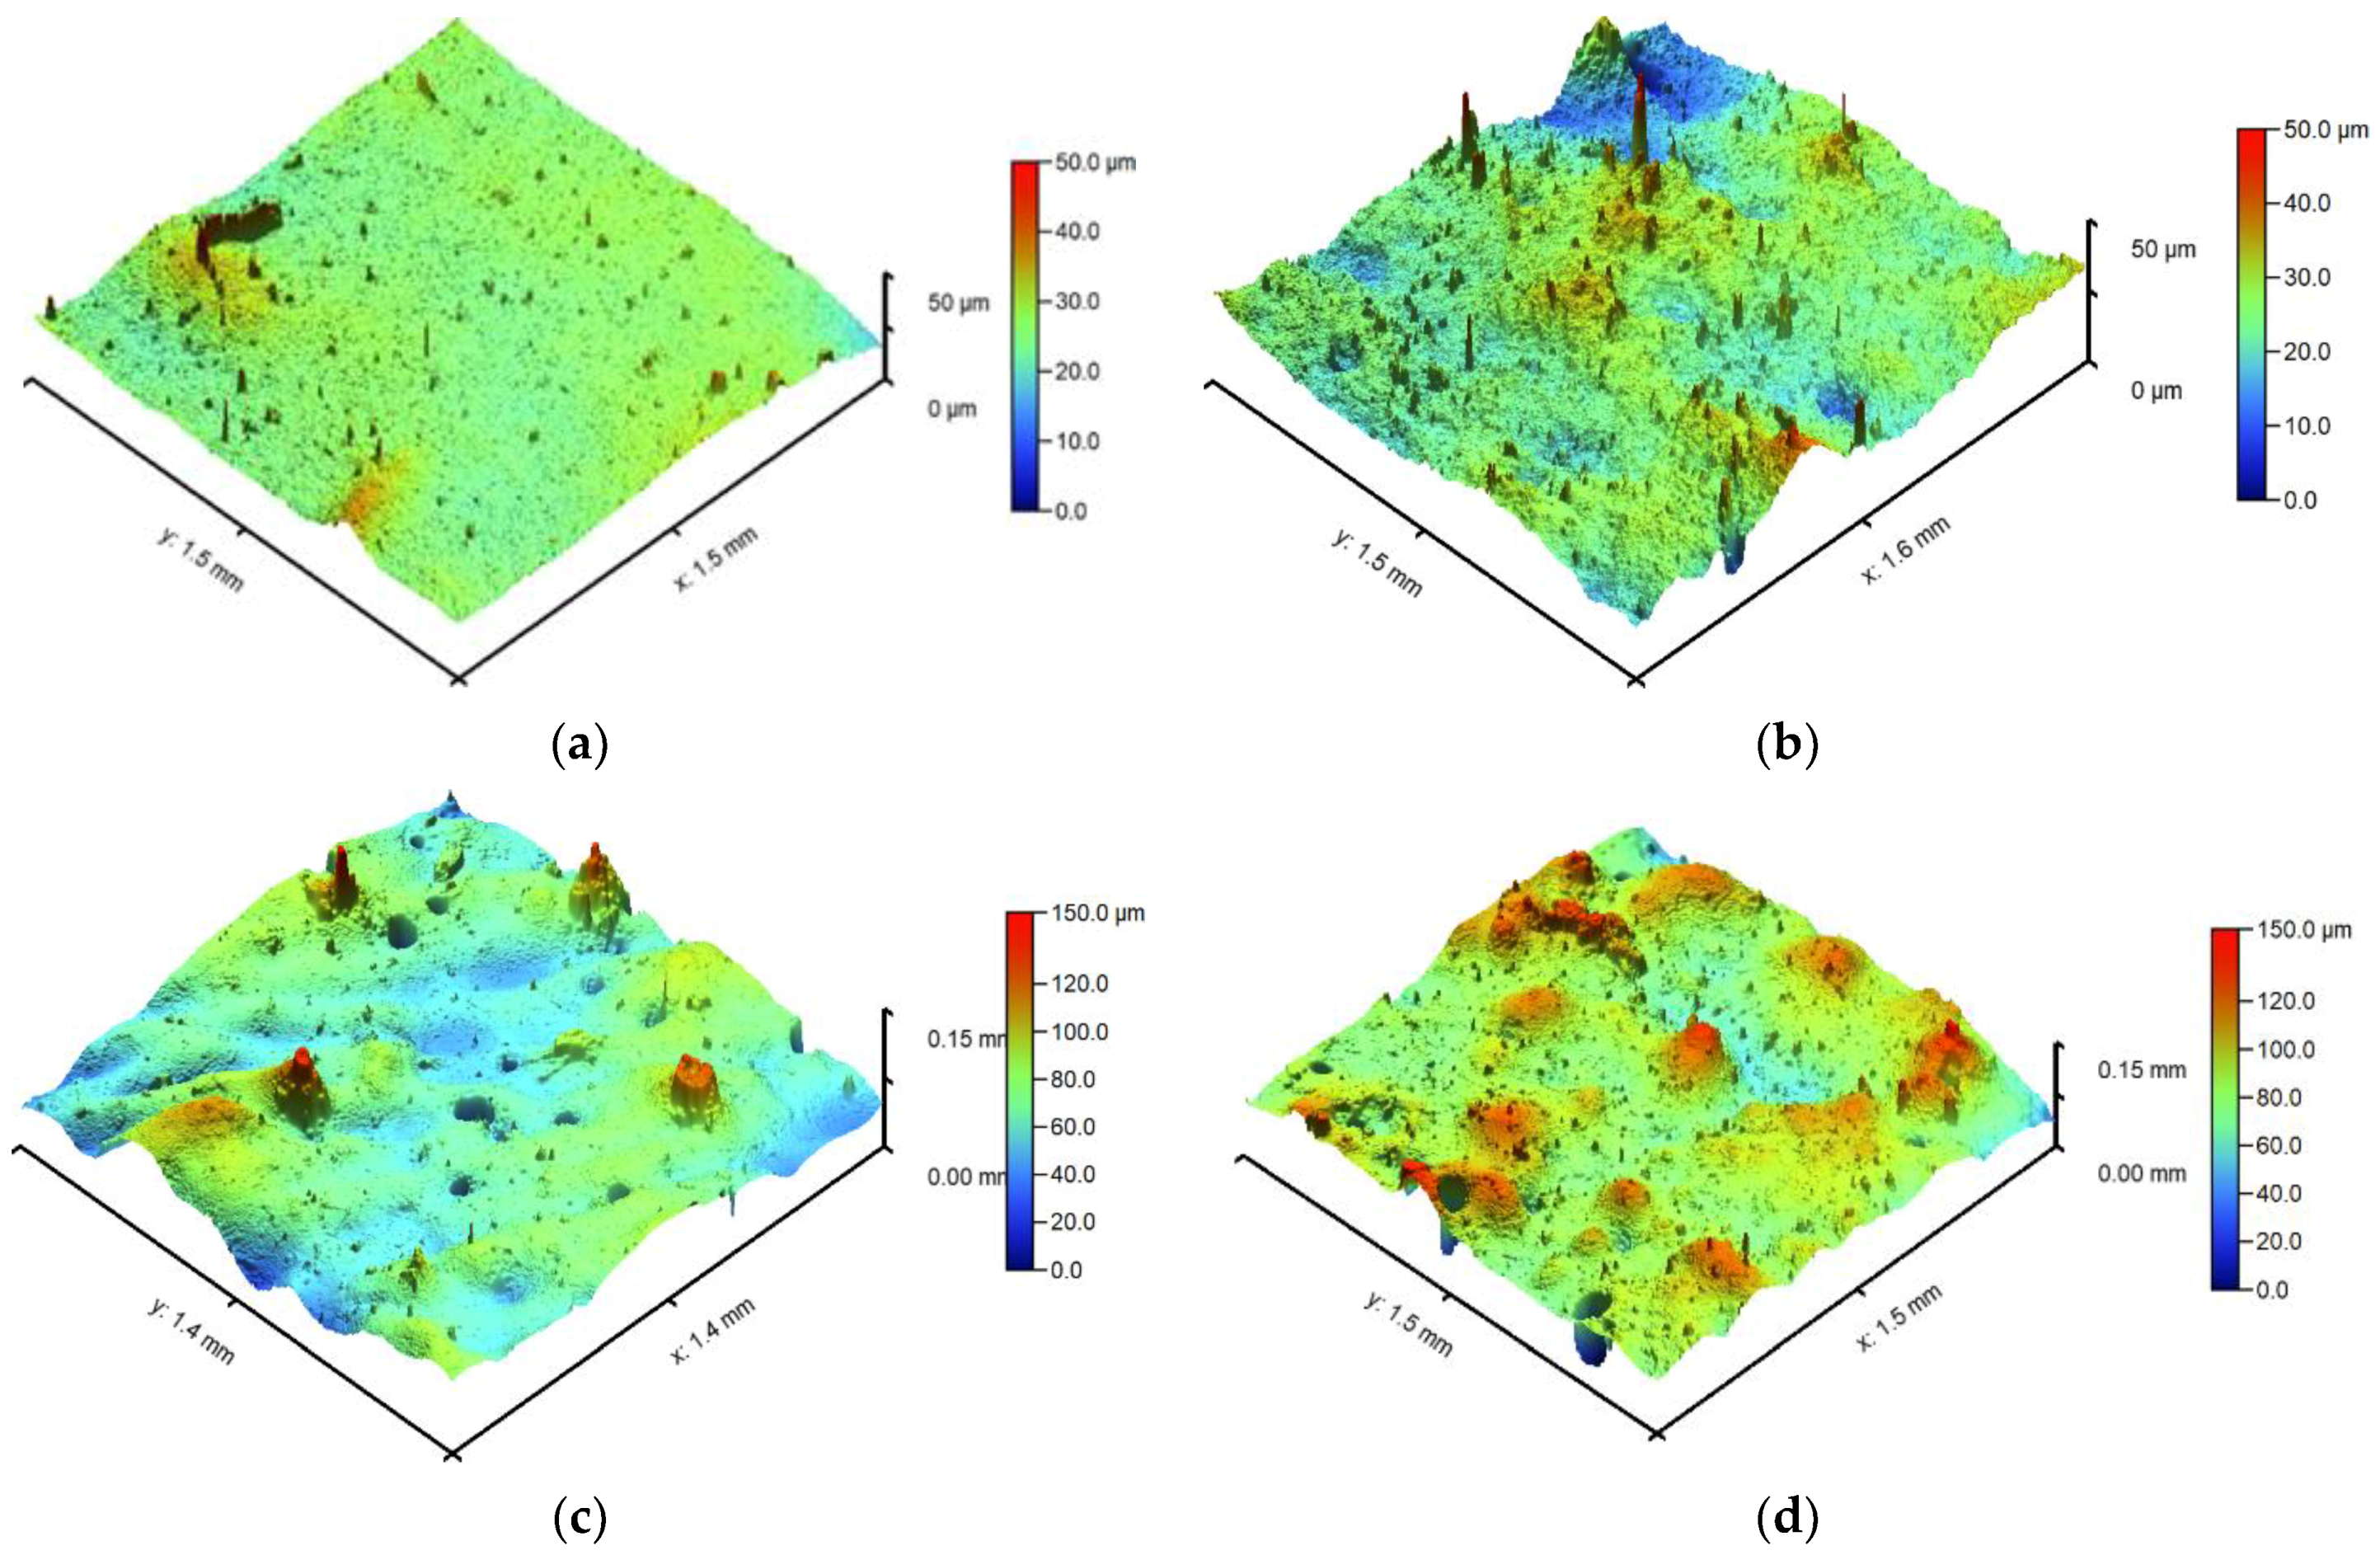
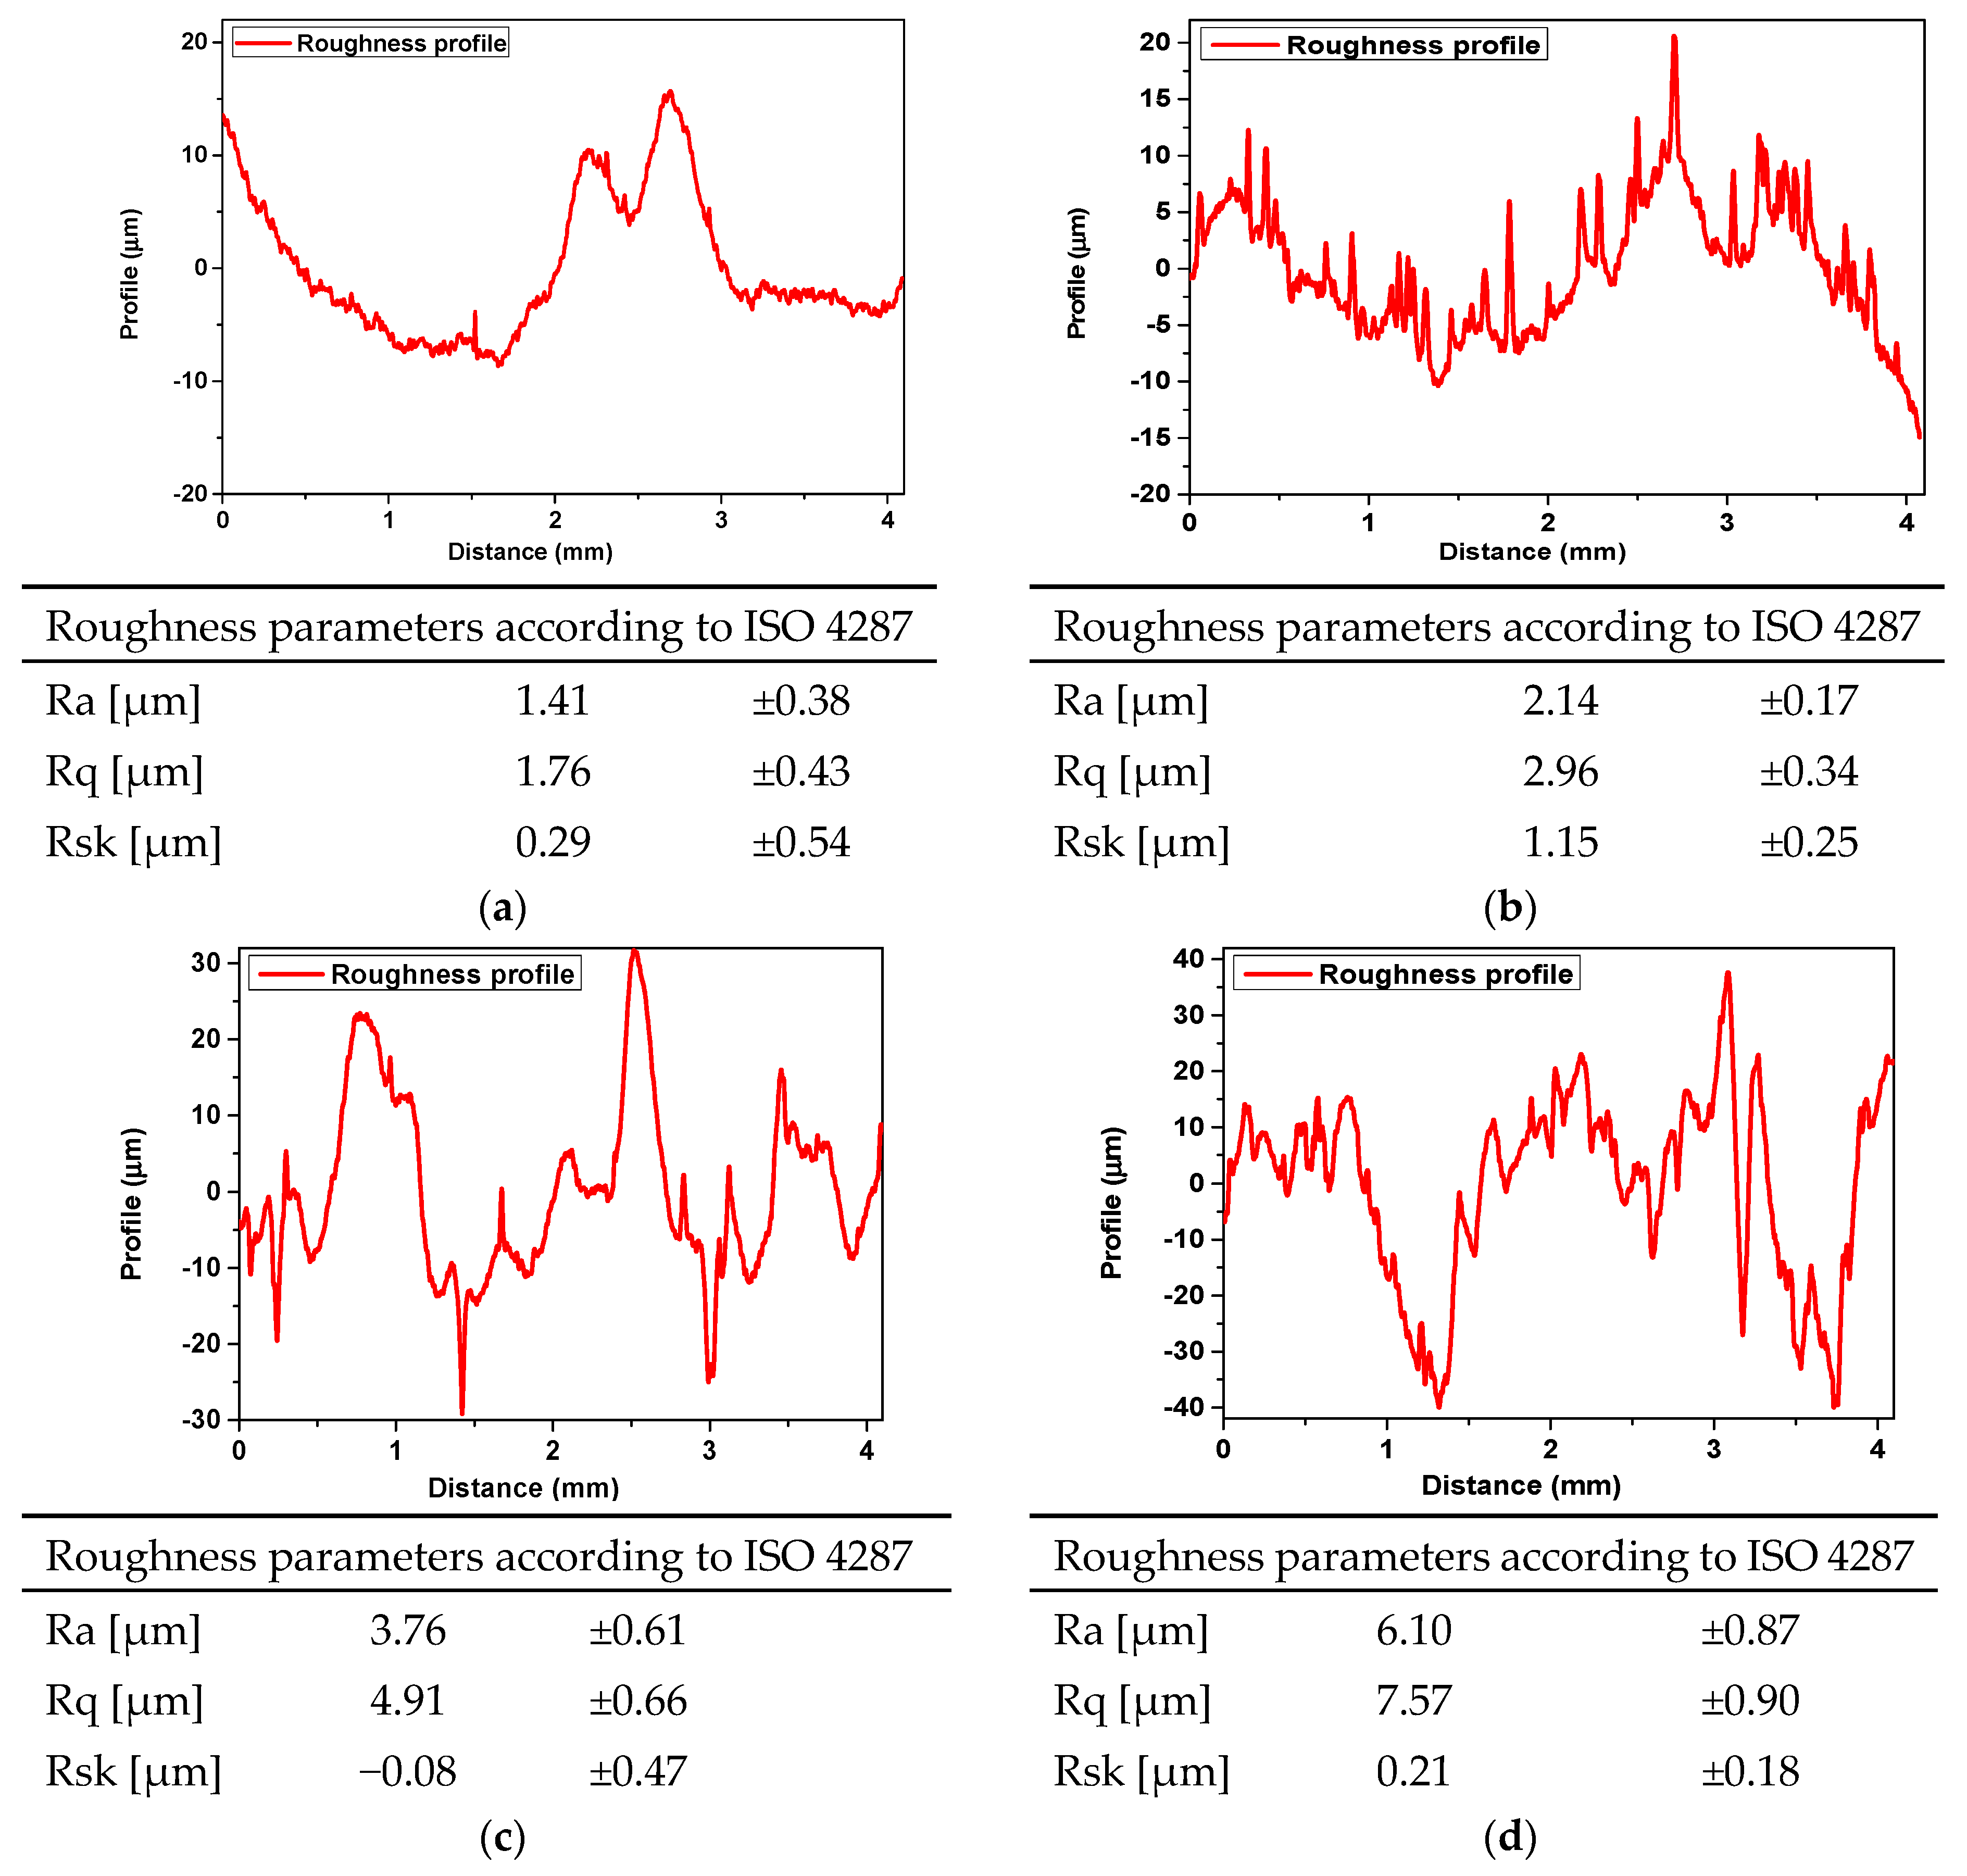
3.3. Surface Topography and Roughness
3.4. Contact Angle and Surface Free Energy
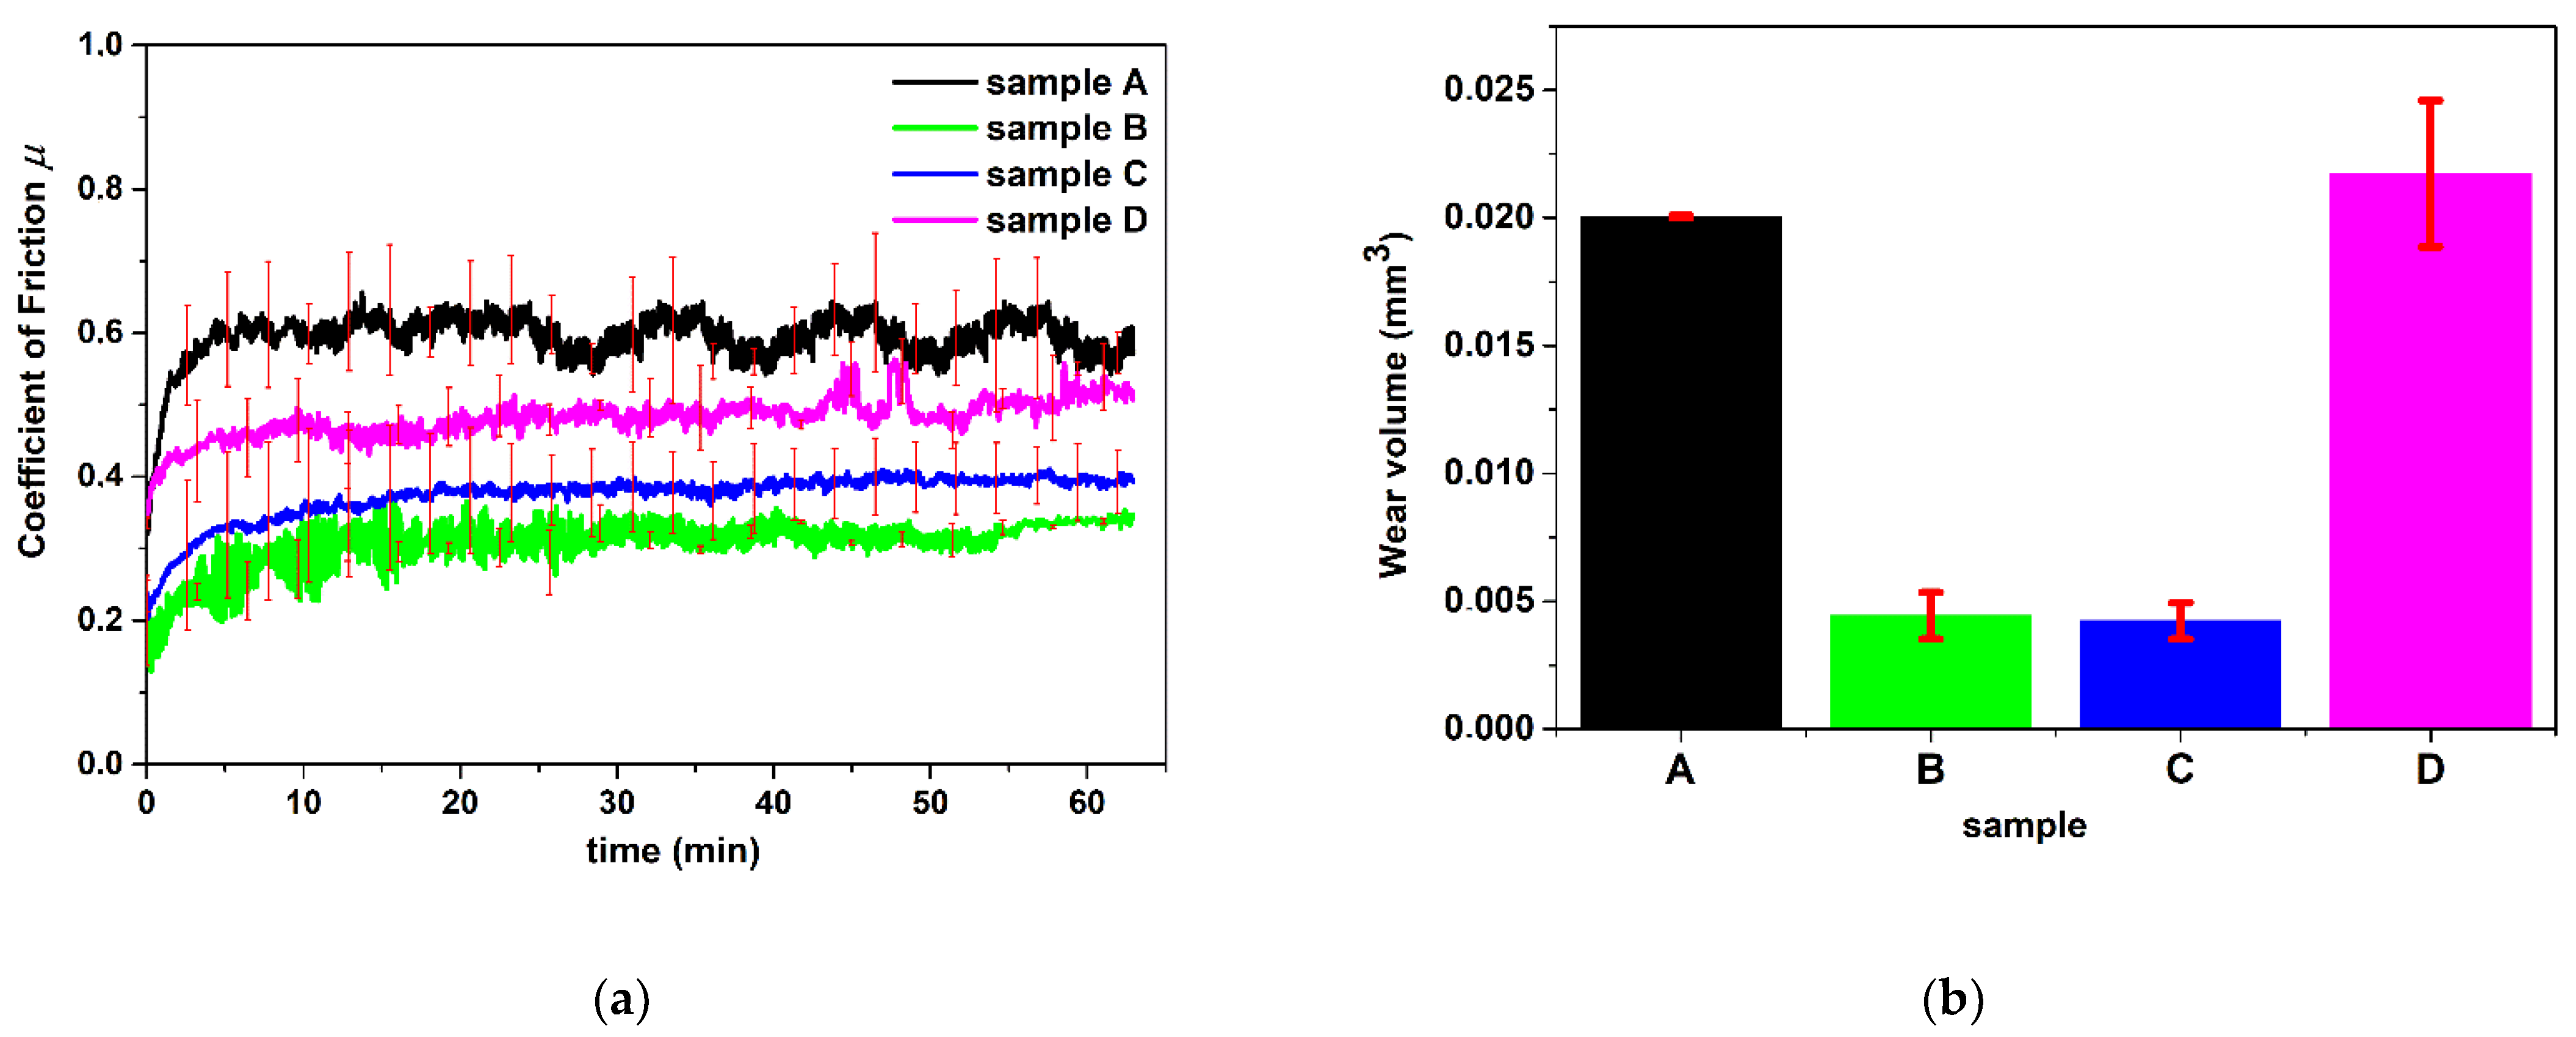
3.5. Nanotribometer
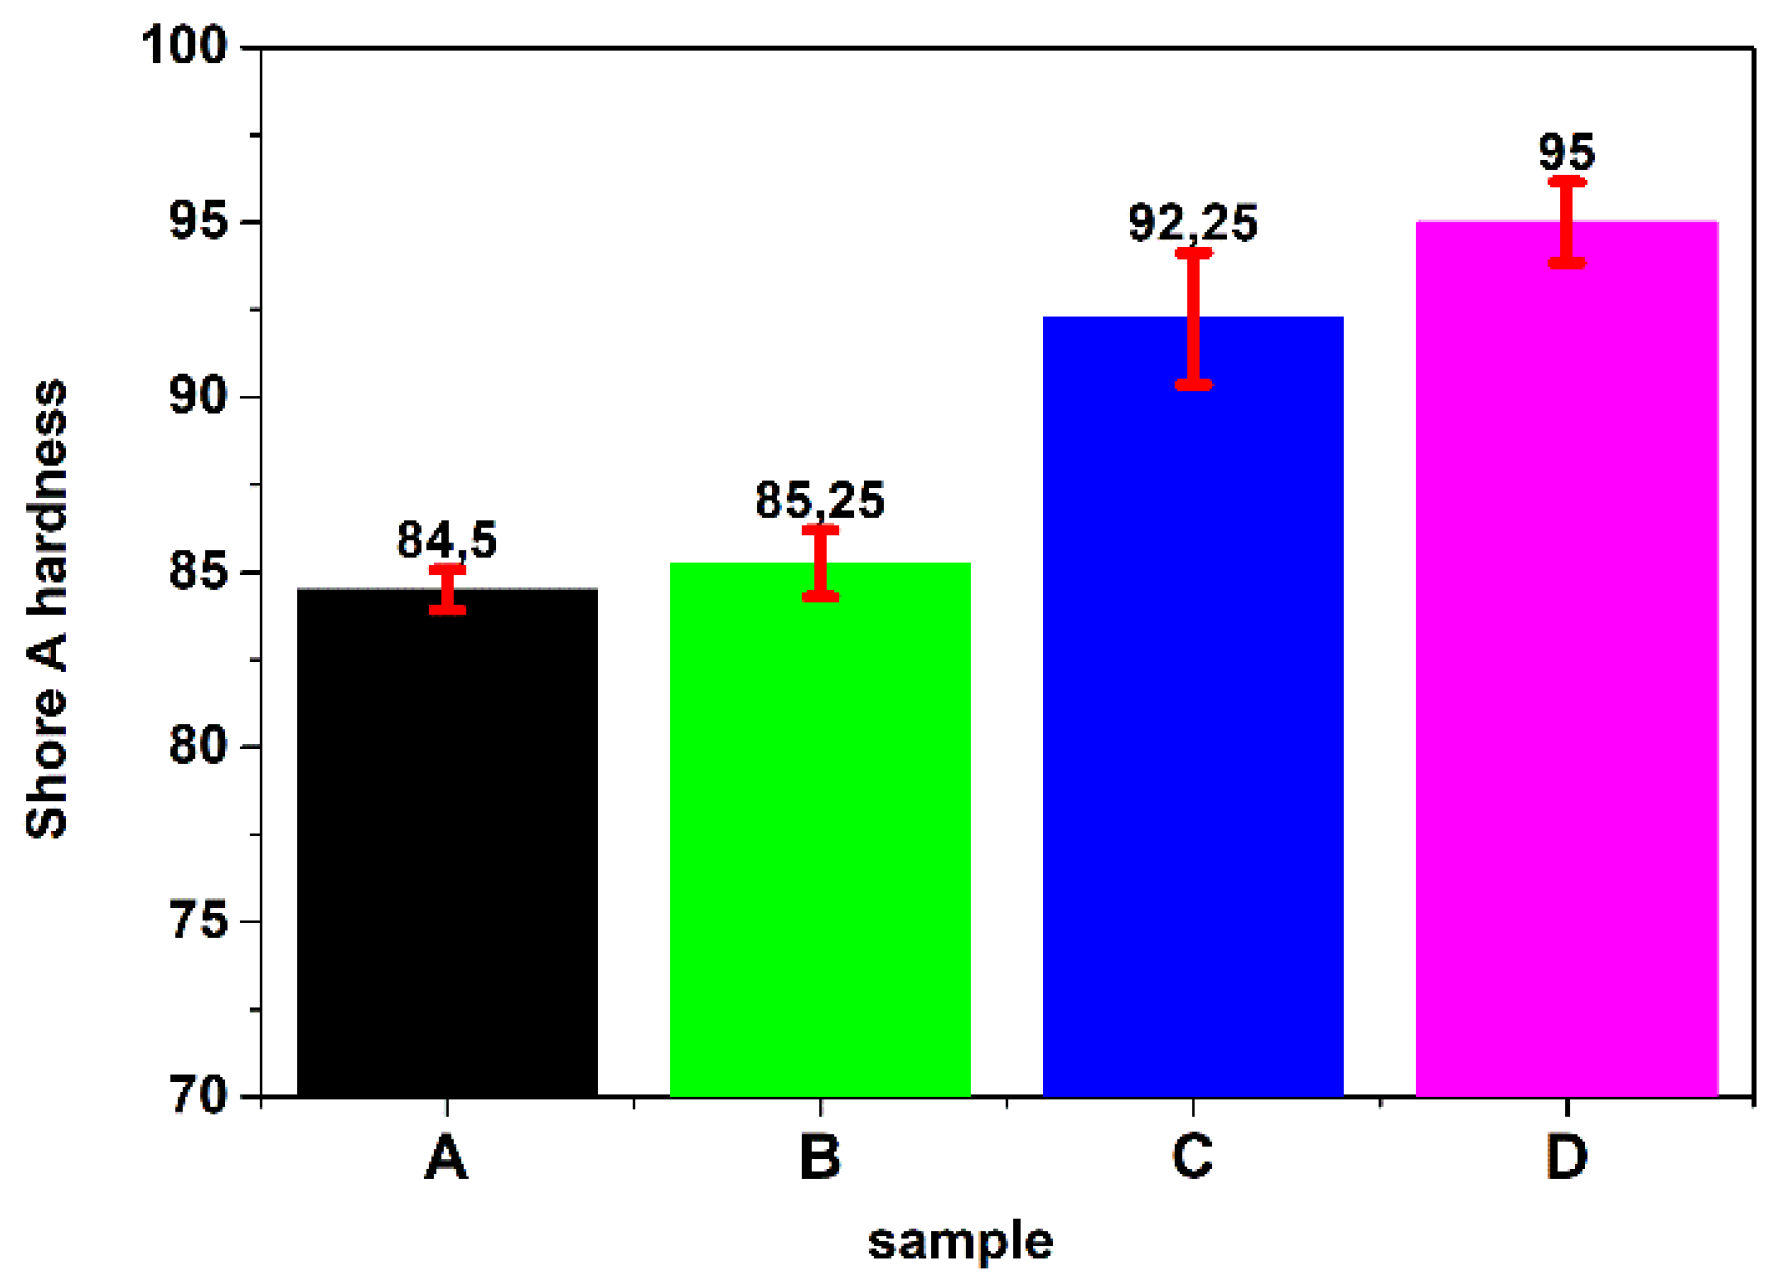
3.6. Hardness Measurement of Coatings
4. Conclusions
Author Contributions
Funding
Institutional Review Board Statement
Informed Consent Statement
Data Availability Statement
Acknowledgments
Conflicts of Interest
References
- Djošić, M.; Janković, A.; Mišković-Stanković, V. Electrophoretic Deposition of Biocompatible and Bioactive Hydroxyapatite-Based Coatings on Titanium. Materials 2021, 14, 5391. [Google Scholar] [CrossRef]
- Chevallier, P.; Turgeon, S.; Sarra-Bournet, C.; Turcotte, R.; Laroche, G. Characterization of Multilayer Anti-Fog Coatings. ACS Appl. Mater. Interfaces 2011, 3, 750–758. [Google Scholar] [CrossRef] [PubMed]
- Soon, G.; Pingguan-Murphy, B.; Lai, K.W.; Akbar, S.A. Review of Zirconia-Based Bioceramic: Surface Modification and Cellular Response. Ceram. Int. 2016, 42, 12543–12555. [Google Scholar] [CrossRef]
- Eliaz, N.; Metoki, N. Calcium Phosphate Bioceramics: A Review of Their History, Structure, Properties, Coating Technologies and Biomedical Applications. Materials 2017, 10, 334. [Google Scholar] [CrossRef] [PubMed] [Green Version]
- Spraying, D. Creation of Bioceramic Coatings on the Surface of Ti–6Al–4V Detonation Spraying. Coatings 2021, 11, 1433. [Google Scholar]
- Li, J.; Jansen, J.A.; Walboomers, X.F.; van den Beucken, J.J. Mechanical Aspects of Dental Implants and Osseointegration: A Narrative Review. J. Mech. Behav. Biomed. Mater. 2020, 103, 103574. [Google Scholar] [CrossRef]
- Kaneko, S.; Yamamoto, Y.; Wada, K.; Kumagai, G.; Harada, Y.; Yamauchi, R.; Ishibashi, Y. Ultraviolet Irradiation Improves the Hydrophilicity and Osteo-Conduction of Hydroxyapatite. J. Orthop. Surg. Res. 2020, 15, 425. [Google Scholar] [CrossRef]
- Bai, L.; Liu, Y.; Du, Z.; Weng, Z.; Yao, W.; Zhang, X.; Huang, X.; Yao, X.; Crawford, R.; Hang, R.; et al. Differential Effect of Hydroxyapatite Nano-Particle versus Nano-Rod Decorated Titanium Micro-Surface on Osseointegration. Acta Biomater. 2018, 76, 344–358. [Google Scholar] [CrossRef]
- Xia, L.; Xie, Y.; Fang, B.; Wang, X.; Lin, K. In Situ Modulation of Crystallinity and Nano-Structures to Enhance the Stability and Osseointegration of Hydroxyapatite Coatings on Ti-6Al-4V Implants. Chem. Eng. J. 2018, 347, 711–720. [Google Scholar] [CrossRef]
- Um, S.H.; Chung, Y.W.; Seo, Y.; Seo, H.; Ok, M.R.; Kim, Y.C.; Han, H.S.; Chung, J.J.; Edwards, J.R.; Jeon, H. Robust Hydroxyapatite Coating by Laser-Induced Hydrothermal Synthesis. Adv. Funct. Mater. 2020, 30, 2005233. [Google Scholar] [CrossRef]
- Beig, B.; Liaqat, U.; Niazi, M.F.K.; Douna, I.; Zahoor, M.; Niazi, M.B.K. Current Challenges and Innovative Developments in Hydroxyapatite-Based Coatings on Metallic Materials for Bone Implantation: A Review. Coatings 2020, 10, 1249. [Google Scholar] [CrossRef]
- Ullah, I.; Siddiqui, M.A.; Liu, H.; Kolawole, S.K.; Zhang, J.; Zhang, S.; Ren, L.; Yang, K. Mechanical, Biological, and Antibacterial Characteristics of Plasma-Sprayed (Sr,Zn) Substituted Hydroxyapatite Coating. ACS Biomater. Sci. Eng. 2020, 6, 1355–1366. [Google Scholar] [CrossRef] [PubMed]
- Chen, Y.; Ren, J.; Liu, W.; Zhao, D. Enhanced Scratch Performance of Plasma Sprayed Hydroxyapatite Composite Coatings Reinforced with BN Nanoplatelets. Coatings 2020, 10, 652. [Google Scholar] [CrossRef]
- Zhao, H.; Liao, J.; Wu, F.; Shi, J. Mechanical Strength Improvement of Chitosan/Hydroxyapatite Scaffolds by Coating and Cross-Linking. J. Mech. Behav. Biomed. Mater. 2021, 114, 104169. [Google Scholar] [CrossRef] [PubMed]
- Jung, H.G.; Lee, D.; Lee, S.W.; Kim, I.; Kim, Y.; Jang, J.W.; Lee, J.H.; Lee, G.; Yoon, D.S. Nanoindentation for Monitoring the Time-Variant Mechanical Strength of Drug-Loaded Collagen Hydrogel Regulated by Hydroxyapatite Nanoparticles. ACS Omega 2021, 6, 9269–9278. [Google Scholar] [CrossRef] [PubMed]
- Banoriya, D.; Purohit, R.; Dwivedi, R.K. Advanced Application of Polymer Based Biomaterials. Mater. Today Proc. 2017, 4, 3534–3541. [Google Scholar] [CrossRef]
- Grant, J.J.; Pillai, S.C.; Perova, T.S.; Hehir, S.; Hinder, S.J.; McAfee, M.; Breen, A. Electrospun Fibres of Chitosan/PVP for the Effective Chemotherapeutic Drug Delivery of 5-Fluorouracil. Chemosensors 2021, 9, 70. [Google Scholar] [CrossRef]
- Ozkan, G.; Franco, P.; Capanoglu, E.; De Marco, I. PVP/Flavonoid Coprecipitation by Supercritical Antisolvent Process. Chem. Eng. Process.—Process Intensif. 2019, 146, 107689. [Google Scholar] [CrossRef]
- López-Calderón, H.D.; Avilés-Arnaut, H.; Galán Wong, L.J.; Almaguer-Cantú, V.; Laguna-Camacho, J.R.; Calderón-Ramón, C.; Escalante-Martínez, J.E.; Arévalo-Niño, K. Electrospun Polyvinylpyrrolidone-Gelatin and Cellulose Acetate Bi-Layer Scaffold Loaded with Gentamicin as Possible Wound Dressing. Polymers 2020, 12, 2311. [Google Scholar] [CrossRef]
- Voronova, M.; Rubleva, N.; Kochkina, N.; Afineevskii, A.; Zakharov, A.; Surov, O. Preparation and Characterization of Polyvinylpyrrolidone/Cellulose Nanocrystals Composites. Nanomaterials 2018, 8, 1011. [Google Scholar] [CrossRef] [Green Version]
- Bakaic, E.; Smeets, N.M.B.; Hoare, T. Injectable Hydrogels Based on Poly(Ethylene Glycol) and Derivatives as Functional Biomaterials. RSC Adv. 2015, 5, 35469–35486. [Google Scholar] [CrossRef]
- Knop, K.; Hoogenboom, R.; Fischer, D.; Schubert, U.S. Poly(Ethylene Glycol) in Drug Delivery: Pros and Cons as Well as Potential Alternatives. Angew. Chem.—Int. Ed. 2010, 49, 6288–6308. [Google Scholar] [CrossRef] [PubMed]
- Thi, T.T.H.; Pilkington, E.H.; Nguyen, D.H.; Lee, J.S.; Park, K.D.; Truong, N.P. The Importance of Poly(Ethylene Glycol) Alternatives for Overcoming PEG Immunogenicity in Drug Delivery and Bioconjugation. Polymers 2020, 12, 298. [Google Scholar] [CrossRef] [Green Version]
- Chakravarty, J.; Rabbi, M.F.; Chalivendra, V.; Ferreira, T.; Brigham, C.J. Mechanical and Biological Properties of Chitin/Polylactide (PLA)/Hydroxyapatite (HAP) Composites Cast Using Ionic Liquid Solutions. Int. J. Biol. Macromol. 2020, 151, 1213–1223. [Google Scholar] [CrossRef] [PubMed]
- Serra, T.; Mateos-Timoneda, M.A.; Planell, J.A.; Navarro, M. 3D Printed PLA-Based Scaffolds: A Versatile Tool in Regenerative Medicine. Organogenesis 2013, 9, 239–244. [Google Scholar] [CrossRef] [Green Version]
- Munirah, S.; Kim, S.H.; Ruszymah, B.H.I.; Khang, G. The Use of Fibrin and Poly(Lactic-Co-Glycolic Acid) Hybrid Scaffold for Articular Cartilage Tissue Engineering: An in Vivo Analysis. Eur. Cells Mater. 2008, 15, 41–52. [Google Scholar] [CrossRef]
- Gregor, A.; Filová, E.; Novák, M.; Kronek, J.; Chlup, H.; Buzgo, M.; Blahnová, V.; Lukášová, V.; Bartoš, M.; Nečas, A.; et al. Designing of PLA Scaffolds for Bone Tissue Replacement Fabricated by Ordinary Commercial 3D Printer. J. Biol. Eng. 2017, 11, 31. [Google Scholar] [CrossRef]
- Słota, D.; Florkiewicz, W.; Piętak, K.; Szwed, A.; Włodarczyk, M.; Siwińska, M.; Rudnicka, K.; Sobczak-Kupiec, A. Preparation, Characterization, and Biocompatibility Assessment of Polymer-Ceramic Composites Loaded with Salvia Officinalis Extract. Materials 2021, 14, 6000. [Google Scholar] [CrossRef]
- Kabiri, K.; Omidian, H.; Hashemi, S.A.; Zohuriaan-Mehr, M.J. Synthesis of Fast-Swelling Superabsorbent Hydrogels: Effect of Crosslinker Type and Concentration on Porosity and Absorption Rate. Eur. Polym. J. 2003, 39, 1341–1348. [Google Scholar] [CrossRef]
- Marmur, A. Thermodynamic Aspects of Contact Angle Hysteresis. Adv. Colloid Interface Sci. 1994, 50, 121–141. [Google Scholar] [CrossRef]
- Owens, D.K.; Wendt, R.C. Estimation of the Surface Free Energy of Polymers. J. Appl. Polym. Sci. 1969, 13, 1741–1747. [Google Scholar] [CrossRef]
- Abdelghany, A.M.; Mekhail, M.S.; Abdelrazek, E.M.; Aboud, M.M. Combined DFT/FTIR structural studies of monodispersed PVP/Gold and silver nano particles. J. Alloys Compd. 2015, 646, 326–332. [Google Scholar] [CrossRef]
- Deygen, I.M.; Kudryashova, E.V. New Versatile Approach for Analysis of PEG Content in Conjugates and Complexes with Biomacromolecules Based on FTIR Spectroscopy. Colloids Surf. B Biointerfaces 2016, 141, 36–43. [Google Scholar] [CrossRef] [PubMed]
- Negishi, Y.; Nobusada, K.; Tsukuda, T. Glutathione-Protected Gold Clusters Revisited: Bridging the Gap between Gold(I)-Thiolate Complexes and Thiolate-Protected Gold Nanocrystals. J. Am. Chem. Soc. 2005, 127, 5261–5270. [Google Scholar] [CrossRef]
- De Campos Vidal, B.; Mello, M.L.S. Collagen Type I Amide I Band Infrared Spectroscopy. Micron 2011, 42, 283–289. [Google Scholar] [CrossRef]
- Rehman, I.; Bonfield, W. Characterization of Hydroxyapatite and Carbonated Apatite by Photo Acoustic FTIR Spectroscopy. J. Mater. Sci. Mater. Med. 1997, 8, 1–4. [Google Scholar] [CrossRef]
- Nihmath, A.; Ramesan, M.T. Development of Hydroxyapatite Nanoparticles Reinforced Chlorinated Acrylonitrile Butadiene Rubber/Chlorinated Ethylene Propylene Diene Monomer Rubber Blends. J. Appl. Polym. Sci. 2021, 138, 50189. [Google Scholar] [CrossRef]
- Verma, N.; Zafar, S.; Talha, M. Influence of Nano-Hydroxyapatite on Mechanical Behavior of Microwave Processed Polycaprolactone Composite Foams. Mater. Res. Express 2019, 6, 085336. [Google Scholar] [CrossRef]


| Sample Symbol | PVP (mL) | PEG (mL) | GSH (g) | COL (g) | HA [% w/v] | PEGDA (mL) | Photoinitiator (µL) |
|---|---|---|---|---|---|---|---|
| A | 5 | 5 | 2 | - | - | 1.8 | 50 |
| B | 0.04 | - | |||||
| C | 5 | ||||||
| D | 15 |
| Tribological Test Set-Up | 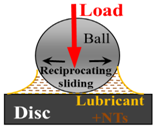 |
|---|---|
| Contactconditions | Point contact at reciprocating sliding |
| Track length | 1 mm |
| Speed | average 1 cm/s (3.18 Hz) |
| Normal Load | 500 mN |
| Mean contact pressure | 50 MPa |
| Temperature | 25 °C |
| Test duration | 1 h |
| Measured parameters | Coefficient of friction vs. time and wear volume |
| Sample | Se [%] | τ |
|---|---|---|
| A | 115.8 ± 5.0 | 30.41 ± 8.1 |
| B | 118.8 ± 5.1 | 29.7 ± 8.0 |
| C | 103.8 ± 4.5 | 41.14 ± 10.9 |
| D | 82.5 ± 2.8 | 47.3 ± 9.2 |
| Sample Symbol and H2O Drop Shape | θ H2O [°]—Contact Angle for Polar Fluid | θ DJD [°]—Contact Angle for Non-Polar Fluid | δPS [mJ/m2] Surface Energy for Water | δDS [mJ/m2] Surface Energy for Djd | δS [mJ/m2] Free Surface Energy |
|---|---|---|---|---|---|
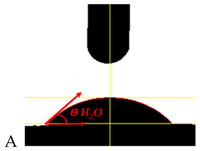 | 50.3 ± 1.3 | 35.0 ± 1.6 | 24.80 | 25.17 | 49.97 |
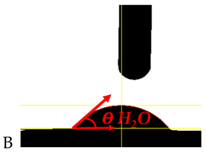 | 53.7 ± 2.0 | 26.27 ± 0.4 | 18.64 | 31.04 | 49.68 |
 | 40.1 ± 1.9 | 28.4 ± 1.0 | 32.30 | 24.74 | 57.04 |
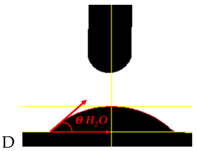 | 46.0 ± 1.9 | 27.1 ± 1.2 | 26.15 | 27.42 | 53.57 |
Publisher’s Note: MDPI stays neutral with regard to jurisdictional claims in published maps and institutional affiliations. |
© 2022 by the authors. Licensee MDPI, Basel, Switzerland. This article is an open access article distributed under the terms and conditions of the Creative Commons Attribution (CC BY) license (https://creativecommons.org/licenses/by/4.0/).
Share and Cite
Tomala, A.M.; Słota, D.; Florkiewicz, W.; Piętak, K.; Dyląg, M.; Sobczak-Kupiec, A. Tribological Properties and Physiochemical Analysis of Polymer-Ceramic Composite Coatings for Bone Regeneration. Lubricants 2022, 10, 58. https://doi.org/10.3390/lubricants10040058
Tomala AM, Słota D, Florkiewicz W, Piętak K, Dyląg M, Sobczak-Kupiec A. Tribological Properties and Physiochemical Analysis of Polymer-Ceramic Composite Coatings for Bone Regeneration. Lubricants. 2022; 10(4):58. https://doi.org/10.3390/lubricants10040058
Chicago/Turabian StyleTomala, Agnieszka Maria, Dagmara Słota, Wioletta Florkiewicz, Karina Piętak, Mateusz Dyląg, and Agnieszka Sobczak-Kupiec. 2022. "Tribological Properties and Physiochemical Analysis of Polymer-Ceramic Composite Coatings for Bone Regeneration" Lubricants 10, no. 4: 58. https://doi.org/10.3390/lubricants10040058
APA StyleTomala, A. M., Słota, D., Florkiewicz, W., Piętak, K., Dyląg, M., & Sobczak-Kupiec, A. (2022). Tribological Properties and Physiochemical Analysis of Polymer-Ceramic Composite Coatings for Bone Regeneration. Lubricants, 10(4), 58. https://doi.org/10.3390/lubricants10040058