Article

Finite Element Modelling of Wear Behaviors of Composite Laminated Structure

by
Mohammed Y. Abdellah
1,2,*,
Mohamed K. Hassan
1,3,*,
Abdel-Aziz AlMalki
1,*,
Ahmed F. Mohamed
1,4 and
Ahmed H. Backar
1,5
1
Mechanical Engineering Department, College of Engineering and Islamic Architecture, Umm Al-Qura University, Makkah 21955, Saudi Arabia
2
Mechanical Engineering Department, Faculty of Engineering, South Valley University, Qena 83523, Egypt
3
Production Engineering and Design Department, Faculty of Engineering, Minia University, Minia 61111, Egypt
4
Mechanical Engineering Department, Faculty of Engineering, Sohag University, Sohag 82524, Egypt
5
Production Engineering Department, Faculty of Engineering, Alexandria University, Alexandria 21544, Egypt
*
Authors to whom correspondence should be addressed.
Lubricants 2022, 10(11), 317; https://doi.org/10.3390/lubricants10110317
Submission received: 17 October 2022 / Revised: 10 November 2022 / Accepted: 14 November 2022 / Published: 18 November 2022
(This article belongs to the Special Issue Assessment of Abrasive Wear)

Abstract

:
Three different laminated composites are used in this study: carbon fiber, woven glass fiber, and glass-fiber-reinforced epoxy. The composite laminate structures were fabricated using the hand lay-up technique at room temperature. The laminates were reinforced with epoxy resin, carbon fibers (CFRP), woven glass fibers (GFRP-W), and random-orientation glass fibers (GFRP-R) to obtain laminates with eight layers. The wear test was performed using a pin-on-disc tribometer with five different loads of 10, 20, 30, 40, and 50 N at room temperature and a constant speed of 3 m/s. In addition, three different surfaces were lubricated: dry, with grease, and with oil. The effect of lubrication on the weight loss of the laminates was measured. The linear elastic finite element model FEM was derived to simulate the pin on the disc and the failure mode in shear mode for the case of dry lubrication. In addition, the FEM allows the friction force to be measured to determine the friction coefficient numerically. For validation, a simple analytical model based on the shear stress induced by the laminates at the interfaces was extracted to measure the friction coefficients. Tensile strength is a characteristic property that is very important for the purpose of material description from FEM and the analytical model. Therefore, it was determined experimentally with a simple tensile test. The results show that the wear rate is better with GFRP-R composites. Moreover, the wear rate with grease is lower than with oil or dry. The FEM showed that the coefficient of friction decreases with normal force to a minimum value of 0.02 for the case of 50 N normal force and for GFRP-R, while the maximum value of the coefficient of friction was 0.55 for CFRP at 10 N normal load and the FEM results were in good agreement with the analytically determined data.

1. Introduction

With human everyday demands, the need for developing materials that meet those needs has evolved since ancient times. Composed materials were the finest option for completing the tasks at hand. Fiber-reinforced polymer composite laminates, among the various forms of composite materials, have evolved in terms of many ancient and modern uses in all fields of life and have demonstrated their efficiency in the aerospace and structural industries. This is because of their ease of manufacture and reduced expenses compared to metals, but the lack of tolerance for friction and wear is an impediment to their usage in more applications that require resistance to friction and wear. Furthermore, CFRP and GFRP have important and relevant advantages in fatigue [1], which are enhanced when post-curing in water under hydraulic pressures [2]. Other applications were concerned with fiber-reinforced polymer, such as glass-fiber-reinforced polymer bar, which has a great attractive role in advanced new concerts [3], distinguished by light weight and saving material and considered to be a cost-effective alternative.
Many works attempted to study the tribological characteristics of laminated composite materials, the influence of fiber loading on the mechanical characteristics, as well as friction and sliding wear behavior of vinyl ester composites in both dry and water-lubricated conditions, with varying normal loads and sliding speeds. Friction and wear tests were performed at room temperature using a pin-on-disc machine configuration [4]. According to the findings of this study, increasing fiber content enhances some mechanical qualities while negatively affecting others. The inclusion of glass fiber as reinforcement improves the friction as well as wear qualities of vinyl ester. While the specific wear rate for vinyl ester composites is adversely proportional to the applied normal load in both dry and wet sliding conditions, the coefficient of friction is directly proportional to applied normal load and sliding speed in dry sliding conditions and negatively proportional to applied normal load in wet sliding conditions. Additionally, using a pin-on-disc test, the tribological behavior of pure vinyl ester (V), glass fiber reinforced (GFR), and SiC-filled glass-fiber-reinforced vinyl ester composite was examined under dry and water-lubricated sliding conditions [5]. The results show that the coefficient of friction under normal load, dry, and lubricated with water decreases with increasing temperature. The specific wear rate of the vinyl esters increased with increasing normal load under water-lubricated conditions but decreased with increasing normal load. However, the specific wear rates of the SiC-filled and GFR vinyl ester composites also decreased with increasing temperature. Under both dry and lubricated conditions, the applied average load increased. Additionally, the lubricant performed worse than the dry condition when the coefficient of friction and particular wear rates were tested at different loads and speeds. Moreover, the fiber loading was found to have effects on the mechanical and wear behavior of the vinyl-ester-based composite [6]. The specific wear rate for vinyl ester composites is adversely proportional to applied normal load under both dry and water-lubricated sliding conditions, in contrast to the coefficient of friction, which is directly proportional to applied normal load and sliding speed under dry sliding conditions and adversely proportional to applied normal load under water-lubricated conditions.
Experimental testing of the friction and wear properties of glass-fiber-reinforced polymer composites was conducted under a variety of sliding circumstances, including dry sliding, oil-lubricated sliding, and sliding in an inert gas (argon) [4]. According to the findings, oil-lubricated sliding and dry sliding both have higher coefficients of friction when performed in an environment of inert gas (argon). An FESEM analysis of the worn surfaces revealed that fiber separation is the primary source of the significant wear in argon.
Epoxy, carbon–epoxy, and glass–epoxy composites’ abrasive wear characteristics have been investigated and numerous weights and the impact of abrading distance have been studied [5]. As a function of load and abrading distance, the wear (calculated as volume loss) and specific wear rate were determined. As the load/abrading distance rises, the wear volume loss also increases. On the other hand, the wear rate increases with increasing load and decreases with increasing abrading distance. In terms of resistance to abrasion wear, the carbon–epoxy composite fared better than glass fiber–epoxy composite. In addition, the experimental investigation of the comparative performances of an epoxy-E glass composite with the effect of silicon filler using varied loads, sliding distances, and velocities was detailed [6]. It discovered substantial silicon particle control parameters that govern wear behavior.
On the other hand, Grewia serrulata bast fibers incorporated into unidirectionally woven fiber-reinforced laminates were chemically treated. Both treated and untreated bast fibers were produced by the hand lay-up method. The prepared sliding wear behavior ASTM G-99 was used to examine the specimens [7]. Materials having lower wear rates are more suitable for tribological applications. According to the findings, acetylated Grewia Polyester samples with serrulata fiber reinforcement and permanganate-treated fiber reinforcement showed much higher wear resistance than neat resin and untreated fiber-reinforced specimens.
Researchers have investigated what happens when glass fibers are hybridized with randomly oriented natural fibers. Epoxy matrix was used to reinforce woven E-glass synthetic fibers, sisal, and banana fibers. Nine distinct laminate types were produced using a varied stacking order [8,9]. The tensile strength was observed to increase with the addition of two and three layers of glass fiber. By employing two rather than three layers of glass fibers, banana-sisal fiber’s flexural properties improved and the laminate made of sisal and three layers of glass fibers has higher-impact strength.
The solid particle erosion behavior of unfilled and graphite-powder-filled carbon-fiber-reinforced epoxy composites at different impact angles was investigated using silica sand particles as the erodent [10]. The effects of impact angle and filler content on the rate of erosion of carbon epoxy composites are examined. The semi-ductile erosive wear behavior of carbon epoxy composites, both unfilled and loaded with graphite, was best observed at a 45° impingement angle. In terms of resistance to erosive wear, unfilled composites performed better than those filled with graphite. Erosive wear weight loss increased in graphite-filled composites from 0 to 4% but decreased in filled ones from 6% to 4%.
Fabric-reinforced polyetherimide composites’ abrasive wear behavior was investigated [11]. However, it was discovered that the mechanical characteristics of the composites could not be correlated with the wear performance. On the other hand, a worn-surface investigation by SEM helped to link composite performance to surface topography, failure of the fibers, resin, and their interface. The wear performance of composites was thought to be predominantly affected by variations in fiber failure modes.
Experimental research is conducted to examine the wear behavior of woven glass textiles and aramid fiber-reinforced composite materials [12]. The results showed that the specimens’ applied stress had a bigger impact on wear than their speed. Furthermore, the weight reduction in the woven composite with 500 glass fibers was larger than that in the composite with 300 glass fibers. The weight loss of aramid fiber-reinforced composites is rather small when compared to woven glass fabric-reinforced composites.
Graphite-filled carbon-fabric-reinforced epoxy composites’ dry sliding wear and two-body abrasive wear characteristics were the subject of experimental investigation [13]. The reference material was an epoxy composite reinforced with carbon cloth. The results showed that larger loads and sliding velocities resulted in more wear loss under dry-sliding-wear conditions. The experimental results show that the counter-face material (hardened steel disc and SiC paper) has a considerable impact on the wear of the composites.
An earlier study on the sliding wear behavior of laminated composites showed that the presence of subsurface cracks and severe plastic deformation defined wear in the copper layer [13,14]. These cracks formed in shear bands within the plastic zones beneath the contact surfaces, resulting in delamination of the material adjacent to these surfaces. Wear of metallic glass coatings also resulted in localization of plastic deformation in shear bands. The wear resistance of the nickel alloy was greater than that of the copper matrix due to its high hardness and fracture resistance. Local strain and temperature gradients caused amorphous layers to crystallize during sliding contact. Metallic glass layers improved the wear resistance of the composite by supporting the load with less deformation, thus, hindering the damage process starting in the copper layers.
The problem of tribological properties was significant in many works; this problem can be solved using numerical and analytical models. Põdra, et al. [15] used FE modeling via ANSYS to predict the coefficient of friction through pin-on-disc wear tester. Recently, another study used the same software [16] to simulate the pin on disc, where polyoxymethylene was the pin, with the pin sliding over a steel disk. It was a 2-D model, based on a Coulomb friction model, which was based on the Holm–Archard equation. More recently, FEM based on Archard’s model was used by Rajesh A M et al. [17] to simulate the problem of pin on disc for an aluminum composite as the pin and stainless steel as the disc. Moreover, the optimization technique using ANOVA analysis was carried out to establish that wear rate was mainly effected by load and sliding distance more than material composition. Additionally, Taguchi’s experimental technique was used to obtain an optimization experimental matrix of the pin-on-disc wear of a walnut-shell-powder-reinforced polymer and FE simulated the wear test [18]. Laminated composite material was used as a bearing material by Rezaei et al. [19], as they analytically simulated the contact and wear problem using Mixed Lagrangian–Eulerian formulation. In addition to the wear rate, the study dealt also with clearance and contact pressure influencing the wear performance.
As cited in the previous study, many works were carried out over failure and strength of composite laminates under lading, while little work considered the tribological properties of such a material if used as a bearing material or the influence of abrasive environment over composite laminates. The main objectives of the present study are to study the following goals: (1) the wear behaviors of a composite laminate reinforced with three different types of fiber material (carbon fiber, woven glass fiber, and random glass fiber) under three different types of interfacial lubrication (dry, grease, and oil lubrications), (2) to investigate the damage and failure induced due to friction shear stress using FEM, and (3) finally, to measure the coefficient of friction using FEM related to the principles of engineering mechanics.
The paper is organized as follows: In the first section, the laminated hand-layup technique is outlined; then, in the second part, the tensile and wear tests were explained. For the third part, FEM was derived, followed by static friction coefficient, calculated using the basic static force equilibrium. In the last section, the results and discussion of the related work were established.

2. Material and Method

2.1. Material Preparation

While epoxy resin serves as the matrix material, three distinct kinds of woven fibers—carbon, glass, and random fibers—are employed as reinforcement. Table 1 [20,21] contains a list of the characteristics of these components. The hand lay-up approach, which is the least expensive and most affordable way, was used to build the composite laminate [22,23,24]. The following steps may be used to summarize the hand lay-up technique: (1) There are two glass plates; the base plate has wax coating that acts as a release agent and prevents sticking. (2) An epoxy coating layer is first applied, followed by a woven fiber layer and then a final epoxy layer is added, this time being evenly distributed with a brush and filled in with an aluminum roller to fill in any gaps. (3) The previous step is carried out once again using the clean fiber layers to create an eight-layer laminate (Figure 1). (4) Another glass plate containing a releasing agent is applied above the entire layer. (5) A set of dead weights are positioned above the top plate in order to obtain a general uniform thickness [24]. After 24 h, the glass plate was removed and the composite was left to fully cure at ambient temperature for three weeks [25]. This curing technique is simple to use, very reliable, and does not require heat energy [26]. The manufacturer’s recommended mixing ratio of 2:1 by weight for resin to hardener was used. The fiber volume fraction was determined using the ignition procedure as stated in ASTM D3171-99 standard [27,28]. In addition, a sample of 10 mm × 10 mm was weighed after and before firing in a kiln for over 575 ± 25 °C, let the sample fire for 30 min. The average volume fractions for glass-fiber-reinforced polymer (GFRP-W), random glass fiber-reinforced polymer (GFRP-R), and carbon-fiber-reinforced polymer (CFRP) were determined to be 45%, 65% and 65%, respectively. The proportion of voids was neglected in the laminate study because the effect of voids was observed in unidirectional laminates when loaded transversely across the fibers, while this is small in multidirectional laminates. CFRP, GFRP-W, and GFRP-R are all denoted by the letters S1, S2, and S3, respectively. The average thickness (t) for S1, S2, and S3 materials was 2.2, 5, and 2 mm, respectively.

2.2. Tensile Test

According to ASTM D3039 [32], the Un-notch tensile test was conducted. To ascertain their mechanical characteristics, CFRP, GFRP-W, and GFRP-R are tested. The tests were conducted using Zwick/Roell type Z600H H-series hydraulic material testing equipment having a maximum load capacity of 600 kN and a control speed of 2 mm/min [33]. Figure 2 shows a schematic illustration of the specimen geometry. The edges of the laminate were cut to a distance of at least 15 mm from the edge with a circular saw. The working areas of the test specimens were about 40 mm from the edge. The planned dimensions of the test specimen were achieved with a water jet machine to minimize the effect of cutting and to avoid damage to the laminates and delamination. To minimize the specimens’ slippage and damage caused by the clamping force, aluminum taps are positioned in the gripping region at both ends of the specimens. The surface of the tabs was roughened with fine sandpaper before gluing with epoxy resin. These end tabs not only reduce the stress concentration of serrated grips. Test specimen was five samples for each material.

2.3. Wear Test

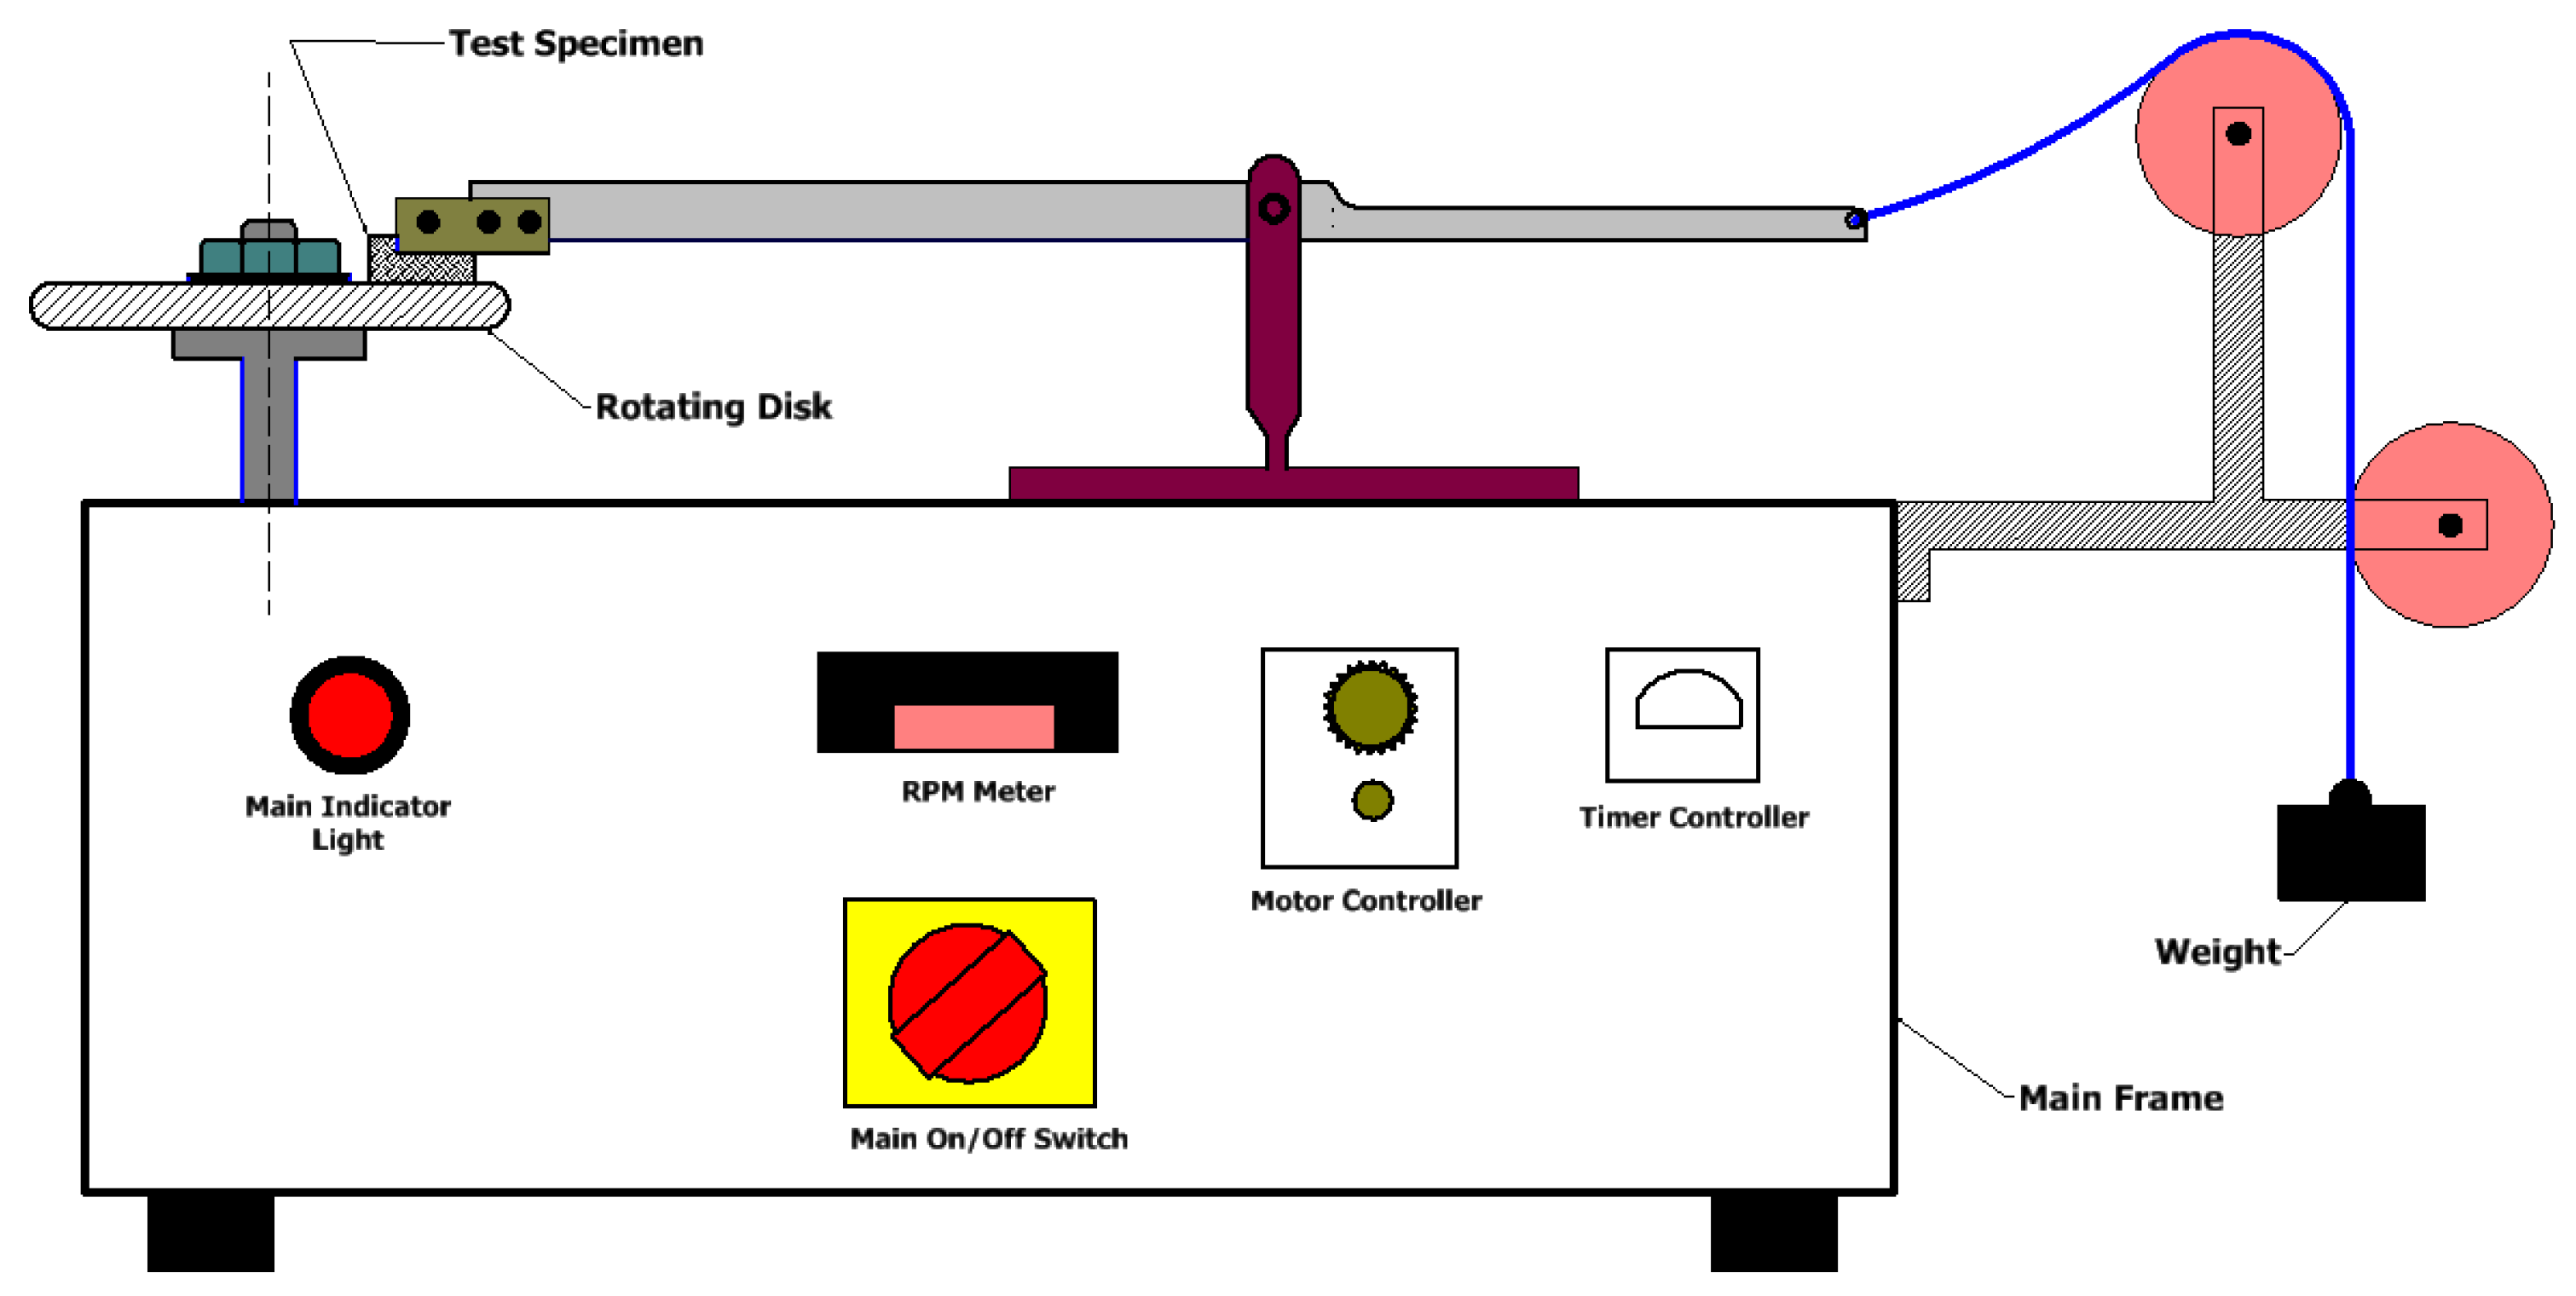
The wear test is carried out on CRFP, GFRP-W, and GFRP-R specimens. The test is performed with a Pin-on-Disc wear testing machine; Figure 3 illustrates a general view of the wear test device [34]. It consists of a horizontal steel disc that rotates and is driven by a motor with variable speed. A specimen holder that is connected to the loading lever and pressed up against the rough counter-face is used to hold the specimen. Five different loads 10, 20, 30, 40, and 50 N at room temperature and constant velocity 3 m/s were used. Prior to the test, emery paper was used to polish the test specimens’ surfaces that would meet the disc. A steel disc with an inner diameter of 50 mm, an outer diameter of 100 mm, and a thickness of 2 mm serves as the counter-face. Sandpaper of 80 grit with a surface roughness of 1.80 × 10⁻⁶ m was applied to the disc. The sandpaper was attached to the disc with epoxy glue. After the test was carried out, it was cured for one day. Three different conditions are used: dry, commercial oil, and grease-lubrication conditions. The test was carried out over the specimen thickness. The specimen weight is measured before and after the test, then the weight loss is calculated as the difference between the two measured weights. The specimen primary weights were 4.5 g, 8 g, and 4 g for CFRP, GFRP-W, and GFRP-R, respectively. The specimens were cut from the laminated board with a hand saw using lubricating oil to reduce the coefficient of friction between the saw and the layer of the specimen and to avoid delamination. The motor speed was 400 rpm. The samples were all tested for a constant time of 1 min. This time was chosen after many trials to achieve optimal conditions to maintain the samples without damage and delamination. Table 2 lists the obtained specimen dimensions and number of fibers measured at the specimen edges based on number of fibers in one bundle.

2.4. Friction Coefficient

It is the ratio between the normal force that pushes two surfaces together and the frictional force that prevents movement between the two surfaces. Usually, it is represented by the Greek letter mu (μ). Mathematically, it is equal to F/N, where F is the frictional force and N is the normal force. The coefficient of friction has no dimensions because both F and N are measured in units of force (such as newtons or pounds). For both static and kinetic friction, the coefficient of friction has a range of values. When an object experiences static friction, the frictional force resists any applied force, so the object remains at rest until the static frictional force is removed. In kinetic friction, the frictional force opposes the motion of an object [35].

2.5. Analytical Model

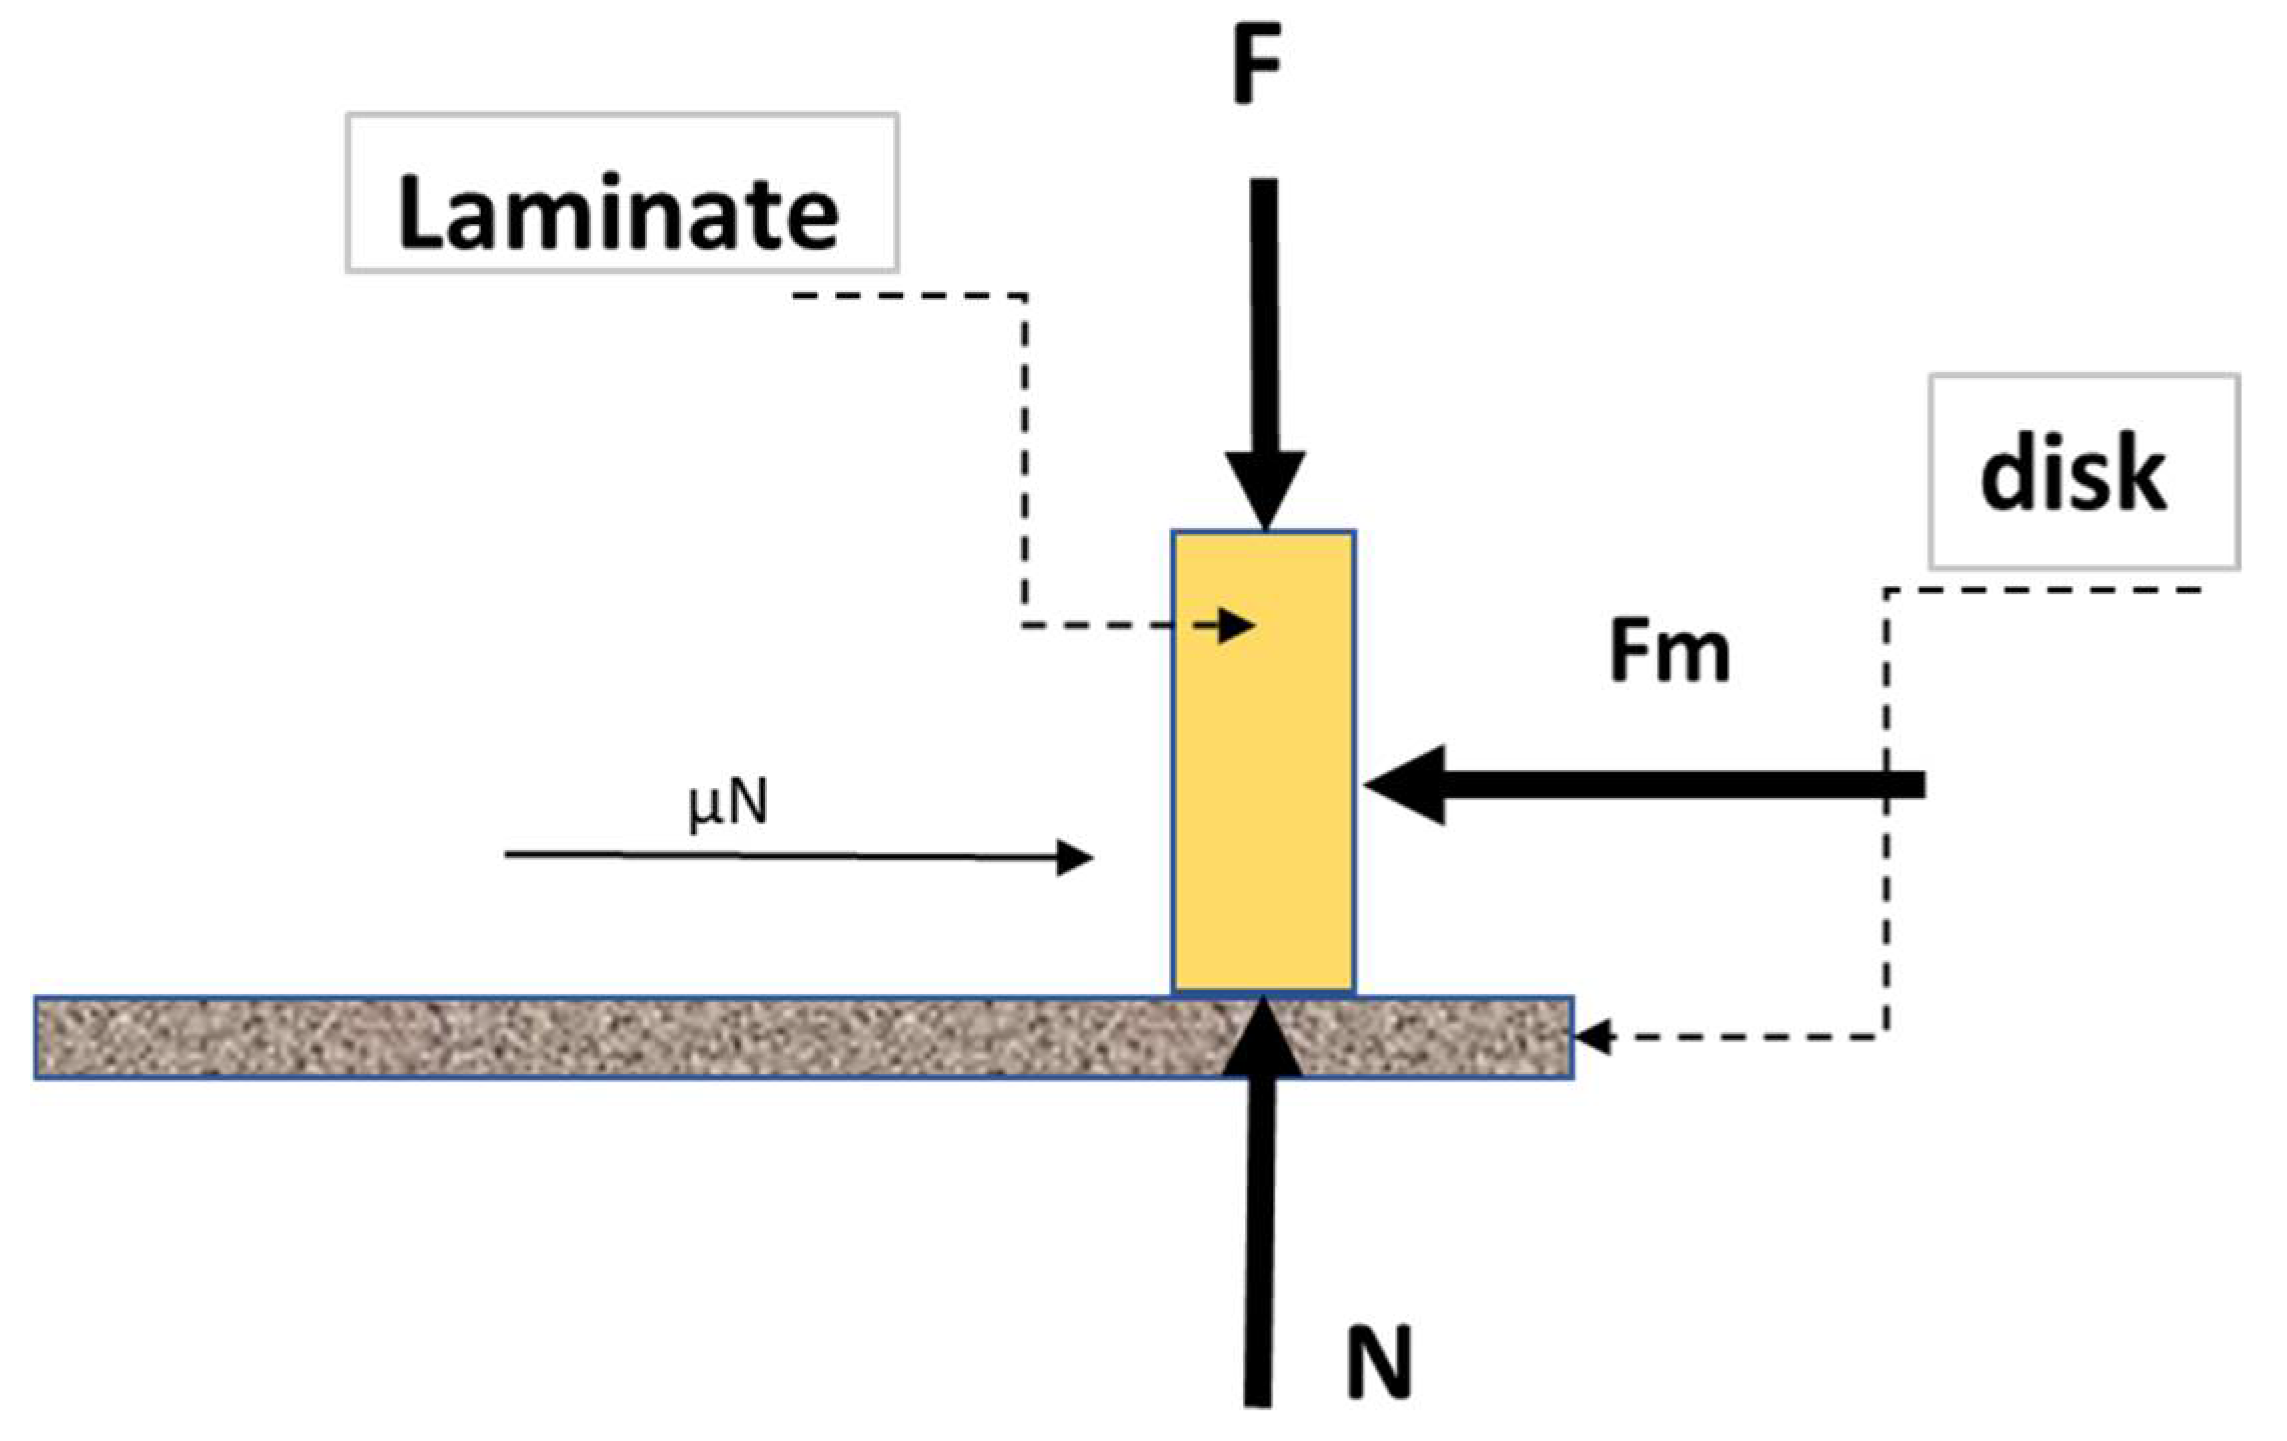
The equilibrium analysis is derived over the system shown in Figure 4, derived as follows:
y = 0 = F N l e a d   t o   F = N
For static case, it was just before moving, acceleration (a) = 0, according to principles of engineering mechanics [36]; therefore, the coefficient of friction can be calculated using the following equation.
μ = F s N
where F s friction force, N is the normal or reaction force while specimen weight was neglected in case of static behavior; also, Equation (2) is known as Coulomb’s Law. The analytical model can be expressed in terms of shear stress through the contact area and number of asperities contact n (number of fibers through width) in one lamina, as follows [37]:
τ = μ p
where τ is the material shear stress which can be measured in this case using the maximum shear stress criterion and is valid for linear material with multidirectional and woven fibers [38,39], as these types of stacking sequence properties are quite homogeneous or isotropic. Therefore, the equation can be calculated as follows:
τ = σ u 2
where σ u is ultimate strength of material. Moreover, the contact pressure depends on numbers of asperities or debris at the interfaces of the mating elements; therefore, it can be calculated using the following (Equation (5)):
p = F n A
where n is the total number of asperities through one layer of the composite laminates. The analysis was performed over lamina level because the shear stress is induced through lamina after failure courses [40,41]. Substituting Equation (5) into Equation (3), the friction coefficient can be obtained as follows:
μ = σ u × A 2 × n × F

2.6. Finite Element Modeling

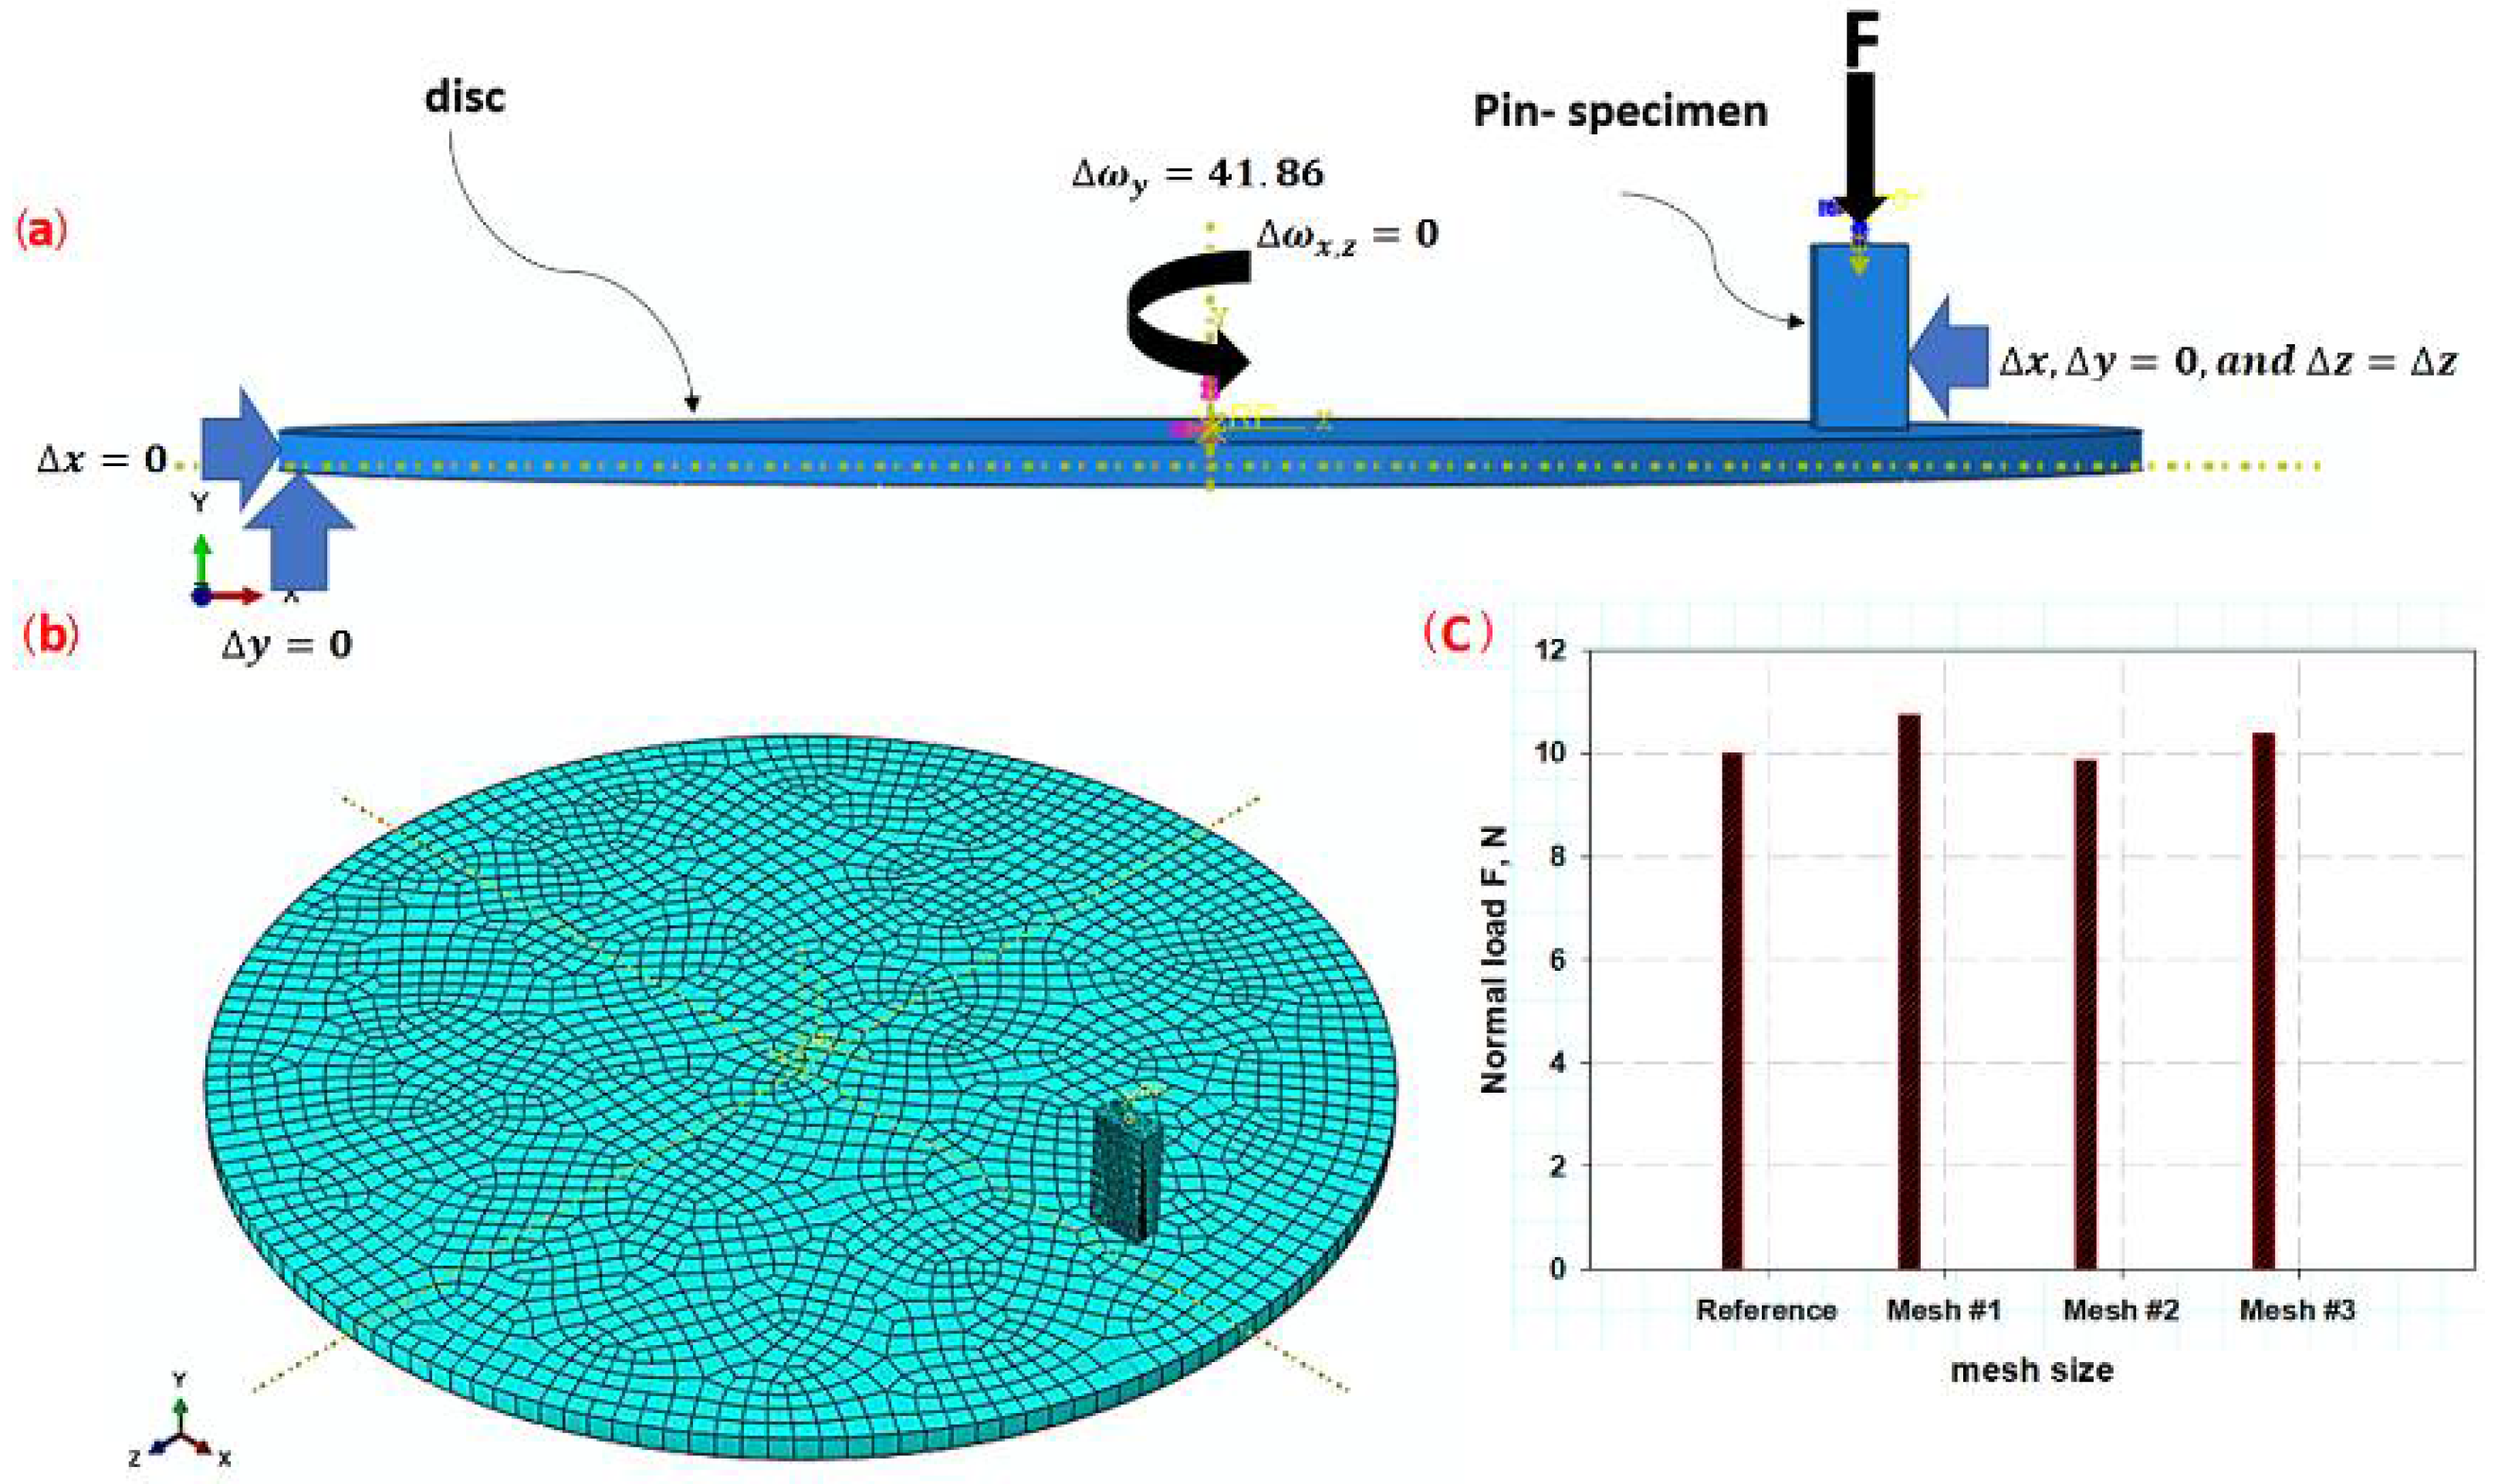
FE is a model that was developed to simulate the pin-on-disc test for composite laminates with different fiber types under dry condition only for simplicity. The main purpose of the model was to measure both the static frictional forces F s . The linear elastic finite element model was created using the stress–strain data obtained from a simple tensile test. The theory of maximum principal stress for elastic failure was chosen for all materials. The material of the disc, however, was selected as perfectly plastic rigid. The material properties are listed in Table 3. The element type used was C3D8R: a linear brick with 8 nodes, reduced integration, and hourglass control for both the pin and the disc. The number of elements was selected after a mesh convergence study, where three pairs of mesh size were selected for disc and pin: mesh # 1 (716, 1875), mesh # 2 (1233, 3125), and mesh # 3 (2403, 6250). The reaction force is compared to accuracy for 10 N normal load with CFRP. The degree of accuracy is illustrated in Figure 5c. The number of elements for the disc was with mesh # 2 which was 3125, while the number of elements for the pin material (sample) was 1233. It was selected because it gives a closer normal load. The disc was restricted in its linear movement in all x, y, and z directions, while it was given a rotational movement Δ ω y   = 41.86 around y directional which is corresponding to 400 rpm of the disc. The pin specimen, on the other hand, was fixed in the x and z directions, while it had one degree of freedom in the y direction where the loads were applied. A displacement of 0.01 mm with linear modes was chosen to evaluate the damage [28]. The static frictional force corresponded to the z direction. It was measured for the static condition with the pin connected to the surface. The contact properties were normal load with hard contact pressure and rough friction formation. It was used as pair of contacts for master surface is the disc and the slave was the pin material.

3. Results and Discussion

3.1. Tension Test

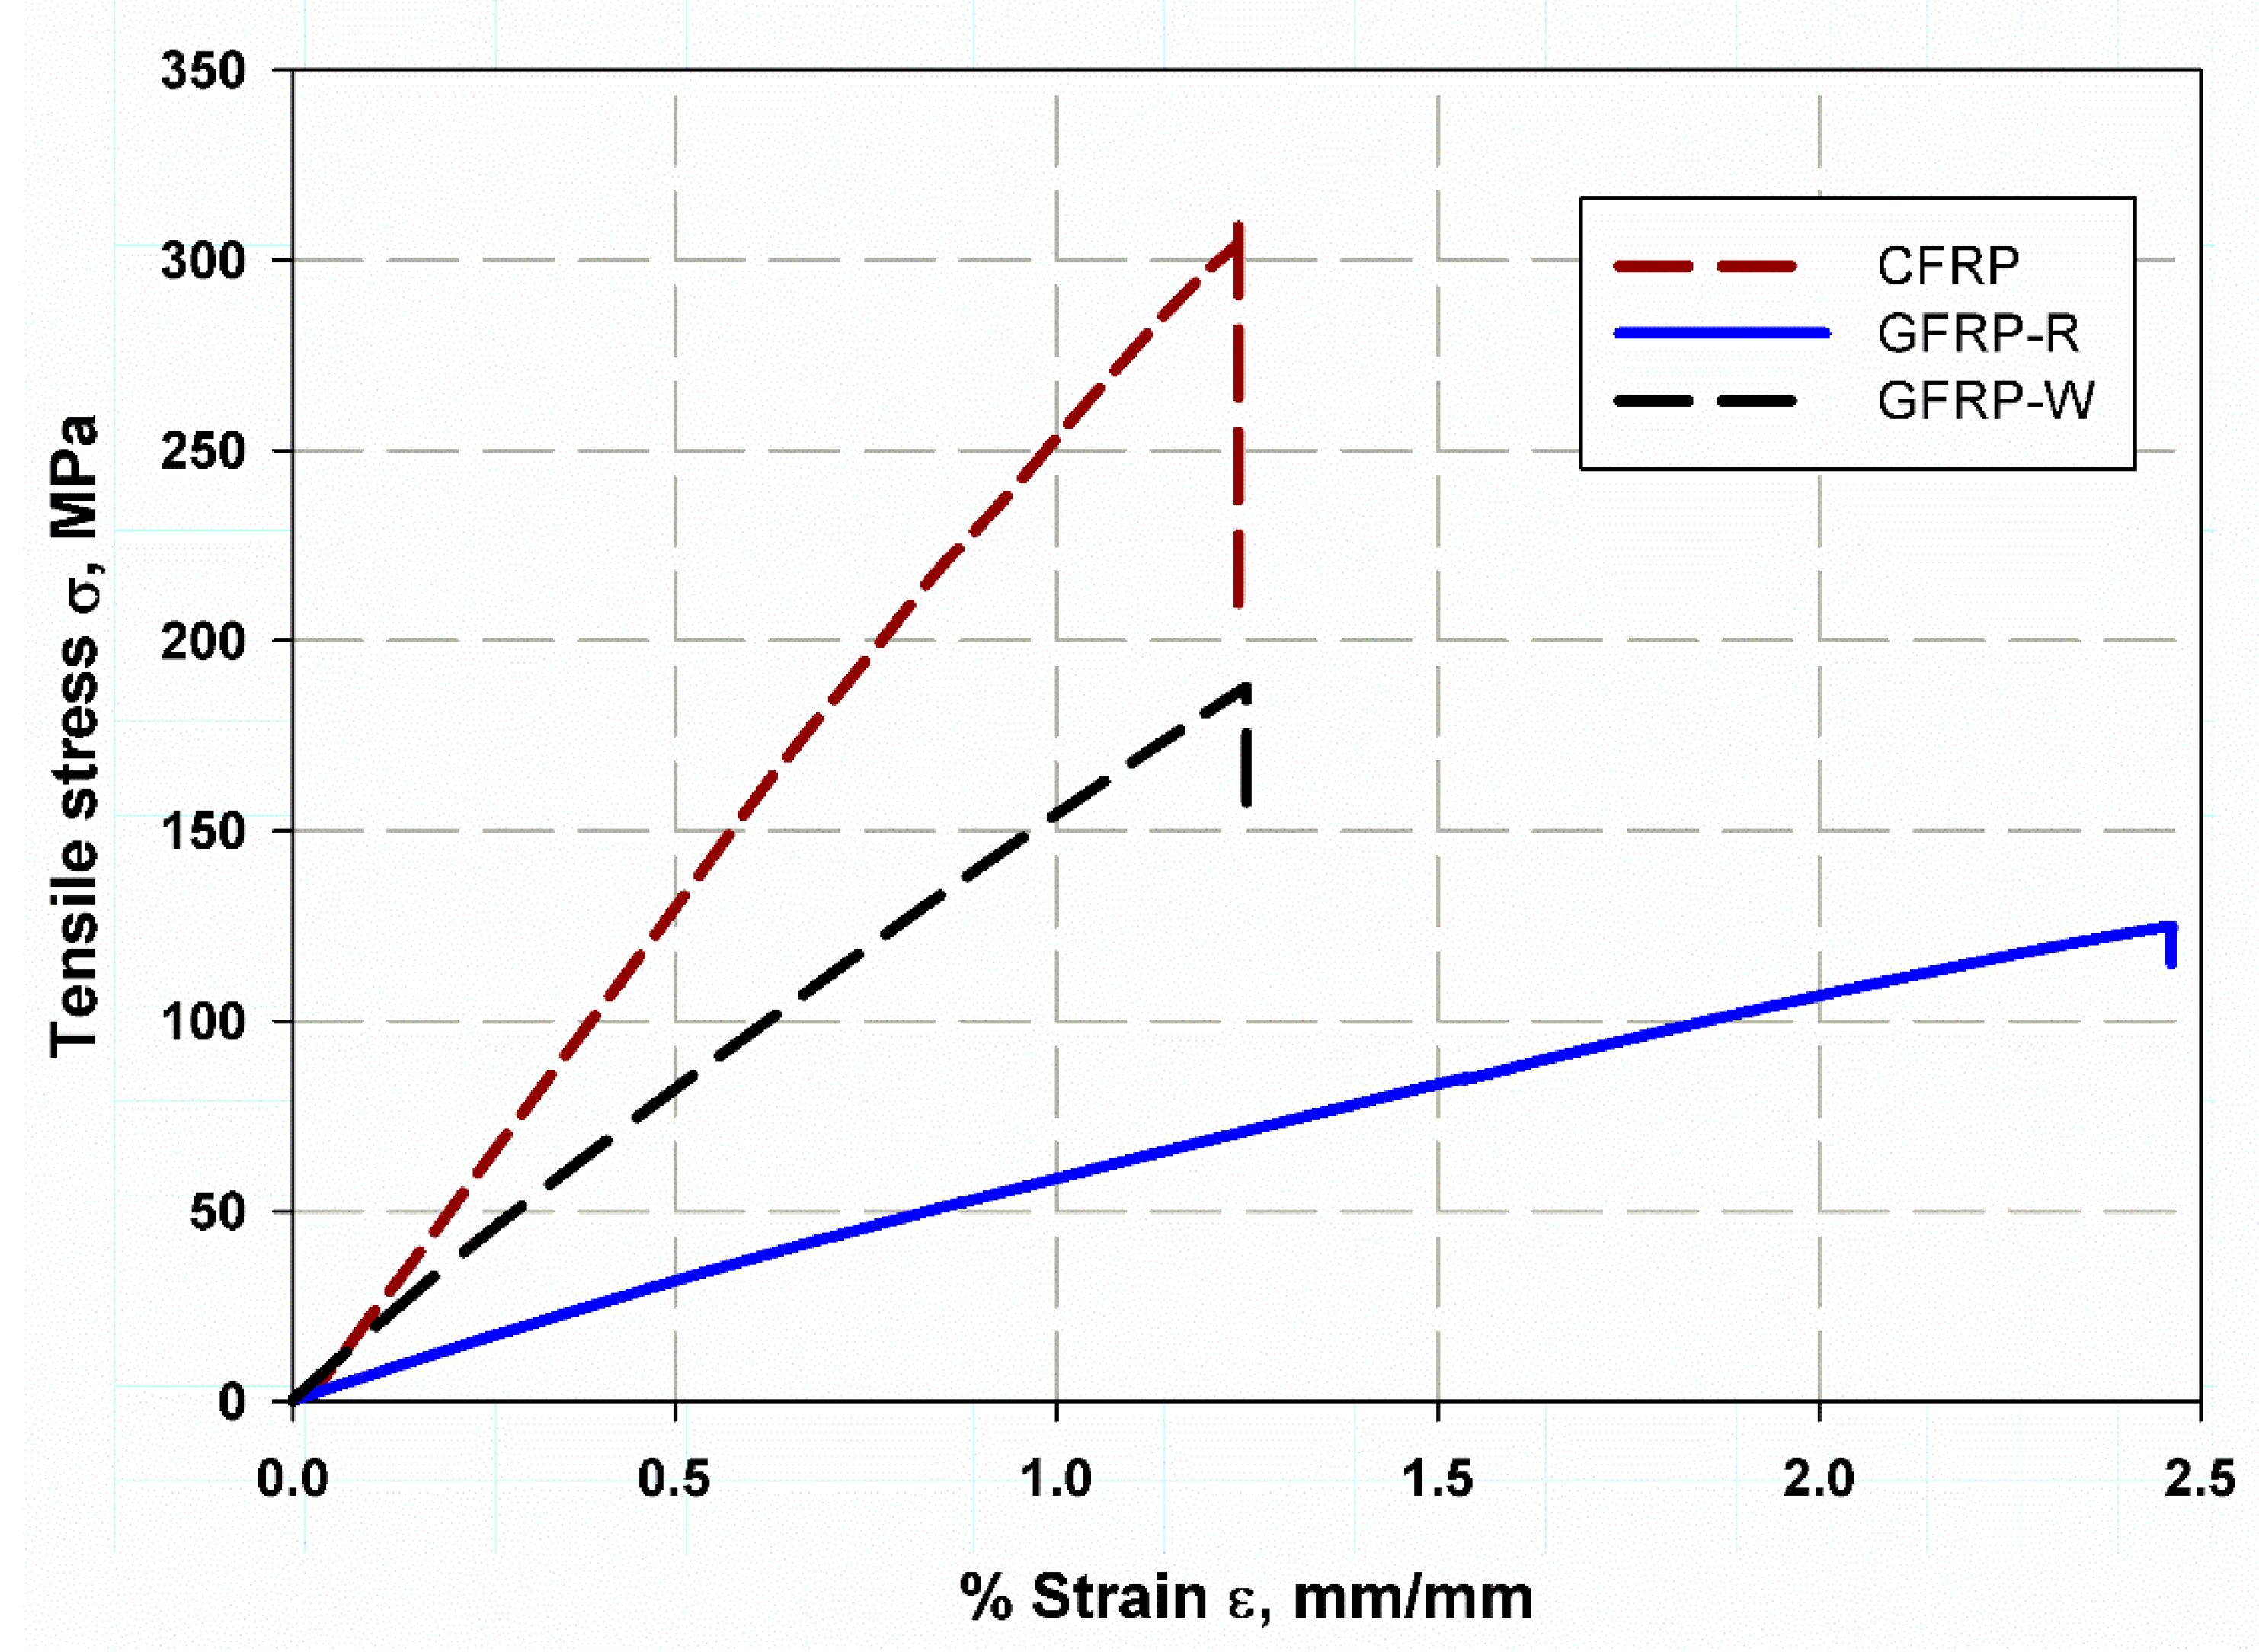
For the purposes of FEM and analytical modelling, the material property should be specified. The relationship between stress and strain in the composite laminates is shown in Figure 6. The elastic modulus of CFRP increased to 27.13 GPa, with a standard deviation of 1.7 GPa, and the average tensile strength of S1 reached 303 MPa, with a standard deviation of 17.98 MPa. GFRP-W had lower average tensile strengths of 187.5 MPa, with a standard deviation of 10.5 MPa for GFRP-W S2 and higher average elastic modulus of 15.36 GPa, despite the reduced values in the case of GFRP-R S3, where the corresponding elastic modulus was extremely low at 5.01 GPa, with a standard deviation of 1.5 GPa and the average tensile strength reduced to 125 MPa, with a standard deviation of 2.5 MPa. This is because carbon fibers are more rigid and strong than random fibers or woven glass fibers. Due to carbon fiber’s stronger stiffness and lesser ductility, as compared to woven glass fiber, which has intermediate % elongation values, material S3 having random fiber (GFRP-R) has a nearly 2.43 bigger percent elongation in comparison to material S1 with carbon fiber (CFRP). The flow profile of the stress through the entire strain path was linear, which can be attributed to the high stiffness and the increasing volume fraction of the fibers. Both S1 and S2 exhibit net tension in the failure modes (see Figure 7a,c). However, the net tension test in material S3 with disordered fiber direction is linked to fiber pullout because the fibers have numerous directional possibilities, as there is less adhesion between the disordered glass fibers than there is for carbon fibers. Furthermore, failure occurs as delamination in the thickness due to the relative increase in thickness of 5 mm when compared to other materials; therefore, the S2 material with woven glass fibers does not have a failure zone (see Figure 7b). Furthermore, the shear stress for all specimens was calculated based on the maximum shear stress theory (Equation (4)). Therefore, it was found that the maximum values of shear stress are 150 MPa for CFRP materials, while the lowest value for S3 materials with random fibers is 62.5 MPa and the mean value is 93.5 MPa and is attributed to GFRP-W. The lower values of SDV were found for the S3 samples with glass fibers in the random direction, indicating that the data are clustered around the mean value, while they were higher for CFRP because the thickness and damage tolerance were low. The data in Table 3 were relatively very low compared with the fiber properties provided in Table 1, which was due to that the data in Table 1 being for fiber only, which is very high with respect to the epoxy data, 2.5 GPa for young modulus and 85 MPa for tensile strength. For composite materials, the main advantage is the closeness of the properties of the polymer matrix with fiber; therefore, the data in the table are considered higher than resin only and obtain other materials with different properties [42,43].

3.2. Wear Test

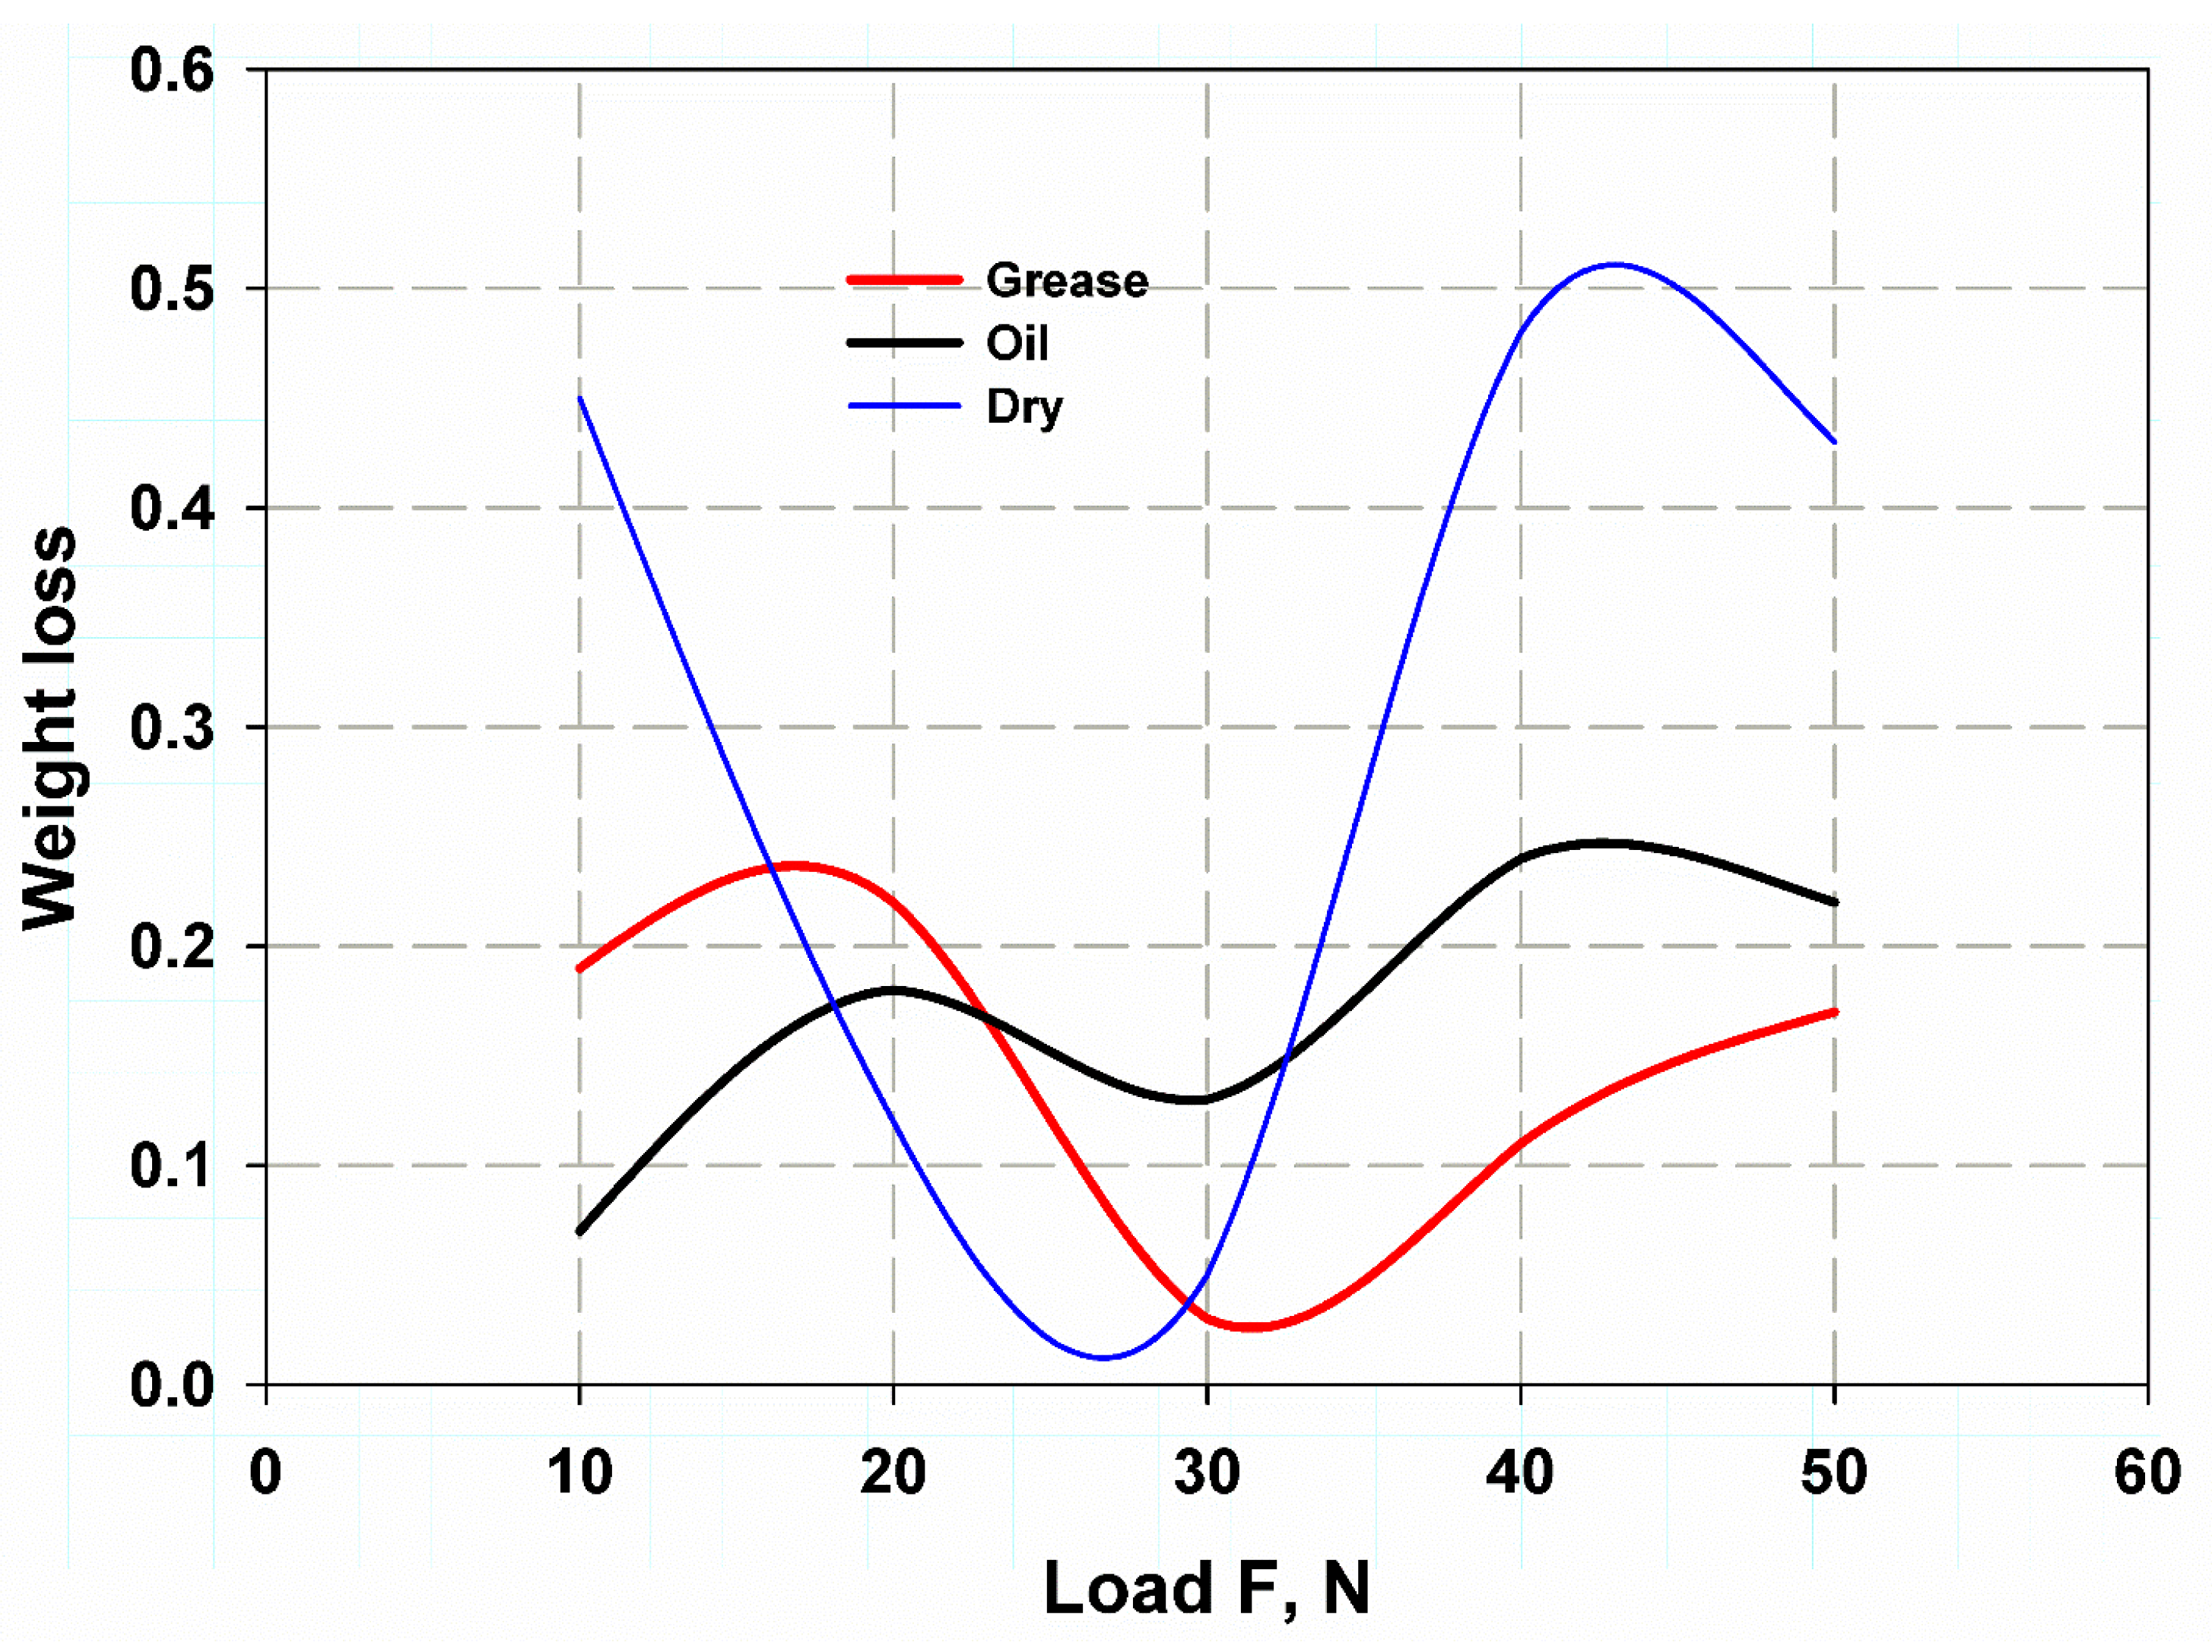
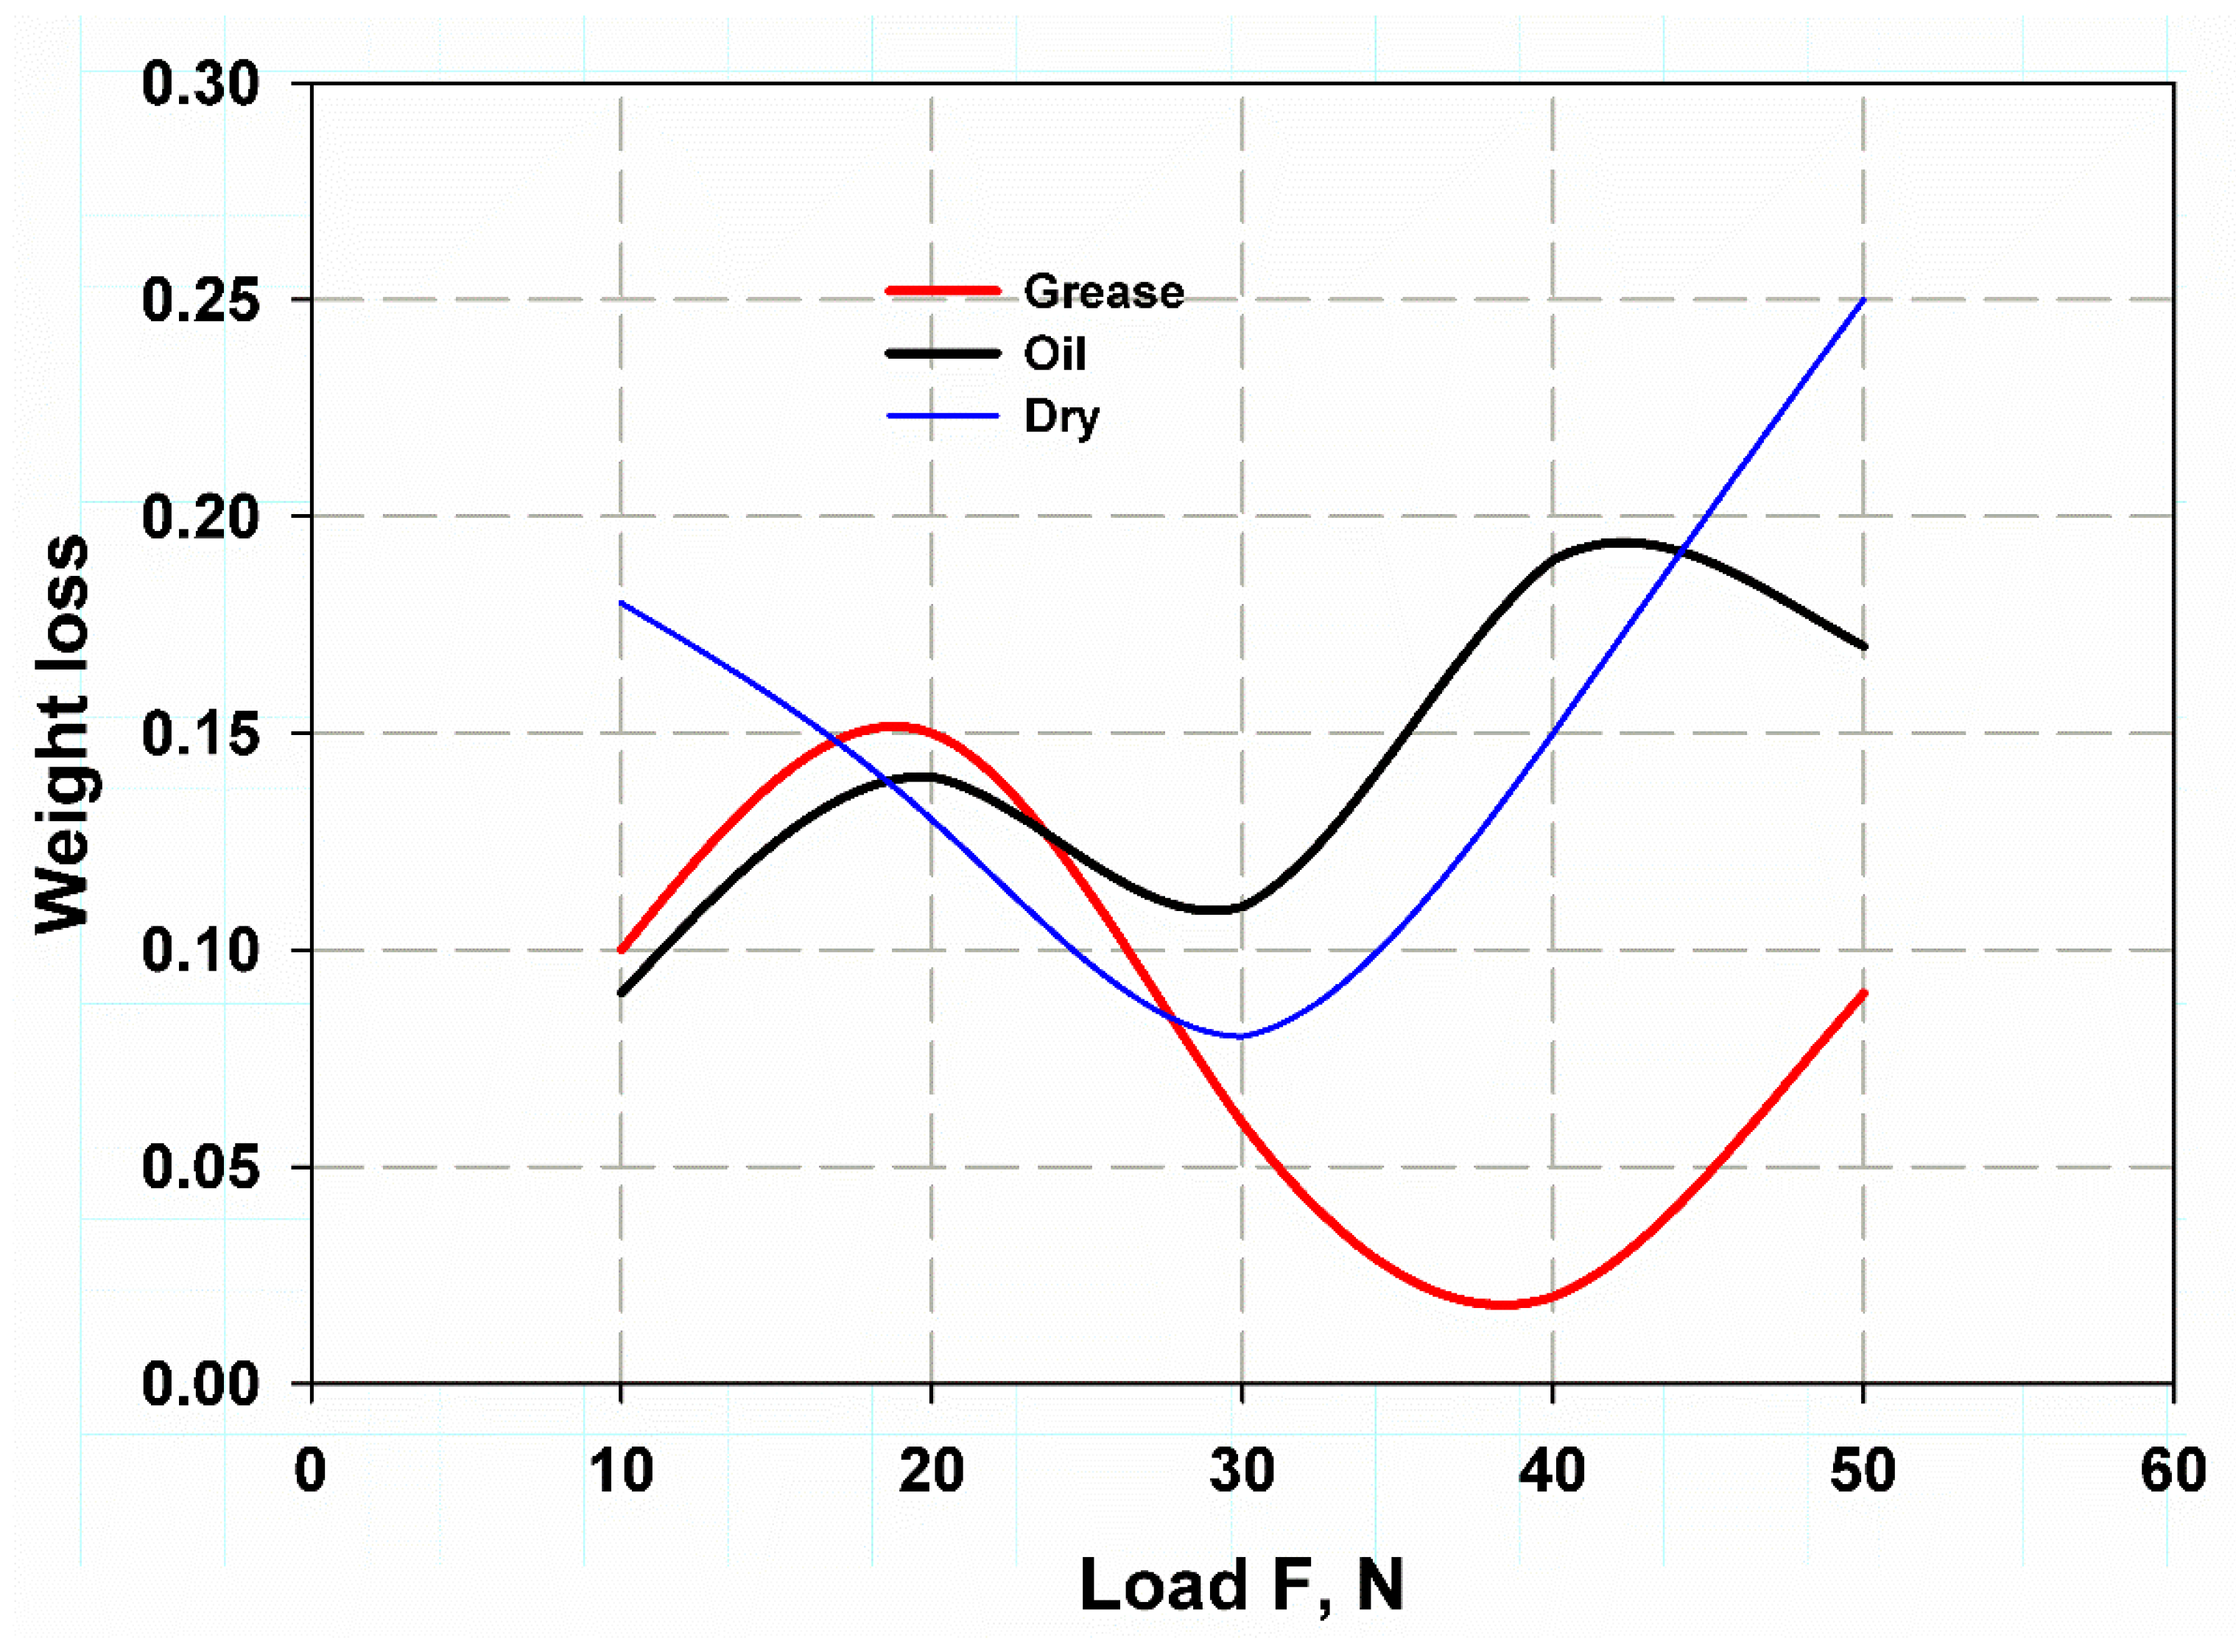
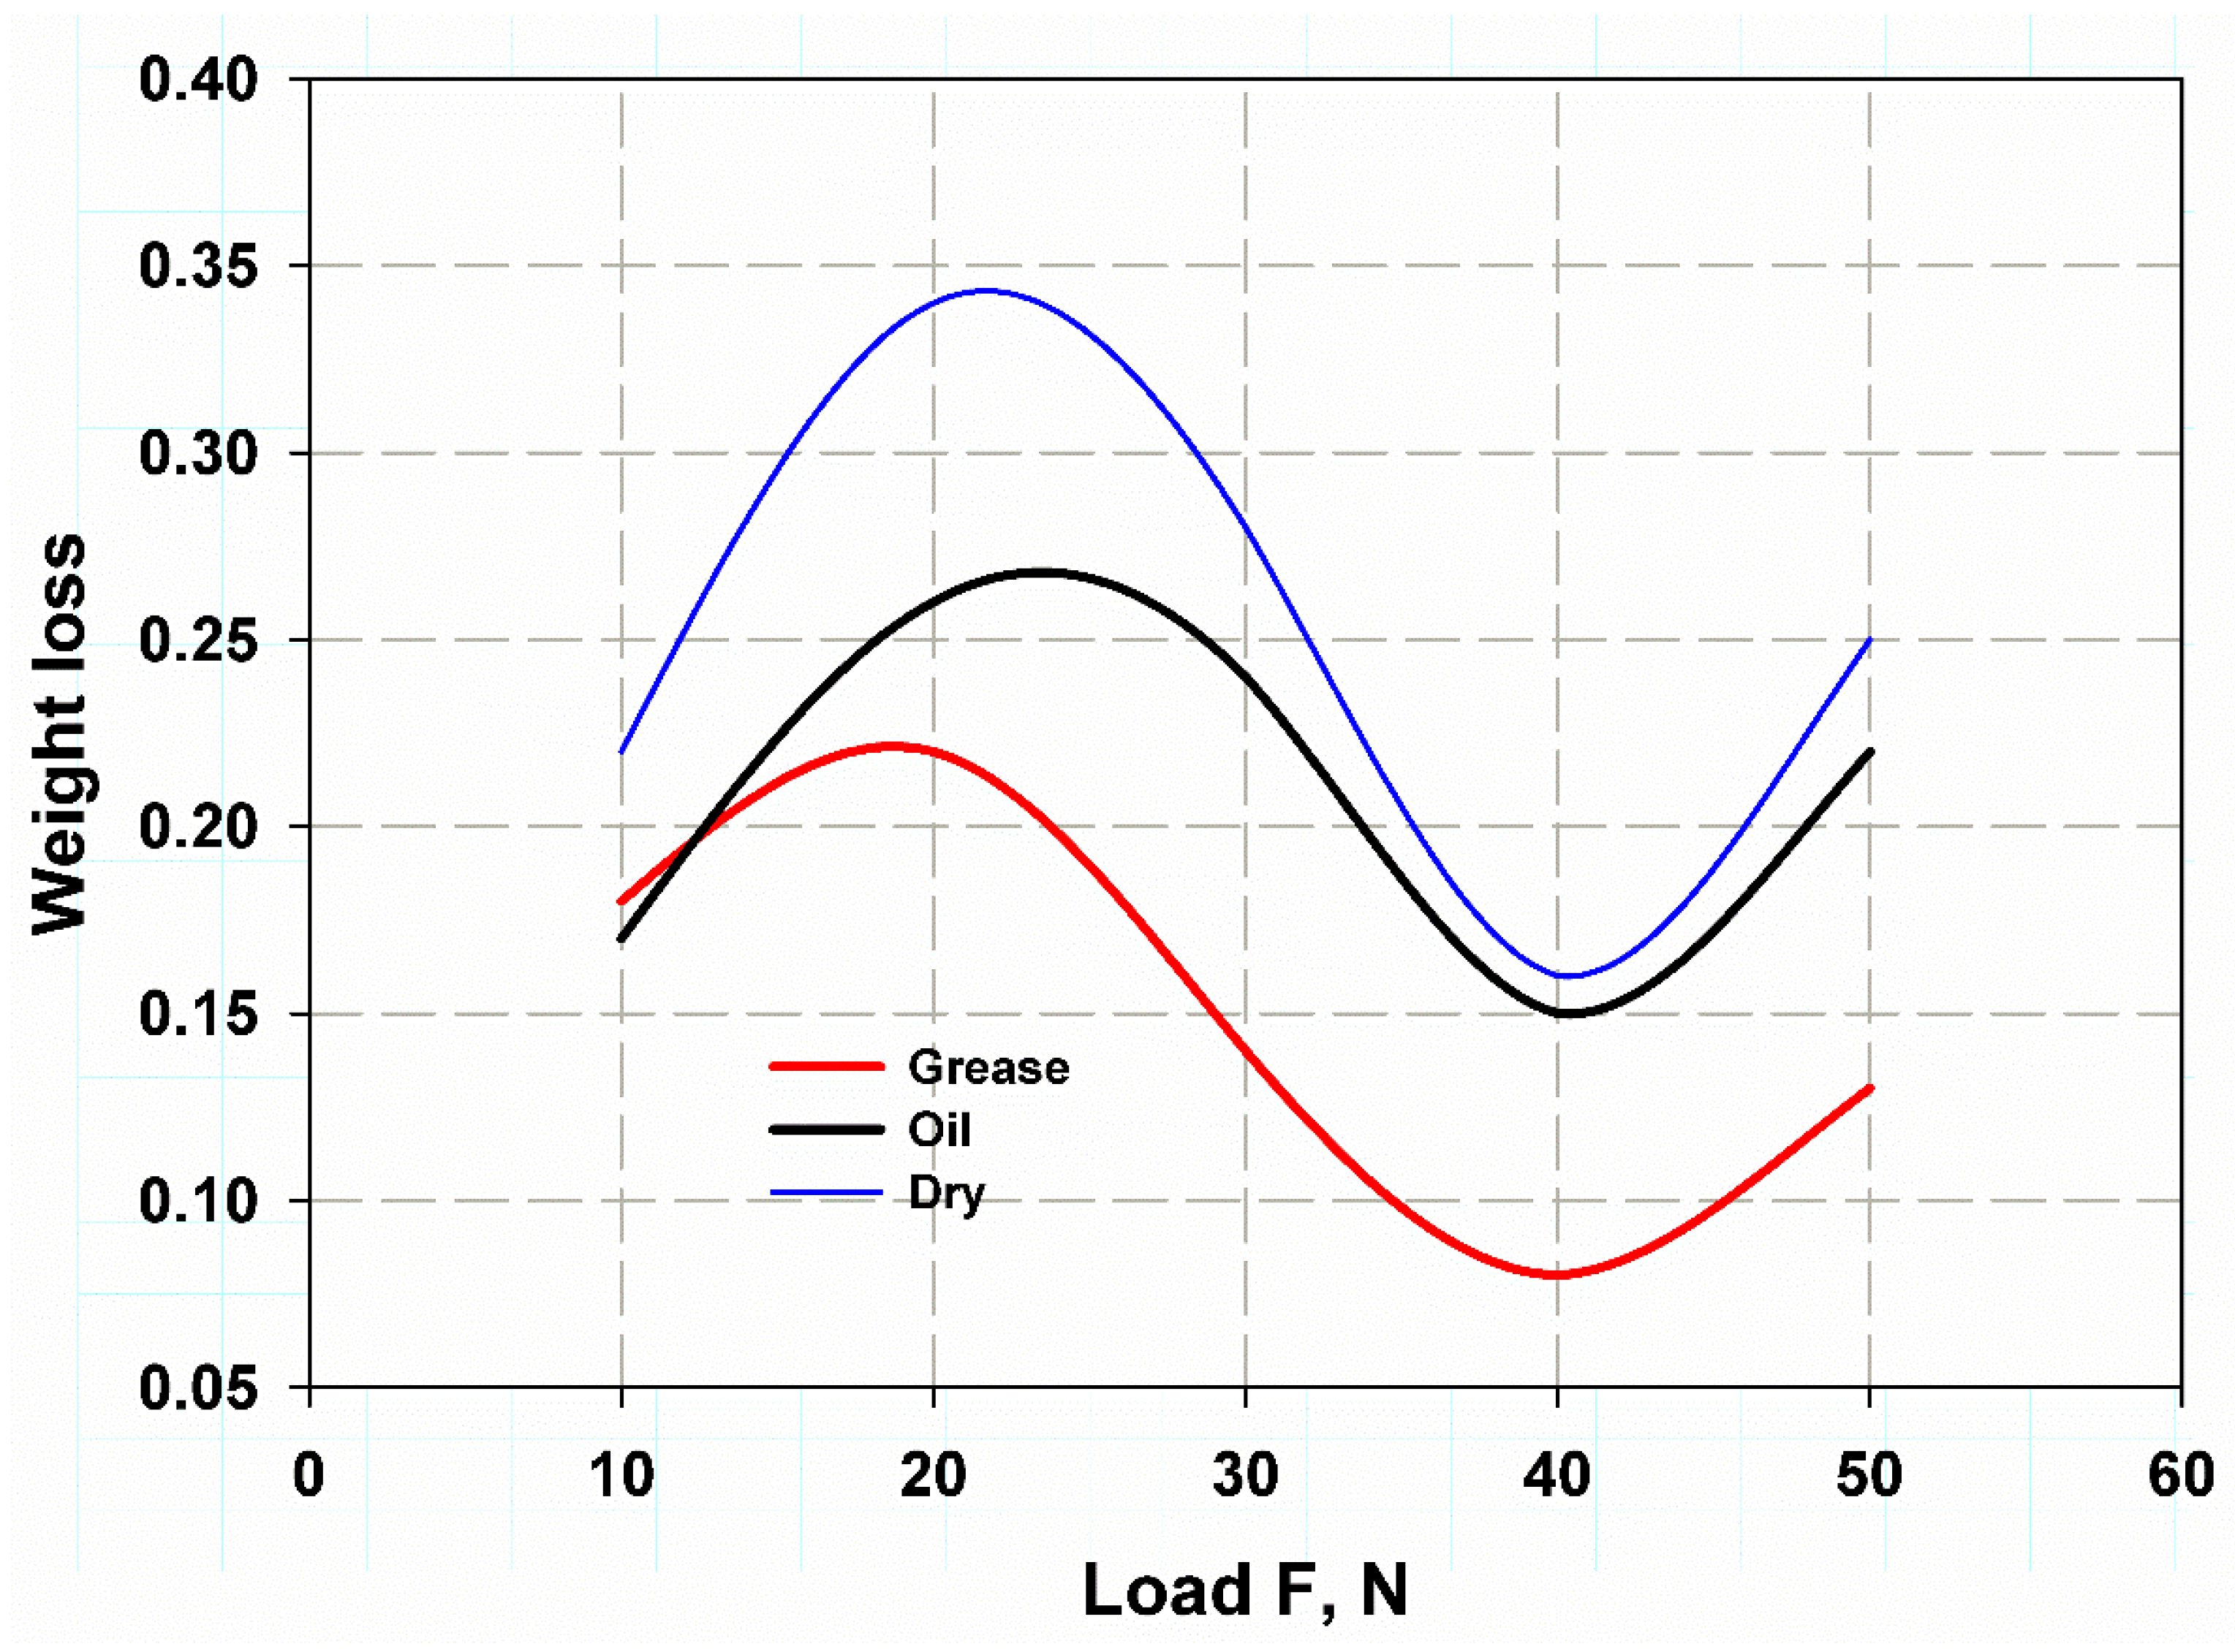
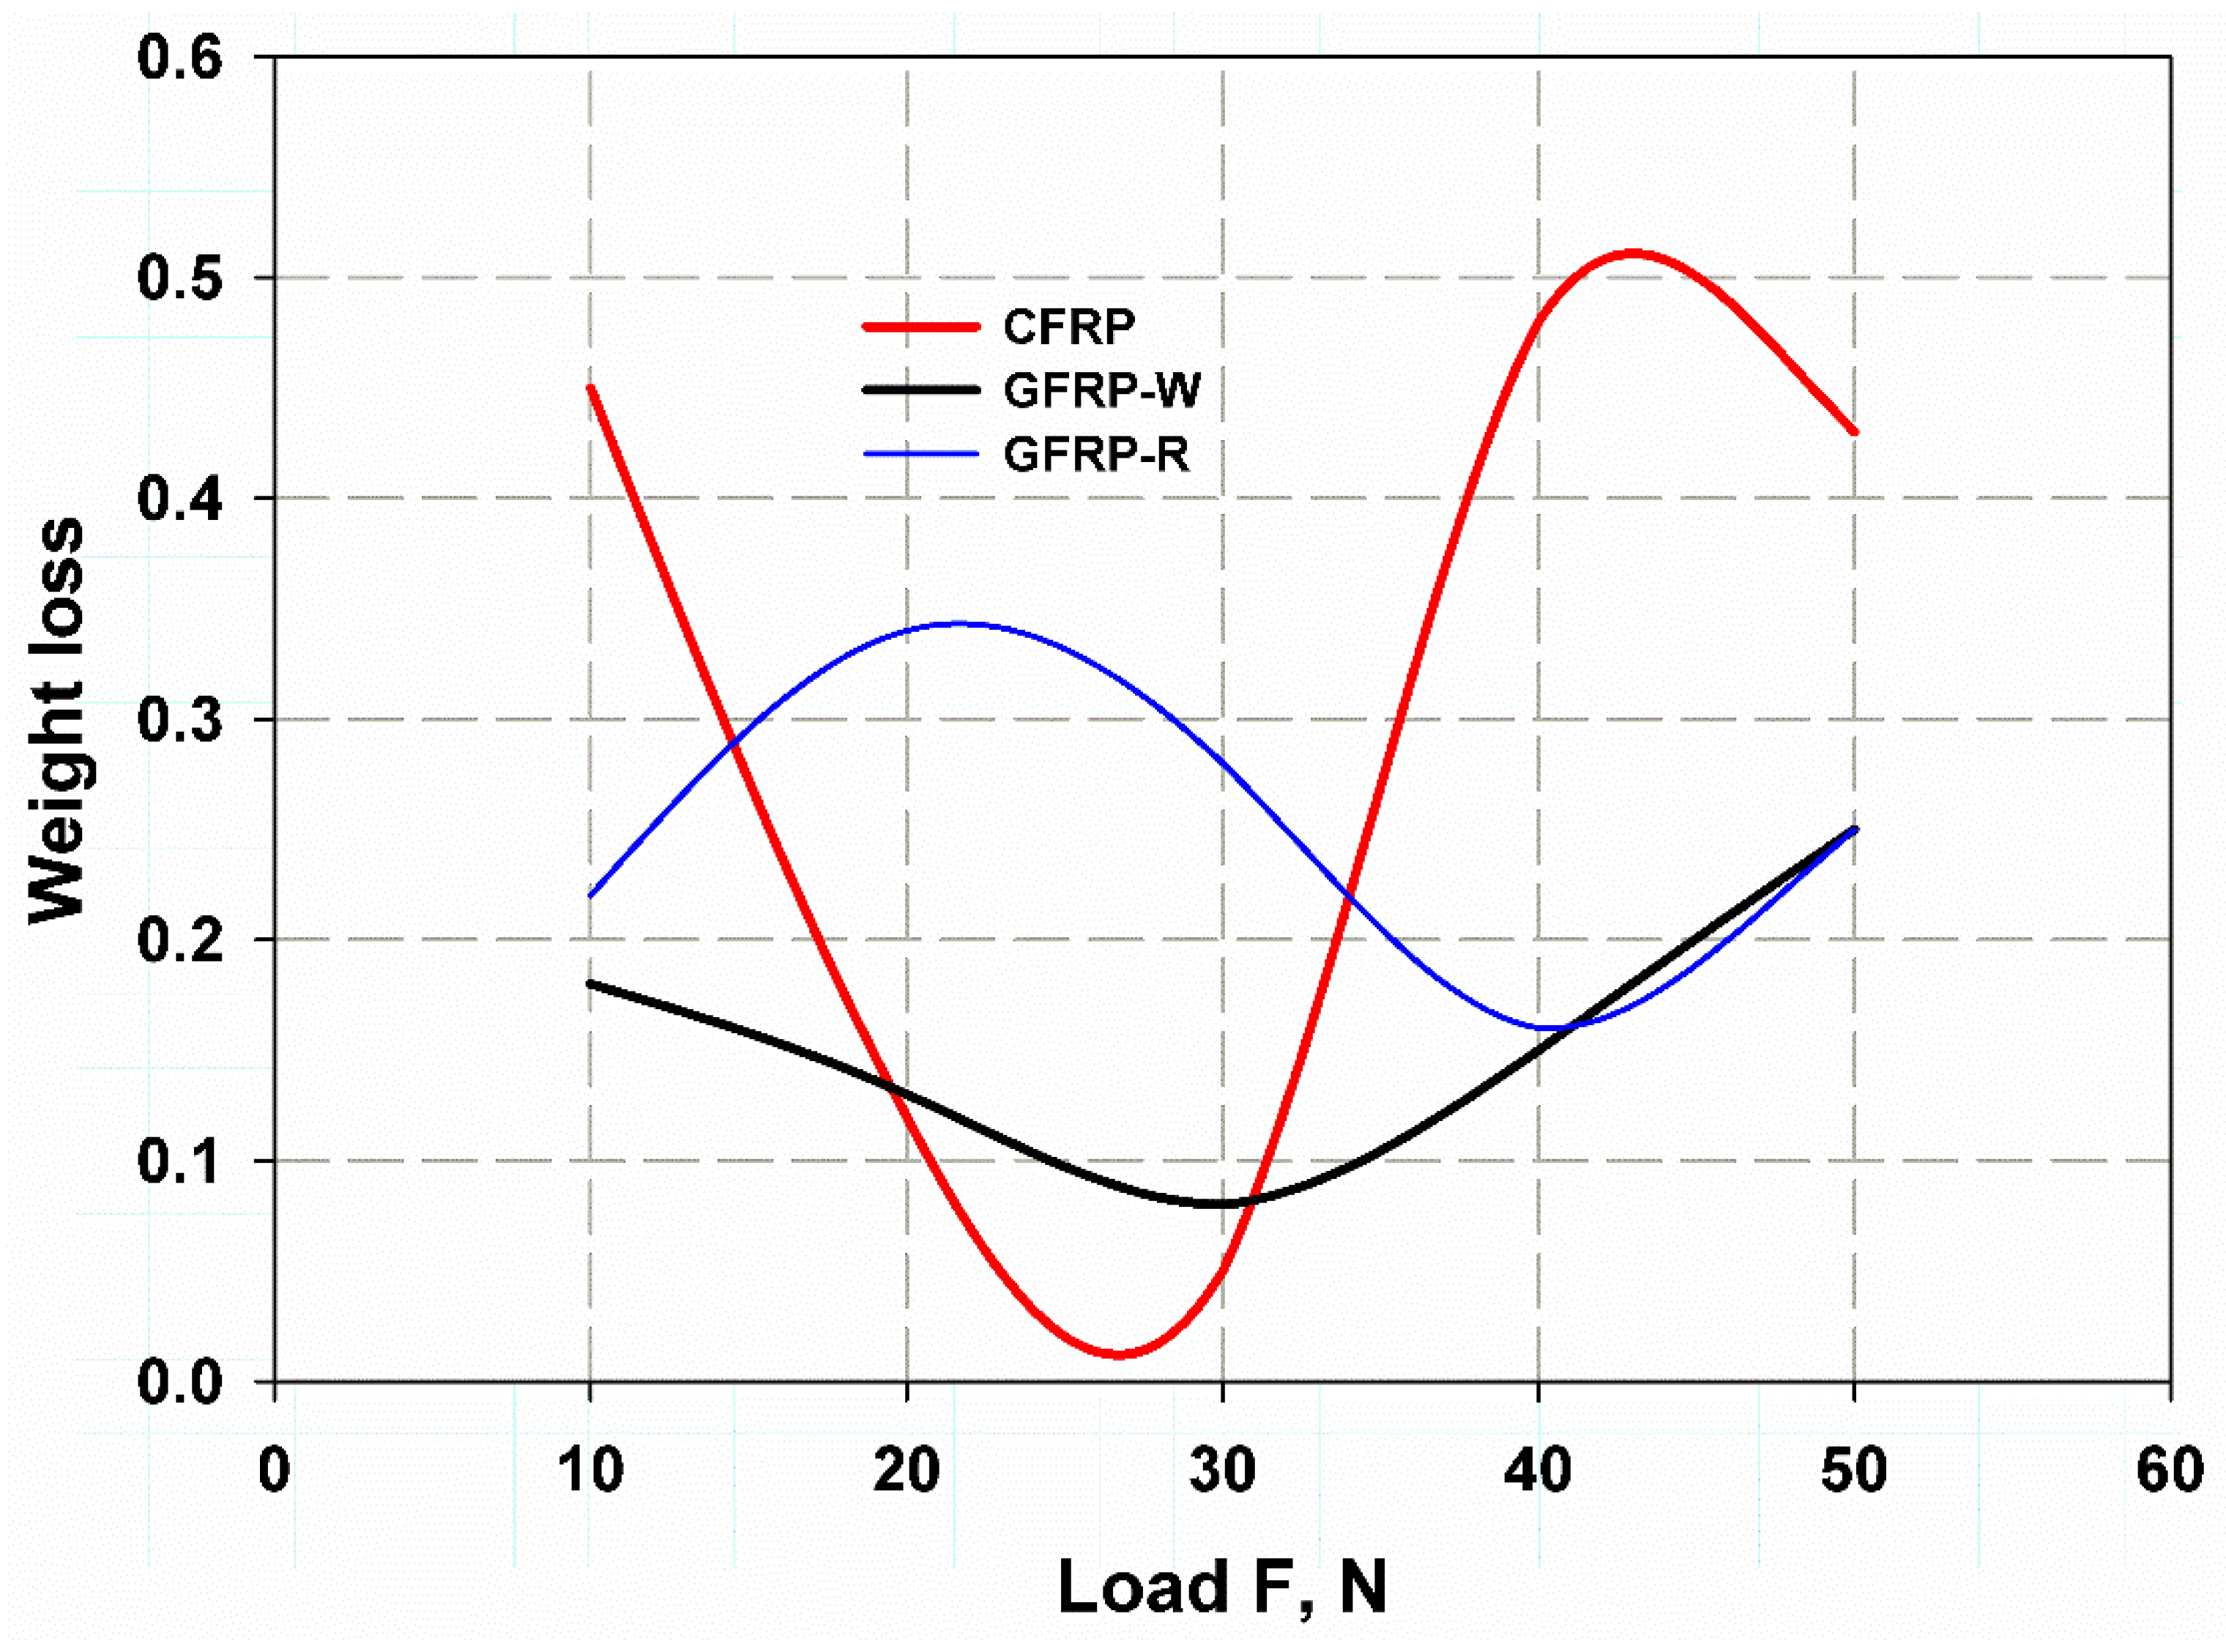
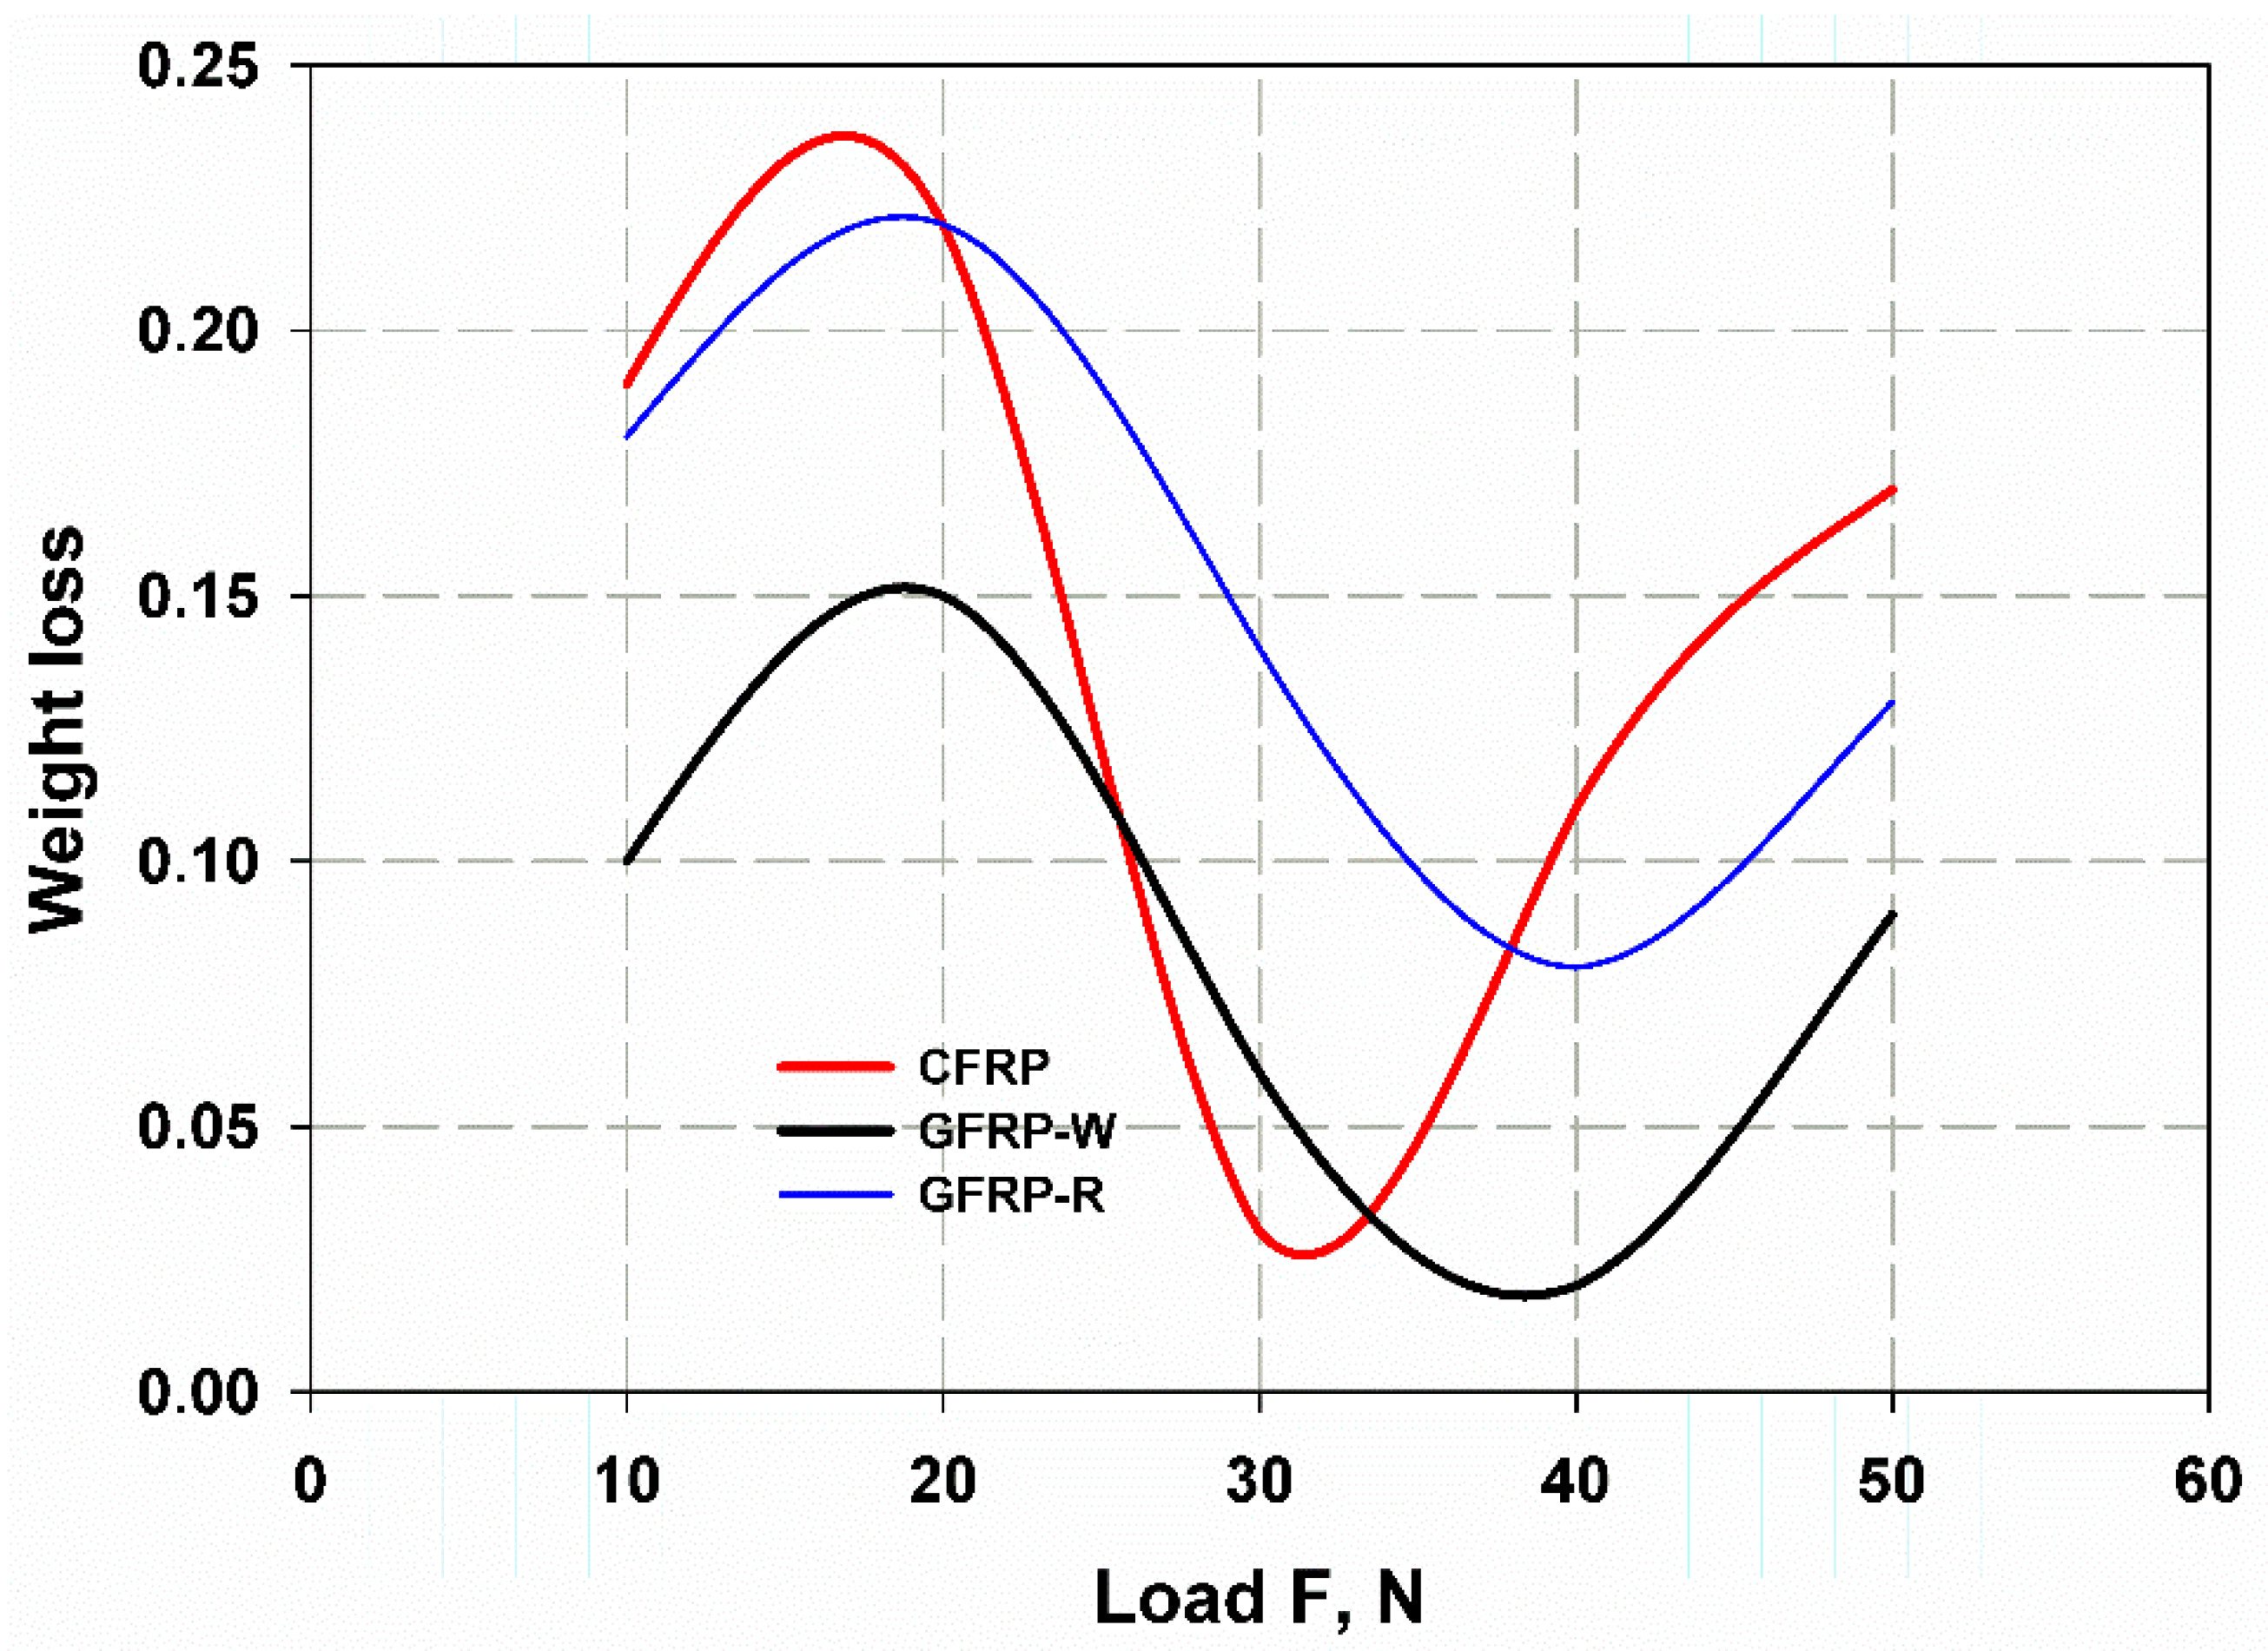
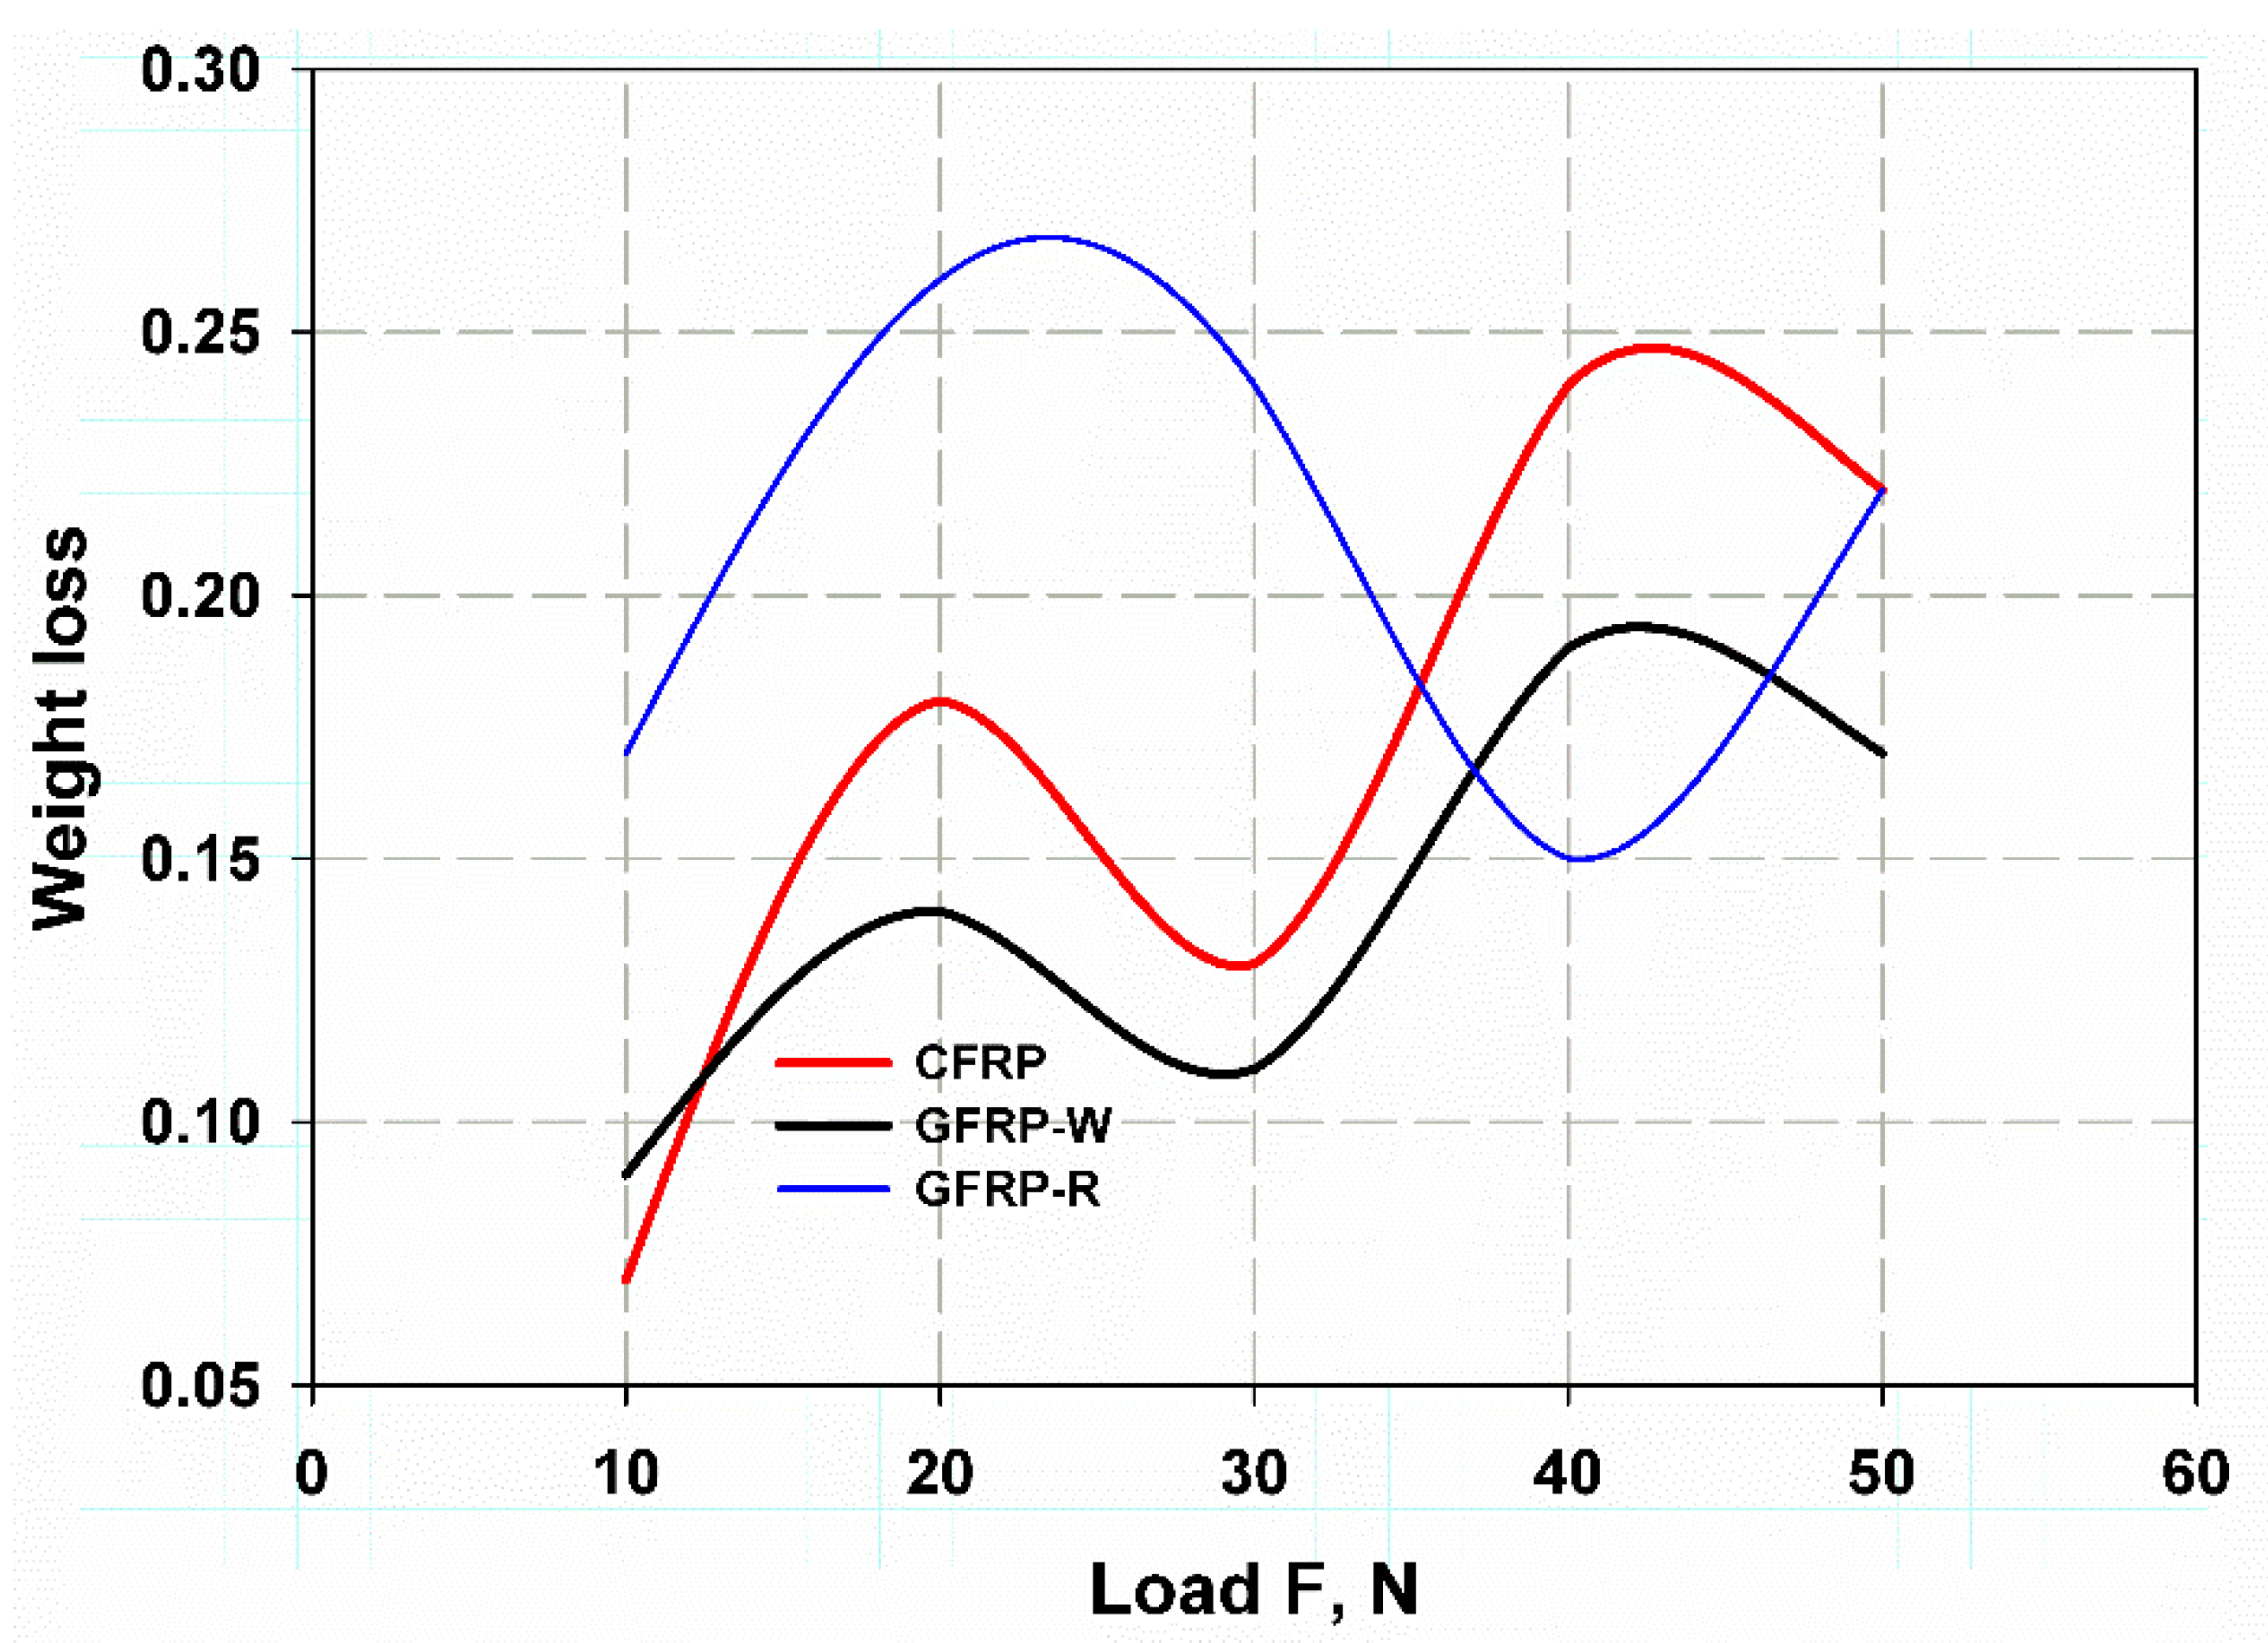
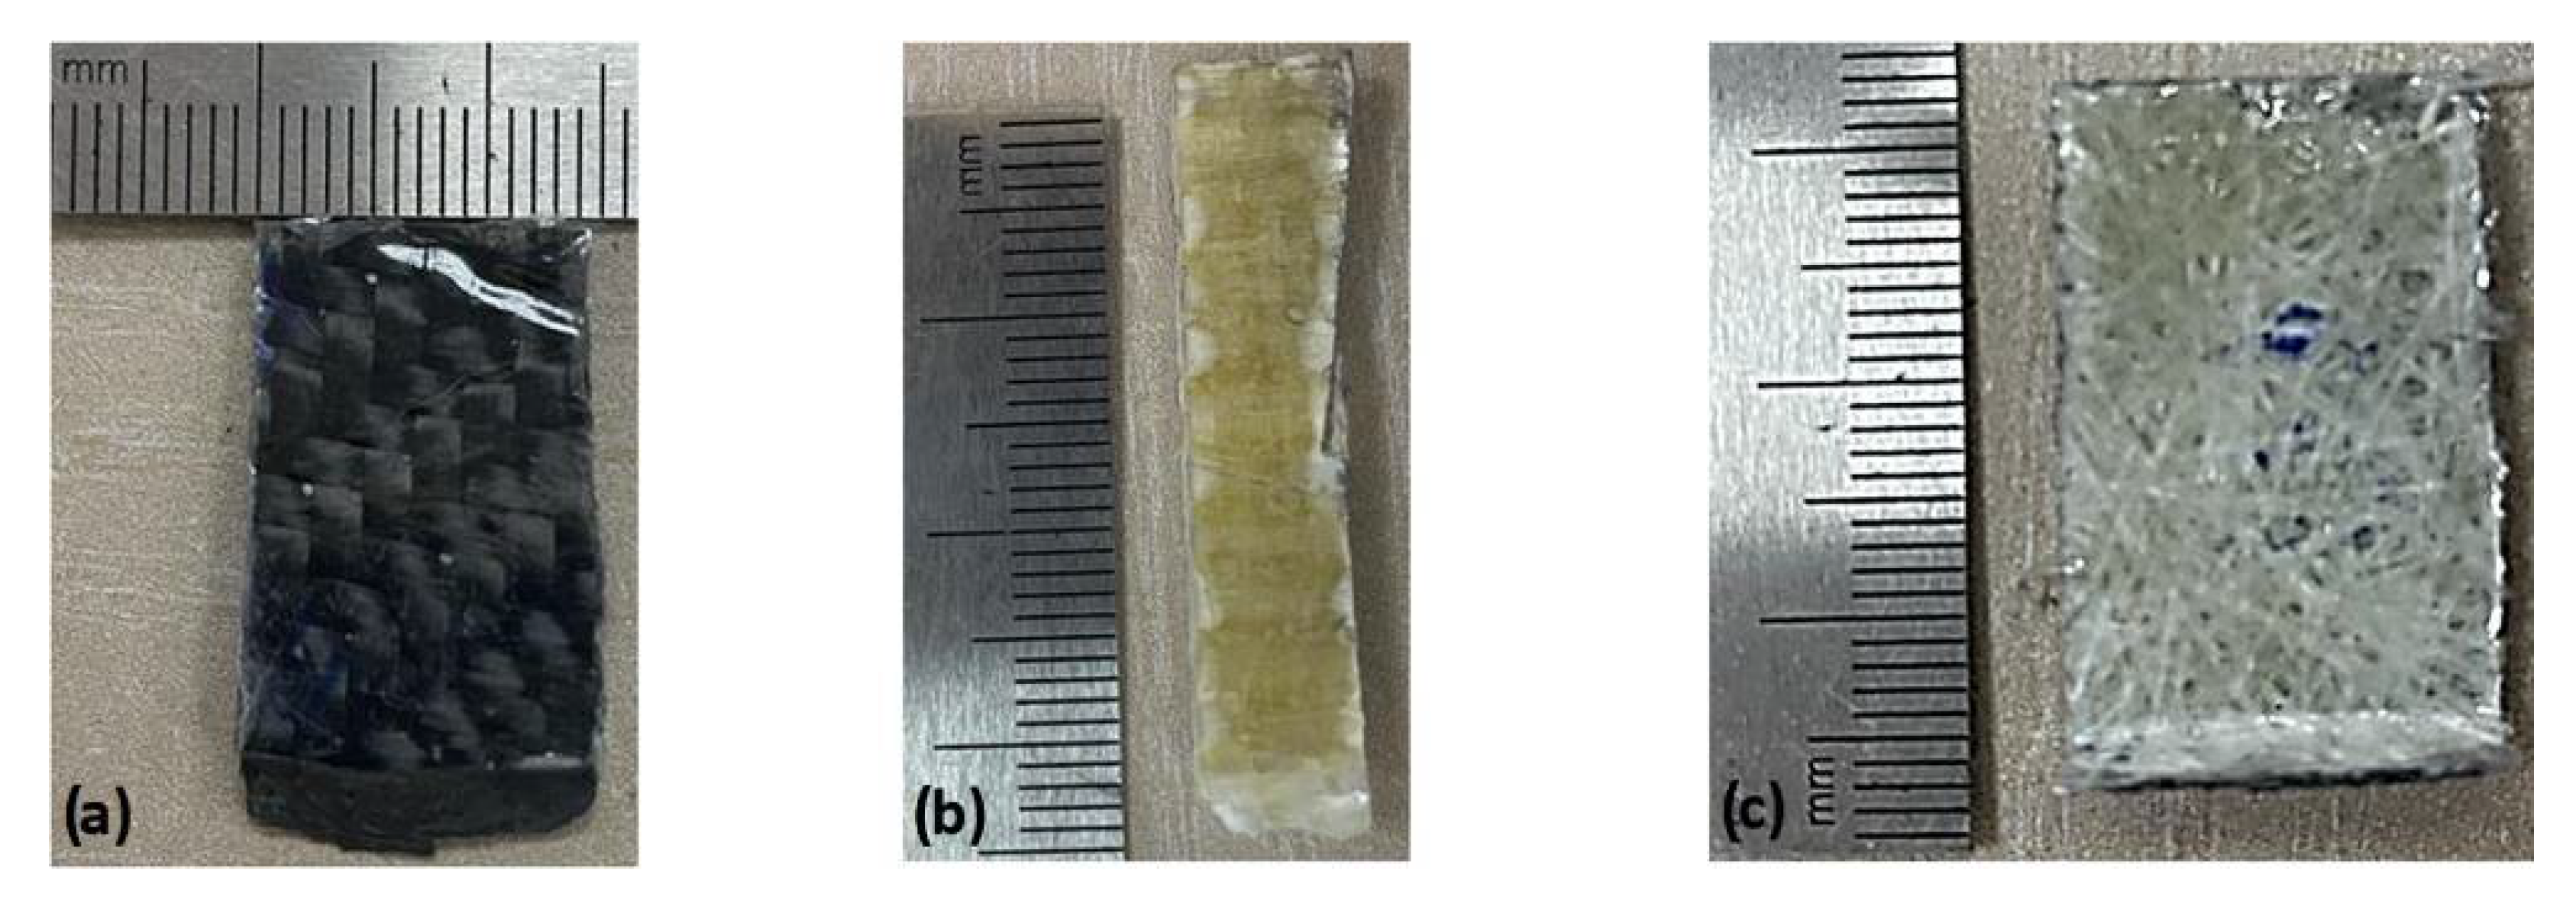
Figure 8 shows the variation in weight loss for CFRP in the case of interfaces. It was found that the dry condition starts with a high wear rate and a high weight loss of almost 45%, then decreases sharply and then increases to a maximum of over 50%. With grease lubrication, the wear rate is lower than with oil lubrication. The same trend applies to laminates reinforced with random glass fibers, as shown in Figure 9. In the case of glass-fiber-reinforced epoxy laminates, the same trend is seen in all three cases, but with different values, with the lowest wear rate in the grease lubricant case (see Figure 10). As far as the effect of the reinforcement types is concerned, it can be clearly seen in Figure 11 that the carbon fiber has a lower value of the wear rate, since the crab on the fiber is a solid lubricant as a graphite base. The same trend but with a sharp decrease in wear rate for other lubrication conditions is shown in Figure 12 and Figure 13. The shear modes were observed on the sample surfaces, as shown in Figure 14. They were large for R-GFRP because these material types have lower detachment strength than others. The CFRP shows little surface damage due to the strong bond between epoxy resin and fibers. In general, the good resistance of CRFP is due to the large amount of resin, which increases the contact area with the emery surface of the machine. While the average wear resistance for CRFP was relatively high, this can be attributed to it, although it is considered a solid lubricant. As the load increases, a lot of material separates from the sample. The weight loss decreases because the frictional force is initially low due to contact between the layers of material and the disc and then increases due to the tilling effect of the pin and vibration, causing a roughening of the disc surface [44]. In contrast, the increase in weight loss with increasing load was due to the separation and removal of damaged material and a longer content of reinforced fibers, while the time was small, as the roughness and other tribological parameters reach a stable level in a shorter time [44]. The tribological behavior of polymeric composites depends on the viscoelastic properties and the temperature gradient. The frictional contact between two materials generates heat at the interfaces, which increases the temperature, thus, changing the viscoelastic properties [45]. In addition, the sliding speed affects the machine vibrations, which increase the fluctuation effect of the pin or composite material on the hard steel disc, resulting in gross damage [46].

3.3. Comparison of the Results

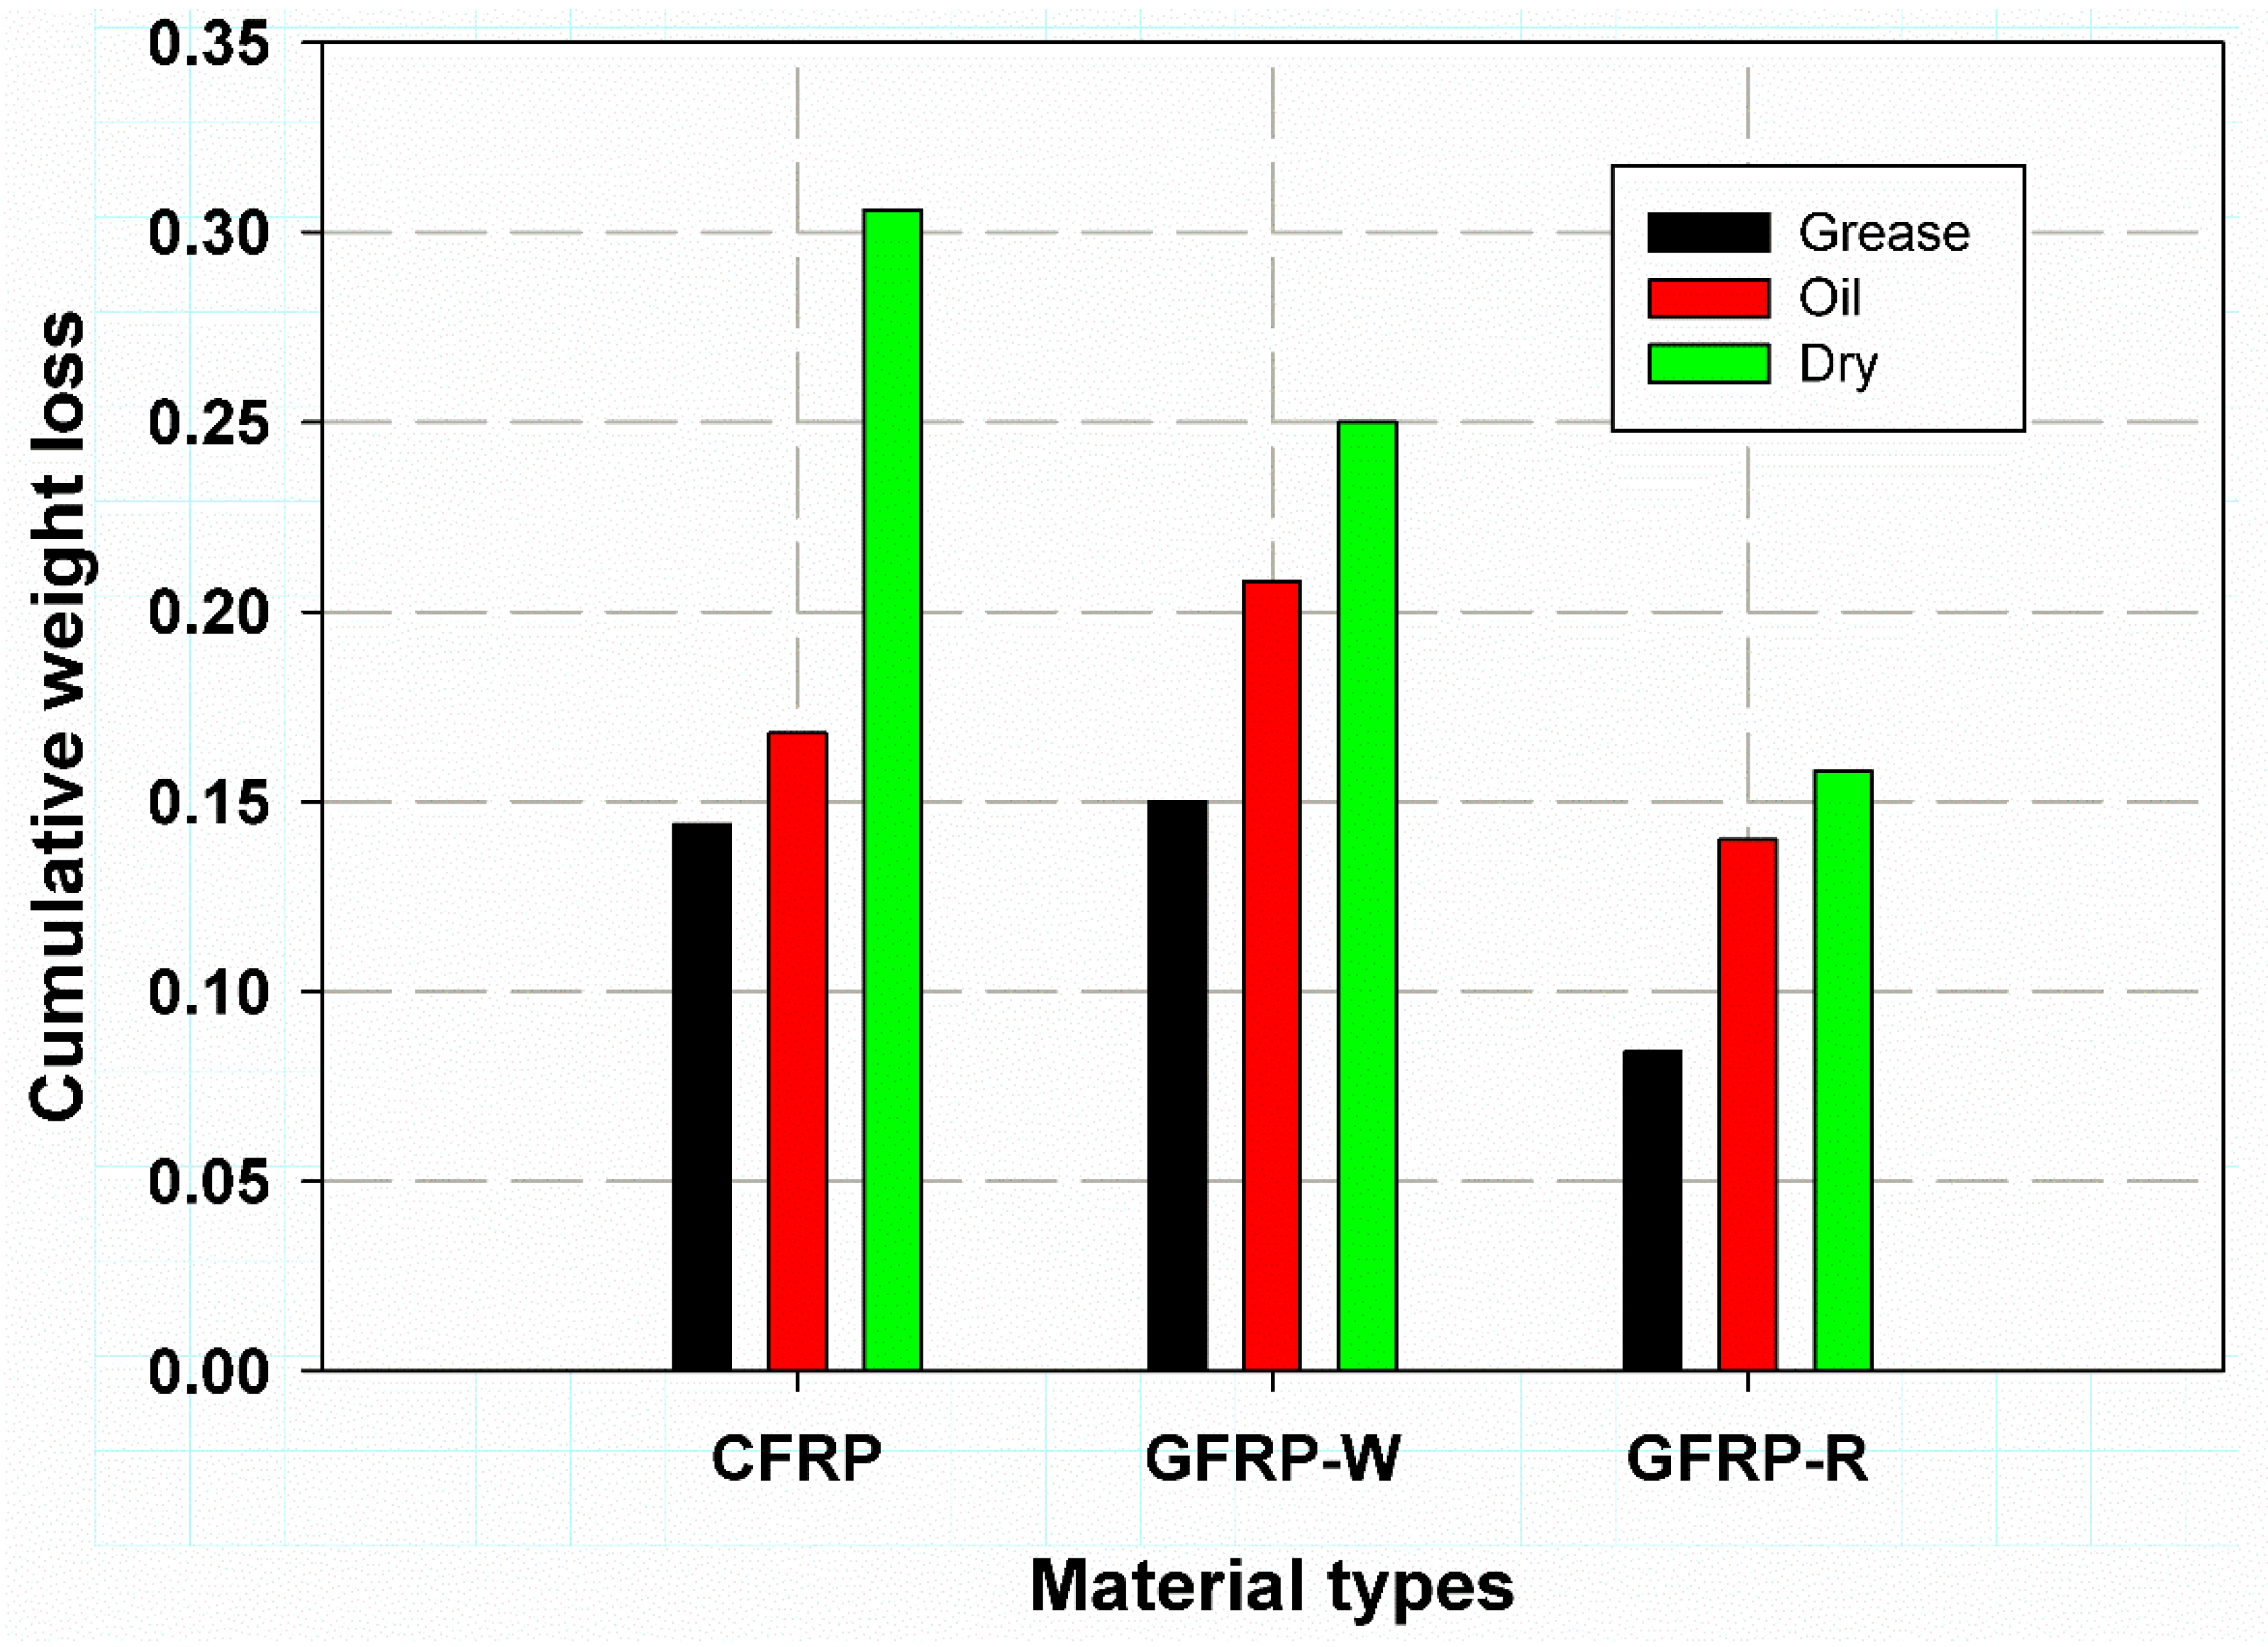
A comparison between the different structures and the different lubrication conditions is shown in Table 4. It was found that in the case of grease for CFRP, there is a lower wear rate of 0.144, while in the case of oil, there is an average wear rate of 0.168, which means a higher value of wear rate in the dry condition. The same trend was observed for the other layups, GFRP-W and GFRP-R (see Figure 15). However, for the specified lubrication conditions, the material with GFRP-R gave a lower wear rate of 0.084, while CFRP and GFRP-W gave almost equal values of 0.144 and 0.15, which is due to the fact that the volume fraction of reinforcement in GFRP-R was higher than the amount of epoxy resin, while the amount of epoxy resin was higher in the case of GFRP-W, in addition to the high stiffness of CFRP. The same results were found in the case of oil lubrication, but with a larger amount, as the lower value for GFRP-R was increased to 0.14, while the average value was 0.168 for CFRP and the larger value for GFRP-W was 0.208. On the other hand, the amount of wear was the largest for the case of dry lubrication conditions. It was also a change from the previous trend, as the largest value of wear was for CFRP 0.306, the medium value was for GFRP-W 0.25, and the lower value 0.158 was for GFRP-R material. Cumulative wear was extracted based on the Archard wear equation [37] as follows:
W = a v e r a g e W l  
where W l is weight loss of each normal load. It is commendable to notice that the Archard method does not take into consideration the influence of surface roughness [37].

3.4. Finite Element Simulation

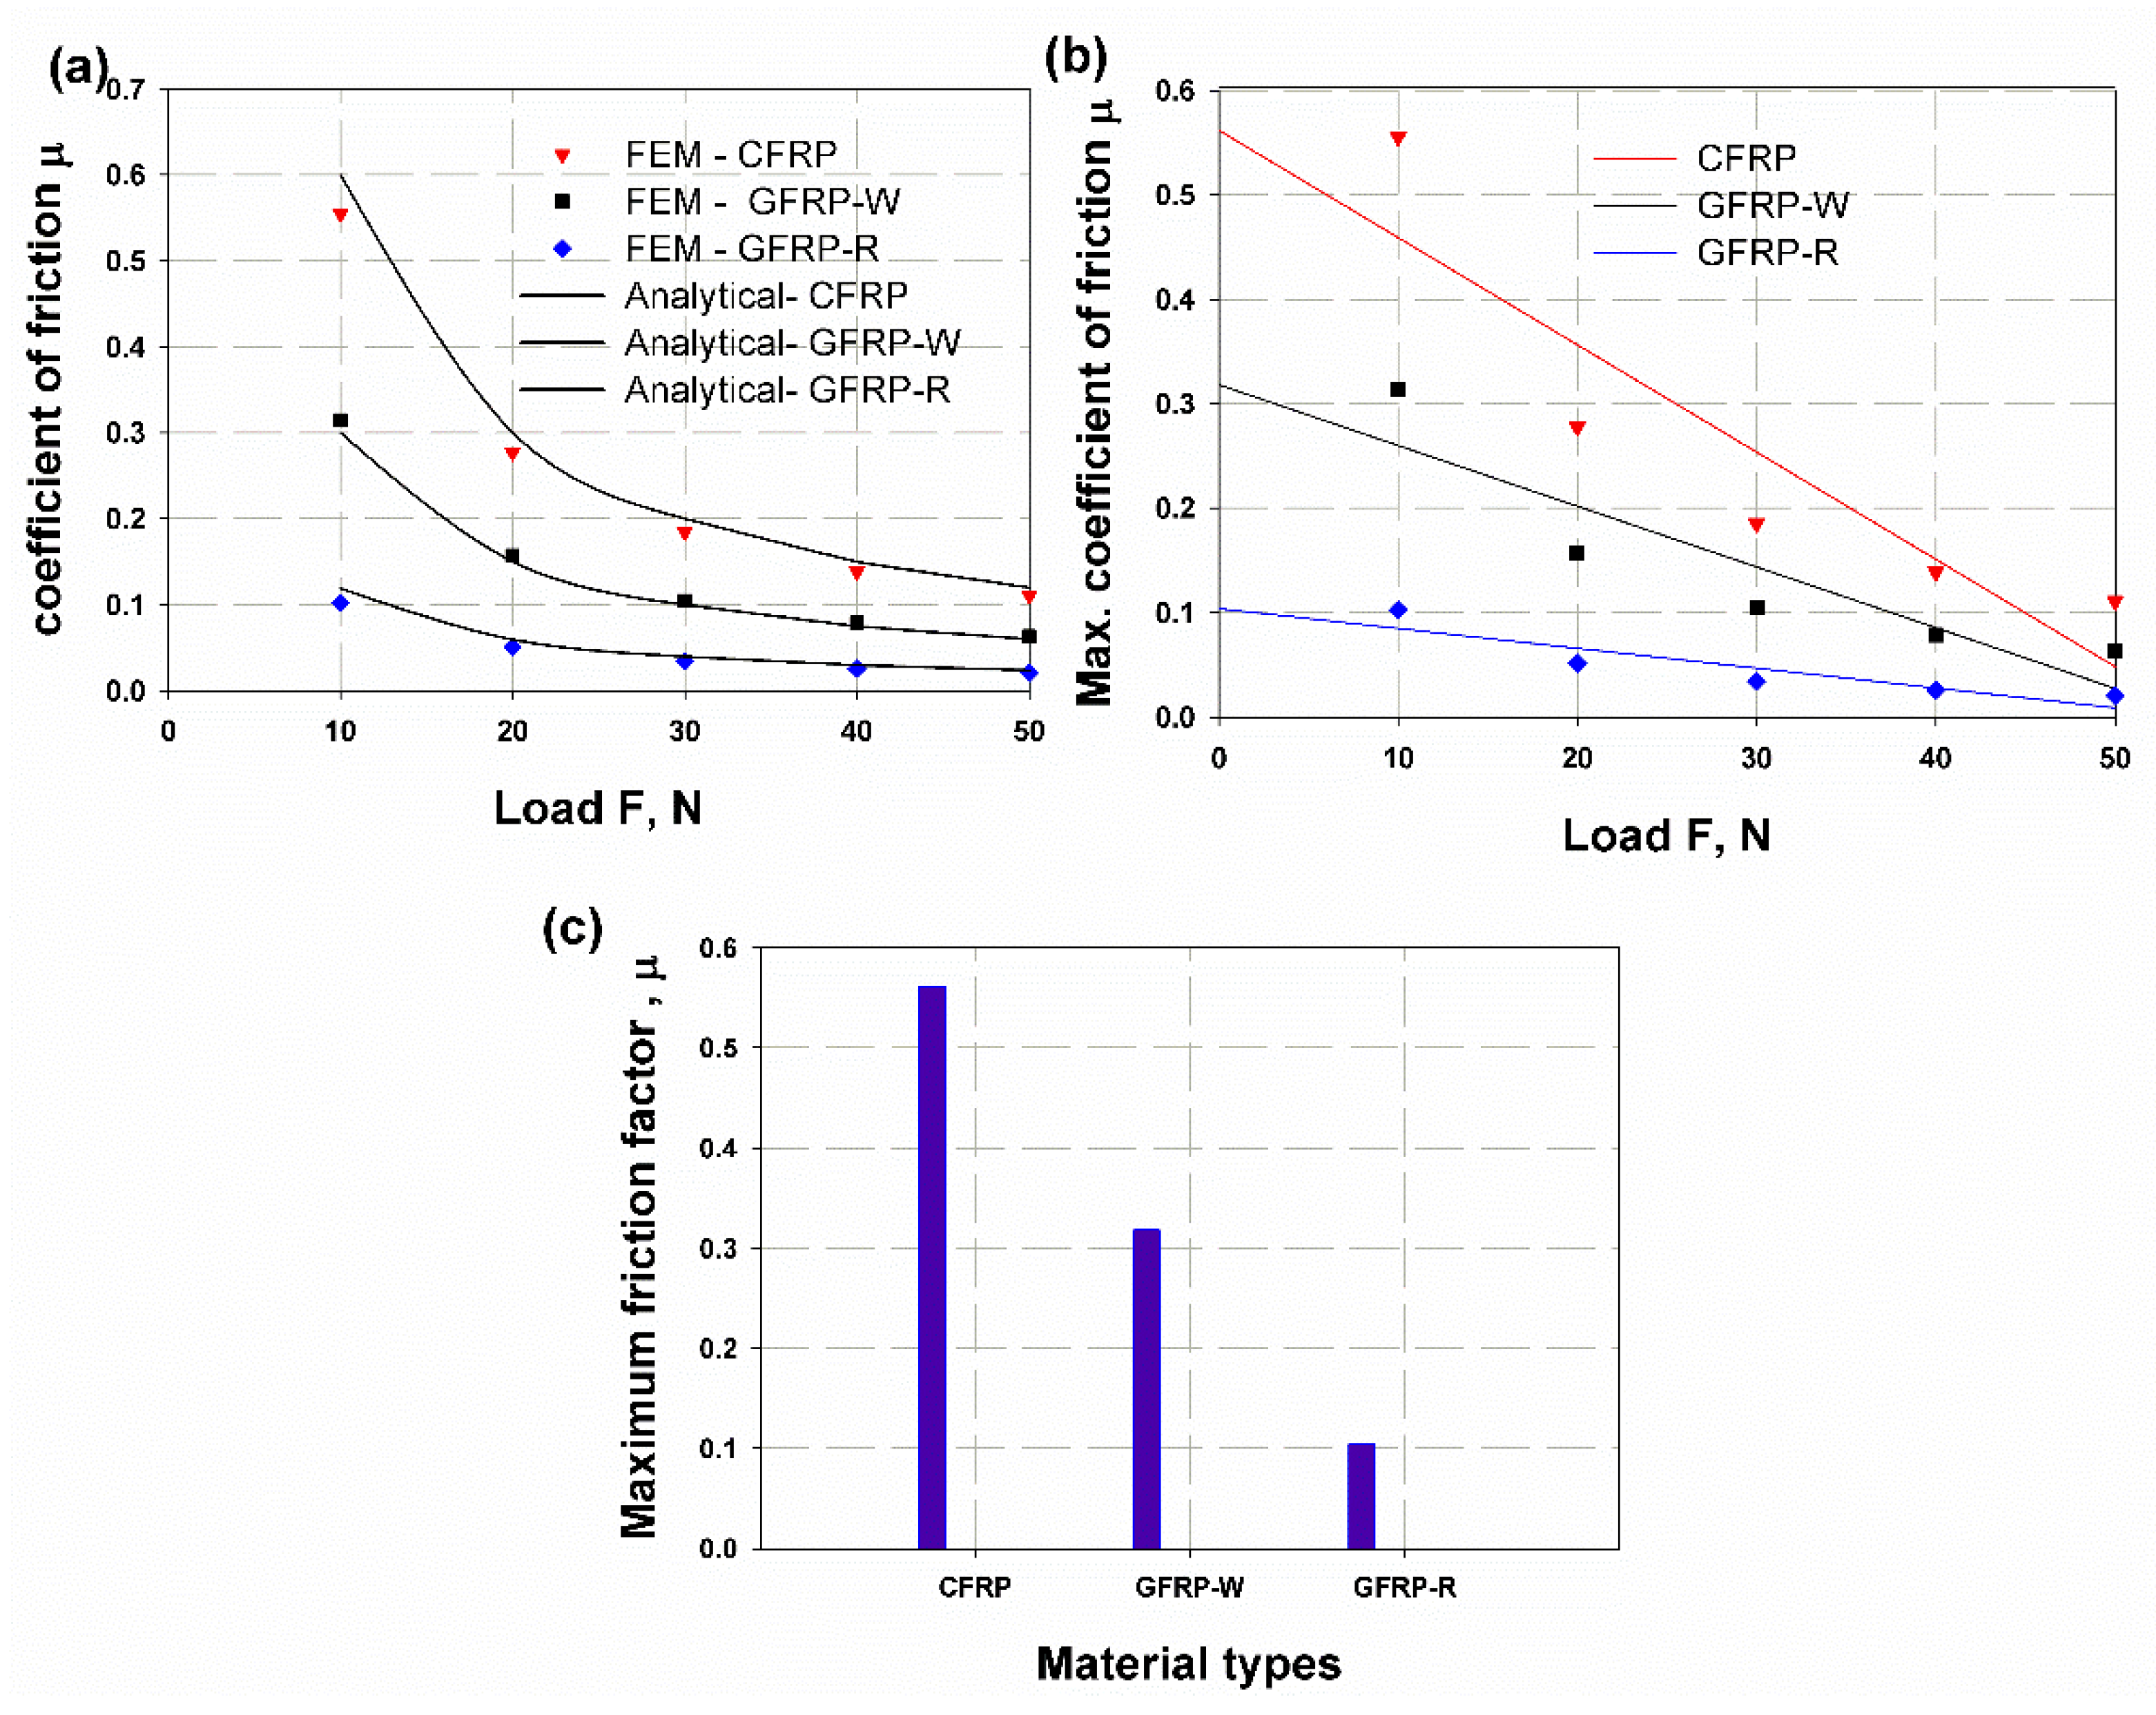
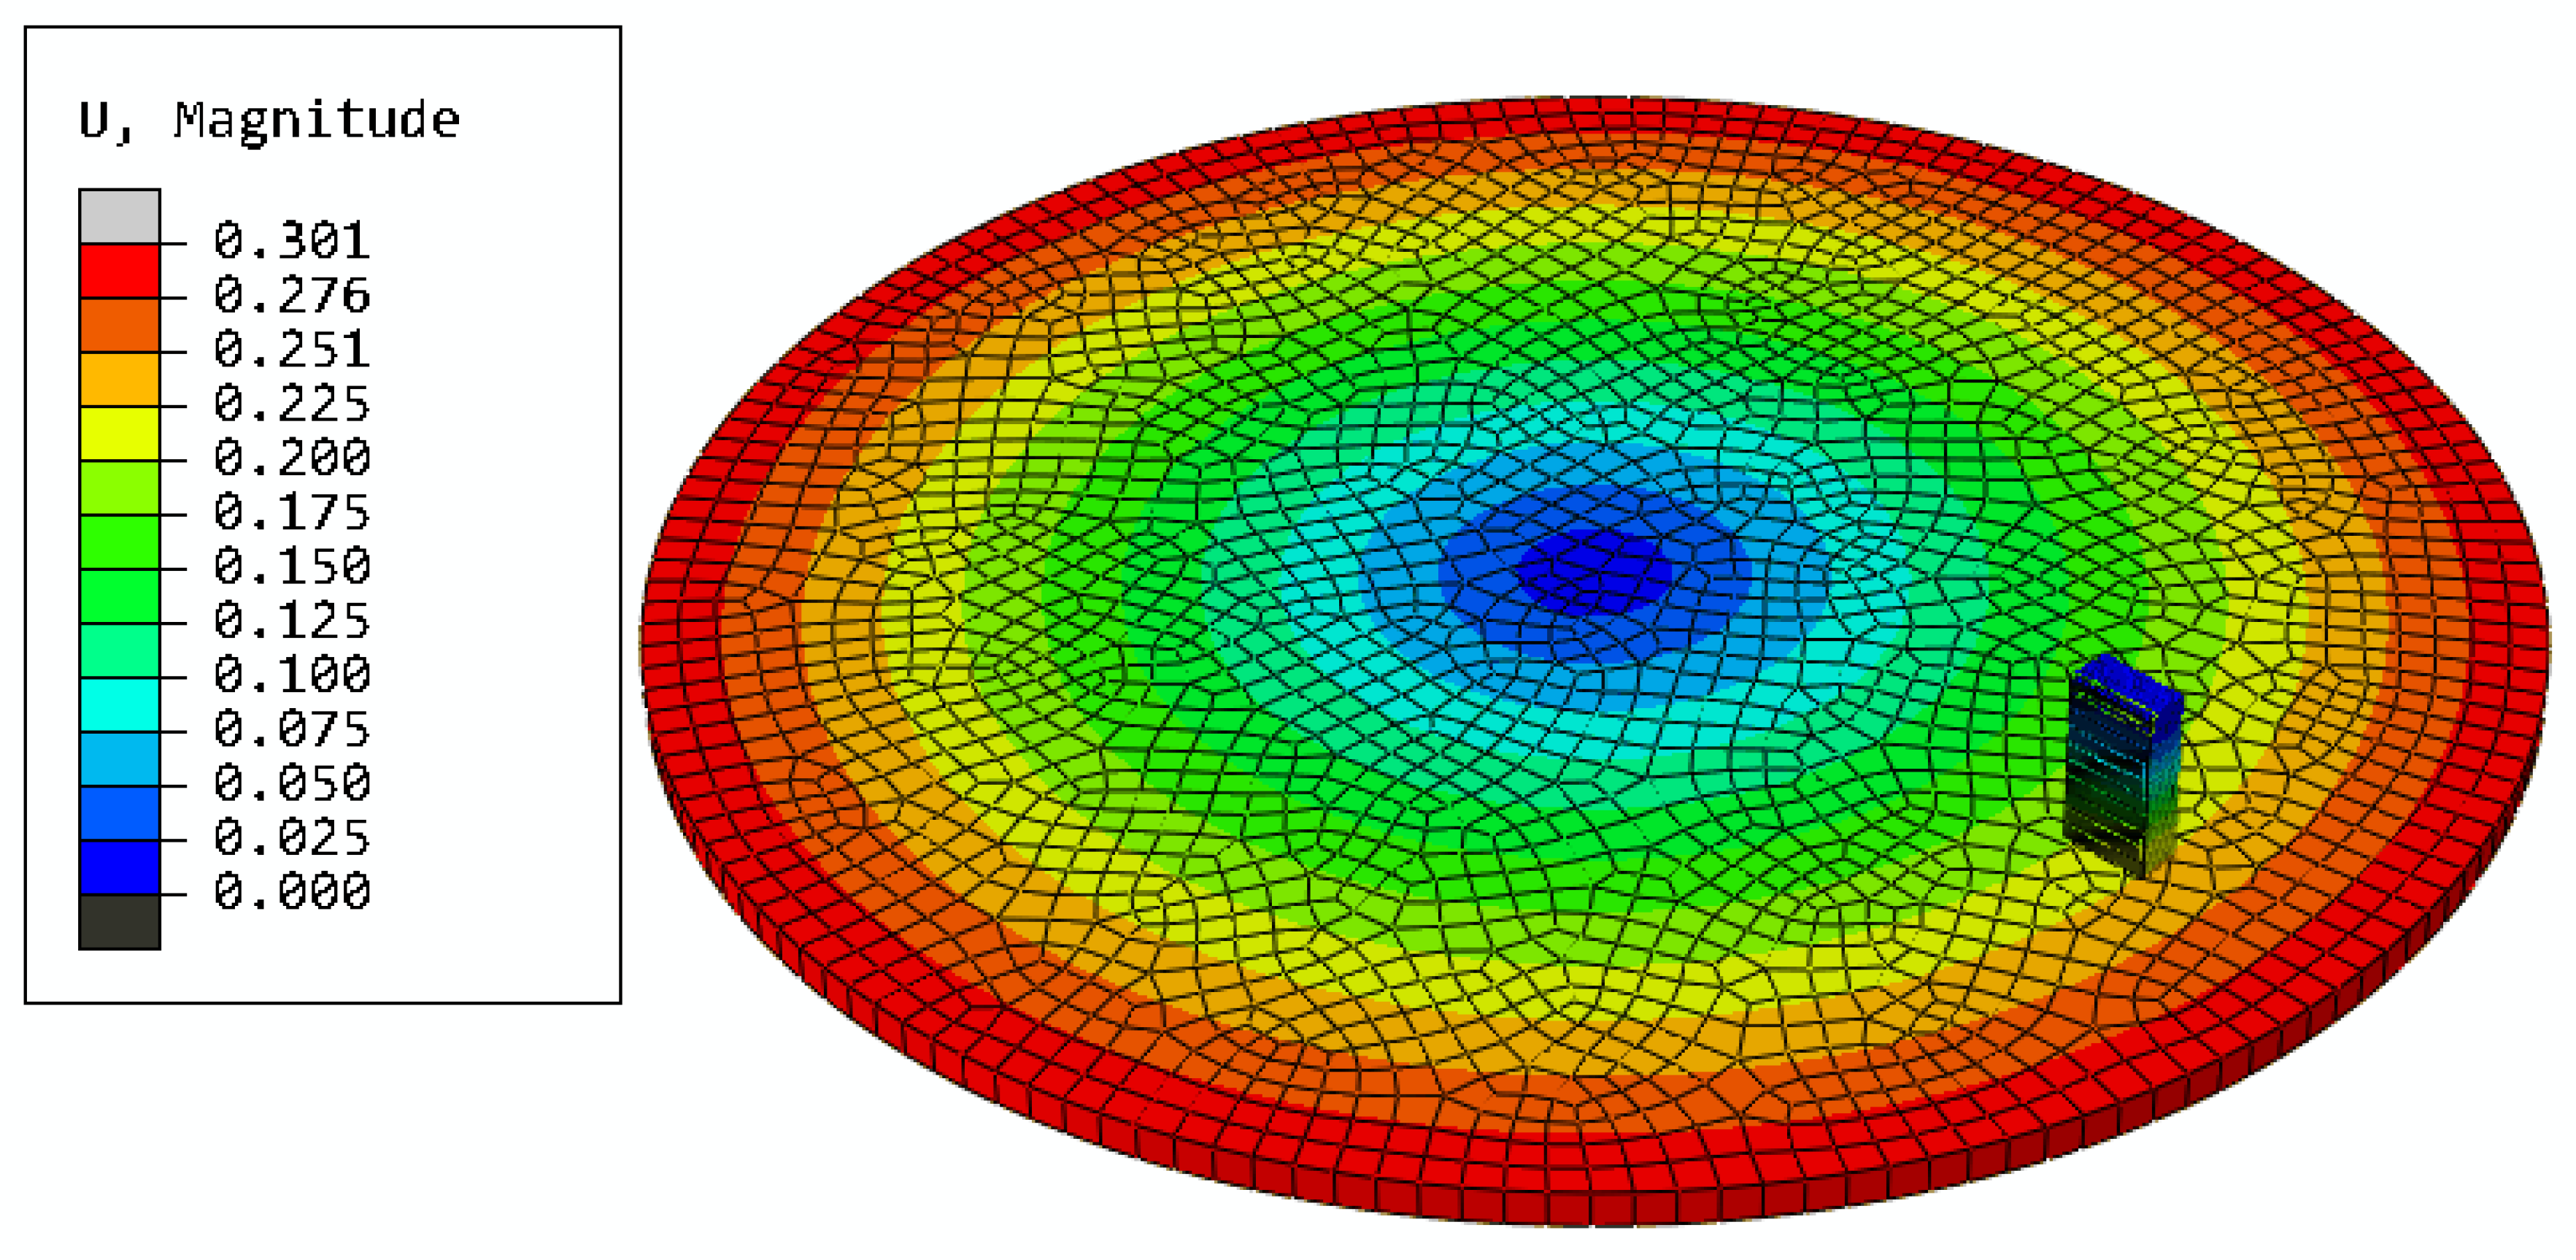
Figure 16a shows the relationship between the static friction coefficient and the applied normal load, as predicted by FEM, in the case of dry lubrication. The coefficient of friction was found to decrease sharply with increasing load and this was logical as it was inversely proportional. Furthermore, the friction force Fs was predicted to be 5.5 N, 3.14 N, and 1.024 N at no movement, for CFRP, GFRP-W, and GFRP-R, respectively, and it was not affected by the applied normal force, as cited in [26,27]. The coefficient of friction for CFRP has a higher value of 0.56, while GFRP-W has an average value of 0.31 and the lowest value of 0.104 for GFRP-R (see Figure 16b). This result clearly explains the reason for the higher wear rate of CFRP compared to other materials. The displacement contour predicted by FE, shown in Figure 17, illustrates the shear stress induced by the disc, which has a high red concentration near the pin. The effect of this shear stress is shown as a concentration induced by the sample (the pin), as shown in Figure 17. The concentration is higher at the point of contact with the disc and at the point of applied normal load. The reduction in friction with an increase in normal load is thought to be caused by increased surface roughening and a significant amount of worn debris [47,48]. Similar results were found for the Al–Stainless-steel pair, which Chowdhury, et al. [49] also reported; in this case, the friction coefficient reduces as the normal load increases. These results concur with those of Chowdhury et al. as well [50]. Even though the friction coefficient rises as the normal load increases, the frictional force decreases.

4. Conclusions

Tests were carried out on the wear of the pin on the disc with the laminated composites. The effects of the different reinforcing fibers on the wear rate and the different types of surface lubrication were studied. The glass-fiber-reinforced material shows better wear resistance than carbon fibers or even woven glass fibers. The lubrication conditions improve the wear performance of the laminate. It was also found that the laminated material generally has a higher wear rate, as the wear test was conducted over the entire thickness. In this direction, there are delamination layers that weaken the strength of the material. The higher delamination resistance between the carbon fibers compared to other reinforcing fibers is the reason for the lower wear resistance that occurs in this type of composite. The coefficient of friction was predicted using FEM. It was found that the frictional force and, thus, the coefficient of friction under static conditions are not affected by the normal load. The predicted coefficient of friction was lower for the glass-fiber-reinforced polymer with random arrangement (µ = 0.104), while the maximum coefficient of friction was found to be 0.56 for CFRP. The data obtained at FEM and the analytical model agreed well, as both models reproduced the shear properties of the laminated material. It was also reported that the number of fibers through the laminate surfaces plays a major role at the interfaces and, in the case of metal, appears as deposits and bumps. For future work, it is recommended to numerically investigate the effects of lubrication and determine the kinetic coefficient of friction.

Author Contributions

Conceptualization, M.Y.A., M.K.H. and A.F.M.; methodology, M.Y.A. and A.F.M.; software, M.Y.A. and M.K.H.; validation, A.H.B. and M.K.H.; formal analysis, M.Y.A., M.K.H. and A.H.B.; investigation, M.Y.A., M.K.H. and A.F.M.; resources, A.H.B.; writing—original draft preparation, M.Y.A., M.K.H., A.-A.A. and A.F.M.; writing—review and editing, M.Y.A. and A.F.M.; supervision, M.K.H., A.-A.A. and M.Y.A.; project administration, M.Y.A. and A.H.B.; funding acquisition, A.H.B. All authors have read and agreed to the published version of the manuscript.

Funding

The authors would like to thank the Deanship of Scientific Research at Umm Al-Qura University for supporting this work. Grant code: 22UQU44286215DSR01.

Institutional Review Board Statement

Not applicable.

Informed Consent Statement

Not applicable.

Data Availability Statement

The data presented in this study are available on request from the corresponding author.

Acknowledgments

The authors would like to thank the Deanship of Scientific Research at Umm Al-Qura University for supporting this work. Grant code: 22UQU44286215DSR01.

Conflicts of Interest

The authors declare no conflict of interest.

References

  1. Li, C.; Yin, X.; Liu, Y.; Guo, R.; Xian, G. Long-term service evaluation of a pultruded carbon/glass hybrid rod exposed to elevated temperature, hydraulic pressure and fatigue load coupling. Int. J. Fatigue 2020, 134, 105480. [Google Scholar] [CrossRef]
  2. Li, C.; Xian, G.; Li, H. Effect of postcuring immersed in water under hydraulic pressure on fatigue performance of large-diameter pultruded carbon/glass hybrid rod. Fatigue Fract. Eng. Mater. Struct. 2019, 42, 1148–1160. [Google Scholar] [CrossRef]
  3. Pan, Y.; Yan, D. Study on the durability of GFRP bars and carbon/glass hybrid fiber reinforced polymer (HFRP) bars aged in alkaline solution. Compos. Struct. 2021, 261, 113285. [Google Scholar] [CrossRef]
  4. Karthik, K.; Rajamani, D.; Manimaran, A.; Prakash, J.U. Wear behaviour of hybrid polymer matrix composites using Taguchi technique. Mater. Today Proc. 2020, 33, 3186–3190. [Google Scholar] [CrossRef]
  5. Suresha, B.; Chandramohan, G.; Siddaramaiah; Samapthkumaran, P.; Seetharamu, S. Three-body abrasive wear behaviour of carbon and glass fiber reinforced epoxy composites. Mater. Sci. Eng. A 2007, 443, 285–291. [Google Scholar] [CrossRef]
  6. Harirao, A.N. Investigation of Dry Wear Behaviour of Silicon-Eglass-Epoxy composite Material. Silicon 2017, 9, 153–158. [Google Scholar] [CrossRef]
  7. Mahesha, G.T.; Satish Shenoy, B.; Vijaya Kini, M.; Padmaraj, N.H. Wear behaviour studies on Grewia Serrulata bast fibre reinforced polymer composites. Cogent Eng. 2018, 5, 1517580. [Google Scholar] [CrossRef]
  8. Arthanarieswaran, V.; Kumaravel, A.; Kathirselvam, M. Evaluation of mechanical properties of banana and sisal fiber reinforced epoxy composites: Influence of glass fiber hybridization. Mater. Des. 2014, 64, 194–202. [Google Scholar] [CrossRef]
  9. Hassan, M.K.; Mohamed, A.F.; Khalil, K.A.; Abdellah, M.Y. Numerical and Experimental Evaluation of Mechanical and Ring Stiffness Properties of Preconditioning Underground Glass Fiber Composite Pipes. J. Compos. Sci. 2021, 5, 264. [Google Scholar] [CrossRef]
  10. Rao, K.S.; Varadarajan, Y.; Rajendra, N. Erosive Wear Behaviour of Carbon Fiber-reinforced Epoxy Composite. Mater. Today Proc. 2015, 2, 2975–2983. [Google Scholar] [CrossRef]
  11. Bijwe, J.; Indumathi, J.; Ghosh, A. On the abrasive wear behaviour of fabric-reinforced polyetherimide composites. Wear 2002, 253, 768–777. [Google Scholar] [CrossRef] [Green Version]
  12. Suresha, B.; Siddaramaiah; Kishore; Seetharamu, S.; Kumaran, P.S. Investigations on the influence of graphite filler on dry sliding wear and abrasive wear behaviour of carbon fabric reinforced epoxy composites. Wear 2009, 267, 1405–1414. [Google Scholar] [CrossRef]
  13. Alpas, A.; Embury, J. The role of subsurface deformation and strain localization on the sliding wear behaviour of laminated composites. Wear 1991, 146, 285–300. [Google Scholar] [CrossRef]
  14. Korim, N.S.; Abdellah, M.Y.; Dewidar, M.; Abdelhaleem, A.M. Crushable finite element modeling of mechanical properties of titanium foam. Int. J. Sci. Eng. Res. 2015, 6, 1221–1227. [Google Scholar]
  15. Põdra, P.; Andersson, S. Simulating sliding wear with finite element method. Tribol. Int. 1999, 32, 71–81. [Google Scholar] [CrossRef]
  16. Benabdallah, H.; Olender, D. Finite element simulation of the wear of polyoxymethylene in pin-on-disc configuration. Wear 2006, 261, 1213–1224. [Google Scholar] [CrossRef]
  17. Doddamani, R.A.S.; Bharath, K. Dry sliding wear simulation of hybrid aluminum metal matrix composites. Adv. Compos. Hybrid Mater. 2020, 3, 120–126. [Google Scholar]
  18. Pradhan, P.; Satapathy, A. Investigation on sliding wear behaviour of walnut shell powder (WSP) filled polyester composites using finite element method. Mater. Today Proc. 2021, 44, 4190–4195. [Google Scholar] [CrossRef]
  19. Rezaei, A.; Van Paepegem, W.; De Baets, P.; Ost, W.; Degrieck, J. Adaptive finite element simulation of wear evolution in radial sliding bearings. Wear 2012, 296, 660–671. [Google Scholar] [CrossRef]
  20. Jones, R.M. Mechanics of Composite Materials; CRC Press: Boca Raton, FL, USA, 1998. [Google Scholar]
  21. Mallick, P.K. Composites Engineering Handbook; CRC Press: Boca Raton, FL, USA, 1997. [Google Scholar]
  22. Khashaba, U. In-plane shear properties of cross-ply composite laminates with different off-axis angles. Compos. Struct. 2004, 65, 167–177. [Google Scholar] [CrossRef]
  23. Mohammed, Y.; Hassan, M.K.; Abu El-Ainin, H.; Hashem, A.M. Effect of stacking sequence and geometric scaling on the brittleness number of glass fiber composite laminate with stress raiser. Sci. Eng. Compos. Mater. 2014, 21, 281–288. [Google Scholar] [CrossRef]
  24. Hassan, M.K.; Mohammed, Y.; Salem, T.; Hashem, A. Prediction of nominal strength of composite structure open hole specimen through cohesive laws. Int. J. Mech. Mech. Eng. IJMME-IJENS 2012, 12, 1–9. [Google Scholar]
  25. Khashaba, U.; Aldousari, S.; Najjar, I. Behavior of [0]8 woven composites under combined bending and tension loading: Part—I experimental and analytical. J. Compos. Mater. 2012, 46, 1345–1355. [Google Scholar] [CrossRef]
  26. Petrie, E.M. Epoxy Adhesive Formulations; McGraw Hill Professional: New York, NY, USA, 2005. [Google Scholar]
  27. STD/D3171; Standard Test Methods for Constituent Content of Composite Materials. ASTM: West Conshohocken, PA, USA, 2011.
  28. Abdellah, M.Y. Essential work of fracture assessment for thin aluminium strips using finite element analysis. Eng. Fract. Mech. 2017, 179, 190–202. [Google Scholar] [CrossRef]
  29. Hagnestål, A.; Sellgren, U.; Andersson, K. Durable winch-based point absorbers. In Proceedings of the 12th European Wave and Tidal Energy Conference, EWTEC 2017, Cork, Ireland, 27 August–1 September 2017. [Google Scholar]
  30. Shukla, M.J.; Kumar, D.S.; Mahato, K.K.; Rathore, D.; Prusty, R.K.; Ray, B.C. A comparative study of the mechanical performance of Glass and Glass/Carbon hybrid polymer composites at different temperature environments. IOP Conf. Ser. Mater. Sci. Eng. 2015, 75, 012002. [Google Scholar] [CrossRef] [Green Version]
  31. Minus, M.; Kumar, S. The Processing, Properties, and Structure of Carbon Fibers. JOM 2005, 57, 52–58. [Google Scholar] [CrossRef]
  32. ASTM D3039/D 3039M; Standard Test Method for Tensile Properties of Polymer Matrix Composite Materials. ASTM: West Conshohocken, PA, USA, 1995.
  33. Available online: https://www.zwickroell.com/products/static-materials-testing-machines/universal-testing-machines-for-static-applications/materials-testing-machine-with-hydraulic-drive/ (accessed on 15 May 2022).
  34. Hassan, M.K.; Mohammed, Y.; Abu, E. Improvement of Al-6061 alloys mechanical properties by controlling processing parameters. Int. J. Mech. Mechatron. Eng. 2012, 12, 14–18. [Google Scholar]
  35. The Editors of Encyclopaedia Britannica. Argon. In Encyclopedia Britannica; Encyclopedia Britannica: London, UK, 2020. [Google Scholar]
  36. Plesha, M.E.; Gray, G.L.; Costanzo, F. Engineering Mechanics: Statics; McGraw-Hill Higher Education: New York, NY, USA, 2010. [Google Scholar]
  37. Ghatrehsamani, S.; Akbarzadeh, S. Predicting the wear coefficient and friction coefficient in dry point contact using continuum damage mechanics. Proc. Inst. Mech. Eng. Part J J. Eng. Tribol. 2019, 233, 447–455. [Google Scholar] [CrossRef]
  38. Abdellah, M.Y. An approximate analytical model for modification of size effect law for open-hole composite structure under biaxial load. Proc. Inst. Mech. Eng. Part C J. Mech. Eng. Sci. 2021, 235, 3570–3583. [Google Scholar] [CrossRef]
  39. Soutis, C.; Filiou, C. Stress Distributions around Holes in Composite Laminates Subjected to Biaxial Loading. Appl. Compos. Mater. 1998, 5, 365–378. [Google Scholar] [CrossRef]
  40. Soutis, C. Fibre reinforced composites in aircraft construction. Prog. Aerosp. Sci. 2005, 41, 143–151. [Google Scholar] [CrossRef]
  41. Inal, O.; Katnam, K.; Potluri, P.; Soutis, C. Progress in interlaminar toughening of aerospace polymer composites using particles and non-woven veils. Aeronaut. J. 2022, 126, 222–248. [Google Scholar] [CrossRef]
  42. Fouad, H.; Mourad, A.H.I.; Al Shammari, B.A.; Hassan, M.K.; Abdallah, M.Y.; Hashem, M. Fracture toughness, vibration modal analysis and viscoelastic behavior of Kevlar, glass, and carbon fiber/epoxy composites for dental-post applications. J. Mech. Behav. Biomed. Mater. 2020, 101, 103456. [Google Scholar] [CrossRef]
  43. Lubin, G. Handbook of Composites; Springer Science & Business Media: Berlin/Heidelberg, Germany, 2013. [Google Scholar]
  44. Nuruzzaman, D.M.; Chowdhury, M.A.; Rahaman, M.L. Effect of duration of rubbing and normal load on friction coefficient for polymer and composite materials. Ind. Lubr. Tribol. 2011, 63, 320–326. [Google Scholar] [CrossRef]
  45. Mimaroglu, A.; Unal, H.; Arda, T. Friction and wear performance of pure and glass fibre reinforced poly-ether-imide on polymer and steel counterface materials. Wear 2007, 262, 1407–1413. [Google Scholar] [CrossRef]
  46. Chowdhury, M.A.; Helali, M. The effect of amplitude of vibration on the coefficient of friction for different materials. Tribol. Int. 2008, 41, 307–314. [Google Scholar] [CrossRef]
  47. Bhushan, B. Tribology and Mechanics of Magnetic Storage Devices; Springer: New York, NY, USA, 1996. [Google Scholar]
  48. Blau, P.J. Scale effects in sliding friction: An experimental study. In Fundamentals of Friction: Macroscopic and Microscopic Processes; Springer: Berlin/Heidelberg, Germany, 1992; pp. 523–534. [Google Scholar]
  49. Chowdhury, M.; Khalil, M.K.; Nuruzzaman, D.M.; Rahaman, M.L. The effect of sliding speed and normal load on friction and wear property of aluminum. Int. J. Mech. Mechatron. Eng. 2011, 11, 45–49. [Google Scholar]
  50. Chowdhury, M.; Nuruzzaman, D.M.; Mia, A.H.; Rahaman, M.L. Friction coefficient of different material pairs under different normal loads and sliding velocities. Tribol. Ind. 2012, 34, 18. [Google Scholar]
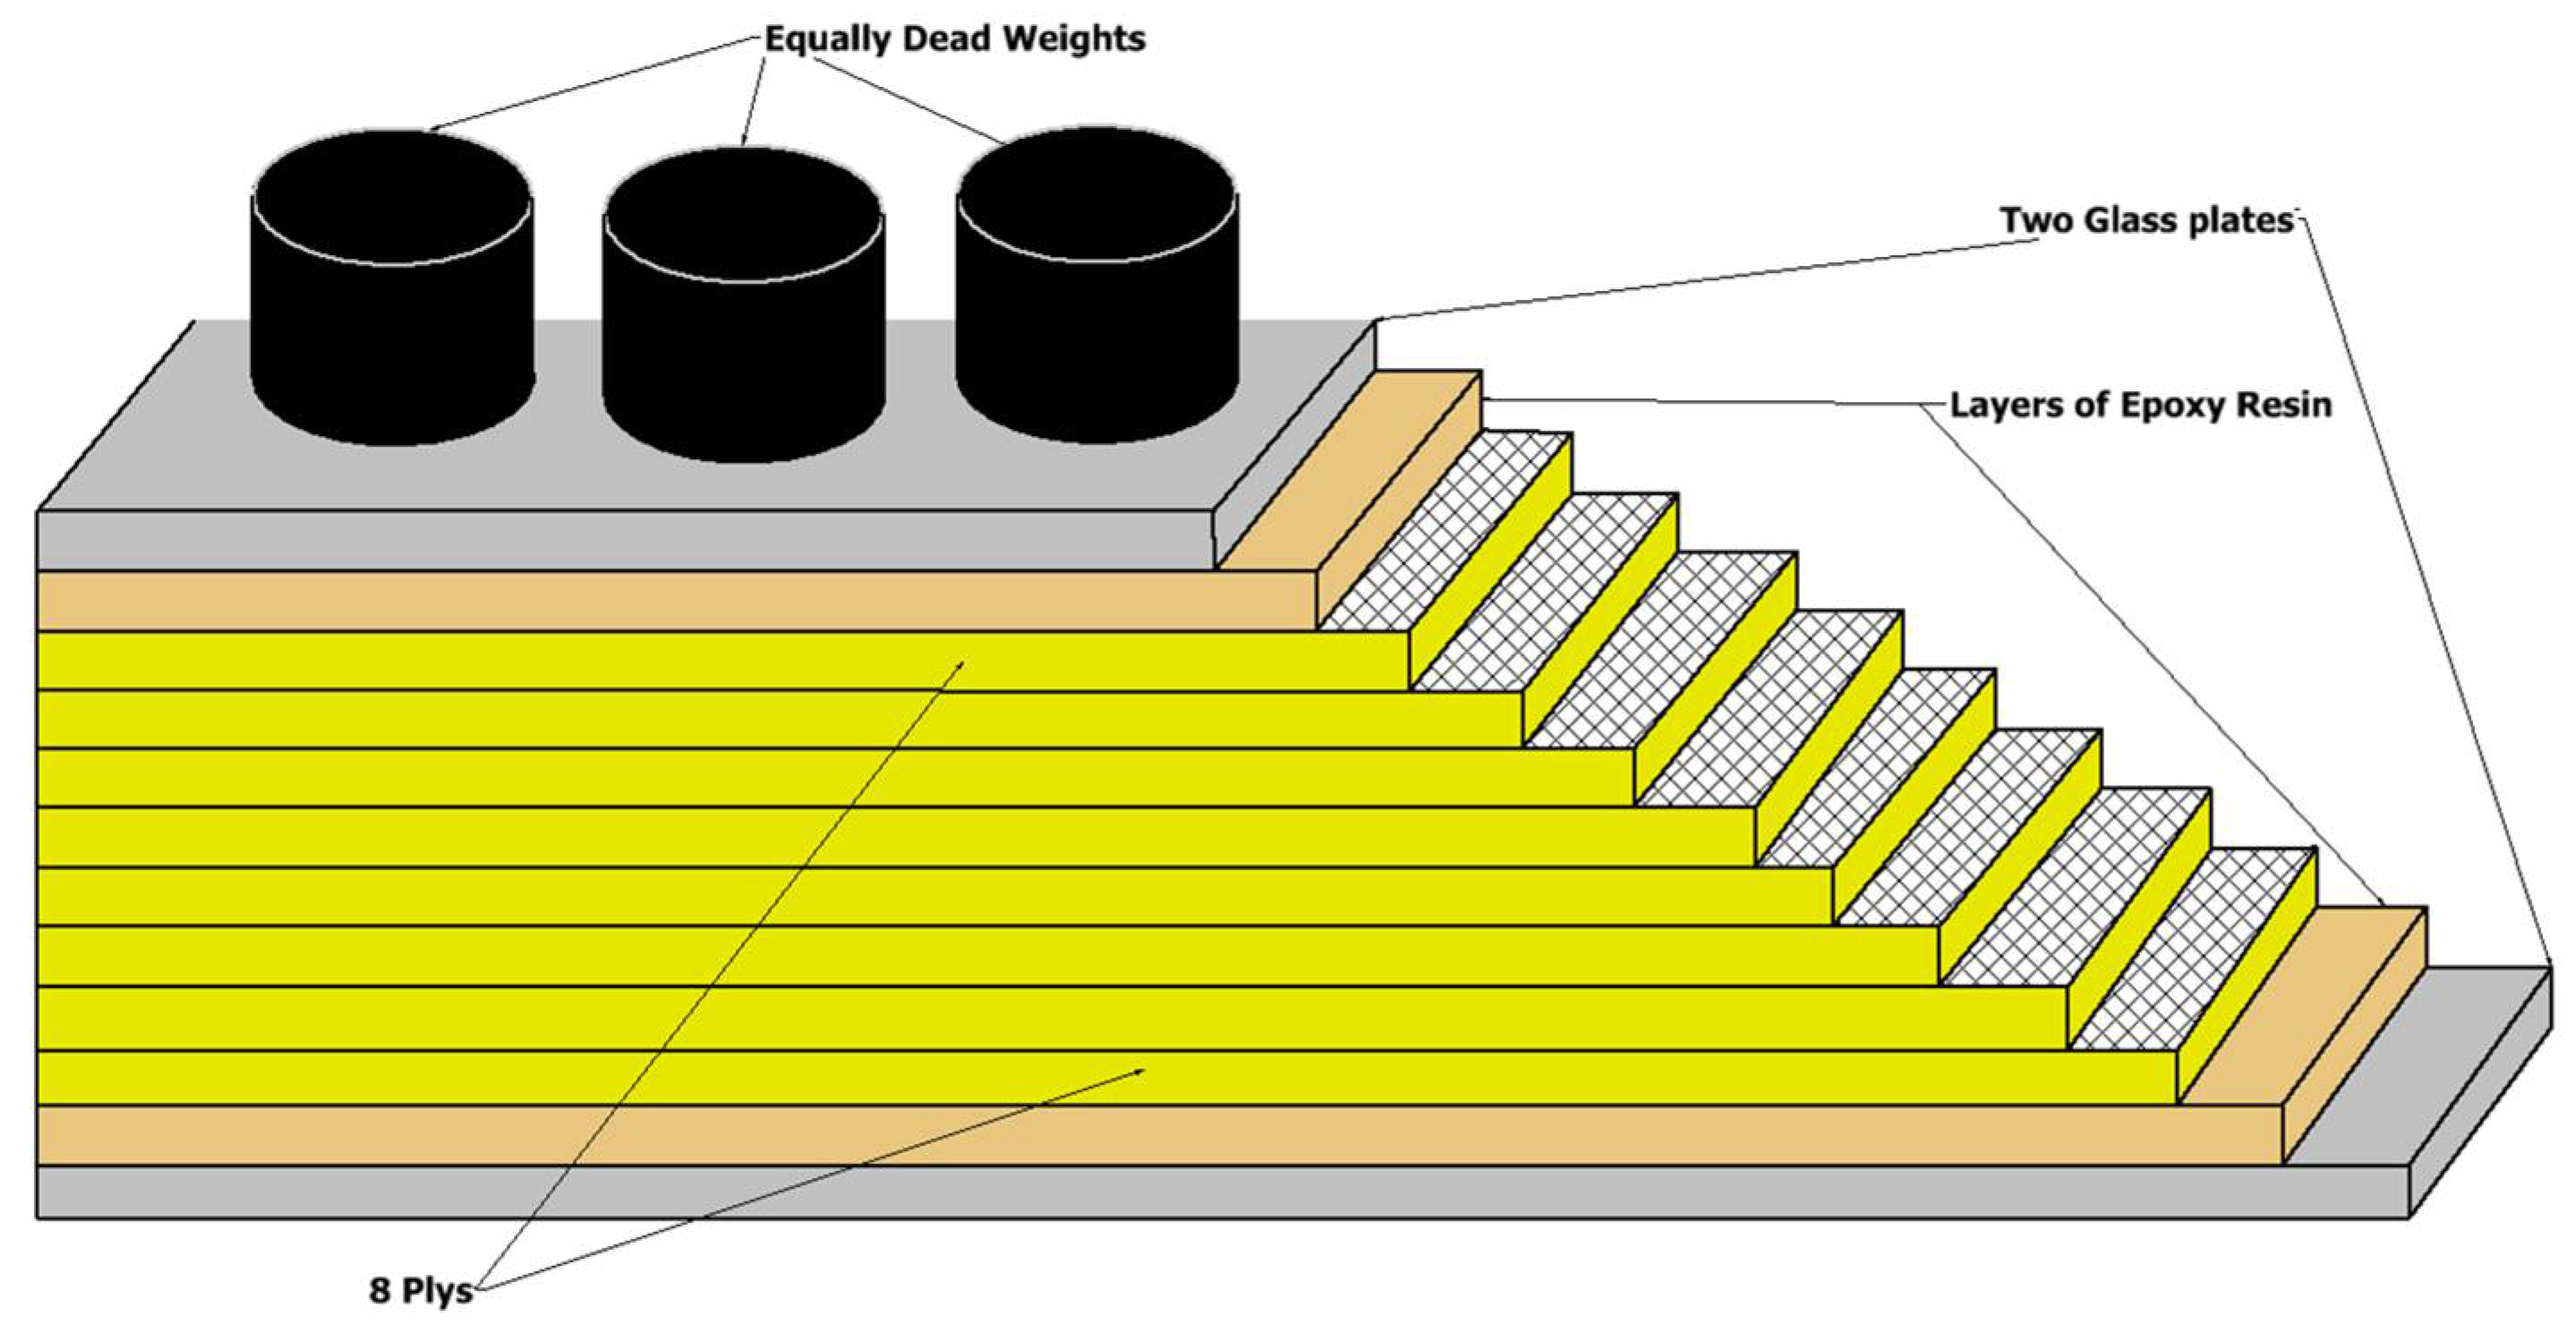
Figure 1. Schematic drawing of the laminate structure.
Lubricants 10 00317 g001
Figure 2. Schematic drawing of the tensile specimen (dimensions in mm).
Lubricants 10 00317 g002
Figure 3. Pin-on-disc machine.
Lubricants 10 00317 g003
Figure 4. Diagram of the free body of the test method.
Lubricants 10 00317 g004
Figure 5. FE area (a) boundary condition, (b) mesh, (c) mesh convergence.
Lubricants 10 00317 g005
Figure 6. Stress and strain relationship for different laminated composites.
Lubricants 10 00317 g006
Figure 7. Types of failure (a) CFRP, (b) GRP-W, (c) GRP-R.
Lubricants 10 00317 g007
Figure 8. Weight loss as a function of the type of lubricant for CFRP composites.
Lubricants 10 00317 g008
Figure 9. Weight loss as a function of the type of lubricant for R-GFRP composites.
Lubricants 10 00317 g009
Figure 10. Variation in weight loss with different lubricants for W-GFRP composites.
Lubricants 10 00317 g010
Figure 11. Comparison of weight loss variation with different laminated materials for the dry lubricated case.
Lubricants 10 00317 g011
Figure 12. Comparison of the weight loss variation with different laminated materials for grease-lubricated specimens.
Lubricants 10 00317 g012
Figure 13. Comparison of weight loss variation with different laminated materials for the oil-lubricated case.
Lubricants 10 00317 g013
Figure 14. Failure modes of the wear specimens; (a) CFRP, (b) GFRP-W, (c) GFRP-R.
Lubricants 10 00317 g014
Figure 15. Comparison between cumulative wear and different materials at different lubrication conditions.
Lubricants 10 00317 g015
Figure 16. Static coefficient of friction predicted with FEM and the model Equation (a) Coeff. Friction verses load, (b) max. coeff. Verse load, (c) max. coeff. Verse material type.
Lubricants 10 00317 g016
Figure 17. FE Displacement contour by disc.
Lubricants 10 00317 g017
Table 1. Mechanical and physical properties of E-glass fiber, AS4 carbon fiber, and epoxy resin [29,30,31].
PropertyE-GlassAS4-Carbon FiberKemapoxy (150 RGL)
Density (kg/m3)260017901.2
Tensile strength (MPa)3450427085
Modulus of Elasticity (GPa)802282.5
Passion’s ratio0.250.340.35
In plane shear modulus (GPa)30.8251.24
Table 2. Specimen specification and dimensions.
MaterialThickness t, mmWidth w, mmArea A, mm n Number of Fibers
S1 (CFRP) 2.21433800
S2 (GFRP-W) 55.226800
S3 (GFRP-R) 21632210
Table 3. Mechanical properties of the tested material.
SpecimensE (GPa)Tensile Strength (MPa)Elongation
(Comparative Measure)
Average ValueStd. Dev.Average ValueStd. Dev.
S1 (CFRP) 27.131.730317.98lower
S2 (GFRP-W)15.361.2187.510.5intermediate
S3 (GFRP-R) 5.011.51252.5higher
Table 4. Changes in cumulative weight loss at different surface conditions.
Laminate TypesGreaseOilDry
CFRP0.1440.1680.306
GFRP-W0.150.2080.25
GFRP-R0.0840.140.158
Publisher’s Note: MDPI stays neutral with regard to jurisdictional claims in published maps and institutional affiliations.