Article

Influence of Friction on the Formability of Fe-Zn-Coated IF Steels for Car Body Parts

Department of Automotive Production, Faculty of Mechanical Engineering, Technical University of Košice, Mäsiarska 74, 04001 Kosice, Slovakia
*
Author to whom correspondence should be addressed.
Lubricants 2022, 10(11), 297; https://doi.org/10.3390/lubricants10110297
Submission received: 5 October 2022 / Revised: 19 October 2022 / Accepted: 27 October 2022 / Published: 4 November 2022
(This article belongs to the Special Issue Modelling in Tribology and Biotribology)

Abstract

:
This paper presents the formability results of galvanized Zn-Fe-based interstitial-free (IF) “galvanneal” steel sheets with different degrees of alloying. The Fe content of the Zn-Fe coatings was determined by titration method and the phase composition of the coatings was determined by raster electron microscopy with EDX analyzer. A deterioration of the adhesion of the Fe-Zn coating to the substrate was observed in the pre-alloyed coating. The applied modes of annealing and smooth rolling after the surface galvanization resulted in a change in the surface microgeometry parameters Ra and Pc. The suitability of the surface microgeometry of the used Zn-Fe-coated sheets was assessed using control diagrams and the capability indexes Cpk with respect to the defined specifications. The coefficient of friction was determined by dry friction cup test, and using Anticorit lubricant and microtene film as lubricants. With increasing Fe content in the coating, a slight increase in friction coefficient values was observed—a slight deterioration in formability. The results obtained indicate that for car body surface parts, the Fe content of the Zn-Fe coating should range from 7% to 12%.

1. Introduction

The lifespan of a car is largely limited by the lifespan of its body. The car manufacturers strive to prevent perforation corrosion for ten years and cosmetic corrosion of automobile body parts for five years. In order to meet these requirements, materials with multi-functional coatings based on zinc, tin, aluminum, lead, nickel, chromium, as well as their combinations with organic coatings, are being developed. Considering the ratio between the fulfillment of car manufacturer specifications and the price, zinc-based coated steel sheets are irreplaceable among coated steel sheets [1,2]. Improvement of the anti-corrosion properties of the zinc layer can be achieved by modifying the chemical composition of the Zn-Al-Mg-based coatings, or by annealing the Zn-Fe-based zinc coating (GA—galvannealed coatings) [3,4]. The corrosion resistance provided by zinc steel is not the only requirement that galvanized sheet metal must meet for visible parts of car bodies. From the point of view of the manufacturability of visible body parts, their formability, weldability and paintability must be ensured. A pure zinc coating is no longer able to guarantee this without reservation. During spot welding of zinc-coated sheets, excessive wear of the welding electrodes occurs [1,2,5]. During pressing, zinc sticks to the contact surfaces of the pressing tool, resulting in an increase in frictional forces and a deterioration of formability [2,3,4]. One of the possibilities for eliminating these negative effects is to replace the pure zinc coating with multifunctional zinc coatings based on Zn-Fe, Zn-Al-Mg, etc. In European countries, Hot Dip Galvanized steel (HDG) and Electro Galvanized steel (EG) are most often used. In contrast, Zn-Fe coatings (Galvannealed steel GA) are more widely used in the countries of the North American Free Trade Area (NAFTA) [5].
Zn-Fe coatings are obtained by annealing galvanized steel sheets for a few seconds at a temperature of 500–565 °C in a furnace located at the outlet of the galvanizing bath [4]. The zinc in the coating interfuses with the iron substrate to form several Zn-Fe intermetallic phases that are layered on the steel substrate. The hardness of Zn-Fe coatings depends mainly on the iron content and the distribution of Zn-Fe intermetallic phases. Compared with pure zinc coatings, Zn-Fe coatings are harder, more scratch-resistant, more suitable for spot welding, more suitable for pressing, more suitable for painting, more cost-effective (zinc consumption is reduced) and more resistant to corrosion [6,7,8,9]. The author draws attention to some problems related to formability, peeling of Zn-Fe from the substrate and their corrosion resistance [10]. After annealing not only the % Fe content in the coating changes, but also the parameters (roughness Ra, number of peaks Pc, etc.) of the surface texture of the coating after smooth rolling [11,12]. Changes in these surface texture parameters affect the manufacturability (formability, paintability), as well as the overall quality of the body surface parts [13]. With the development of the automotive industry, the demand for cold and hot rolled steel sheets with controlled surface microgeometry, excellent formability and resistance to corrosion is increasing. In general, the surface of sheet steel for the automotive industry for visible car parts must be met with a roughness Ra = 0.6–1.6 μm and with the number of peaks Pc > 50 cm−1 [14]. For example, Škoda Auto requires a roughness Ra = 1.1–1.6 μm and a minimum number of peaks Pc ≥ 40 cm−1 for car body panel parts; Ford requires roughness Ra = 1.1–1.7 μm and a minimum number of peaks Pc ≥ 50 cm−1 and Volkswagen requires roughness Ra = 1.1–1.6 μm and a maximum number of peaks Pc ≥ 60 cm−1 [14,15,16,17].
The texture of the sheet metal surface plays an important role in the manufacture of the outer car body panels because during forming the lubricant is retained in the craters (pits) on the surface of the sheet, forming a thin film between the contact surfaces of the tool and the blank sheet metal. The formed lubricant film reduces frictional forces and im-proves formability. Formability is the ability of a material to undergo plastic deformation into the desired shape without defects under certain thermomechanical conditions (e.g., temperature, friction, deformation, deformation speed). The formability depends not only on mechanical properties but also on elements of the tribological system (blank holder—lubricant—blank sheet metal—lubricant—die) when stamping body parts from metal sheets. A crack in the stamped part occurs at the moment when the total punch drawing force TPDF exceeds the value of the total punch drawing force required to break the stamped part Fcrack (Figure 1).
TPDF ≤ Fcrack,
The total punch force consists of the following force components:
TPDF = FID + FFBH-BS + FBRD + FFBS-SD + FFBS-DR,
FFBH ≅ FFBH-BS + FFBS-SD,
T PDF = ( F ID + FF BH + F BDR ) e α · CF BS - DR
or
FF BS - DR = T PDF ( 1   e α · CF BS - DR )
Frictional forces FFBH and FFBS-DR increase the TPDF value which is necessary to draw a stamped part with a diameter of d from a blank sheet metal with a diameter of D0. By the ratio of the blank sheet metal diameter D0 to the diameter of the punch d, the Limit Drawing Ratio (LDR) is given [13,18,19]:
LDR = D 0 max d
where D0max is the maximum diameter of the blank sheet metal from which it is possible to produce a stamped part without crack with the diameter of the punch d.
LDR is an important indicator of the formability of steel sheets, which is used in the grading of drawing operations for the production of more demanding rotationally symmetrical stamped parts [13,20,21,22]. The issue of friction and lubrication during stamping operations is analyzed in detail in [23,24,25,26,27,28,29,30,31]. Several methods have been developed in order to study friction on the contact surfaces of pressing tools. For example, drawing the sheet metal strip between the flat jaws combined with drawing the sheet metal strip over the drawing edge of the die. Another option is to determine CF using a pin-on-disk test, a ball-on-disc test, or a cup test [13,32,33,34,35,36,37]. For the prediction of the technological characteristics of the deep drawing process, the cup test is a more CF-process-relevant determination approach. With this test, it is possible to model the stress of the contact surfaces during sheet metal forming. The aim of the scientific research was to implement innovative tools of the six sigma methodology in order to minimize waste (defective stamped parts) or to achieve zero waste in the production of stamped parts from metal sheets. Another contribution is the expression of the coefficient of friction based on the results of the cup test, which will make it possible to more accurately determine the coefficient of friction without simplifying assumptions.

2. Materials and Methods

For experimental research, steel sheets from IF steel stabilized with Ti were used, the chemical composition of which is shown in Table 1. By annealing after galvanizing and smooth rolling, Zn-Fe coatings with different degrees of alloying and with different surface textures were obtained. The Fe content of the coating in the materials used was determined by the titration method, and the phase composition of the coatings was determined by raster electron microscopy with an EDX analyzer. The individual phases were identified on the basis of the percentage content of Zn-Fe—Table 2 [2,38].
The applied modes of annealing and smooth rolling after the surface galvanization resulted in a change in the surface microgeometry parameters Ra and Pc. The values of the microgeometry parameters Ra and Pc of the metal sheets used were determined using the Hommel Tester 1000 device in the direction of 90° with respect to the direction of rolling—Table 3. The values of the mechanical properties were determined in the direction 90° with respect to the rolling direction by tensile test on the TIRATEST 2300 device. The tensile test was performed in accordance with standards EN ISO 6892-1:2010, ISO 10275:20220, and ISO 10113:2020—Table 4. The parameters of the Swift model were determined from the dependence of the actual stress on the deformations:
σ = K φ 0 + φ n
which are used to describe the mechanical behavior of the material in the simulation of crash tests of thin-walled body parts and for predicting the formability (manufacturability) of sheet metal parts by forming technologies [23,39,40,41,42,43,44].
For the experimental determination of CF, a cup test was used, which was carried out on the Erichsen universal machine. From the blank sheet metal with diameter D0 = 130 mm, cylindrical stamped parts were drawn by a punch with a diameter of d = 77.2 mm, and with the die radius rd = 5 mm and the punch radius rp = 5 mm. The stress on the contact surfaces between the blank sheet metal and the tool was modeled by changing the lubricant and changing the blankholder force (BHF = 10 kN, 20 kN, 30 kN, 40 kN and 50 kN). The following lubricants were used in the experiments: Anticorit 3802-39S (kinematic viscosity η40°C = 60 mm2·s−1 according to DIN 51 562), microtene film and lubricant-free drawing (dry friction). The coefficient of friction at the interface of the tool and the blank sheet metal during dry friction was designated as CFDRY; when using a microtene film as CFMF; and when using lubricant Anticorit as CFAntic. The drawing was done at the speed of the punch vpunch = 15 mm·s−1. Before starting the application of the individual lubricants, the contact surfaces of the tool and of the blank sheet metal were degreased with technical gasoline. A layer of lubricant (approx. 2 g·m−2) was applied to the surface of the blank sheet metal from both sides to exclude direct contact between the tool and the blank sheet metal. The experiments were repeated three times for each BHF and each lubricant. In order to determine the effect of the change in friction on formability—LDR—an experiment was carried out in accordance with condition (1). TPDFs were recorded when drawing cylindrical stamped parts from the blank sheet metal with diameters D0 of 120 mm, 130 mm and 140 mm. The lubricant Anticorit 3802-39S and a BHF of 10 kN were used in the experiment. Fcrak was determined using blank sheet metal with a diameter of D0 = 160 mm and a BHF of 60 kN.

3. Results and Discussion

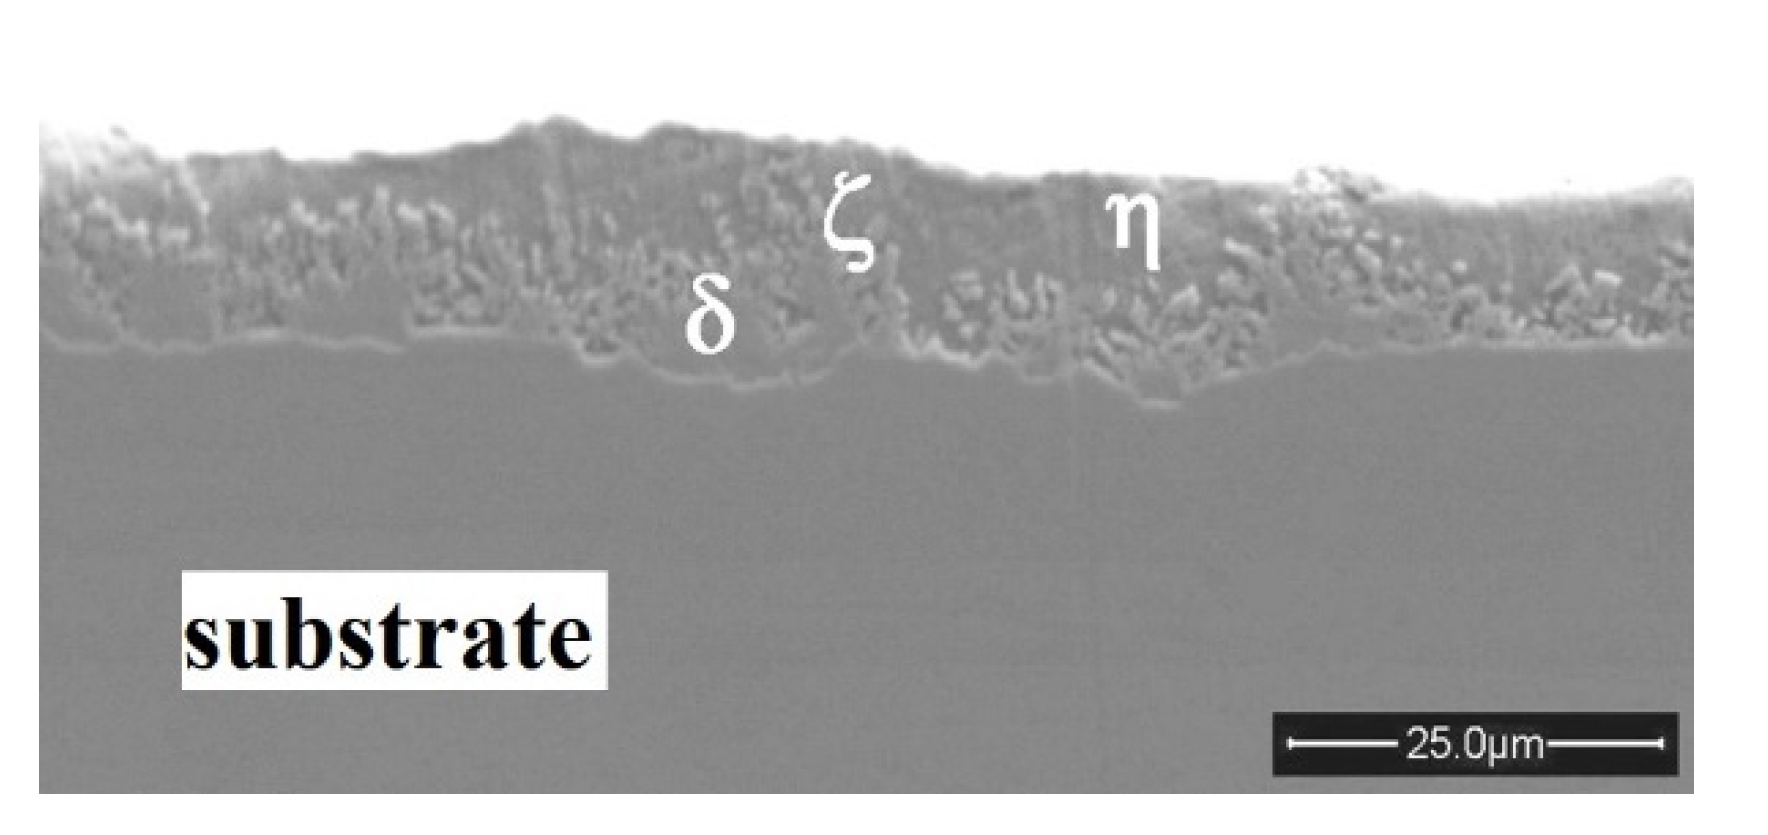
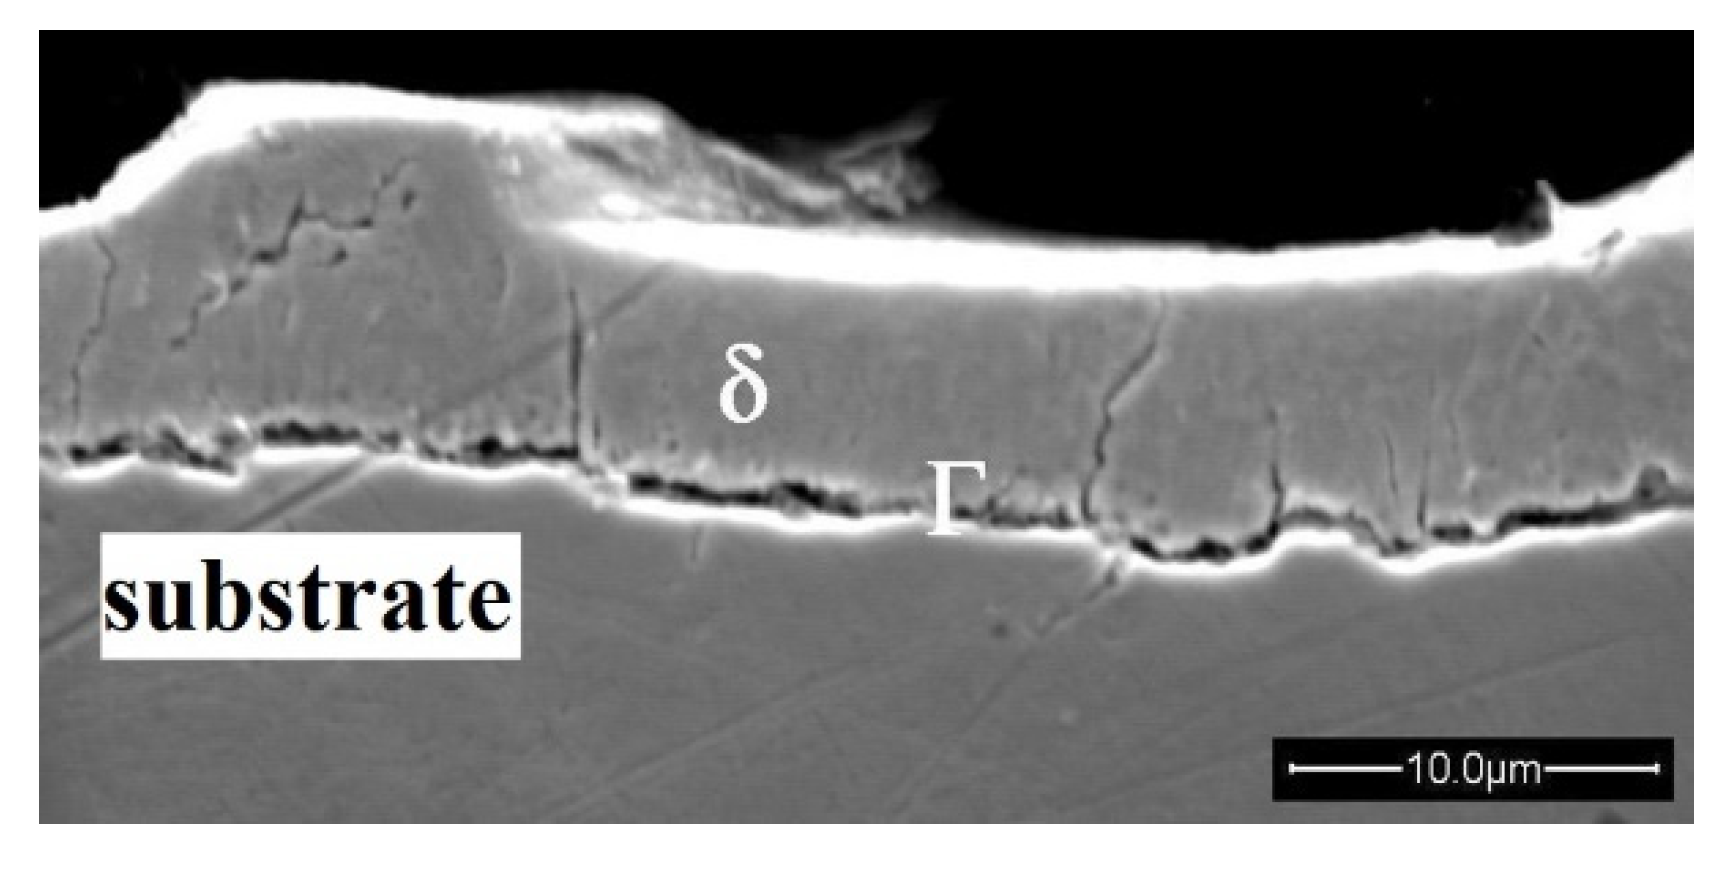
The degree of alloying is microscopically characterized by the phase composition of the coating and macroscopically by the total Fe content in the Zn coating. The analyses of the applied annealing modes after galvanizing show that the pure zinc η phase (Zn, hcp) was transformed into a Zn-Fe coating, which contains intermetallic phases δ (FeZn10, hexagonal), ζ (FeZn13, mono-clinic) and Г (Fe3Zn10)—Figure 2, Figure 3 and Figure 4. It follows that during annealing after galvanizing, the microstructure of the Zn-Fe coating (1) consisting of η, ζ and δ phase was formed. This coating microstructure is typical for an unalloyed coating—Figure 2. The microstructure of the coating of the Zn-Fe material (2), which is primarily determined by the δ phase and a thin interfacial layer Г, is characteristic in the case of a fully alloyed coating—Figure 3. Due to volume changes in the δ phase, fine cracks were observed at the interface of the substrate (blank sheet metal) and the coating and in the area of a δ layer. These fine cracks may be due to deterioration of the corrosion resistance of Zn-Fe coatings. Alloyed coatings are harder and more prone to failure by rolling in the area δ phase than a pure zinc coating. The morphology of the coating of the Zn-Fe (3) material is formed by a compact phase layer δ and an interphase layer Г—Figure 4. Larger cracks were observed at the interface between the substrate (blank sheet metal) and the coating, which progress through the layers δ and Г. As a result, there may be unwanted exposure of the substrate and deterioration of the corrosion resistance of the Zn-Fe coating [2,6,38].
It should be noted that for GA coating thicknesses of less than 60 g/m2, no powdering occurs. A coating mass of 55 g/m2 or lower will pass most automotive powdering tests. A comparison of the measured values shown in Table 2 shows that this condition is fulfilled by the alloyed Zn-Fe (2) and the over-alloyed Zn-Fe (3) coating. The Zn-Fe (1) coating was unalloyed. Flaking, as a failure of the bond between the steel and the coating, occurs during bending/unbending strain, followed by a shear stress on the coating, such as is present along the bead in a draw die. It can result from either a weakened coating–steel bond (due to over-alloyed coating, or heavy temper rolling), or an increased transmission of strain to the coating–steel interface [45].
Table 3 shows that the applied modes of annealing and subsequent smooth rolling led to a gradual decrease in the surface texture parameters Ra and Pc. The authors noted a similar tendency in Refs. [10,46]. The suitability of the investigated Zn-Fe-coated sheets was analyzed from the point of view of Ford company specifications for Ra and Pc parameters using control diagrams and capability indexes of the applied processes. When setting the limits in the control diagram, we started from the probability distribution of the relevant selection characteristics. The control limits define the range of values for the selection characteristics of individual subgroups with a pre-selected probability, provided that only random causes of process parameter variability act on the examined process in a given period of time. Figure 5 shows control diagrams with measured roughness values Ra. The horizontal center line represents the target nominal roughness value Ra (TMVRa = 1.4 µm, green dot-dashed line) according to Ford company specifications [14,15,16,17]. Lines representing the upper control limit (UCL—red line), lower control limit (LCL—red line), upper warning limit (UWL—orange line) and lower warning limit (LWL—orange line) have been added to the graph as follows:
UCL Ra = TMV Ra + 3 UCL LCL 6 = 1.7   μ m
LCL Ra = TMV Ra 3 UCL LCL 6 = 1.1   μ m
UWL Ra = TMV Ra + 2 UCL LCL 6 = 1.6   μ m
LWL Ra = TMV Ra 2 UCL LCL 6 = 1.2   μ m
USPCL Ra = TMV Ra + UCL LCL 6 = 1.3   μ m
LSPCL Ra = TMV Ra UCL LCL 6 = 1.3   μ m
Areas between UCL = 1.7 µm and UWL = 1.6 µm, or between LCL = 1.1 µm and LWL = 1.2 µm, are considered to be risky (unstable) due to high variability of the process parameters. The area within the range of measured values in the USPCL and LSPCL area is considered to be stable and under statistical control [47,48]. Process capability was also assessed using the Cpk capability indexes. Capability indexes Cpk,Ra were calculated based on the measured average MVRa values and UCLRa specifications and LCLRa of Ra parameters subject to Ford company specifications according to relation (14):
C pk , Ra = min UCL x ¯ 3 σ ,   x ¯ LCL 3 σ = min C pkU , C pkL
and in the case of Pc, only LCLPc is specified by the Ford company; therefore, the capability index was calculated according to relation (15):
C pk , Pc , lower =   x ¯ LCL 3 σ
where   x ¯ are measured average values of the roughness Ra and the number of peaks Pc, σ is the standard deviation.
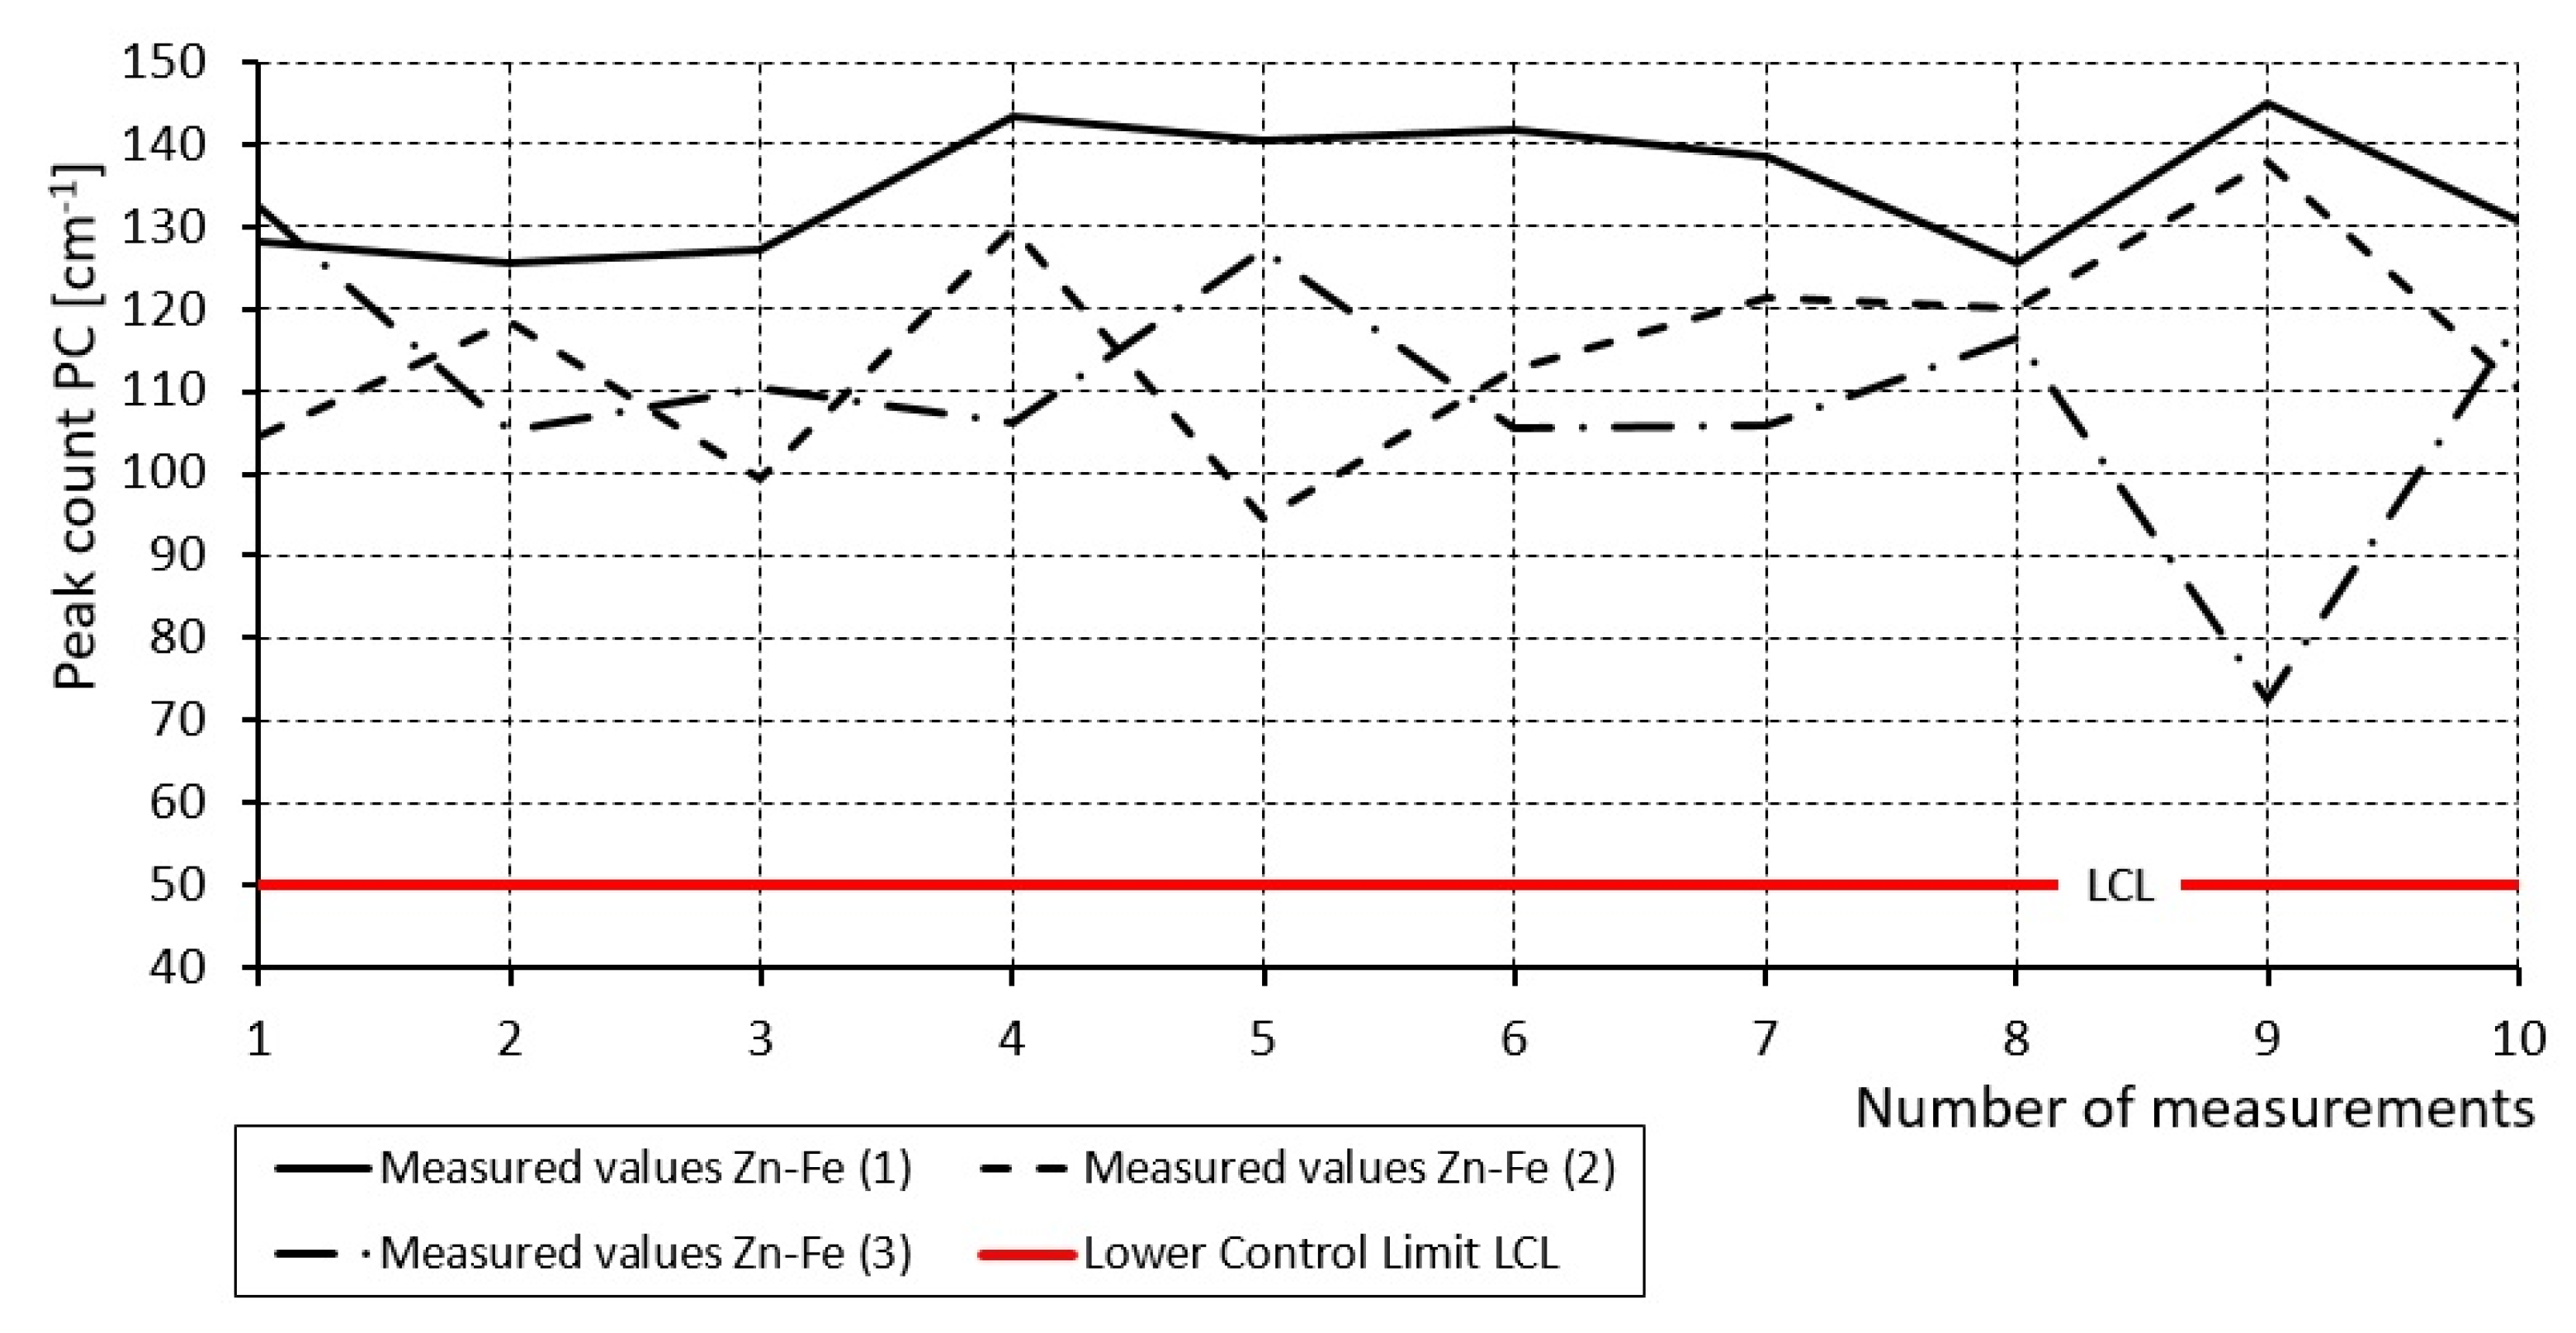
In the case of the Zn-Fe (1) coating, the measured Ra and Pc values are within the range of USPCL and LSPCL—Figure 5 and Figure 6. Cpk,Ra values and Cpk,Pc were greater than 1.33. This means that the Zn-Fe (1) coating formation process is capable of achieving the specified roughness values Ra and Pc and is under statistical control. In the case of the fully alloyed Zn-Fe (2) coating, the Ra values in the warning area were in the range of TMV and LWL—Figure 5—and Pc values were under statistical control—Figure 6. CpkL,Ra values were less than 1.33 and Cpk,Pc values were greater than 1.33. This means that it is necessary to take corrective measures, because in production there may be an increase in the risk of producing sheets that do not conform to the defined specification of the Ra parameter. For example, it will be necessary to apply continuous roughness measurement and, based on online information, to optimize the rolling mill settings so that Ra values are achieved in accordance with the defined specification along the entire width and length of the strip. In the case of pre-alloyed Zn-Fe coating (3), Ra values were in the range of LWL and LCL and also beyond the LCL border. CpkL,Ra values were less than 1.33 [47,49] and Cpk,Pc values were greater than 1.33. In this case, it is necessary to take corrective measures, because the risk of producing non-conforming products is high.
Another opportunity to improve formability in the process of forming galvanized sheets is the elimination of friction between the contact surfaces of the tool and the blank sheet metal. As a result of increased friction on the contact surfaces, scratches, coating cracks and peeling of the zinc coating occur and the integrity of the base material is damaged. Friction on contact surfaces can be improved by applying lubricants with additives [50]. Even at increased pressures and temperatures, lubricants with additives are able to form a thin layer (film) with low CF values on the contact surfaces. The purpose of the designed experiment was to verify:
  • CF is constant, i.e., in the area under the blank holder, and CFBH is the same as on the drawing edge of the die (CF = CFBH = CFDR);
  • CF is not constant, i.e., it changes depending on the used lubricant, pressure on the contact surfaces, drawing speed, surface morphology of the contact surfaces, etc. (CFBH ≠ CFDR).
When designing the experiment, we assumed that if the contact surfaces are separated by a continuous CF layer, it should be the same in the area under the blank holder and on the draw edge of the die (CF = CFBH = CFDR). Such a condition was modeled using microtene film as a lubricant. Lubricant efficiency can be expressed by the PL indicator [13]:
PL = T PDF , Dry T PDF ,   Lub
If PL is greater than 1, then the application of a lubricant will achieve a reduction in TPDF, a decrease in energy consumption and the number of stamping operations, an increase in LDR, the tool life, and a reduction in the risk of stamped part fracture.
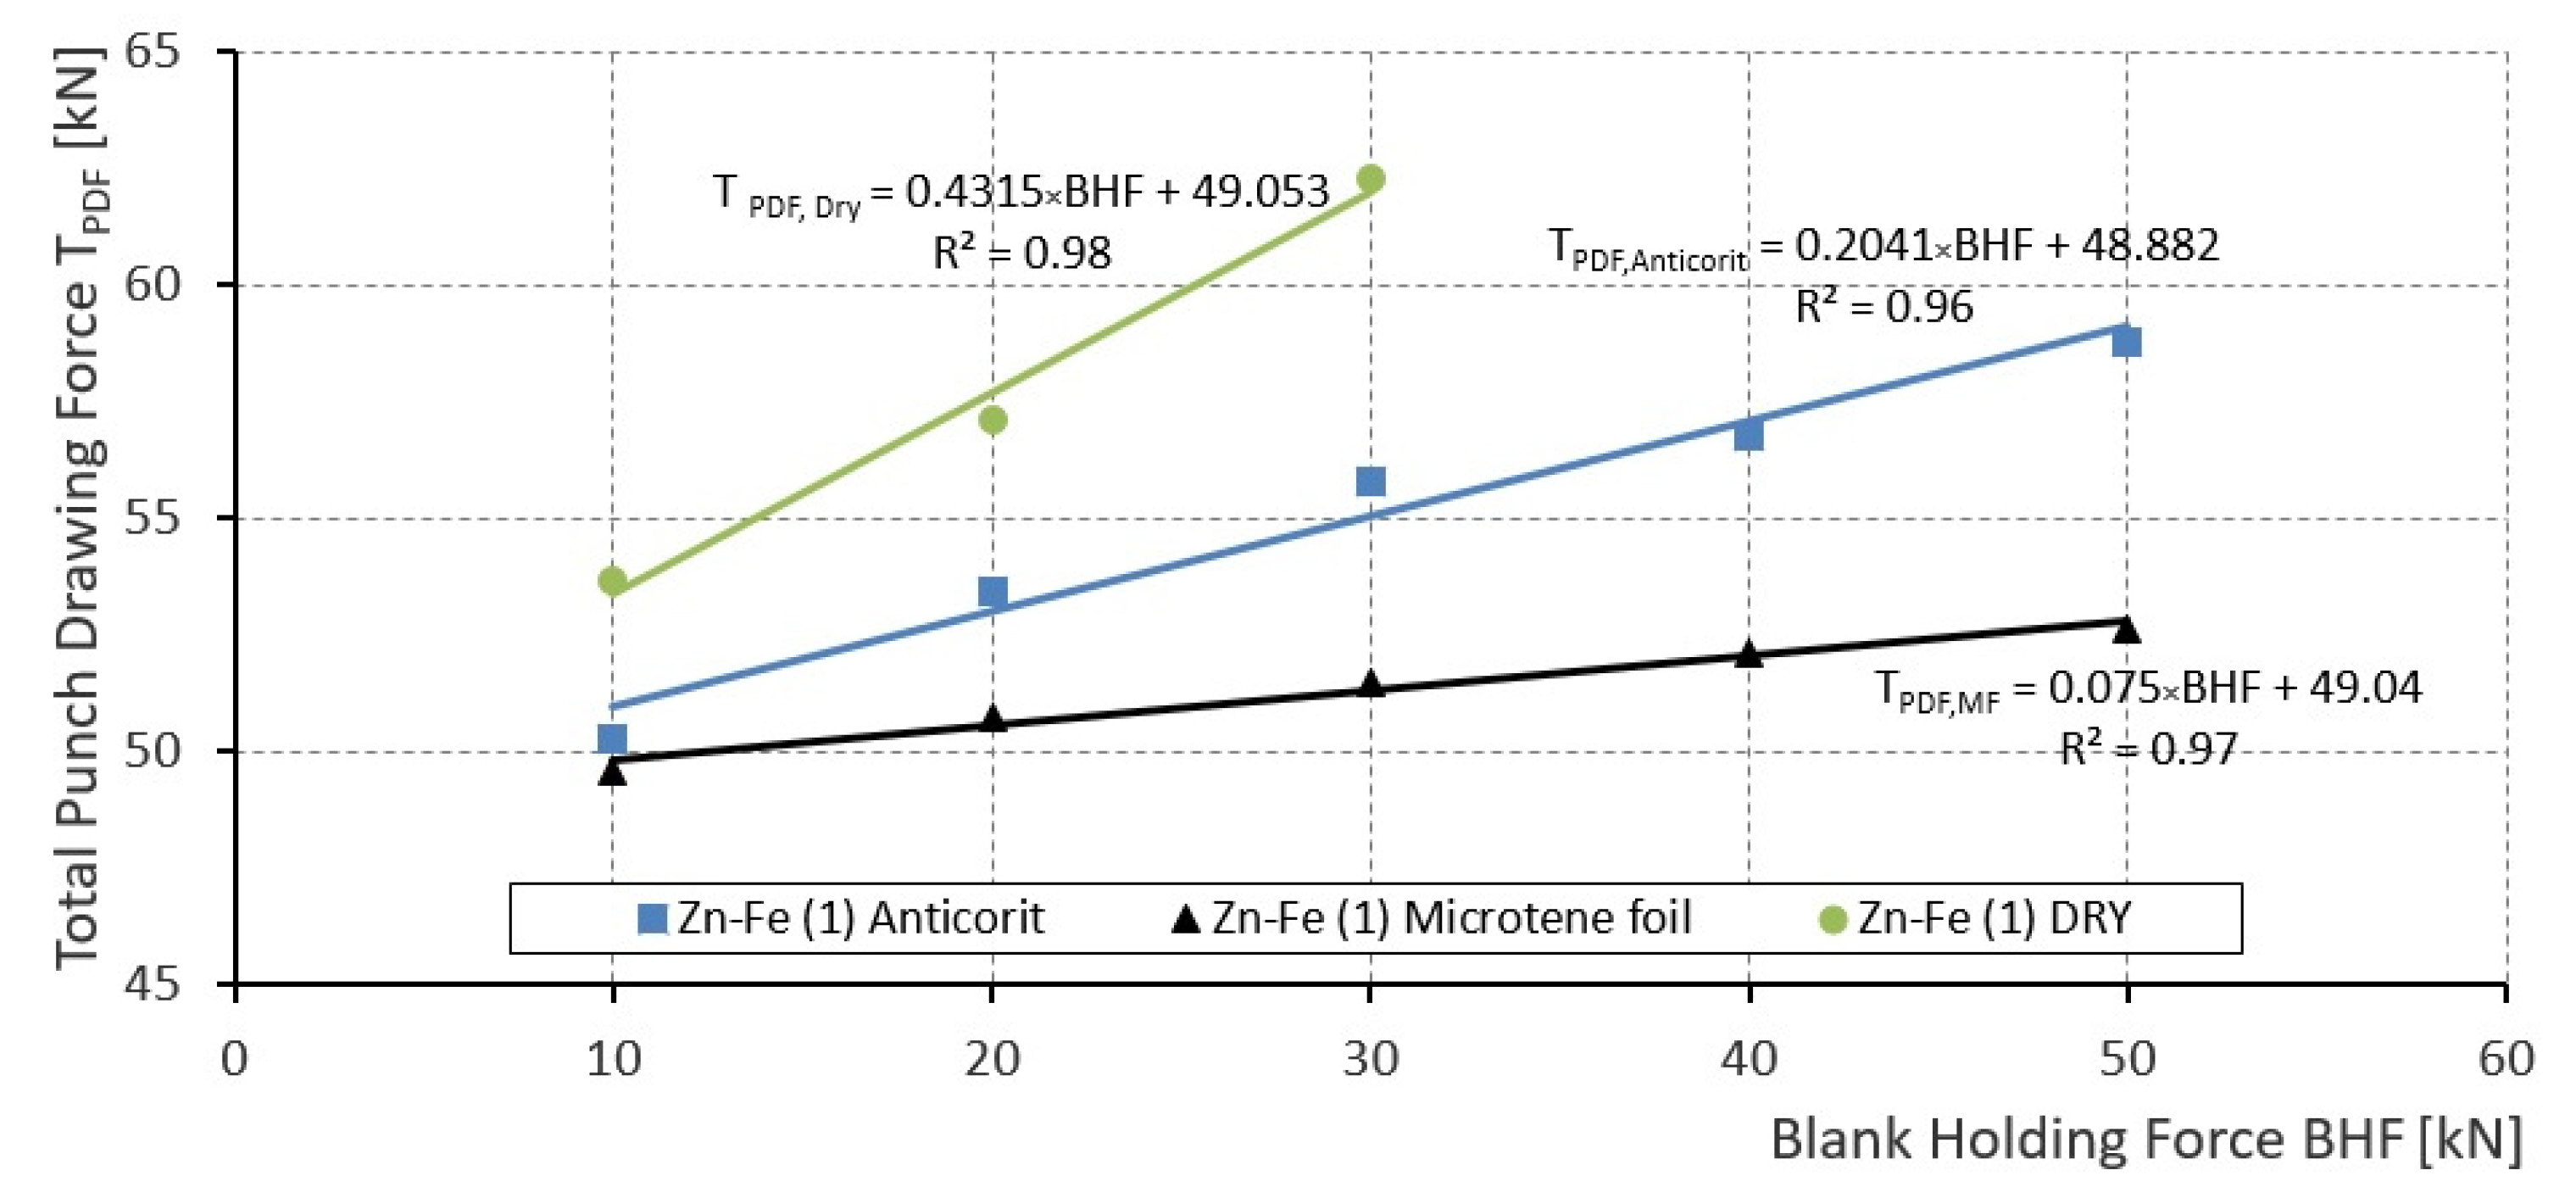
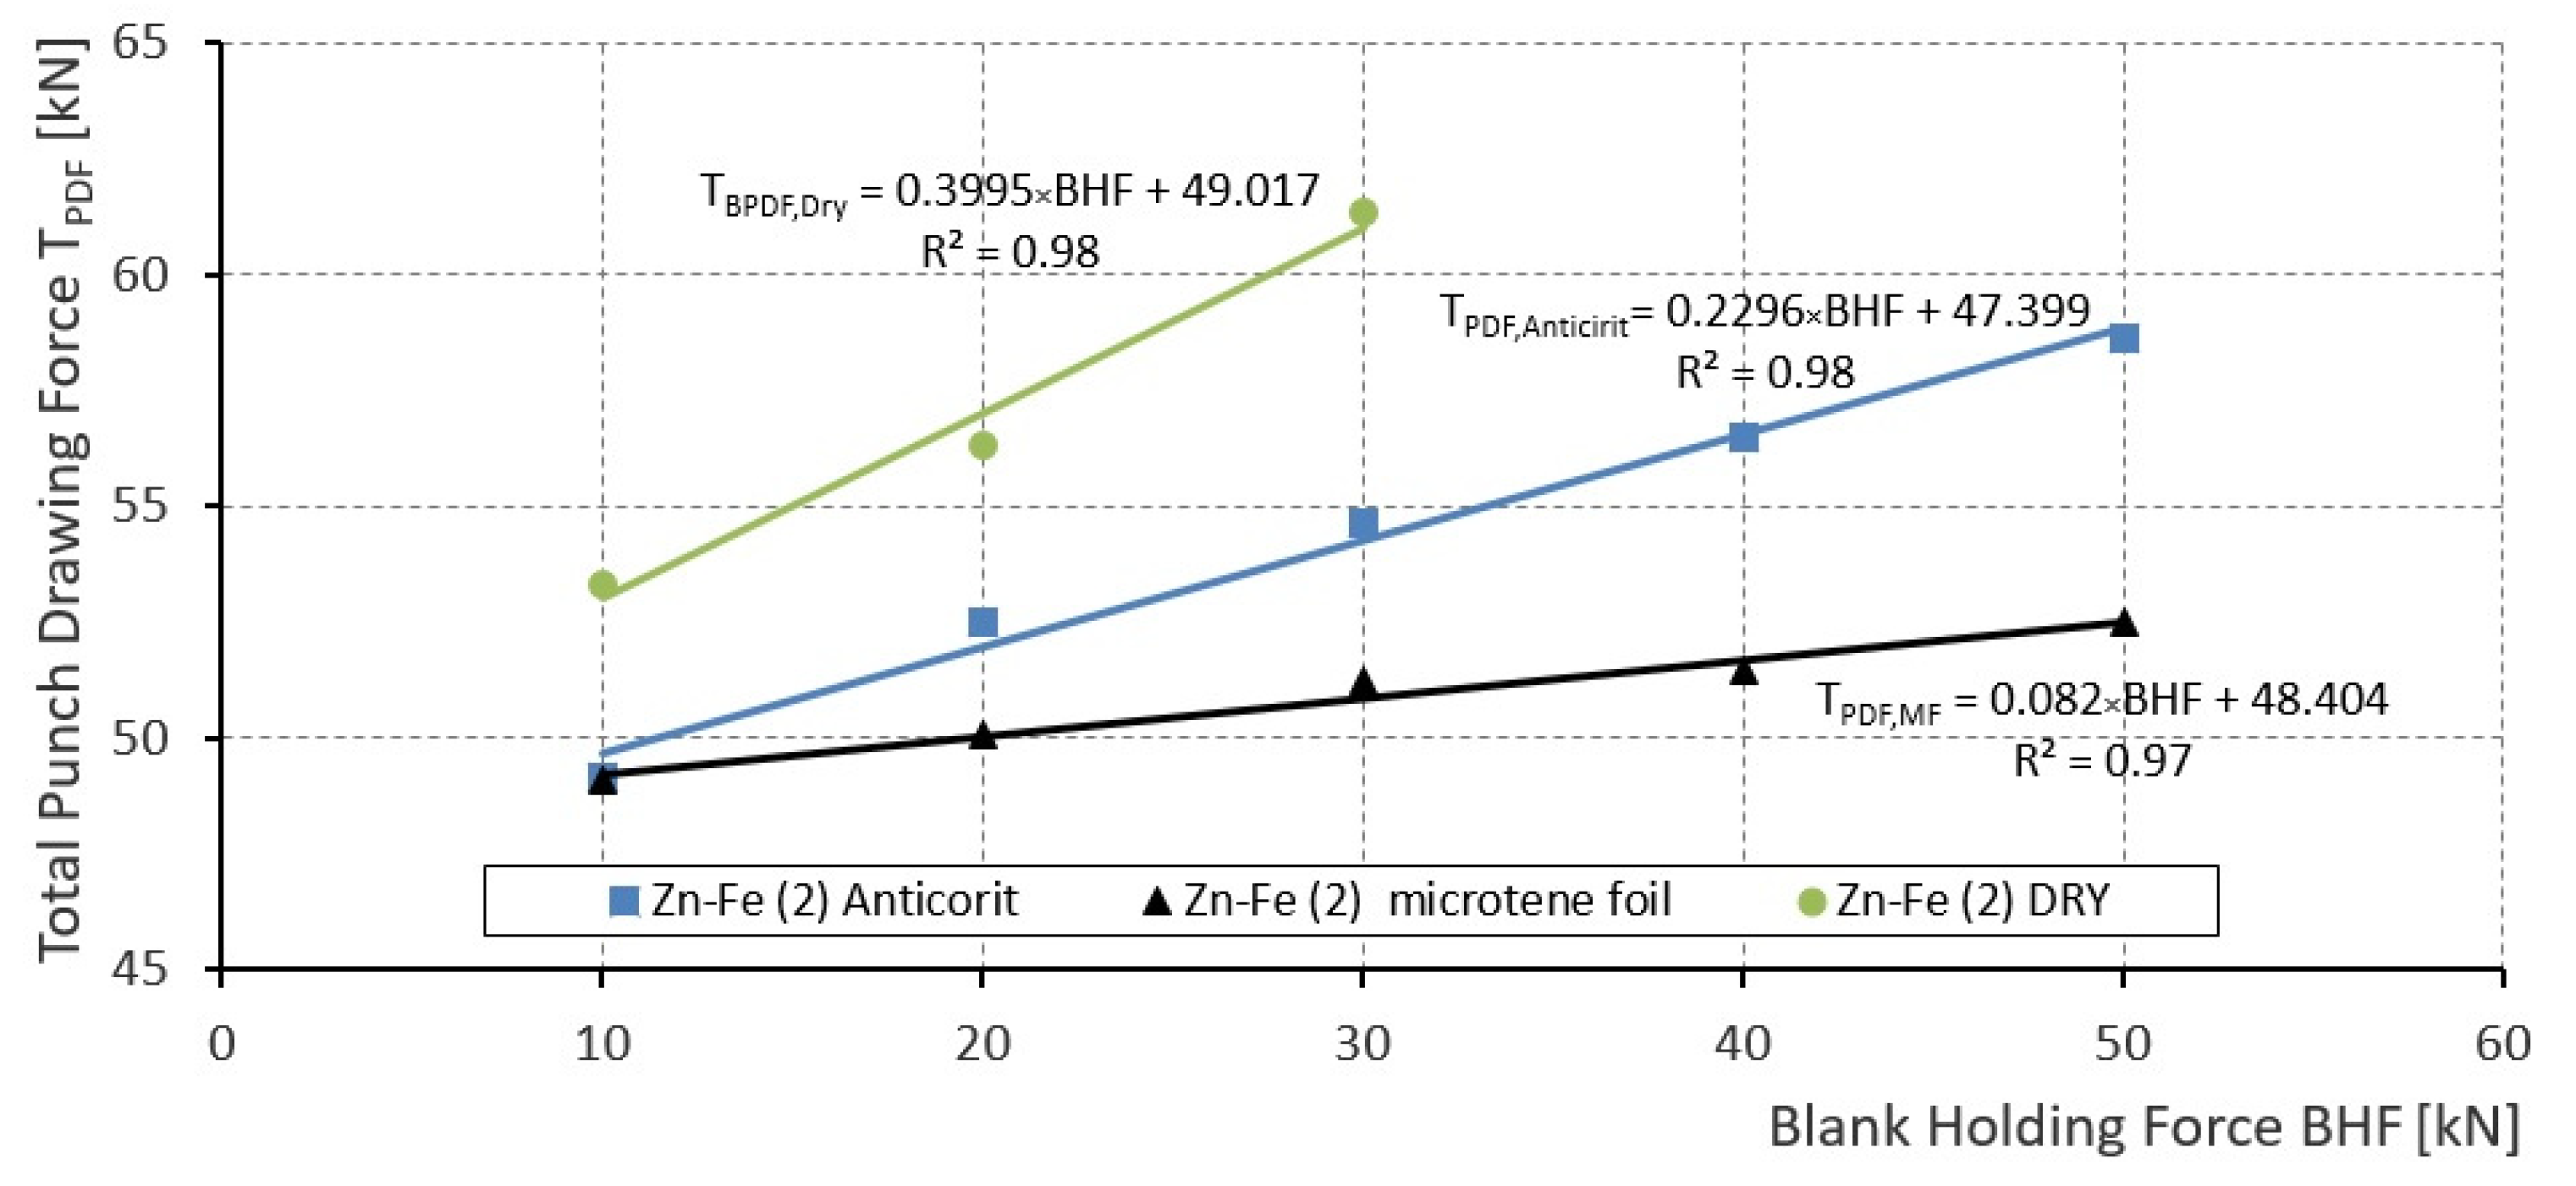
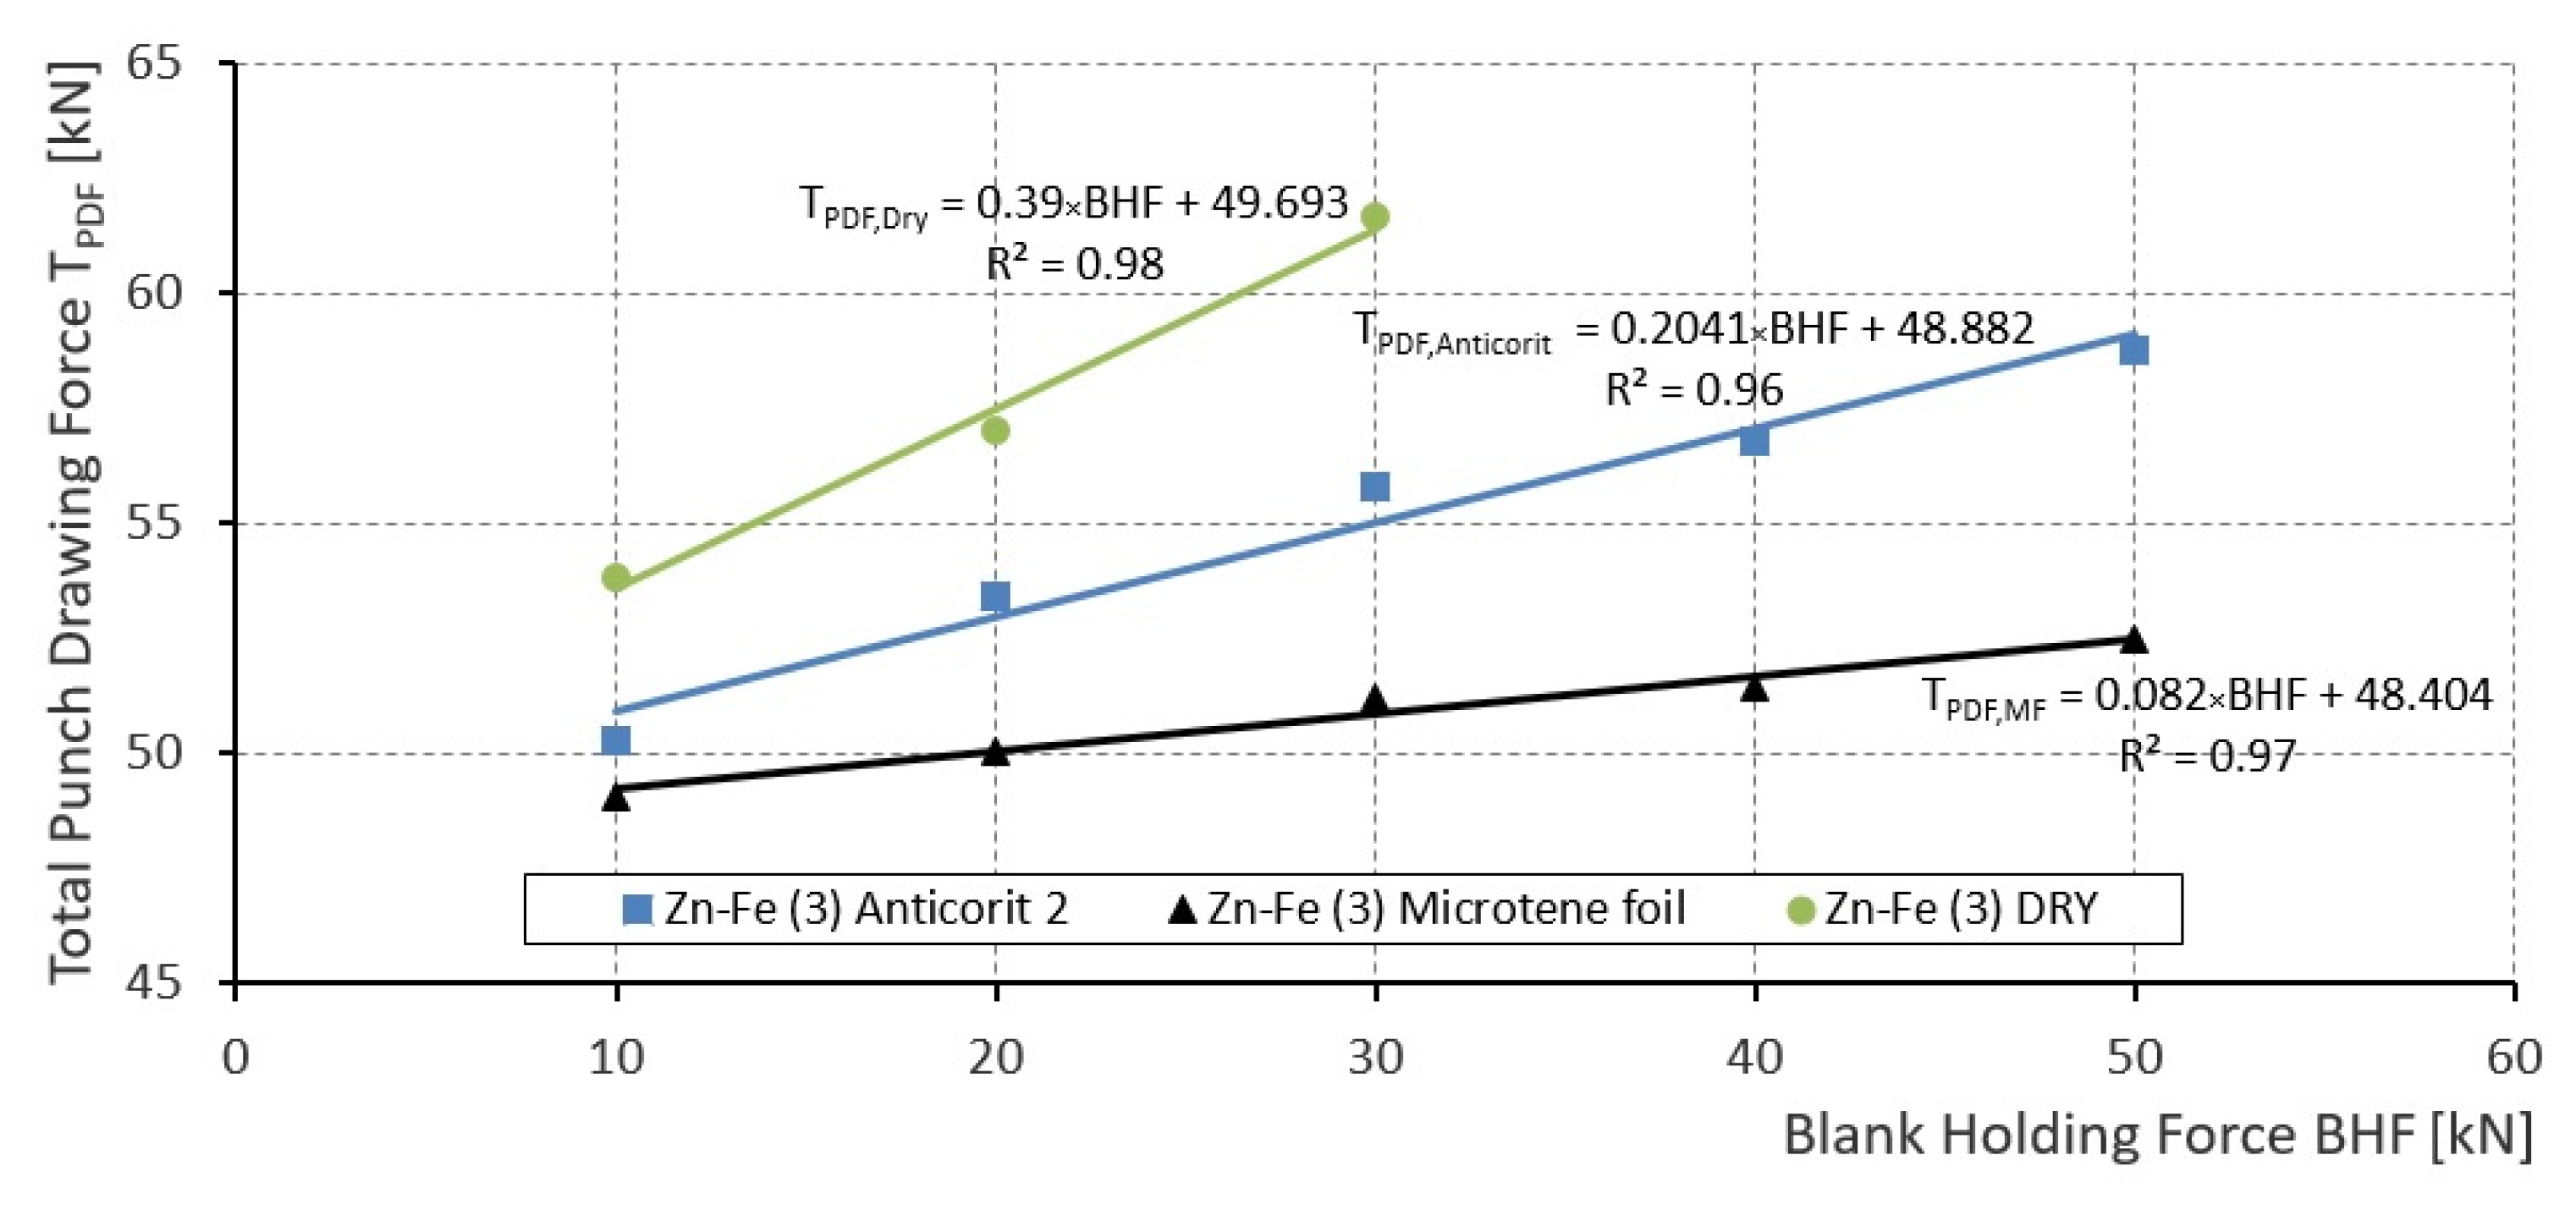
The obtained results indicate that with increasing BHF, TPDF differences were noted. The comparison of the effectiveness of the PL lubricant with respect to the microtene film shows that when using the Anticorit lubricant, the PLAntic. values ranged from 0.98 to 0.89 depending on BHF, and when drawing stamped parts without lubricant, PCDry values ranged from 0.92 to 0.83. TPDF was the least sensitive to the change in BHF when using microtene film and the most sensitive to the change in BHF with dry friction. Dependencies were constructed from the measured values TPDF and BHF—Figure 7, Figure 8 and Figure 9. In terms of Coulomb’s law of friction, CF is defined by the ratio of the frictional force to the holding force:
CF = FF BHF
Thus, the direction of dependence of TPDF on BHF expresses the value of the coefficient of friction CF—Figure 7, Figure 8 and Figure 9. However, in the deep drawing process in the area under the blank holder, contact occurs from both sides of the blank sheet metal, so that the CF was calculated as a half of the value of the line direction. At the drawing stage of DR = 130/77.2 = 1.684 stamped parts from the blank sheet metal with Zn-Fe (01) coating when using microtene film, the value was CFMF,1 = 0.036 ± 0.005; when using Anticorit lubricant, the value was CFAntic.,1 = 0.102 ± 0.005; and when drawing without using lubricant (dry friction) the value was CFDRY,1 = 0.215 ± 0.005. When drawing stamped parts from blank sheet metal with a Zn-Fe (2) coating using microtene film, the value was CFMF,2 = 0.041 ± 0.005; when using Anticorit lubricant, the value was CFAntic.,2 = 0.115 ± 0.005. When drawing without the use of lubricant (dry friction), the value was CFDRY,2 = 0.20 ± 0.005. When drawing stamped parts from blank sheet metal with a Zn-Fe (3) coating using microtene film, the value was CFMF,3 = 0.041 ± 0.005; when using Anticorit lubricant, the value of the coefficient of friction was CFAntic,3 = 0.102 ± 0.005; and when drawing without using lubricant (dry friction) the value was CFDRY,3 = 0.195 ± 0.005.
This comparison shows that during dry friction, the smallest value of CF was record-ed when drawing stamped parts from blank sheet metal with a Zn-Fe (1) coating and largest with a Zn-Fe (3) coating. However, it should be noted that the differences in the values of the CF friction coefficients when drawing stamped parts from blank sheet metal with Zn-Fe (2) and Zn-Fe (3) coatings were within the ±0.005 measurement variance. From the evaluation of the TPDF dependency guidelines on the BHF force, the coefficient of friction appears to be constant both in the region below the blank holder as well as on the drawing radius. In order to verify this tendency, an analytical relation of the dependence of CF was derived depending on the BHF force or blank holder pressure. The analytical expression of CF was based on the difference TPPF,i measured at BHFi and TPDF,ref measured at the reference value BHFref:
T PDF , i + 1 T PDF , ref = F ID + 2 · CF · BHF + F BRD e α CF BR F ID + 2 · CF · BHF ref + F BRD e α CF BR
and after modification we get:
e α CF BR = T PDF , i + 1 T PDF , ref 2 · CF BH · BHF BHF ref
If we start from the assumption that CF = CFBH = CFBR and the contact angle of the drawing edge is α ≈ 90°, then after adjusting Equation (20) we get:
CF · e CF π / 2 = T PDF , i + 1 T PDF , ref 2 · BHF i + 1 BHF ref
Expression CF · e CF π / 2   CF · 1 + CF π / 2 CF · 1 + 1.16 CF CF + 1.16 CF 2 was due to simplification of the calculation of the coefficient of friction described by the exponential regression model in the form CF · e CF π / 2   1.847CF1.177. Then, after substitution into Equation (20) and modification, we get:
CF = T PDF , i + 1 T PDF , ref 3.694 BHF i + 1 BHF ref 1.177
Using the relation (21), the values of the friction coefficients were calculated from the measured forces, which are listed in Table 5.
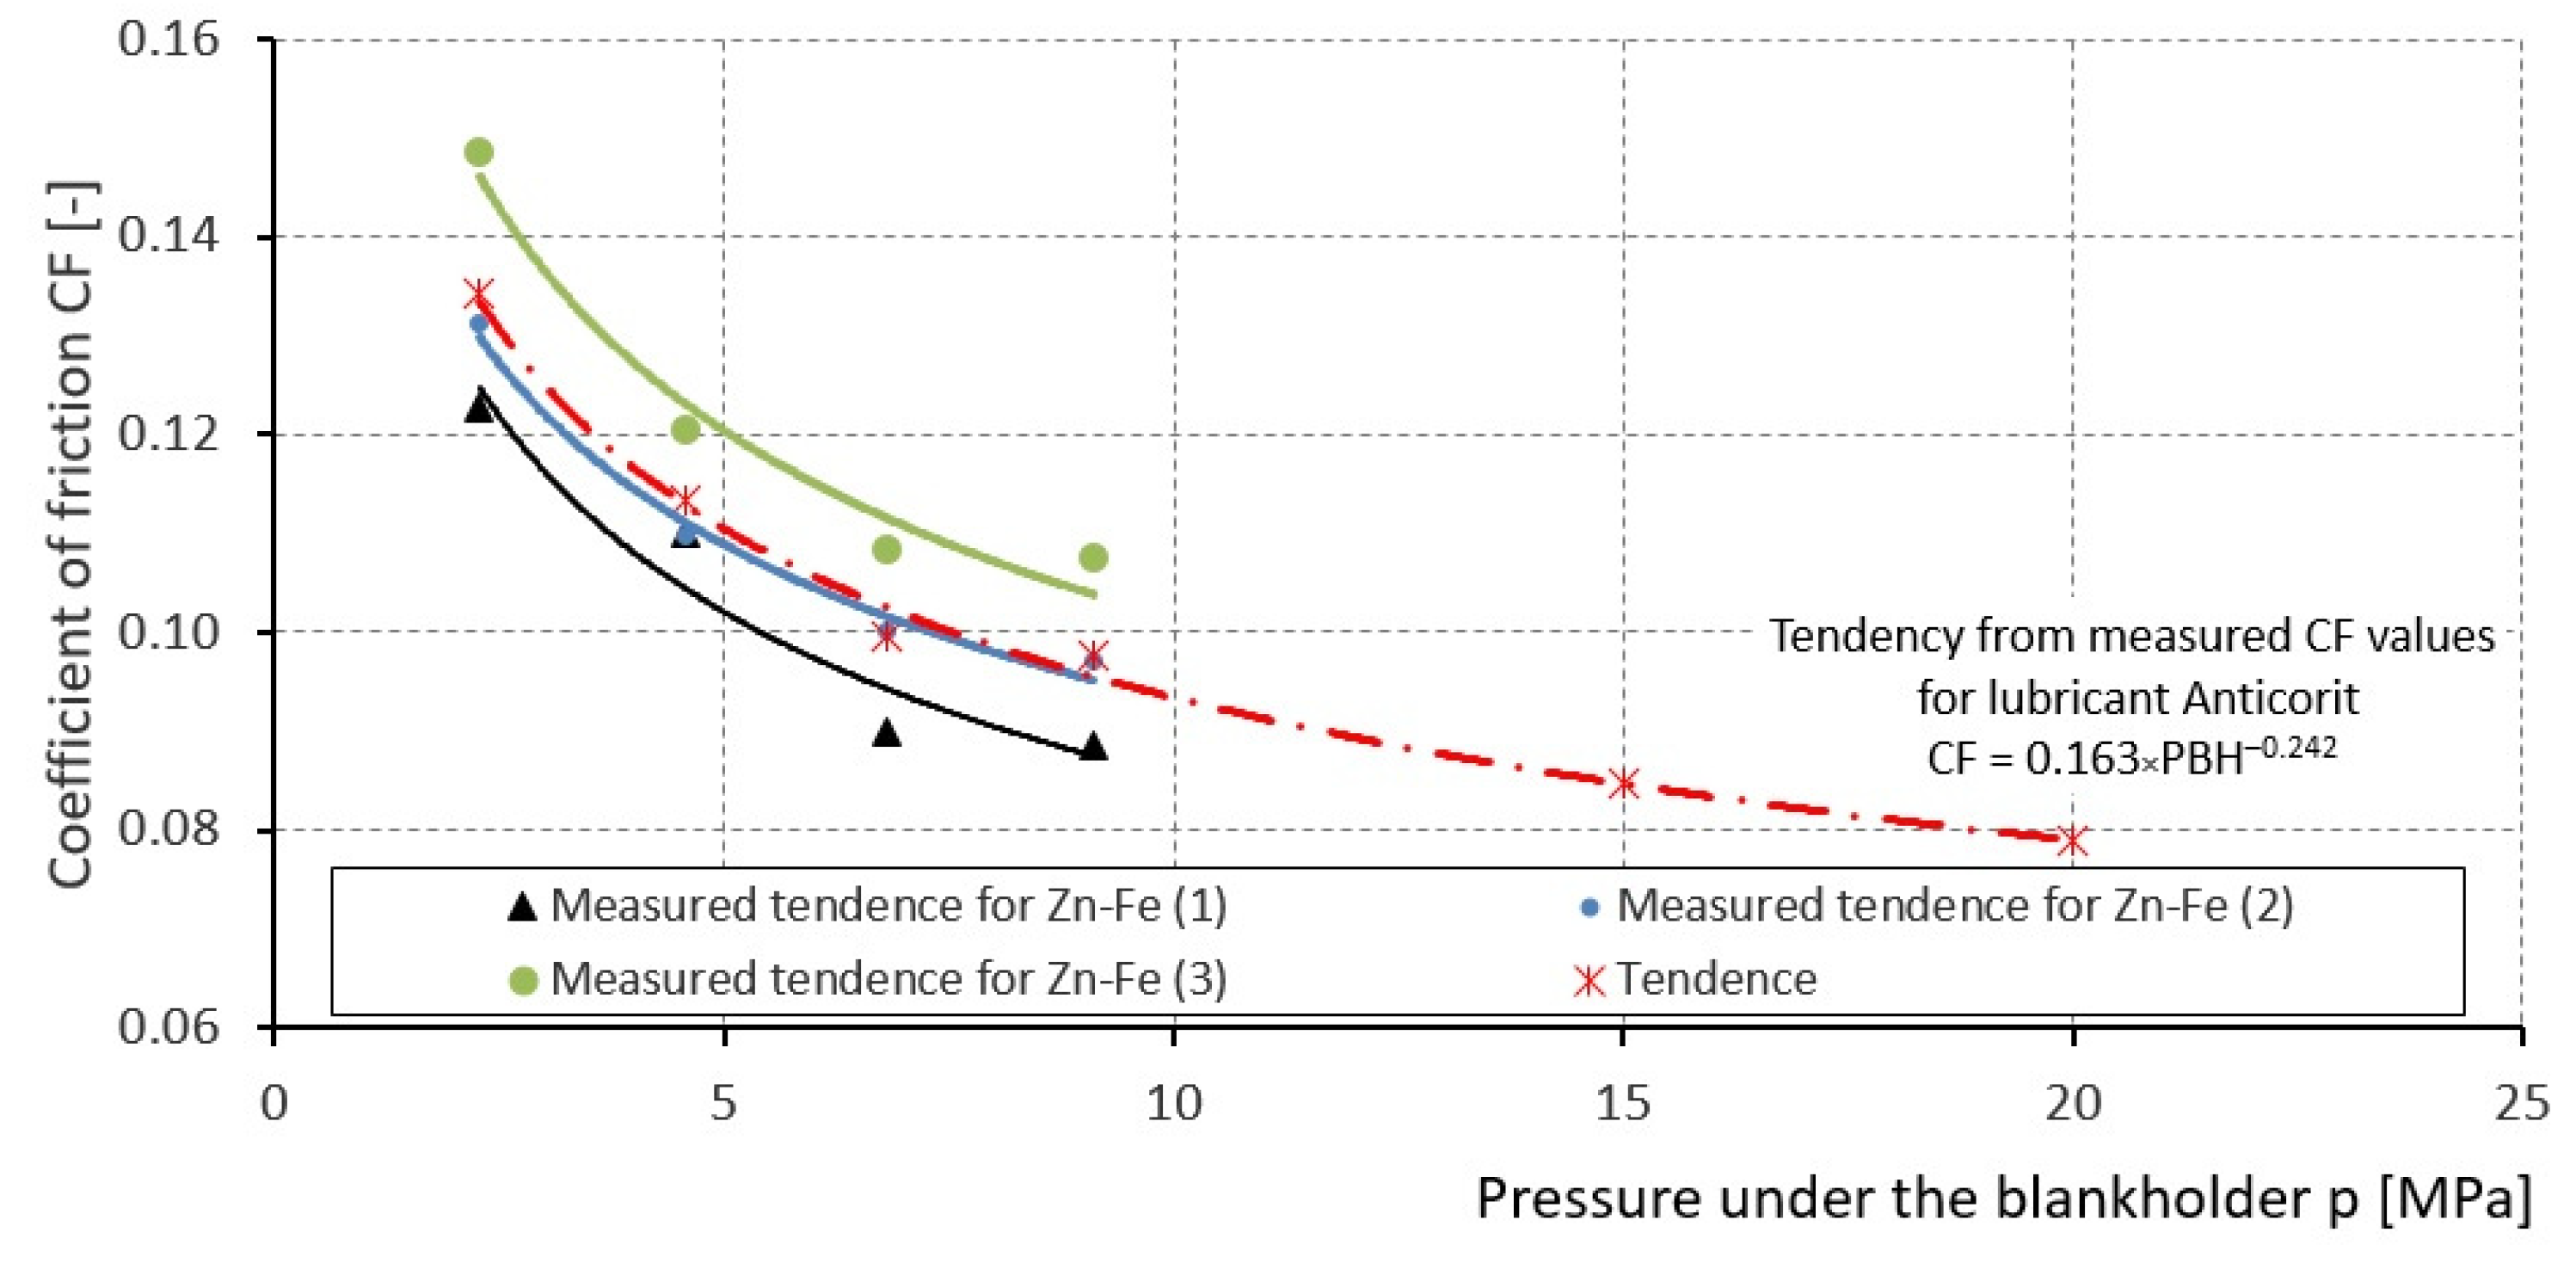
From the calculated friction coefficients (Table 5), it follows that (CFBH ≠ CFDR) changes depending on the used lubricant and BHF force or pressure on the contact surfaces. From the point of view of use in numerical simulations of cold forming processes, the dependences of CF on the blank holder pressure are more informative than on BHF. The pressure depends on contact force and surface area. The pressure under the blank holder was calculated from BHF and the contact area under the blank holder at the point of time when TPDF reached its maximum value. TPDF reached the maximum value at the moment when the flange diameter was 118 mm and the contact area was 4387 mm2. From the measured and calculated data, the dependence of CF on the pressure of the blank holder was projected—Figure 10.
The contact pressure on the die radius is several times larger than under the blank holder [6]. From the measured values, prediction relations were determined by regression analysis and, with their help, the tendency of CF at higher pressures was marked with a dot-dashed line in Figure 10.
Figure 10 shows that CF values increased slightly with increasing % of Fe content in the coating. This tendency is opposite to that reported by the authors of [50,51]. We assume that this may be related to the roughness Ra and the hardness of the coating. A glossier and harder surface with fewer peaks or pits cannot retain the required amount of lubricant on the contact surfaces [15].
Frictional force decreases with decreasing roughness value Ra, which was confirmed in [52]. Similar studies have been carried out [51,52,53,54]. The results of these authors show that with an appropriate choice of surface roughness Ra, it is possible to reduce friction, improve formability and wear resistance.
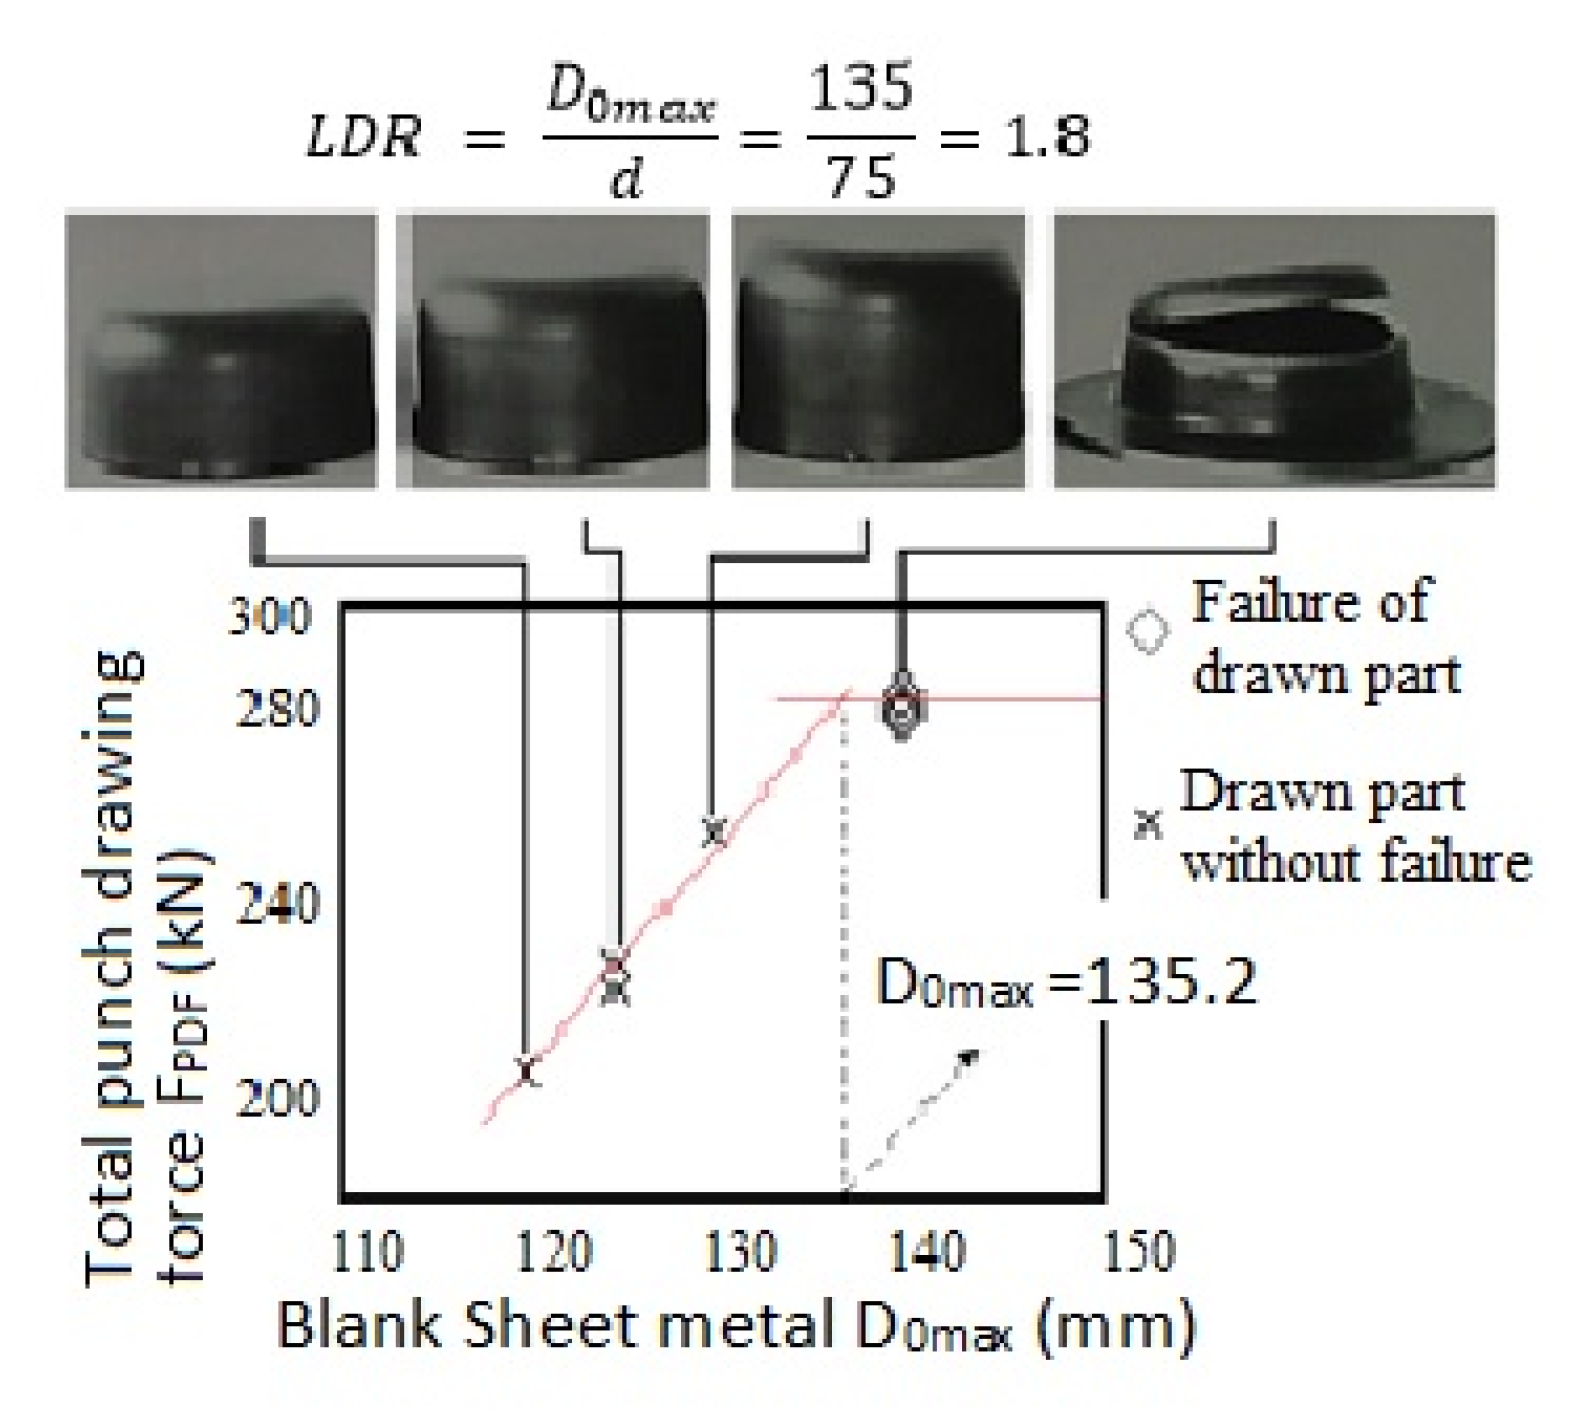
It follows from the relations (4) that, as a result of the increase in friction, the value of TPDF also increases and then the value of LDR decreases; that is, the formability of the material deteriorates—Figure 11 [16,18,19,20,21,22].
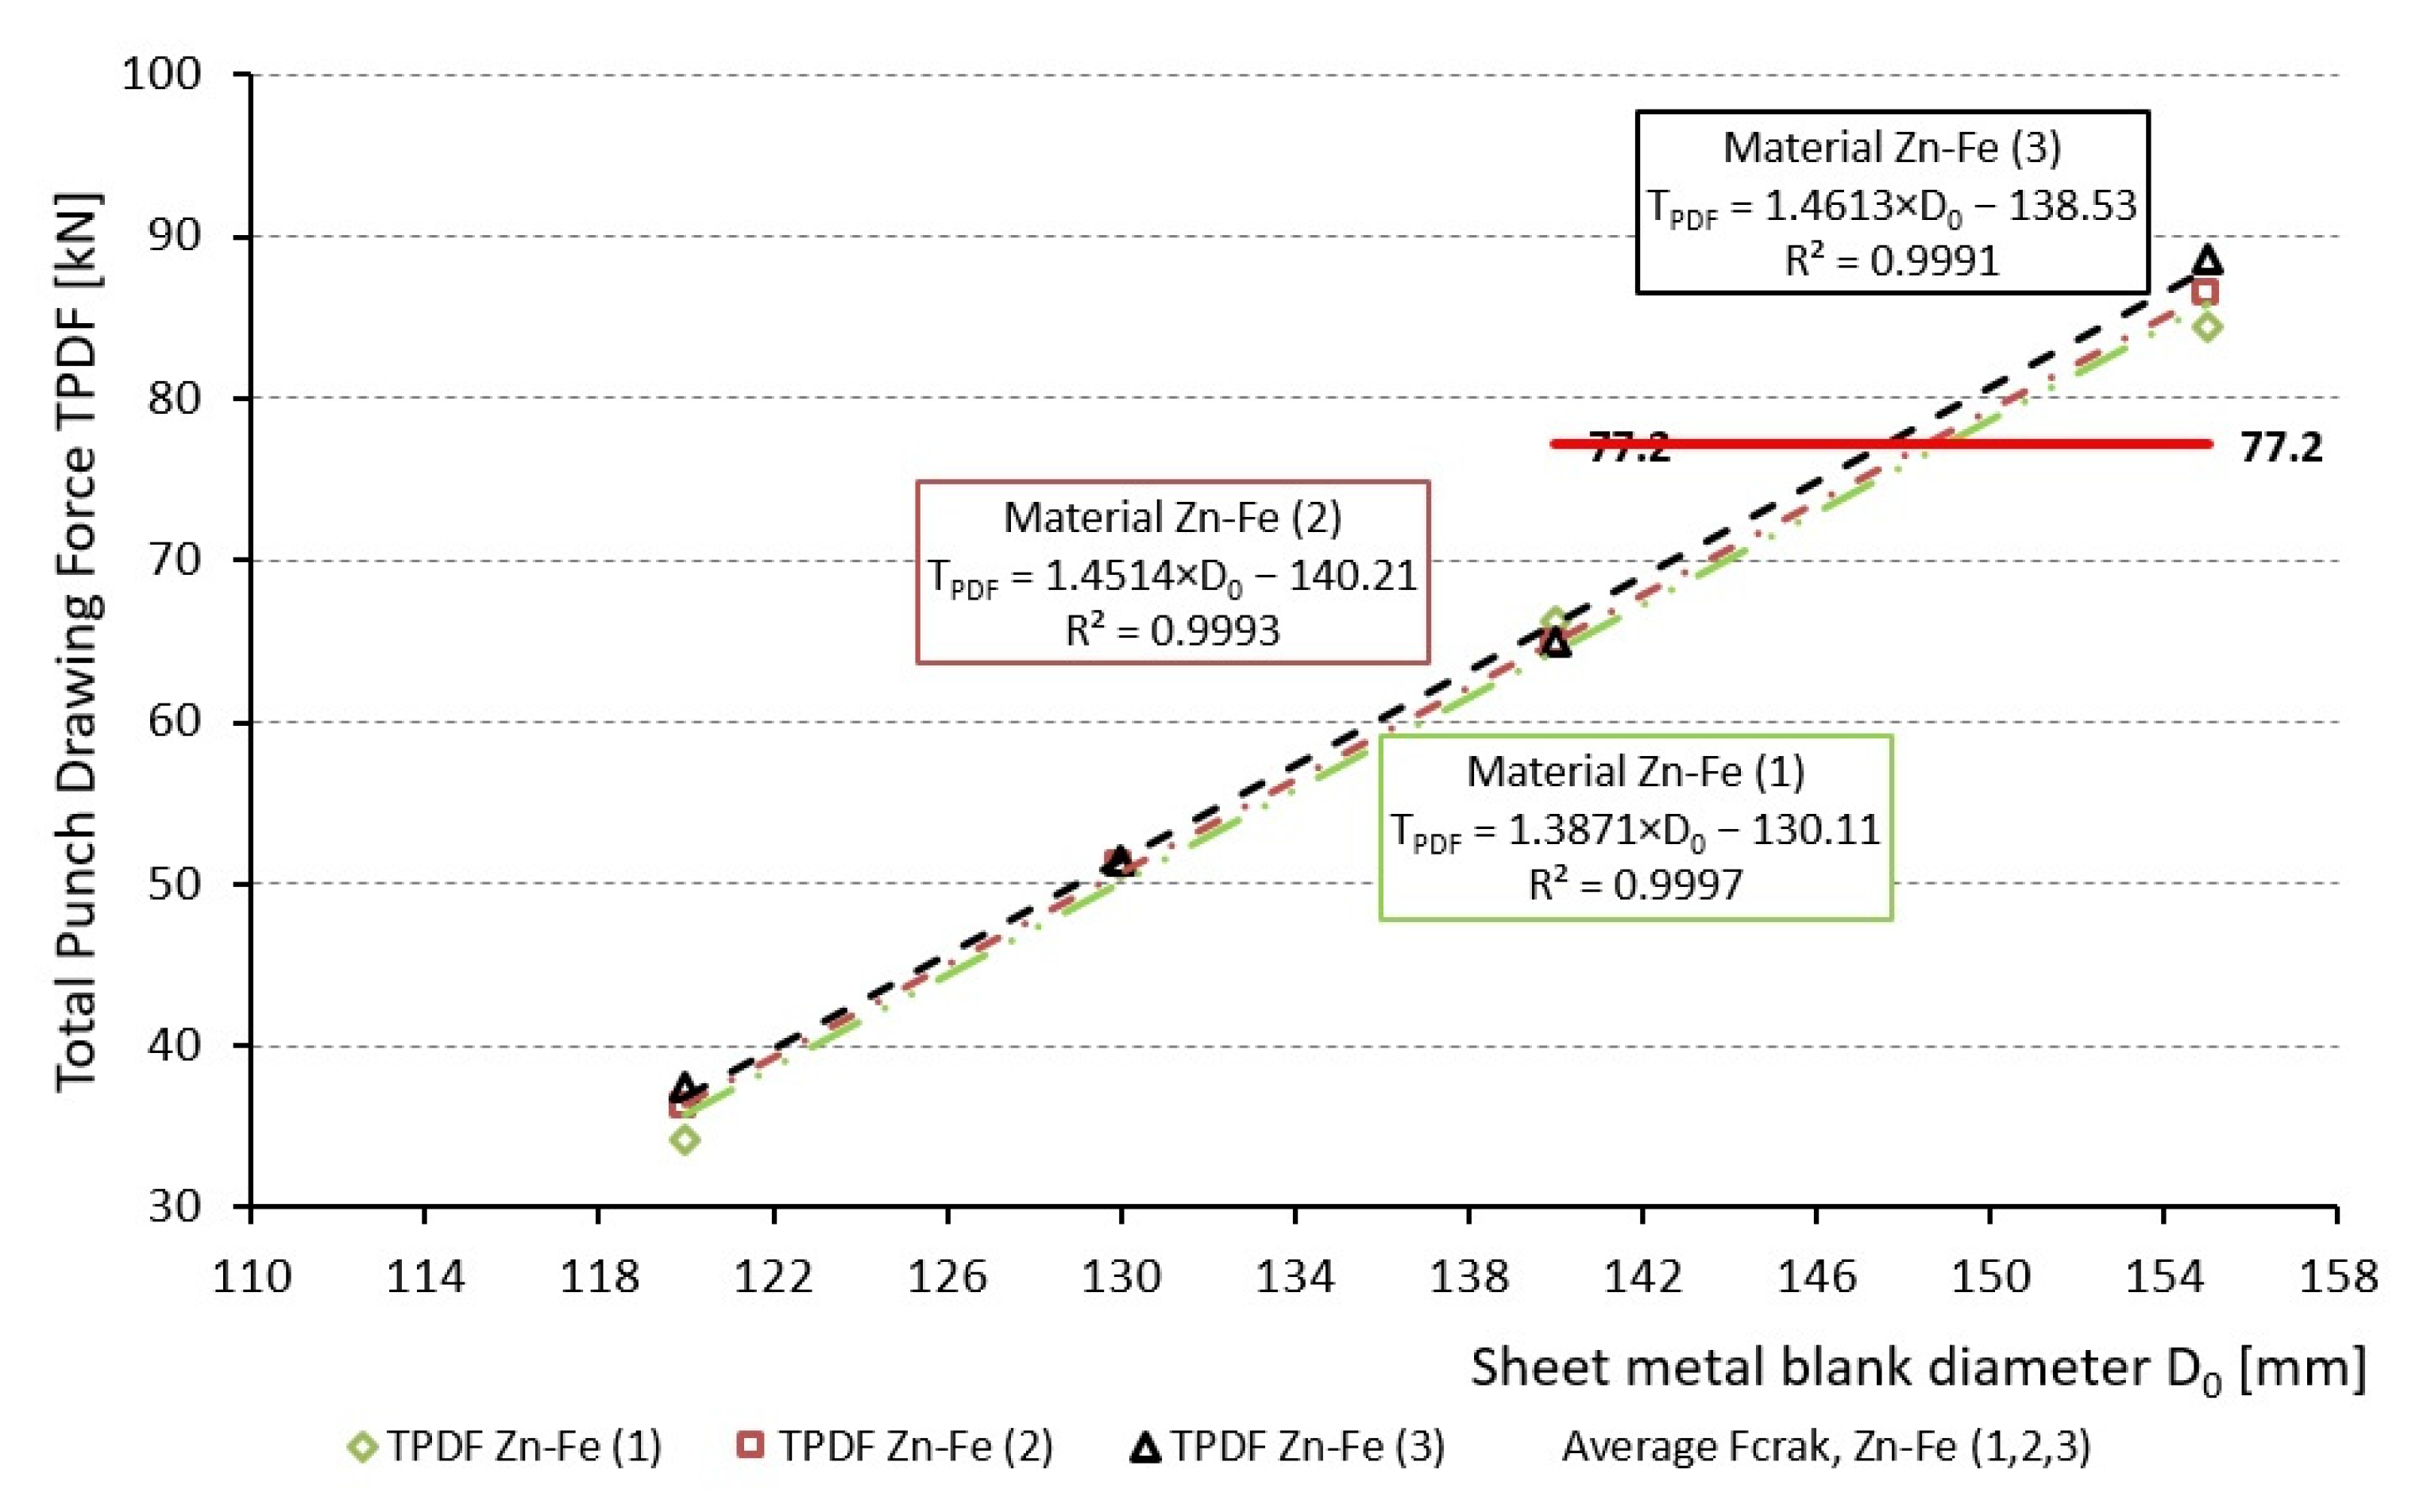
If a layer of lubricant is applied to the contact surface of the blank sheet metal and the surface of the tool, which continuously separates the contact surfaces, then a reduction in TPDF and an increase in the LDR value is achieved (improvement of material formability). At the same time, the created layer of lubricant also prevents the softer material (blank sheet metal) from sticking to the contact surfaces of the tool and, consequently, the formation of grooves on the surface of the stamped part. Dependencies were constructed from the measured TPDF for blank sheet metal diameters D0 120 mm, 130 mm and 140 mm—Figure 12. From condition (1), after substituting the measured Fcrack forces at which the stamped parts from metal sheets broke, and the regression equations for the TPDF required to pull out the stamped parts—Figure 7, Figure 8 and Figure 9—were derived the following relationships for individual materials:
Zn-Fe (1)
F crack T PDF = 1.3871     D   0 max 130.11 = > D 0 max = 77.2 + 130.11 1.3871 = 149   mm
then LDR after substituting into Equation (6) will be:
LDR = 149 77.2 = 1.93
Zn-Fe (2)
F crack T PDF = 1.4514     D   0 max 140.21 = > D 0 max = 77.2 + 140.21 1.4514 = 149   mm
then LDR after substituting into the Equation (6) will be:
LDR = 149 77.2 = 1.93
Zn-Fe (3)
F crack T PDF = 1.4613   D   0 max 138.53 = > D 0 max = 77.2 + 138.53 1.4613 = 147   mm
then LDR after substituting into the Equation (6) will be:
LDR = 147 77.2 = 1.904
The comparison of the calculated D0max and LDR shows that the material Zn-Fe (3) recorded lower values for the given characteristics of formability. However, it can be stated that no significant effects of the change in Fe content in the coating on formability were recorded.
The forming behavior of GA-coated steel sheets depends on the distribution of intermetallic phases in the coating: the ζ-phase is formed in the range from 6 to 6.5% Fe and the δ-phase is formed in the range from 7 to 10% Fe [55]. With increasing temperature or annealing cycle time increases, the iron content in the Zn-Fe coating and δ-phase and Г-phase are growing at the expense of ζ-phase. The presence of the ζ-phase means that the coating is unalloyed. The ζ-phase is a soft phase and occurs on the outer surface of the coating. During pressing, there is a risk that it will stick to the die and there will be an increase in friction on the contact surfaces between the tools and the die. A softer coating is stuck to the surface of the pressing tool, and during pressing grooves are subsequently formed on the surface of the drawn part. The ζ-phase is brittle and grows at the substrate–coating interface. Cracks in the Zn-Fe coating propagate through the Γ/δ interface. Therefore, it is necessary to use GA coating parameters as well, so that the proportion of ζ-phase and brittle Г-phase on the Zn-Fe coating surface is minimized.
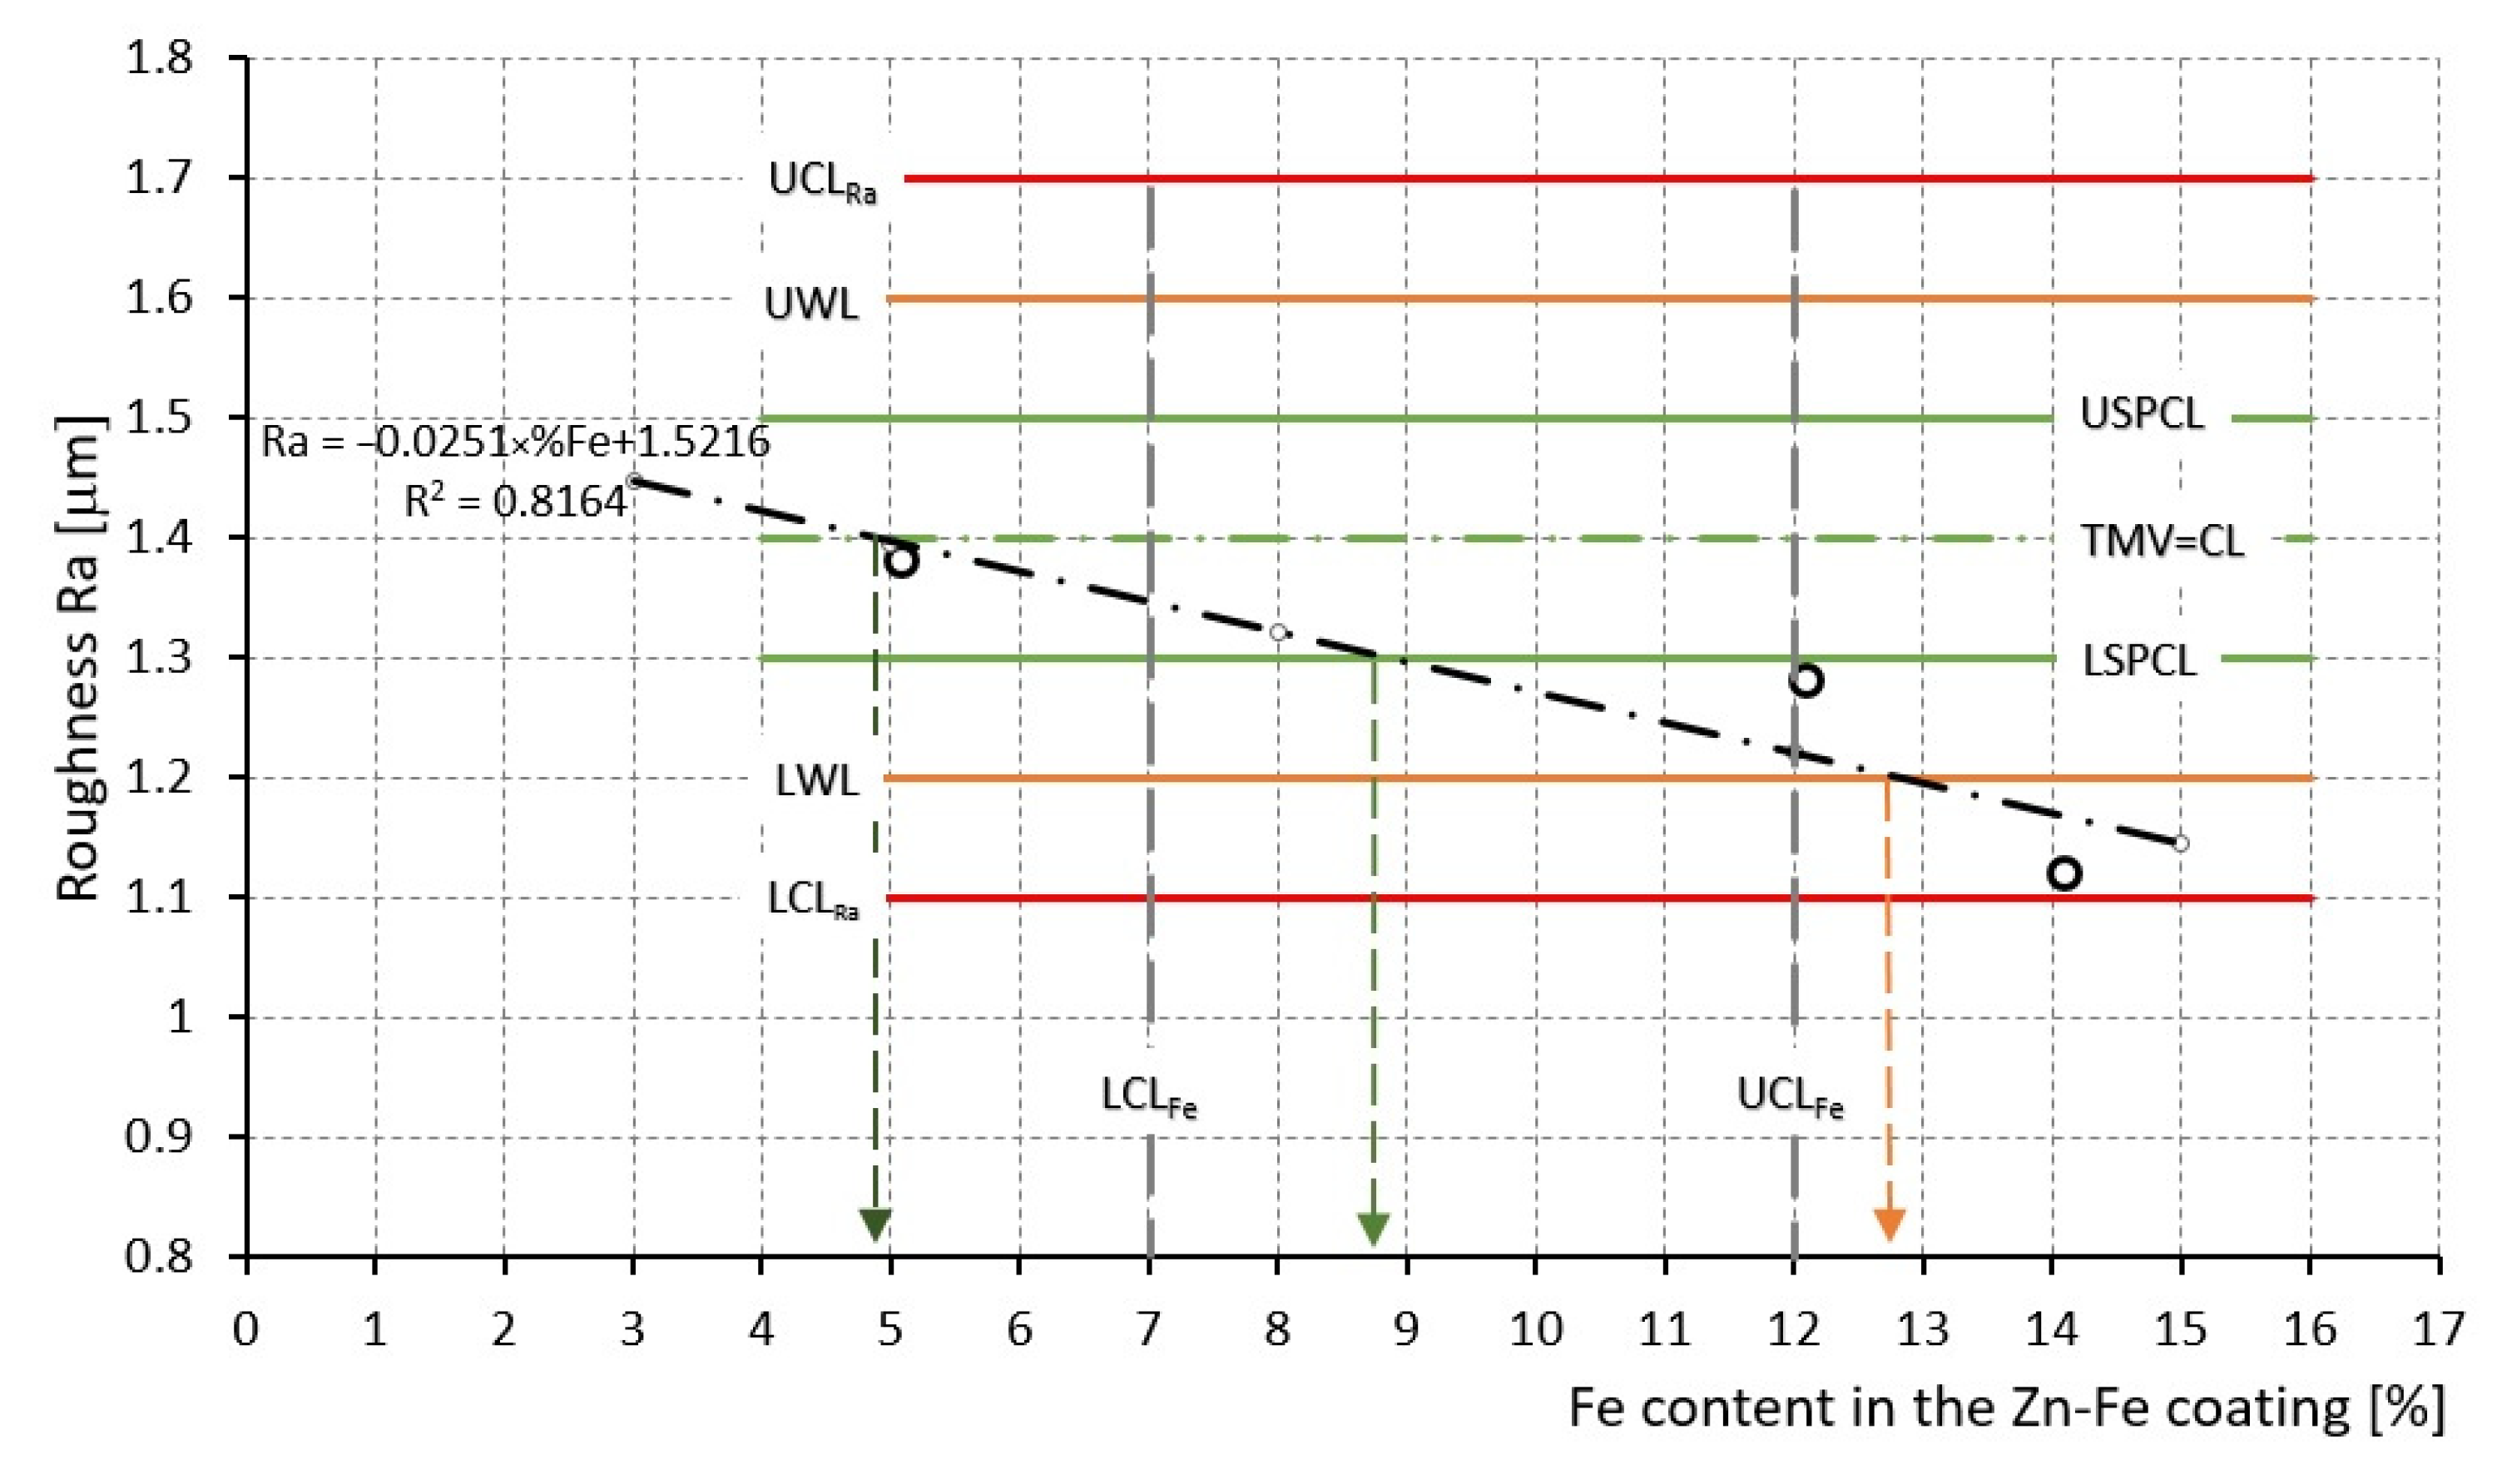
Figure 13 shows the dependence of the roughness Ra on % Fe content in the coating. The obtained results indicate that the technology used can produce a fully alloyed Zn-Fe coating with an Fe content in the range of 5.5 to 9% with a target roughness value of TMVRa 1.4–0.1 µm, and with Fe content in the range of 5.5 to 12.6% with a target value of TMVRa 1.4–0.2 µm. For alloyed coatings with an Fe content in the range of 5.5% to 12.6%, only very fine cracks were recorded, which should not significantly impair the corrosion resistance. For a coating with an Fe content greater than 14%, it is assumed that larger cracks will form in the coating. There may be peeling of the coating, unwanted exposure of the base material and deterioration of the corrosion resistance of the Fe-Zn coating. The amount of iron on the surface and the distribution in the coating is a function of the galvanic annealing parameters (mainly the chemical composition of the bath and the duration of the galvanic annealing at a given temperature). The iron content of the coating affects the hardness of the coating and consequently the interaction with lubricants and contact surfaces of the tool. Hard GA coatings have greater tendency to crush when in contact with tool surfaces, especially when moving over the edge of the die.

4. Conclusions

This paper presents the possibilities of improving the formability of coated steel sheets based on Fe-Zn with a content of 5.5%, 12.6% and 14.4% Fe in the coating. If Fe content in the Zn-Fe coating lies within 7% to 12%, δ phase with very fine cracks appeared primarily, which should not significantly worsen the corrosion resistance. The applied modes for the Zn-Fe (1) coating are capable of achieving roughness values from Ra 1.2 to 1.4 µm and Cpk,Pc values were greater than 1.33. The increased content of Fe in the Fe-Zn coating did not significantly affect the change in TPDF or the performance indicators of PL lubricants. By re-alloying the coating, its adhesion to the base material (substrate) worsens. The results obtained indicate that it is not appropriate to evaluate CF by regression analysis from the TPDF dependence directive at BHF in terms of Coulomb’s law. The derived analytical relationship allows CF to be predicted based on the cup test results as a function of the contact pressure when using a lubricant. CF determined using a derived relationship indicates that the CF is not constant but varies depending on the contact conditions at the interface of the tool and blank sheet metal. For stamping operations, acceptable values are CF ≈ 0.1. It should be noted that GA coatings are sensitive to the thickness of the lubricating film; therefore, the lubricant with a film thickness of 1.5 ± 0.3 g/m2 must be distributed as evenly as possible over the entire surface area of the sheet metal. In the press shops of the automotive industry, film with a thickness of 0.6–0.8 g/m2 is applied [56,57]. In subsequent research, attention will be focused on the texture of the sheet metal surface, and verification of applied friction models in numerical simulation programs for cold sheet metal forming processes.

Author Contributions

Conceptualization, E.E.; methodology, E.E.; software, M.T.; validation, E.E.; formal analysis, E.E.; investigation, E.E. and M.T.; resources, E.E.; data curation, E.E.; writing—original draft preparation, E.E.; writing—review and editing, E.E. and M.T.; visualization, E.E. and M.T.; project administration, E.E. All authors have read and agreed to the published version of the manuscript.

Funding

This research was funded by VEGA grant number 2/0800/19 “Prediction of weldability and formability for laser-welded tailored blanks made of combined high-strength steels with CAE support”.

Data Availability Statement

All data included in the article were reached by authors during the research. No public data and archives were used.

Acknowledgments

Authors thanks to the Scientific Grant Agency of the Ministry of Education of the Slovak Republic for supporting the research under the project VEGA 2/0800/19 “Prediction of weldability and formability for laser-welded tailored blanks made of combined high-strength steels with CAE support”.

Conflicts of Interest

The authors declare no conflict of interest.

References

  1. Akafuah, N.K.; Poozesh, S.; Salaimeh, A.; Gabriela Patrick, P.; Lawler, K.; Saito, K. Evolution of the Automotive Body Coating Process—A Review. Coatinngs 2016, 6, 24. [Google Scholar] [CrossRef] [Green Version]
  2. Evin, E.; Kollárová, M. The Tribology Properties of Zinc Coated Steel Sheets for Auto Body. Chem. Listy 2011, 105, 465–467. [Google Scholar]
  3. Graban, J.; Kohúteková, V.; Hollý, F.; Tarhaničová, R. Evaluation of Galvanized Sheets with Thin Organic Coating with Antifingerprint properties. In Proceedings of the 17th International Conference on Metallurgy and Materials Proceedings—METAL 2008, Hradec nad Moravicí, Czech Republic, 24–26 May 2008. [Google Scholar]
  4. Kolnerová, M.; Solfronk, P. Morphology of sheet metal of zinc coated sheet metal surface used in car industry. In Proceedings of the 10th International Metallurgical Conference Proceedings—METAL 2001, Ostrava, Czech Republic, 15–17 May 2001. [Google Scholar]
  5. Evin, E.; Tomáš, M.; Graban, J.; Kundracík, V.; Hollý, F.; Toth, M. Analysis of coated steel sheets resistance to corrosion after plastic deformation. MM Sci. J. 2016, 5, 1415–1419. [Google Scholar] [CrossRef]
  6. Evin, E.; Tomáš, M.; Kollárová, M.; Antoszewski, B. Some Tribological aspects of Fe-Zn Coated steel sheets at Stamping Processes. Acta Metall. Slovaca 2014, 2, 189–199. [Google Scholar] [CrossRef] [Green Version]
  7. Tanaka, S.; Honda, K.; Takahashi, A.; Morimoto, Y.; Kurosaki, M.; Shindo, H.; Nishimura, K.; Sugiyama, M. The performance of Zn-Al-Mg-Si hot-dip galvanized steel sheet. In Proceedings of the 5th International Conference on Zinc and Zinc Alloy Coated Steel, GALVATECH, Brussels, Belgium, 26–28 June 2001; pp. 153–160. [Google Scholar]
  8. Tsujimura, T.; Komatsu, A.; Andoh, A. Influence of Mg content in coating layer and coating structure on corrosion resistance of hot-dip Zn-Al-Mg alloy coated steel sheet. In Proceedings of the 5th International Conference on Zinc and Zinc Alloy Coated Steel, GALVATECH, Brussels, Belgium, 26–28 June 2001; pp. 145–152. [Google Scholar]
  9. Pradhan, D.; Kumar, A.; Pankaj Raju, G.; Manna, M.; Dutta, M.; Venugopalan, T. Fe-Zn Alloy Coating on Galvannealed (GA) Steel Sheet to Improve Product Qualities. J. Mater. Eng. Perform. 2014, 23, 3336–3346. [Google Scholar] [CrossRef]
  10. Miranda, W.J.; Carneiro, J.R.G.; Brito, P.P. Formability evaluation of Galvannealed (GA), Hot-Dip Pure ZN Galvanized (GI), Electrogalvanized (EG) and Electrgalvanized Prephosphated (EGP) Intersticial Free Steelaluation. In Proceedings of the IMECE2005 2005 ASME International Mechanical Engineering Congress and Exposition, Orlando, FL, USA, 5–11 November 2005. [Google Scholar]
  11. Sigvant, M.; Pilthammar, J.; Hol, J.; Wiebenga, J.H.; Chezan, T.; Carleer, B.; van den Boogaard, A.H. Friction in sheet metal forming influence of surface roughness and strain rate on sheet metal forming simulation results. Procedia Manuf. 2019, 29, 512–519. [Google Scholar] [CrossRef]
  12. Ajayi, O.O.; Erck, R.A.; Lorenzo-Martin, C.; Fenske, G.R. Frictional anisotropy under boundary lubrication: Effect of surface texture. Wear 2009, 267, 1214–1219. [Google Scholar] [CrossRef]
  13. Hrivňák, A.; Evin, E. Formability of Steel Sheets, 1st ed.; Elfa: Košice, Slovakia, 2004. [Google Scholar]
  14. Gorbunov, A.V.; Belov, V.K.; Begletsov, D.O. Texturing of Rollers for the Production of Auto-Industry Sheet. Steel Transl. 2009, 39, 696–699. [Google Scholar] [CrossRef]
  15. Çolak, B.; Basglu, F.; Kurgan, N. Texturing Methods for Cold Mill Work Rolls. In Proceedings of the UDCS’19 Fourth International Iron and Steel Symposium, Karabuk, Turkey, 4–6 April 2019. [Google Scholar]
  16. Müll, K.; Routschek, T. Topocrom Texturing: Technology and Advantages. Available online: http://www.topocrom.com/content/pdf/Baosteel_BAC_Topocrom.pdf (accessed on 27 November 2019).
  17. Evin, E.; Tomáš, M.; Kmec, J. Optimization of Electro-Discharge Texturing Parameters for Steel Sheets’ Finishing Rollers. Materials 2020, 13, 1223. [Google Scholar] [CrossRef] [Green Version]
  18. Manabe, K.; Soeda, K.; Shibata, A. Effects of Variable Punch Speed and Blank Holder Force in Warm Superplastic Deep Drawing Process. Metals 2021, 11, 493. [Google Scholar] [CrossRef]
  19. Lange, K. Lehrbuch der Umformtechnik: Band 3: Blechumformung; Springer: Berlin/Heidelberg, Germany, 1975. [Google Scholar]
  20. Tigrinho, L.M.V.; Santos, R.A.; Filho, A.A.C.; Marcondes, P.V.P. Experimental Investigation on the influence of the lubricant Type in the Punch Stretching of Extra Deep-Drawing Steel. J. Braz. Soc. Mech. Sci. Eng. 2008, 30, 29–294. [Google Scholar] [CrossRef]
  21. Zein, H.; Irfan, O.M. Optimization and Mapping of the Deep Drawing Force Considering Friction Combination. Appl. Sci. 2021, 11, 9235. [Google Scholar] [CrossRef]
  22. Evin, E.; Ábel, M.; Vinaš, J.; Tkáčová, J.; Antoszewski, B. Tribological characteristics of stamping dies with coatings. Mechanika 2013, 2, 129–137. [Google Scholar] [CrossRef]
  23. Choudhury, I.A.; Lai, O.H.; Wong, L.T. PAM-STAP in the simulation of stamping process of an automotive component. Simul. Model. Pract. Theory 2006, 14, 71–81. [Google Scholar] [CrossRef]
  24. Adnan, I.O. Zaid. Effect of Different Lubricants on Deep Drawing of Galvanized Steel. Int. J. Sci. Eng. Res. 2017, 8, 1584. [Google Scholar]
  25. Mohan Krishna, K.; Kumara Swamy, M. Prediction of Draw Ratio in Deep Drawing through Software Simulations. Int. Refereed J. Eng. Sci. (IRJES) 2014, 3, 24–29. [Google Scholar]
  26. Hou, J.; Wang, B.; Xu, D.; Cui, L.; Sun, J. Effect of Surfactants on the Corrosion Protectability of Calcium Phosphate Conversion Coatings on Duplex StructuredMg-8Li (in wt.%) Alloy. Coatings 2022, 12, 1182. [Google Scholar] [CrossRef]
  27. Karupannasamy, D.K.; Hol, J.; de Rooij, M.B.; Meinders, T.; Schipper, D.J. Modelling mixed lubrication for deep drawing processes. Wear 2012, 294–295, 296–304. [Google Scholar] [CrossRef] [Green Version]
  28. Roizarda, X.; Pothiera, J.M.; Hih, J.Y.; Monteila, G. Experimental device for tribological measurement aspects in deep drawing process. J. Mater. Process. Technol. 2009, 209, 1220–1230. [Google Scholar] [CrossRef]
  29. Shisode, M.; Hazrati, J.; Mishra, T.; de Rooij, M.; ten Horn, C.; van Beeck, J.; van den Boogaard, T. Modeling boundary friction of coated sheets in sheet metal forming. Tribol. Int. 2021, 153, 106554. [Google Scholar] [CrossRef]
  30. Wu, W.; Zhao, C.; Cao, M. Effect of ultrasonic and low frequency vibrations on friction coefficient at die radius in deep drawing process. J. Manuf. Process. 2021, 71, 56–69. [Google Scholar] [CrossRef]
  31. Xia, J.; Zhao, J.; Dou, S.; Shen, X. A Novel Method for Friction Coefficient Calculation in Metal Sheet Forming of Axis-Symmetric Deep Drawing Parts. Symmetry 2022, 14, 414. [Google Scholar] [CrossRef]
  32. Trzepieciński, T. Polynomial Multiple Regression Analysis of the Lubrication Effectiveness of Deep Drawing Quality Steel Sheets by Eco-Friendly Vegetable Oils. Materials 2022, 15, 1151. [Google Scholar] [CrossRef] [PubMed]
  33. Trzepiecinski, T.; Lemu, G.H. Recent Developments and Trends in the Friction Testing for Conventional Sheet Metal Forming and Incremental Sheet Forming. Metals 2020, 10, 47. [Google Scholar] [CrossRef] [Green Version]
  34. Bay, N.; Olsson, D.D.; Andreasen, J.O. Lubricant test methods for sheet metal forming. Tribol. Int. 2008, 41, 844–853. [Google Scholar] [CrossRef]
  35. Folle, L.; Schaeffer, L. New Proposal to Calculate the Friction in Sheet Metal Forming Through Bending Under Tension Test. Mater. Res. 2019, 22, 1–11. [Google Scholar] [CrossRef]
  36. Pöhlandt, K. Materials Testing for the Metal Forming Industry; Springer Science & Business Media: Berlin/Heidelberg, Germany, 2012. [Google Scholar]
  37. Rahul, K.; Verma, R.K.; Chandra, S. An improved model for predicting limiting drawing ratio. J. Mater. Process. Technol. 2006, 172, 218–224. [Google Scholar]
  38. Evin, E.; Jakubeczyová, D.; Kollárová, M.; Hrabčáková, L. The influence of Fe-Zn coatings phase composition on friction characteristics under forming. In Proceedings of the 17th International Conference on Metallurgy and Materials Proceedings—METAL 2008, Hradec nad Moravicí, Czech Republic, 24–26 May 2008. [Google Scholar]
  39. Čada, R. Evaluation of Strain and Material Flow in Sheet-Metal Forming. J. Mater. Process. Technol. 2003, 138, 170–175. [Google Scholar] [CrossRef]
  40. Novák, V.; Valeš, M.; Tatíček, T.; Šanovec, J.; Chrášťanský, L. Analysis of forming capacity of HCT490X and DX57D depending on strain rate. IOP Conf. Ser. Mater. Sci. Eng. 2021, 1178, 012045. [Google Scholar] [CrossRef]
  41. Mulidrán, P.; Spišák, E.; Tomáš, M.; Slota, J.; Majerníková, J. Numerical Prediction and Reduction of Hat-Shaped Part Springback Made of Dual-Phase AHSS Steel. Metals 2020, 10, 1119. [Google Scholar] [CrossRef]
  42. Schrek, A.; Gajdošová, V.; Švec, P. Deformation Properties of Tailor Welded Blank Made of Dual Phase Steels. Acta Mech. Autom. 2016, 10, 38–42. [Google Scholar] [CrossRef] [Green Version]
  43. Rusz, S.; Hilšer, O.; Ochodek, V.; Čada, R.; Švec, J.; Szkandera, P. Influence of SPD Process on Low-Carbon Steel Mechanical Properties. Mod. Mach. Sci. J. 2019, 12, 2910–2914. [Google Scholar] [CrossRef] [Green Version]
  44. Gupta, A.K.; Kumar, D.R. Formability of galvanized interstitial-free steel sheets. J. Mater. Process. Technol. 2006, 172, 225–237. [Google Scholar] [CrossRef]
  45. Dallin, G.W. Galvanizing—2014: Continuous Hot-Dip Galvanizing—Process and Products; Galvinfo center—A Program of the International Zinc Association; 2014. Available online: https://www.galvinfo.com/wp-content/uploads/sites/8/2017/05/Galvanizing-2014.pdf (accessed on 3 November 2022).
  46. Teixeira, E.L.S.; Dias, T.S.; Andrade, M.O.; Oliveira, A.B.S. Statistical process control application in automotive industry. In Proceedings of the 24th ABCM International Congress of Mechanical Engineering, Curitiba, Brazil, 3–8 December 2017. [Google Scholar]
  47. Godina, R.; Matias, J.C.O.; Azevedo, S.G. Quality Improvement With Statistical Process Control in the Automotive Industry. Int. J. Ind. Eng. Manag. (IJIEM) 2016, 7, 1–8. [Google Scholar]
  48. Verma, V.; Vinay Sharma, V.; Badar, M.A. Improving Sigma Level of Galvanization Process by Zinc Over-Coating Reduction Using an Integrated Six Sigma and Design-of-Experiments Approach. Arab. J. Acience Eng. 2022, 47, 8535–8549. [Google Scholar] [CrossRef]
  49. Li, G.; Long, X.; Yang, P.; Liang, Z. Advance on friction of stamping forming. Int. J. Adv. Manuf. Technol. 2018, 96, 21–38. [Google Scholar] [CrossRef]
  50. Garza, L.G.; Van Tyne, C.J. Friction and formability of galvannealed interstitial free sheet steel. J. Mater. Process. Technol. 2007, 187–188, 164–168. [Google Scholar] [CrossRef]
  51. Cristino, V.A.M.; Rosa, P.A.R.; Martins, P.A.F. Surface roughness and material strength of tribo-pairs in ring compression tests. Tribol. Int. 2011, 44, 134–143. [Google Scholar] [CrossRef]
  52. Feng, D.; Shen, M.X.; Peng, X.D.; Meng, X.K. Surface roughness effect on the friction and wear behaviour of acrylonitrile-butadiene rubber (NBR) under oil lubrication. Tribol. Lett. 2017, 65, 10. [Google Scholar] [CrossRef]
  53. Podgornik, B.; Jerina, J. Surface topography effect on galling resistance of coated and uncoated tool steel. Surf. Coat. Technol. 2012, 206, 2792–2800. [Google Scholar] [CrossRef]
  54. Leu, D.K. Modeling of surface roughness effect on dry contact friction in metal forming. Int. J. Adv. Manuf. Technol. 2011, 57, 575–584. [Google Scholar] [CrossRef]
  55. Sriram, S.; Krishnardula, V.; Hahn, H. Influence of Delta Phase Morphology in Galvannealed Coated Steels on Formability. IOP Conf. Ser. Mater. Sci. Eng. 2018, 418, 012094. [Google Scholar] [CrossRef]
  56. Dalton, G.M.; Zaccone, D.C. Oil Migration on Sheet Steels and the Effect on Performance in Metal Stamping. J. Mater. Manuf. 1999, 108, 661–666. [Google Scholar]
  57. Booser, E.R. Tribology Data Handbook, 1st ed.; CRC Press: Boca Raton, FL, USA, 1997. [Google Scholar]
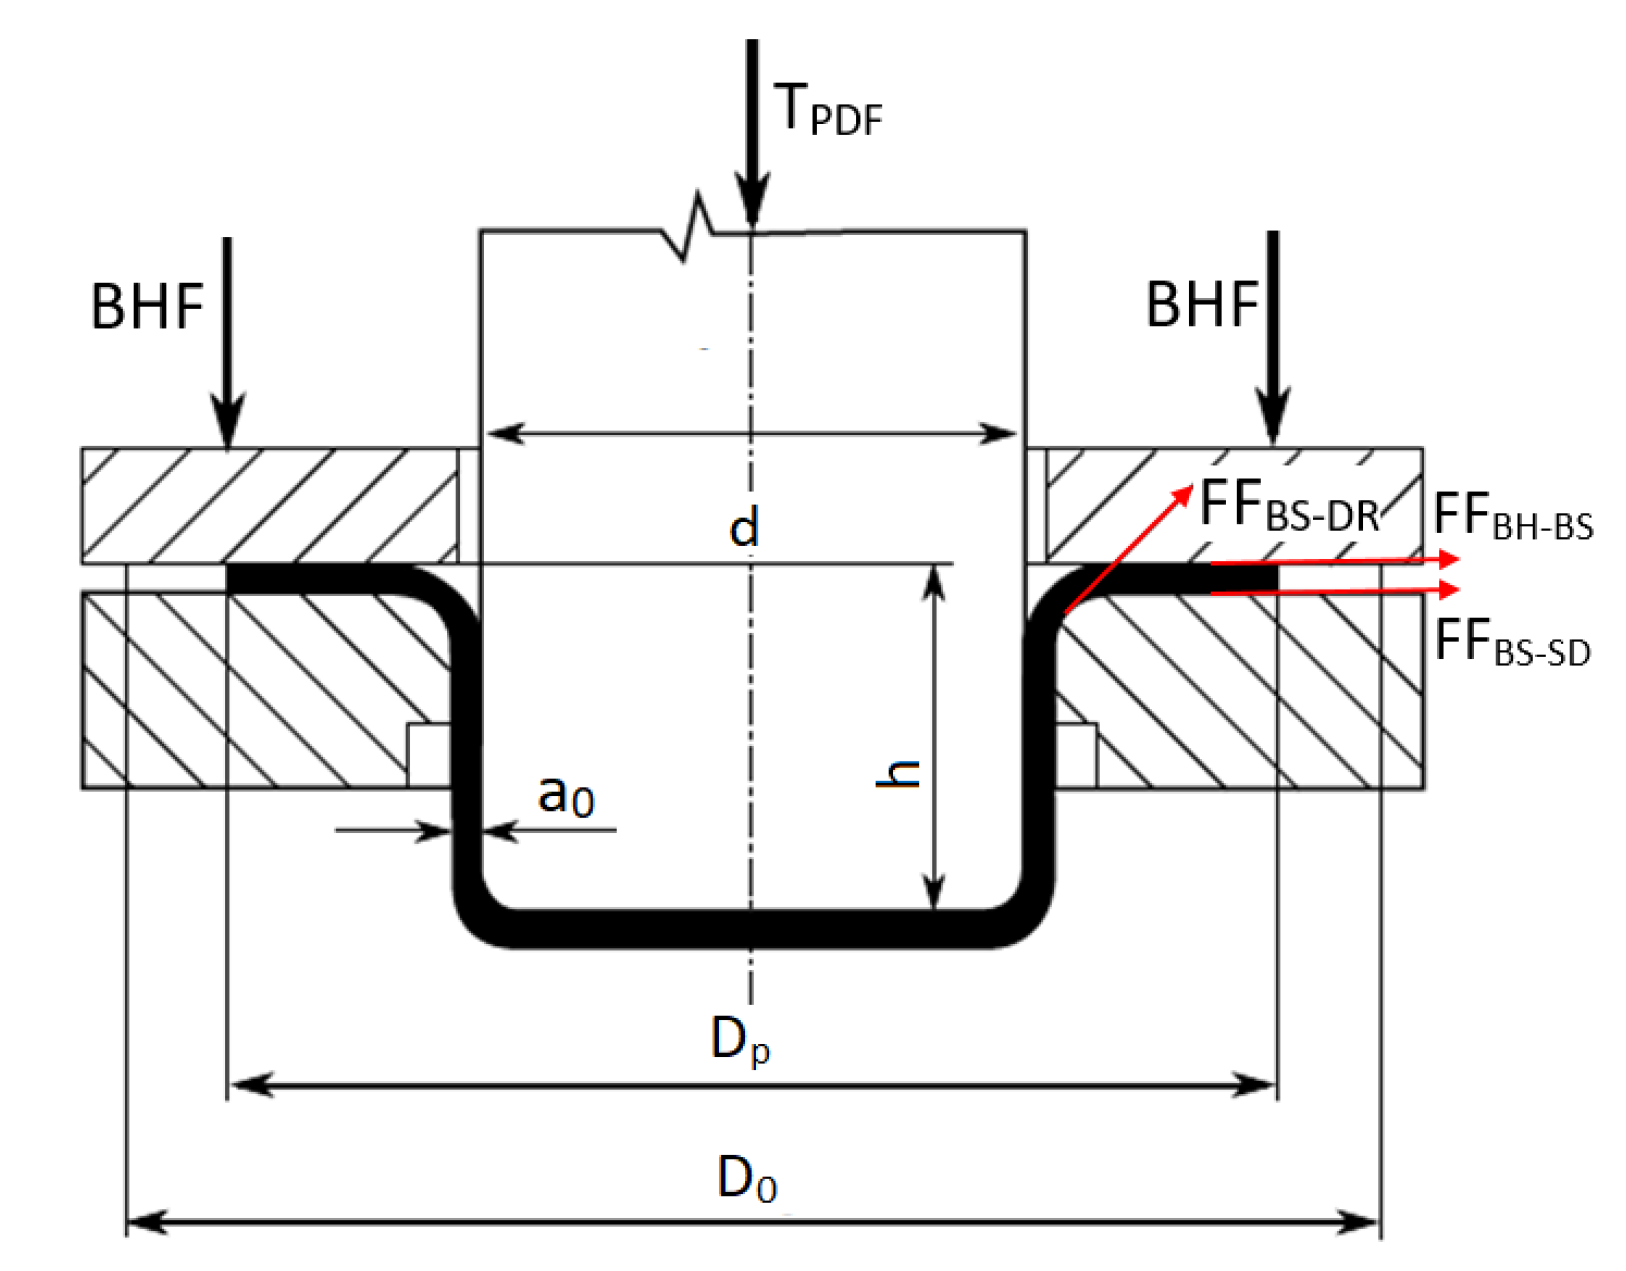
Figure 1. Scheme of cup test and forces [13].
Lubricants 10 00297 g001
Figure 2. Microstructure of material coating Zn-Fe (1).
Lubricants 10 00297 g002
Figure 3. Microstructure of material coating Zn-Fe (2).
Lubricants 10 00297 g003
Figure 4. Microstructure of material coating Zn-Fe (3).
Lubricants 10 00297 g004
Figure 5. Control diagram for the roughness Ra. (Note: UCL and LCL—Upper and Lower Control Limit; UWL and LWL—Upper and Lower Warning Limit; USPCL and LSPCL—Upper and Lower Statistical Control Process Limit; TMV = CL—Target Mean Value).
Lubricants 10 00297 g005
Figure 6. Control diagram for the number of peaks Pc.
Lubricants 10 00297 g006
Figure 7. Dependence of the total punch drawing force on the holding force when applying coated material Zn-Fe (1).
Lubricants 10 00297 g007
Figure 8. Dependence of the total punch drawing force on the holding force when applying coated material Zn-Fe (2).
Lubricants 10 00297 g008
Figure 9. Dependence of the total punch drawing force on the holding force when applying coated material Zn-Fe (3).
Lubricants 10 00297 g009
Figure 10. Dependence of the coefficient of friction on the pressure of the blank holder when using Anticorit lubricant.
Lubricants 10 00297 g010
Figure 11. Principle of determining Limit Drawing Ratio.
Lubricants 10 00297 g011
Figure 12. Dependence of the total punch drawing force on the diameter of the blank sheet metal.
Lubricants 10 00297 g012
Figure 13. Dependence of the roughness Ra on the Fe content in the coating Zn-Fe.
Lubricants 10 00297 g013
Table 1. Chemical composition of the base material (weight %).
C MaxMn MaxP MaxS MaxAl MinTiN Max
0.0150.200.0150.0150.020.06–0.140.006
Table 2. Chemical composition and other properties of the coatings.
CoatingThickness
[µm]
Fe Volume [%]AlloyingPhase CompositionPhase Microhardness HV
InsideSurface
Zn-Fe (1)11.65.5Noη, ζ, δηη (52 to 72)
Zn-Fe (2)7.612.6Yesδ, Γδδ (240 to 300)
Zn-Fe (3)8.014.4Yesδ, Γδ
Note: η—Zn; ζ—FeZn13; Γ—Fe3Zn10.
Table 3. Measured values of roughness Ra, Pc and the calculated values of capability indexes.
CoatingMeasured Values Ra and PcFord RequirementsCpk,Ra IndexesCpk,Pc
Index
Ra
[µm]
Pc
[cm−1]
бRa
[µm]
бPc
[cm−1]
Ra
[µm]
Pc
[cm−1]
Cpk,USLCpk,LSL
Zn-Fe (1)1.381340.077.51.1 to 1.6>601.541.345.97
Zn-Fe (2)1.271150.06112.82.30.962.97
Zn-Fe (3)1.121100.03415.55.730.22.34
Note: Ra—arithmetical mean height, Pc—peak count, бRa—standard deviation of Ra, бPc—standard deviation of Pc, Cpk—capability indexes.
Table 4. Mechanical properties of coated material.
CoatingRolling Dir. [°]RP0.2
[MPa]
Rm
[MPa]
Ag
[%]
A80
[%]
K
[MPa]
n
[-]
φ0
[-]
r
[-]
Zn-Fe (1)90°16629327.540.75090.2150.0052.19
Zn-Fe (2)17529626.739.05140.2100.0102.02
Zn-Fe (3)17029426.038.24980.2050.0101.93
Note: RP0.2—yield stress, Rm—ultimate tensile stress, Ag—uniform elongation, A80—total elongation, K—strength constant, n—strainhardening exponent, r—plastic strain ratio (Lankford’s coefficient), φ0—strain offset.
Table 5. Calculated values of friction coefficients according to relation (21).
MaterialBlankholder Force BHF
[kN]
Coefficient of Friction CFAntic.
[-]
Coefficient of Friction CFmf.
[-]
Coefficient of Friction CFDry.
[-]
Pressure under the Blank Holder
[MPa]
Zn-Fe (1)10---2.27
200.1230.0520.1334.56
300.1000.0450.1616.84
400.0900.040Fracture9.12
500.0880.037-13.68
Zn-Fe (2)10---2.27
200.1310.0460.1194.56
300.1100.0490.1516.84
400.1000.038Fracture9.12
500.0970.041-13.68
Zn-Fe (3)10---2.27
200.1490.0520.1244.56
300.1200.0530.1486.84
400.1080.060Fracture9.12
500.1070.051-13.68
Publisher’s Note: MDPI stays neutral with regard to jurisdictional claims in published maps and institutional affiliations.