Article

A Possible Quasi-Periodic Oscillation in the X-ray Emission of 3C 120

1
Raman Research Institute, C. V. Raman Avenue, Sadashivanagar, Bengaluru 560080, India
2
Indian Institute of Astrophysics, Block II, Koramangala, Bengaluru 560034, India
3
Inter University Centre for Astronomy and Astrophysics, Pune 411007, India
4
Center for Theoretical Physics, Polish Academy of Sciences, Al.Lotnikow 32/46, 02-668 Warsaw, Poland
5
Embibe, Diamond District, Domlur, Bengaluru 560008, India
*
Author to whom correspondence should be addressed.
Galaxies 2021, 9(2), 20; https://doi.org/10.3390/galaxies9020020
Submission received: 21 September 2020 / Revised: 3 March 2021 / Accepted: 18 March 2021 / Published: 25 March 2021

Abstract

:
We present here the detection of a possible quasi-periodic oscillation (QPO) signal in the X-ray light curve of the active galactic nucleus 3C 120, a broad line radio galaxy at z = 0.033. The hint of a QPO at the 3 σ level at 7.1 × 10 6 Hz (∼1.65 days) was detected based on the analysis of X-ray data acquired in the 3–79 keV band by the Nuclear Spectroscopic Telescope Array (NuSTAR). The data, when processed separately in the soft (3–10 keV), hard (10–79 keV) and the total (3–79 keV) bands using four different techniques, namely discrete correlation function, Lomb Scargle periodogram, structure–function, and power spectral density indicated the presence of a QPO. 3C 120 very well fits in the negative correlation in the frequency of the QPO versus the black hole mass (F Q P O versus M B H ) diagram known for stellar-mass and supermassive black hole sources. Considering the observed signs of QPO to represent the innermost stable orbit of the accretion disk, we found a black hole mass of 1.9 × 10 9 M for a Kerr black hole and 3.04 × 10 8 M for a Schwarzschild black hole. This deduced black hole mass from QPO measurement is a few times larger than the black hole mass obtained from reverberation mapping observations.

1. Introduction

Active Galactic Nuclei (AGNs) are among the brightest persistent sources in the sky with characteristic bolometric luminosity ranging between 10 41 –10 48 erg s 1 . They are believed to be powered by an actively accreting and possibly spinning central supermassive black hole (SMBH) [1] with typical masses of 10 6 –10 10 M . This process of accretion leads to the formation of an optically thick, geometrically thin accretion disc (AD) due to the loss of angular momentum through viscous and turbulent processes [2]. AD emits mainly in the optical, UV, and soft X-ray bands of the electromagnetic (EM) spectrum. In the unified model of AGN, the AD is surrounded by the doughnut-shaped dusty torus away from the central region, and a minor fraction of AGN is also characterized by relativistic bipolar outflows [3,4]. One of AGN’s defining characteristics since their discovery is that they display strong, aperiodic flux variability across the EM spectrum [5,6]. Rapid flux variations observed in the X-ray band on timescales of a day or less support the idea that X-rays originate close to the central SMBH [7]. In addition, in the broadband X-ray spectra of a few AGN, high energy cut off ( E c u t ) has been observed, which is attributed to thermal comptonization [8,9,10].
The prevailing notion that AGNs show that only random flux variations over a range of time scales from low energy radio to high energy γ -ray bands have been challenged since the last decade, with the first detection of a highly significant quasi-periodic oscillation (QPO) of about 1 h in the X-ray light curve of the narrow-line Seyfert 1 (NLSy1) galaxy RE J1034+396 [11,12]. Since then, QPOs in AGNs have been detected in the radio ([13,14,15] and references therein), optical ([16,17] and references therein), X-rays [11,18,19] and γ -rays ([20] and references therein). Thus, it is now evident that AGNs do show QPO similar to what is seen in galactic compact X-ray sources that include white dwarfs, neutron stars, and X-ray binaries (XRBs) [21]. In the plot of QPO frequencies against black hole (BH) masses, AGNs lie in the high mass end of the extrapolated anti-correlation trend known in X-ray binaries [22,23] which extends additional support to the notion of AGNs being the scaled-up version of XRBs.
QPOs are known in a large number of Galactic XRBs [24,25,26]. There have been a few works quantifying the QPOs in AGNs, giving us more cause to explore this study through this work. Detection of more AGN with significant QPOs will also enable one to better constrain some of the models available in the literature to explain QPOs observed in AGN, such as the orbiting hot spot on AD [27], turbulence behind shock in relativistic jet [28] and the swinging jet model [29]. In this paper, we present the detection of a possible QPO in 3C 120 in the X-ray band.
3C 120 ( α 2000.0 = 04 h 33 m 11.1s, δ 2000.0 = + 05 21 15 ) has been identified as a broad-line radio galaxy at a redshift (z) = 0.033 [30] powered by a BH of mass ( 5.7 ± 2.7 ) × 10 7 M [31]. It has a one-sided low inclination superluminal jet detected in the optical, radio, and X-ray bands (e.g., [32] and references therein). It is very bright (∼5 × 10 11 erg s 1 cm 2 at 2–10 keV) and variable in X-rays [33]. It is also found to be a γ -ray source from the Large Area Telescope (LAT) onboard the Fermi Gamma-ray space telescope [34]. Broadband X-ray spectral fits revealed the presence of a high energy cut-off at E c u t = 83 8 + 10 keV [10]. Analysis of the same timing data presented by [35] hinted towards the presence of a QPO. Therefore, the goal of this study is to confirm the presence of QPO using well-established methods. This paper is organized as follows: In Section 2, we present the NuSTAR data analysis. In Section 3, we describe the various methods used to search periodicity in the light curve and also discuss the results obtained, while in Section 4 we discuss the results and draw our conclusions.

2. NuSTAR Observations and Data Analysis

We used the archival data of 3C 120 observed by NuSTAR [36]) in the 3−79 keV band on 6 February 2013 (ObsID 60001042003). We reduced the data using the NuSTAR Data Analysis Software Package NuSTARDAS v1.6.0 distributed by the High Energy Astrophysics Archive Research Center (HEASARC). Taking into account the passage of the satellite through the South Atlantic Anomaly, and using CALDB 20161207, we generated a cleaned and screened events file using the task nupipeline. For generating the source light curve, we used a circular region of 60 radius centered at the peak brightness of the source. Similarly, for the background light curve, we used a circular region of 60 much farther from the source. We generated light curves separately for both the focal plane modules FPMA and FPMB in the 3–79 keV band with a binning of 300 s. We generated the final light curve by combining the count rates in both the modules using the lcmath task available in FTOOLS V4.0. The light curve in the 3–79 keV band for a total duration of about 250 ksec is shown in Figure 1 (lower Panel). A visual inspection of the light curve hints at a possible presence of a periodic signal. To confirm the presence of the periodic signal in 3C 120 unambiguously, we carried out the discrete correlation function (DCF), lomb-scargle periodogram, structure–function and power spectral density analyses. To get rid of undesired noise, we removed data points with uncertainty more than two times the standard deviation of the data points’ errors. We then averaged the resultant light curve over 3600 s to get an evenly sampled data set. The error in each point of the binned light curve is standard deviation of the flux values over the 3600 s bin. The averaged light curve is displayed in the upper panel of Figure 1. In all further analyses, the averaged light curve having a uniform time resolution of 1 h was used.

3. Analysis and Results

3.1. Discrete Correlation Function

To quantify the presence of a periodic signal in the light curve of 3C 120 if any, we first used the DCF technique proposed by [37]. It permits to study the correlation relationship between any two data sets. For two discrete data sets (a i , b j ), we first calculated the unbinned DCF (UDCF) as:
U D C F i j ( τ ) = ( a i a ¯ ) ( b j b ¯ ) ( σ a 2 e a 2 ) ( σ b 2 e b 2 )
where a ¯ , b ¯ are the mean values of two data sets, σ a , σ b are their standard deviation and e a , e b are measurement errors of data points in the two data series. Each value of UDCF is associated with time delay Δ t i j = ( t y j t x i ) .
DCF is obtained by averaging the UDCF values for each time lag τ over the interval τ Δ τ 2 t i j τ + Δ τ 2 as follows:
D C F ( τ ) = k = 1 m U D C F k M ,
where M is the number of pairs with time lag values lying in the τ interval. Errors in DCF are calculated using the formula:
σ D C F ( τ ) = k = 1 M ( U D C F k D C F ( τ ) ) 2 M 1 .
With only one light curve, the DCF method becomes a discrete auto-correlation function (DACF), which can be utilized to detect the periodicity in the light curve. This is done by comparing the light curve with itself shifted by a delta in time. We used a τ of 4700 s. If the DACF reveals the detection of strong peaks apart from the one close to zero time lag and at multiples of the period, it accounts for the presence of a possible QPO [38]. A detailed description of ACF is given in [39].
The essence of DACF is that, for clear correlation, the DACF peaks at time lag equal to zero, and the presence of periodicity in the light curve will appear as secondary peaks in DACF. Our DACF analysis revealed a signature of a periodic component for the source at a possible period of ∼156,250 ± 2350 s in the 3–79 keV. Figure 2a shows the DACF for 3C 120.

3.2. Lomb–Scargle Periodogram

Lomb–Scargle Periodogram (LSP) is a powerful tool widely used to search for periodicities in time series data (e.g., [17,40,41] and references therein). It was proposed by [42] and extended by [43]. LSP has been generalized for more practical use by [44]. We obtained the LSP using the following form of periodogram:
P L S ( f ) = 1 2 { n g n cos ( 2 π f [ t n τ ] ) 2 / n cos 2 ( 2 π f [ t n τ ] ) + n g n sin ( 2 π f [ t n τ ] ) 2 / n sin 2 ( 2 π f [ t n τ ] ) }
where τ is specified for each f to ensure time-shift invariance:
τ = 1 4 π f tan 1 n sin ( 4 π f t n ) n cos ( 4 π f t n ) .
More details are outlined in [45] and references therein. We computed LSP on the time series data of 3C 120 and the periodogram is shown in Figure 2b. A prominent peak (with significance greater than 3 σ ; Figure 2b) is seen in the periodogram with a period of at 149,200 ± 11,550 s. As our data are uniformly sampled, the aliasing problem associated with LSP [45] is mitigated. In addition, the period obtained from our LSP analysis matches within 1 σ of that obtained from the DACF analysis.

3.3. Structure Function

Structure function (SF) is well adapted to quantitatively estimate periodicity and timescales that contribute to fluctuations. Therefore, it also sheds light on the underlying cause of variability. SF has been introduced and discussed by [46]. The biggest advantage of this method is that it remains unaffected by any data gaps in the light curves and can be applied to unevenly sampled data.
First order SF for a data series is defined as:
S F ( τ j ) = 1 N ( τ ) i = 1 N ω ( i ) ω ( i + τ ) [ a ( i ) a ( i + τ j ) ] 2
where τ is the time lag. The weighting function w(i) is 1 if we have observation for ith interval else it is 0. Further details of SF can be found in [47] and references therein. For a sinusoidal time series with period P, the SF curve has minima at τ equal to the period (P) and its sub-harmonics (e.g., [18]. The SF evaluated for 3C 120 for the light curve in 3–79 keV is shown in Figure 2c. The first dip clearly indicates a possible period of ∼154,800 ± 1760 s. This is also in good agreement with the value of P obtained from LS periodogram and DACF analyses.

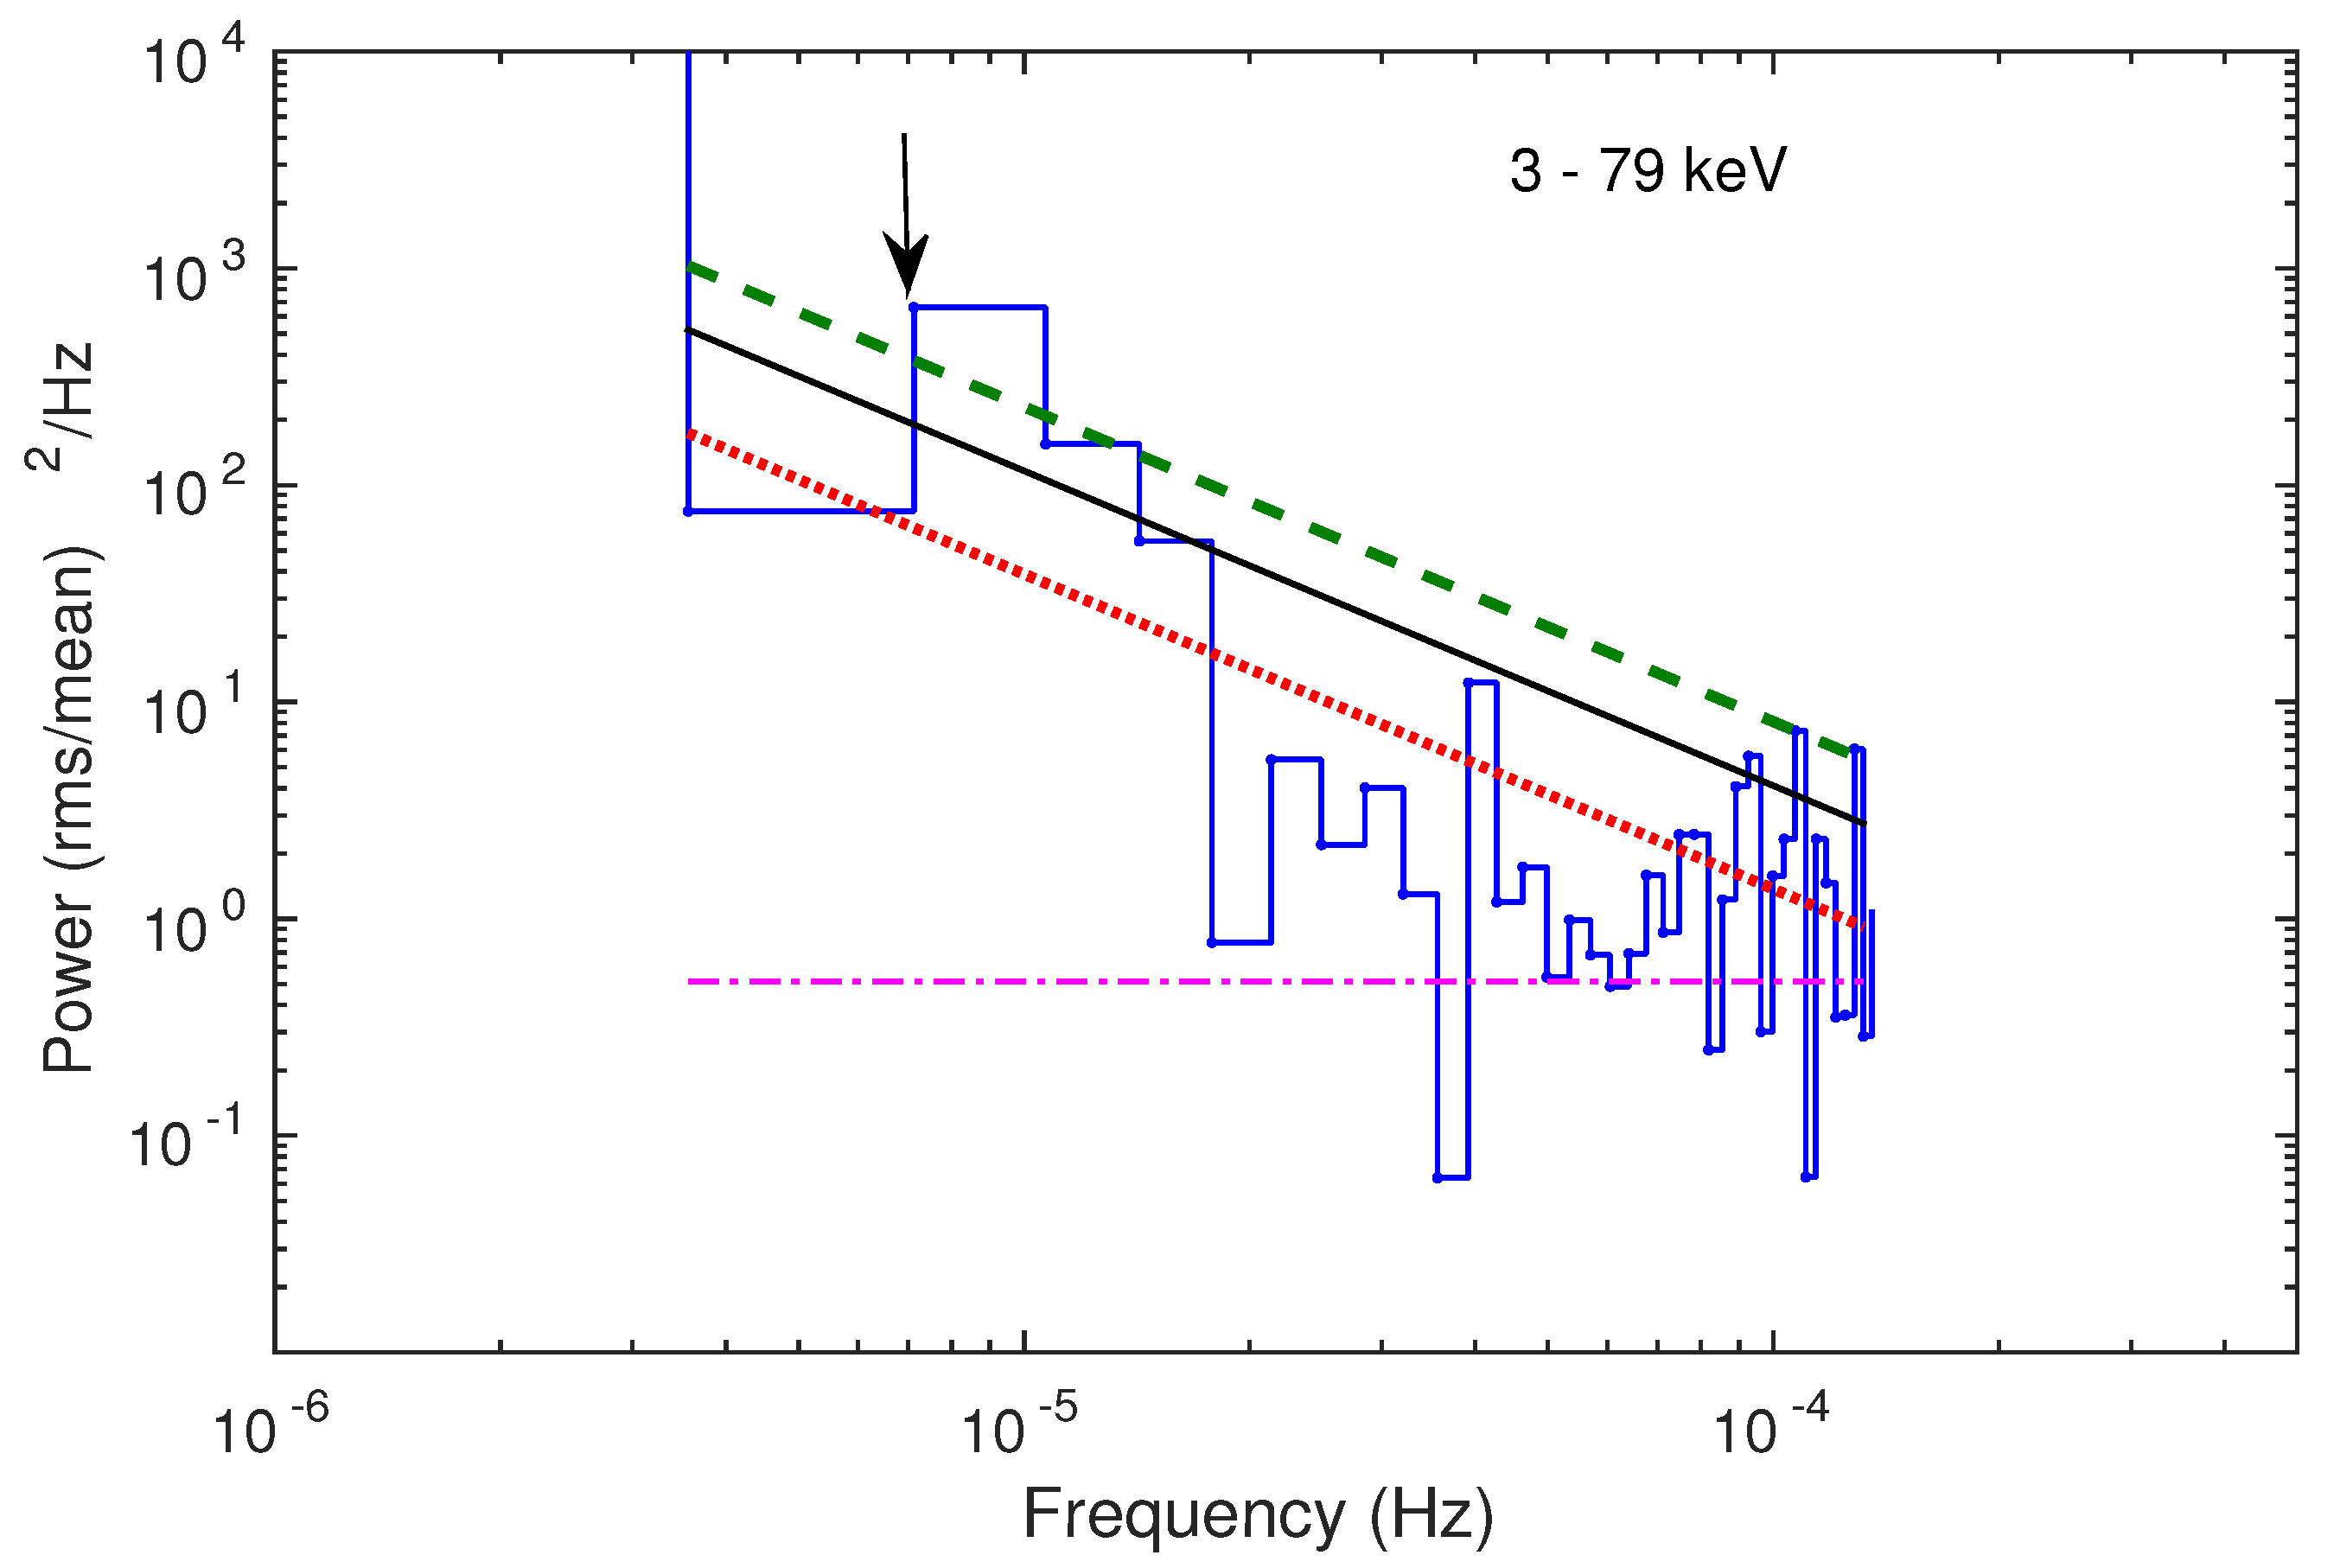
3.4. Power Spectral Density

The periodogram sheds light on the physical process contributing to the source variability. Moreover, it also aids in detecting and characterizing the QPOs. The presence of QPOs will be evident as peaks in the power spectral density (PSD). To estimate the period more precisely, we adopted the methodology proposed by [48,49]. PSD is a very promising tool to differentiate the random fluctuations from the real variations in AGN light curves. It is also widely accepted and used to search for periodic variations in AGN light curves ([11,50] and references therein). The steps followed in this method include measuring the periodogram, dividing the periodogram by the best-fitted power law, and then estimating the significance of the observed peak above the continuum. PSD is computationally one of the simplest techniques with the only limitation of being applied to evenly sampled data. Additional advantage of PSD is that, since all sources of intrinsic noise present in the target are accounted for, the noise due to external sources can be identified and studied. PSD describes the amount of variability power, i.e., average squared amplitude, as a temporal frequency function (1/timescale). This method involved first measuring periodogram of an evenly sampled time series as below:
I ( f j ) = 2 Δ T x 2 N | X j | 2
where X ( f j ) is the discrete Fourier transform at each n = K / 2 Fourier frequencies. The computed periodogram using the above equation follows a χ 2 -distribution with two degrees of freedom (DOF). The power-law component in an AGN spectrum sheds light on the power distribution as a function of frequency and is formulated as:
P ( f ) f α
where α is the PSD slope, representing red noise spectra ( α 1 ). When the power spectrum follows a power-law model, then the best way to plot is in log space and the logarithmic of the power-law becomes a linear function. The expectation value of the logarithm of the observed periodogram offsets the PSD by 0.250682 i.e., 0.57721466 / l n 10 where the numerator is the Euler–Mascheroni constant. Finally, the unbiased estimate of the logarithmic periodogram is computed by adding 0.250682 to the periodogram [51] obtained using Equation (7). We fit our calculated PSDs with a single Power-law model of the form given in Equation (8) using the least squares method and estimate the slope α and normalization (N). In the logarithmic scale, the slope of the linear fit ( y = m x + c ) gives us α as m and the intercept tells log ( N ) = c + 0.250682 .
We also tested the significance of the frequency peak detected above the power spectrum using the Vaughan recipe [49]. To perform an estimation of the peak significance against the red noise is of extreme importance (see Section 3.5). Using our values of α and N, we can formulate our null hypothesis that any peak is generated by a non-periodic process. We then define the significance level for a given number of frequencies (M) of the periodogram as:
γ ϵ / 2 = ln [ 1 ( 1 ϵ ) 1 / M ]
where ϵ gives the ‘false alarm probability and therefore ( 1 ϵ ) 100 percent is the confidence limit for a detection. Thus, to define our 95 ( ϵ = 0.05) and 99 ( ϵ = 0.01) per cent confidence limits on our computed log–log periodogram, we add the logarithm of γ ϵ / 2 to the model. If a periodogram point deviates from the red-noise model, i.e., exceeds the 3 σ limit, we assume the presence of a QPO in the source.
Periodogram evaluated for 3C 120 light curve in the 3–79 keV energy range is shown in Figure 3. Here, the spectrum steepens at low frequencies due to the red noise variability that characterizes most of the AGN, while the spectrum flattens (‘white noise’) at high frequencies due to Poisson Noise. Analysis of the PSD indicates the presence of a possible QPO signal at ∼143,000 s. A 3C 120 light curve averaged over 3600 s folded with a period of 143,000 s is displayed in Figure 4. The best-fitted sinusoidal model is also plotted over the folded light curve.

3.5. Significance and Uncertainty Estimation

Astronomical sources show random and chaotic variability, which is considered as red noise (larger amplitude variations at larger time scales) in their power spectrum. Sometimes, in the periodogram, the larger amplitude peaks can be misunderstood as a periodic signal, especially in the lower frequency regime [52]. In addition to the red noise processes, the periodogram tends to be biased due to the finite period of the observations (causing red noise leak) in unevenly sampled light curve. Thus, the need arises to account for the above-mentioned distortions. In addition, as discussed in [53], the spectral window function applied on the uneven sampled light curve shows considerable power at all frequencies because of the uneven sampling of the light curve, which could be misleading in detecting the actual periodicity. In our case, we carried out our analysis on the evenly sampled light curve, and hence our results are free from the spurious detection caused by the uneven sampling and the spectral window function.
To have a robust detection of possible QPO in any method, a significance corresponding to the QPO should be estimated. In general, this can be done by simulating a large number of red-noise light curves of the source. To simulate a large number of light curves, we have followed the well-accepted procedure by [54], which fully randomizes the phase and amplitude of the Fourier components of the light curves. To have the exact form of the red noise, we used the procedure of Vaughan [49], and the power spectral density was fitted with power-law. The best slope was found to be 1.45, and this slope was used to simulate a large number of red noise light curves for the significance estimation.
The simulated light curves were then used to estimate the significance of the QPO detected using the three methods, viz. DACF, LSP, and SF. The secondary peak of the DACF is found to be above 2 σ significance, as shown in Figure 2a. Similarly, significance in the LSP method and SF method is found to be above 3 σ as shown in Figure 2b,c. Our analysis indicates that the QPO signal found in 3C 120 is unlikely to be spurious.

4. Discussion

By analyzing the 3–79 keV X-ray data from NuSTAR, we found a possible imprint of the QPO signal in 3C 120. The possible existence of the QPO signal was confirmed by four independent analysis methods. Though X-ray QPOs are widely known in Galactic sources, their detection in AGN is very limited. As of today, X-ray QPOs are known in only half-a-dozen AGN such as (a) ∼1-h QPO in RE J1034+396 [11] (b) two transient QPO signals in 1H 0707-495 [55], (c) 3.8 h QPO in 2XMM J123103.2+110648 [56], (d) ∼2 h QPO in MS2254.9-3712 [57], (e) ∼1.8 h QPO in Mrk 766 [23] and (f) a twin QPO with period of 23.82 ± 0.07 h in XMMUJ134736.6+173403 [58]. A look into these AGNs’ long-term optical light curves indicates that they are generally non-variable and, if variable, they are either in the faint or intermediate brightness levels during the period when QPO was detected. This clearly indicates that the jet’s contribution to the observed X-ray emission in them was insignificant during the epoch when QPO was detected. The period of QPOs in the X-ray band in AGNs known till today is lesser than 5 h and, among them, about 50% (3/6) are NLSy1 galaxies. However, the X-ray QPO for 3C 120 has a period of about 1.65 days, the highest known in an AGN till today in the X-ray band. With a possible detection reported in this work, the number of AGNs with X-ray QPOs has increased to seven. We note here that all four analysis methods show signs of the presence of QPO in 3C 120. However, the length of the data are not long enough to unambiguously claim the detection of QPO. Further analysis with longer duration light curves are of substantial importance to confirm or reject the presence of QPO in 3C 120.
The observed X-rays in AGN are related to processes happening close to their central regions [7]. In the AGNs with weak radio jets ([59] and references therein), the X-ray emission is likely to be dominated by thermal processes close to the AD [60,61,62], while, for the AGNs with strong radio jets, the observed X-ray emission in addition to the disk emission is likely to be contaminated by emission from the jet. However, in general, in addition to X-ray flux variations, the QPOs seen in X-ray wavelengths in compact sources is widely believed to be related to the innermost stable circular orbit around BHs [26]. In the case of AGNs with weak jets, the observed QPOs can be explained by a variety of theoretical models such as instabilities in the AD [63], hot spots in the AD [27] or the disk precision [64]. Alternatively, the AGNs with strong jets such as blazars, the observed QPO in all likelihood is dominated by processes related to the jet itself, such as the precession of the jet (e.g., [65,66,67] and references therein) or to the processes that feed the jet such as pulsational accretion flow instabilities [20].
The source 3C 120, though classified as a Seyfert 1 galaxy [30], is a γ -ray source [68] with a one-sided jet. It is thus likely that the observed X-ray emission is dominated by emission from the jet. However, during the epoch of NuSTAR data analyzed in this work, 3C 120 was in a relatively faint state. Its NuSTAR spectrum has a prominent weak Fe K α line [10] and it was also not detected by Fermi [69] during the epoch of NuSTAR observation. This clearly indicates that the X-rays from 3C 120 observed by NuSTAR has negligible/no contribution from the jet and thus the observed QPO could be ascribed to processes related to the AD. This inference could indeed be used to estimate the mass of the SMBH in 3C 120. The minimum size of an emitting region is closely related to the gravitational radius of BH, R ≥ R g = GM/c 2 [70]. Taking the redshift and SMBH spin into account, we estimated the mass of SMBH using [71]:
M / M = 3.23 × 10 4 P ( ( r 3 / 2 + ( a / M ) ) ( 1 + z ) ,
where P is a periodicity (in seconds), r is the radius of the emitting region (in GM/c 2 ), a / M is the BH angular momentum parameter, and z is the redshift. In case of non rotating Schwarzschild BH, for the last stable circular orbit of the disc, we have r = 6 and a/M = 0, whereas, for a rapidly rotating Kerr BH, we have r = 1.2, the last stable circular orbit for a co-rotating disk around a maximum rotating BH, along with a/M = 0.9982 [72].
For an a of 143,000 s, we found BH masses of 1.9 × 10 9 M and 3.04 × 10 8 M for a rapidly rotating and non-rotating SMBH, respectively. These SMBH mass values correspond to a L E d d value of 2.5 × 10 47 ergs 1 and 3.9 × 10 46 ergs 1 , respectively, where L E d d is given as:
L E d d = 1.3 10 38 M B H M e r g s 1
It is theoretically expected in strong gravity that the QPO frequency inversely scales with the mass of the source [18]. From three micro-quasars with known mass, [26] found the QPO frequency to inversely scale with mass as:
f h i g h = 2793 ( M B H M ) 1
For 3C 120 with a BH mass of 6.7 × 10 7 M from reverberation observations [31], we expect to have a QPO frequency (F Q P O ) of 4.2 × 10 5 Hz. The observed QPO frequency in 3C 120 is about an order of magnitude smaller than what is expected from the scaling relations of galactic BH systems. However, given that 3C 120 is a γ -ray emitting source and the jet seen in 3C 120 is at very close angle to the line of sight, the BH mass estimated from reverberation mapping observations is likely to be affected due to the contribution of jet to the optical continuum emission in 3C 120. In support of the expectation from gravity theories, observationally, it has been noticed that the F Q P O -M B H anti-correlation is universal [22] that covers a wide range of masses from stellar mass BHs to SMBHs. The signs of QPO-like behavior found in 3C 120 in this work and the BH mass calculated using this frequency (M B H = 1.9 × 10 9 M ) for a kerr BH also nicely fits in the already known negative correlation between F Q P O and BH mass [73]. Detailed X-ray spectral analysis by [74] indicates 3C 120 to have a rapidly spinning BH with the spin factor a >0.95. Shown in Figure 5 are the galactic sources in blue solid circles and AGN sources in black open triangles. For AGNs, we re-calculated their BH masses in a homogenous way using their reported QPO frequencies culled from literature and our Equation (7) for a non-rotating case. However, for 3C 120, we show in Figure 5 its position with filled green squares both for the Schwarzschild and Kerr BH case.
Suggestions do exist in literature of a connection between AGN and Galactic BHs and detection of QPOs in a large number of AGN will indeed strengthen this connection. In addition, the detection of QPO signals in more and more AGN is needed, which, in addition to constraining the available models of QPOs, will help in establishing a firm footing for the inverse correlation that is observed between QPO frequency and mass over a wide range of masses.

Author Contributions

Conceptualization, A.A. and C.S.S.; methodology, A.A., P.R., R.P. and V.A.; writing—original draft preparation, A.A.; formal analysis, A.A., P.R., R.P. and V.A.; supervision, C.S.S. and G.C.A.; writing—review and editing, C.S.S. and G.C.A. All authors have read and agreed to the published version of the manuscript.

Funding

AA’s work is partially supported by Science and Engineering Research Board, Grant No. PDF/2016/002648.

Institutional Review Board Statement

Not applicable.

Informed Consent Statement

Not applicable.

Data Availability Statement

This manuscript has no associated data or the data will not be deposited.

Acknowledgments

We thank the anonymous referees for thoughtful remarks and suggestions. We are grateful to Queena Cui for the invitation to submit an article to this special issue. We also acknowledge the support and cooperation of Hugo Wang throughout the publication process. This work has made use of data obtained with NuSTAR, a project led by the Jet Propulsion Laboratory, and funded by the National Aeronautics and Space Administration. This research has also made use of the NuSTAR Data Analysis Software (NuSTARDAS) jointly managed by the ASI Science Data Center (ASDC, Italy) and the California Institute of Technology (Caltech, CA, USA).

Conflicts of Interest

The authors declare no conflict of interest.

References

  1. Begelman, M.C.; Blandford, R.D.; Rees, M.J. Theory of Extragalactic Radio Sources. Rev. Mod. Phys. 1984, 56, 255–351. [Google Scholar] [CrossRef]
  2. Shakura, N.I.; Sunyaev, R.A. Reprint of 1973A&A....24..337S. Black Holes in Binary Systems. Obs. Appearance. Astron. Astrophys. 1973, 500, 33–51. [Google Scholar]
  3. Blandford, R.D.; Königl, A. Relativistic Jets as Compact Radio Sources. Astrophys. J. 1979, 232, 34–48. [Google Scholar] [CrossRef]
  4. Blandford, R.; Meier, D.; Readhead, A. Relativistic Jets from Active Galactic Nuclei. Annu. Rev. Astron. Astrophys. 2019, 57, 467–509. [Google Scholar] [CrossRef] [Green Version]
  5. Wagner, S.J.; Witzel, A. Intraday Variability In Quasars and BL Lac Objects. Annu. Rev. Astron. Astrophys. 1995, 33, 163–198. [Google Scholar] [CrossRef]
  6. Hovatta, T.; Lindfors, E. Relativistic Jets of Blazars. New Astron. Rev. 2019, 87, 101541. [Google Scholar] [CrossRef]
  7. Mushotzky, R.F.; Done, C.; Pounds, K.A. X-ray Spectra and Time Variability of Active Galactic Nuclei. Annu. Rev. Astron. Astrophys. 1993, 31, 717. [Google Scholar] [CrossRef]
  8. Pahari, M.; McHardy, I.M.; Mallick, L.; Dewangan, G.C.; Misra, R. Detection of the High-Energy Cut-off from the Seyfert 1.5 Galaxy NGC 5273. Mon. Not. R. Astron. Soc. 2017, 470, 3239–3248. [Google Scholar] [CrossRef] [Green Version]
  9. Tortosa, A.; Marinucci, A.; Matt, G.; Bianchi, S.; La Franca, F.; Ballantyne, D.R.; Boorman, P.G.; Fabian, A.C.; Farrah, D.; Fuerst, F.; et al. Broad-Band X-ray Spectral Analysis of the Seyfert 1 Galaxy GRS 1734-292. Mon. Not. R. Astron. Soc. 2017, 466, 4193–4200. [Google Scholar]
  10. Rani, P.; Stalin, C.S. Measurement of Coronal Properties of Seyfert Galaxies from NuSTAR’s Hard X-ray Spectrum. J. Astrophys. Astron. 2018, 39, 15. [Google Scholar] [CrossRef]
  11. Gierliński, M.; Middleton, M.; Ward, M.; Done, C. A Periodicity of 1hour in X-ray Emission from the Active Galaxy RE J1034+396. Nature 2008, 455, 1. [Google Scholar] [CrossRef]
  12. Espaillat, C.; Bregman, J.; Hughes, P.; Lloyd-Davies, E. Wavelet Analysis of AGN X-ray Time Series: A QPO in 3C 273? Astrophys. J. 2008, 679, 182–193. [Google Scholar] [CrossRef]
  13. An, T.; Baan, W.A.; Wang, J.-Y.; Wang, Y.; Hong, X.-Y. Periodic Radio Variabilities in NRAO 530: A Jet-Disc Connection? Mon. Not. R. Astron. Soc. 2013, 434, 3487–3496. [Google Scholar] [CrossRef] [Green Version]
  14. Xie, G.Z.; Yi, T.F.; Li, H.Z.; Zhou, S.B.; Chen, L.E. Periodicity Analysis of the Radio Curve of PKS 1510-089 and Implications for Its Central Structure. Astron. J. 2008, 135, 2212–2216. [Google Scholar] [CrossRef]
  15. Raiteri, C.M.; Villata, M.; Aller, H.D.; Aller, M.F.; Heidt, J.; Kurtanidze, O.M.; Lanteri, L.; Maesano, M.; Massaro, E.; Montagni, F.; et al. Optical and Radio Variability of the BL Lacertae Object <ASTROBJ>AO 0235+16</ASTROBJ>: A Possible 5-6 Year Periodicity. Astron. Astrophys. 2001, 377, 396–412. [Google Scholar] [CrossRef]
  16. Sandrinelli, A.; Covino, S.; Dotti, M.; Treves, A. Quasi-Periodicities at Year-like Timescales in Blazars. Astron. J. 2016, 151, 54. [Google Scholar] [CrossRef]
  17. Bhatta, G.; Stawarz, Ł.; Ostrowski, M.; Markowitz, A.; Akitaya, H.; Arkharov, A.A.; Bachev, R.; Benítez, E.; Borman, G.A.; Carosati, D.; et al. Multifrequency Photo-Polarimetric WEBT Observation Campaign on the Blazar S5 0716+714: Source Microvariability and Search for Characteristic Timescales. Astrophys. J. 2016, 831, 92. [Google Scholar] [CrossRef] [Green Version]
  18. Lachowicz, P.; Czerny, B.; Abramowicz, M.A. Wavelet Analysis of MCG-6-30-15 and NGC 4051: A Possible Discovery of QPOs in 2:1 and 3:2 Resonance. arXiv 2006, arXiv:astro-ph/0607594. [Google Scholar]
  19. Rani, B.; Wiita, P.J.; Gupta, A.C. Nearly Periodic Fluctuations in the Long-Term X-ray Light Curves of the Blazars AO 0235+164 and 1ES 2321+419. Astrophys. J. 2009, 696, 2170–2178. [Google Scholar] [CrossRef]
  20. Zhang, P.-F.; Yan, D.-H.; Zhou, J.-N.; Fan, Y.-Z.; Wang, J.-C.; Zhang, L. A γ-Ray Quasi-Periodic Modulation in the Blazar PKS 0301-243? Astrophys. J. 2017, 845, 82. [Google Scholar] [CrossRef]
  21. Warner, B.; Woudt, P.A.; Pretorius, M.L. Dwarf Nova Oscillations and Quasi-Periodic Oscillations in Cataclysmic Variables - III. A New Kind of Dwarf Nova Oscillation, and Further Examples of the Similarities to X-ray Binaries. Mon. Not. R. Astron. Soc. 2003, 344, 1193–1209. [Google Scholar] [CrossRef] [Green Version]
  22. Zhou, X.-L.; Yuan, W.; Pan, H.-W.; Liu, Z. Universal Scaling of the 3:2 Twin-Peak Quasi-Periodic Oscillation Frequencies With Black Hole Mass and Spin Revisited. Astrophys. J. 2015, 798, L5. [Google Scholar] [CrossRef] [Green Version]
  23. Zhang, P.; Zhang, P.; Yan, J.; Fan, Y.; Liu, Q. An X-ray Periodicity of ∼1.8 Hr in Narrow-Line Seyfert 1 Galaxy Mrk 766. Astrophys. J. 2017, 849, 9. [Google Scholar] [CrossRef] [Green Version]
  24. Homan, J.; Wijnands, R.; van der Klis, M.; Belloni, T.; van Paradijs, J.; Klein-Wolt, M.; Fender, R.; Méndez, M. Correlated X-ray Spectral and Timing Behavior of the Black Hole Candidate XTE J1550-564: A New Interpretation of Black Hole States. Astrophys. J. 2001, 132, 377–402. [Google Scholar] [CrossRef] [Green Version]
  25. Strohmayer, T.E. Discovery of a Second High-Frequency Quasi-Periodic Oscillation from the Microquasar GRS 1915+105. Astrophys. J. 2001, 554, L169–L172. [Google Scholar] [CrossRef]
  26. Remillard, R.A.; McClintock, J.E. X-ray Properties of Black-Hole Binaries. Annu. Rev. Astron. Astrophys. 2006, 44, 49–92. [Google Scholar] [CrossRef] [Green Version]
  27. Mangalam, A.V.; Wiita, P.J. Accretion Disk Models for Optical and Ultraviolet Microvariability in Active Galactic Nuclei. Astrophys. J. 1993, 406, 420. [Google Scholar] [CrossRef]
  28. Camenzind, M.; Krockenberger, M. The Lighthouse Effect of Relativistic Jets in Blazars. A Geometric Originof Intraday Variability. Astron. Astrophys. 1992, 255, 59–62. [Google Scholar]
  29. Gopal-Krishna; Wiita, P.J. Swinging Jets and the Variability of Active Nuclei. Astron. Astrophys. 1992, 259, 109–117. [Google Scholar]
  30. Burbidge, E.M. Redshifts of Thirteen Radio Galaxies. Astrophys. J. 1967, 149, L51. [Google Scholar] [CrossRef]
  31. Grier, C.J.; Peterson, B.M.; Pogge, R.W.; Denney, K.D.; Bentz, M.C.; Martini, P.; Sergeev, S.G.; Kaspi, S.; Minezaki, T.; Zu, Y.; et al. Reverberation Mapping Results for Five Seyfert 1 Galaxies. Astrophys. J. 2012, 755, 60. [Google Scholar] [CrossRef] [Green Version]
  32. Harris, D.E.; Hjorth, J.; Sadun, A.C.; Silverman, J.D.; Vestergaard, M. X-ray Emission from the Radio Jet in 3C 120. Astrophys. J. 1999, 518, 213–218. [Google Scholar] [CrossRef] [Green Version]
  33. Halpern, J.P. X-ray Spectrum and Variability of 3C 120. Astrophys. J. 1985, 290, 130–135. [Google Scholar] [CrossRef]
  34. Abdo, A.A.; Ackermann, M.; Ajello, M.; Baldini, L.; Ballet, J.; Barbiellini, G.; Bastieri, D.; Bechtol, K.; Bellazzini, R.; Berenji, B.; et al. Fermi Large Area Telescope Observations of Misaligned Active Galactic Nuclei. Astrophys. J. 2010, 720, 912–922. [Google Scholar] [CrossRef] [Green Version]
  35. Rani, P.; Stalin, C.S. Coronal Proerties of the Seyfert 1 Galaxy 3C 120 with NuSTAR. Astrophys. J. 2018, 856, 120. [Google Scholar] [CrossRef] [Green Version]
  36. Harrison, F.A.; Craig, W.W.; Christensen, F.E.; Hailey, C.J.; Zhang, W.W.; Boggs, S.E.; Stern, D.; Cook, W.R.; Forster, K.; Giommi, P.; et al. The Nuclear Spectroscopic Telescope Array (NuSTAR) High-Energy X-ray Mission. Astrophys. J. 2013, 770, 103. [Google Scholar] [CrossRef] [Green Version]
  37. Edelson, R.A.; Krolik, J.H. The Discrete Correlation Function: A New Method for Analyzing Unevenly Sampled Variability Data. Astrophys. J. 1988, 333, 646. [Google Scholar] [CrossRef]
  38. Stalin, C.S.; Kawabata, K.S.; Uemura, M.; Yoshida, M.; Kawai, N.; Yanagisawa, K.; Shimizu, Y.; Kuroda, D.; Nagayama, S.; Toda, H. Simultaneous MITSuME g’RCIC Monitoring of S5 0716+714. Mon. Not. R. Astron. Soc. 2009, 399, 1357–1366. [Google Scholar] [CrossRef] [Green Version]
  39. McQuillan, A.; Mazeh, T.; Aigrain, S. Stellar Rotation Periods of the Kepler Objects of Interest: A Dearth of Close-in Planets around Fast Rotators. Astrophys. J. 2013, 775, L11. [Google Scholar] [CrossRef] [Green Version]
  40. Sandrinelli, A.; Covino, S.; Treves, A.; Holgado, A.M.; Sesana, A.; Lindfors, E.; Ramazani, V.F. Quasi-Periodicities of BL Lacertae Objects. Astron. Astrophys. 2018, 615, A118. [Google Scholar] [CrossRef]
  41. Agarwal, A.; Mihov, B.; Andruchow, I.; Cellone, S.A.; Anupama, G.C.; Agrawal, V.; Zola, S.; Slavcheva-Mihova, L.; Özdönmez, A.; Ege, E.; et al. Multi-Band Behaviour of the TeV Blazar PG 1553+113 in Optical Range on Diverse Timescales. Flux and Spectral Variations. Astron. Astrophys. 2021, 645, A137. [Google Scholar] [CrossRef]
  42. Lomb, N.R. Least-Squares Frequency Analysis of Unequally Spaced Data. Astrophys. Space Sci. 1976, 39, 447–462. [Google Scholar] [CrossRef]
  43. Scargle, J.D. Studies in Astronomical Time Series Analysis. II. Statistical Aspects of Spectral Analysis of Unevenly Spaced Data. Astrophys. J. 1982, 263, 835–853. [Google Scholar] [CrossRef]
  44. Press, W.H.; Rybicki, G.B. Fast Algorithm for Spectral Analysis of Unevenly Sampled Data. Astrophys. J. 1989, 338, 277. [Google Scholar] [CrossRef]
  45. VanderPlas, J.T. Understanding the Lomb-Scargle Periodogram. Astrophys. J. 2018, 236, 16. [Google Scholar] [CrossRef]
  46. Simonetti, J.H.; Cordes, J.M.; Heeschen, D.S. Flicker of Extragalactic Radio Sources at Two Frequencies. Astrophys. J. 1985, 296, 46–59. [Google Scholar] [CrossRef]
  47. Agarwal, A.; Cellone, S.A.; Andruchow, I.; Mammana, L.; Singh, M.; Anupama, G.C.; Mihov, B.; Raj, A.; Slavcheva-Mihova, L.; Özdönmez, A.; et al. Multiband Optical Variability of 3C 279 on Diverse Time-Scales. Mon. Not. R. Astron. Soc. 2019, 488, 4093–4105. [Google Scholar] [CrossRef]
  48. Vaughan, S.; Edelson, R.; Warwick, R.S.; Uttley, P. On Characterizing the Variability Properties of X-ray Light Curves from Active Galaxies. Mon. Not. R. Astron. Soc. 2003, 345, 1271–1284. [Google Scholar] [CrossRef]
  49. Vaughan, S. A Simple Test for Periodic Signals in Red Noise. Astron. Astrophys. 2005, 431, 391–403. [Google Scholar] [CrossRef]
  50. Agarwal, A.; Mohan, P.; Gupta, A.C.; Mangalam, A.; Volvach, A.E.; Aller, M.F.; Aller, H.D.; Gu, M.F.; Lähteenmäki, A.; Tornikoski, M.; et al. Core Shift Effect in Blazars. Mon. Not. R. Astron. Soc. 2017, 469, 813–840. [Google Scholar] [CrossRef] [Green Version]
  51. Papadakis, I.E.; Lawrence, A. Quasi-Periodic Oscillations in X-ray Emission from the Seyfert Galaxy NGC5548. Nature 1993, 361, 233–236. [Google Scholar] [CrossRef]
  52. Press, W.H. Flicker Noises in Astronomy and Elsewhere. Comments Astrophys. 1978, 7, 103–119. [Google Scholar]
  53. Goyal, A. Blazar Variability Power Spectra from Radio up to TeV Photon Energies: Mrk 421 and PKS 2155-304. Mon. Not. R. Astron. Soc. 2020, 494, 3432–3448. [Google Scholar] [CrossRef]
  54. Timmer, J.; Koenig, M. On Generating Power Law Noise. Astron. Astrophys. 1995, 300, 707. [Google Scholar]
  55. Zhang, P.; Zhang, P.; Liao, N.; Yan, J.; Fan, Y.; Liu, Q. Two Transient X-ray Quasi-Periodic Oscillations Separated by an Intermediate State in 1H 0707-495. Astrophys. J. 2018, 853, 193. [Google Scholar] [CrossRef] [Green Version]
  56. Lin, D.; Irwin, J.A.; Godet, O.; Webb, N.A.; Barret, D. A 3.8 Hr Periodicity from an Ultrasoft Active Galactic Nucleus Candidate. Astrophys. J. 2013, 776, L10. [Google Scholar] [CrossRef] [Green Version]
  57. Alston, W.N.; Parker, M.L.; Markevičiūtė, J.; Fabian, A.C.; Middleton, M.; Lohfink, A.; Kara, E.; Pinto, C. Discovery of an ∼2-h High-Frequency X-ray QPO and Iron KαReverberation in the Active Galaxy MS 2254.9-3712. Mon. Not. R. Astron. Soc. 2015, 449, 467–476. [Google Scholar] [CrossRef]
  58. Carpano, S.; Jin, C. Discovery of a 23.8 h QPO in the Swift Light Curve of XMMU J134736.6+173403. Mon. Not. R. Astron. Soc. 2018, 477, 3178–3184. [Google Scholar] [CrossRef] [Green Version]
  59. Blundell, K.M.; Beasley, A.J.; Bicknell, G.V. A Relativistic Jet in the Radio-Quiet Quasar PG 1407+263. Astrophys. J. 2003, 591, L103–L106. [Google Scholar] [CrossRef] [Green Version]
  60. Czerny, B.; Elvis, M. Constraints on Quasar Accretion Disks from the Optical/Ultraviolet/Soft X-ray Big Bump. Astrophys. J. 1987, 321, 305. [Google Scholar] [CrossRef]
  61. Fanali, R.; Caccianiga, A.; Severgnini, P.; Della Ceca, R.; Marchese, E.; Carrera, F.J.; Corral, A.; Mateos, S. Studying the Relationship between X-ray Emission and Accretion in AGN Using the XMM-Newton Bright Serendipitous Survey. Mon. Not. R. Astron. Soc. 2013, 433, 648–658. [Google Scholar] [CrossRef] [Green Version]
  62. Pal, M.; Dewangan, G.C.; Misra, R.; Pawar, P.K. X-ray/UV Variability and the Origin of Soft X-ray Excess Emission from II Zw 177. Mon. Not. R. Astron. Soc. 2016, 457, 875–886. [Google Scholar] [CrossRef] [Green Version]
  63. Chakrabarti, S.K.; Wiita, P.J. Spiral Shocks in Accretion Disks As a Contributor to Variability in Active Galactic Nuclei. Astrophys. J. 1993, 411, 602. [Google Scholar] [CrossRef]
  64. Smith, K.L.; Mushotzky, R.F.; Boyd, P.T.; Wagoner, R.V. Evidence for an Optical Low-Frequency Quasi-Periodic Oscillation in the Kepler Light Curve of an Active Galaxy. Astrophys. J. 2018, 860, L10. [Google Scholar] [CrossRef] [Green Version]
  65. Ackermann, M.; Ajello, M.; Albert, A.; Atwood, W.B.; Baldini, L.; Ballet, J.; Barbiellini, G.; Bastieri, D.; Becerra Gonzalez, J.; Bellazzini, R.; et al. Multiwavelength Evidence for Quasi-Periodic Modulation in the Gamma-Ray Blazar PG 1553+113. Astrophys. J. Lett. 2015, 813, L41. [Google Scholar] [CrossRef] [Green Version]
  66. Caproni, A.; Abraham, Z.; Motter, J.C.; Monteiro, H. Jet Precession Driven by a Supermassive Black Hole Binary System in the BL Lac Object PG 1553+113. Astrophys. J. 2017, 851, L39. [Google Scholar] [CrossRef] [Green Version]
  67. Abraham, Z. Jet Precession in Binary Black Holes. Nat. Astron. 2018, 2, 443–444. [Google Scholar] [CrossRef]
  68. Sahakyan, N.; Zargaryan, D.; Baghmanyan, V. On the Gamma-Ray Emission from 3C 120. Astron. Astrophys. 2015, 574, A88. [Google Scholar] [CrossRef] [Green Version]
  69. Tanaka, Y.T.; Doi, A.; Inoue, Y.; Cheung, C.C.; Stawarz, L.; Fukazawa, Y.; Gurwell, M.A.; Tahara, M.; Kataoka, J.; Itoh, R. Six Years of Fermi-LAT and Multi-Wavelength Monitoring of the Broad-Line Radio Galaxy 3c 120: Jet Dissipation At Sub-Parsec Scales from the Central Engine. Astrophys. J. Lett. 2015, 799, L18. [Google Scholar] [CrossRef] [Green Version]
  70. Wiita, P.J. Active Galactic Nuclei. I. Observations and Fundamental Interpretations. Phys. Rep. 1985, 123, 117–213. [Google Scholar] [CrossRef]
  71. Gupta, A.C.; Srivastava, A.K.; Wiita, P.J. Periodic Oscillations in the Intra-Day Optical Light Curves of the Blazar S5 0716+714. Astrophys. J. 2009, 690, 216–223. [Google Scholar] [CrossRef] [Green Version]
  72. Thorne, K.S. Disk-Accretion onto a Black Hole. II. Evolution of the Hole. Astrophys. J. 1974, 191, 507–520. [Google Scholar] [CrossRef]
  73. Pan, H.-W.; Yuan, W.; Yao, S.; Zhou, X.-L.; Liu, B.; Zhou, H.; Zhang, S.-N. Detection of a Possible X-ray Quasi-Periodic Oscillation in the Active Galactic Nucleus 1H 0707-495. Astrophys. J. Lett. 2016, 819, L19. [Google Scholar] [CrossRef]
  74. Lohfink, A.M.; Reynolds, C.S.; Jorstad, S.G.; Marscher, A.P.; Miller, E.D.; Aller, H.; Aller, M.F.; Brenneman, L.W.; Fabian, A.C.; Miller, J.M.; et al. An X-ray View of the Jet Cycle in the Radio-Loud AGN 3C120. Astrophys. J. 2013, 772, 83. [Google Scholar] [CrossRef]
Figure 1. Light curve in counts/sec for 3C 120 in the 3–79 keV band (bottom panel) while the one hour binned light curve is shown in the upper panel.
Galaxies 09 00020 g001
Figure 2. (a) DACF of the source; (b) LSP with a peak at a period of 156,250 s; (c) SF curve showing period at ∼154,800 s. The corresponding 1 σ , 2 σ or 3 σ confidence contours (see Section 3.5) are also added in the respective plots.
Galaxies 09 00020 g002
Figure 3. Fourier spectrum of 3C 120 in the 3–79 keV band. The red curve (dotted line) represents the best-fit power-law model, pink line (dash-dot) denotes the expected Poisson level, black line (solid line) gives the 95% confidence level while green (dashed line) represents the 99.73% confidence level. The arrow points towards the QPO signal.
Galaxies 09 00020 g003
Figure 4. Folded 3–79 keV light curve with a period = 143,000 s and the best-fit sinusoidal curve in red solid line.
Galaxies 09 00020 g004
Figure 5. Updated version of Figure 1 from [22] describing relationship between QPO frequency and BH mass. The solid line represents the model f(Hz) = 1862(M B H /M ) given by [26]. Non-AGN sources are displayed with blue circles, and AGN sources with significant QPOs are shown with black triangles. Two significant QPOs for 1H 0707–495 [55] are displayed as (1) and (2). The position of 3C 120 in this diagram is shown as filled green square (A) with BH mass estimated assuming a Kerr BH, and (B) with BH mass estimated assuming a Schwarzschild BH.
Galaxies 09 00020 g005
Publisher’s Note: MDPI stays neutral with regard to jurisdictional claims in published maps and institutional affiliations.

