Conference Report

X-ray and Radio Observations of the Radio Relic Galaxy Clusters 1RXS J0603.3+4214 and RXC J1053.7+5453

by
Motokazu Takizawa
Department of Physics, Yamagata University, Kojirakawa-Machi 1-4-12, Yamagata, Yamagata 990-8560, Japan
Galaxies 2019, 7(1), 2; https://doi.org/10.3390/galaxies7010002
Submission received: 29 September 2018 / Revised: 17 December 2018 / Accepted: 17 December 2018 / Published: 22 December 2018
(This article belongs to the Special Issue The Power of Faraday Tomography)

Abstract

:
We study two galaxy clusters with radio relics, 1RXS J0603.3+4214 and RXC J1053.7+5453, through X-ray and radio observations. Radio relics are diffuse non-thermal radio sources found in outskirts of galaxy clusters. Because of their shape and location, they are thought to be related to cluster merger shocks. The galaxy cluster 1RXS J0603.3+4214 has a well-known linear-shape “toothbrush” radio relic. We investigate the temperature structure across the relic to constrain the Mach number of the associated shock. The results are compared with radio spectral results, which suggest that a simple diffusive shock acceleration model does not hold for this relic. The RXC J1053.7+5453 harbors a standard arc-like relic. We also get the Mach number from the temperature profile. In addition, we found an edge-like structure in the X-ray image between the X-ray peak and relic. We investigate the density and temperature profiles across the edge and found that the structure is likely relevant to not a shock but a contact discontinuity.

1. Introduction

Some merging galaxy clusters have diffuse non-thermal radio emitting regions, which indicates that there are non-thermal electrons with GeV energy and magnetic fields of a μ G level in the intracluster medium (ICM) [1,2,3]. These radio-emitting regions are often classified into three categories: radio halos, radio mini halos, and radio relics, depending upon their locations, morphology, and sizes. Radio halos and mini halos are located near the cluster center and show a morphology similar to that of the thermal X-ray emission from the ICM. It is believed that they are related to ICM turbulence. On the other hand, radio relics are usually found in the outskirts of clusters and show an elongated arc-like shape. It is likely that they are associated with the merger shocks.
Mach numbers of the shocks relevant to the radio relics can be estimated in two independent ways. First, assuming that the non-thermal electrons are accelerated via a simple diffusive shock acceleration (DSA) model, the Mach number ( M Radio ) can be estimated from the integrated radio spectral index ( α int ) as follows:
M Radio 2 = 2 α int + 2 2 α int 2 .
Second, we can also estimate the Mach number ( M X ) from the temperature and/or density jumps of the ICM across the shock, which can be obtained from the X-ray observations. From Rankine-Hugoniot (RH) relations, we get
T 2 T 1 = 5 M X 4 + 14 M X 2 3 16 M X 2
ρ 2 ρ 1 = 4 M X 2 M X 2 + 3
where T 1 and T 2 ( ρ 1 and ρ 2 ) are the pre- and post-shock temperatures (densities), respectively, assuming that the specific heat ratio γ is 5 / 3 . In principle, both methods should provide us with consistent results if a simple DSA theory is valid. Thus, comparisons of radio results with X-ray results are useful to gain an insight on the particle acceleration processes of the radio relics [4]. However, it should be noted that the X-ray analysis may underestimate the Mach number due to projection effects, while the radio Mach number might be overestimated due to a Mach-number-dependent emissivity. Thus, some mismatch of the X-ray and radio Mach numbers is expected [5].
In this report, we present X-ray and radio results of two galaxy clusters with radio relics, 1RXS J0603.3+4214 and RXC J1053.7+5453, mainly based on two earlier publications [6,7]. The galaxy cluster 1RXS J0603.3+4214 harbors a radio relic with a peculiar linear shape, which is nicknamed “toothbrush.” On the other hand, a typical arc-like radio relic is found in RXC J1053.7+5453.

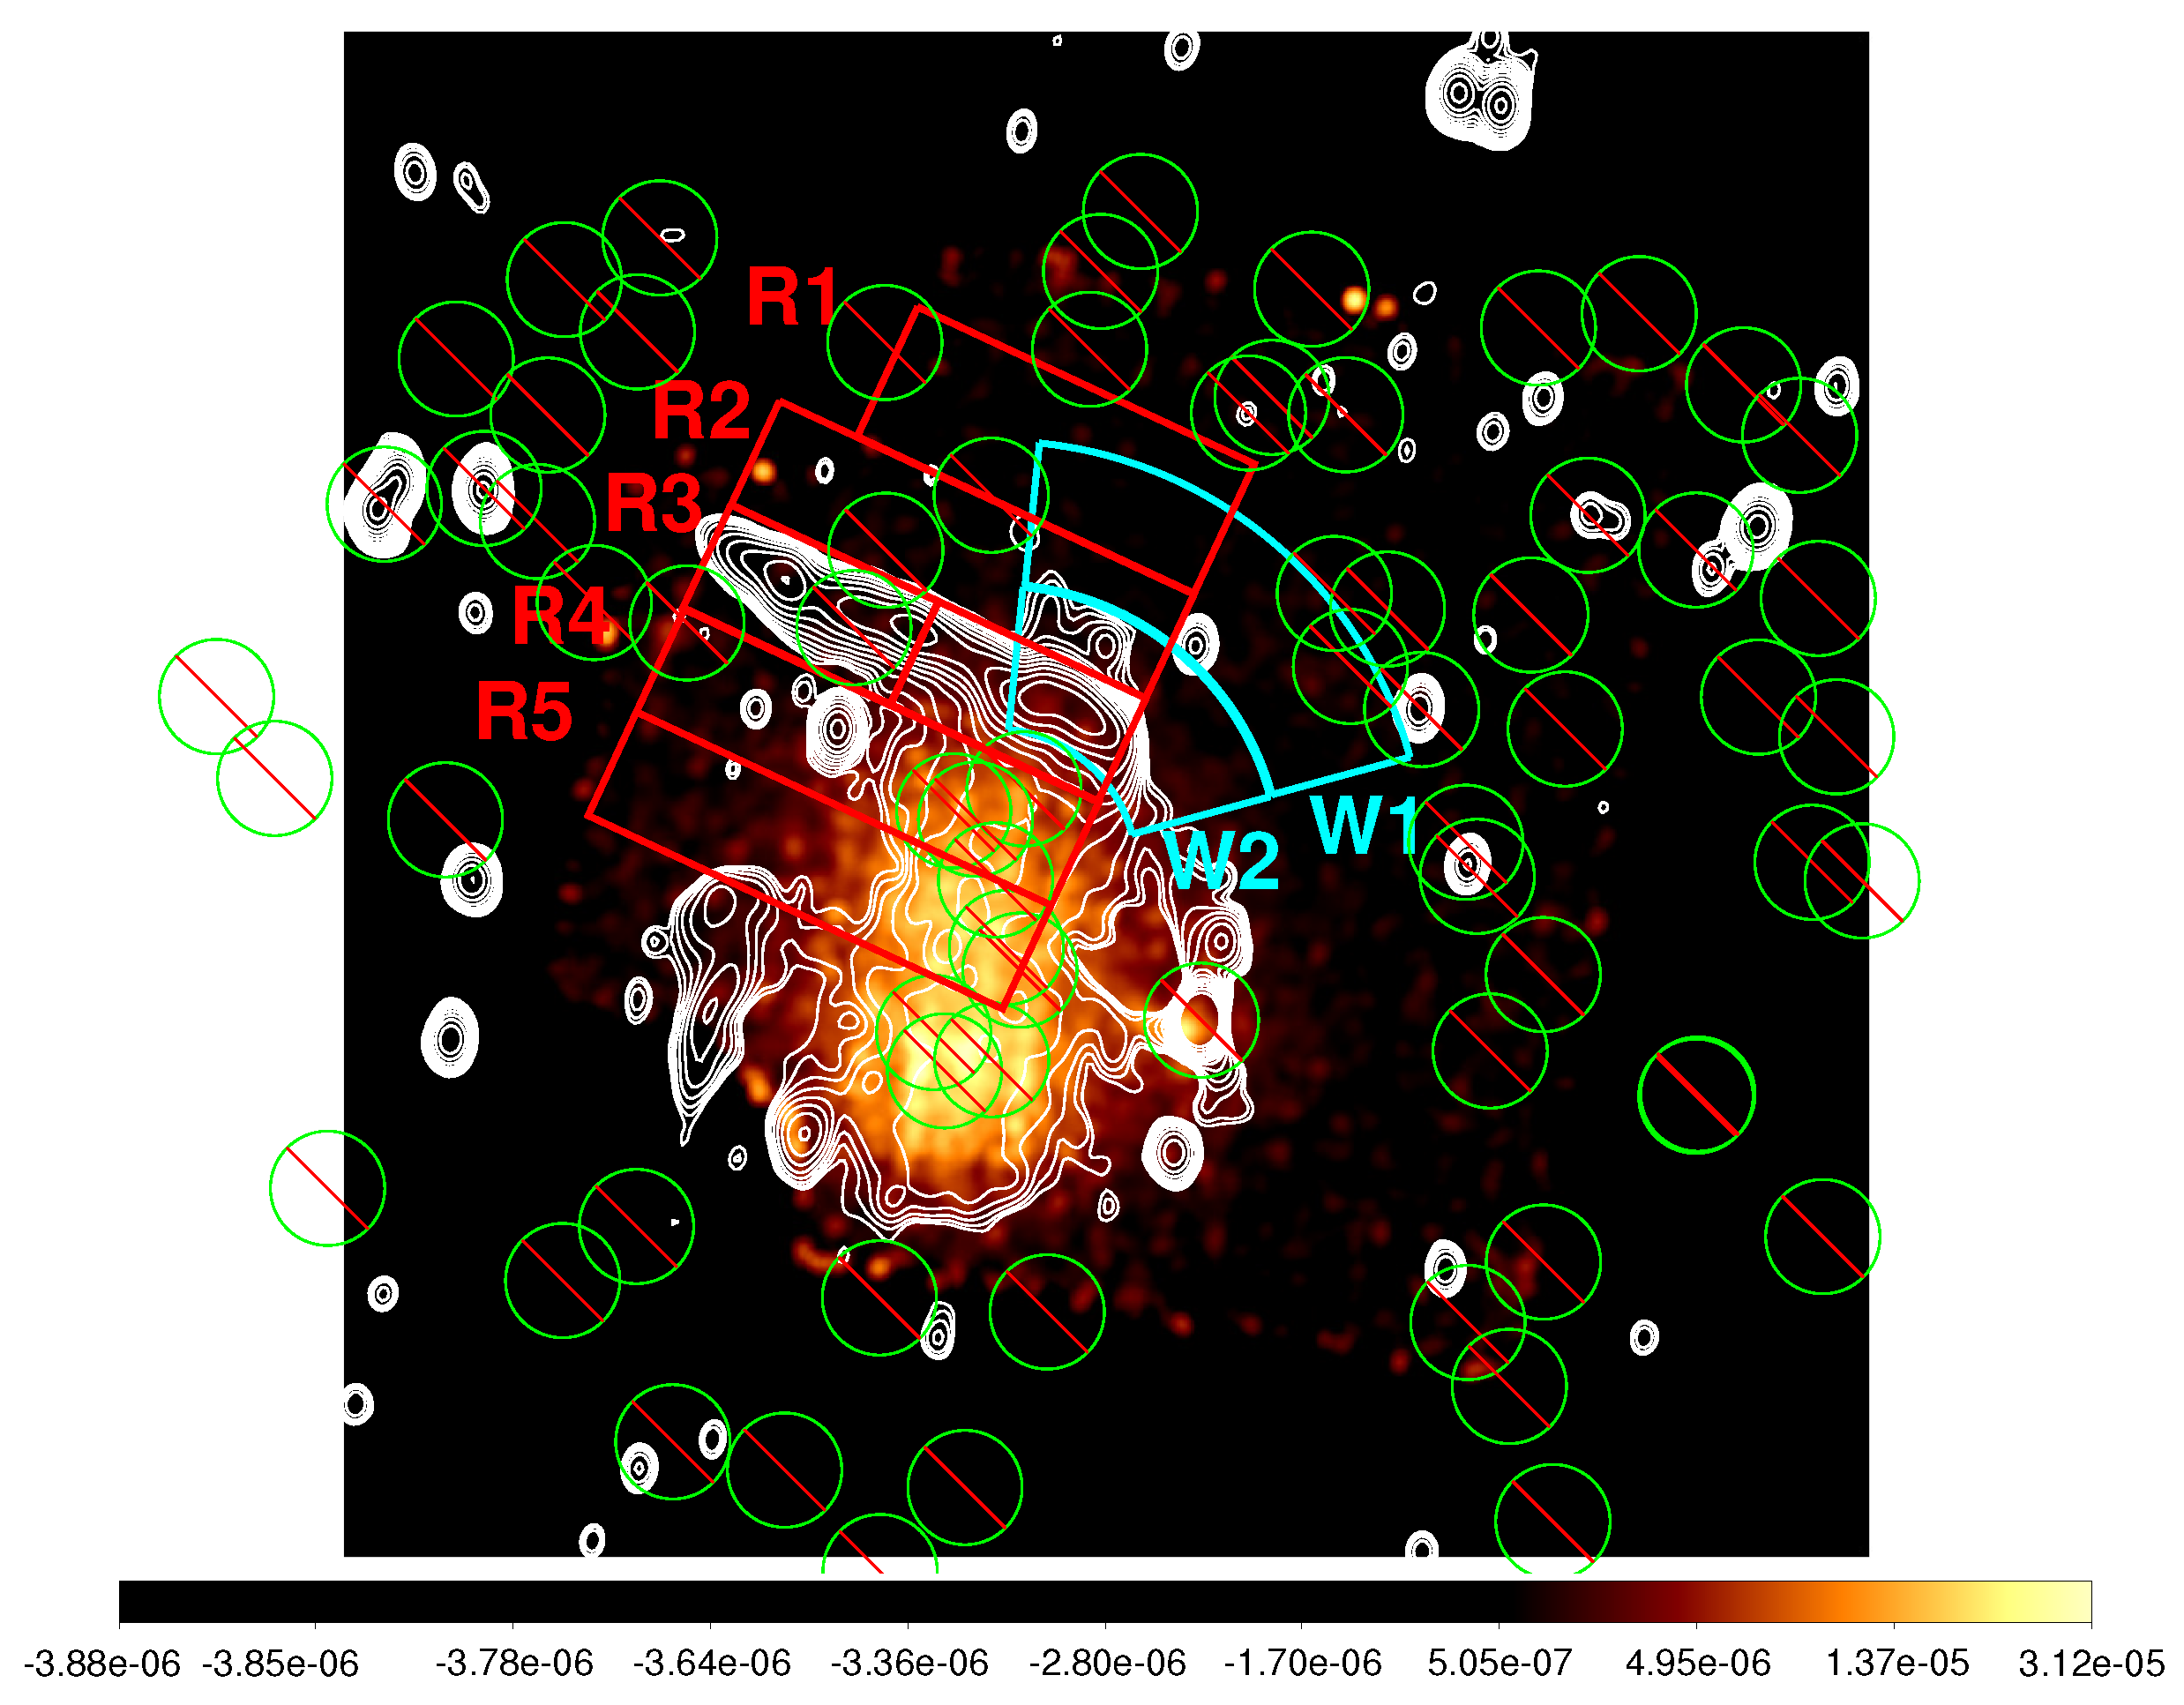
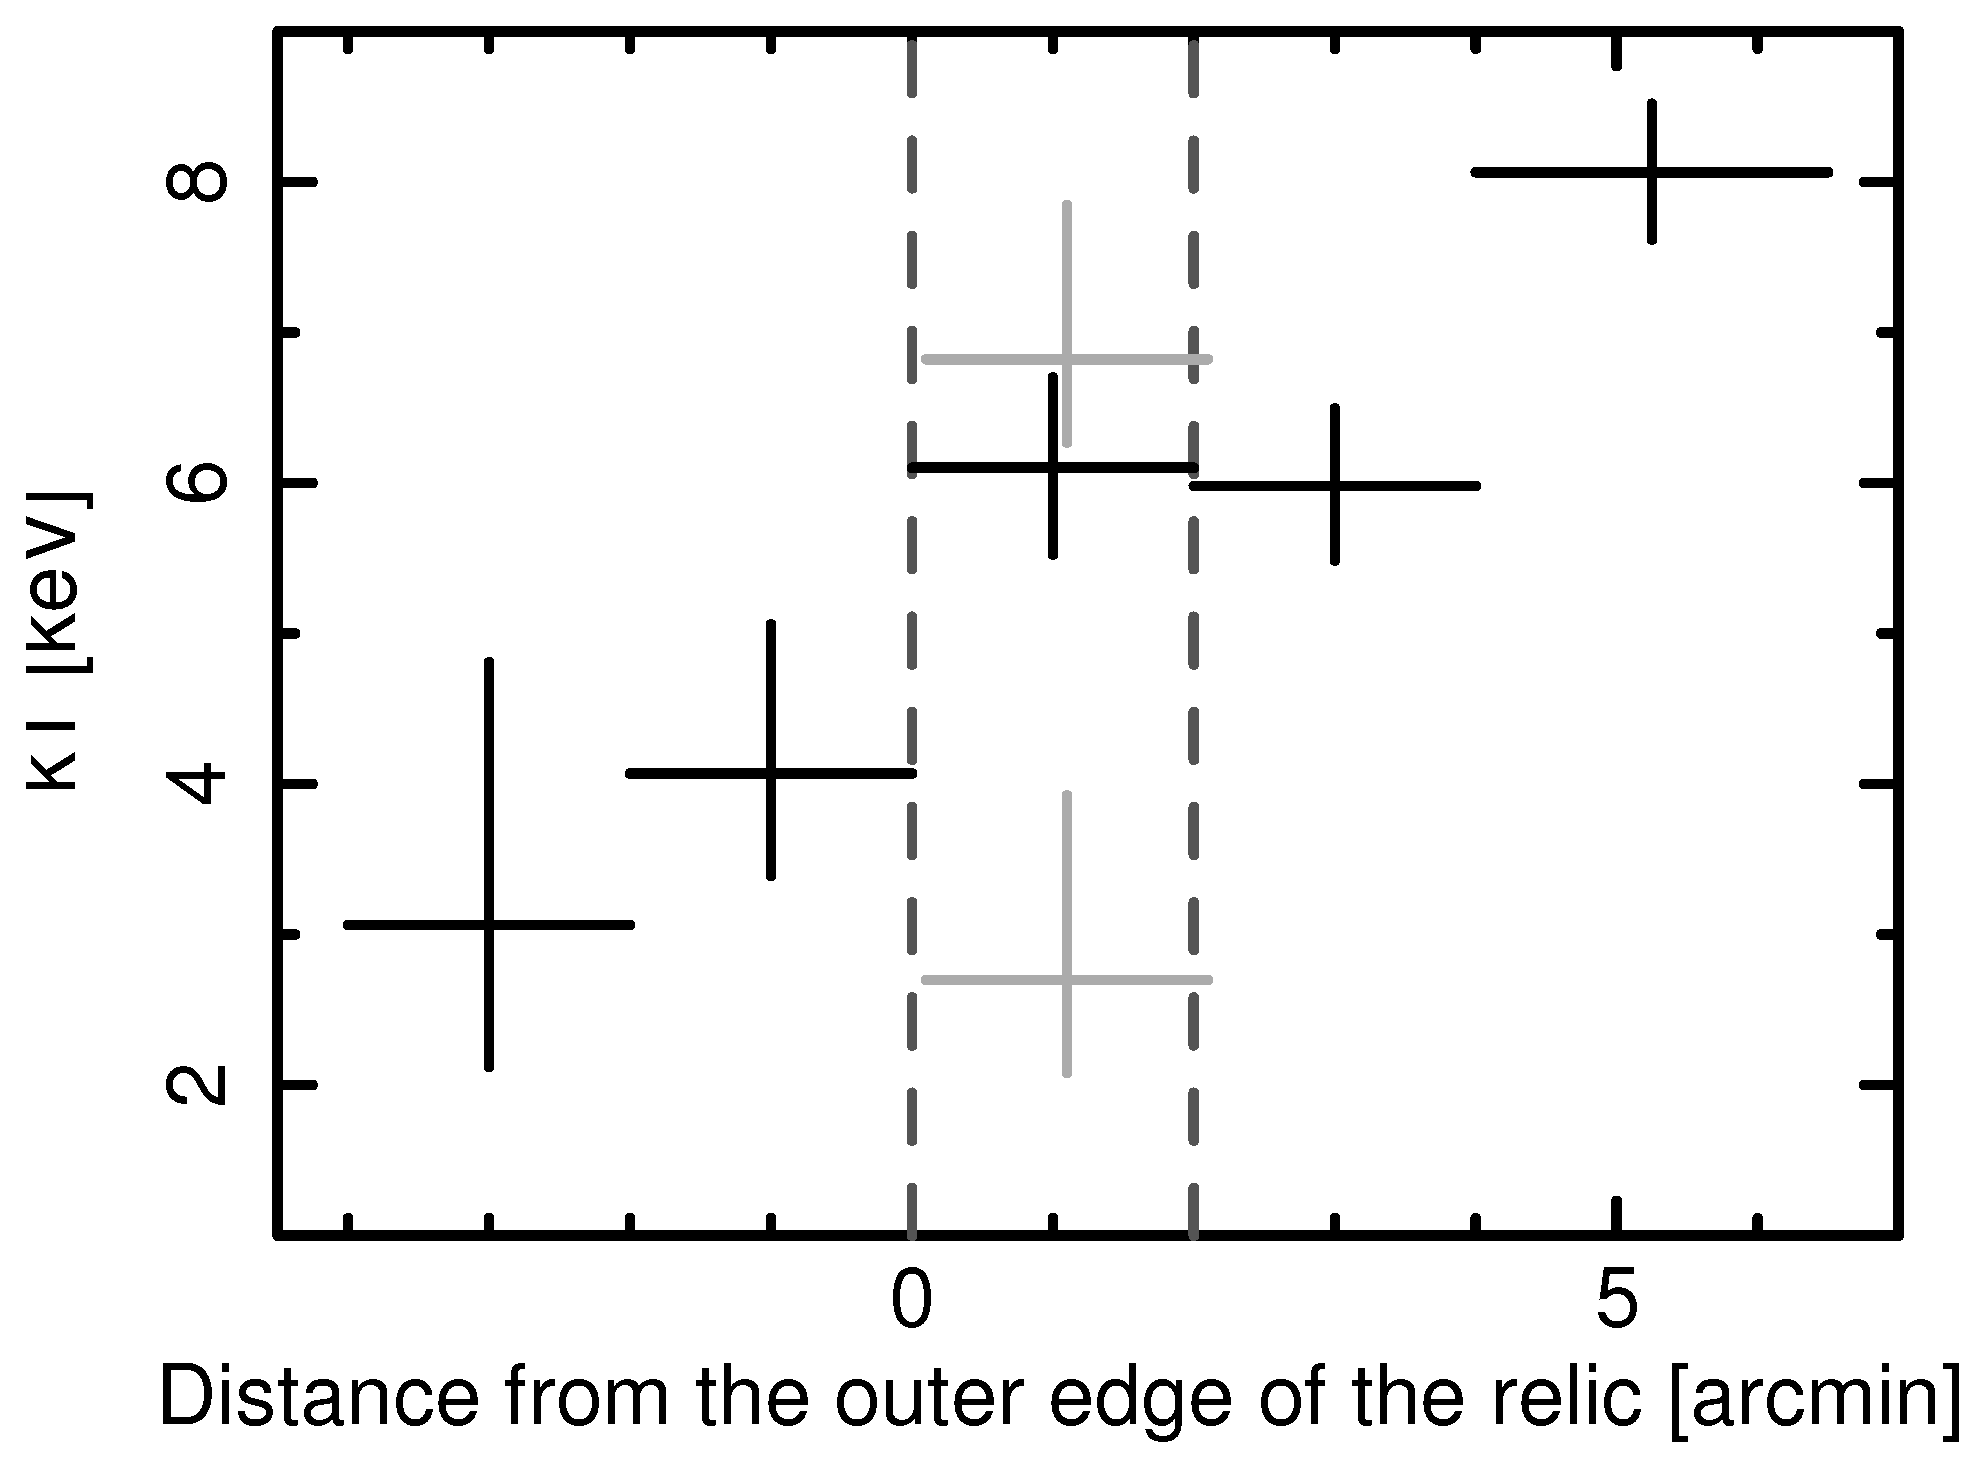
2. The 1RXS J0603.3+4214 Cluster with the “Toothbrush” Relic

A peculiar linear-shape radio relic is found in the galaxy cluster 1RXS J0603.3+4214, which is called the “toothbrush.” Relatively flat radio spectra have been reported for this relic [8,9,10]. Recent VLA results from [10] imply a rather high Mach number ( M radio = 3.78 0.2 + 0.3 ). On the other hand, surface brightness analyses of Chandra X-ray data indicate that the shock is just at the outer edge of the relic and that its Mach number is lower ( M X < 1.5 ) than the value estimated from the radio data [9], though former XMM results show that the shock is shifted outward from the relic outer edge [11].
We observed this cluster by Suzaku in October 2012. Detailed observational logs and analysis methods are given in [6]. We obtained the temperature profile across the relic to investigate the shock Mach number. Figure 1 shows the X-ray image by Suzaku XIS3 (colors) and 1.16–1.78 GHz radio contours by WSRT, where red rectangles are regions used to obtain the temperature profile across the relic. Figure 2 shows the obtained temperature profile, where the horizontal axis represents the angular distance from the relic outer edge. Inward and outward directions are positive and negative, respectively. The inner and outer edge positions of the relic are displayed in dotted lines. We estimate the shock Mach number from the temperature difference between regions R2 and R3 in Figure 1, using the RH relations. The resultant Mach number is 1.50 0.27 0.24 0.15 + 0.37 + 0.25 + 0.14 , where the first, second, and third errors are statistical, cosmic X-ray background systematic, and non-X-ray background systematic, respectively. This value is similar to those estimated from the X-ray surface brightness analysis of Chandra and XMM data [9,11]. The Mach number of the Chandra result is obtained from the density jump, which makes our Suzaku results based on the temperature measurements complementary. In addition, considering that the density determination through the deconvolution of the X-ray surface brightness is affected by the assumed geometrical line-of-sight structures, we emphasize that our result is more robust for the uncertainties of the line-of-sight structures. On the other hand, the results are inconsistent with the radio results, which makes the validity of a simple DSA model picture suspicious for this relic. A similar possibility is also pointed out in [9].

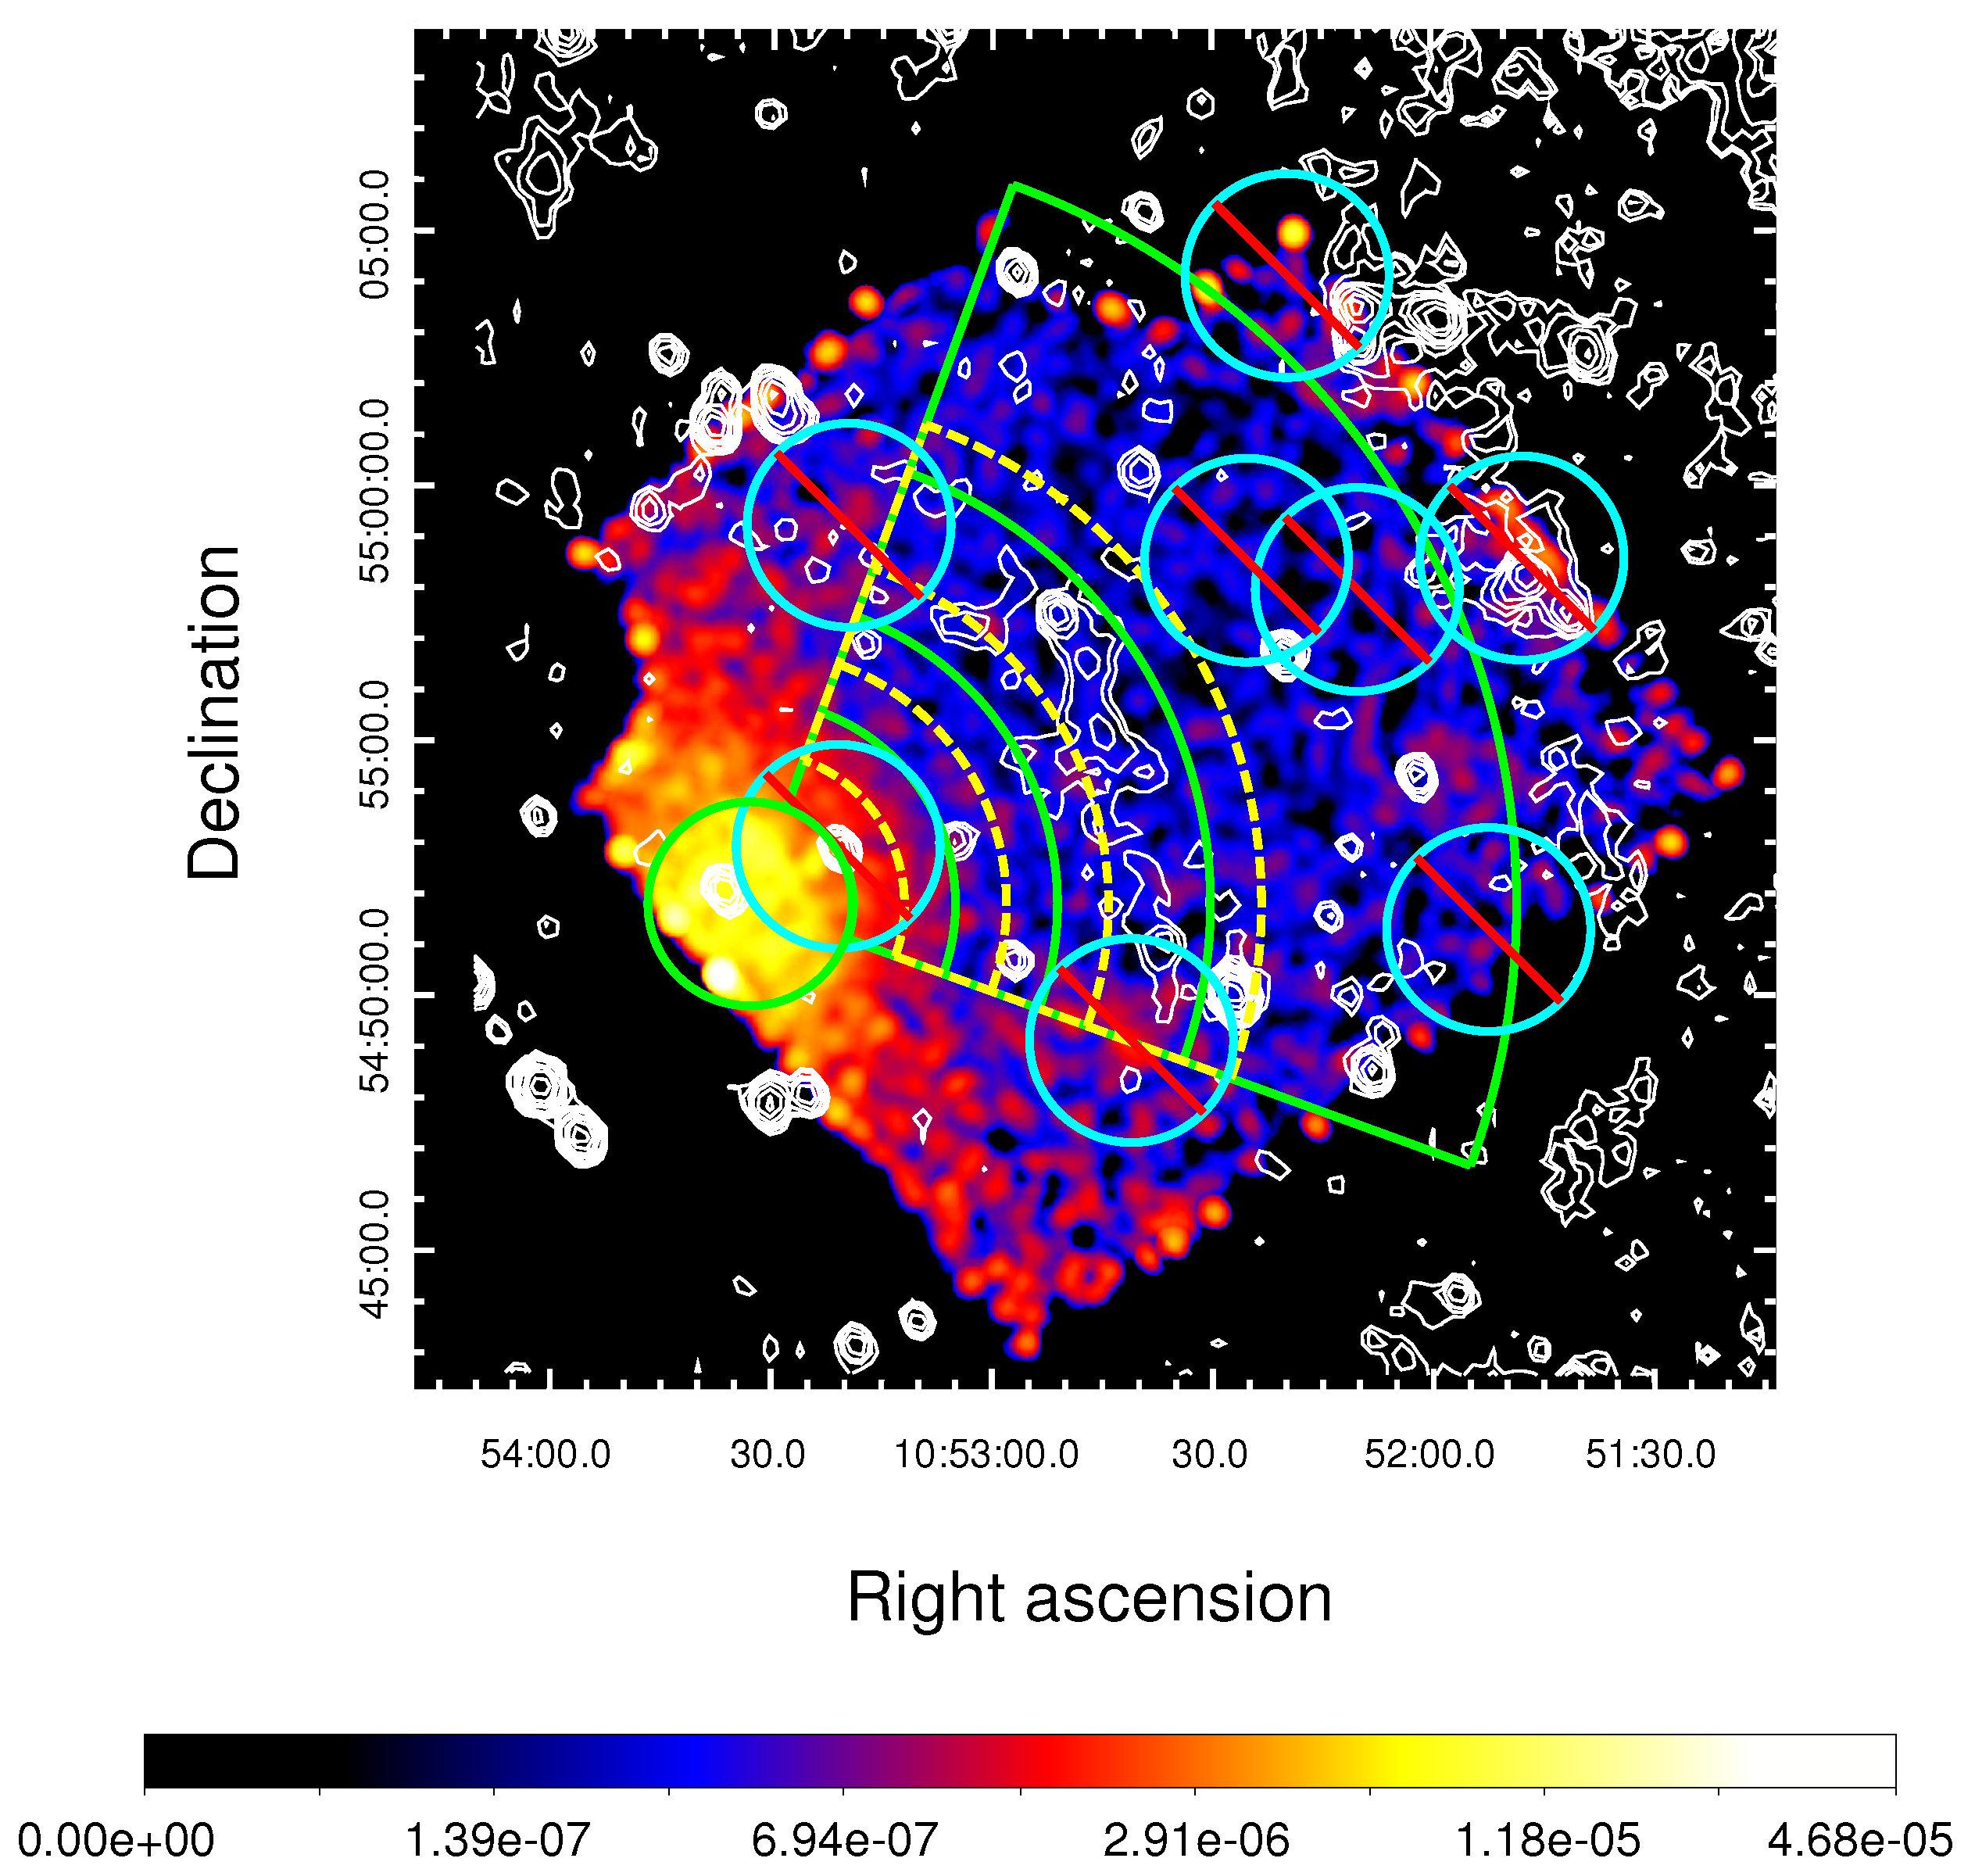
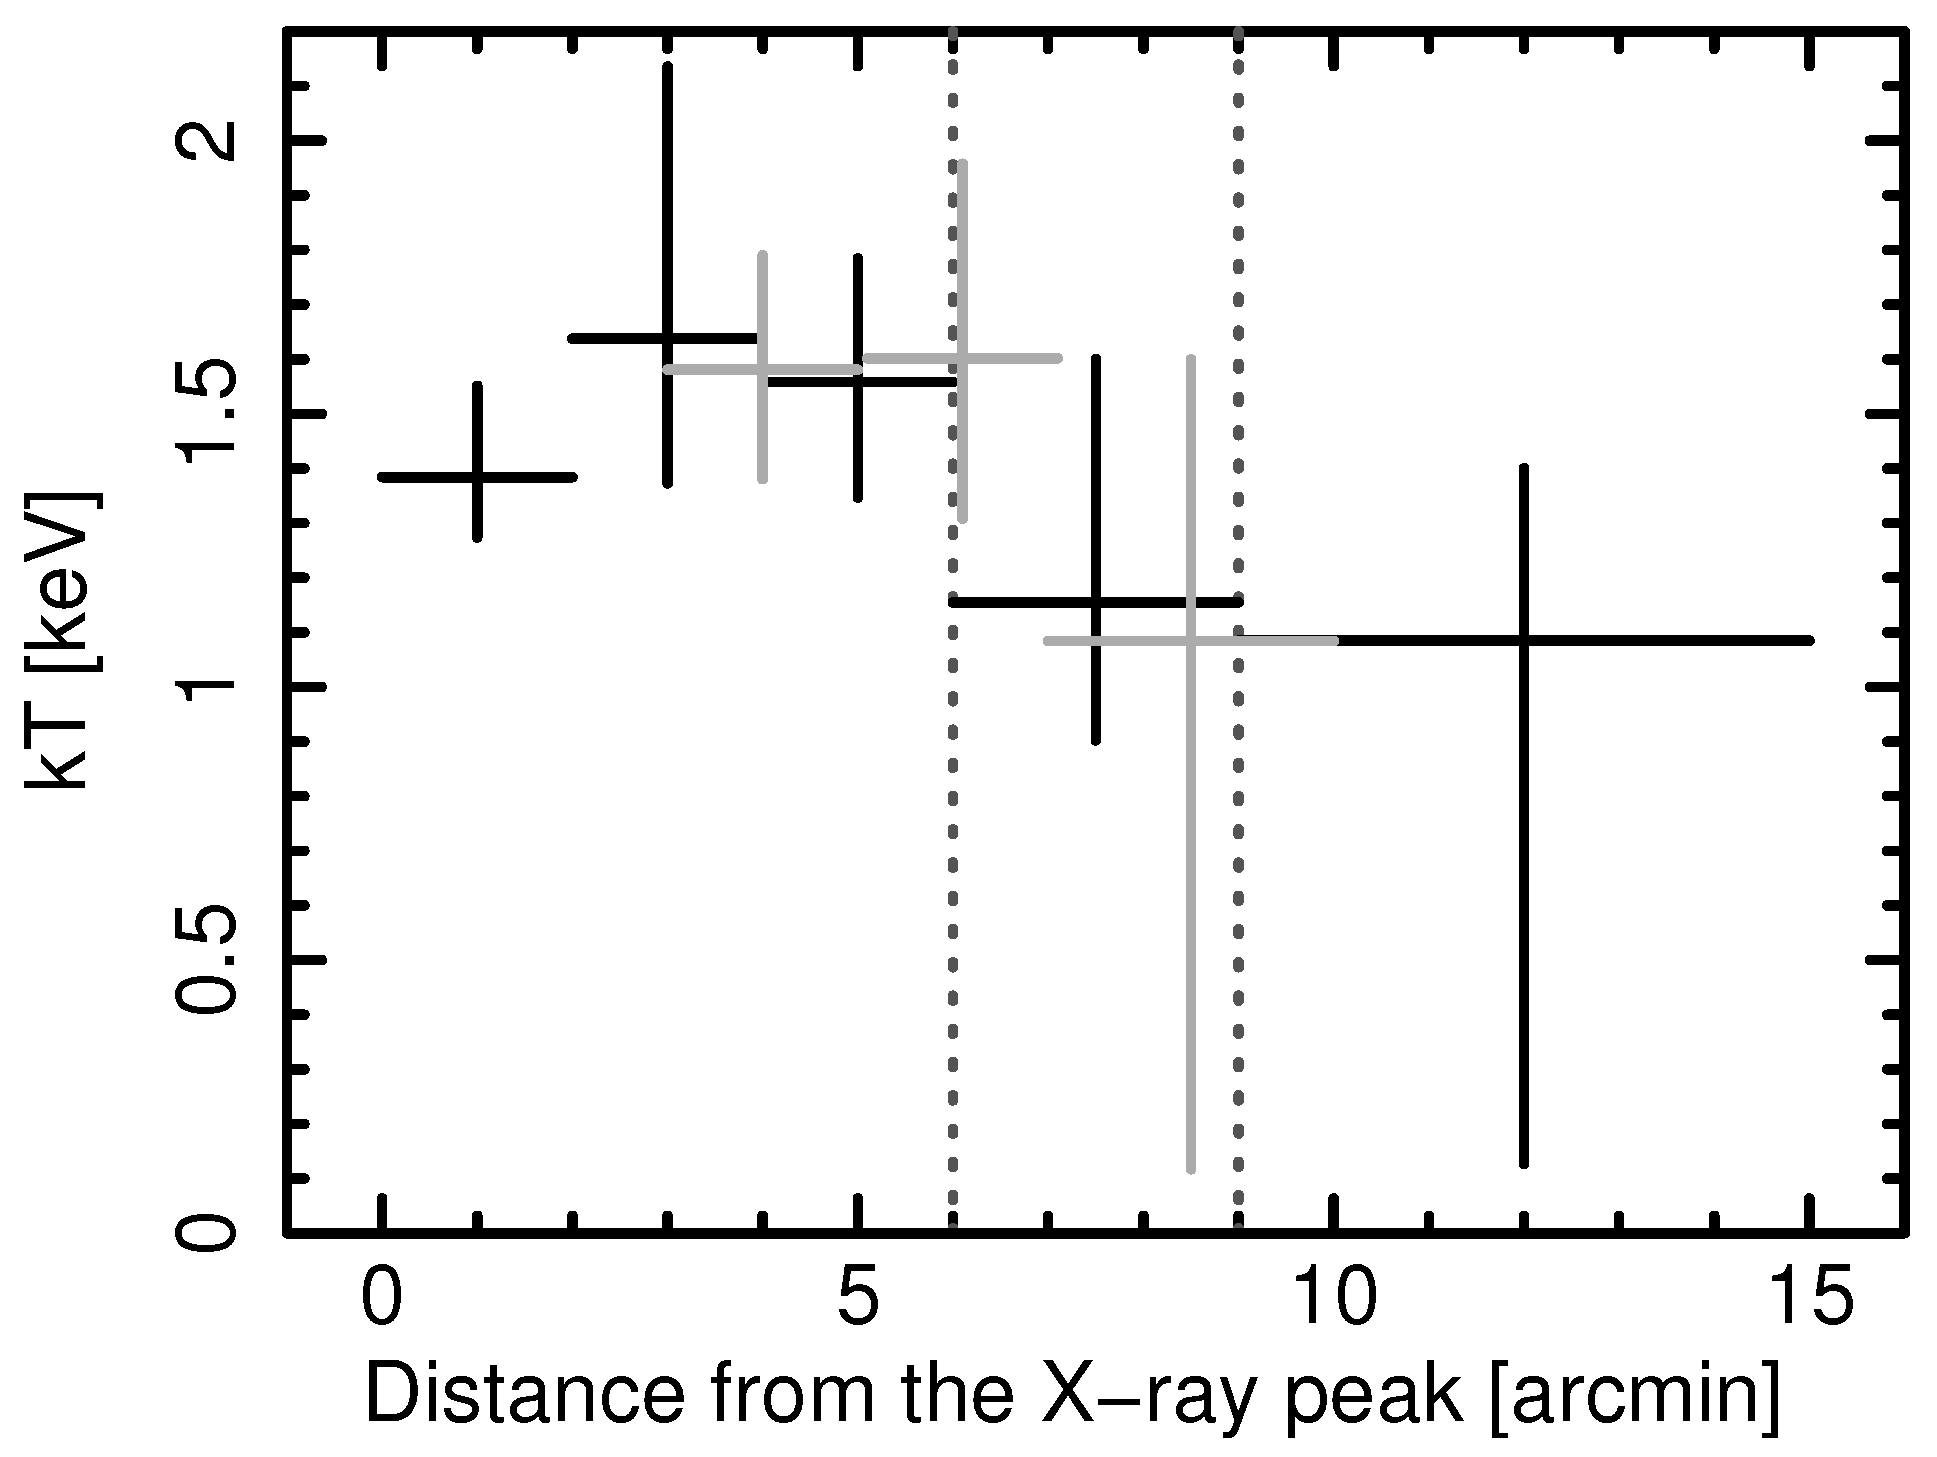
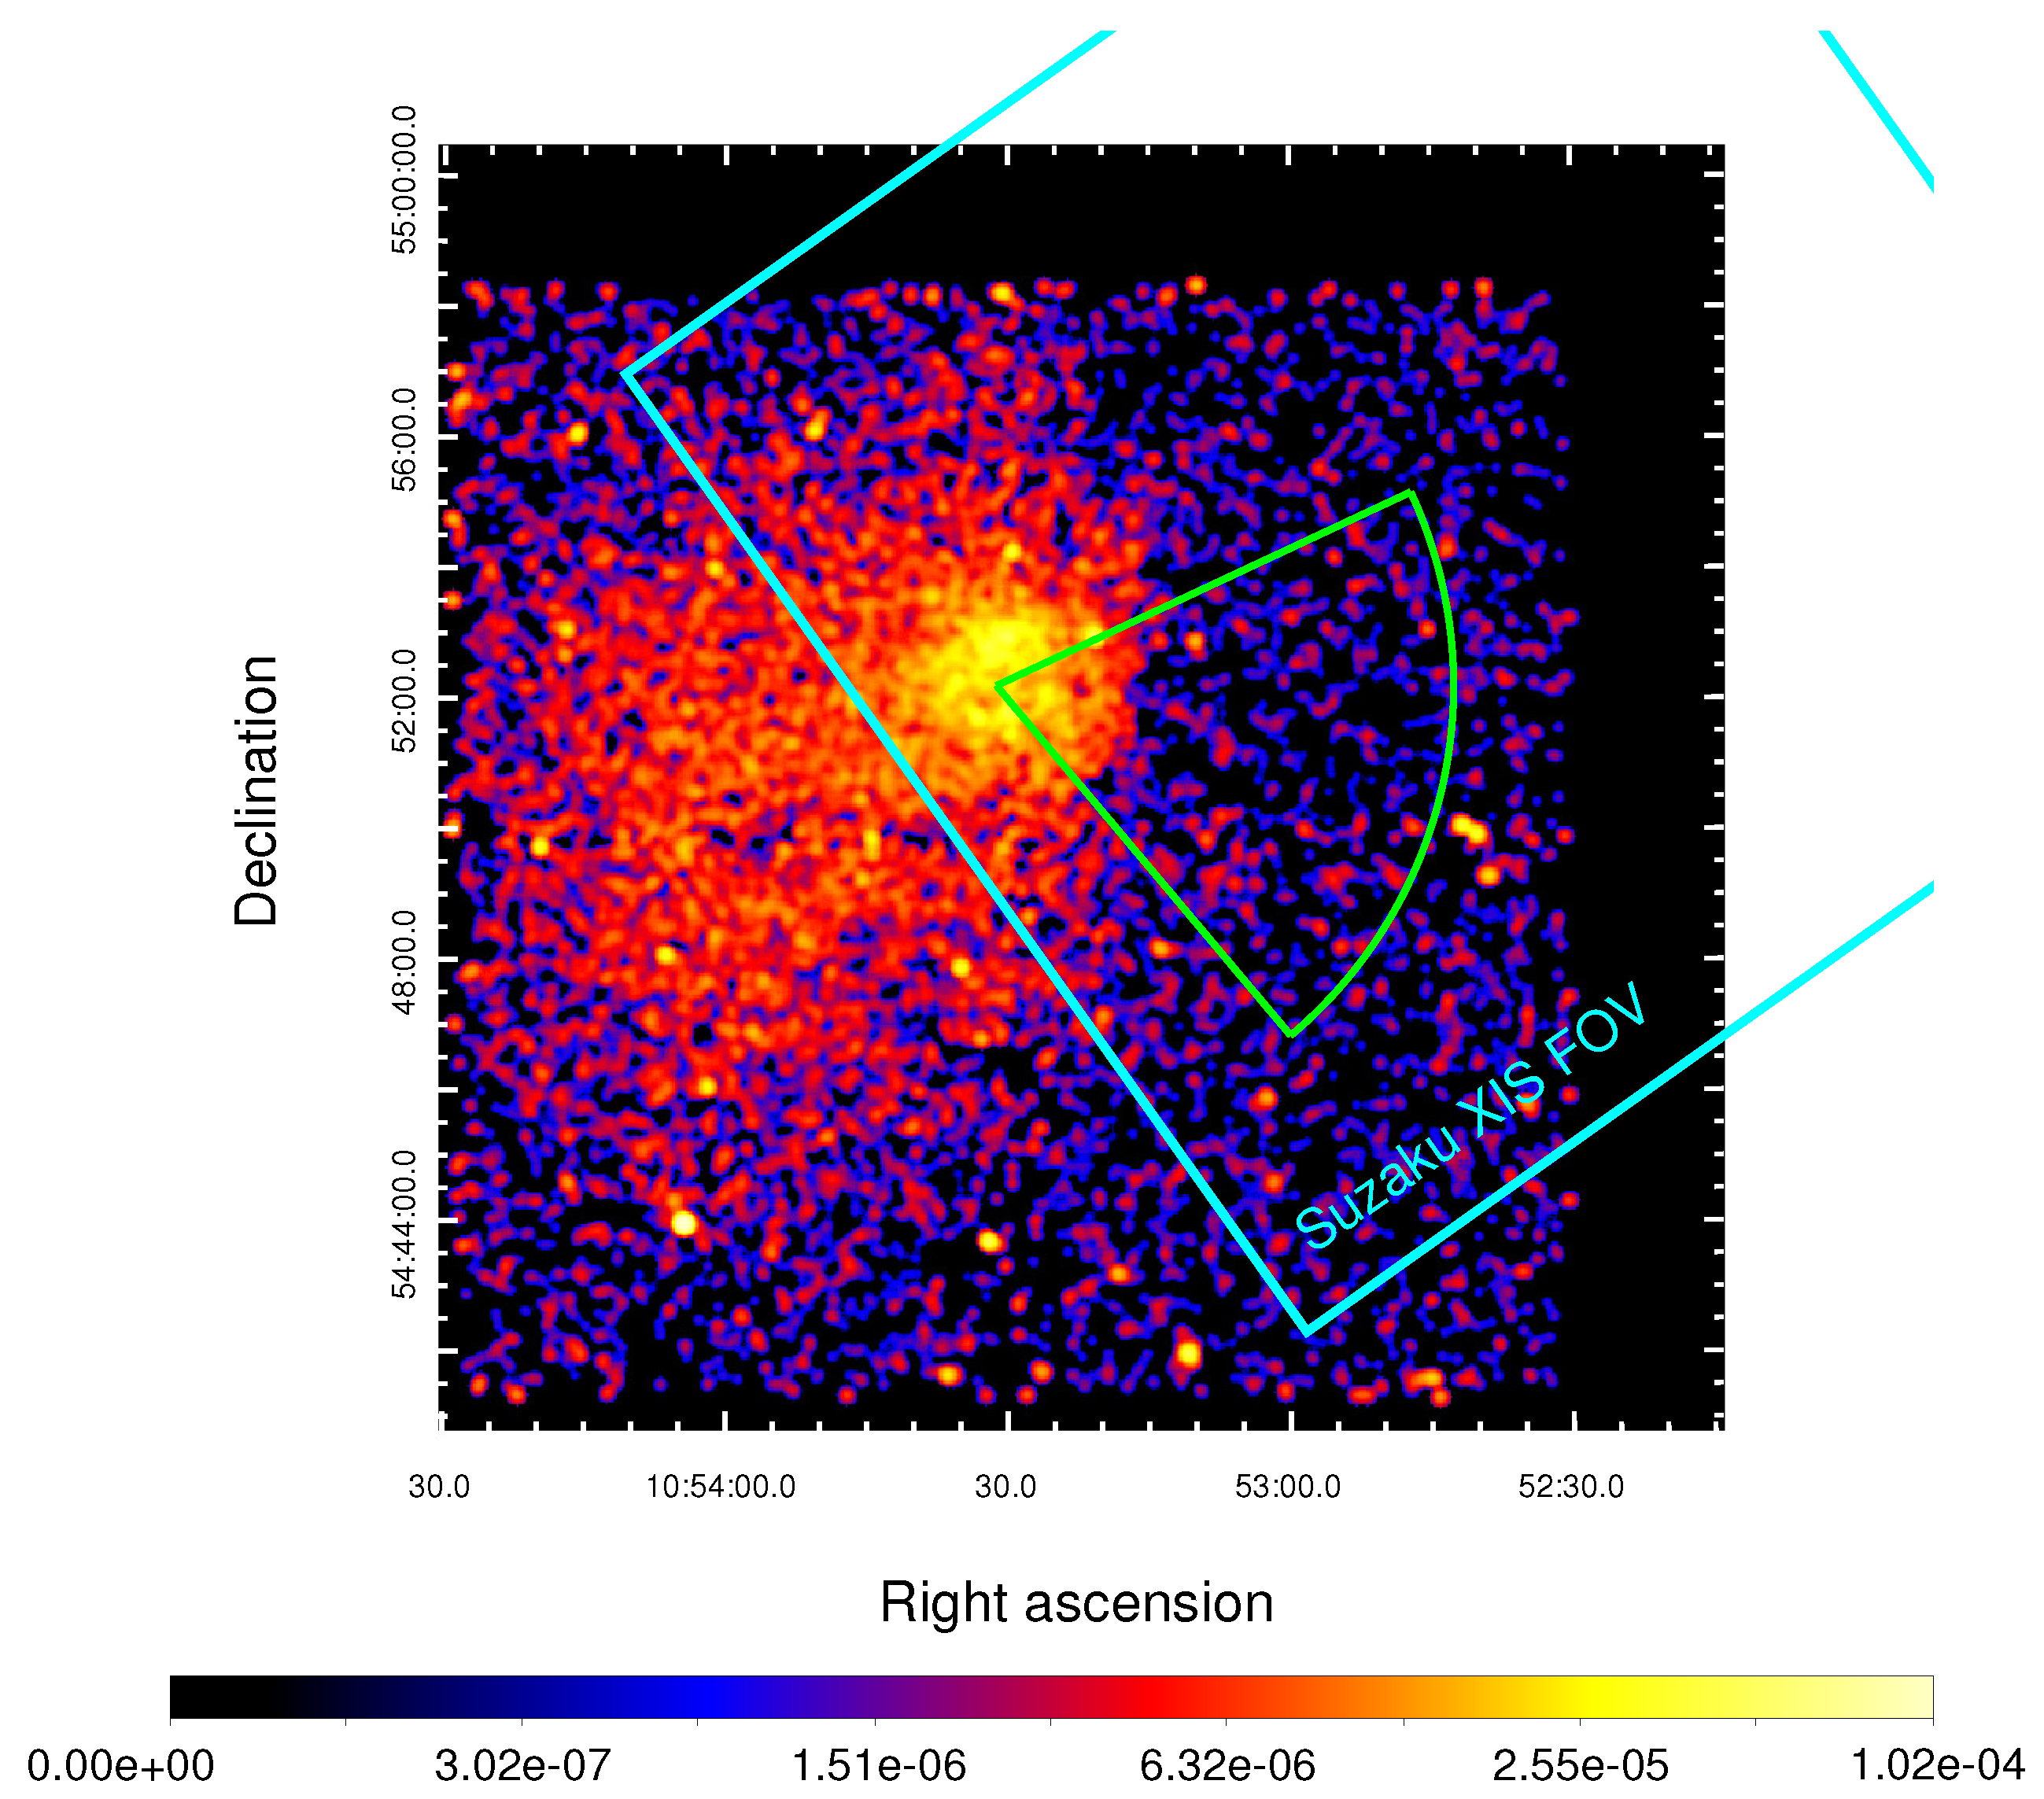
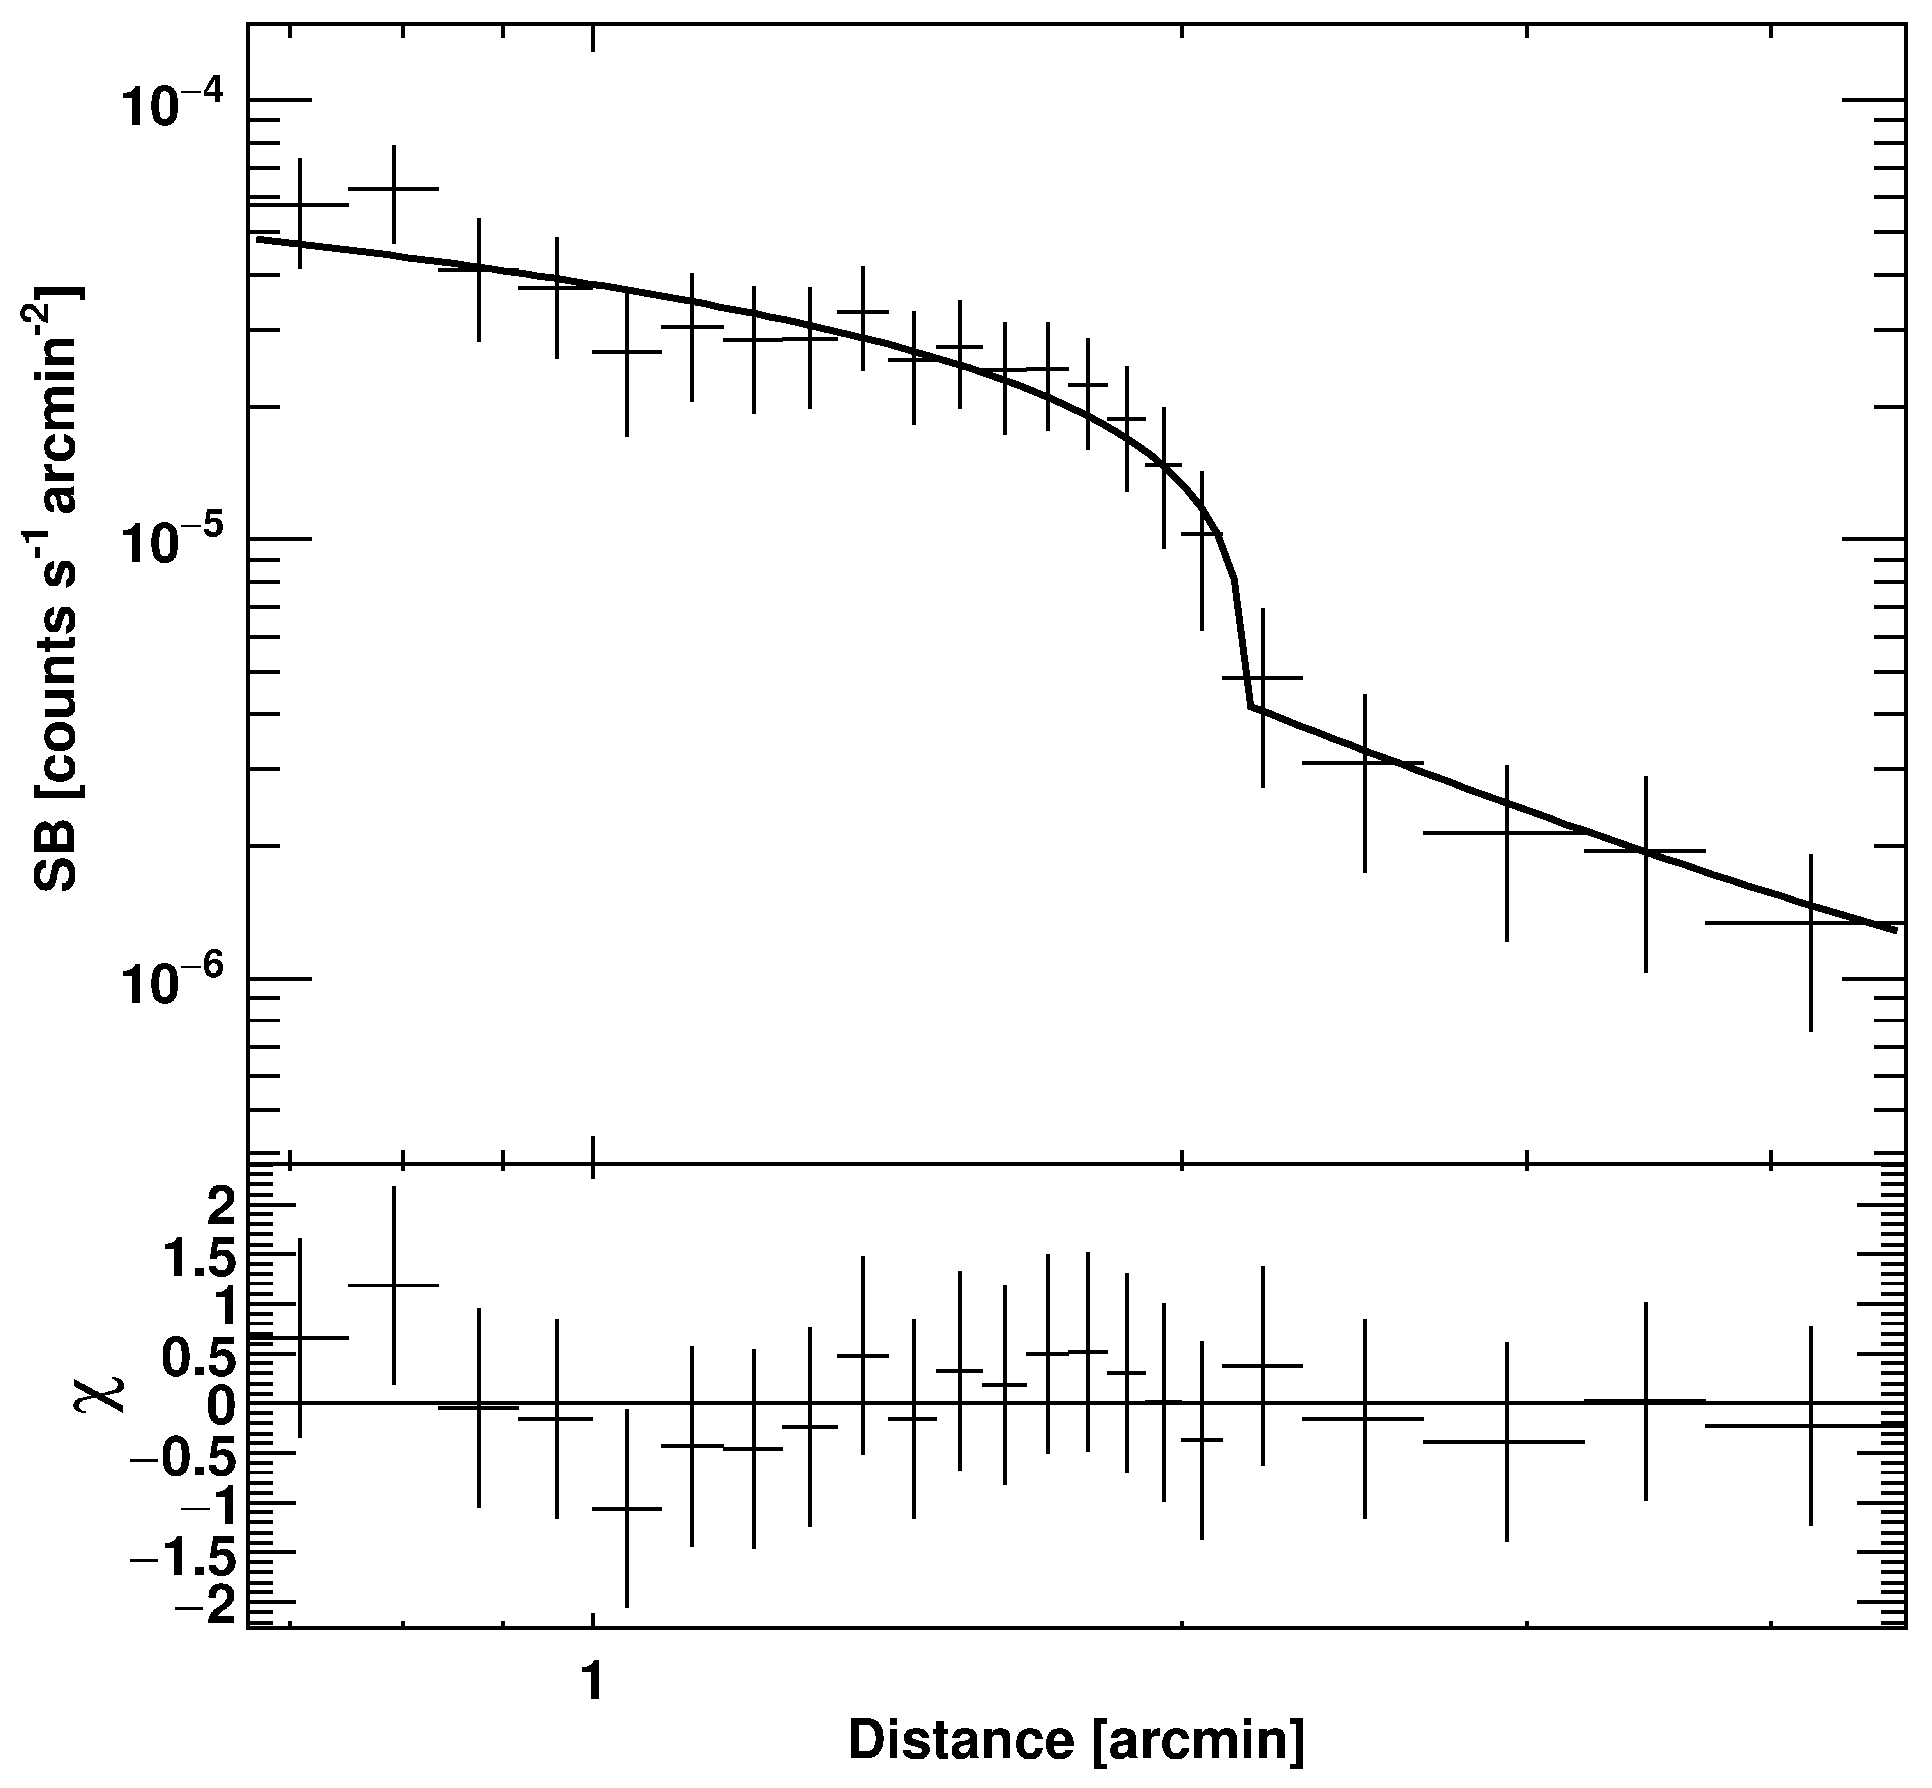
3. The RXC J1053.7+5453 Cluster

The RXC J1053.7+5453 cluster shows an elongated X-ray morphology with a typical arc-like radio relic [12]. Two subgroups are found in galaxy distribution [13]. No direct temperature measurements have been done for this cluster, whereas k T 3 keV is expected from the X-ray luminosity-temperature relation [14]. There has been no radio spectral information for the relic.
We observed this cluster with Suzaku in November 2014 and with Chandra in June 2013. The details of the observational logs and data analyses are presented in [7]. Figure 3 shows an X-ray image of the RXC J1053.7+5453 taken by Suzaku XIS1 in the 0.5–8.0 keV band (colors) overlaid with 1382 MHz radio contours. Green and yellow regions are used to produce the temperature profile so as to explore the possible shock associated with the relic. The obtained profile is shown in Figure 4, where the horizontal axis represents the angular distance from the X-ray peak. Again, the inner and outer edge positions of the relic are displayed in dotted lines. Applying the RH relation for this result, we obtained the Mach number as 1.4 0.91 1.34 0.04 + 0.48 + 0.14 + 0.03 , where the errors are written in the same way as in the case of the toothbrush relic. Therefore, even if a shock exits, a rather low Mach number is expected. Unfortunately, we do not have any information about the radio spectrum of the relic.
We found an edge-like structure between the X-ray peak and relic in the Chandra X-ray image (Figure 5), which might correspond to a shock or contact discontinuity. An X-ray surface brightness profile across the edge is made from the Chandra data of the green sector region in Figure 5, and we fit the profile with the density model as follows:
n ( r ) = n 1 r R f α 1 , r < R f n 1 1 C r R f α 2 , r > R f
where n ( r ) is the electron number density at r, n 1 is the density inside the density discontinuity, R f is the radius of the discontinuity location, and α 1 and α 2 are the powerlaw indexes of the inner and outer regions, respectively. C is the density contrast at the discontinuity. The profile and best fit model are shown in Figure 6, and we obtain C = 2.44 1.22 + 2.50 from the fitting. We also investigate the temperature difference across the edge from the Suzaku data and obtained the results T 1 / T 2 = 0.72 0.15 + 0.24 , where T 1 and T 2 denote the temperatures inside and outside the edge, respectively. This means that the denser region is cooler, and vice versa. Thus, it is unlikely that this structure is related to a shock. The pressure contrast can be estimated from these results and becomes P 1 / P 2 = ( n 1 T 1 ) / ( n 2 T 2 ) = 1.76 0.95 + 1.89 . Though the errors are relatively large, this value is consistent with unity, which suggests the edge is associated with a contact discontinuity. If we assume that a shock is located at the outer edge of the relic and that the X-ray peak is a remnant of the absorbed smaller cluster core, the relative locations among the X-ray peak, the possible contact discontinuity, and the relic suggest that this cluster is undergoing an east–west merger event. The overall X-ray morphology is also consistent with this picture.

4. Conclusions

We present here the X-ray and radio results of two galaxy clusters with radio relics, 1RXS J0603.3+4214 and RXC J1053.7+5453. We obtained the temperature profile across the “toothbrush” relic in the galaxy cluster 1RXS J0603.3+4214 and found an evident inconsistency between X-ray and radio Mach number estimates. This suggests that a simple DSA theory is invalid for the relic. For RXC J1053.7+5453, we measured the ICM temperature for the first time and estimated the Mach number of the possible shock associated with the relic. We found a surface brightness edge between the X-ray peak and the relic. We investigated the density and temperature structures around the edge, and it was found that the edge is not related to a shock but instead is likely to be a contact discontinuity. Considering the overall X-ray morphology, the location of the possible contact discontinuity, and the shape and location of the relic, it is likely that this cluster is undergoing an east–west merger event.

Funding

MT is supported in part by Japan Society for the Promotion of Science (JSPS) KAKENHI Grant Number 26400218.

Conflicts of Interest

The author declares no conflict of interest. The founding sponsors had no role in the design of the study; in the collection, analyses, or interpretation of data; in the writing of the manuscript; or in the decision to publish the results.

References

  1. Feretti, L.; Giovannini, G.; Govoni, F.; Murgia, M. Clusters of galaxies: Observational properties of the diffuse radio emission. Astron. Astrophys. Rev. 2012, 20, 54. [Google Scholar] [CrossRef]
  2. Brunetti, G.; Jones, T.W. Cosmic Rays in Galaxy Clusters and Their Nonthermal Emission. Int. J. Mod. Phys. D 2014, 23, 2330007. [Google Scholar] [CrossRef]
  3. Akahori, T.; Nakanishi, H.; Sofue, Y.; Fujita, Y.; Ichiki, K.; Ideguchi, S.; Kameya, O.; Kudoh, T.; Kudoh, Y.; Machida, M.; et al. Cosmic magnetism in centimeter- and meter-wavelength radio astronomy. Publ. Astron. Soc. Jpn. 2018, 70, R2. [Google Scholar] [CrossRef]
  4. Akamatsu, H.; Kawahara, H. Systematic X-Ray Analysis of Radio Relic Clusters with Suzaku. Publ. Astron. Soc. Jpn. 2013, 65, 16. [Google Scholar] [CrossRef]
  5. Hong, S.E.; Kang, H.; Ryu, D. Radio and X-Ray Shocks in Clusters of Galaxies. Astrophys. J. 2015, 812, 49. [Google Scholar] [CrossRef]
  6. Itahana, M.; Takizawa, M.; Akamatsu, H.; Ohashi, T.; Ishisaki, Y.; Kawahara, H.; van Weeren, R.J. Suzaku observations of the galaxy cluster 1RXS J0603.3+4214: Implications of particle acceleration processes in the “Toothbrush” radio relic. Publ. Astron. Soc. Jpn. 2015, 67, 113. [Google Scholar] [CrossRef] [Green Version]
  7. Itahana, M.; Takizawa, M.; Akamatsu, H.; van Weeren, R.J.; Kawahara, H.; Fukazawa, Y.; Kaastra, J.S.; Nakazawa, K.; Ohashi, T.; Ota, N.; et al. Suzaku and Chandra observations of the galaxy cluster RXC J1053.7+5453 with a radio relic. Publ. Astron. Soc. Jpn. 2017, 69, 88. [Google Scholar] [CrossRef]
  8. Van Weeren, R.; Röttgering, H.J.A.; Intema, H.T.; Rudnick, L.; Brüggen, M.; Hoeft, M.; Oonk, J.B.R. The “toothbrush-relic”: Evidence for a coherent linear 2-Mpc scale shock wave in a massive merging galaxy cluster? Astron. Astrophys. 2012, 546, A124. [Google Scholar] [CrossRef]
  9. Van Weeren, R.; Brunetti, G.; Brüggen, M.; Andrade-Santos, F.; Ogrean, G.A.; Williams, W.L.; Röttgering, H.J.A.; Dawson, W.A.; Forman, W.R.; De Gasperin, F.; et al. LOFAR, VLA, and Chandra Observations of the Toothbrush Galaxy Cluster. Astrophys. J. 2016, 818, 204. [Google Scholar] [CrossRef]
  10. Rajpurohit, K.; Hoeft, M.; Van Weeren, R.J.; Rudnick, L.; Röttgering, H.J.A.; Forman, W.R.; Brüggen, M.; Croston, J.H.; Andrade-Santos, F.; Dawson, W.A.; et al. Deep VLA Observations of the Cluster 1RXS J0603.3+4214 in the Frequency Range of 1–2 GHz. Astrophys. J. 2018, 852, 65. [Google Scholar] [CrossRef] [Green Version]
  11. Ogrean, G.A.; Brüggen, M.; van Weeren, R.J.; Röttgering, H.; Croston, J.H.; Hoeft, M. Challenges to our understanding of radio relics: X-ray observations of the Toothbrush cluster. Mon. Not. R. Astron. Soc. 2012, 433, 812–824. [Google Scholar] [CrossRef]
  12. Van Weeren, R.; Brüggen, M.; Röttgering, H.J.A.; Hoeft, M.; Nuza, S.E.; Intema, H.T. Radio continuum observations of new radio halos and relics from the NVSS and WENSS surveys. Relic orientations, cluster X-ray luminosity, and redshift distributions. Astron. Astrophys. 2011, 533, A35. [Google Scholar] [CrossRef]
  13. Aguerri, J.A.L.; Sánchez-Janssen, R.; Muñoz-Tuñón, C. A study of catalogued nearby galaxy clusters in the SDSS-DR4. I. Cluster global properties. Astron. Astrophys. 2007, 471, 17–29. [Google Scholar] [CrossRef]
  14. Ebeling, H.; Edge, A.C.; Böhringer, H.; Allen, S.W.; Crawford, C.S.; Fabian, A.C.; Voges, W.; Huchra, J.P. The ROSAT Brightest Cluster Sample—I. The compilation of the sample and the cluster log N-log S distribution. Mon. Not. R. Astron. Soc. 1998, 301, 881–914. [Google Scholar] [CrossRef]
Figure 1. An X-ray image of 1RXS J0603.3+4214 taken by Suzaku XIS3 in the 0.5–8.0 keV band (colors) overlaid with 1.16–1.78 GHz radio contours by WSRT from [6]. Red boxes are regions used to produce the temperature profile across the relic.
Galaxies 07 00002 g001
Figure 2. The temperature profile of the 1RXS J0603.3+4214 across the “toothbrush” relic from [6]. The horizontal axis represents the angular distance from the relic outer edge. Inward and outward directions are positive and negative, respectively. The inner and outer edge positions of the relic are displayed in dotted lines. Light gray crosses show results when Region R3 in Figure 1 is divided into eastern and western regions.
Galaxies 07 00002 g002
Figure 3. An X-ray image of the RXC J1053.7+5453 taken by Suzaku XIS1 in the 0.5–8.0 keV band (colors) overlaid with 1382 MHz radio contours from [7]. Green and yellow regions are used to produce the temperature profile across the relic.
Galaxies 07 00002 g003
Figure 4. The temperature profile of the RXC J1053.7+5453 across the relic from [7]. The horizontal axis represents the angular distance from the X-ray peak. The inner and outer edge positions of the relic are displayed in dotted lines. Black and light gray crosses show the results from green and yellow regions in Figure 3, respectively.
Galaxies 07 00002 g004
Figure 5. An X-ray image of the RXC J1053.7+5453 taken by Chandra in the 0.5–2.0 keV band from [7]. The green sector region is utilized to make the surface brightness profile across the edge.
Galaxies 07 00002 g005
Figure 6. The surface brightness profile across the surface brightness edge of the RXC J1053.7+5453 from [7]. The best fit model written in the text is displayed with the black line.
Galaxies 07 00002 g006

