Fermi: Monitoring the Gamma-Ray Universe


Abstract
1. Introduction
2. Fermi Gamma-Ray Space Telescope
2.1. Large Area Telescope (LAT)
2.2. Gamma-Ray Burst Monitor (GBM)
2.3. Fermi Operations
3. Sharing Fermi Results
3.1. Catalogs
- Third Fermi GBM Gamma-Ray Burst Catalog [6]. This catalog covers the first six years of the mission and presents GBM results from 1405 -ray bursts (GRBs).
- Third Fermi LAT Catalog [7]. The 3FGL catalog includes LAT results from the first four years of the mission, with 3033 -ray sources.
- GBM Time-resolved Spectral Catalog of GRBs [8]. Using the first four years of GBM data, this catalog presents time-resolved spectra of 81 GRBs.
- GBM Magnetar Catalog [9]. This catalog presents five years of GBM data on flares from high-magnetic-field neutron stars (magnetars).
- GBM X-ray Burst Catalog [10]. In its first three years, GBM detected 1084 X-ray bursts.
- Third Fermi LAT Hard Sources Catalog [11]. This LAT catalog of sources seen at energies above 10 GeV contains 1556 objects.
- GBM Catalog of Terrestrial Gamma-ray Flashes [12]. Over 4000 terrestrial -ray flashes (short bursts associated with thunderstorms) are reported in this catalog.
- Second LAT Catalog of Flaring Sources [13]. The Fermi All-sky Variability Analysis (FAVA) monitors the high-energy sky for flaring activity, using an aperture photometry method to compare the -ray sky at any time with the average sky over many years. In over seven years of observation, FAVA found 4547 such flares.
- LAT Supernova Remnant Catalog [14]. This catalog presents results for GeV emission from 30 supernova remnants.
- Third LAT Catalog of Active Galactic Nuclei [15]. The 3LAC catalog is a supplement to the 3FGL catalog, focused on the properties of the 1591 active galactic nuclei (AGN) seen at high Galactic latitudes.
- LAT Gamma-ray Burst Catalog [16]. In three years of observations, the LAT detected 35 GRBs, whose properties are described in this catalog.
- Second LAT Pulsar Catalog [17]. Properties of pulsed rays from 117 pulsars are summarized in this LAT catalog.
3.2. Online Resources
- Monitored Source List: https://fermi.gsfc.nasa.gov/ssc/data/access/lat/msl$_$lc/. A LAT automated analysis generates flux values for all sources whose daily -ray flux has exceeded 1 × 10⁻⁶ photons (E > 100 MeV) cm−2 s−1 at least once since the start of the Fermi mission. Although these are not publication-quality light curves, they provide useful monitors of past and current activity for these sources. Daily and weekly light curves are updated regularly. An example is shown in Figure 1.
- Public List of LAT-Detected Gamma-ray Pulsars: https://confluence.slac.stanford.edu/x/5Jl6Bg. Newly detected -ray pulsars are added to this list regularly. This page includes details and references for each of more than 200 known pulsars.
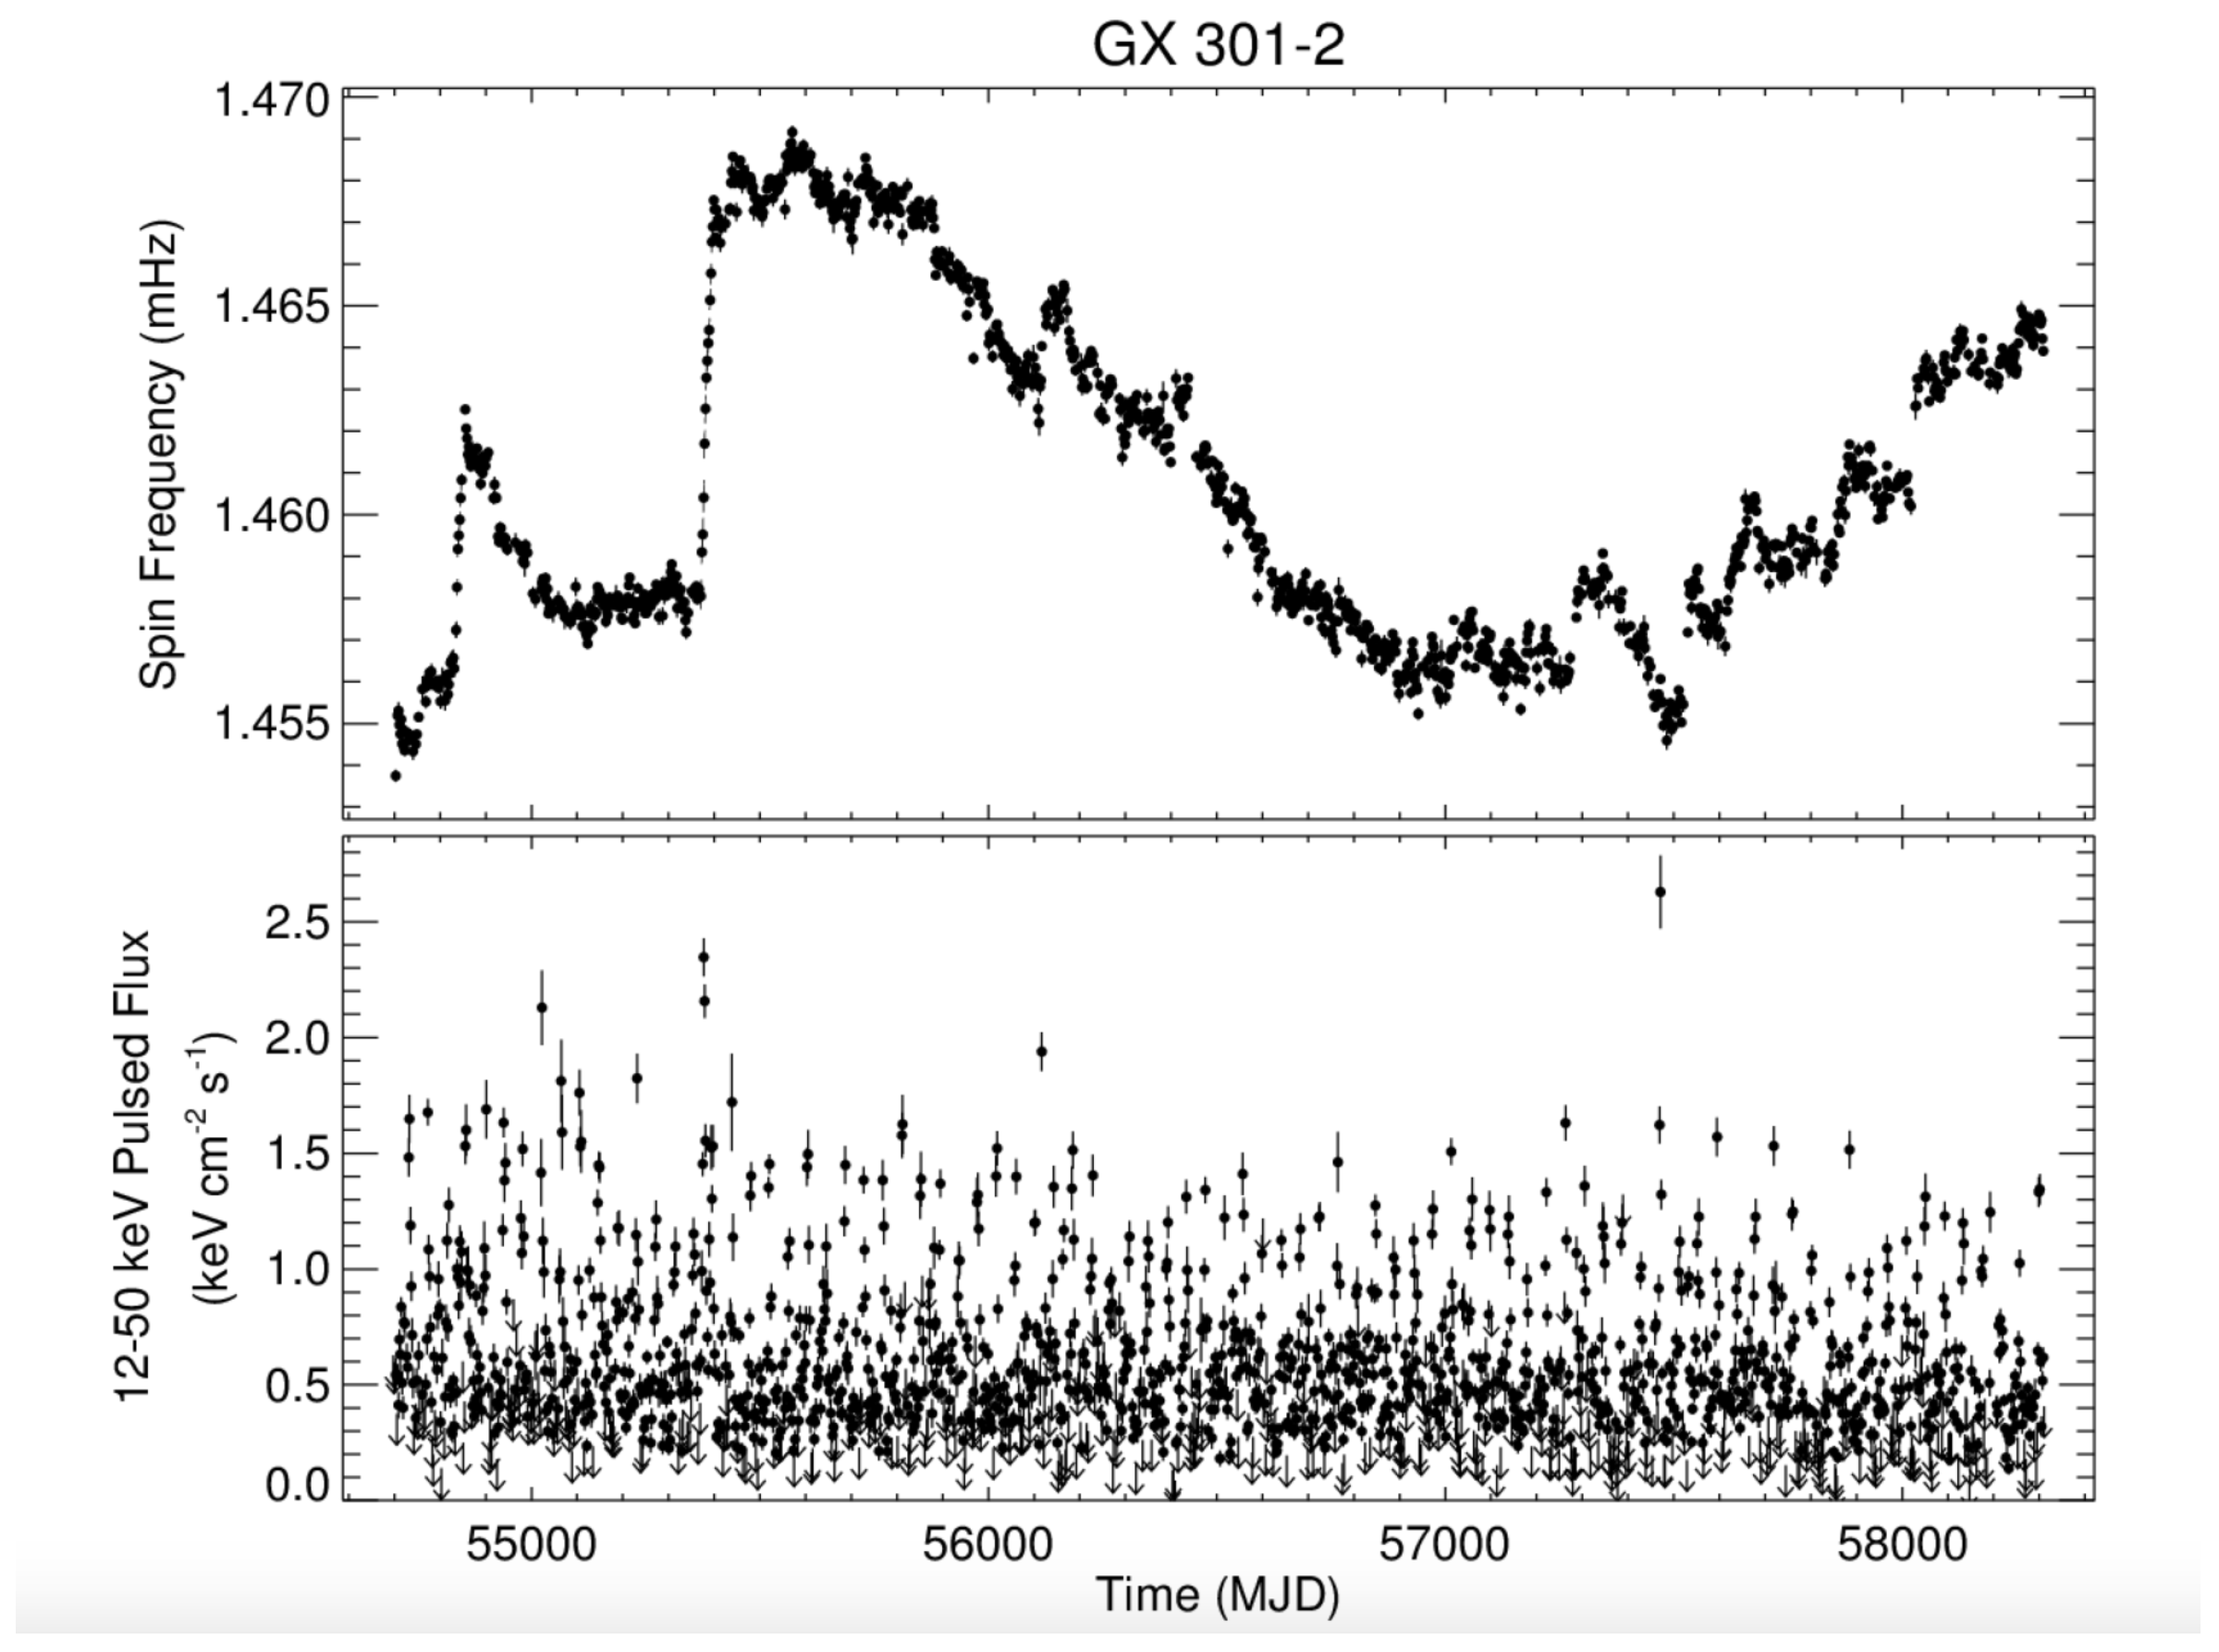
- GBM Accreting Pulsar Histories: https://gammaray.nsstc.nasa.gov/gbm/science/pulsars.html. Over 30 accreting pulsars are monitored by the GBM in the energy range 12–50 keV. The pulse periods and flux values are updated regularly. An example is shown in Figure 2.
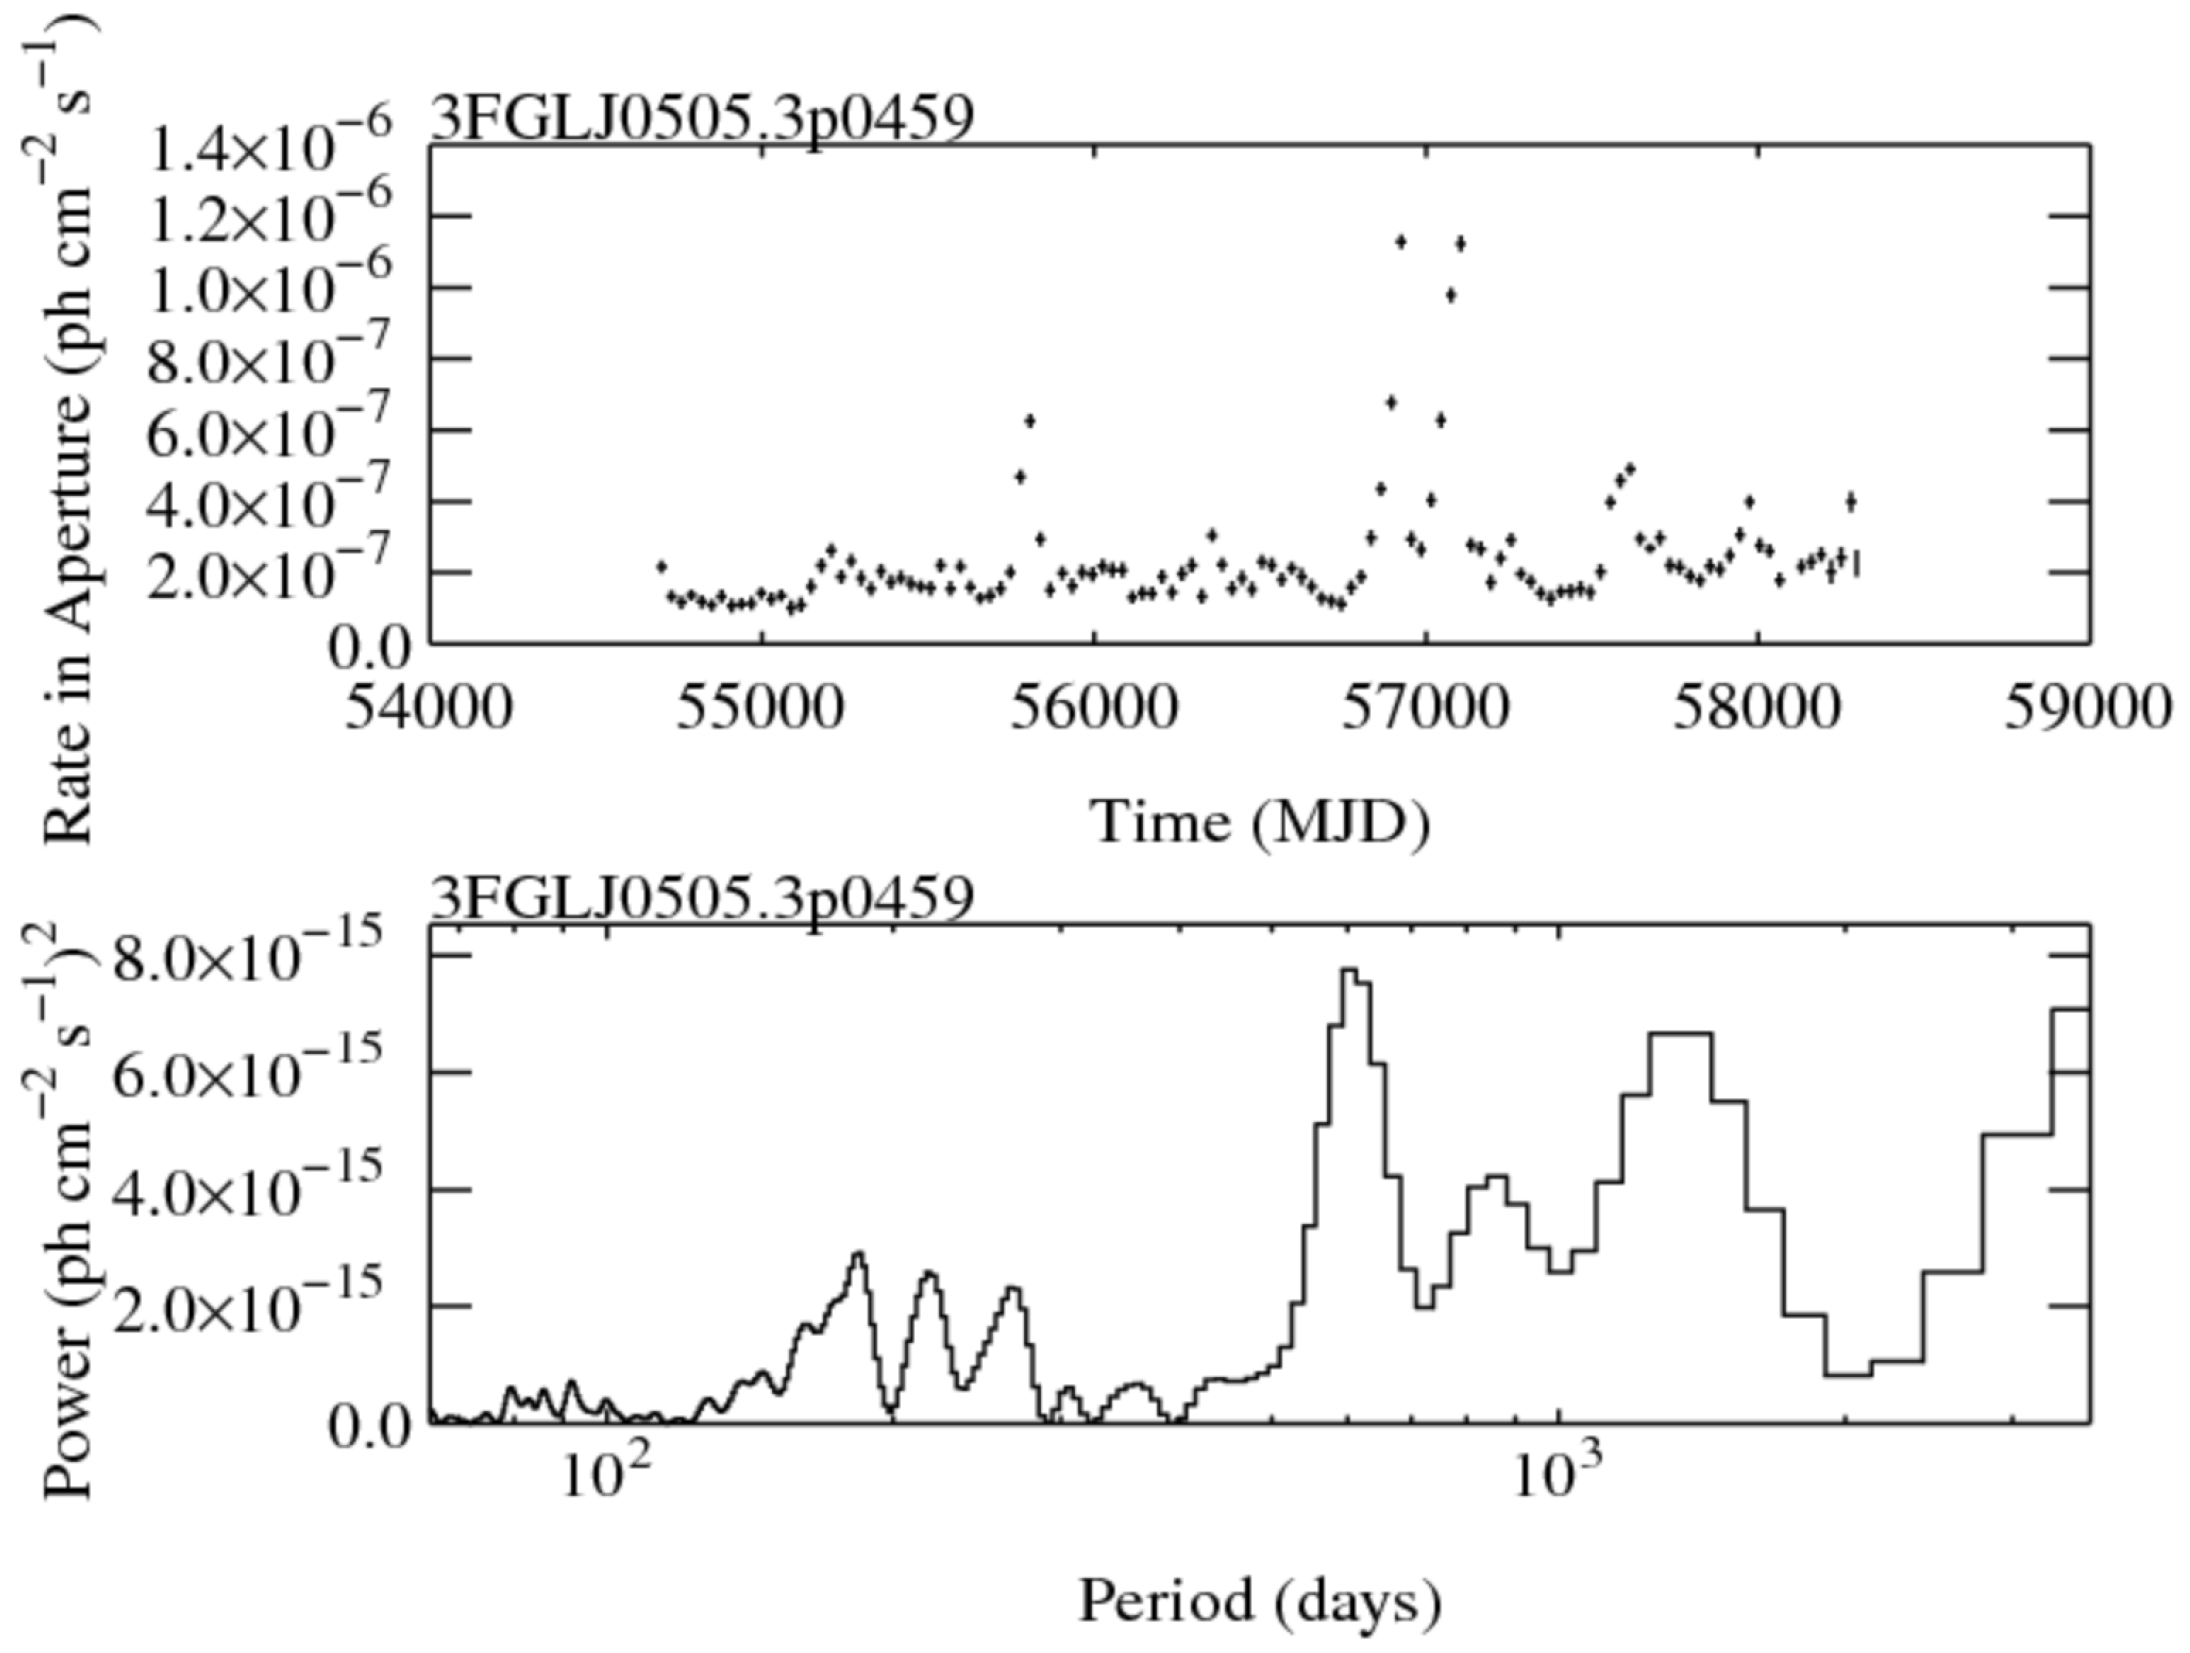
- LAT Aperture Photometry Light Curves: https://fermi.gsfc.nasa.gov/ssc/data/access/lat/4yr$_$catalog/ap$_$lcs.php. Weekly updates of aperture photometry 30-day interval light curves for all 3FGL sources are maintained, along with periodicity analyses. An example is shown in Figure 3.
- Fermi Solar Flare X-ray and Gamma-ray Observations: https://hesperia.gsfc.nasa.gov/fermi$_$solar/. This collection of links offers extensive information about both GBM and LAT solar observations.
- Very Important Project (VIP) list of AGN. The LAT team has identified 30 candidate AGN for concentrated study in the future: https://confluence.slac.stanford.edu/display/GLAMCOG/VIP+List+of+AGNs+for+Continued+Study. For each one, LAT scientists have been identified who will be watching these sources, encouraging multiwavelength studies, and possibly even organizing full multiwavelength campaigns. These are ones for which the team will make a particular effort to cooperate with anyone interested in the same sources.
3.3. Rapid Communications
3.3.1. Public Communications
- GRB on-board alerts sent through the Gamma-Ray Coordinates Network (GCN): https://gcn.gsfc.nasa.gov. GCN, also named Transient Astronomy Network (TAN), is a near-real-time system for rapid communications. GRBs are the only transients bright enough to be detected by the Fermi GBM or LAT on board the spacecraft. An Initial GCN Notice can be sent electronically within seconds of the GRB, followed shortly by a notice in a format that can be used to point automated telescopes and then about 15 min later by one or more with additional information about the burst. An archive of Fermi GCN notices can be found at https://gcn.gsfc.nasa.gov/fermi$_$grbs.html.
- GRB or other transient (such as high-energy neutrino events) follow-up analysis results sent as GCN Circulars. GCN Circulars are sent with more information about a transient, including the light curve shape and the spectrum. They are sent hours after the actual burst. An archive of GCN Circulars from many instruments can be found at https://gcn.gsfc.nasa.gov/gcn3$_$archive.html.
- Flaring activity from LAT sources sent as GCN Notices. LAT non-GRB flare detections are limited by counting statistics and therefore depend on accumulating data for analysis on the ground. The basic latency from the time of data collection at the instrument to having useful -ray information is about 6 h, including transmission of data in several steps and two levels of processing to extract the photon information. First analysis of the -ray data is done by the LAT team’s Automated Science Processing system [18] working on daily data sets. A source that shows a daily flux with 5 excess compared to the average flux over the preceding two weeks generates a GCN Notice. An archive of these notices can be found at https://gcn.gsfc.nasa.gov/fermi$_$lat$_$mon$_t$rans.html.
- Astronomer’s Telegrams (ATels): http://www.astronomerstelegram.org. ATels have become a standard means of rapid communication for a wide variety of astronomical phenomena. They are prepared and submitted manually, generally about a day after the actual event in the case of Fermi. For LAT results, ATels generally come from the volunteer Flare Advocates on the LAT science team [19].
3.3.2. Communications with Limited Distribution
- Limited-access GCN Notices and Circulars have been used to share information between the GBM team and the LIGO/Virgo gravitational wave observatories [20,21]. These MOU-based exchanges were of sub-threshold events seen by each facility, with the idea that seeing something simultaneously could increase the chances of finding a real signal.
- Informal sharing of information, usually by e-mail, has been undertaken between Fermi instrument teams and a wide variety of multiwavelength and multi-messenger facilities. A principal use of this channel has been alerts from the LAT team to the narrow-field imaging atmospheric Cherenkov telescopes (IACTs): H.E.S.S., VERITAS, MAGIC, and FACT. Although the LAT has limited sensitivity at energies that overlap with the IACTs, even a few source photons seen by LAT with energies above 10 GeV can suggest that an observation at TeV energies might be worthwhile. The LAT team also participates in the MAGIC/HESS/VERITAS/HAWC/FACT flaring-AGN agreement, another e-mail-based information exchange.
4. Some Examples of Scientific Results from Monitoring
4.1. Monitoring to Accumulate Statistics
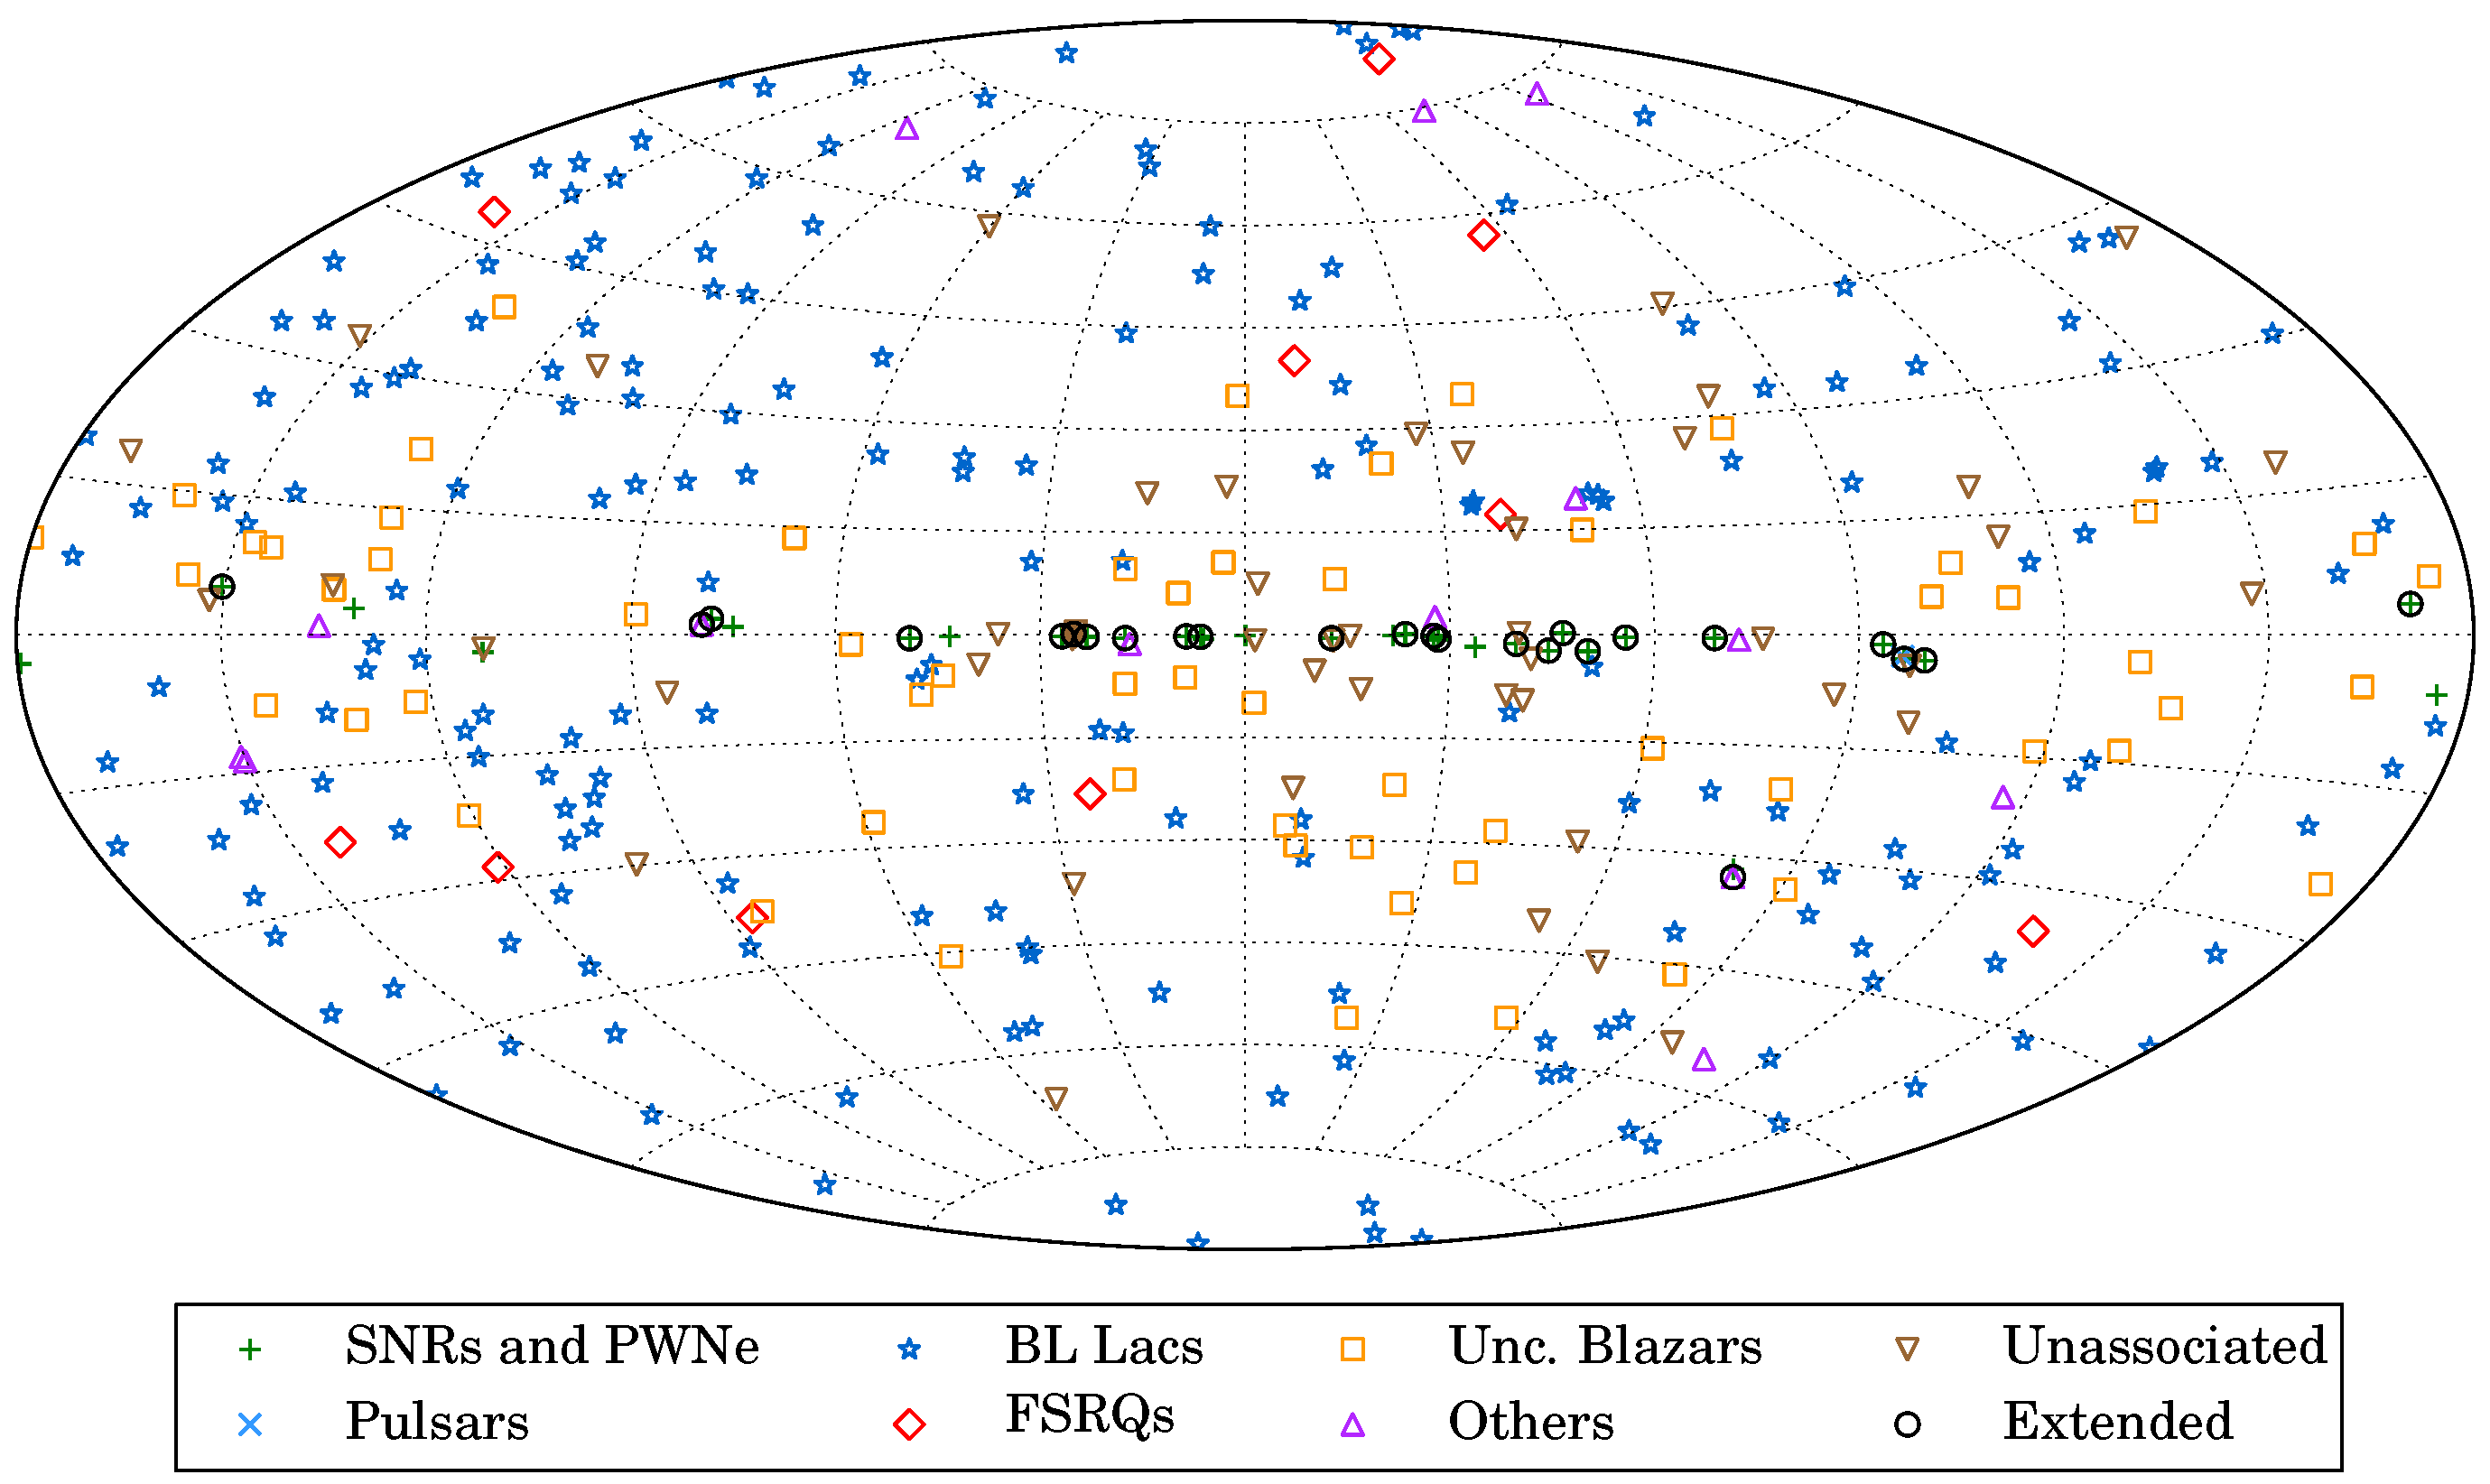
- The 2FHL Catalog. With 80 months of LAT data, it was possible to construct the 2FHL catalog of sources in the energy range 50 GeV–2 TeV [24]. These 360 sources, shown in Figure 4, include some that were seen with as few as 3 photons. Only about 25 percent of these sources had been detected by IACTs, making this catalog a valuable roadmap for future TeV observatories like the Cherenkov Telescope Array (CTA).
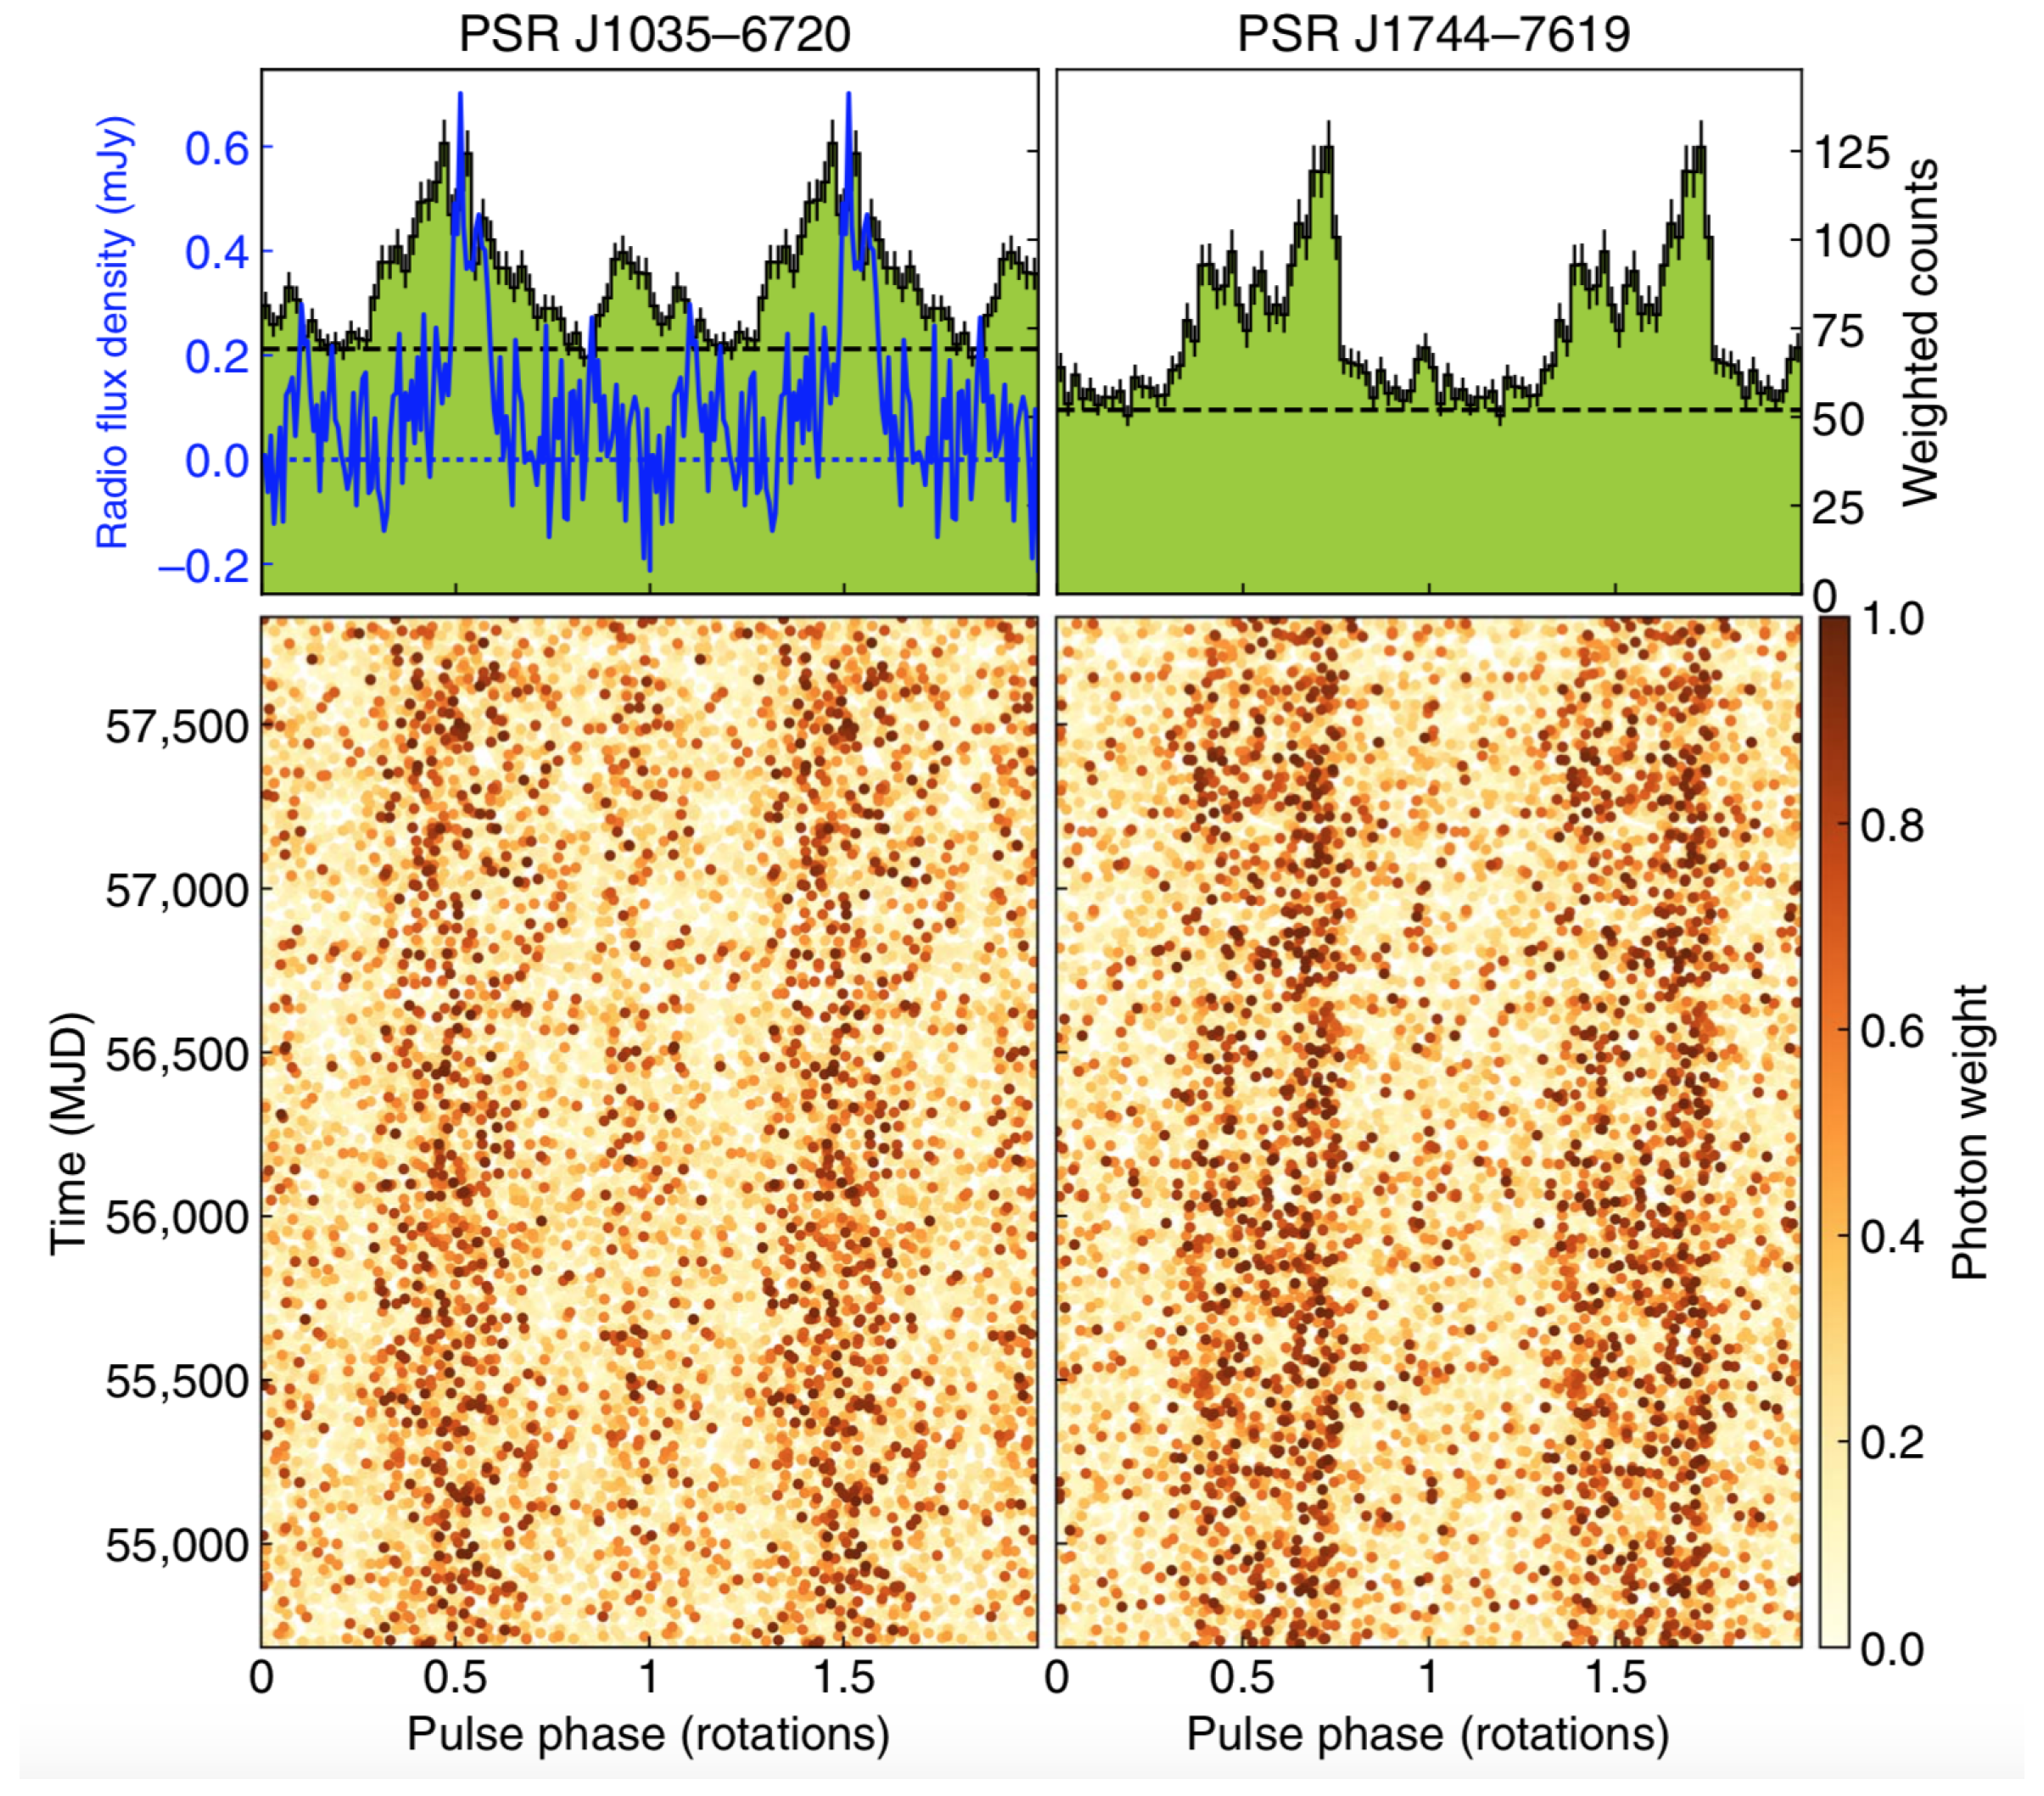
- A Radio-quiet Millisecond Pulsar. Using 5.5 years of LAT data, combined with advanced pulse-searching methods, the Einstein@Home distributed computing project was able to reveal two millisecond pulsars in blind searches, and one of these was the first radio-quiet millisecond pulsar [25]. Although the Einstein@Home project was able to accumulate the equivalent of 10,000 years of CPU time, this computing power still required enough detected rays to make this discovery. The pulse profiles of the two pulsars, along with the pulse phases of individual rays, are shown in Figure 5.
4.2. Monitoring to Search for Long-Term Trends
- Accreting Pulsars. As mentioned above, the GBM monitors a number of accreting pulsars: https://gammaray.nsstc.nasa.gov/gbm/science/pulsars.html. Unlike the example in Figure 2, some other pulsars in this set do show clear long-term trends: 4U 1626−67 has been spinning up since the beginning of the Fermi mission (https://gammaray.nsstc.nasa.gov/gbm/science/pulsars/lightcurves/4u1626.html), while the pulse frequency of GX 1 + 4 has been decreasing steadily (https://gammaray.nsstc.nasa.gov/gbm/science/pulsars/lightcurves/gx1p4.html).
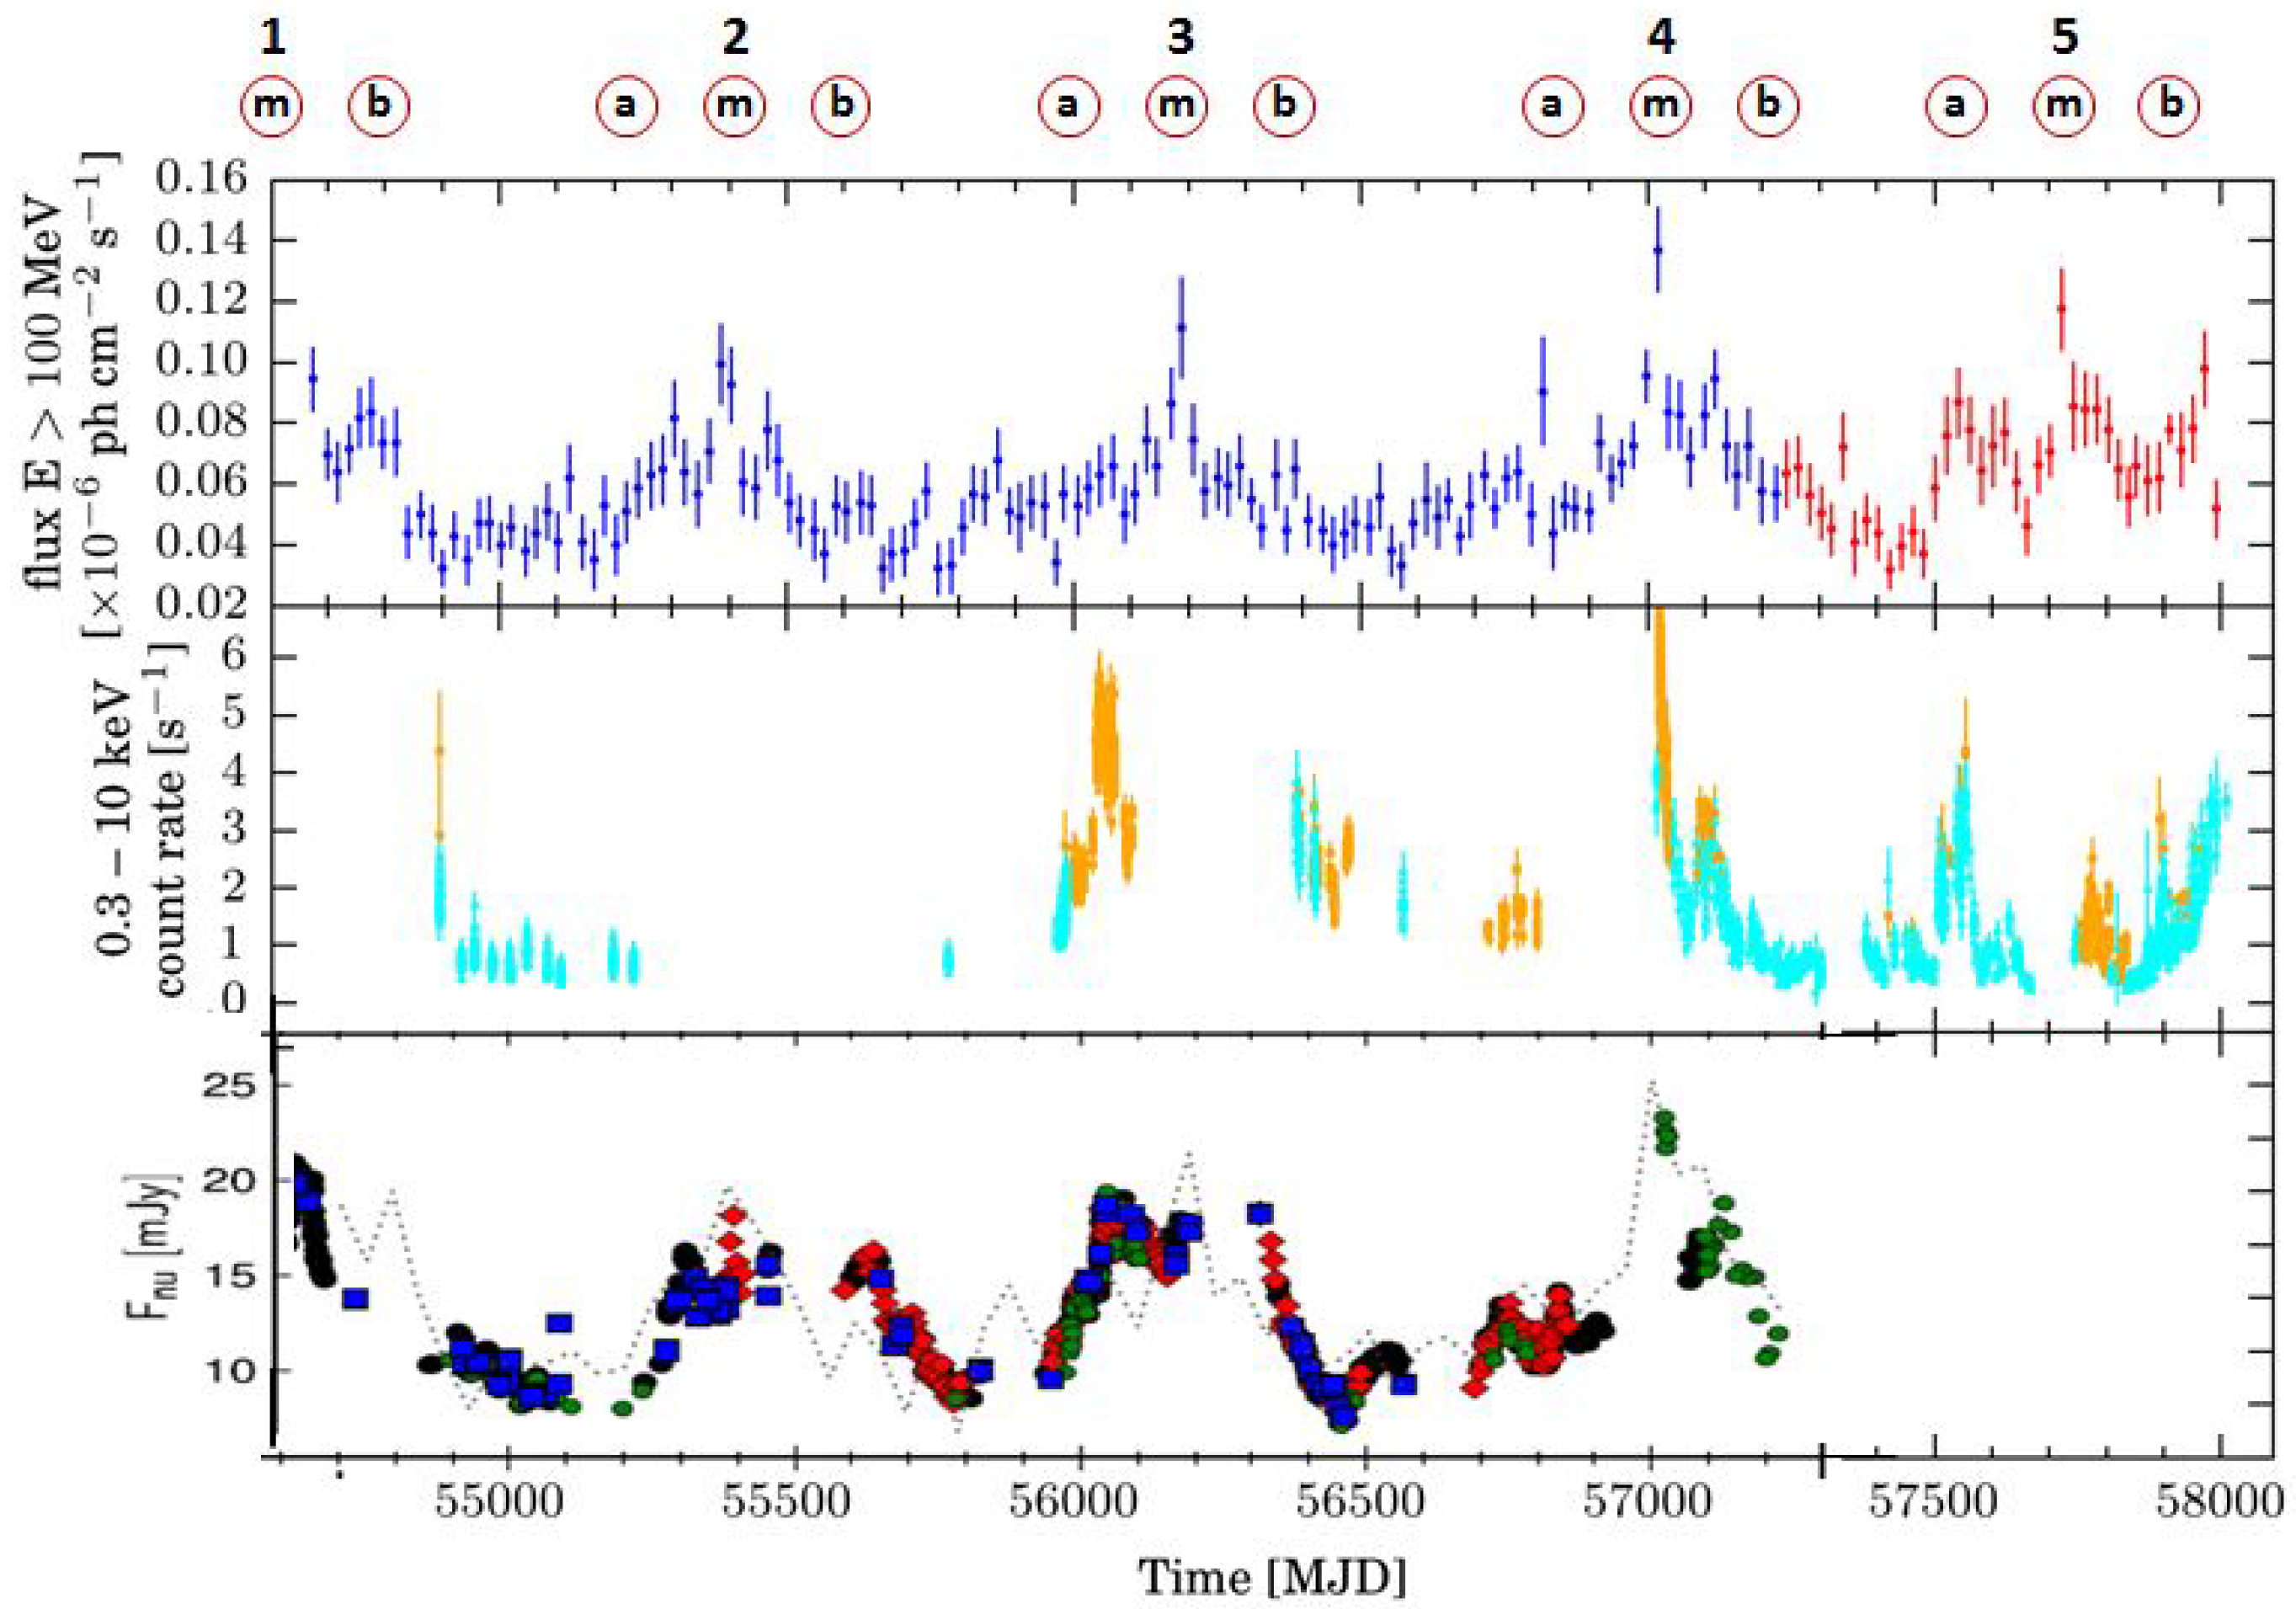
- Possible AGN Periodicity. BL Lac object PG 1553 + 113 is bright enough in the LAT data to be detected regularly, and the long-term light curve showed evidence of quasi-periodic 2.2-year variations in the -ray flux [26]. This periodicity, now reaching 5 cycles and shown in Figure 6, suggests that this system may contain two supermassive black holes [27].
- Power Spectral Density Analysis. Characterization of variability by power density spectra can show features on various time scales, such as the example of LAT analysis for blazar OJ 287 [28].
4.3. Monitoring to Detect Rare Transients
- GRB 090510. This short, bright, distant (z = 0.9) GRB was seen by both the GBM and the LAT, with energies up to 31 GeV. The near-simultaneous arrival times of photons with a broad range of energies set strong constraints on Lorentz-invariance violation and some models of quantum gravity [29].
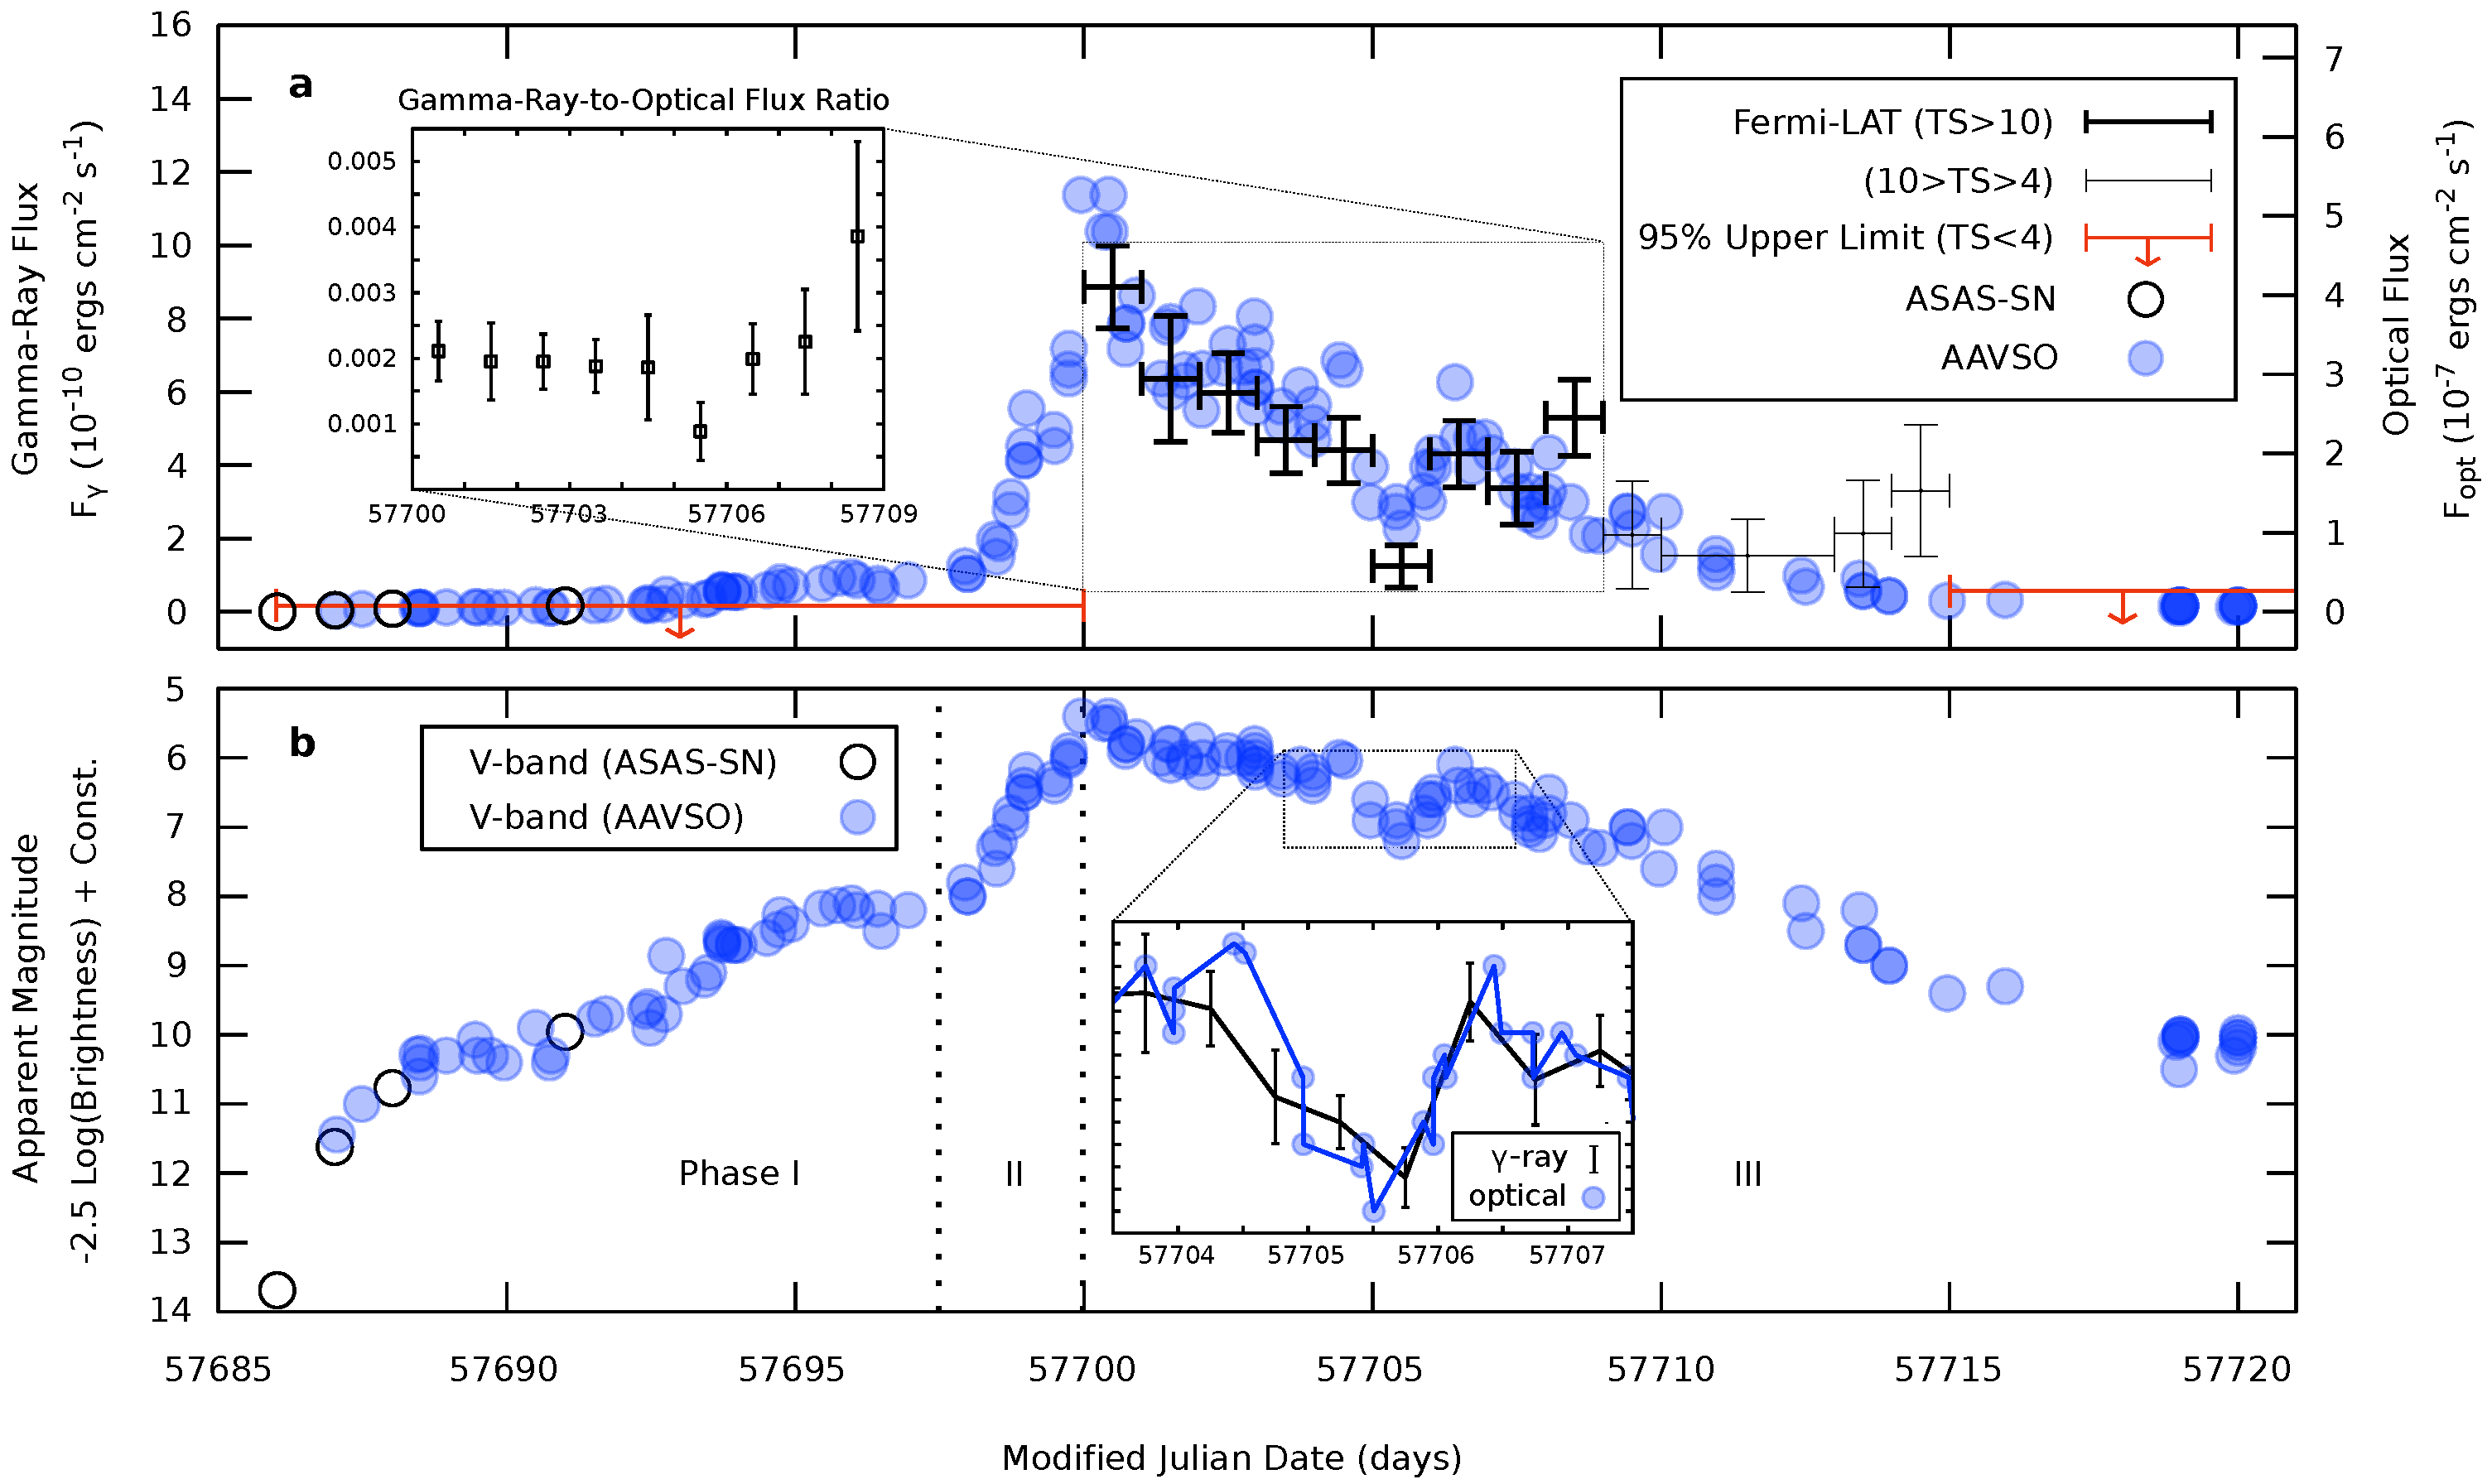
- Shock-powered Nova. ASASSN−16 ma, appearing two years ago, is one of the brightest -ray novae yet seen (Figure 7). The excellent optical and -ray coverage showed the light curves to match, implying that both bands were powered by shocks, contrary to expectation that nova optical emission was related to the white dwarf in these binary systems [33].
4.4. Monitoring for Synergy with New Facilities
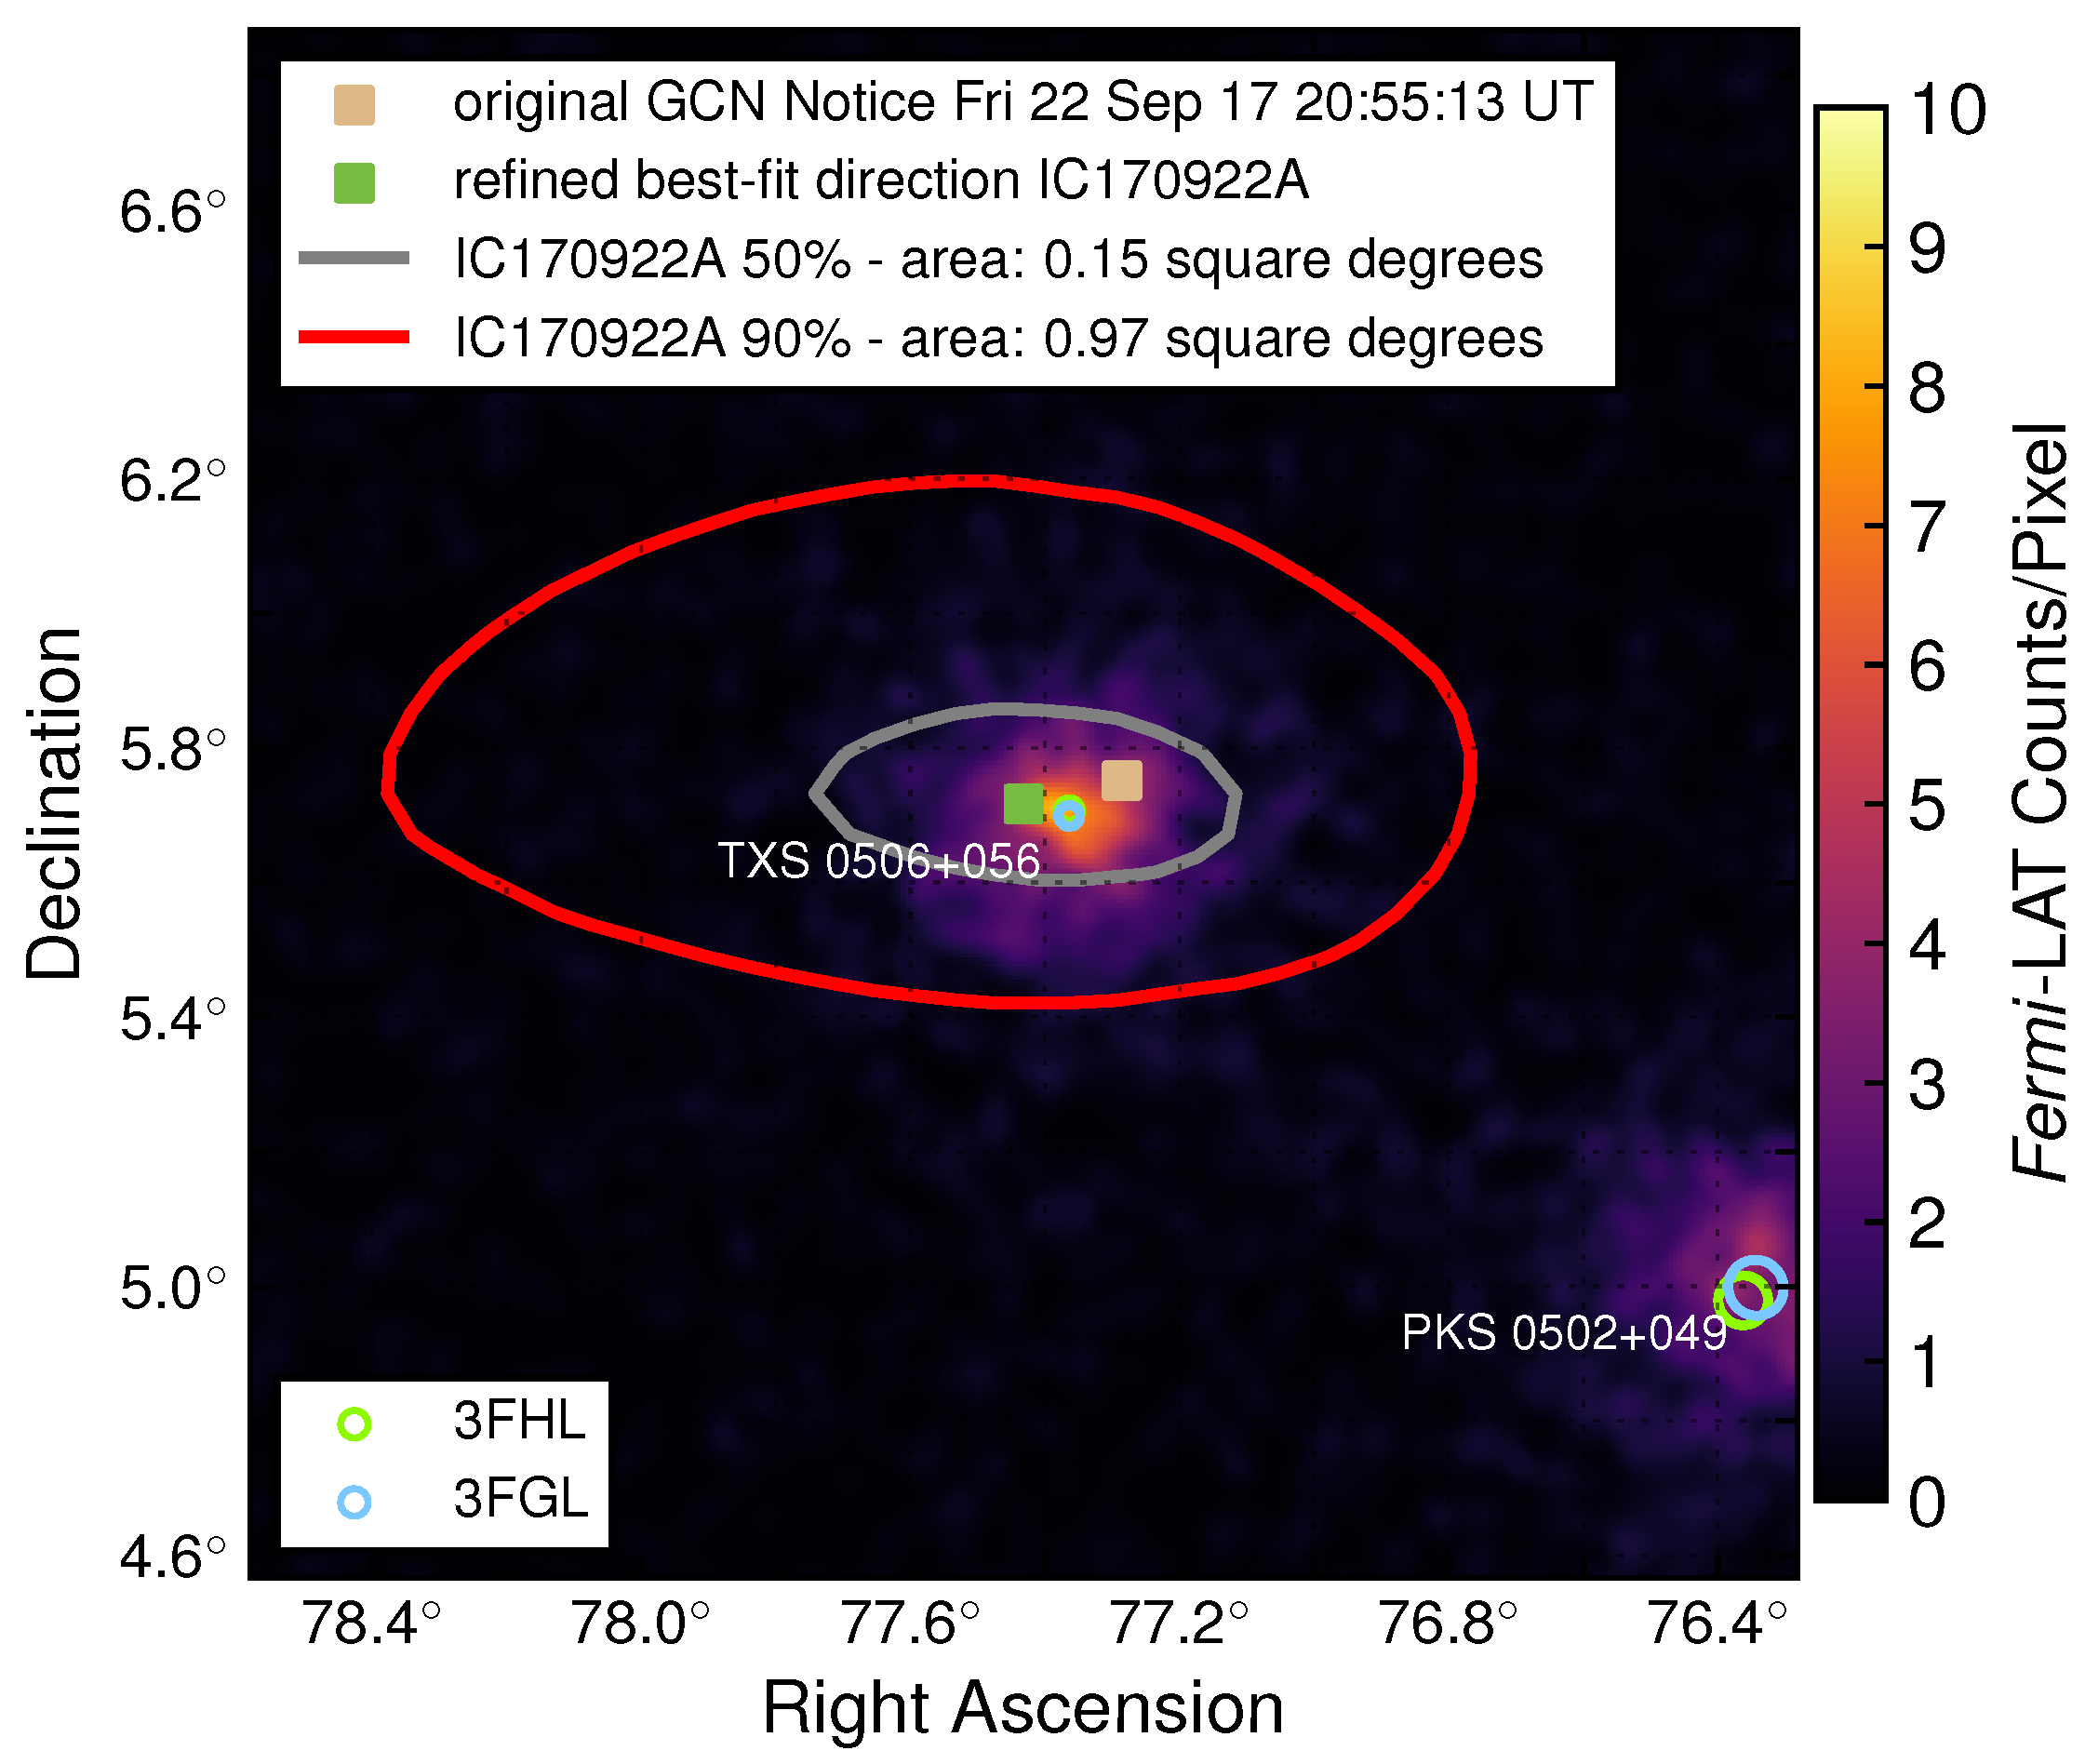
- GRB 170817A/GW170817. The first announcement of this event, a binary star merger that produced a gravitational wave signal, came from a GCN Notice of an on-board Fermi-GBM trigger, followed by a GCN Notice from the LIGO-Virgo gravitational wave teams and then a flood of other observations [34] (see Figure 8). Among the many results from this event, two that involved Fermi were the confirmation of neutron star mergers as the origin of short GRBs and the first measurement of the speed of gravity as essentially the speed of light.
- Swift J0243.6+6124. In 2017 September, a massive outburst from a newly discovered Be/X-ray binary system was detected by the Swift Burst Alert Telescope [35], making it the first known Galactic ultraluminous X-ray pulsar [36]. The full nature of this unusual system, Swift J0243.6+6124, was only revealed by combining data from Swift, Fermi-GBM, NuSTAR, NICER, and Gaia, with the GBM providing the detailed evolution of the flux and pulse spin frequency (Figure 9). Of the five missions involved, only Swift was in operation at the time Fermi was launched.
4.5. Monitoring to Establish Context
5. Discussion
Funding
Acknowledgments
Conflicts of Interest
Abbreviations
| AGN | Active Galactic Nucleus |
| ATel | Astronomer’s Telegram |
| CTA | Cherenkov Telescope Array |
| GBM | Gamma-ray Burst Monitor |
| GCN | Gamma-ray Coordinates Network |
| GRB | Gamma-ray Burst |
| FAVA | Fermi All-sky Variability Analysis |
| FSSC | Fermi Science Support Center |
| IACT | Imaging Atmospheric Cherenkov Telescope |
| LAT | Large Area Telescope |
| LIGO | Laser Interferometer Gravitational-wave Observatory |
| MJD | Modified Julian Day |
| MOU | Memorandum of Understanding |
| 3FGL | Third Fermi LAT Catalog |
References
- McEnery, J.E.; Michelson, P.F.; Paciesas, W.S.; Ritz, S. Fermi Gamma-Ray Space Telescope. Opt. Eng. 2012, 51, 011012. [Google Scholar] [CrossRef]
- Atwood, W.B.; Abdo, A.A.; Ackermann, M.; Althouse, W.; Anderson, B.; Axelsson, M.; Baldini, L.; Ballet, J.; Band, D.L.; Barbiellini, G.; et al. The Large Area Telescope on the Fermi Gamma-Ray Space Telescope Mission. Astrophys. J. 2009, 697, 1071–1102. [Google Scholar] [CrossRef]
- Meegan, C.; Lichti, G.; Bhat, P.N.; Bissaldi, E.; Briggs, M.S.; Connaughton, V.; Diehl, R.; Fishman, G.; Greiner, J.; Hoover, A.S.; et al. The Fermi Gamma-ray Burst Monitor. Astrophys. J. 2009, 702, 791–804. [Google Scholar] [CrossRef]
- Kocevski, D.; Burns, E.; Goldstein, A.; Canton, T.D.; Briggs, M.S.; Blackburn, L.; Veres, P.; Hui, C.M.; Hamburg, R.; Roberts, O.J.; et al. Analysis of Sub-threshold Short Gamma-ray Bursts in Fermi GBM Data. Astrophys. J. 2018, 862, 152. [Google Scholar] [CrossRef]
- Atwood, W.; Albert, A.; Baldini, L.; Tinivella, M.; Bregeon, J.; Pesce-Rollins, M.; Sgrò, C.; Bruel, P.; Charles, E.; Drlica-Wagner, A.; et al. Pass 8: Toward the Full Realization of the Fermi-LAT Scientific Potential. arXiv 2013, arXiv:1303.3514. [Google Scholar]
- Bhat, P.N.; Meegan, C.A.; von Kienlin, A.; Paciesas, W.S.; Briggs, M.S.; Burgess, J.M.; Burns, E.; Chaplin, V.; Cleveland, W.H.; Collazzi, A.C.; et al. The Third Fermi GBM Gamma-Ray Burst Catalog: The First Six Years. Astrophys. J. Suppl. Ser. 2016, 223, 28. [Google Scholar] [CrossRef]
- Acero, F.; Ackermann, M.; Ajello, M.; Albert, A.; Atwood, W.B.; Axelsson, M.; Baldini, L.; Ballet, J.; Barbiellini, G.; Bastieri, D.; et al. Fermi Large Area Telescope Third Source Catalog. Astrophys. J. Suppl. Ser. 2015, 218, 23. [Google Scholar] [CrossRef]
- Yu, H.F.; Preece, R.D.; Greiner, J.; Bhat, P.N.; Bissaldi, E.; Briggs, M.S.; Cleveland, W.H.; Connaughton, V.; Goldstein, A.; von Kienlin, A.; et al. The Fermi GBM gamma-ray burst time-resolved spectral catalog: Brightest bursts in the first four years. Astron. Astrophys. 2016, 588, A135. [Google Scholar] [CrossRef]
- Collazzi, A.C.; Kouveliotou, C.; Van der Horst, A.J.; Younes, G.A.; Kaneko, Y.; Göğüş, E.; Lin, L.; Granot, J.; Finger, M.H.; Chaplin, V.L.; et al. The Five Year Fermi/GBM Magnetar Burst Catalog. Astrophys. J. Suppl. Ser. 2015, 218, 11. [Google Scholar] [CrossRef]
- Jenke, P.A.; Linares, M.; Connaughton, V.; Beklen, E.; Camero-Arranz, A.; Finger, M.H.; Wilson-Hodge, C.A. The Fermi-GBM Three-year X-ray Burst Catalog. Astrophys. J. 2016, 826, 228. [Google Scholar] [CrossRef]
- Ajello, M.; Atwood, W.B.; Baldini, L.; Ballet, J.; Barbiellini, G.; Bastieri, D.; Bellazzini, R.; Bissaldi, E.; Blandford, R.D.; Bloom, E.D.; et al. 3FHL: The Third Catalog of Hard Fermi-LAT Sources. Astrophys. J. Suppl. Ser. 2017, 232, 18. [Google Scholar] [CrossRef]
- Roberts, O.J.; Fitzpatrick, G.; Stanbro, M.; McBreen, S.; Briggs, M.S.; Holzworth, R.H.; Grove, J.E.; Chekhtman, A.; Cramer, E.S.; Mailyan, B.G. The First Fermi-GBM Terrestrial Gamma Ray Flash Catalog. J. Geophys. Res. Space Phys. 2017, 123, 4381–4401. [Google Scholar] [CrossRef]
- Abdollahi, S.; Ackermann, M.; Ajello, M.; Albert, A.; Baldini, L.; Ballet, J.; Barbiellini, G.; Bastieri, D.; Gonzalez, J.B.; Bellazzini, R.; et al. The Second Catalog of Flaring Gamma-Ray Sources from the Fermi All-sky Variability Analysis. Astrophys. J. 2017, 846, 34. [Google Scholar]
- Acero, F.; Ackermann, M.; Ajello, M.; Baldini, L.; Ballet, J.; Barbiellini, G.; Bastieri, D.; Bellazzini, R.; Bissaldi, E.; Blandford, R.D.; et al. The First Fermi LAT Supernova Remnant Catalog. Astrophys. J. Suppl. Ser. 2016, 224, 8. [Google Scholar] [CrossRef]
- Ackermann, M.; Ajello, M.; Atwood, W.B.; Baldini, L.; Ballet, J.; Barbiellini, G.; Bastieri, D.; Gonzalez, J.B.; Bellazzini, R.; Bissaldi, E.; et al. The Third Catalog of Active Galactic Nuclei Detected by the Fermi Large Area Telescope. Astrophys. J. 2015, 810, 14. [Google Scholar] [CrossRef]
- Ackermann, M.; Ajello, M.; Asano, K.; Axelsson, M.; Baldini, L.; Ballet, J.; Barbiellini, G.; Bastieri, D.; Bechtol, K.; Bellazzini, R.; et al. The First Fermi-LAT Gamma-Ray Burst Catalog. Astrophys. J. Suppl. Ser. 2013, 209, 11. [Google Scholar] [CrossRef]
- Abdo, A.A.; Ajello, M.; Allafort, A.; Baldini, L.; Ballet, J.; Barbiellini, G.; Baring, M.G.; Bastieri, D.; Belfiore, A.; Bellazzini, R.; et al. The Second Fermi Large Area Telescope Catalog of Gamma-Ray Pulsars. Astrophys. J. Suppl. Ser. 2013, 208, 17. [Google Scholar] [CrossRef]
- Chiang, J. Automated Science Processing for the Fermi Large Area Telescope. In Advances in Machine Learning and Data Mining for Astronomy; Way, M.J., Scargle, J.D., Ali, K.M., Srivastava, A.N., Eds.; CRC Press: Boca Raton, FL, USA; Taylor & Francis Group: Abingdon, UK, 2012; pp. 41–54. [Google Scholar]
- Ciprini, S. Four years of Fermi LAT flare advocate activity. In Proceedings of the AIP Conference Proceedings, Philadelphia, PA, USA, 1–2 August 2012; Volume 1505. [Google Scholar] [CrossRef]
- Connaughton, V.; Burns, E.; Goldstein, A.; Blackburn, L.; Briggs, M.S.; Zhang, B.B.; Camp, J.; Christensen, N.; Hui, C.M.; Jenke, P.; et al. Fermi GBM Observations of LIGO Gravitational-wave Event GW150914. Astrophys. J. Lett. 2016, 826, L6–L25. [Google Scholar] [CrossRef]
- Racusin, J.L.; Burns, E.; Goldstein, A.; Connaughton, V.; Wilson-Hodge, C.A.; Jenke, P.; Blackburn, L.; Briggs, M.S.; Broida, J.; Camp, J.; et al. Searching the Gamma-Ray Sky for Counterparts to Gravitational Wave Sources: Fermi GBM and LAT Observations of LVT151012 and GW151226. Astrophys. J. 2017, 835, 82. [Google Scholar] [CrossRef]
- Lenain, J.-P. FLaapLUC: A pipeline for the generation of prompt alerts on transient Fermi-LAT γ-ray sources. Astron. Comput. 2018, 22, 9–15. [Google Scholar] [CrossRef]
- Pacciani, L.; Tavecchio, F.; Donnarumma, I.; Stamerra, A.; Carrasco, L.; Recillas, E.; Porras, A.; Uemura, M. Exploring the Blazar Zone in High-energy Flares of FSRQs. Astrophys. J. 2014, 790, 45. [Google Scholar] [CrossRef]
- Ackermann, M.; Ajello, M.; Atwood, W.B.; Baldini, L.; Ballet, J.; Barbiellini, G.; Bastieri, D.; Gonzalez, J.B.; Bellazzini, R.; Bissaldi, E.; et al. 2FHL: The Second Catalog of Hard Fermi-LAT Sources. Astrophys. J. Suppl. Ser. 2016, 222, 5. [Google Scholar] [CrossRef]
- Clark, C.J.; Pletsch, H.J.; Wu, J.; Guillemot, L.; Kerr, M.; Johnson, T.J.; Camilo, F.; Salvetti, D.; Allen, B.; Anderson, D.; Aulbert, C. Einstein@Home discovers a radio-quiet gamma-ray millisecond pulsar. Sci. Adv. 2018, 4, 2. [Google Scholar] [CrossRef] [PubMed]
- Ackermann, M.; Ajello, M.; Albert, A.; Atwood, W.B.; Baldini, L.; Ballet, J.; Barbiellini, G.; Bastieri, D.; Gonzalez, J.B.; Bellazzini, R.; et al. Multiwavelength Evidence for Quasi-periodic Modulation in the Gamma-Ray Blazar PG 1553+113. Astrophys. J. Lett. 2015, 813, L41. [Google Scholar] [CrossRef]
- Tavani, M.; Cavaliere, A.; Munar-Adrover, P.; Argan, A. The Blazar PG 1553+113 as a Binary System of Supermassive Black Holes. Astrophys. J. 2018, 854, 11. [Google Scholar] [CrossRef]
- Goyal, A.; Zola, S.; Marchenko, V.; Soida, M.; Nilsson, K.; Ciprini, S.; Baran, A.; Ostrowski, M.; Wiita, P.J.; Siemiginowska, A.; et al. Stochastic Modeling of Multiwavelength Variability of the Classical BL Lac Object OJ 287 on Timescales Ranging from Decades to Hours. Astrophys. J. Lett. 2018, 863, 175. [Google Scholar] [CrossRef]
- Abdo, A.A.; Ackermann, M.; Ajello, M.; Asano, K.; Atwood, W.B.; Axelsson, M.; Baldini, L.; Ballet, J.; Barbiellini, G.; Baring, M.G.; et al. A limit on the variation of the speed of light arising from quantum gravity effects. Nature 2009, 462, 331–334. [Google Scholar] [CrossRef] [PubMed]
- Abdo, A.A.; Ackermann, M.; Ajello, M.; Allafort, A.; Baldini, L.; Ballet, J.; Barbiellini, G.; Bastieri, D.; Bechtol, K.; Bellazzini, R.; et al. Gamma-Ray Flares from the Crab Nebula. Science 2011, 331, 739–742. [Google Scholar] [CrossRef] [PubMed]
- Tavani, M.; Bulgarelli, A.; Vittorini, V.; Pellizzoni, A.; Striani, E.; Caraveo, P.; Weisskopf, M.C.; Tennant, A.; Pucella, G.; Trois, A.; et al. Discovery of Powerful Gamma-Ray Flares from the Crab Nebula. Science 2011, 331, 736–741. [Google Scholar] [CrossRef] [PubMed]
- Mayer, M.; Buehler, R.; Hays, E.; Cheung, C.C.; Dutka, M.S.; Grove, J.E.; Kerr, M.; Ojha, R. Rapid Gamma-Ray Flux Variability during the 2013 March Crab Nebula Flare. Astrophys. J. Lett. 2013, 775, L37. [Google Scholar] [CrossRef]
- Li, K.L.; Metzger, B.D.; Chomiuk, L.; Vurm, I.; Strader, J.; Finzell, T.; Beloborodov, A.M.; Nelson, T.; Shappee, B.J.; Kochanek, C.S.; et al. A nova outburst powered by shocks. Nat. Astron. 2017, 1, 697–702. [Google Scholar] [CrossRef]
- Abbott, B.P.; Abbott, R.; Adhikari, R.X.; Ananyeva, A.; Anderson, S.B.; Appert, S.; Arai, K.; Araya, M.C.; Barayoga, J.C.; Barish, B.C.; et al. Multi-messenger Observations of a Binary Neutron Star Merger. Astrophys. J. Lett. 2017, 848, L12. [Google Scholar] [CrossRef]
- Cenko, S.B.; Barthelmy, S.D.; D’Avanzo, P.; Kennea, J.A.; Lien, A.Y.; Marshall, F.E.; Palmer, D.M.; Siegel, M.H.; Tohuvavohu, A. GRB 171003A: Swift detection of a burst or a Galactic Transient. GRB Coordinates Network, Circular Service, 2017; 21960. [Google Scholar]
- Wilson-Hodge, C.A.; Malacaria, C.; Jenke, P.A.; Jaisawal, G.K.; Kerr, M.; Wolff, M.T.; Arzoumanian, Z.; Chakrabarty, D.; Doty, J.P.; Gendreau, K.C.; et al. NICER and Fermi GBM Observations of the First Galactic Ultraluminous X-ray Pulsar Swift J0243.6+6124. Astrophys. J. 2018, 863, 9. [Google Scholar] [CrossRef]
- IceCube Collaboration. GRB Coordinates Network/AMON Notices; IceCube Collaboration: Zeuthen, Germany, 2017; Volume 21916. [Google Scholar]
- Tanaka, Y.T.; Buson, S.; Kocevski, D. Fermi-LAT detection of increased gamma-ray activity of TXS 0506+056, located inside the IceCube-170922A error region. The Astronomer’s Telegram, Semptember 2017; 10791. [Google Scholar]
- IceCube Collaboration. Multimessenger observations of a flaring blazar coincident with high-energy neutrino IceCube-170922A. Science 2018, 361, 147. [Google Scholar]


© 2018 by the author. Licensee MDPI, Basel, Switzerland. This article is an open access article distributed under the terms and conditions of the Creative Commons Attribution (CC BY) license (http://creativecommons.org/licenses/by/4.0/).
Share and Cite
Thompson, D.J. Fermi: Monitoring the Gamma-Ray Universe. Galaxies 2018, 6, 117. https://doi.org/10.3390/galaxies6040117
Thompson DJ. Fermi: Monitoring the Gamma-Ray Universe. Galaxies. 2018; 6(4):117. https://doi.org/10.3390/galaxies6040117
Chicago/Turabian StyleThompson, David J. 2018. "Fermi: Monitoring the Gamma-Ray Universe" Galaxies 6, no. 4: 117. https://doi.org/10.3390/galaxies6040117
APA StyleThompson, D. J. (2018). Fermi: Monitoring the Gamma-Ray Universe. Galaxies, 6(4), 117. https://doi.org/10.3390/galaxies6040117