Investigation of Similarity in the Spectra between Short- and Long-Duration Gamma-ray Bursts


Abstract
1. Introduction
2. Analysis
2.1. Identifying the Spectral Energy Range of the Fermi GBM Data
2.2. Preparation of the Data
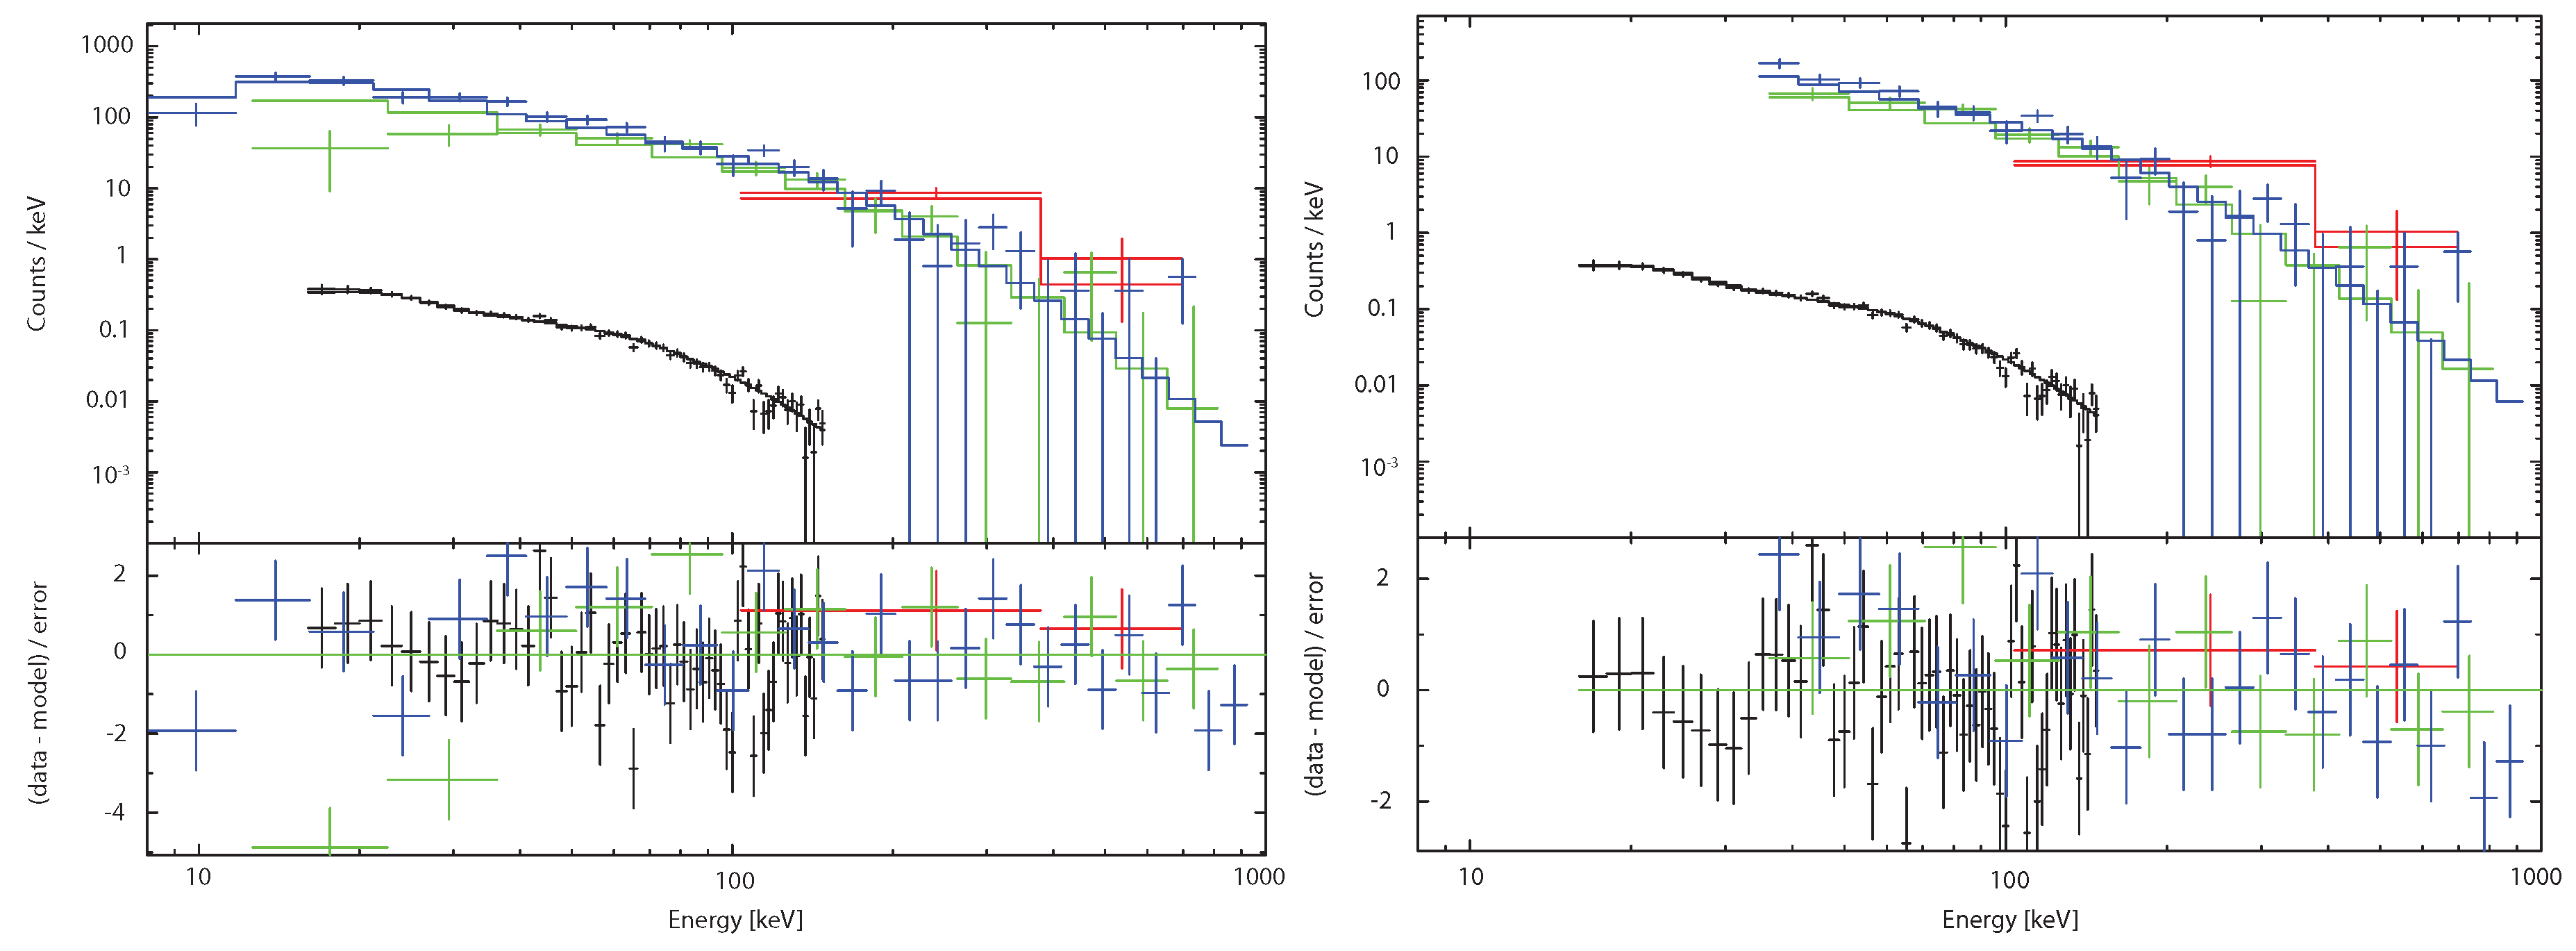
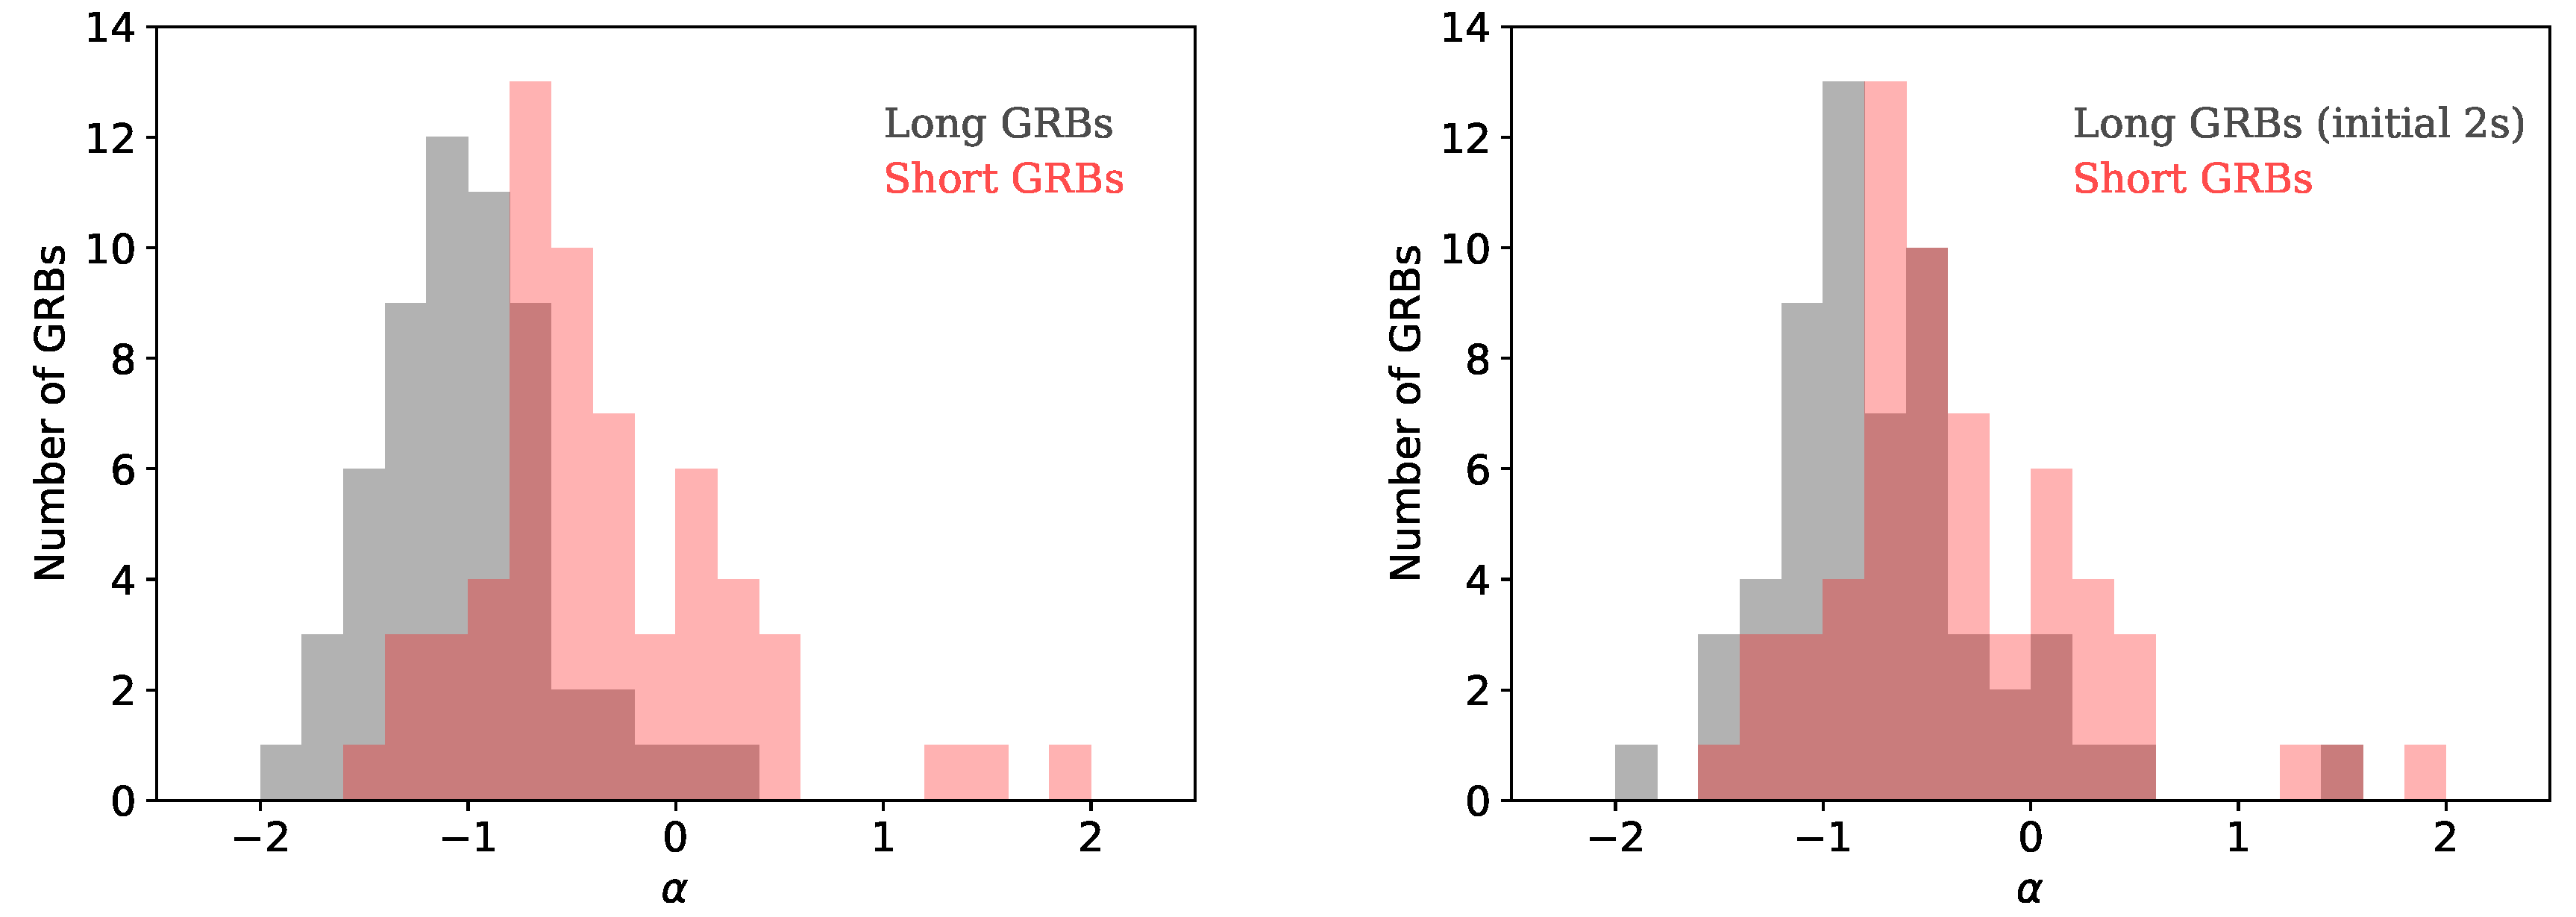
3. Results
4. Discussion
Author Contributions
Funding
Acknowledgments
Conflicts of Interest
References
- Abbott, B.P.; Abbott, R.; Abbott, T.D.; Acernese, F.; Ackley, K.; Adams, C.; Adams, T.; Addesso, P.; Adhikari, R.X.; Adya, V.B.; et al. GW170817: Observation of Gravitational Waves from a Binary Neutron Star Inspiral. Phys. Rev. Lett. 2017, 119, 161101. [Google Scholar] [CrossRef] [PubMed]
- Abbott, B.P.; Abbott, R.; Adhikari, R.X.; Ananyeva, A.; Anderson, S.B.; Appert, S.; Arai, K.; Araya, M.C.; Barayoga, J.C.; Barish, B.C.; et al. Multi-messenger Observations of a Binary Neutron Star Merger. Astrophys. J. Lett. 2017, 848, 59. [Google Scholar] [CrossRef]
- Goldstein, A.; Veres, P.; Burns, E.; Briggs, M.S.; Hamburg, R.; Kocevski, D.; Wilson-Hodge, C.A.; Preece, R.D.; Poolakkil, S.; Roberts, O.J.; et al. An Ordinary Short Gamma-ray Burst with Extraordinary Implications: Fermi GBM Detection of GRB 170817A. Astrophys. J. Lett. 2017, 848, 14. [Google Scholar] [CrossRef]
- Troja, E.; Piro, L.; Van Eerten, H.; Wollaeger, R.T.; Im, M.; Fox, O.D.; Butler, N.R.; Cenko, S.B.; Sakamoto, T.; Fryer, C.L.; et al. The X-ray Counterpart to the Gravitational-wave Event GW170817. Nature 2017, 551, 71–74. [Google Scholar] [CrossRef]
- Troja, E.; Piro, L.; Ryan, G.; van Eerten, H.; Ricci, R.; Wieringa, M.H.; Lotti, S.; Sakamoto, T.; Cenko, S.B. The Outflow Structure of GW170817 from Late-time Broad-band Observations. Mon. Not. R. Astron. Soc. Lett. 2018, 478, L18–L23. [Google Scholar] [CrossRef]
- Mooley, K.P.; Nakar, E.; Hotokezaka, K.; Hallinan, G.; Corsi, A.; Frail, D.A.; Horesh, A.; Murphy, T.; Lenc, E.; Kaplan, D.L.; et al. A Mildly Relativistic Wide-angle Outflow in the Neutron-star Merger Event GW170817. Nature 2018, 554, 207–210. [Google Scholar] [CrossRef] [PubMed]
- Yamazaki, R.; Ioka, K.; Nakamura, T. X-ray Flashes from Off-Axis Gamma-ray Bursts. Astrophys. J. Lett. 2002, 571, L31–L35. [Google Scholar] [CrossRef]
- Zhang, B.; Dai, X.; Lloyd-Ronning, N.M.; Mészáros, P. Quasi-universal Gaussian Jets: A Unified Picture for Gamma-ray Bursts and X-ray Flashes. Astrophys. J. Lett. 2004, 601, L119–L122. [Google Scholar] [CrossRef]
- Kouveliotou, C.; Meegan, C.A.; Fishman, G.J.; Bhat, N.P.; Briggs, M.S.; Koshut, T.M.; Paciesas, W.S.; Pendleton, G.N. Identification of two classes of gamma-ray bursts. Astrophys. J. 1993, 413, L101–L104. [Google Scholar] [CrossRef]
- Ghirlanda, G.; Ghisellini, G.; Celotti, A. The spectra of short Gamma-ray Bursts. Astron. Astrophys. 2004, 422, L55–L58. [Google Scholar] [CrossRef]
- Ghirlanda, G.; Nava, L.; Ghisellini, G.; Celotti, A.; Firmani, C. Short versus Long gamma-ray bursts: Spectra, energetics, and luminosities. Astron. Astrophys. 2009, 496, 585–595. [Google Scholar] [CrossRef]
- Hakkila, J.; Preece, R.D. Unification of Pulses in Long and Short Gamma-ray Bursts: Evidence from Pulse Properties and their Correlations. Astrophys. J. 2011, 740, 104. [Google Scholar] [CrossRef]
- Ghirlanda, G.; Ghisellini, G.; Nava, L. Short and Long Gamma-ray Bursts: Same Emission Mechanism? Mon. Not. R. Astron. Soc. Lett. 2011, 418, L109–L113. [Google Scholar] [CrossRef]
- Gehrels, N.; Chincarini, G.; Giommi, P.; Mason, K.O.; Nousek, J.A.; Wells, A.A.; White, N.E.; Barthelmy, S.D.; Burrows, D.N.; Cominsky, L.R.; et al. The Swift Gamma-ray Burst Mission. Astrophys. J. 2004, 611, 1005–1020. [Google Scholar] [CrossRef]
- Barthelmy, S.D.; Barbier, L.M.; Cummings, J.R.; Fenimore, E.E.; Gehrels, N.; Hullinger, D.; Krimm, H.A.; Markwardt, C.B.; Palmer, D.M.; Parsons, A.; et al. The Burst Alert Telescope (BAT) on the SWIFT MIDEX Mission. Space Sci. Rev. 2005, 120, 143–164. [Google Scholar] [CrossRef]
- Meegan, C.; Lichti, G.; Bhat, P.N.; Bissaldi, E.; Briggs, M.S.; Connaughton, V.; Diehl, R.; Fishman, G.; Greiner, J.; Hoover, A.S.; et al. The Fermi Gamma-ray Burst Monitor. Astrophys. J. 2009, 702, 791–804. [Google Scholar] [CrossRef]
- Lien, A.; Sakamoto, T.; Barthelmy, S.D.; Baumgartner, W.H.; Cannizzo, J.K.; Chen, K.; Collins, N.R.; Cummings, J.R.; Gehrels, N.; Krimm, H.A.; et al. The Third Swift Burst Alert Telescope Gamma-ray Burst Catalog. Astrophys. J. 2016, 829, 47. [Google Scholar] [CrossRef]
- Sakamoto, T.; Barthelmy, S.D.; Barbier, L.; Cummings, J.R.; Fenimore, E.E.; Gehrels, N.; Hullinger, D.; Krimm, H.A.; Markwardt, C.B.; Palmer, D.M.; et al. The First Swift BAT Gamma-ray Burst Catalog. Astrophys. J. Suppl. Ser. 2008, 175, 179–190. [Google Scholar] [CrossRef]
- Sakamoto, T.; Barthelmy, S.D.; Baumgartner, W.H.; Cummings, J.R.; Fenimore, E.E.; Gehrels, N.; Krimm, H.A.; Markwardt, C.B.; Palmer, D.M.; Parsons, A.M.; et al. The Second Swift Burst Alert Telescope Gamma-ray Burst Catalog. Astrophys. J. Suppl. Ser. 2011, 195, 27. [Google Scholar] [CrossRef]
- Sakamoto, T.; Pal’Shin, V.; Yamaoka, K.; Ohno, M.; Sato, G.; Aptekar, R.; Barthelmy, S.D.; Baumgartner, W.H.; Cummings, J.R.; Fenimore, E.E.; et al. Spectral Cross-Calibration of the Konus–Wind, the Suzaku/WAM, and the Swift/BAT Data Using Gamma-ray Bursts. Publ. Astron. Soc. Jpn. 2011, 63, 215–277. [Google Scholar] [CrossRef]
- Gruber, D.; Goldstein, A.; von Ahlefeld, V.W.; Bhat, P.N.; Bissaldi, E.; Briggs, M.S.; Byrne, D.; Cleveland, W.H.; Connaughton, V.; Diehl, R.; et al. The Fermi GBM Gamma-ray Burst Spectral Catalog: Four Years of Data. Astrophys. J. Suppl. Ser. 2014, 211, 27. [Google Scholar] [CrossRef]
- Von Kienlin, A.; Meegan, C.A.; Paciesas, W.S.; Bhat, P.N.; Bissaldi, E.; Briggs, M.S.; Burgess, J.M.; Byrne, D.; Chaplin, V.; Cleveland, W.; et al. The Second Fermi GBM Gamma-ray Burst Catalog: The First Four Years. Astrophys. J. Suppl. Ser. 2014, 211, 13. [Google Scholar] [CrossRef]
- Bhat, P.N.; Meegan, C.A.; von Kienlin, A.; Paciesas, W.S.; Briggs, M.S.; Burgess, J.M.; Burns, E.; Chaplin, V.; Cleveland, W.H.; Collazzi, A.C.; et al. The Third Fermi GBM Gamma-ray Burst Catalog: The First Six Years. Astrophys. J. Suppl. Ser. 2016, 223, 18. [Google Scholar] [CrossRef]
- Sari, R.; Piran, T.; Narayan, R. Spectra and Light curves of Gamma-ray Bursts Afterglows. Astrophys. J. Lett. 1998, 497, L17–L20. [Google Scholar] [CrossRef]
- Preece, R.D.; Briggs, M.S.; Mallozzi, R.S.; Pendleton, G.N.; Paciesas, W.S.; Band, D.L. The Synchrotron Shock Model Confronts a “Line of Death” in the BATSE Gamma-ray Burst Data. Astrophys. J. Lett. 1998, 506, L23–L26. [Google Scholar] [CrossRef]
- Norris, J.P.; Share, G.H.; Messina, D.C.; Dennis, B.R.; Desai, U.D.; Cline, T.L.; Matz, S.M.; Chupp, E.L. Spectral Evolution of Pulse Structures in Gamma-ray Burst. Astrophys. J. 1986, 301, 213–219. [Google Scholar] [CrossRef]
- Golenetskii, S.V.; Mazets, E.P.; Aptekar, R.L.; Ilinskii, V.N. Correlation between Luminosity and Temperature in Gamma-ray Burst Sources. Nature 1983, 306, 451–453. [Google Scholar] [CrossRef]
- Lu, R.J.; Hou, S.J.; Liang, E.W. The Epeak-Flux Correlation in the Rising and Decaying Phases of Gamma-ray Burst Pulses: Evidence for Viewing Angle Effect? Astrophys. J. 2010, 720, 1146–1154. [Google Scholar] [CrossRef]
| 1. | |
| 2. | |
| 3. |


| GRB | [keV] | |
|---|---|---|
| GRB081209981 | ||
| GRB081216531 | ||
| GRB081223419 | ||
| GRB081226509 | ||
| GRB090228204 | ||
| GRB090305052 | ||
| GRB090308734 | ||
| GRB090617208 | ||
| GRB090907808 | ||
| GRB091126333 | ||
| GRB100206563 | ||
| GRB100525744 | ||
| GRB100625773 | ||
| GRB100629801 | ||
| GRB100811108 | ||
| GRB101031625 | ||
| GRB101216721 | ||
| GRB110526715 | ||
| GRB110705151 | ||
| GRB111103948 | ||
| GRB111222619 | ||
| GRB120323507 | ||
| GRB120603439 | ||
| GRB120811014 | ||
| GRB120817168 | ||
| GRB120830297 | ||
| GRB121012724 | ||
| GRB130204484 | ||
| GRB130307126 | ||
| GRB130628860 | ||
| GRB130701761 | ||
| GRB130912358 | ||
| GRB131126163 | ||
| GRB131217108 | ||
| GRB140105065 | ||
| GRB140209313 | ||
| GRB140511095 | ||
| GRB140605377 | ||
| GRB140626843 | ||
| GRB140807500 | ||
| GRB140901821 | ||
| GRB141011282 | ||
| GRB141105406 | ||
| GRB150118927 | ||
| GRB150506630 | ||
| GRB150604434 | ||
| GRB150811849 | ||
| GRB150819440 | ||
| GRB151231568 | ||
| GRB160406503 | ||
| GRB160804180 | ||
| GRB160806584 | ||
| GRB160820496 | ||
| GRB160821937 | ||
| GRB160822672 | ||
| GRB170121133 | ||
| GRB170127634 | ||
| GRB170206453 | ||
| GRB170305256 | ||
| GRB170325331 |
| GRB | [keV] | |
|---|---|---|
| GRB081009140 | ||
| GRB081215784 | ||
| GRB090424592 | ||
| GRB090719063 | ||
| GRB090804940 | ||
| GRB091127976 | ||
| GRB100131730 | ||
| GRB100324172 | ||
| GRB100722096 | ||
| GRB100829876 | ||
| GRB100910818 | ||
| GRB101208498 | ||
| GRB110817191 | ||
| GRB110921912 | ||
| GRB111220486 | ||
| GRB120129580 | ||
| GRB120204054 | ||
| GRB120217904 | ||
| GRB120328268 | ||
| GRB120426090 | ||
| GRB120728434 | ||
| GRB120801920 | ||
| GRB130121835 | ||
| GRB130228212 | ||
| GRB130306991 | ||
| GRB130425327 | ||
| GRB130502327 | ||
| GRB130815660 | ||
| GRB130821674 | ||
| GRB131108862 | ||
| GRB131214705 | ||
| GRB131229277 | ||
| GRB140213807 | ||
| GRB140523129 | ||
| GRB140621827 | ||
| GRB140801792 | ||
| GRB141222298 | ||
| GRB150330828 | ||
| GRB150403913 | ||
| GRB150426594 | ||
| GRB151227072 | ||
| GRB151227218 | ||
| GRB151231443 | ||
| GRB160113398 | ||
| GRB160516237 | ||
| GRB160521385 | ||
| GRB160724444 | ||
| GRB16080225 | ||
| GRB160816730 | ||
| GRB160910722 | ||
| GRB161218356 | ||
| GRB170207906 | ||
| GRB170511249 | ||
| GRB170522657 | ||
| GRB170626401 | ||
| GRB170802638 | ||
| GRB170826819 | ||
| GRB171120556 | ||
| GRB180120207 |
© 2018 by the authors. Licensee MDPI, Basel, Switzerland. This article is an open access article distributed under the terms and conditions of the Creative Commons Attribution (CC BY) license (http://creativecommons.org/licenses/by/4.0/).
Share and Cite
Sakamoto, T.; Yoshida, Y.; Serino, M. Investigation of Similarity in the Spectra between Short- and Long-Duration Gamma-ray Bursts. Galaxies 2018, 6, 106. https://doi.org/10.3390/galaxies6040106
Sakamoto T, Yoshida Y, Serino M. Investigation of Similarity in the Spectra between Short- and Long-Duration Gamma-ray Bursts. Galaxies. 2018; 6(4):106. https://doi.org/10.3390/galaxies6040106
Chicago/Turabian StyleSakamoto, Takanori, Yuuki Yoshida, and Motoko Serino. 2018. "Investigation of Similarity in the Spectra between Short- and Long-Duration Gamma-ray Bursts" Galaxies 6, no. 4: 106. https://doi.org/10.3390/galaxies6040106
APA StyleSakamoto, T., Yoshida, Y., & Serino, M. (2018). Investigation of Similarity in the Spectra between Short- and Long-Duration Gamma-ray Bursts. Galaxies, 6(4), 106. https://doi.org/10.3390/galaxies6040106