Abstract
We report on the optical observations and analysis of the high-energy peaked BL Lac object (HBL), Mrk 501, at redshift z = 0.033. We can confirm microvariable behavior over the course of minutes on several occasions per night. As an alternative to the commonly understood dynamical model of random variations in intensity of the AGN, we develop a relativistic beaming model with a minimum of free parameters, which allows us to infer changes in the line of sight angles for the motion of the different relativistic components. We hope our methods can be used in future studies of beamed emission in other active microvariable sources, similar to the one we explored.
1. Introduction
Mrk 501 at z = 0.033 [1] is a TeV blazar [2] that can be detected at all wavelengths, from radio waves to TeV γ rays. Such blazars are highly variable BL Lac objects, even at very high energies [3], which is often interpreted as AGN with relativistic beaming properties. Indeed, the high frequency component of the spectrum is generally attributable to inverse Compton scattering, i.e., Doppler boosting from relativistic electrons of lower energy spectral components.
This object is a microvariable source as well. It produces very high cadence variations in the optical, a phenomenon that has been studied by many but is not represented by any single coherent or a generally accepted model. Indeed, one such model for such rapid variation, for example, is magnetic reconnection [4,5]. What has generally been understood is that relativistic jets are an important contribution to such variability [6,7].
Therefore, there are ample reasons to believe that there are a number of relativistic components aligned closely to the line of sight for this object. Indeed, the challenge is finding and describing the relativistic components from an optical light curve—something we would wish to accomplish here. We present a geometrical beaming model as an alternative to naturally or intrinsically occurring variations in intensity by other means.
2. Observations
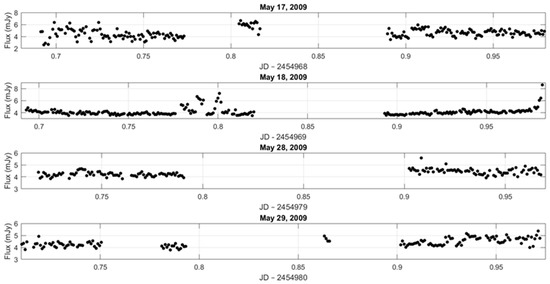
Observations of Mrk 501 were taken over several nights. All images were taken with the Johnson–Cousins R filter, and with the Remote Observatory for Variable Object Research (ROVOR) robotic telescope of Brigham Young University [8]. This automated telescope is a 0.4 m f/9 optical telescope located in Central Utah and was constructed for rapid cadence observations. The telescope uses an Apogee Ap47p camera with a 1024 × 1024 13 μm pixel Marconi 47-10 CCD detector. All images were binned 2 × 2 before data reduction. Figure 1 shows the raw light curves for four different nights. The typical statistical error is 0.5%. The data logs are shown in Table 1 below, indicating the date of observation, the number of data points, and the time duration of the night for each object.

Figure 1.
The raw light curves for four different nights for Mrk 501. The statistical error bars are ~0.5%, and the host galaxy flux is subtracted.

Table 1.
Record of the microvariability observations of Mrk 501.
All images were reduced using Mira Pro 7.0 proprietary image processing software [9]. Aperture photometry was performed using an aperture with a 15” diameter. The finding chart and comparison star magnitudes were taken from Villata et al. [10].
3. Results
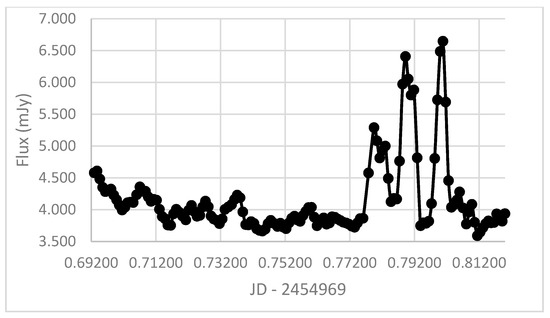
Once we collected the data, we converted apparent magnitude values to flux values. Then we subtracted the host galaxy flux [11] to present only the variable contribution of the AGN itself. Finally, we employed standard smoothing and curve fitting algorithms. We then evaluated the light curve and scrutinized it for micro-outbursts. The quiescent flux has a standard deviation, σ, of 5%. We use 2σ above median as the criterion for acceptance of a microflare. This implies expecting 2.5% random fluctuations, or false positives. Any flux more than 10% greater than the median value for quiescence over each pair of nights was deemed to be a micro-outburst. We have smoothed the raw data. In the smoothing process, each point is weighted with the adjacent points: . Figure 2 shows a sample of smoothed data (18 May 2009) for Mrk 501. The systematic uncertainty in the data is around 1% or less.

Figure 2.
A sample light curve consisting of smoothed data (18 May 2009) for Mrk 501. The statistical error bars are ~0.5%, and the host galaxy flux is subtracted.
If calculated as belonging to an isotropic source, the micro-outbursts would be sub-Eddington and therefore do not directly reveal relativistic components. Nevertheless, the time duration of these outbursts can be seen by inspection to be as little as a few minutes, shown in Figure 1 and Figure 2; it is very short, implying that some kind of beaming mechanism is in play. Alternatively, we would have to infer that the emitting region of such emission, taken from standard light travel time arguments, is very small indeed [12].
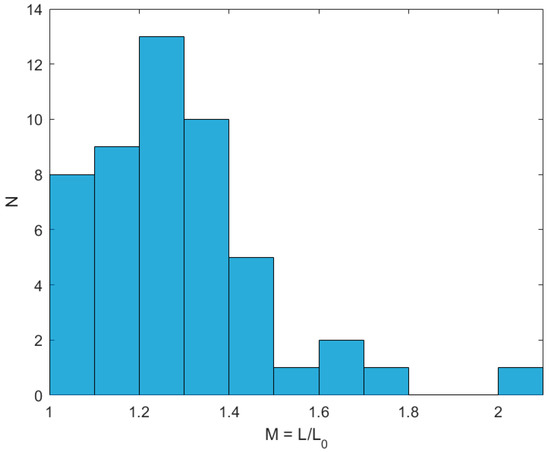
Finally, after all the light curves were characterized, a histogram of the amplitudes was compiled as shown in Figure 3. As one can see, over the course of four nights (a total of more than 26 h of integration time), there were literally dozens of micro-outbursts. They vary in amplitude from the minimum accepted to be counted as a micro-outburst, 10% luminosity enhancement, to approximately a factor of two brighter than quiescence. In the histogram shown in Figure 3, most outbursts form a distribution at lower amplitudes, as would be expected, with a small contingent represented at higher amplitudes.

Figure 3.
Distribution of micro-outbursts in Mrk 501 over four nights, by amplitude.
4. Analysis
We would like to consider a strictly geometric model to analyze the data. The advantage of such a model is that there would be a minimum of free parameters to be considered. Geometric models such as the one we present have been considered in the past. For instance, a shifting jet is considered in the long-term activity of CTA 102 [13]. In our case, however, due to the microvariable nature of our source, we are considering multiple relativistic components, but with differing angles to the line of sight. Figure 4 shows a sketch of the geometry for a single relativistic jet that we wish to consider. Our goal, then, is to determine, for a reasonable Lorentz factor, γ, the angle to the line of sight, θ, implied for our distribution of outbursts. We take the Lorentz factor γ to be 10, which is consistent with results from studies of superluminal motion, and has been taken as a typical canonical value [14]. Our subsequent calculation for the angle to the line of sight does not depend very much on our choice of γ, so long as γ2 >> 1 and θ2 << 1 [14]. Indeed, we considered values of γ from 7 to 15 and our results changed very little.

Figure 4.
Geometric model depicting the source sending out components, which result in relativistic beaming. The Lorentz factor γ is taken to be 10, and the angle to the line of sight is designated θ as shown.
We begin by considering in Equation (1) the luminosity enhancement due to relativistic beaming [15].
where L0 is the baseline or median flux of approximately 4 mJy, and δ is the Doppler beaming factor:
and
is the speed of the beam in the AGN frame. The exponent to the Doppler factor is generally taken to be 2, as we do here, but some have pointed out that, for “blobs,” perhaps the exponent should be 3 [16]. Since Mrk 501 is a highly variable blazar, it is not unreasonable to consider the baseline (quiescent) emission itself to be beamed. As it turns out, the difference in the determination of the angle to the line of sight is only slightly affected by the choice of exponent. We will use Equation (1) for quiescent emission, , for enhanced (micro-outburst) emission . Finally, we also define the luminosity magnification as follows:
From this, one finds that the corresponding outburst Doppler factor is .
We used , so . If we assume that the viewing angle for the quiescent emission () is , then Equation (2) yields .
With these equations in hand, we can refer to the histogram shown in Figure 3 and calculate the luminosity enhancement and angle to the line of sight for the micro-outburst events. One can find the value of corresponding to the largest bursts from the histogram, use to find , and finally find the beaming angle from Equation (2). A detailed exposition of the largest micro-outburst is shown in Table 2. Here, the time interval represents from the beginning to end of each outburst. We bring to the reader’s attention that, when the inferred angle changes a little, the full distribution of amplitudes () is revealed, as we have documented here.

Table 2.
Summary of the maximum micro-outburst data.
5. Conclusions
For our object, Mrk 501, the microvariable activity consists of a number of outbursts during the four nights observed. Pooling all these events together allows us to see that for the most part, they show a rapidly decreasing distribution in amplitude, with a tail towards higher amplitude. All of this is modeled in terms of relativistic beaming of a source whose direction changes slightly from event to event.
In using a strictly geometric model of relativistic beaming to analyze our data, we have made the assumption that we are dealing with a fixed Lorentz factor γ (taken to be 10), and we vary only the angle to our line of sight, θ. One could conceive of an alternative scenario. One could posit a fixed angle θ and deal with a distribution of Lorentz factor γ (in which the kinetic energy per unit mass is γ − 1). There are general conservation of energy considerations that would argue against this, but to be more specific, if one were to pick a plausible and likely fixed angle θ taken from the data, then the distribution of Lorentz factors γ would be skewed and biased towards higher values, something that may be unphysical.
The micro-variability we observed in the optical coincides with the intra-night variability reported at TeV energies in May 2009 [17]. They may be physically related, but unfortunately, the time resolution in the optical is minutes or better, while that in the TeV is much longer. One can say that, in the TeV, the source has varied within a day, but to give more detail than that with any assurance is not possible. To do better, one would need much better sampling (cadence), so a comparison between optical and TeV events is impossible due to insufficient temporal information in TeV.
Nevertheless, it may be worth speculating what such a coincidence in variability may mean. These two different energy regimes may represent independent though perhaps similar phenomena. The amplitude change in TeV seems to be much greater (as is typical for high energy) than in the optical, and for a pure beaming model, this would indicate a much smaller angle. One could still retain a beaming model, but one would then have to posit a second source of beaming. Since TeV radiation is probably due to multiple relativistic boosting events, this scenario would be entirely plausible.
The primary purpose of this exercise is to identify relativistic components and characterize them specifically for one HBL source, Mrk 501. This is not to imply, however, that the only reasonable possibility to explain fast variability in Mrk 501 is through changes in the Doppler factor through viewing angle changes. We simply present our model as another alternative to dynamical models such as the well documented presentations of magnetic reconnection [4,5] among other interesting scenarios proposed.
We present here a relativistic jet model through a geometrical model of relativistic beaming with a fixed Lorentz factor γ. The results of our work are shown in Table 2. Much of this exercise could be applied to other HBL sources as well; indeed, many of those sources have a history of microvariability. Indeed, it can even be applied to other sources whose cadence of variability is much longer. We hope to extend this analysis to other similar microvariable sources using the aforementioned statistical techniques and geometrical model.
Acknowledgments
We gratefully acknowledge the contributions of Robert Nelson and Jeremy Judge for help with the computations, and Hannah Rafle for early inspiration.
Author Contributions
All authors contributed actively to the paper. J. Ward Moody provided the observations, Alberto Sadun the data reduction, and Masoud Asadi-Zeydabadi and Brian Mills the computational support.
Conflicts of Interest
Alberto C. Sadun is on the editorial board of Galaxies.
References
- De Vaucouleurs, G. Third Reference Catalogue of Bright Galaxies; Springer-Verlag: Berlin, Germany, 1991; Volume III. [Google Scholar]
- Zheng, Y.G.; Zhang, L. Rapid TeV Flaring in Markarian 501. Astrophys. J. 2011, 728, 105–110. [Google Scholar] [CrossRef]
- Albert, J.; Aliu, E.; Anderhub, H.; Antoranz, P.; Armada, A.; Baixeras, C.; Barrio, J.A.; Bartko, H.; Bastieri, D.; Becker, J.K.; et al. Variable VHE γ-ray emission from Markarian 501. Astrophys. J. 2007, 667, 862–883. [Google Scholar] [CrossRef]
- Giannios, D.; Uzdensky, D.; Begelman, M. Fast TeV variability in blazars: Jets in a jet. Mon. Not. R. Astron. Soc. 2010, 402, 1649–1656. [Google Scholar]
- Nalewajkom, K.; Giannios, D.; Begelman, M. Radiative properties of reconnection-powered minijets in blazars. Mon. Not. R. Astron. Soc. 2011, 413, 333–346. [Google Scholar] [CrossRef]
- Camenzind, M.; Krockenberger, M. The lighthouse effect of relativistic jets in blazars—A geometric origin of intraday variability. Astron. Astrophys. 1992, 255, 59–62. [Google Scholar]
- Webb, J.R. Multi-Frequency Blazar Micro-Variability as a Tool to Investigate Relativistic Jets. Galaxies 2016, 4, 15. [Google Scholar] [CrossRef]
- Moody, J.W.; Boizelle, B.; Bates, K.; Little, B.; McCombs, T.; Nelson, J.; Pace, C.; Pearson, R.L.; Harrison, J.; Brown, P.J.; et al. Remote Observatory for Variable Object Research (ROVOR). Publ. Astron. Soc. Pac. 2012, 124, 956–962. [Google Scholar] [CrossRef]
- Mirametrics, Inc. Available online: http://www.mirametrics.com/index.php (accessed on 26 January 2018).
- Villata, M.; Raiteri, C.M.; Lanteri, L.; Sobrito, G.; Cavellone, M. BVR photometry of comparison stars in selected blazar fields. Astron. Astrophys. Suppl. Ser. 1998, 130, 305–310. [Google Scholar] [CrossRef]
- Nilsson, K.; Pasanen, M.; Takalo, L.O.; Lindfors, E.; Berdyugin, A.; Ciprini, S.; Pforr, J. Host galaxy subtraction of TeV candidate BL Lacertae objects. Astron. Astrophys. 2007, 475, 199–207. [Google Scholar] [CrossRef]
- Carroll, B.W.; Ostlie, D.A. An Introduction to Modern Astrophysics; Addison-Wesley Publishing: New York, NY, USA, 1996; p. 1181. [Google Scholar]
- Raiteri, C.M.; Villata, M.; Acosta-Pulido, J.A.; Agudo, I.; Arkharov, A.A.; Bachev, R.; Baida, G.V.; Benίtez, E.; Borman, G.A.; Boschin, W.; et al. Blazar spectral variability as explained by a twisting inhomogeneous jet. Nature 2017, 552, 374–377. [Google Scholar] [CrossRef] [PubMed]
- Sadun, A. A Complete Spectral Analysis of the Flare of the Quasar 3C 273. J. R. Astron. Soc. Can. 1992, 86, 15–30. [Google Scholar]
- Cohen, M.H.; Lister, M.L.; Homan, D.C.; Kadler, M.; Kellermann, K.I.; Kovalev, Y.Y.; Vermeulen, R.C. Relativistic Beaming and the Intrinsic Properties of Extragalactic Radio Jets. Astrophys. J. 2007, 658, 232–244. [Google Scholar] [CrossRef]
- Ubachukwu, A.A.; Chukwude, A.E. On the Relativistic Beaming and Orientation Effects in Core-Dominated Quasars. J. Astrophys. Astron. 2002, 23, 235–242. [Google Scholar] [CrossRef]
- Ahnen, M.L.; Ansoldi, S.; Antonelli, L.A.; Antoranz, P.; Babic, A.; Banerjee, B.; Bangale, P.; Barres de Almeida, U.; Barrio, J.A.; Becerra González, J.; et al. Multiband variability studies and novel broadband SED modeling of Mrk 501 in 2009. Astron. Astrophys. 2017, 603, 31–60. [Google Scholar] [CrossRef]
© 2018 by the authors. Licensee MDPI, Basel, Switzerland. This article is an open access article distributed under the terms and conditions of the Creative Commons Attribution (CC BY) license (http://creativecommons.org/licenses/by/4.0/).