Optical Polarimetry and Radio Observations of PKS1510-089 between 2009 and 2013


Abstract
:1. Introduction
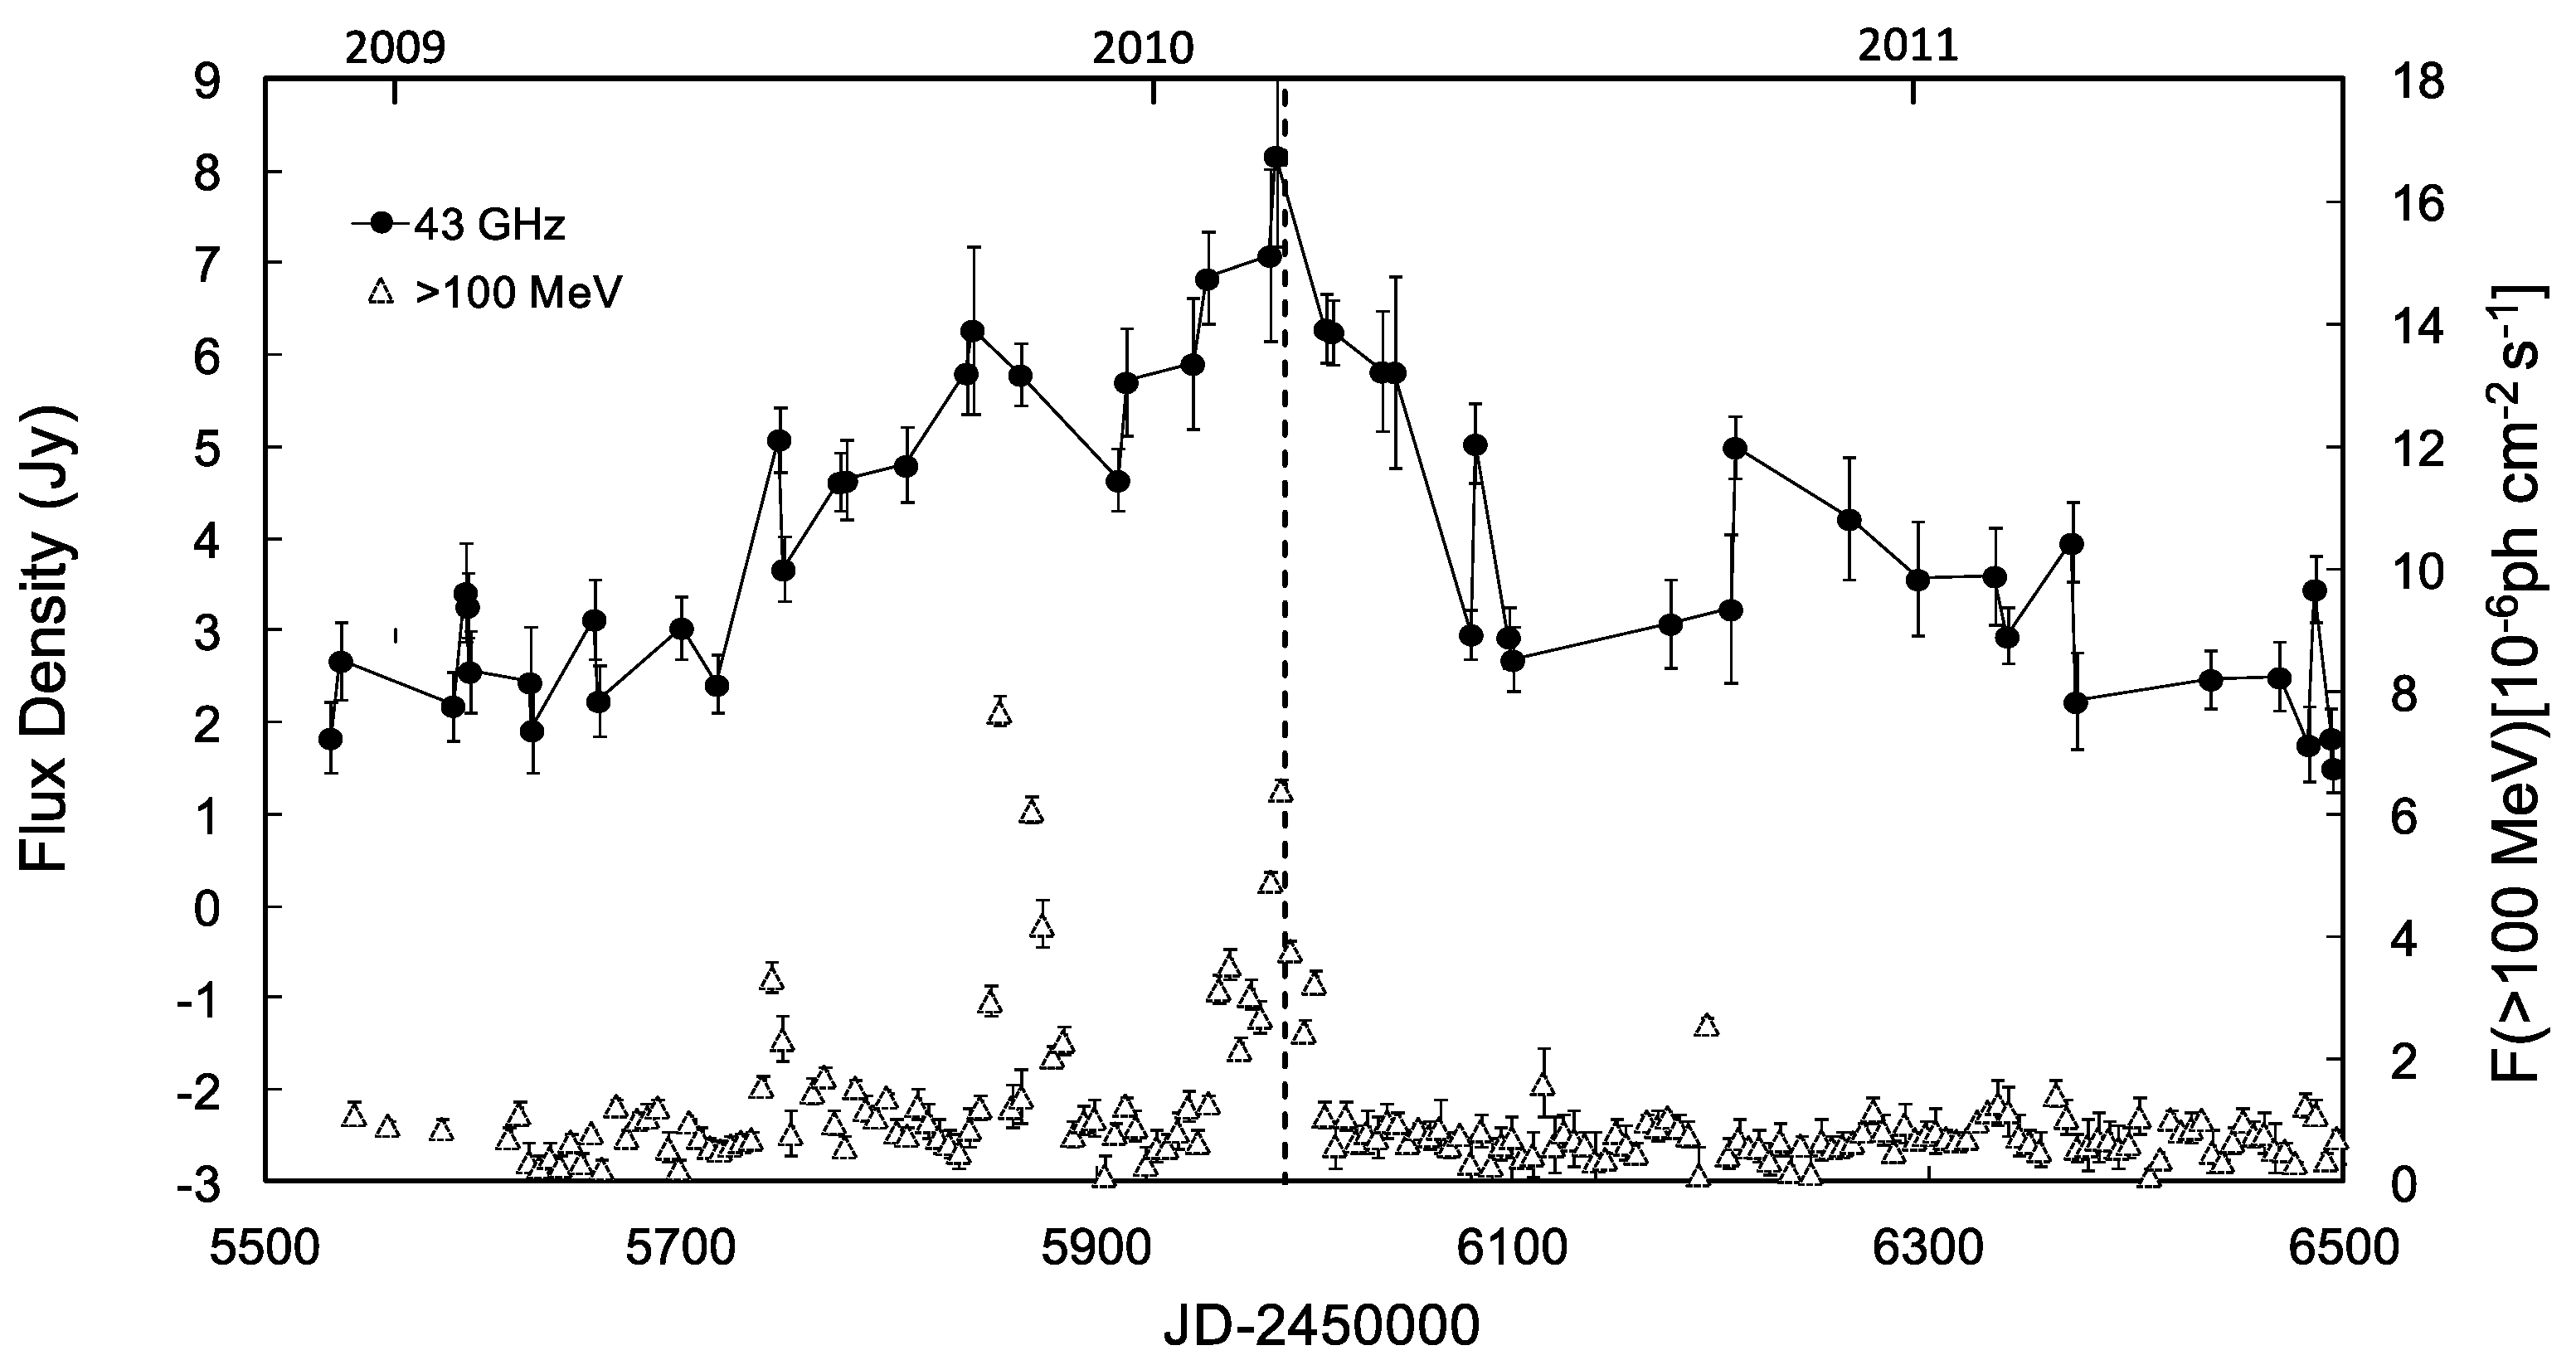
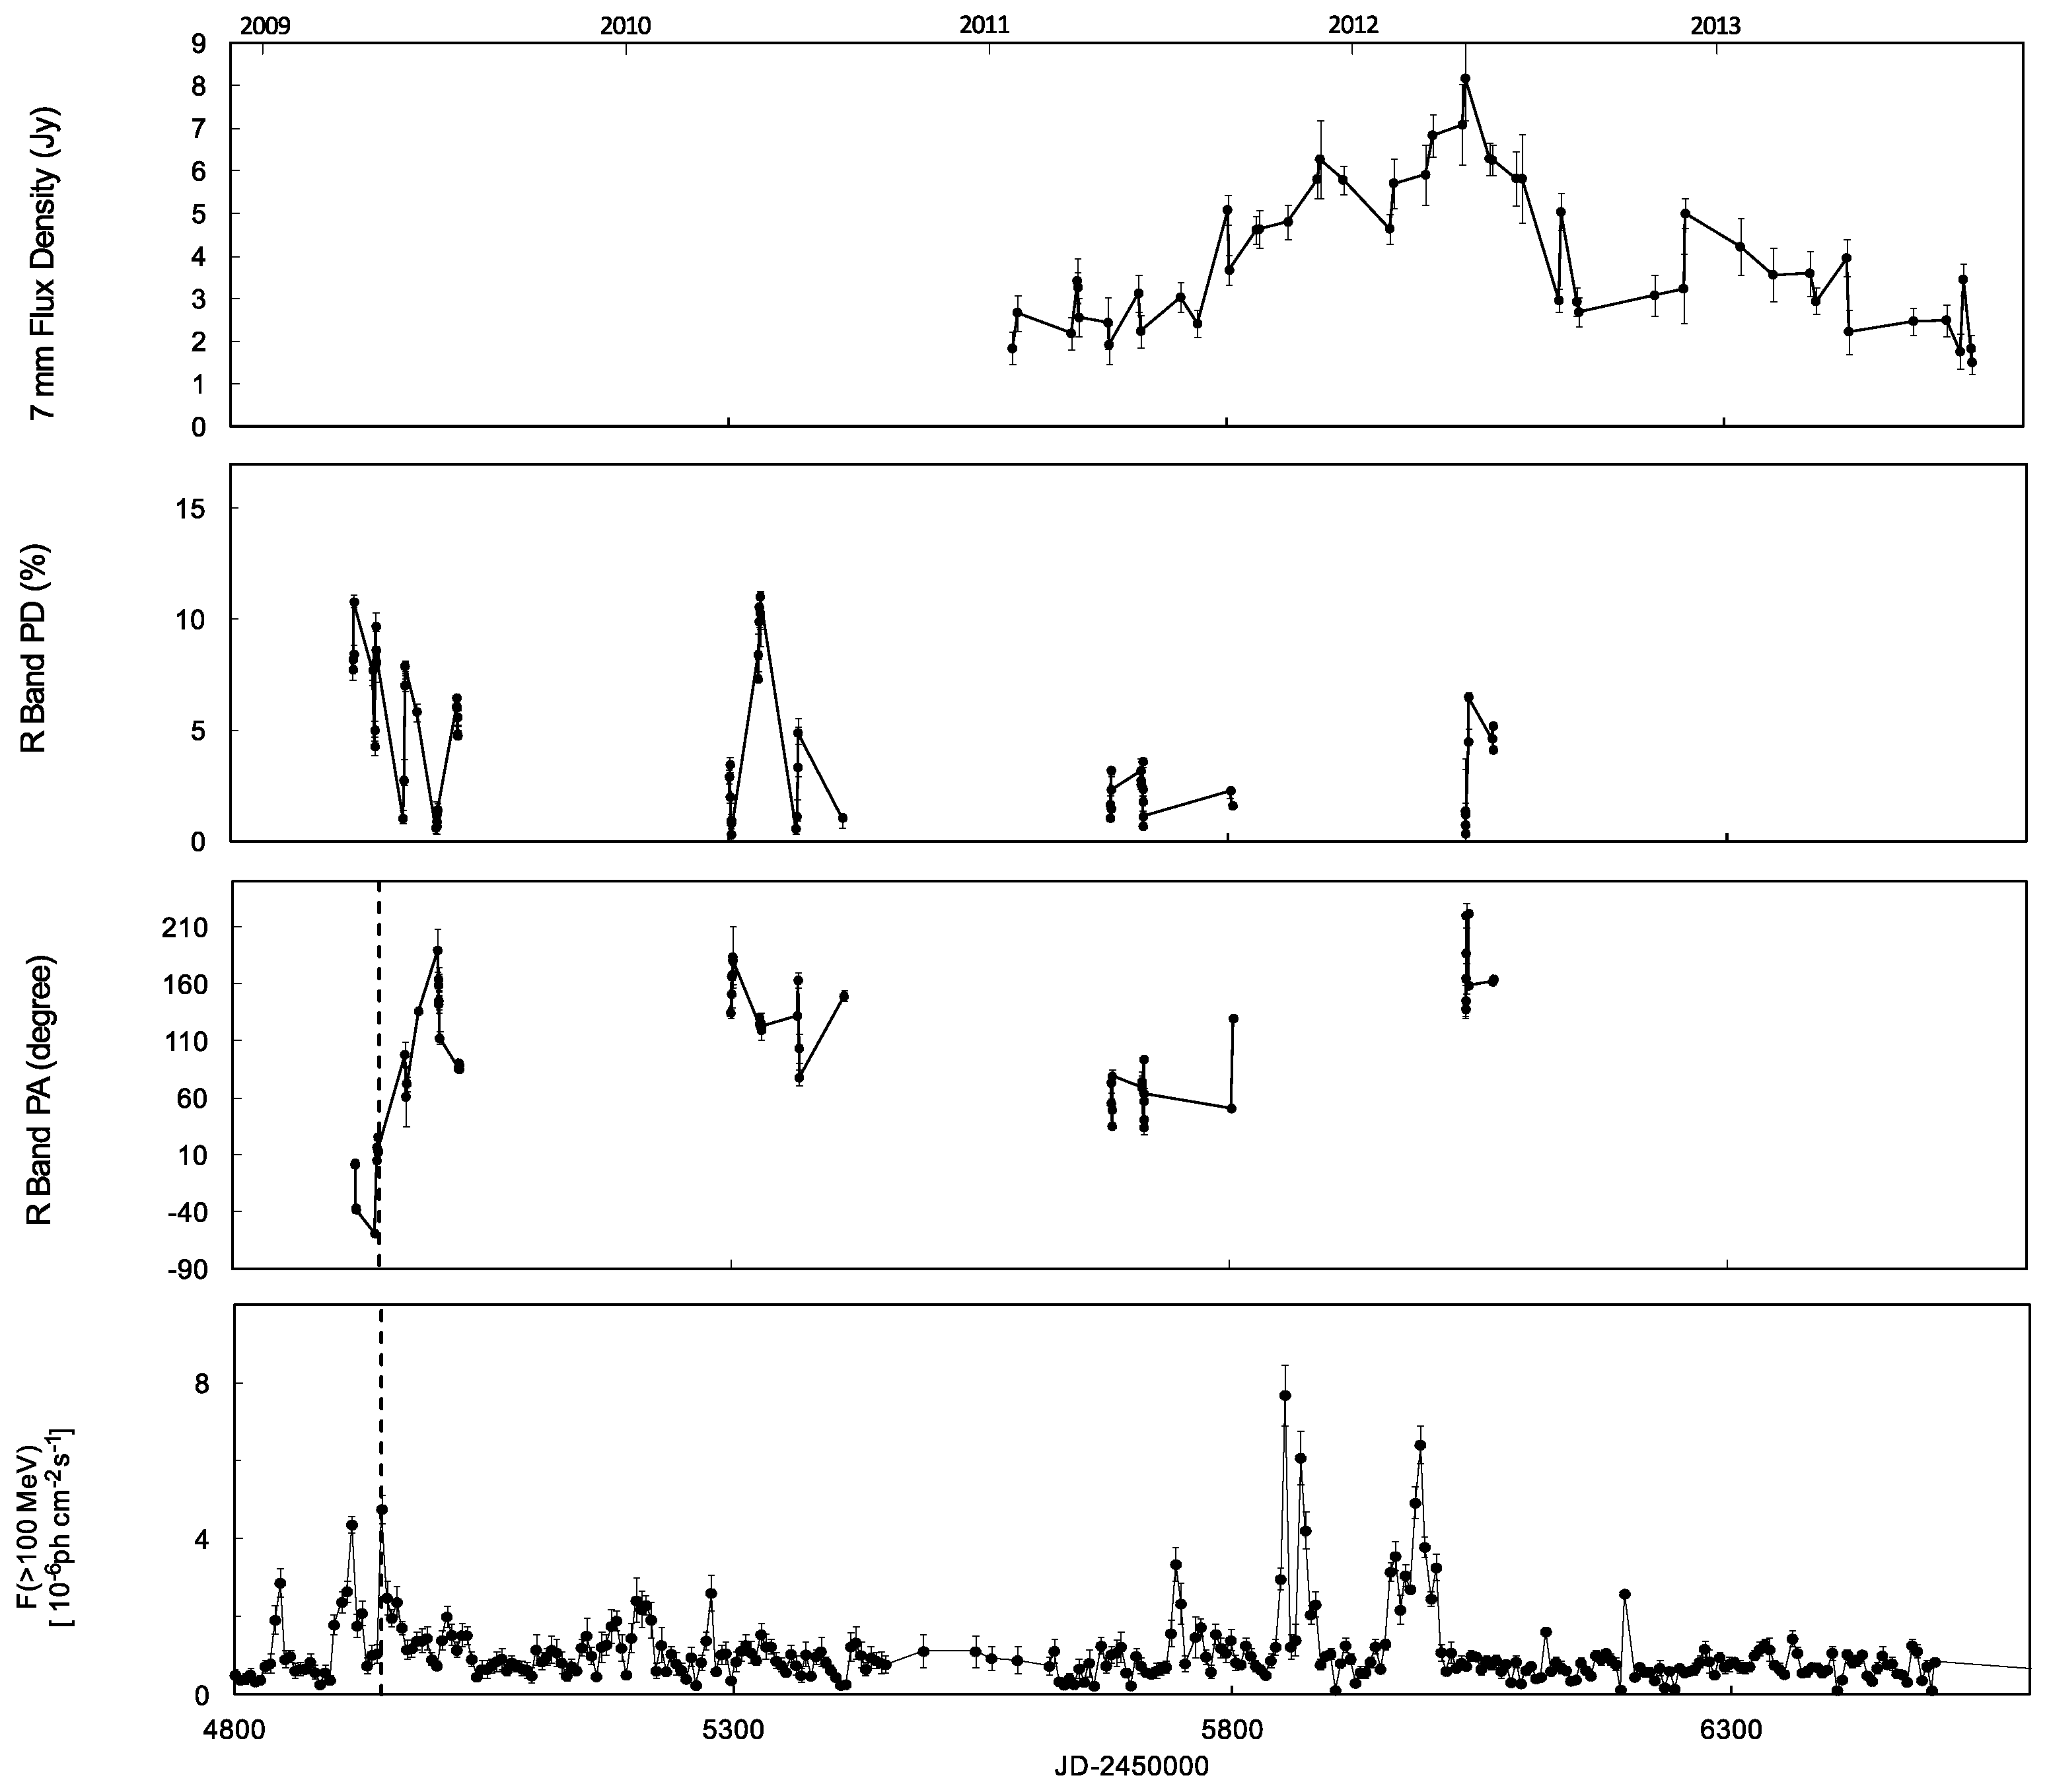
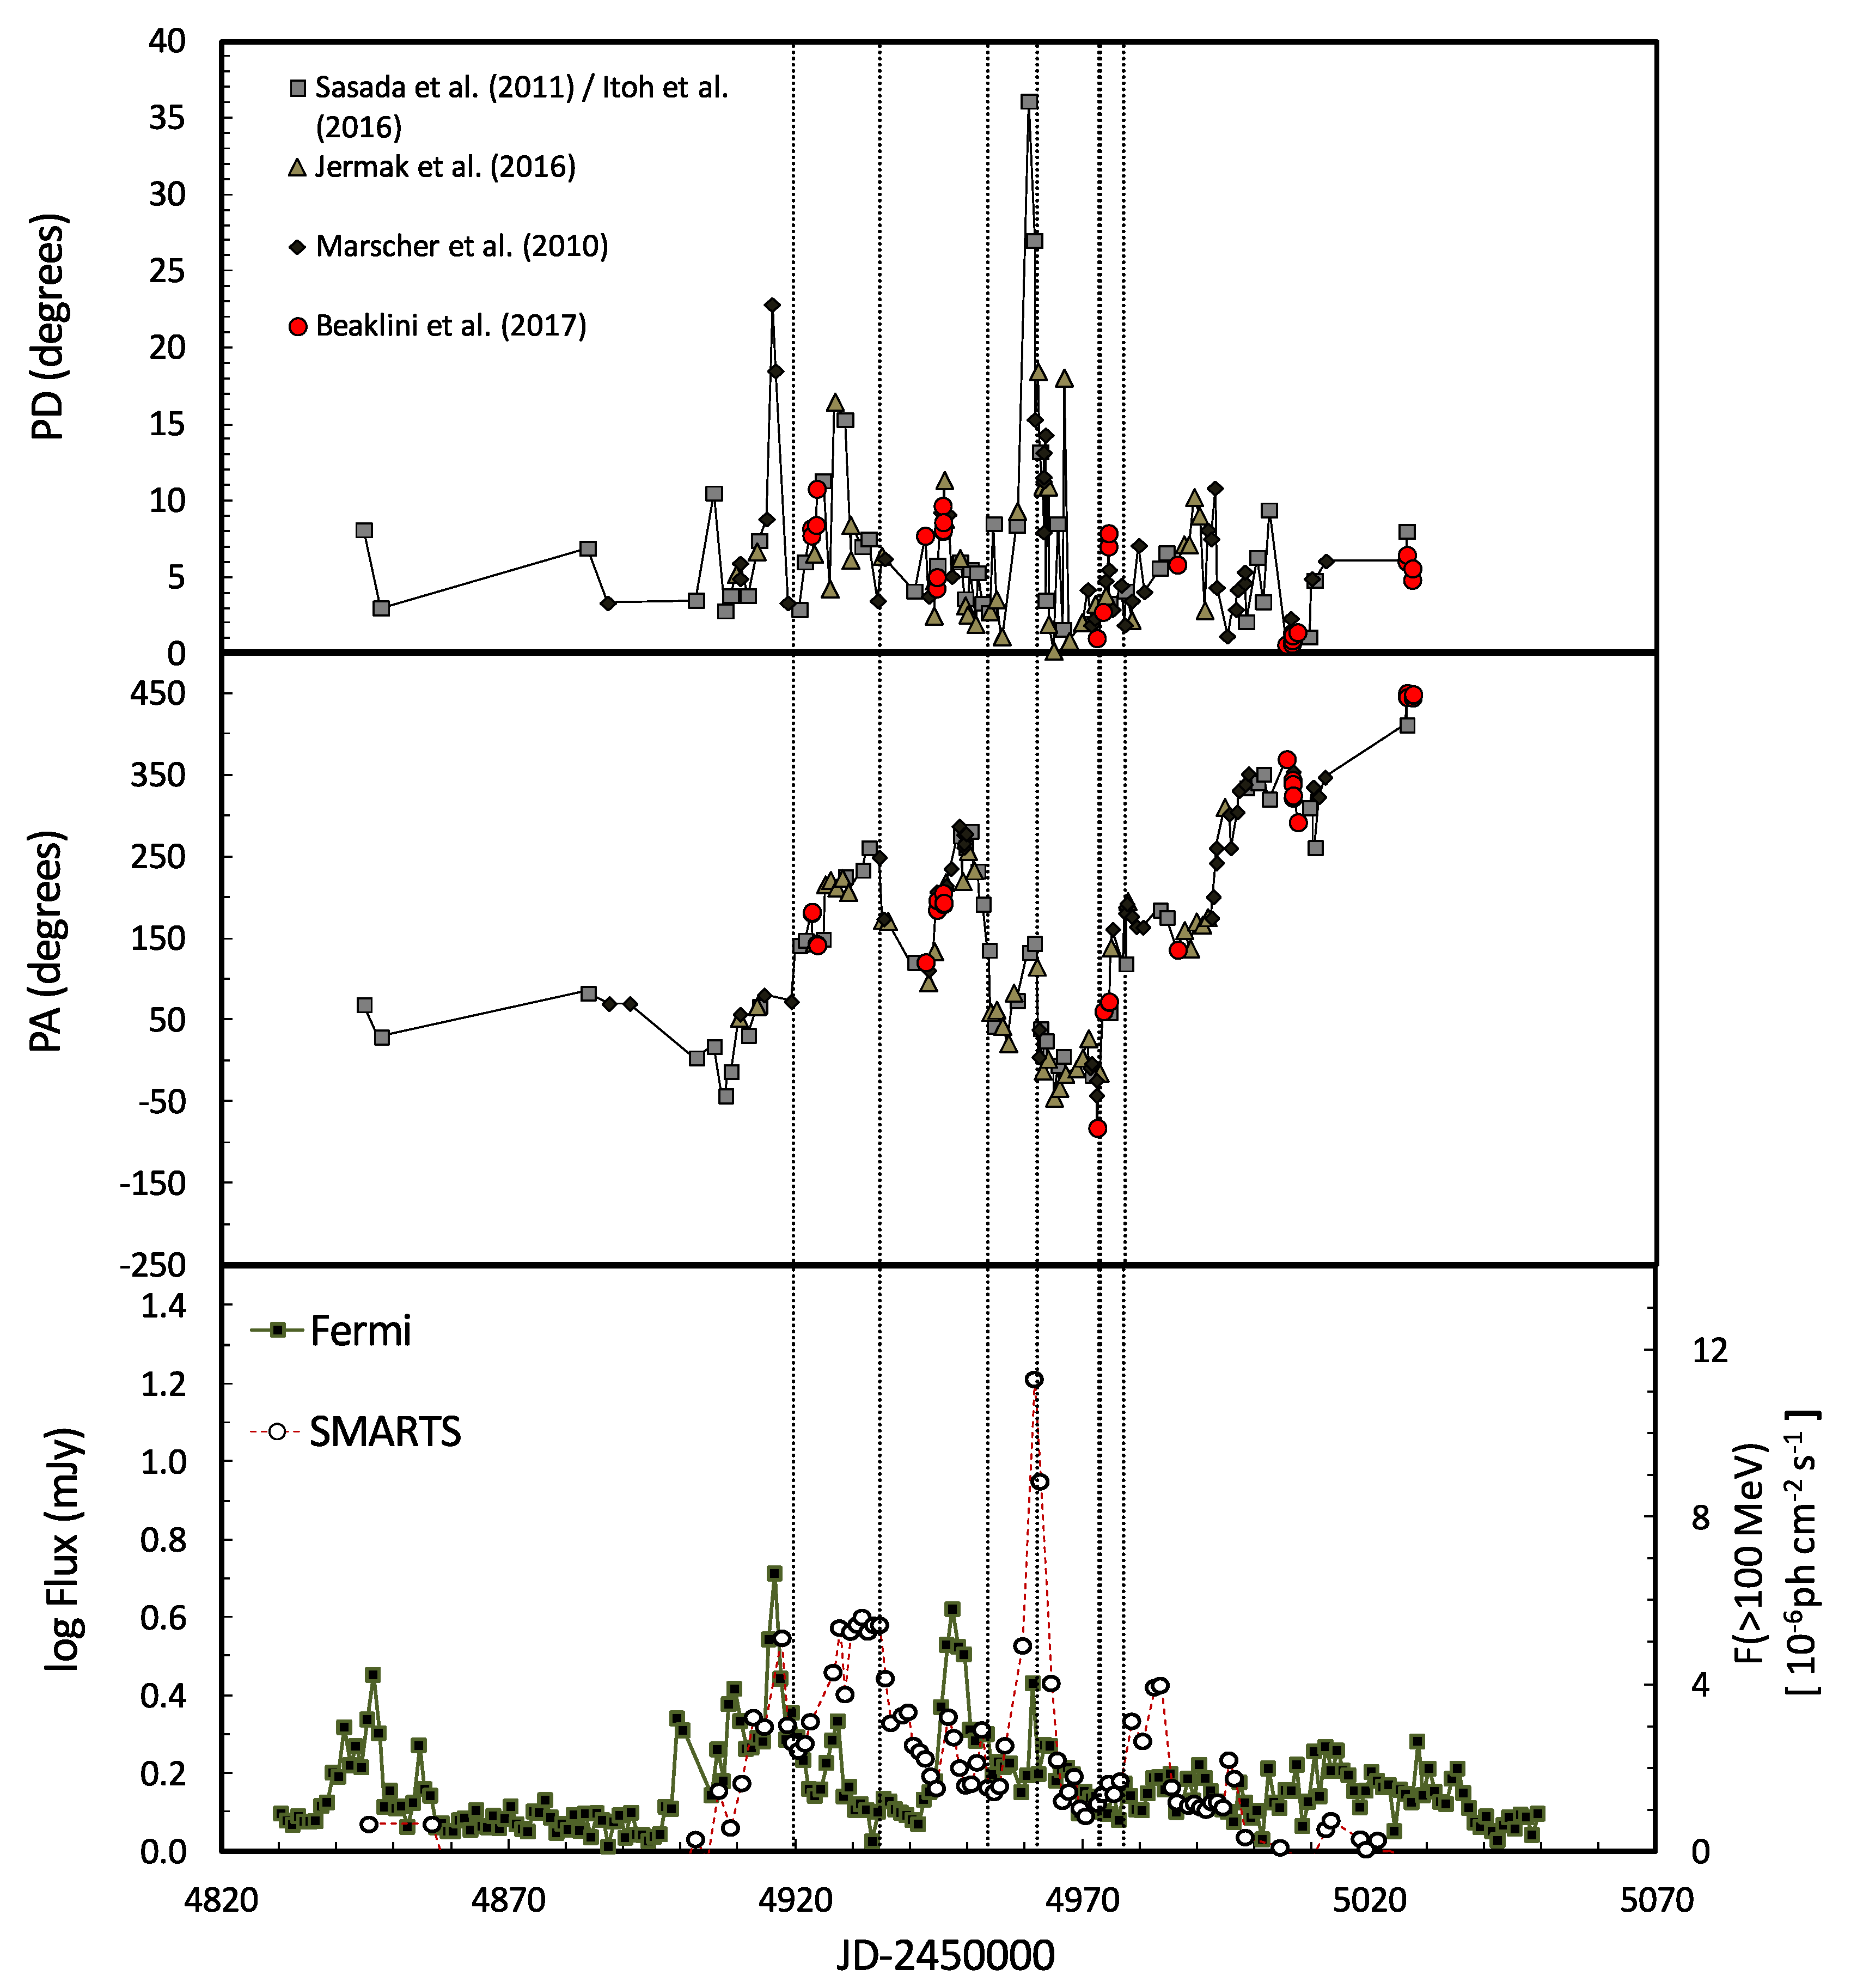
2. Observation and Results
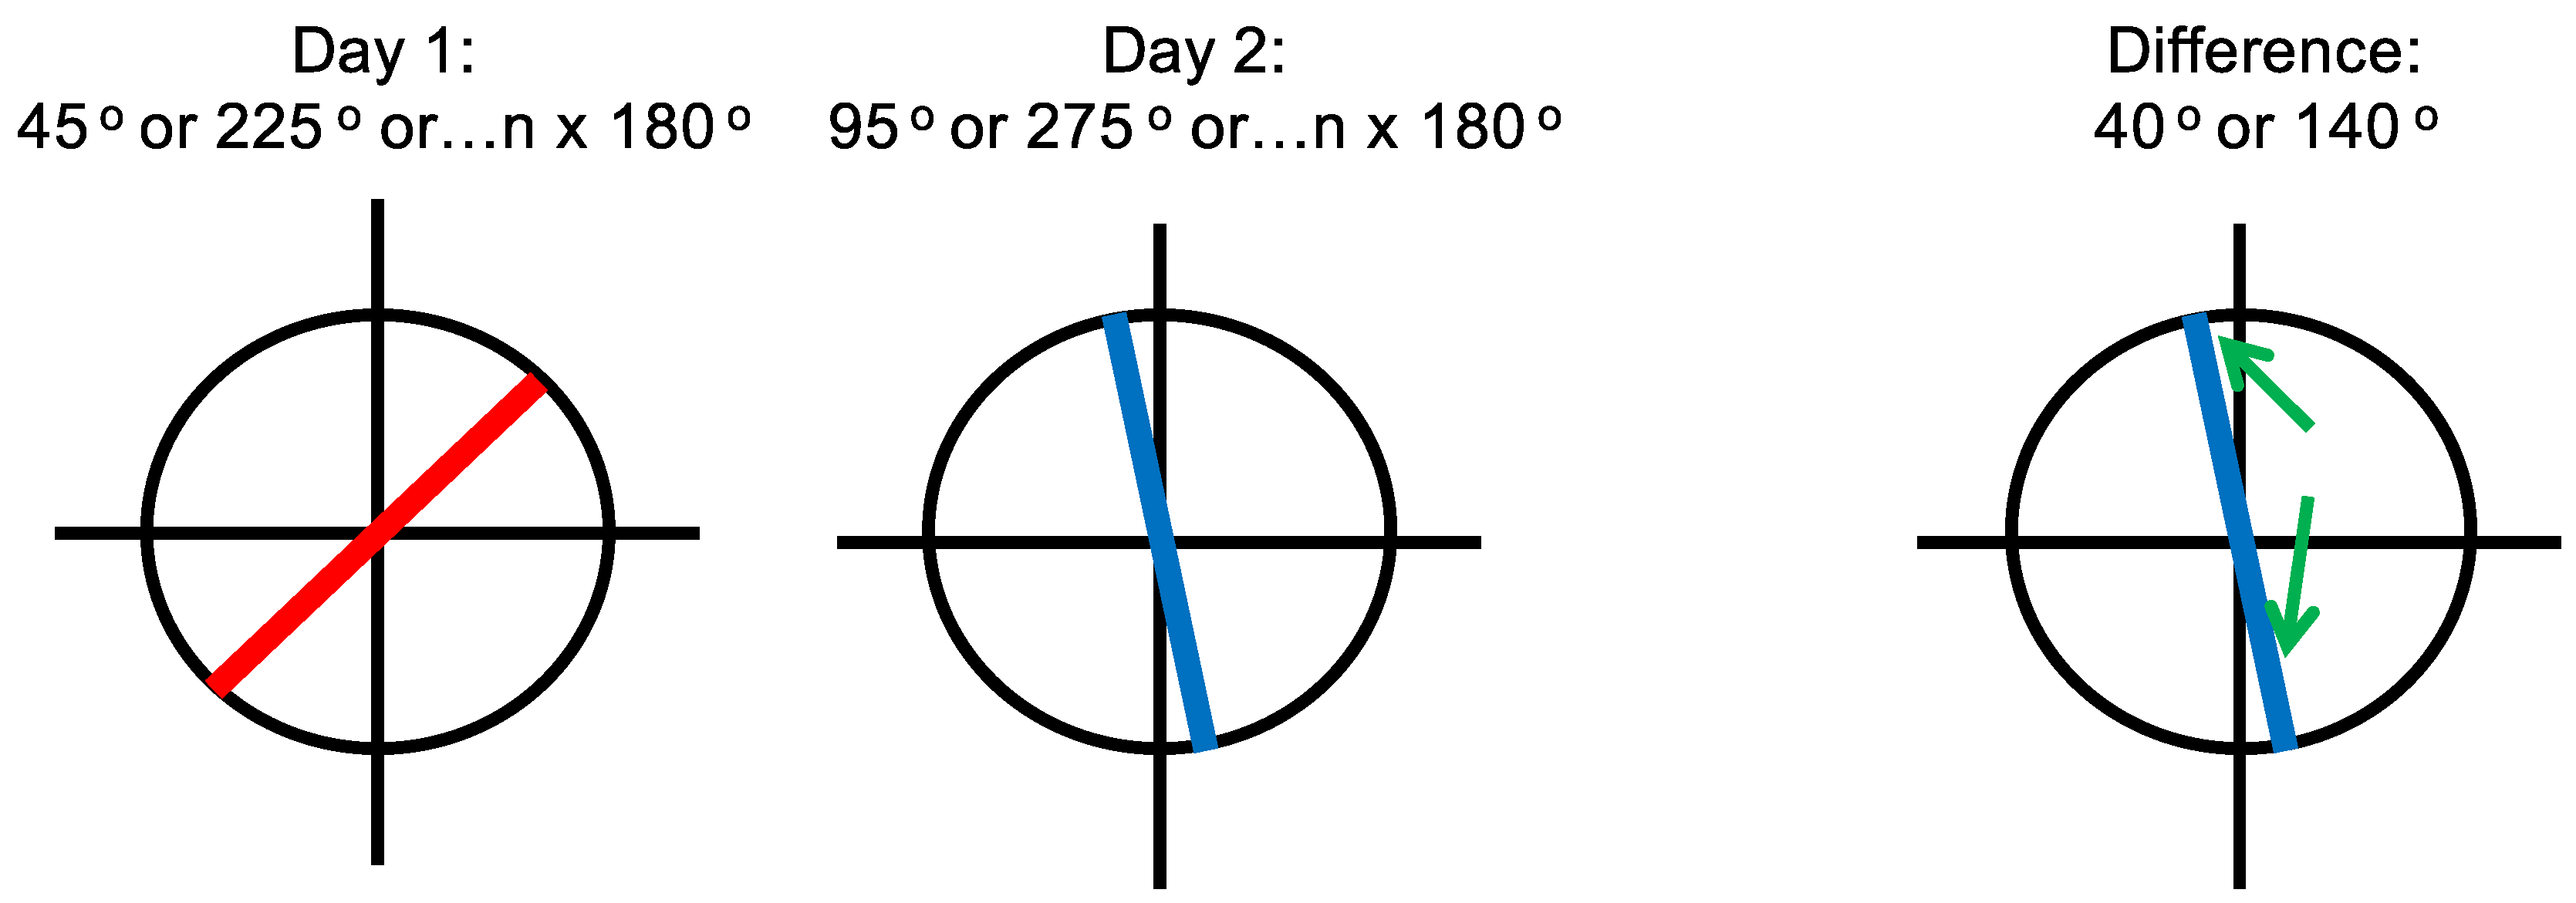
3. Discussion
4. Conclusions
Acknowledgments
Author Contributions
Conflicts of Interest
References
- Brown, A.M. Locating the γ-ray emission region of the flat spectrum radio quasar PKS 1510-089. Mon. Not. R. Astron. Soc. 2013, 431, 824–835. [Google Scholar] [CrossRef]
- Foschini, L.; Bonnoli, G.; Ghisellini, G.; Tagliaferri, G.; Tavecchio, F.; Stamerra, A. Fermi/LAT detection of extraordinary variability in the gamma-ray emission of the blazar PKS 1510-089. Astron. Astrophys. 2013, 555, A138. [Google Scholar]
- Saito, S.; Stawarz, Ł; Tanaka, Y.T.; Takahashi, T.; Madejski, G.; D’Ammando, F. Very Rapid High-amplitude Gamma-Ray Variability in Luminous Blazar PKS 1510-089 Studied with Fermi-LAT. Astrophys. J. Lett. 2013, 766, 52–61. [Google Scholar]
- Atwood, W.B.; Abdo, A.A.; Ackermann, M.; Althouse, W.; Anderson, B.; Axelsson, M.; Baldini, L.; Ballet, J.; Band, D.L.; Barbiellini, G.; et al. The Large Area Telescope on the Fermi Gamma-Ray Space Telescope Mission. Astrophys. J. 2009, 697, 1071. [Google Scholar] [CrossRef]
- Nestoras, I.; Fuhrmann, L.; Angelakis, E.; Schmidt, R.; Krichbaum, T.P.; Zensus, J.A.; Ungerechts, H.; Sievers, A.; Riquelme, D. Record cm/mm-band radio flux levels of the gamma-ray flaring blazar PKS 1510-089. The Astronomer’s Telegram, 21 October 2011. [Google Scholar]
- Orienti, M.; D’Ammando, F.; Giroletti, M.; Orlati, A. Extremely high cm-band radio flux level of the gamma-ray flaring FSRQ PKS 1510-089. The Astronomer’s Telegram, 21 November 2011. [Google Scholar]
- Beaklini, P.P.; Dominici, T.P.; Abraham, Z. Detection of an increase in the flux density at 43 GHz from blazar PKS 1510-089 since August. The Astronomer’s Telegram, 8 December 2011. [Google Scholar]
- Orienti, M.; Koyama, S.; D’Ammando, F.; Giroletti, M.; Kino, M.; Nagai, H.; Venturi, T.; Dallacasa, D.; Giovannini, G.; Angelakis, E.; et al. Radio and γ-ray follow-up of the exceptionally high-activity state of PKS 1510-089 in 2011. Mon. Not. R. Astron. Soc. 2013, 428, 2418–2429. [Google Scholar] [CrossRef]
- Marscher, A.P.; Jorstad, S.G.; Larionov, V.M.; Aller, M.F.; Aller, H.D.; Lähteenmäki, A.; Agudo, I.; Smith, P.S.; Gurwell, M.; Hagen-Thorn, V.A.; et al. Probing the Inner Jet of the Quasar PKS 1510-089 with Multi-Waveband Monitoring During Strong Gamma-Ray Activity. Astrophys. J. Lett. 2010, 710, L126–L131. [Google Scholar] [CrossRef]
- Sasada, M.; Uemura, M.; Fukazawa, Y.; Kawabata, K.S.; Ikejiri, Y. Prominent Polarized Flares of the Blazars AO 0235+164 and PKS 1510-089. Publ. Astron. Soc. Jpn. 2011, 63, 489. [Google Scholar] [CrossRef]
- Jermak, H.; Steele, I.A.; Lindfors, E.; Hovatta, T.; Nilsson, K.; Lamb, G.P.; Mundell, C.; Barres de Almeida, U.; Berdyugin, A.; Kadenius, V.; et al. The RINGO2 and DIPOL optical polarization catalogue of blazars. Mon. Not. R. Astron. Soc. 2016, 462, 4267–4299. [Google Scholar] [CrossRef]
- Beaklini, P.P.; Abraham, Z.; Dominici, T.P. Radio observations of PKS 1510-089 at 43 GHz during July 2011. The Astronomer’s Telegram, 2 August 2011. [Google Scholar]
- Beaklini, P.P.; Dominici, T.P.; Abraham, Z. Multiwavelength flaring activity of PKS1510-089. Astron. Astrophys. 2017, 606, A87. [Google Scholar] [CrossRef]
- Pushkarev, A.B.; Kovalev, Y.Y.; Lister, M.L. Radio/Gamma-ray Time Delay in the Parsec-scale Cores of Active Galactic Nuclei. Astrophys. J. Lett. 2010, 722, L7–L11. [Google Scholar] [CrossRef]
- Blandford, R.D.; Königl, A. Relativistic jets as compact radio sources. Astrophys. J. 1979, 232, 34–48. [Google Scholar] [CrossRef]
- Marscher, A.P.; Gear, W.K. Models for high-frequency radio outbursts in extragalactic sources, with application to the early 1983 millimeter-to-infrared flare of 3C 273. Astrophys. J. 2010, 298, 114–127. [Google Scholar] [CrossRef]
- Konigl, A. Relativistic jets as X-ray and gamma-ray sources. Astrophys. J. 1981, 243, 700–709. [Google Scholar] [CrossRef]
- Itoh, R.; Nalewajko, K.; Fukazawa, Y.; Uemura, M.; Tanaka, Y.T.; Kawabata, K.S.; Madejski, G.M.; Schinzel, F.K.; Kanda, Y.; Shiki, K.; et al. Systematic Study of Gamma-ray-bright Blazars with Optical Polarization and Gamma-Ray Variability. Astrophys. J. 2010, 833, 77. [Google Scholar] [CrossRef]
- Bonning, E.; Urry, C.M.; Bailyn, C.; Buxton, M.; Chatterjee, R.; Coppi, P.; Fossati, G.; Isler, J.; Maraschi, L. SMARTS Optical and Infrared Monitoring of 12 Gamma-Ray Bright Blazars. Astrophys. J. 2012, 756, 609–612. [Google Scholar] [CrossRef]


© 2018 by the authors. Licensee MDPI, Basel, Switzerland. This article is an open access article distributed under the terms and conditions of the Creative Commons Attribution (CC BY) license (http://creativecommons.org/licenses/by/4.0/).
Share and Cite
Beaklini, P.P.B.; Dominici, T.P.; Abraham, Z. Optical Polarimetry and Radio Observations of PKS1510-089 between 2009 and 2013. Galaxies 2018, 6, 18. https://doi.org/10.3390/galaxies6010018
Beaklini PPB, Dominici TP, Abraham Z. Optical Polarimetry and Radio Observations of PKS1510-089 between 2009 and 2013. Galaxies. 2018; 6(1):18. https://doi.org/10.3390/galaxies6010018
Chicago/Turabian StyleBeaklini, Pedro P. B., Tânia P. Dominici, and Zulema Abraham. 2018. "Optical Polarimetry and Radio Observations of PKS1510-089 between 2009 and 2013" Galaxies 6, no. 1: 18. https://doi.org/10.3390/galaxies6010018
APA StyleBeaklini, P. P. B., Dominici, T. P., & Abraham, Z. (2018). Optical Polarimetry and Radio Observations of PKS1510-089 between 2009 and 2013. Galaxies, 6(1), 18. https://doi.org/10.3390/galaxies6010018