Abstract
The blazar PKS 1510-089 has shown intense activity at -rays in the recent years. In this work, we discussed the results of our 7 mm radio continuum and optical polarimetric monitoring between 2009 and 2013. In 2009, we detected a large rotation of the optical polarization angle that we attributed to the ejection of new polarized components. In 2011, after the occurrence of several -rays flares, the radio emission started to increase, reaching values never observed before. We interpreted this increase as the consequence of the superposition of several new components ejected during the -rays flares. A delay was measured between the maximum in the radio emission and the -ray flares, which favors models involving expanding components like the shock-in-jet models. Finally, we tried to understand the polarization angle variability behavior filling the gaps in our observations with published results of other polarimetric campaigns, and using the criterion of minimum variation in the polarization angle between successive observations to solve the 180° multiplicity.
1. Introduction
The blazar PKS1510-089 revealed intense activity at -rays particularly after 2008 [1,2,3], when the Fermi/LAT observatory started its operations monitoring the whole sky between 30 MeV and 300 GeV [4]. Because of that, multiwavelength campaigns on PKS1510-089 were intensified, producing a large amount of data from radio to X-rays wavelenghts. In this paper, we discuss two specific epochs of high activity at -rays, which occurred in 2009 and 2011, and their counterparts at optical and radio wavelenghts.
Concerning the radio flux density, earlier results reported a monotonic increase that seemed to start at the epoch of the 2011 -ray flare activity [5,6,7,8]. On the polarimetric monitoring programs, several authors reported high variability on the polarization angle () simultaneous to the 2009 high energy flares; however, the rotation sense of each episode is still under debate, which affects the interpretation of how much really changed during the flare events [9,10,11].
In this report, we discuss some details of our radio and optical polarimetric monitoring program of PKS1510-089, which resulted in several publications [7,12,13]. We compared our polarimetric data with others available in the literature in a attempt to minimize the gaps between the observations and in order to obtain a better understanding of the emission variability. This is specially important because of the 180° multiplicity in the value, which is difficult to assess when the gaps are longer than the typical variability timescale.
2. Observation and Results
The 7 mm (43 GHz) radio observations were performed at the Itapetinga Radio Observatory, in Brazil, between 2009 and 2013. We used the scan (on-the-fly) method, where each scan had 30 arc min amplitude and 20 s of duration. During one day, between 150 and 210 scans were made, leading to an average of 3 h of observing time. The R-band polarimetric observations were made at Pico dos Dias Observatory, in Brazil, with the IAGPOL image polarimeter. To obtain a set of polarimetric quantities (polarization angle and degree), at least 8 images were obtained, with the wave plate position rotated by 22.5° between each one. In good weather conditions, we could obtain more than one set of the polarimetric measurements in one night.
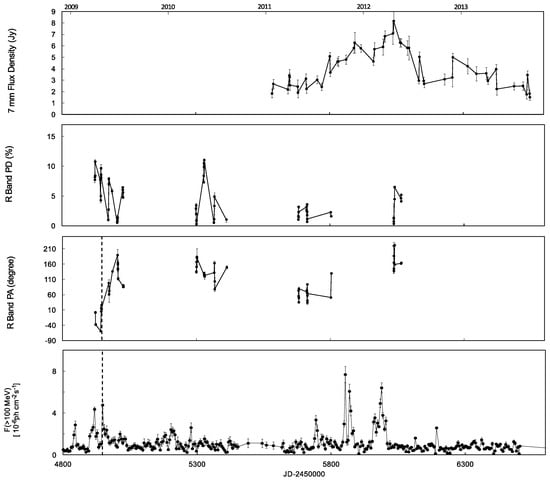
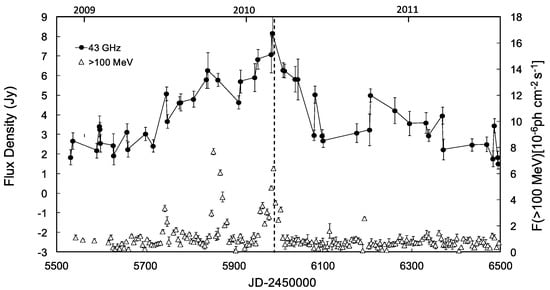
In Figure 1 we show the result of our 7 mm radio and R-band polarimetric monitoring. The increase in the radio flux density started around 50 days after the first -ray flare in 2011. As reported in [12], radio observations obtained just a few days after the -ray flare showed no unusual variability. A few days later, Nestoras et al. [5] and Orienti et al. [6] reported an increase in the flux density that continued during the following weeks [7]. In Figure 2 we show the aligned -ray and 7 mm radio light curves, the latter was shifted by 54 days, which resulted in a good match between the maxima in both light curves. Although the different variability timescales makes it difficult to use a statistical test to confirm this delay, an analysis of the epochs of occurrence of the flares at both wavelengths by Beaklini et al. [13] indicated a time delay of 54 days.

Figure 1.
Top: 7 mm emission observed with the Itapetinga Radio Observatory (ROI). Middle: Polarization degree at R-band obtained at Picos dos Dias Observatory (OPD). Bottom: Idem for the polarization angle. The vertical dashed line indicates the moment that polarization angle () rotated by almost 70° in a two-day interval.

Figure 2.
The radio and -ray variability between 2009 and 2013. The radio data was shifted by 54 days to coincide the maximum of its light curve with the last -ray flare, as indicated by the dashed line.
The existence of delays between flares at high energies and radio wavelengths is already known in AGNs [14]. In the case discussed here, the sequence of several short-duration flares at -rays corresponds to a superposition of long term flares at 43 GHz, which explains the monotonic increase at radio frequencies that started after the first -ray flare.
During the 2009 -ray active phase, both the polarization degree () and changed significantly. The polarized flux showed large fluctuations in short timescales, with the polarization degree varying between and less than . The rotated almost 70° between 20 and 22 April 2009, simultaneously to a -ray flare.
3. Discussion
In both the 2009 and 2011 events, the multiwavelength variability can be understood as a consequence of the ejection of new jet components. The rotation simultaneous with depolarization in 2009, can be explained if the new component has a almost perpendicular to the jet . In 2011, the delay between radio and -ray flares can be attributed to the propagation of an expanding jet component, initially optically thick at radio frequencies, which reaches its maximum flux density when it becomes optically thin [15,16,17].
Therefore, we explained the rotation of in PKS1510-089 as due to the ejection of a new jet component. However, could a new component produce such rotation simultaneously to a decrease in the polarized flux? To answer this question, let us describe the polarimetric behavior of the steady jet as an unique set of Stokes parameters I, Q and U. When a new component emerges, the total polarized flux can be obtained as a simple addition of Stokes parameters of the new component with the steady jet:
Because of the dependence of the Stokes parameters with and , the polarization angle of a new component can be recovered from the polarimetric quantities obtained before and after a -ray flare:
where represents the and is the polarized flux. We consider as the jet polarimetric properties those of the day before the flare (20 April 2009, , mJy) and the final quantities as those of the day after the flare (22 April 2009, , mJy). We found the value of 23° for the new component , with a polarized flux of mJy. For the final polarized flux to be smaller than that before the ejection of the new component, we must have:
It is clear that we could find the polarization angle () and the new component because we detected a large rotation on a small time interval. The long term variability, however, is much more difficult to understand because of the gaps in the monitoring programs, which prevents the solution of the 180° ambiguity. During larger gaps, it is also possible that the angle had rotated many times 180°.
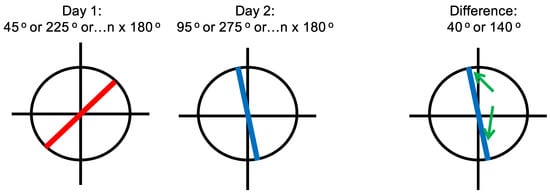
The 2009 long term rotation event was monitored by different authors [9,10,11,13,18]. We could minimize the gaps between the observation and assume that the angle rotated by the smallest difference, as we shown in a schematic view in Figure 3. Because of the 180° multiplicity, the difference between two consecutive angles can never be higher than 90° if we choose the smallest angle between them. We use it as a criterion to describe the variability behavior of during the 2009 event. One should note that using this criterion, we are allowing both senses for the PA rotation.

Figure 3.
Schematic view of the variability of the Polarization Angle and how the 180° multiplicity affects it. To choose the rotation sense, we always kept the difference between them lower than 90°.
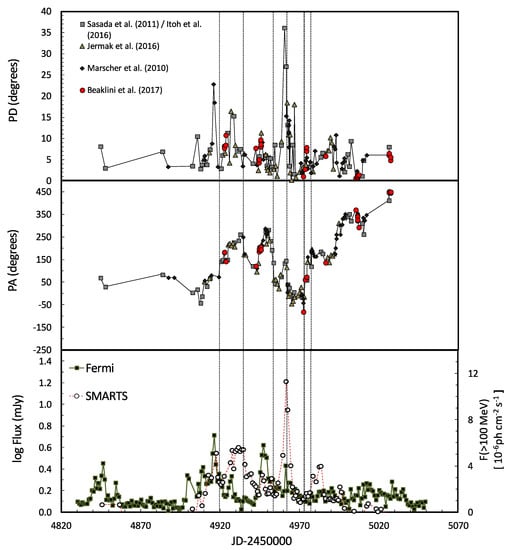
In Figure 4 we show the resulting variability simultaneous to the Fermi -rays and the R-band SMARTS light curves [4,19]. The SMARTS program was developed for the photometric monitoring of blazar sources at B, V, R, J and K-bands using small aperture telescopes located at Cerro Tololo. We can see the rotation in both directions simultaneous to the flares, sometimes at R-band, sometimes at -rays. We also detected a large and monotonic 300° rotation at the end of the period of higher -ray activity. To signal the occurrence of fast rotations, we marked the occasions where the angle rotated by a value higher than 70° in a time interval of 2 days, similar to what we detected in the April 2009 event. Using this criterion we detected other 7 events besides our detection which are indicated by dashed line in the figure. Beaklini et al. [13] showed that if the optical and/or gamma-ray flares are associate with the formation of a new jet component, depending on its polarimetric properties, it is possible to obtain different amount of variation in , including no variation at all. In Figure 4, one can see two of these rapid variation exactly coincident with the flares, although they were also detected without a corresponding flare. Because of the existence of many flares in the -ray light curve, a careful statistical analysis to verify how often coincidences between flares and rapid PA rotations would be expected to occur by chance is necessary. This falls outside the scope of this paper.

Figure 4.
Polarization degree and angle variability pattern using all the data available in the literature. We used the criterion of keeping the difference between two consecutive measurements smaller than 90° to solve the 180° multiplicity. We indicated by dashed lines the epochs in which large variations of the polarization angle in short timescales took place, and at least two of them seem to be coincide with to the occurrence of optical flares.
4. Conclusions
In this communication we discussed the monitoring campaign reported by Beaklini et al. [13]. At radio wavelengths, We reported a delay between the radio and the -ray emission, with the high energy flux density coming first. We interpreted the gradual increase in the radio flux density as a consequence of the superposition of the emission of new jet components. In the polarimetric optical data, we detected a large rotation in in an interval of only two days; we interpreted this rotation as a consequence of the ejection of a new polarized component. Using polarization data from the literature to minimize the gap between the observations, we obtained a more complete view of the variability of the polarization angle during the 2009 -ray activity phase. In those data, presented in Figure 4, one can clearly see the existence of double rotation events between MJD 54940-54950 and between MJD 54957-54963, where rotated first in one sense and then returned back to a the previous level after rotating in the opposite direction. We also identified other rapid rotation that occurred simultaneously with the R-band flares, but this did not always happen.
Acknowledgments
We are grateful to the Brazilian research agencies FAPESP and CNPq for financial support (FAPESP Projects: 2008/11382-3 and 2014/07460-0). This paper has made use of up-to-date SMARTS optical/near-infrared light curves that are available at www.astro.yale.edu/smarts/glast/home.php.
Author Contributions
The authors contributed equally to the analysis and to the production of this manuscript.
Conflicts of Interest
There is no conflict of interest
References
- Brown, A.M. Locating the γ-ray emission region of the flat spectrum radio quasar PKS 1510-089. Mon. Not. R. Astron. Soc. 2013, 431, 824–835. [Google Scholar] [CrossRef]
- Foschini, L.; Bonnoli, G.; Ghisellini, G.; Tagliaferri, G.; Tavecchio, F.; Stamerra, A. Fermi/LAT detection of extraordinary variability in the gamma-ray emission of the blazar PKS 1510-089. Astron. Astrophys. 2013, 555, A138. [Google Scholar]
- Saito, S.; Stawarz, Ł; Tanaka, Y.T.; Takahashi, T.; Madejski, G.; D’Ammando, F. Very Rapid High-amplitude Gamma-Ray Variability in Luminous Blazar PKS 1510-089 Studied with Fermi-LAT. Astrophys. J. Lett. 2013, 766, 52–61. [Google Scholar]
- Atwood, W.B.; Abdo, A.A.; Ackermann, M.; Althouse, W.; Anderson, B.; Axelsson, M.; Baldini, L.; Ballet, J.; Band, D.L.; Barbiellini, G.; et al. The Large Area Telescope on the Fermi Gamma-Ray Space Telescope Mission. Astrophys. J. 2009, 697, 1071. [Google Scholar] [CrossRef]
- Nestoras, I.; Fuhrmann, L.; Angelakis, E.; Schmidt, R.; Krichbaum, T.P.; Zensus, J.A.; Ungerechts, H.; Sievers, A.; Riquelme, D. Record cm/mm-band radio flux levels of the gamma-ray flaring blazar PKS 1510-089. The Astronomer’s Telegram, 21 October 2011. [Google Scholar]
- Orienti, M.; D’Ammando, F.; Giroletti, M.; Orlati, A. Extremely high cm-band radio flux level of the gamma-ray flaring FSRQ PKS 1510-089. The Astronomer’s Telegram, 21 November 2011. [Google Scholar]
- Beaklini, P.P.; Dominici, T.P.; Abraham, Z. Detection of an increase in the flux density at 43 GHz from blazar PKS 1510-089 since August. The Astronomer’s Telegram, 8 December 2011. [Google Scholar]
- Orienti, M.; Koyama, S.; D’Ammando, F.; Giroletti, M.; Kino, M.; Nagai, H.; Venturi, T.; Dallacasa, D.; Giovannini, G.; Angelakis, E.; et al. Radio and γ-ray follow-up of the exceptionally high-activity state of PKS 1510-089 in 2011. Mon. Not. R. Astron. Soc. 2013, 428, 2418–2429. [Google Scholar] [CrossRef]
- Marscher, A.P.; Jorstad, S.G.; Larionov, V.M.; Aller, M.F.; Aller, H.D.; Lähteenmäki, A.; Agudo, I.; Smith, P.S.; Gurwell, M.; Hagen-Thorn, V.A.; et al. Probing the Inner Jet of the Quasar PKS 1510-089 with Multi-Waveband Monitoring During Strong Gamma-Ray Activity. Astrophys. J. Lett. 2010, 710, L126–L131. [Google Scholar] [CrossRef]
- Sasada, M.; Uemura, M.; Fukazawa, Y.; Kawabata, K.S.; Ikejiri, Y. Prominent Polarized Flares of the Blazars AO 0235+164 and PKS 1510-089. Publ. Astron. Soc. Jpn. 2011, 63, 489. [Google Scholar] [CrossRef]
- Jermak, H.; Steele, I.A.; Lindfors, E.; Hovatta, T.; Nilsson, K.; Lamb, G.P.; Mundell, C.; Barres de Almeida, U.; Berdyugin, A.; Kadenius, V.; et al. The RINGO2 and DIPOL optical polarization catalogue of blazars. Mon. Not. R. Astron. Soc. 2016, 462, 4267–4299. [Google Scholar] [CrossRef]
- Beaklini, P.P.; Abraham, Z.; Dominici, T.P. Radio observations of PKS 1510-089 at 43 GHz during July 2011. The Astronomer’s Telegram, 2 August 2011. [Google Scholar]
- Beaklini, P.P.; Dominici, T.P.; Abraham, Z. Multiwavelength flaring activity of PKS1510-089. Astron. Astrophys. 2017, 606, A87. [Google Scholar] [CrossRef]
- Pushkarev, A.B.; Kovalev, Y.Y.; Lister, M.L. Radio/Gamma-ray Time Delay in the Parsec-scale Cores of Active Galactic Nuclei. Astrophys. J. Lett. 2010, 722, L7–L11. [Google Scholar] [CrossRef]
- Blandford, R.D.; Königl, A. Relativistic jets as compact radio sources. Astrophys. J. 1979, 232, 34–48. [Google Scholar] [CrossRef]
- Marscher, A.P.; Gear, W.K. Models for high-frequency radio outbursts in extragalactic sources, with application to the early 1983 millimeter-to-infrared flare of 3C 273. Astrophys. J. 2010, 298, 114–127. [Google Scholar] [CrossRef]
- Konigl, A. Relativistic jets as X-ray and gamma-ray sources. Astrophys. J. 1981, 243, 700–709. [Google Scholar] [CrossRef]
- Itoh, R.; Nalewajko, K.; Fukazawa, Y.; Uemura, M.; Tanaka, Y.T.; Kawabata, K.S.; Madejski, G.M.; Schinzel, F.K.; Kanda, Y.; Shiki, K.; et al. Systematic Study of Gamma-ray-bright Blazars with Optical Polarization and Gamma-Ray Variability. Astrophys. J. 2010, 833, 77. [Google Scholar] [CrossRef]
- Bonning, E.; Urry, C.M.; Bailyn, C.; Buxton, M.; Chatterjee, R.; Coppi, P.; Fossati, G.; Isler, J.; Maraschi, L. SMARTS Optical and Infrared Monitoring of 12 Gamma-Ray Bright Blazars. Astrophys. J. 2012, 756, 609–612. [Google Scholar] [CrossRef]
© 2018 by the authors. Licensee MDPI, Basel, Switzerland. This article is an open access article distributed under the terms and conditions of the Creative Commons Attribution (CC BY) license (http://creativecommons.org/licenses/by/4.0/).