1. Introduction
Very-Long-Baseline Interferometry (VLBI) using radio telescopes spread across continents has been an important tool in radio astronomy, providing unprecedented angular resolution. This can be exploited by imaging relativistic plasma jets ejected from supermassive black holes found in quasars and by mapping structures of cosmic masers associated with young stellar objects or evolved stars in the galaxy as well as megamasers in active galaxies. VLBI astrometry of masers can obtain relative positional accuracy down to a ∼10 microarcsecond level, which in turn enables direct measurement of the rotation of our galaxy and constraints to be placed on the expansion rate of the universe and the dark-matter distribution (e.g., [
1,
2] and references therein). VLBI has long served as a geodetic technique to determine precise coordinates on the Earth, monitor Earth orientation parameters, and derive many other parameters of the Earth system (e.g., [
3,
4,
5] and references therein). In order to improve accuracy and precision in the above measurements, it is necessary to record data at wider receiver bandwidths and higher recording rates.
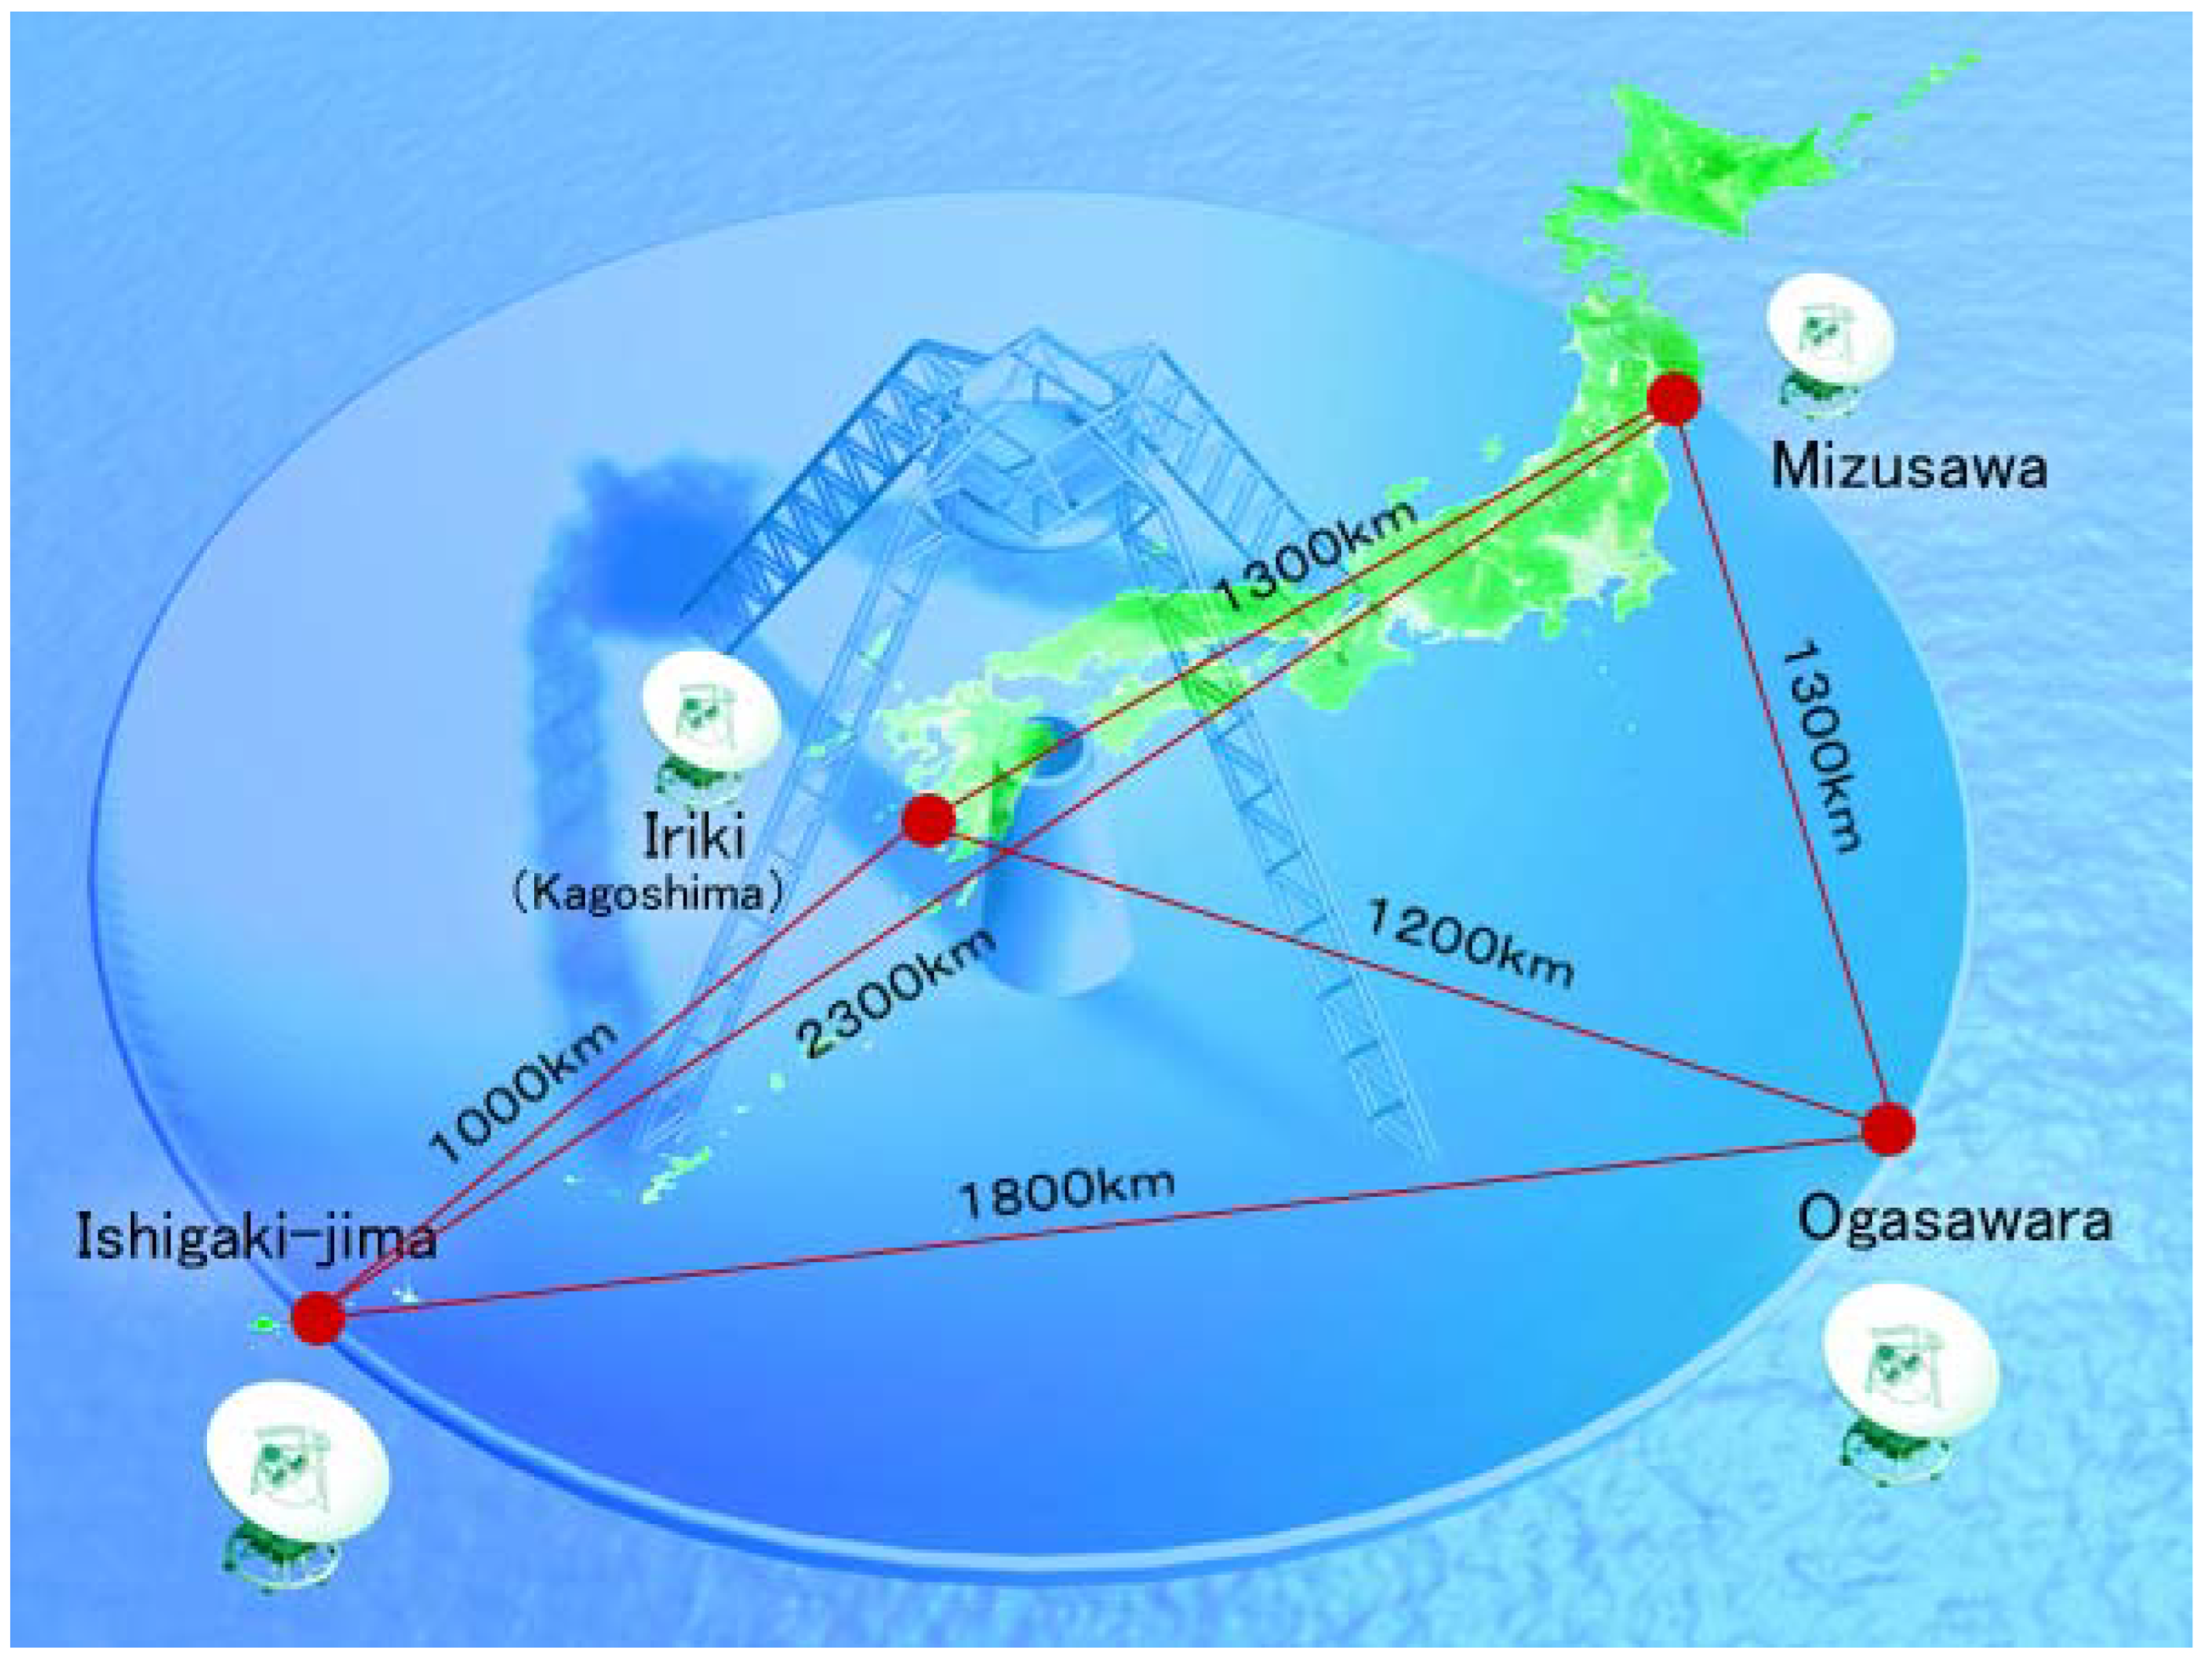
VLBI Exploration of Radio Astrometry (VERA) is a VLBI facility operated by the National Astronomical Observatory of Japan. It comprises four 20 m radio telescopes located across the country (
Figure 1). The basic specification of the telescopes and their performance characteristics are given in
Table 1. VERA was originally designed to reveal the three-dimensional structure of the Milky Way galaxy based on high-precision astrometry of galactic maser sources [
1,
6]. However, not only can VERA conduct high-precision galactic astrometry, but it can also be used for mapping compact extragalactic sources in radio wavelengths.
The scientific capability of VERA has been recently improved by installing a new right-handed circular (RCP) polarization receiver for each of the 20 m telescopes that provides new dual-polarization capability across the array, new analog-to-digital samplers, and wideband disk-based recording systems that enable data recording rates of 1, 2, 4, 8, and 16 Giga bit s
[
7,
8].
In this article, we describe the recent development and evaluation of the dual-polarization receiving capability at the front-ends of the 20 m telescopes. We present preliminary data and images obtained from the new system to illustrate the polarimetric observing performance.
Table 1.
Specifications of VERA 20 m telescopes.
Table 1.
Specifications of VERA 20 m telescopes.
| Items | Values |
|---|
| Aperture efficiency 1 | 45–50% (22 GHz band), 35–50% (43 GHz band) |
| Receiving frequency 1 | 20–24 GHz (22 GHz band), 42.2–44.5 GHz (43 GHz band) |
| Intermediate frequency | 4.7–7 GHz |
| Polarizations (22 and 43 GHz) | Dual-circular polarization (LCP, RCP) |
2. Instrumentation
2.1. Overview
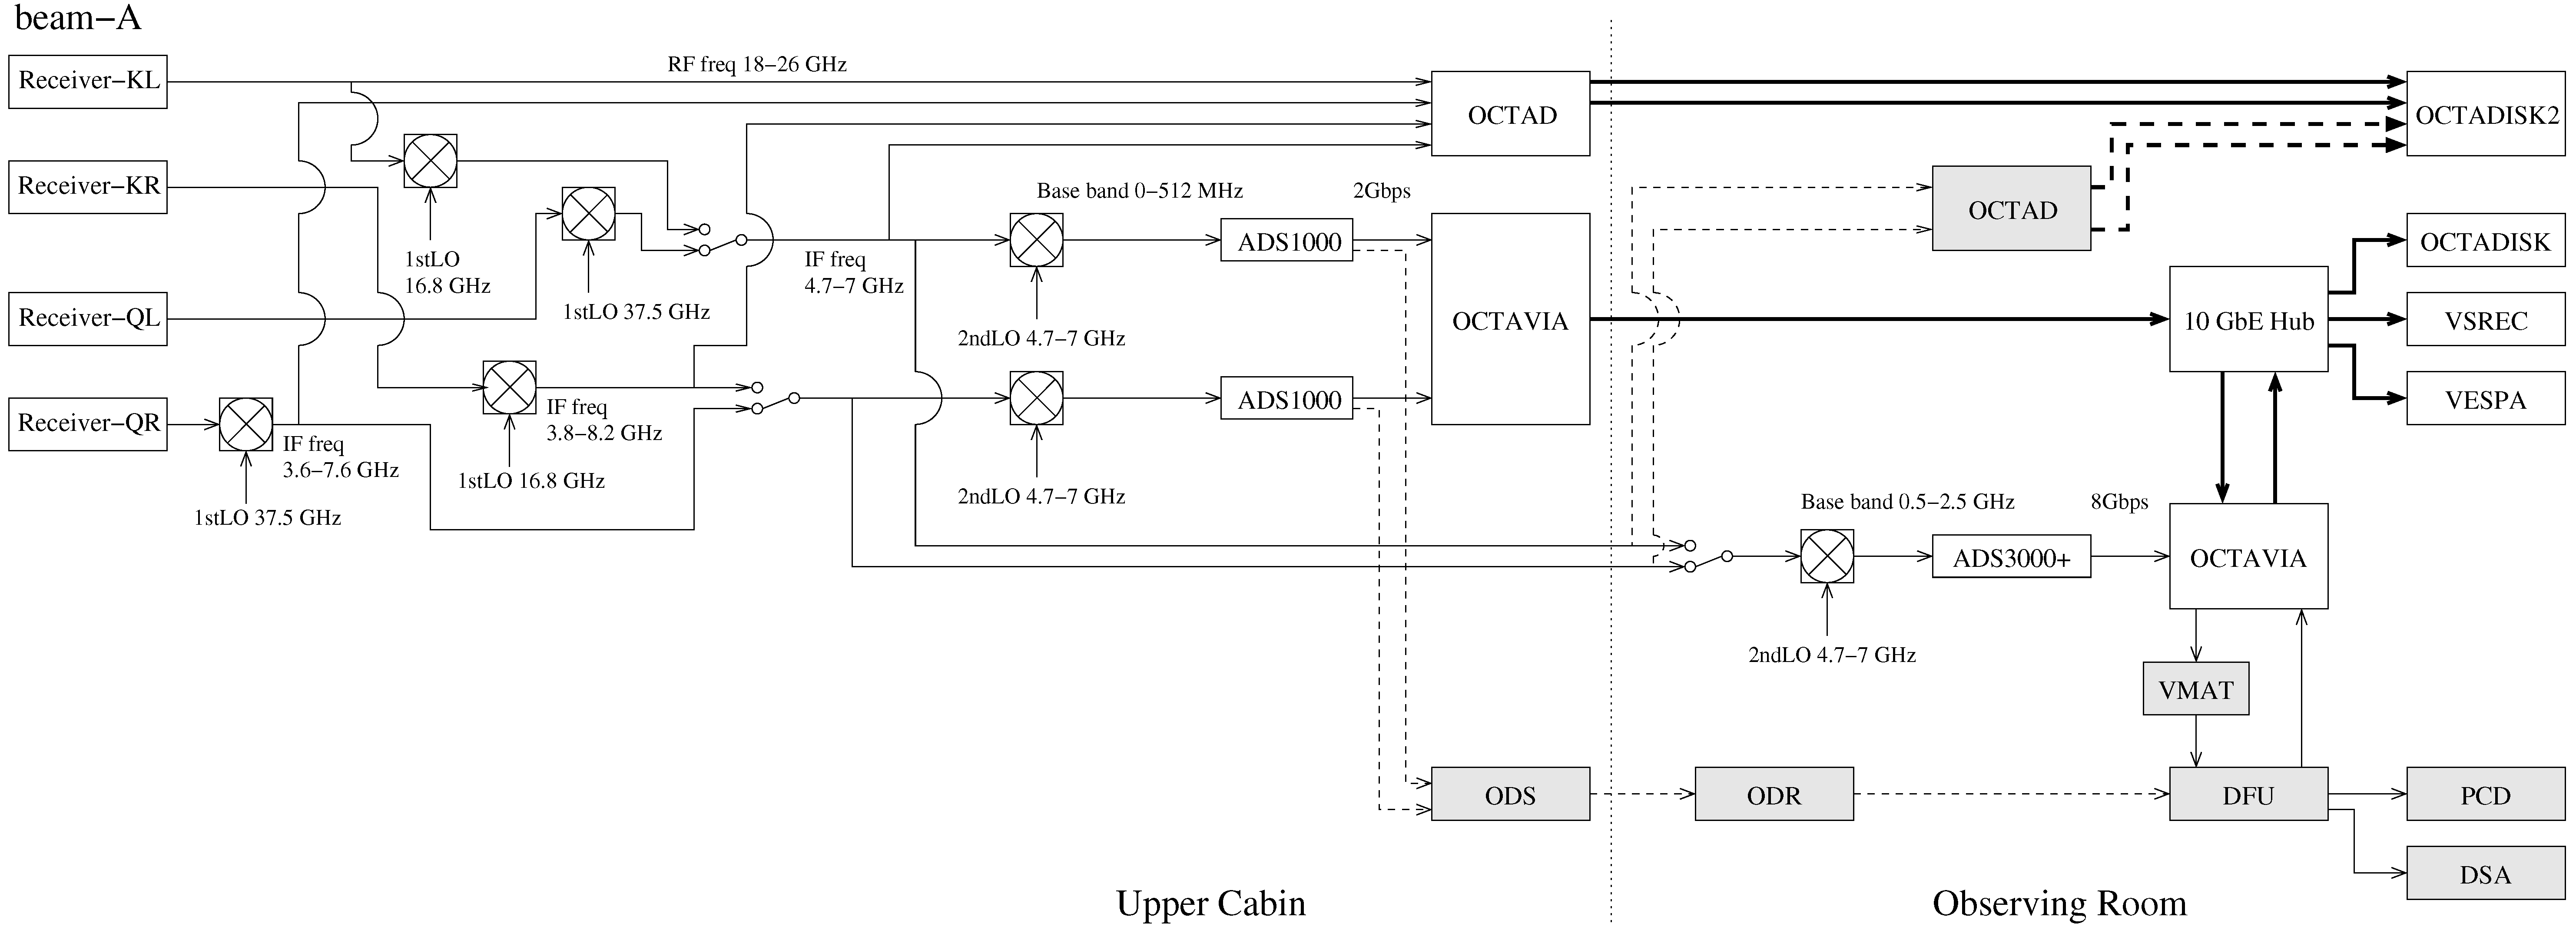
Here, we separately consider the front- and back-end systems. The former comprises capturing and amplifying radio signals with low-noise amplifiers (LNA), the frequency down-conversion, and intermediate frequency (IF) channels; the latter comprises the conversion of the IF signals to video-frequency range and the subsequent recording to digital signal processing instruments. The telescope front-end, IF, and the back-end system are shown in
Figure 2.
2.2. Front-End
VERA is equipped with a unique dual-beam receiver system (termed beam-A and beam-B) at both 22 and 43 GHz bands. Each of the two beams can observe a different source, with a separation between the two sources up to 2 degrees in the sky [
6]. Since the construction of the VERA, the 20 m telescopes have been equipped with only a left-handed circular polarization (LCP) receiver for each of the two beams. New right-handed circular polarization (RCP) receivers were installed in the front-end of all the telescopes, which combined with the already present LCP receivers enables for the first time dual-polarization observations by VERA. In this development, the RCP receivers are installed only for the beam-A at each telescope but not yet for the beam-B.
In
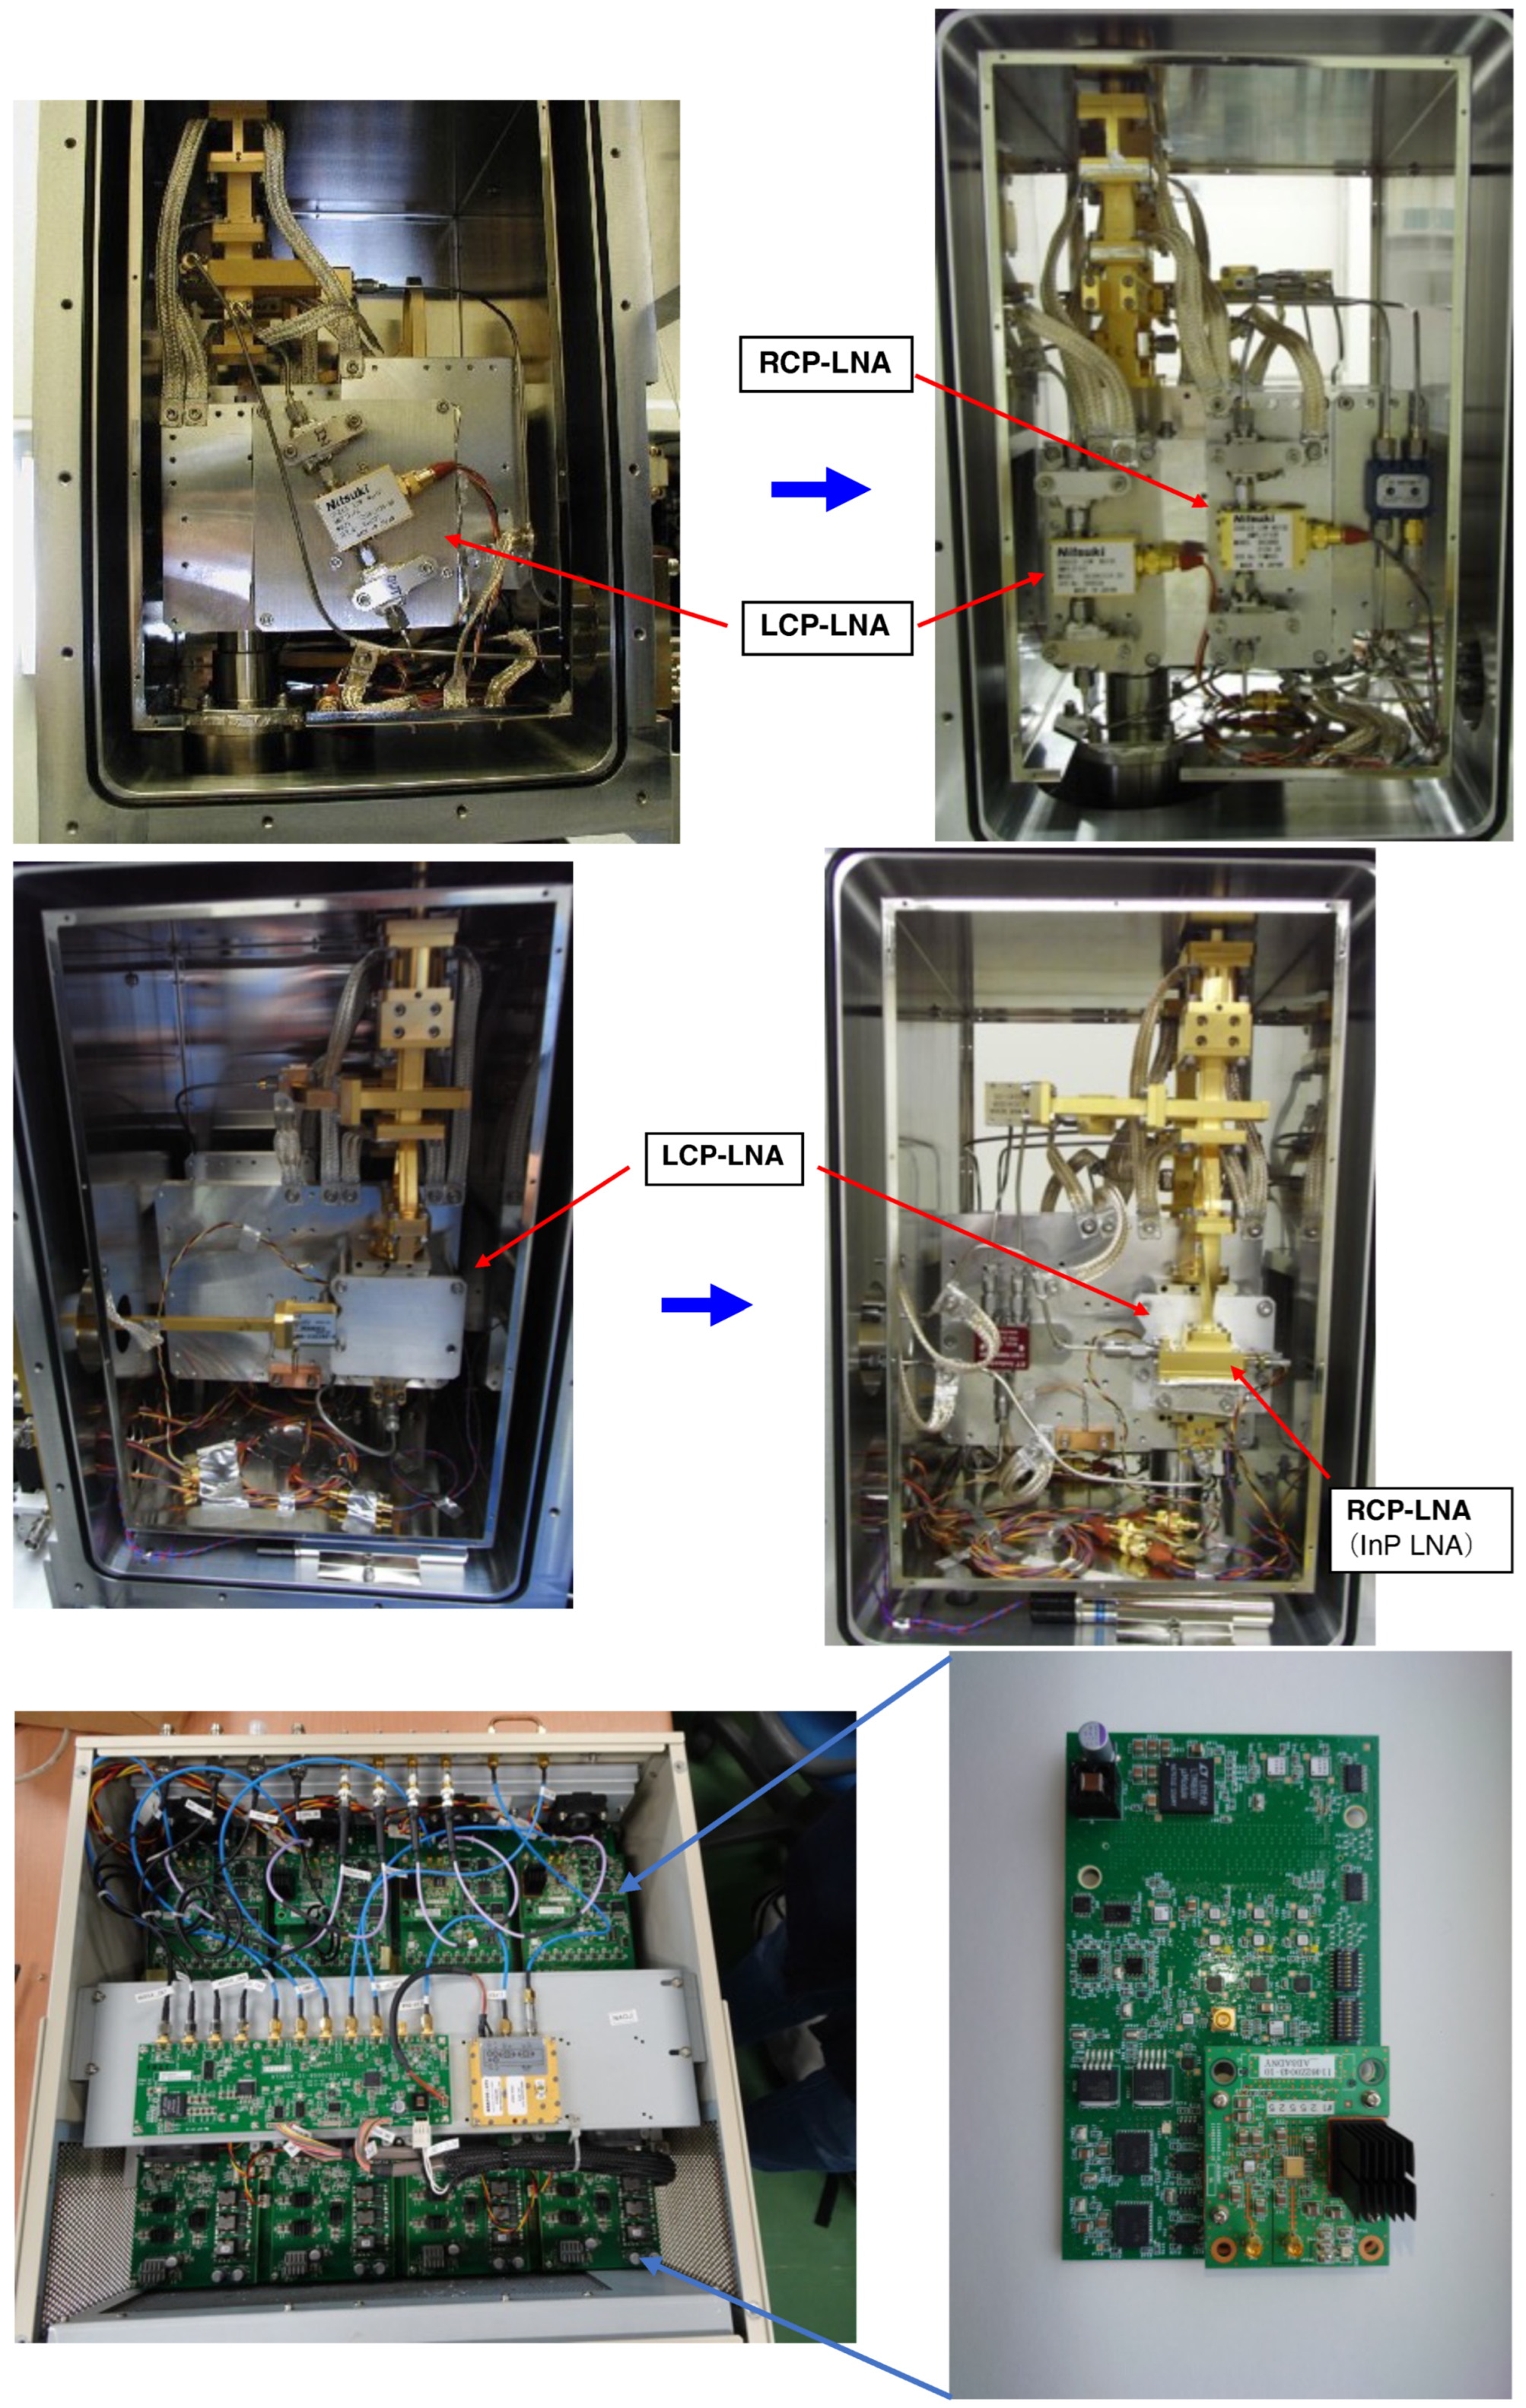
Figure 2, the signal paths for the two feed horns at each of the two frequency bands are shown, illustrative of various stages of mixing/switching within the receiver stage. Radio frequency (RF) signals received at the feed horn at each of the two frequency bands are divided into left- or right-handed circular polarizations by a circular polarizer, and then amplified by the LNA in the Cryogenic Dewar. Pictures of the construction inside the Dewar are shown in
Figure 3. The amplified signals in each circular polarization are converted to intermediate frequency (IF) via frequency down-converters appropriate to each of the frequency bands.
2.3. Intermediate Frequency (IF) and Back-End
A new analog-to-digital sampler (OCTAD: Optically Connected Array for VLBI Exploration Analog-to-Digital Converter) that enables frequency down-conversion at 18–26 GHz has been installed on each of the telescopes, which enables VLBI data recording at the rates of 4, 8, and 16 Giga bit s for each of the two polarizations, or up to 32 Giga bit s combined over both polarizations. At the time of mid-2022, the highest recording rate at the back-end is 16 Giga bit s. The details of the broad-band observing system for VERA will be found in a forthcoming paper (Oyama et al. in preparation).
The 22 GHz band RF signals from the receivers are transmitted to through the intermediate frequency (4.7–7.0 GHz) using OCTAD, a “direct” sampler, while the 43 GHz band signals are converted to IF using the 43 GHz band down-converter, since OCTAD is not capable of directly sampling signals at frequencies higher than the 22 GHz band. Note, however, that in the observations described here, the frequency conversion at the 22 GHz band was conducted by the frequency converter rather than by OCTAD. With installations of both the new RCP receiver and the new back-end system, ultrawideband VLBI polarimetry is realized using VERA.
3. Observations
We performed commissioning wideband polarimetric observations with VERA on 8 March 2022 at 22 GHz band and on 13 March at 43 GHz band. Each session lasted 19 h in a continuous observing track, in which we observed a number of radio sources, as listed in
Table 2. These observations were part of a VERA wideband science program on narrow-line Seyfert 1 galaxies, but we could also make use of bright calibrators in these observations to examine the polarization performance of VERA. While a dedicated study on the science targets will be published in a separate paper (Takamura et al. in preparation), here, we focus on the analysis of a few bright calibrators to demonstrate the polarimetric VLBI performance of VERA.
All four VERA telescopes participated in good weather conditions throughout the sessions, with typical system temperatures of 100–200 K at the 22 GHz band and 200–800 K at 43 GHz (
Table 2). Both sessions were performed at a recording rate of 16 Giga bit s
, where signals were received in four 512 MHz sub-bands in two circular polarizations. Thanks to the long observing tracks, most of the sources were observed over a wide range of parallactic angles, which was important to perform reliable calibration of the polarization leakage terms (D-terms). Correlation of the data was executed using the Mizusawa Software Correlator (softcos), an FX-type software correlator at NAOJ Mizusawa Observatory, which is also known as OCTACOR2. More details of the observations are summarized in
Table 2.
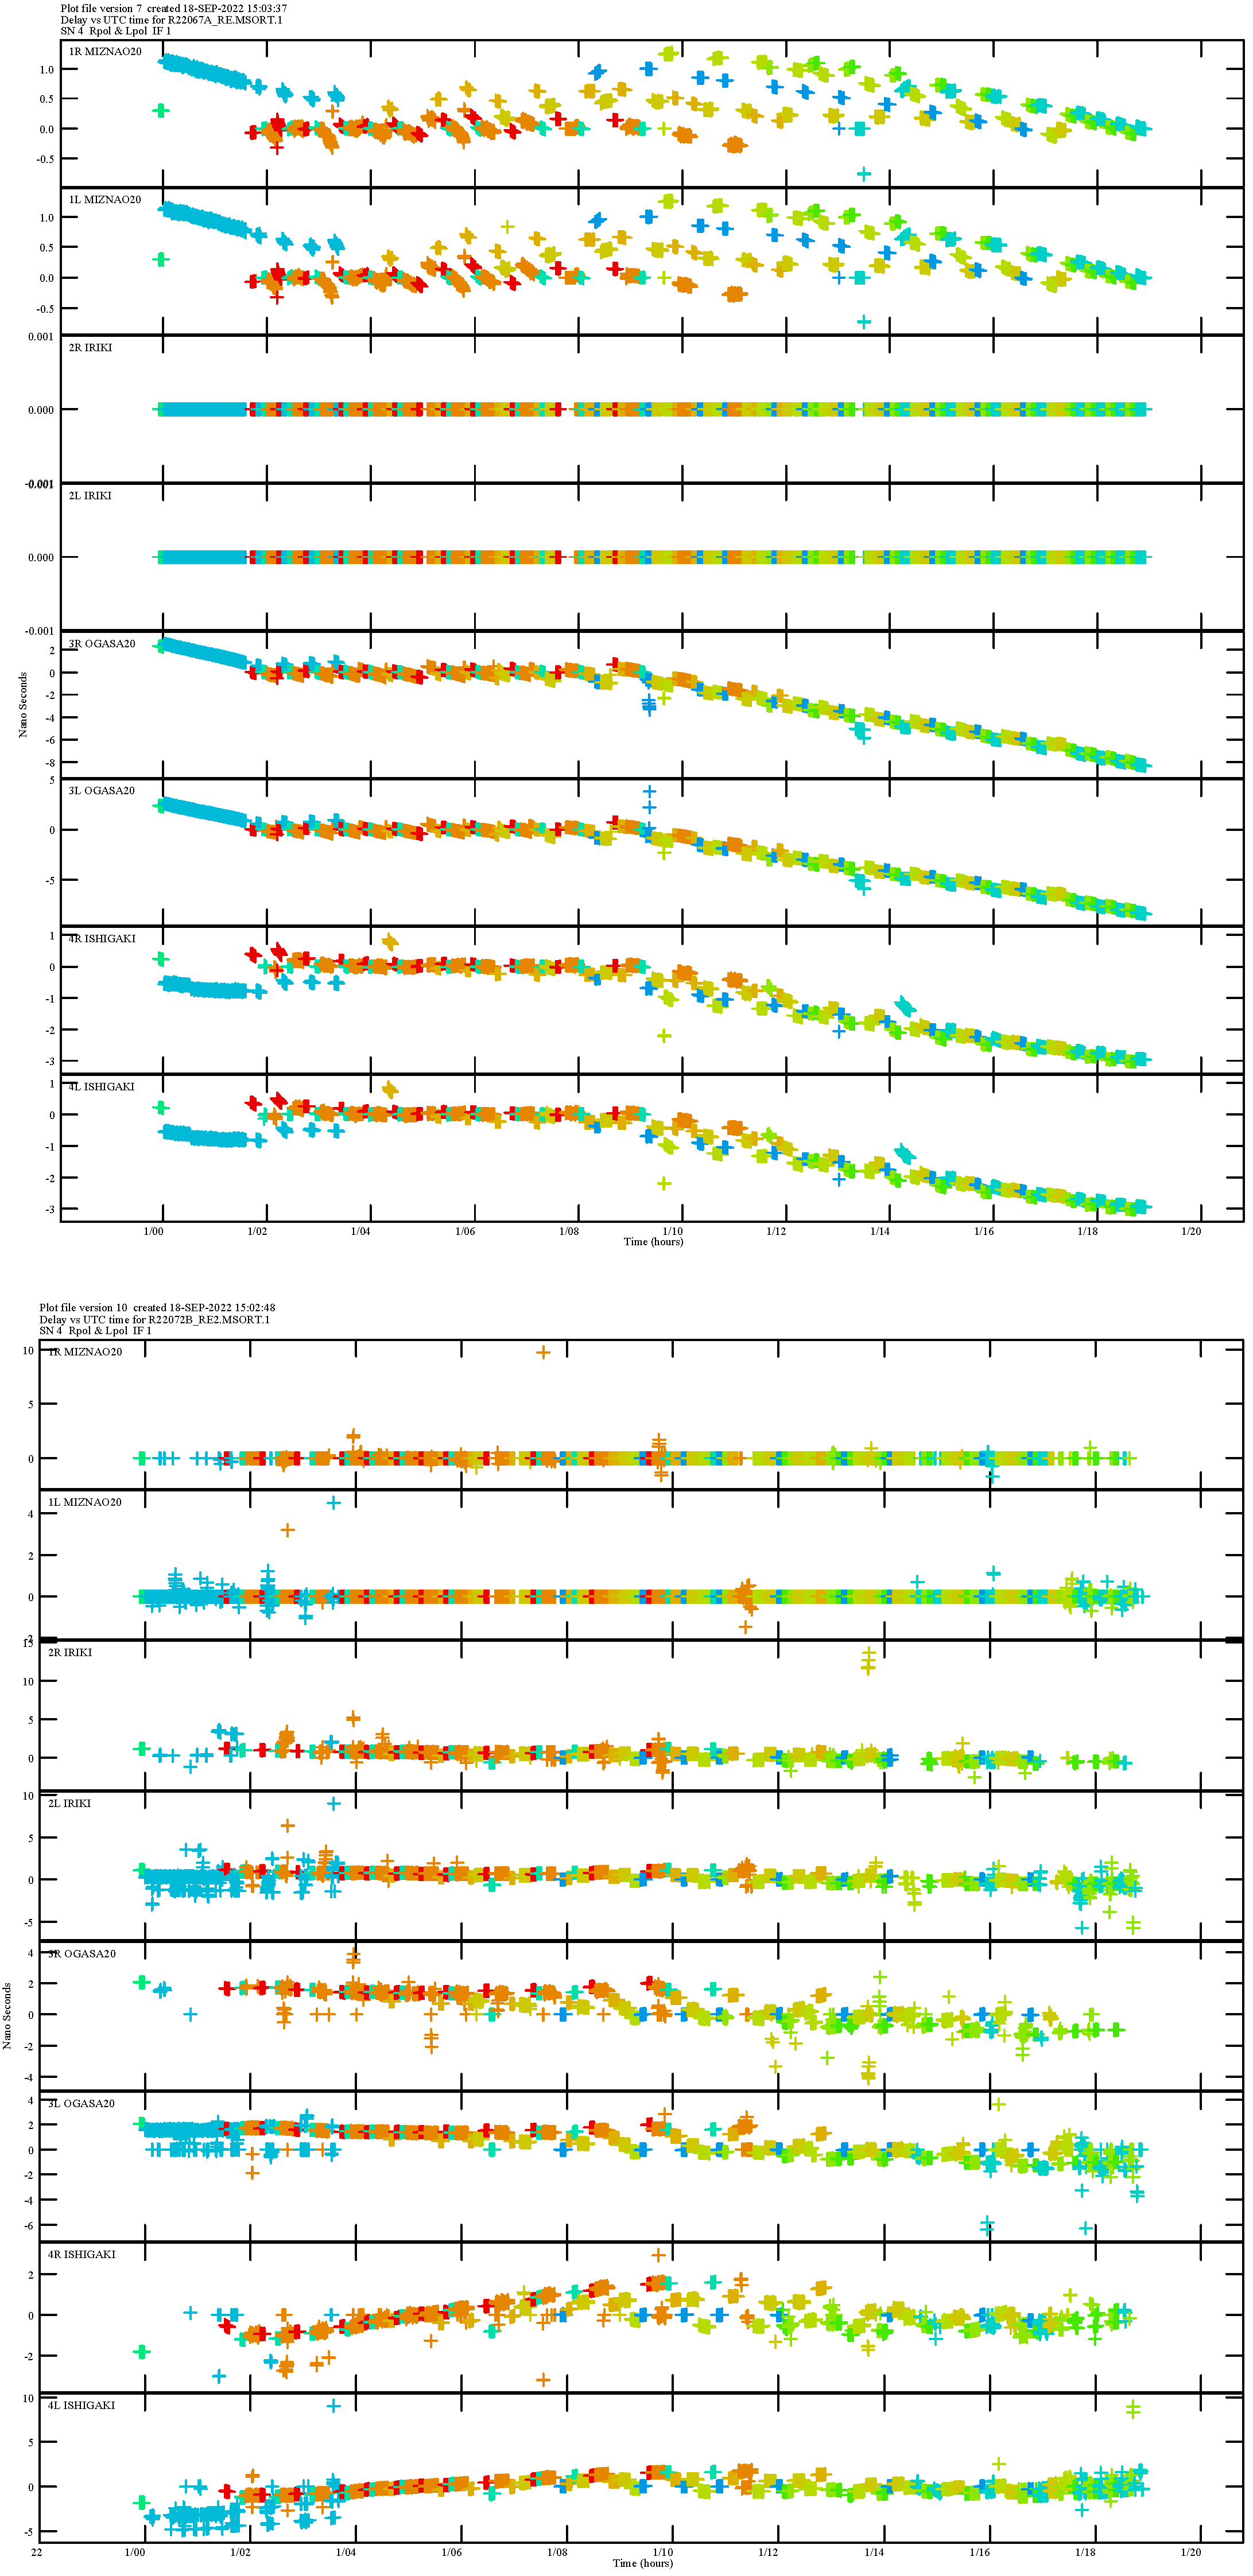
Figure 4 displays the time series of delay solutions from a global fringe fit for a portion of each session. Uncertainties in each of the solutions are typically 2–3 nanoseconds; systematic and calibration errors were considered in a standard way, and fitting errors that occur when obtaining delay solutions were also taken into account.
4. Data Reduction
The initial data calibration was performed with the Astronomical Image Processing System (AIPS) developed at the National Radio Astronomy Observatory (NRAO) [
10]. Since the polarimetric observations of VERA were performed with a single-beam mode, the data reduction procedures of VERA polarimetric data were similar to those of other VLBI networks, such as the Very-Long-Baseline Array (VLBA) and the Korean VLBI Network (KVN). CLEAN imaging of Stokes I, Q, and U were performed in DIFMAP [
11]. For the calibration of antenna gains, self-calibration of both phase and amplitude was performed using the Stokes I data set. D-terms were solved for each 512 MHz sub-band separately by using the AIPS task LPCAL.
Note that corrections of absolute EVPA were not performed in our present analysis, since that requires near-in-time absolute EVPA information monitored by external (single-dish or connected array) facilities.
5. Results and Verification
5.1. Overview
The new RCP receivers were installed and tested at all four telescopes in March 2022. In this section, we explain the procedures taken to test and verify the new system during the test observations.
5.2. D-Terms
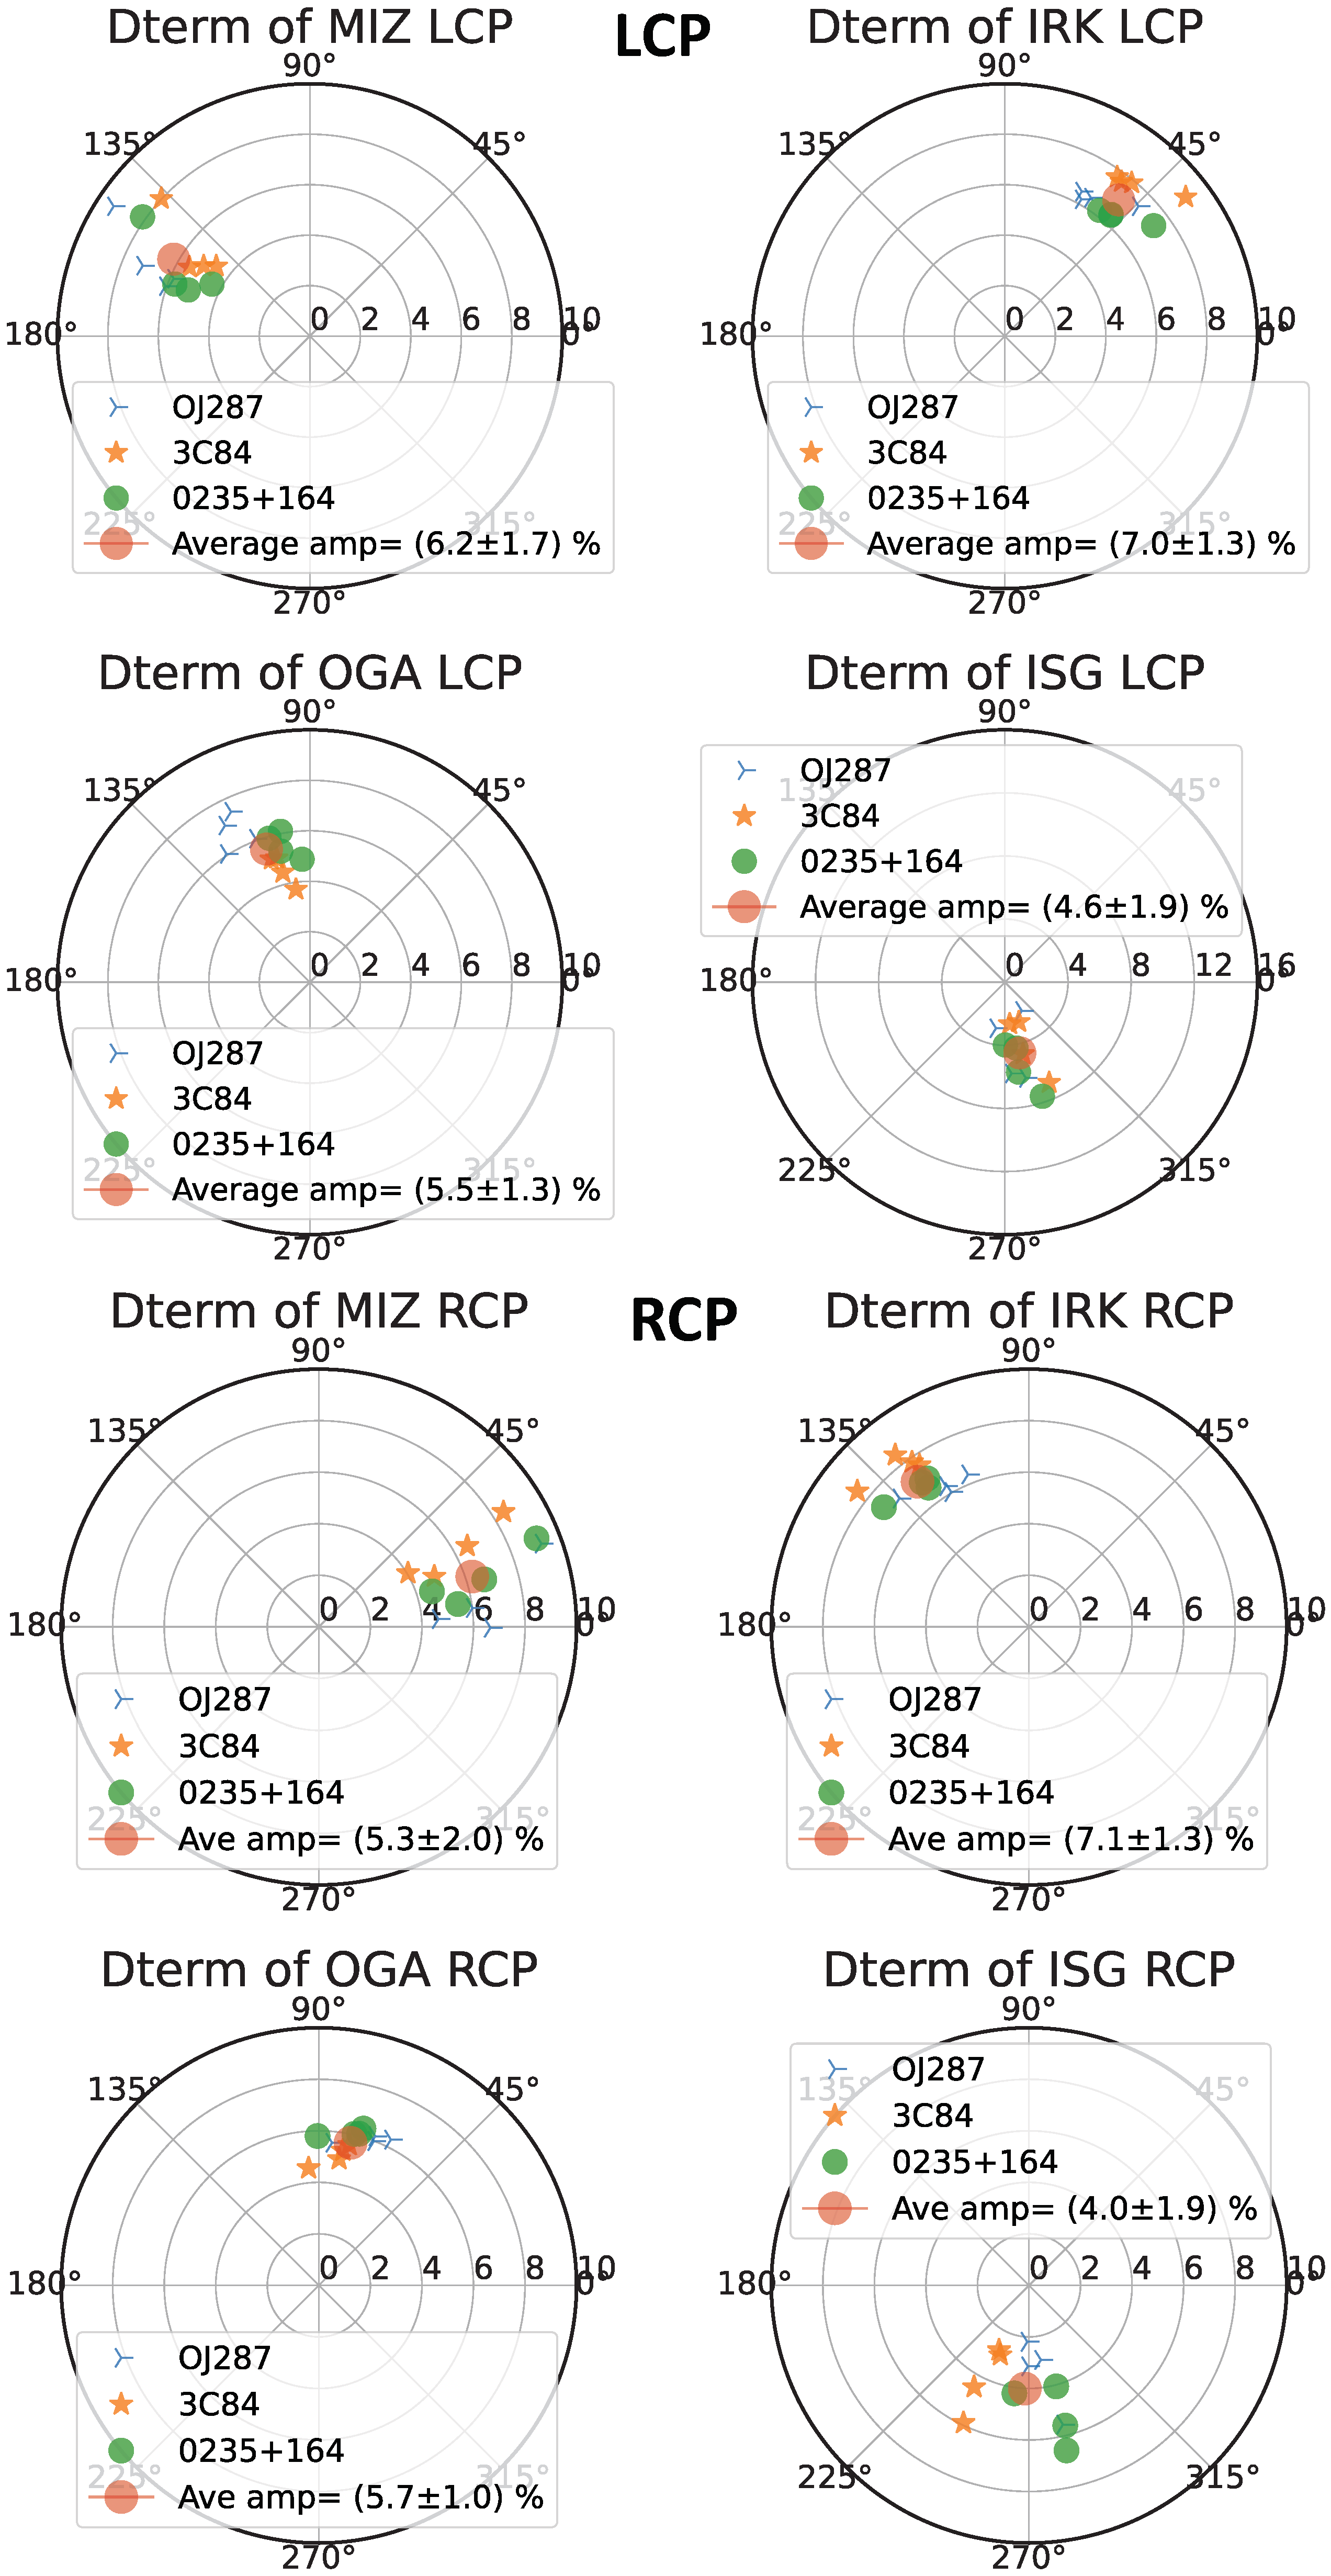
One of the primary purposes of our experiments was to estimate D-terms for each VERA telescope at 22 GHz and 43 GHz. In
Figure 5, we show the D-term solutions at the 22 GHz band obtained for each telescope and polarization. In each of the eight sub-panels, we plot the solutions for all the four IFs, obtained from three different calibrators OJ287, 3C84, and 0235+164, as well as a solution averaged over all the calibrators and four IF sub-bands.
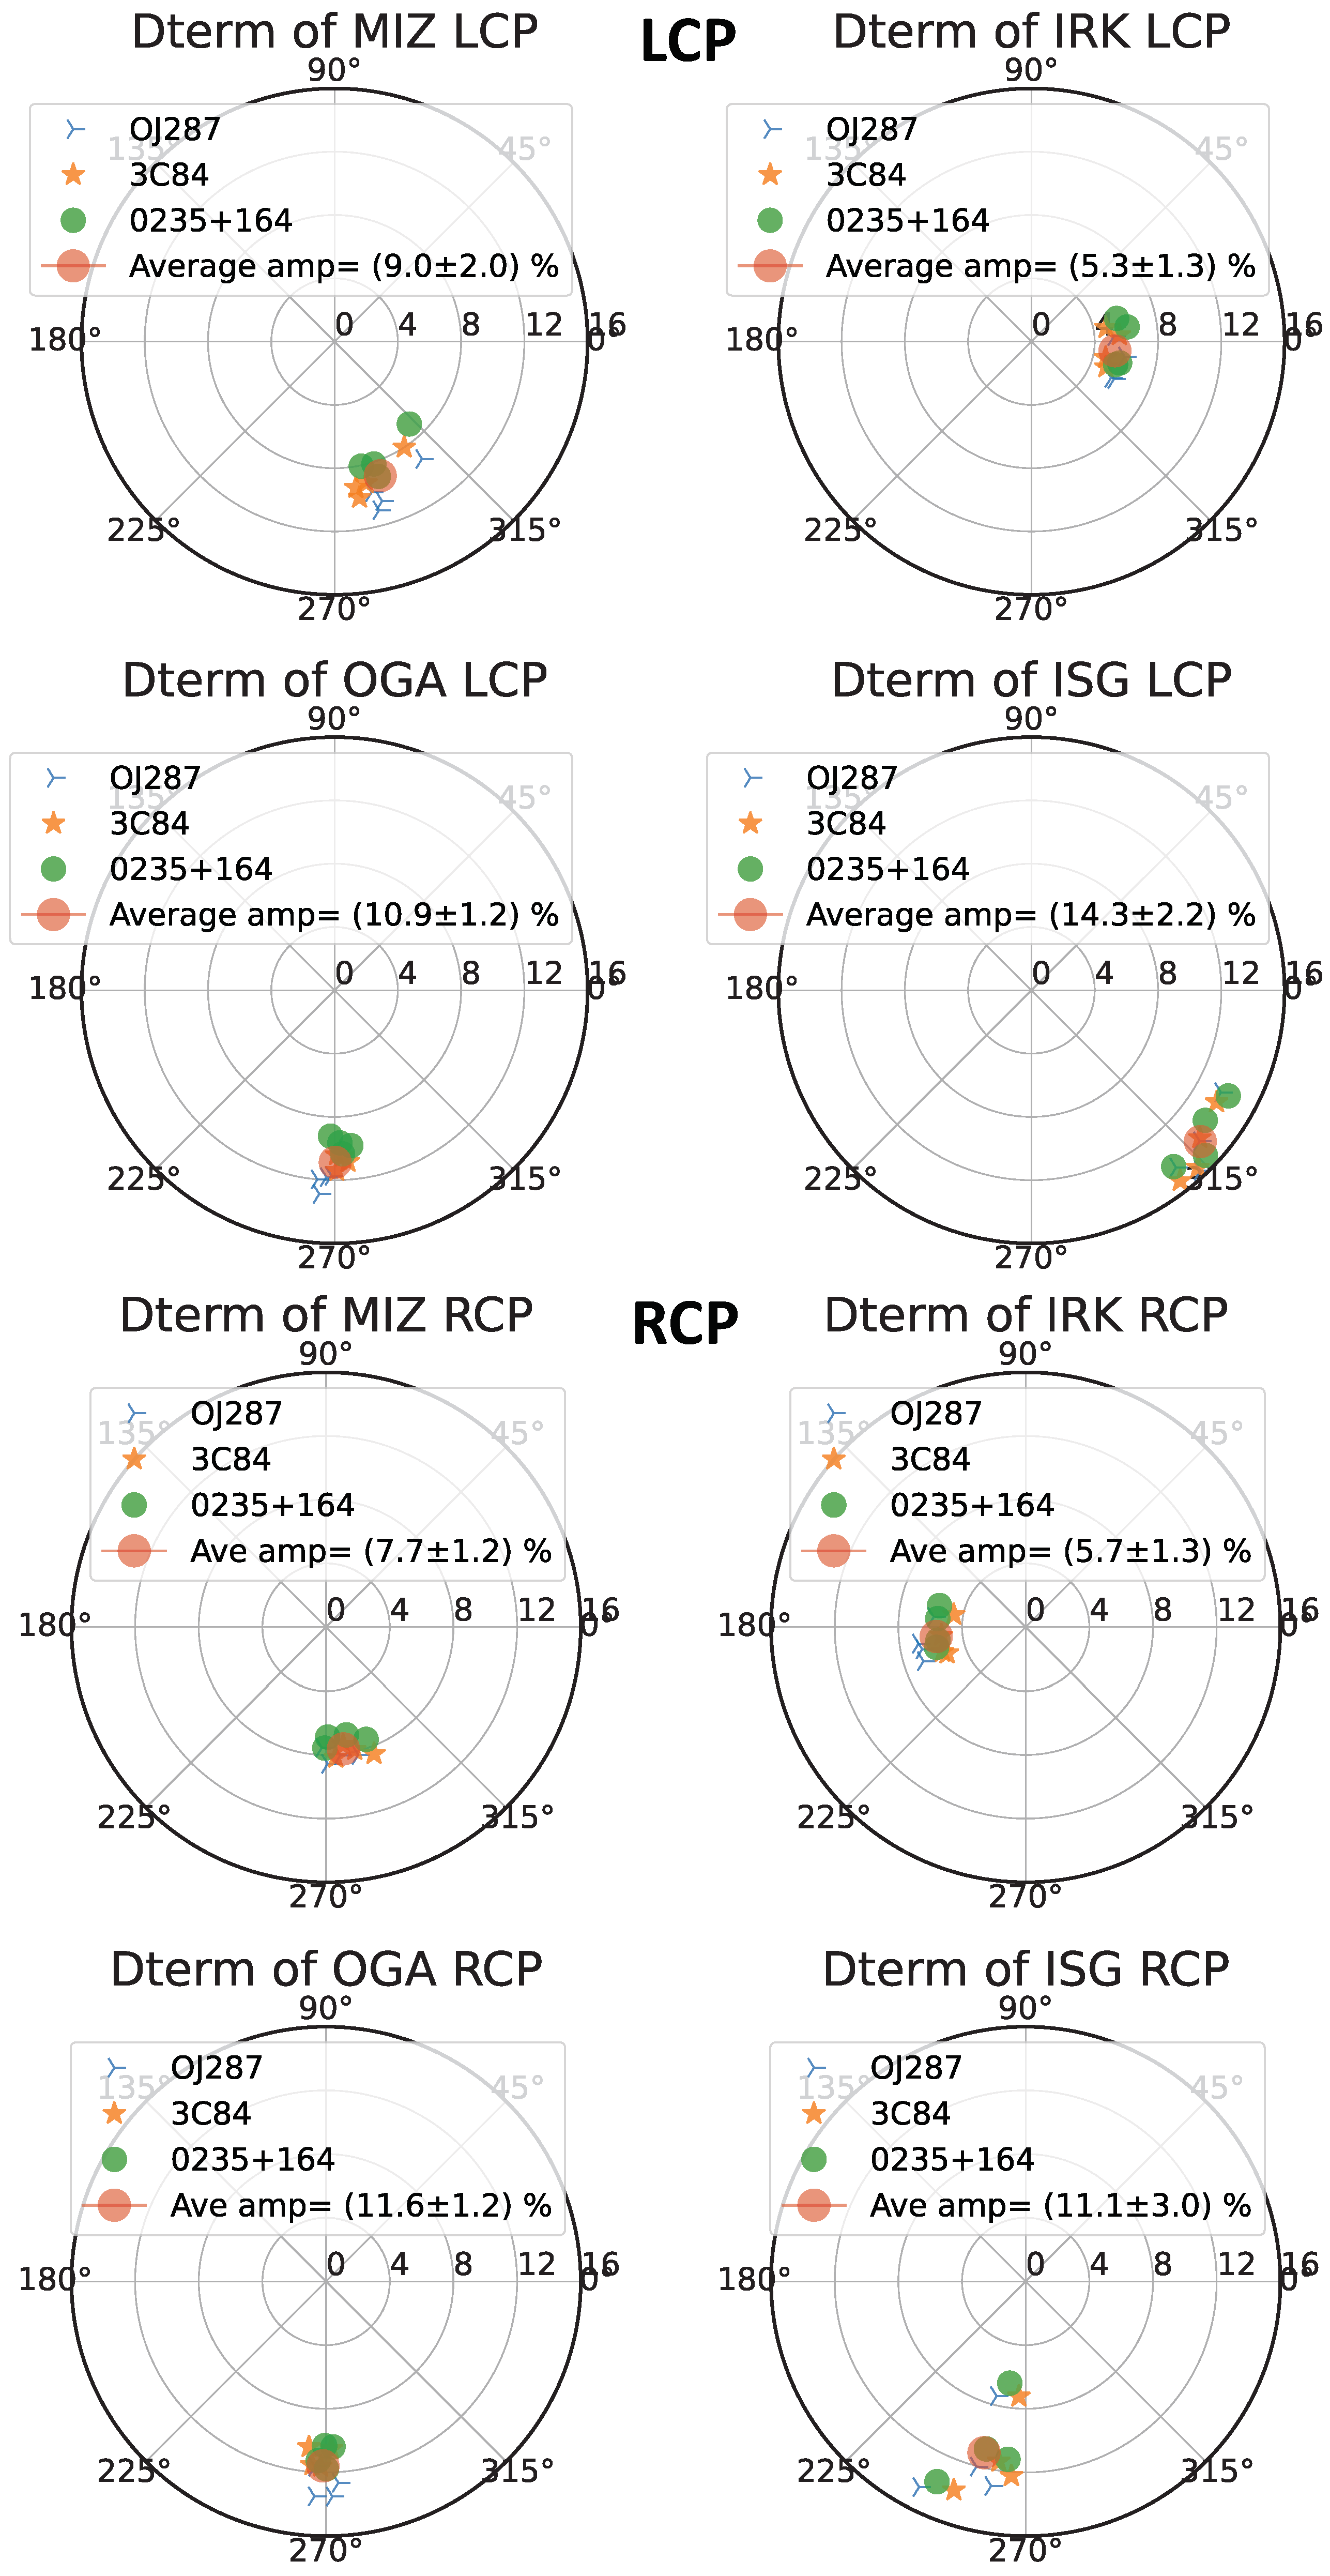
Figure 6 displays the corresponding results for the 43 GHz band. The values of D-terms for each VERA telescope are summarized in
Table 3.
At the 22 GHz band, the D-term solutions derived from different calibrators were in very good agreement with each other at all four telescopes. The D-terms amplitudes were confirmed to be 4–7% across the four telescopes, with a standard deviation of ∼1.5%. We note that the D-term solutions seem to show some slight difference between the IF sub-bands. This could be caused by the limited SNR of our D-term derivation process, or we could be seeing a possible frequency dependence of the D-terms due to the wide bandwidth (∼2 GHz) of our observations, which should be examined in more detail in future observations.
At the 43 GHz band, the D-term solutions derived from different calibrators were also in good agreement with each other at all the telescopes. The D-term amplitudes at 43 GHz were somewhat larger than those at 22 GHz, but still largely constrained to be ≲10% (except for LCP at the Ishigaki-Jima telescope). It is uncertain whether or not this relatively larger D-term for Ishigaki was temporal. Compared with the D-terms (<∼5%) obtained for Very-Long-Baseline Array (VLBA) telescopes at 22 and 43 GHz [
12], the D-terms of VERA are larger. It is not clear whether this is due to better calibration accuracy as a result of the larger number of VLBA baselines, or due to differences in the antenna feeds. Note that the D-terms of the KVN are ∼3.5–11% at 22 GHz and ∼4.5–6.5% at 43 GHz [
13], closer to those of VERA. Multiepoch measurements would be necessary to further test the stability of the D-terms over time.
Nevertheless, the D-terms results obtained from our first VERA wideband polarimetric experiments are overall very encouraging without any serious issues. This indeed allowed us to produce reliable linear polarization images with VERA, as described in the following subsection.
5.3. Linear Polarization Images
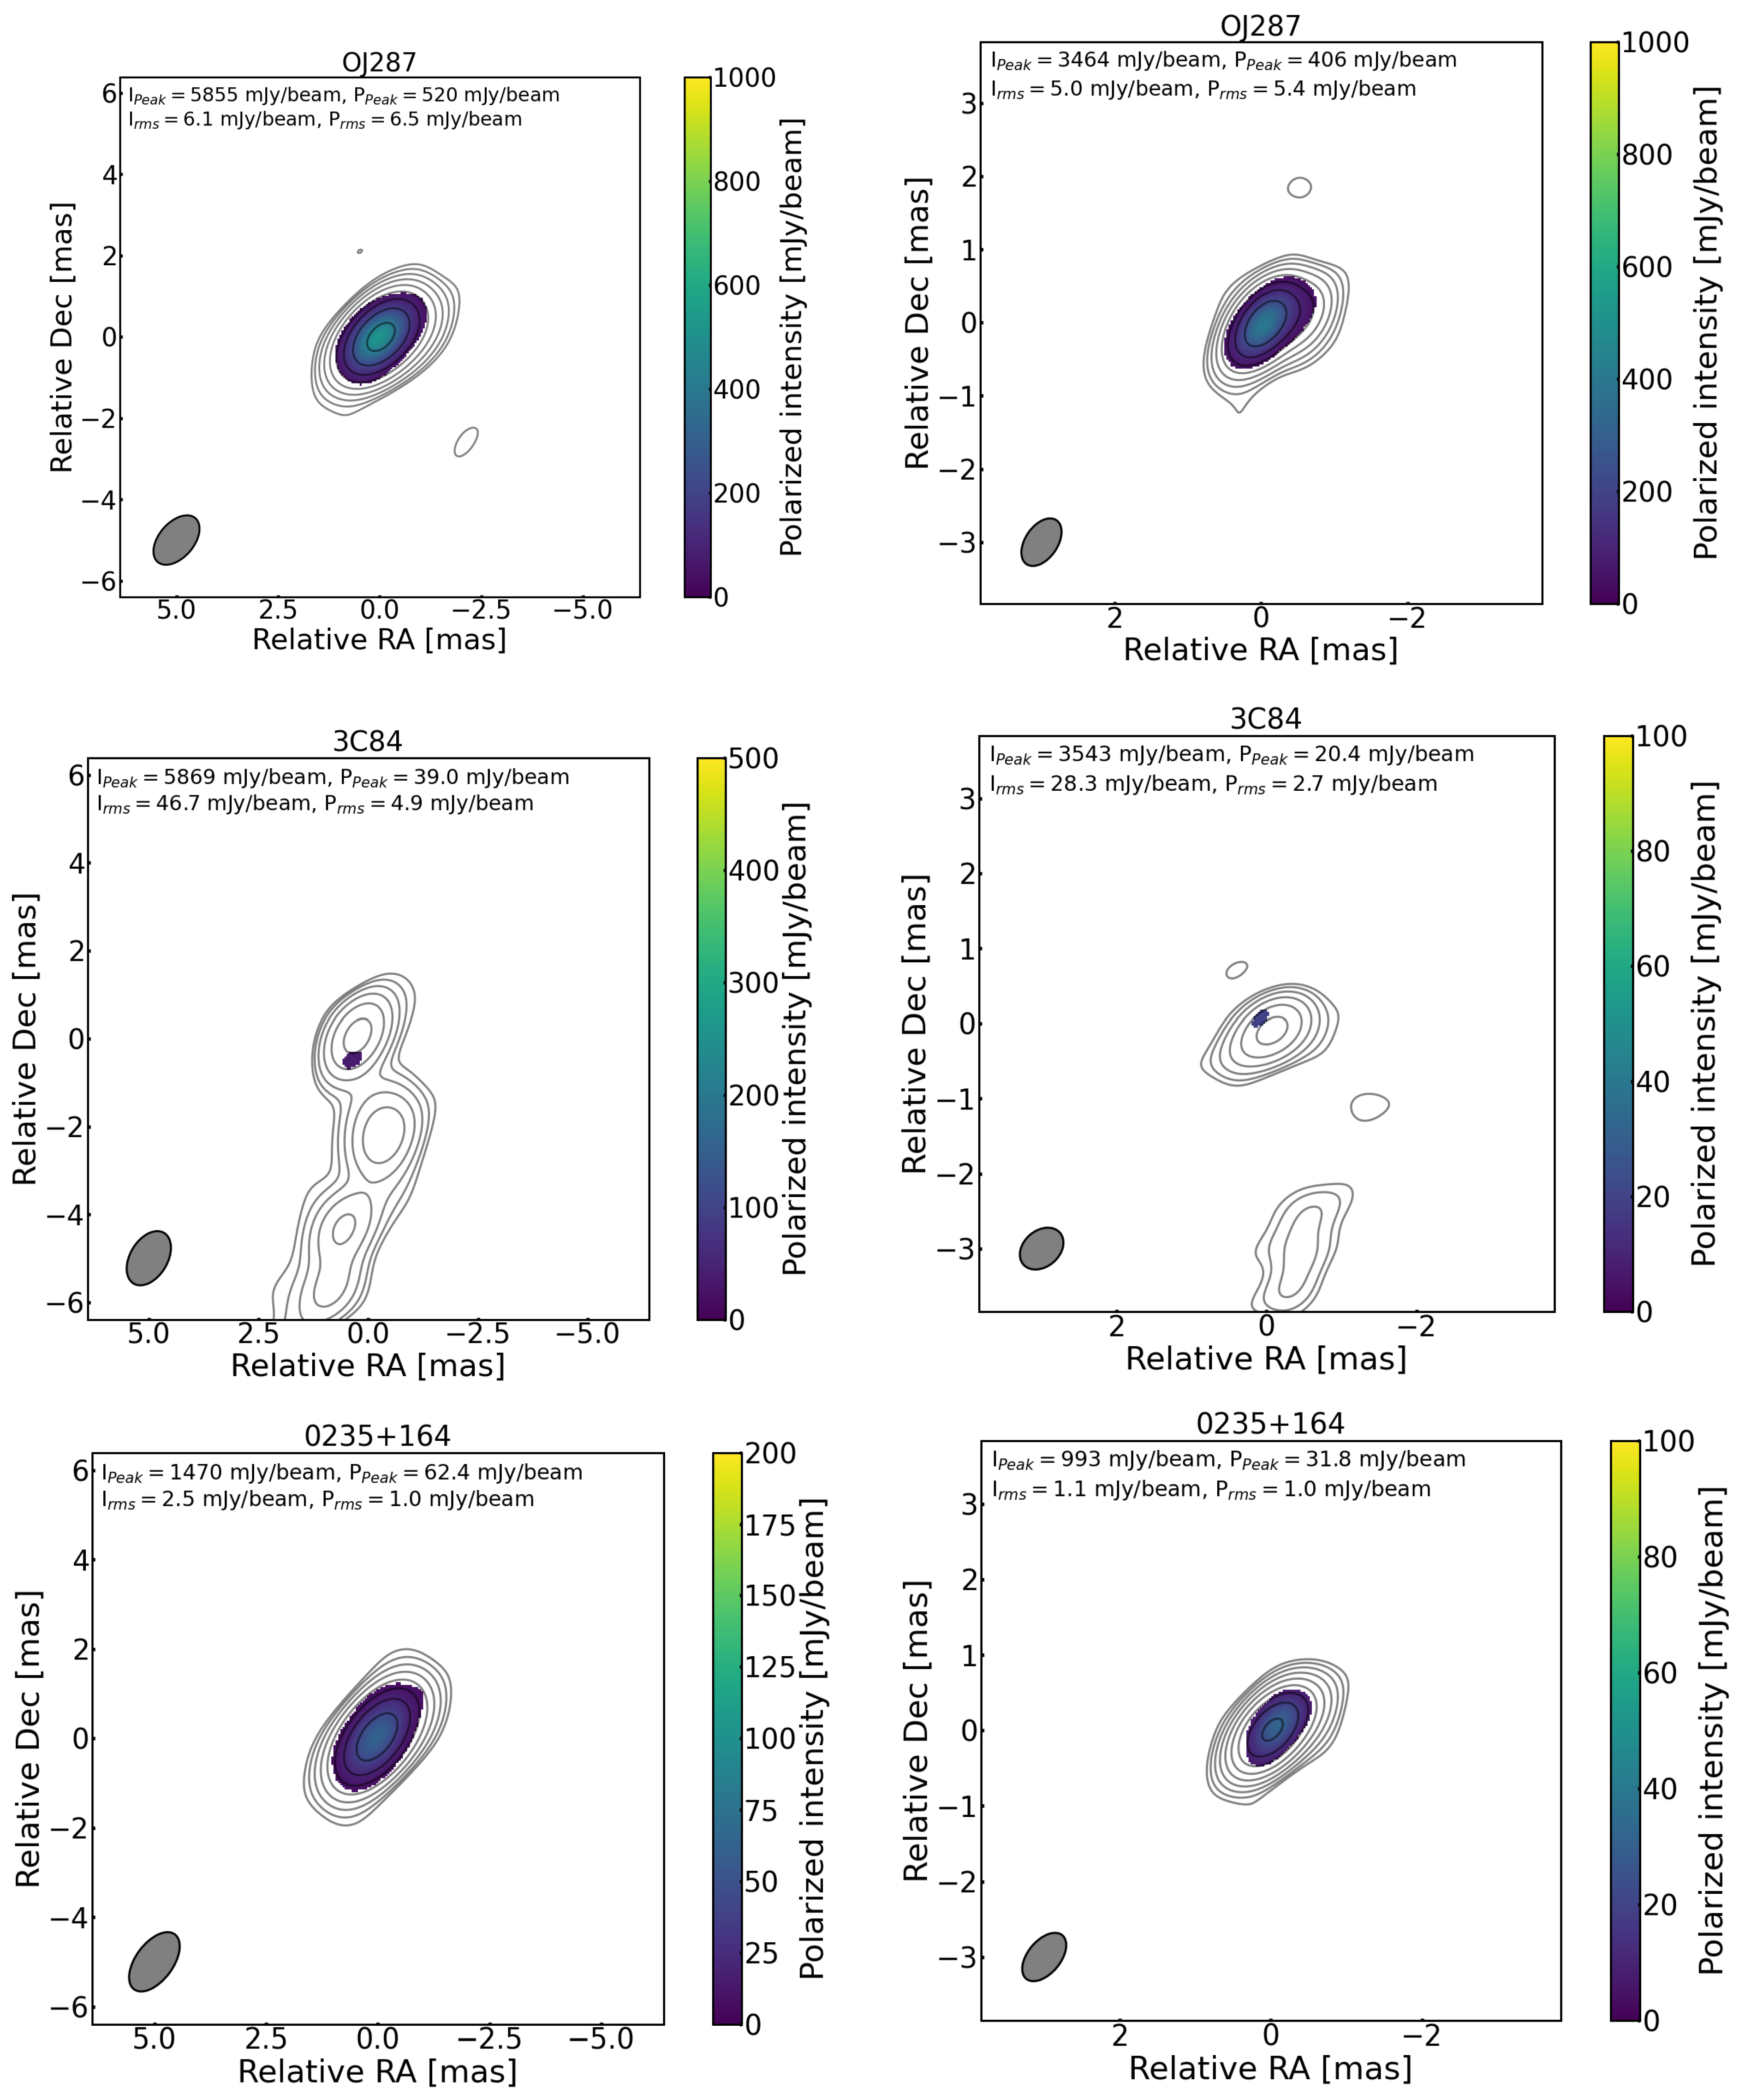
In
Figure 7, we present linear polarization (
) images obtained for OJ287, 3C84, and 0235 + 164, which are overlaid on total intensity (Stokes I) contour maps. Images at both the 22 and 43 GHz bands are shown, and polarization emission detected at SNR > 5 is shown for all images. Note that here we do not present EVPA distributions, since the correction of absolute EVPA requires external information from other facilities, which were not performed in our analysis. For blazars OJ287 and 0235+164, we detected significant polarization flux densities from the core regions both at 22 and 43 GHz bands. The integrated polarized flux densities over a one mas square of the core region of OJ287 were 463 mJy and 442 mJy at 22 and 43 GHz bands, which correspond to fractional polarization degrees of 8.5% and 10.4%, respectively. For 0235+164, the integrated polarized flux densities over a one mas square of the core region were 54.6 mJy and 31.1 mJy at the 22 and 43 GHz bands, which correspond to fractional polarization degrees of 4.0% and 2.9% at 22 and 43 GHz, respectively. Although the nucleus of radio galaxy 3C84 is well known as a very weakly polarized source at these frequencies [
14], we detected the polarized emission. The errors of linear polarization flux density,
P, are estimated as the following:
where
and
are rms noises in the Stokes
Q and
U images, respectively.
Fractional polarization values are obtained by simply dividing the integrated polarized flux density
by the integrated total flux density
. Fractional polarization errors (
) are calculated by dividing P
by the peak intensity (Stokes I), as the following; see, e.g., [
15]:
We list the parameters of total flux densities, polarized flux densities, fractional linear polarization values (average values of the fractional polarization of an area indicated by color in each panel), and rms values for each map in
Table 4.
5.4. Verification
Given the relatively small D-term values, we conclude that we can conduct polarimetric VLBI observations at both 22 and 43 GHz using VERA. All of the three sources discussed in the previous subsection are regularly monitored with VLBA at 15 GHz through the MOJAVE program [
16] and at 43 GHz through the Boston University Blazar program [
17]. Bearing in mind the different times of observations, angular resolutions, and observing frequencies, the polarization characteristics of these sources obtained with VERA are consistent overall with those typically measured from the VLBA observations, confirming the capability of VERA for polarimetric study. A rotation measure of the narrow-line Seyfert 1 galaxy was tentatively obtained from our data (Takamura et al., in preparation), which demonstrates that the detection of large rotation measure can be made by the combination of the new dual-polarization and ultrawideband (∼2 GHz) capabilities of VERA.
6. Future Prospects
First of all, we aim to present scientific results obtained from the test observations of Faraday rotation measurement towards narrow-line Seyfert 1 galaxies in March 2022, and commissioning that will be conducted in the near future (Takamura et al., in preparation). After commissioning is completed, for example, an extensive mapping observation campaign of narrow-line Seyfert 1 galaxies will begin utilizing the ultrawideband polarimetric VLBI capability.
Additional scientific capabilities will be implemented to both the front- and back-end in the future. For example, simultaneous observations at 22 and 43 GHz with dual polarizations at 16 Giga bit s will be enabled, which will significantly improve the sensitivity of measuring spectral indices of active galactic nuclei. Moreover, “super” ultrawideband observation at 32 Giga bit s will be possible in the future.
We started VLBI polarimetric test observations with the three 21 m telescopes of the Korean VLBI Network (KVN). With the KVN, both single-dish and VLBI monitoring observations of the polarization of Blazars at 22 and 43 GHz are being conducted. This will facilitate EVPA calibration for polarimetric observations using VERA, or with a combined array observation with the KVN and VERA (KaVA) in the future; see, e.g., [
18]. Such KaVA capabilities would provide better UV coverage and sensitivity for polarimetric mapping observations at 22 and 43 GHz.
7. Summary
The new dual-circular polarization receiving system was designed, and the installation of the new RCP receivers at all four telescopes of VERA was completed in August 2019. With the new receivers, the new VERA front-end enables VLBI polarimetry, and we aim to combine the VERA with KVN in the near future for more sensitive polarimetric imaging. The new back-end can process and record data at 16 Giga bit s, providing up to factor of four improvement in sensitivity compared with the earlier capability.
In March 2022, the first VERA polarimetric observations at 22 and 43 GHz were tested using the ultrawideband recording system at 16 Giga bit s (8 Giga bit s per polarization.With the current front-end configuration, the recording rate can be extended up to 32 Giga bit s. Exploitation of the ultrawideband mode in more extensive VLBI arrays, such as KaVA, might need a comparable recording rate enhancement at other participating telescopes or arrays.
From these observations, we obtained for the first time 22 and 43 GHz total intensity and linear polarization maps of extragalactic sources using the VERA. Thus, the new ultrawideband recording has enabled sensitive polarization observations by VERA. We have no doubt that these developments are now, and will be in the future, of great importance for VLBI collaborations, primarily in the East Asian region.
Author Contributions
Project management, Y.H. and K.H.; observations, K.H. and M.T.; instrumentation, S.S., T.O., Y.H. and A.Y.; software, T.O.; data analysis, M.T. and K.H.; writing and editing, Y.H.; funding acquisition, Y.H. and K.H. All authors have read and agreed to the published version of the manuscript.
Funding
This research was funded by JSPS KAKENHI grant number JP15H03644 (PI:Y.Hagiwara) and JP19H01943 (PI:K.Hada).
Institutional Review Board Statement
Not applicable.
Informed Consent Statement
Not applicable.
Data Availability Statement
Not applicable.
Acknowledgments
We gratefully acknowledge the support of the Mizusawa VLBI Observatory staff for their assistance with the observing. YH thanks Noriyuki Kawaguchi for his useful advice on the development of the VERA front-end system and also thanks Takeshi Ohno for his efforts during the receiver installation process. The authors thank Bob Campbell for comments and suggestions that significantly improved the manuscript. VERA is operated by National Astronomical Observatory of Japan. Part of the research was supported by the Inoue Enryo Memorial Grant, TOYO University in Japan.
Conflicts of Interest
The authors declare no conflict of interest.
Abbreviations
The following abbreviations are used in this manuscript:
| AGN | Active Galactic Nuclei |
| EVPA | Electric Vector Position Angle |
| KaVA | KVN and VERA |
| KVN | Korean VLBI Network |
| LCP/RCP | Light-/Right-Handed Circular Polarization |
| LNA | Low-noise amplifiers |
| MOJAVE | Monitoring Of Jets in Active galactic nuclei with VLBA Experiments |
| OCTAD | Optically Connected Array for VLBI Exploration Analog-to-Digital Converter |
| VERA | VLBI Exploration of Radio Astrometry |
| VLBI | Very-Long-Baseline Interferometry |
References
- Honma, M.; Kawaguchi, N.; Sasao, T. Science with VERA: VLBI exploration of radio astrometry. In Proceedings of the SPIE, Radio Telescopes, Munich, Germany, 27–31 March 2010; pp. 624–631. [Google Scholar]
- Hagiwara, Y.; Fomalont, E.; Tsuboi, M.; Yasuhiro, M. In Proceedings of Approaching Micro-Arcsecond Resolution with VSOP-2: Astrophysics and Technologies. ASP Conf. Ser. 2009, 402, 1–497. [Google Scholar]
- Schuh, H.; Behrend, D. VLBI: A fascinating technique for geodesy and astrometry. J. Geodyn. 2012, 61, 68–80. [Google Scholar] [CrossRef]
- Nothnagel, A.; Artz, T.; Behrend, D.; Malkin, Z. International VLBI Service for Geodesy and Astrometry. J. Geodesy 2017, 91, 711–721. [Google Scholar] [CrossRef]
- Ghaderpour, E. Least-squares Wavelet and Cross-wavelet Analyses of VLBI Baseline Length and Temperature Time Series: Fortaleza-Hartebeesthoek-Westford-Wettzell. Publ. Astron. Soc. Pacif. 2021, 133, 014502. [Google Scholar] [CrossRef]
- Kawaguchi, N.; Sasao, T.; Manabe, S. Dual-beam VLBI techniques for precision astrometry of the VERA project. In Proceedings of the SPIE, Radio Telescopes, Munich, Germany, 27–31 March 2010; pp. 544–551. [Google Scholar]
- Oyama, T.; Kono, Y.; Suzuki, S.; Kanaguchi, M.; Nishikawa, T.; Kawaguchi, N.; Hirota, T.; Nagayama, T.; Kobayashi, H.; Imai, H.; et al. The first simultaneous mapping of four 7 mm SiO maser lines using the OCTAVE system. Publ. Astron. Soc. Jpn. 2016, 68, 105. [Google Scholar] [CrossRef]
- Oyama, T.; Kono, Y.; Suzuki, S.; Mizuno, S.; Bushimata, T.; Jike, T.; Kawaguchi, N.; Kobayashi, H.; Kimura, M. New VLBI Observing System ’OCTAVE-Family’ to Support VDIF Specifications with 10 GigE for VERA, JVN, and Japanese e-VLBI (OCTAVE). In Proceedings of the Seventh General Meeting (GM2012) of the international VLBI Service for Geodesy and Astrometry (IVS), Madrid, Spain, 4–9 March 2012; pp. 91–95. [Google Scholar]
- VERA Status Report; Mizusawa VLBI Observatory, National Astronomical Observatory of Japan, 2019; pp. 1–29. Available online: https://www.miz.nao.ac.jp/veraserver/restricted/CFP2020A/status20A.pdf (accessed on 30 August 2022).
- Greisen, E.W. The Astronomical Image Processing System. In Acquisition, Processing and Archiving of Astronomical Images; Longo, G., Sedmak, G., Eds.; Springer: Naples, Italy, 1990; pp. 125–142. [Google Scholar]
- Shepherd, M.C. Difmap: An Interactive Program for Synthesis Imaging. Astronomical Data Analysis Software and Systems VI. A.S.P. Conf. Ser. 1997, 125, 77–84. [Google Scholar]
- Gómez, J.L.; Marscher, A.P.; Alberdi, A.; Jorstad, S.G.; Agudo, I. Polarization calibration of the VLBA using the D-terms. Vlba Sci. Memos 2002, 30, 1–16. [Google Scholar]
- Park, J.; Kam, M.; Trippe, S.; Kang, S.; Byun, D.-Y.; Kim, D.-W.; Algaba, J.-C.; Lee, S.-S.; Zhao, G.-Y.; Kino, M.; et al. Revealing the Nature of Blazar Radio Cores through Multifrequency Polarization Observations with the Korean VLBI Network. Astrophys. J. 2018, 860, 112. [Google Scholar] [CrossRef]
- Taylor, G.B.; Gugliucci, N.E.; Fabian, A.C.; Sanders, J.S.; Gentile, G.; Allen, S.W. Magnetic fields in the centre of the Perseus cluster. Mon. Not. R. Astron. Soc. 2006, 368, 1500–1506. [Google Scholar] [CrossRef]
- Hovatta, T.; Lister, M.L.; Aller, M.F.; Aller, H.D.; Homan, D.C.; Kovalev, Y.Y.; Pushkarev, A.B.; Savolainen, T. MOJAVE: Monitoring of Jets in Active Galactic Nuclei with VLBA Experiments. VIII. Faraday Rotation in Parsec-scale AGN Jets. Astron. J. 2012, 144, 105. [Google Scholar] [CrossRef]
- Lister, M.L.; Aller, M.F.; Aller, H.D.; Hodge, M.A.; Homan, D.C.; Kovalev, Y.Y.; Pushkarev, A.B.; Savolainen, T. MOJAVE. XV. VLBA 15 GHz Total Intensity and Polarization Maps of 437 Parsec-scale AGN Jets from 1996 to 2017. Astrophys. J. Suppl. Ser. 2018, 234, 12. [Google Scholar] [CrossRef]
- Jorstad, S.G.; Marscher, A.P.; Morozova, D.A.; Troitsky, I.S.; Agudo, I.; Casadio, C.; Foord, A.; Gómez, J.L.; MacDonald, N.R.; Molina, S.N.; et al. Kinematics of Parsec-scale Jets of Gamma-Ray Blazars at 43 GHz within the VLBA-BU-BLAZAR Program. Astrophys. J. 2017, 846, 98. [Google Scholar] [CrossRef]
- Kang, S.; Lee, S.-S.; Byun, D.-Y. Monitoring of Gamma-Ray Bright AGN: The Multi-Frequency Polarization of the Flaring Blazar 3C 279. J. Korean Astron. Soc. 2015, 48, 257–265. [Google Scholar] [CrossRef]
Figure 1.
An overview of the VERA array, consisting of four telescopes located at Mizusawa, Iriki, Ogasawara, and Ishigaki-Jima (Image credit:NAOJ).
Figure 1.
An overview of the VERA array, consisting of four telescopes located at Mizusawa, Iriki, Ogasawara, and Ishigaki-Jima (Image credit:NAOJ).
Figure 2.
Schematic diagram of the front-end part of the 22 GHz and 43 GHz receivers (beam-A) on the 20 m telescopes of VERA. The two-letter receiver abbreviations encode frequency band in the first letter (K for 22 GHz, Q for 43 GHz) and polarization in the second letter. Signal paths follow the arrows. The 22 GHz radio frequency (RF) signals (18–26 GHz) are directly converted to intermediate frequency (IF) signals (4.7–7 GHz) using a “direct” sampler OCTAD. The 43 GHz RF signals are converted via the frequency down-converter to IF signals.
Figure 3.
Interiors of the cryogenic dewars with the single-polarization (LCP) 22 GHz (top left) and 43 GHz band (middle left) receivers, before 2018. Interiors of the dewars with the new dual-circular polarization at 22 GHz (top right) and 43 GHz (middle right) band receivers (photos by Japan Communication Equipment Co., Ltd.). (Bottom left): an interior of OCTAD and (bottom right): an OCTAD channel board mounted on an FPGA board.
Figure 4.
Plots of the delay solutions obtained at 22 GHz (upper) and 43 GHz (lower), with each point being indicated in different colors that correspond to different sources. Units of vertical and horizontal axes are in nanoseconds and hours, respectively.
Figure 4.
Plots of the delay solutions obtained at 22 GHz (upper) and 43 GHz (lower), with each point being indicated in different colors that correspond to different sources. Units of vertical and horizontal axes are in nanoseconds and hours, respectively.
Figure 5.
D-terms obtained using different calibrator sources (different colors) at 22 GHz observations by combining all four IF sub-bands. Each panel shows D-terms of each of the four VERA 20 m telescopes at each circular polarization (upper: LCP, lower: RCP). D-terms obtained by averaging over the sources are also shown. The radius of each plot is in percent.
Figure 6.
D-terms obtained at 43 GHz. Description of what is contained in the
Figure 5 caption.
Figure 6.
D-terms obtained at 43 GHz. Description of what is contained in the
Figure 5 caption.
Figure 7.
The 22 GHz (left) and 43 GHz (right) VERA total intensity (contour) and linearly polarized intensity (color) maps of OJ287 (top), 3C84 (middle), and 0235+164 (bottom). The 1 noise and peak values of the total and polarized intensity are shown at the top of each panel. The contours are plotted with increasing powers of two, starting from the 3 level. In both the 22 and 43 GHz maps, the polarized intensity is scaled up to 7 , with the color scale in mJy beam given in the vertical bars to the right. The synthesized beam is plotted at the bottom left in each panel.
Table 2.
Summary of observations.
Table 2.
Summary of observations.
| Items | 22 GHz | 43 GHz |
|---|
| Dates | 8 March 2022 | 13 March 2022 |
| Duration (hours) | 19 | 19 |
| Observed sources | | |
| (targets) | 0321+340, 0846+513, 0946+006, 1219+044, 1505+03, J2118-07 | 0321+340, 0846+513, 0946+006, 1219+044, 1505+03, J2118-07 |
| (calibrators) | 0235+164, 0528+134, 3C 273, 3C 454.3, 3C 84, OJ 287, W3OH | 0235+164, 0528+134, 3C 273, 3C 454.3, 3C 84, OJ 287, Orion-KL |
| System temperatures 1 (K) | | |
| Mizusawa, Iriki | 100–200(LCP), 100–200(RCP) | 200–800(LCP), 200–1000(RCP) |
| Ogasawara, Ishigaki | 150–300(LCP), 150–400(RCP) | 200–800(LCP), 200–1000(RCP) |
| The number of the sub-band | 4 | 4 |
| IF sub-bandwidth 2 | 512 MHz | 512 MHz |
| Center frequencies of each sub-band (GHz) | 21.715, 22.227, 22.739, 23.251 | 42.682, 43.194, 43.706, 44.218 |
| Recording rates | 16 Gigabit s | 16 Gigabit s |
| Correlation | FX-type, software correlator (softcos) | softcos |
Table 3.
D-terms 1 of the 20-m VERA telescopes (expressed in percent).
Table 3.
D-terms 1 of the 20-m VERA telescopes (expressed in percent).
| Telescope | 22 GHz, RCP | 22 GHz, LCP | 43 GHz, RCP | 43 GHz, LCP |
|---|
| Mizusawa (MIZ) | 6.3 ± 2.0 | 6.2 ± 1.7 | 7.7 ± 1.2 | 9.0 ± 2.0 |
| Iriki (IRK) | 7.1 ± 1.3 | 7.0 ± 1.3 | 5.7 ± 1.3 | 5.3 ± 1.3 |
| Ogasawara (OGA) | 5.7 ± 1.0 | 5.5 ± 1.3 | 11.6 ± 1.2 | 10.9 ± 1.2 |
| Ishigak-Jima (ISG) | 4.0 ± 1.9 | 4.6 ± 1.9 | 11.1 ± 3.0 | 14.3 ± 2.2 |
Table 4.
Summary of 22 and 43 GHz Image Parameters.
Table 4.
Summary of 22 and 43 GHz Image Parameters.
| Object | Band | 1 | 2 | 3 | 4 | 5 | R 6 |
|---|
| | (GHz) | (Jy) | (mJy) | (Jy beam) | (mJy beam) | (mJy beam) | (%) |
|---|
| OJ287 | 22 | 5.4 | 463.3 | 5.9 | 6.1 | 6.5 | 8.5 ± 0.1 |
| OJ287 | 43 | 4.2 | 441.7 | 3.5 | 5.0 | 5.4 | 10.4 ± 0.2 |
| 3C 84 | 22 | 5.5 | 15.4 | 5.9 | 46.7 | 4.9 | 0.3 ± 0.1 |
| 3C 84 | 43 | 4.3 | 16.0 | 3.5 | 28.2 | 2.7 | 0.4 ± 0.1 |
| 0235+164 | 22 | 1.4 | 54.6 | 1.5 | 2.5 | 1.0 | 4.0 ± 0.1 |
| 0235+164 | 43 | 1.1 | 31.1 | 1.0 | 1.1 | 1.0 | 2.9 ± 0.1 |
| Publisher’s Note: MDPI stays neutral with regard to jurisdictional claims in published maps and institutional affiliations. |
© 2022 by the authors. Licensee MDPI, Basel, Switzerland. This article is an open access article distributed under the terms and conditions of the Creative Commons Attribution (CC BY) license (https://creativecommons.org/licenses/by/4.0/).


 ,
, 


